 Sharon A. Billings
 Daniel de B. Richter
 Susan E. Ziegler
 Karen Prestegaard4
 Anna M. Wade
- 1Department of Ecology and Evolutionary Biology, Kansas Biological Survey, University of Kansas, Lawrence, KS, United States
- 2Nicholas School of the Environment, Duke University, Durham, NC, United States
- 3Department of Earth Sciences, Memorial University, St. John's, NL, Canada
- 4Department of Geology, University of Maryland, College Park, MD, United States
Lateral movements of soil organic C (SOC) influence Earth's C budgets by transporting organic C across landscapes and by modifying soil-profile fluxes of CO2. We extended a previously presented model (Soil Organic C Erosion Replacement and Oxidation, SOrCERO) and present SOrCERODe, a model with which we can project how erosion and subsequent deposition of eroded material can modify biosphere-atmosphere CO2 fluxes in watersheds. The model permits the user to quantify the degree to which eroding and depositional profiles experience a change in SOC oxidation and production as formerly deep horizons become increasingly shallow, and as depositional profiles are buried. To investigate the relative importance of erosion rate, evolving SOC depth distributions, and mineralization reactivity on modeled soil C fluxes, we examine two forests exhibiting distinct depth distributions of SOC content and reactivity, hydrologic regimes and land use. Model projections suggest that, at decadal to centennial timescales: (1) the quantity of SOC moving across a landscape depends on erosion rate and the degree to which SOC production and oxidation at the eroding profile are modified as deeper horizons become shallower, and determines the degree to which depositional profile SOC fluxes are modified; (2) erosional setting C sink strength increases with erosion rate, with some sink effects reaching more than 40% of original profile SOC content after 100 y of a relatively high erosion rate (i.e., 1 mm y−1); (3) even large amounts of deposited SOC may not promote a large depositional profile C sink even with large gains in autochthonous SOC post-deposition if oxidation of buried SOC is not limited; and (4) when modeled depositional settings receive a disproportionately large amount of SOC, simulations of strong C sink scenarios mimic observations of modest preservation of buried SOC and large SOC gains in surficial horizons, suggesting that C sink scenarios have merit in these forests. Our analyses illuminate the importance of cross-landscape linkages between upland and depositional environments for watershed-scale biosphere-atmosphere C fluxes, and emphasize the need for accurate representations and observations of time-varying depth distributions of SOC reactivity across evolving watersheds if we seek accurate projections of ecosystem C balances.
Introduction
Lateral movement of soil organic C (SOC) due to erosion can influence regional and global C budgets (Doetterl et al., 2016), a phenomenon of increasing importance given human acceleration of soil transport across the globe (Syvitski et al., 2005; Wilkinson and McElroy, 2007; Haff, 2010; Hook et al., 2012). Soil erosion and subsequent deposition transports SOC, which locally depletes or augments profile SOC reservoirs, respectively. Erosion can also alter regional and global C budgets by influencing fluxes of CO2 to and from the atmosphere (Stallard, 1998; Harden et al., 1999; Berhe et al., 2007; van Oost et al., 2007; Billings et al., 2010; Doetterl et al., 2015; Dialynas et al., 2016; Wang et al., 2017). Biosphere-atmosphere exchange of C can be influenced by erosion via SOC mineralization to CO2 during transport of eroded material, and by alteration of SOC production and mineralization rates in both eroding and depositional profiles.
Mineralization of SOC to CO2 during transport of eroded material (Jacinthe and Lal, 2001; Jacinthe et al., 2002) is perhaps the most obvious way that erosion can influence atmospheric CO2. The fraction of eroded SOC subjected to mineralization during transport varies greatly, depending on the chemical and physical characteristics of eroded material (Hu and Kuhn, 2014). Assumptions about the fate of eroded SOC range from complete mineralization to complete preservation (Lal, 1995; Jacinthe and Lal, 2001; Smith et al., 2001). Difficulties with tracking the fate of eroded SOC make quantifying the eroded SOC that is lost as CO2 during transport a challenging problem (Hu and Kuhn, 2014).
Erosion influences atmospheric CO2 by influencing biosphere-atmosphere C exchange within the eroding profile. “Dynamic replacement” (Stallard, 1998) of SOC—the continued production of SOC at an eroding profile that can replenish the SOC removed via erosion—is an important driver of erosion's influence on global C cycling (van Oost et al., 2007; Wang et al., 2017). The degree to which SOC continues to be produced within an eroding profile via litterfall, root detritus, and root exudates depends on ecosystem productivity. Production of SOC may be maintained, but in natural, unfertilized systems SOC production may decrease with the onset of erosion given that eroded ecosystems typically exhibit lower productivity than those growing on intact soil profiles due to fertility losses (Lal, 1987, 1995; Lenka et al., 2017).
Soil erosion may also influence rates of SOC oxidation within eroding profiles. Though it is possible that deep, slow-turnover SOC retains its relatively slow mineralization rate as it becomes increasingly shallow upon erosion, its mineralization behavior is difficult to predict. As buried horizons become closer to the surface upon erosion, they are likely exposed to an increasingly more oxygenated environment. Soil at a new, shallower depth also may experience a greater rate of labile inputs than it would have sans erosion, which can promote mineralization of relatively persistent SOC (Fontaine et al., 2007). These processes may result in formerly deep, slow-turnover SOC experiencing mineralization to CO2 at rates more similar to the SOC that previously resided at the shallower depths.
As a result of potentially altered SOC dynamics, each layer within a soil profile may exhibit SOC production ranging between some reduced rate and that occurring prior to erosion. Likewise, each layer may exhibit SOC oxidation ranging between its original rate and some new, enhanced rate similar to SOC oxidation of the layer that originally resided at that depth (i.e., SOC oxidation rates maintained at the pre-erosion rate). The integrated, eroded profile thus exhibits some CO2 sink or source reflective of the combined influence of both of these phenomena. Indeed, model projections suggest that modifying both of these terms can result in significant changes to the eroding profile's C budget, and that eroding profiles can serve as significant, net C sinks (Billings et al., 2010). Note that these phenomena within the eroding profile—dynamic replacement of SOC (Stallard, 1998) at potentially lower rates and potentially maintained SOC oxidation rates—assume that profile depth is only influenced by erosion and not by bedrock weathering, a reasonable assumption for decadal-to-centennial timescales. “Dynamic replacement” of SOC thus does not consider longer-term processes linking erosion, weathering, and geochemical CO2 consumption (Ebelman, 1845; Berner, 1999).
The same logic suggesting that soil removal via erosion can modify SOC production and oxidation at an eroding profile also suggests that deposition of eroded soil can modify analogous processes in terrestrial depositional profiles. If the eroded material is comprised of organic matter-rich topsoil, deposition of eroded soil can introduce a rich source of exogenous nutrients to depositional profiles (Liu et al., 2003; Quinton et al., 2010; Wang et al., 2014; Papanicolaou et al., 2015); even erosion of SOC from deep gullies (Nadeu et al., 2012) transports nutrients to depositional environments. This process can promote relatively high ecosystem productivity at many depositional environments (McKenney et al., 1995; Van Loo et al., 2017) and, presumably, SOC productivity rates as well. Because SOC buried in relatively low-oxygen environments can be preserved far longer than in surface environments, deposition of eroded material also may induce enhanced preservation of buried profiles at depositional settings (Berhe et al., 2008; Berhe and Kleber, 2013; Marín-Spiotta et al., 2014). The mechanisms driving such preservation remain unclear, but it is likely to greater frequency of reducing conditions in deepening soils. Regardless of the mechanisms, the degree to which deposition of eroded material influences either SOC production or oxidation at depositional profiles remains poorly quantified. It is difficult to predict the relative dominance of simultaneously occurring SOC production and oxidation across profiles receiving varying amounts of eroded material.
Here, we present a modeling tool useful for assessing the influence of erosion and subsequent deposition on soil and atmospheric C budgets, conceptually depicted in Figure 1. The new model expands an existing 1-D model, Soil Organic C Erosion Replacement and Oxidation (SOrCERO; Billings et al., 2010), which focused on eroding profile C dynamics, to include depositional profiles (SOrCERODe), providing a tool to facilitate watershed-scale assessment of C budgets. Both models are spreadsheet-driven, providing a user-friendly interface and the ability to observe soil layers (i.e., spreadsheet rows) to vary in SOC content over time. The original SOrCERO model tests the influence of erosion rates and associated changes in SOC production and oxidation in an eroding soil profile with prescribed SOC characteristics on profile C stocks and atmospheric CO2. Recently expanding these ideas, a spatially-explicit, hydrogeomorphic model (tRIBS-ECO; Dialynas et al., 2016) demonstrates the potential importance of time-varying erosion rates and small-scale (i.e., tens of meters) topographical differences in driving watershed-scale, erosion-induced C fluxes due to changes in SOC production and oxidation. SOrCERODe represents another expansion of SOrCERO's principles by allowing the user to specify depositional profile characteristics and the degree to which depositional profile SOC production and oxidation are modified upon deposition. Note that the depositional profile is assumed to be terrestrial, where SOC production can occur. Further, SOrCERODe allows the user to specify the fraction of eroded SOC that is deposited at the depositional profile. SOrCERODe does not explicitly account for differences in characteristics of soil organic matter that arrives at depositional profiles compared to the material that was eroded; because low density material tends to travel further, this can be an important driver of SOC transformations post-erosion (Berhe and Kleber, 2013; Hu and Kuhn, 2014; Papanicolaou et al., 2015). It also does not consider processes influencing total ecosystem C balance such as methane dynamics or volatile organic C or CO losses (Chapin et al., 2006). However, the user is able to evaluate the relative importance of (1) changes in SOC production and oxidation rates in the eroding profile and the depositional profile and (2) the fraction of eroded material arriving at the depositional profile in driving the influence of erosion and subsequent deposition on an integrated watershed's C budget.
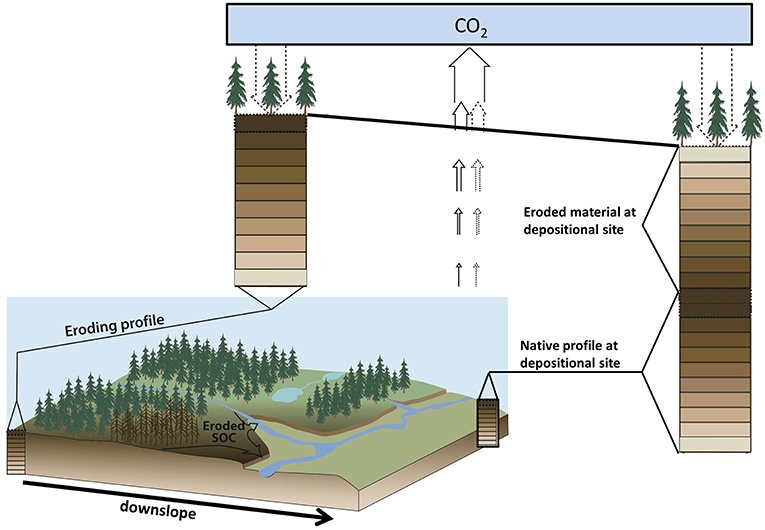
Figure 1. Schematic of a landscape experiencing erosion (upslope) and deposition (downslope), as conceptualized by the Soil Organic C Erosion Replacement and Oxidation-Deposition (SOrCERODe) model. Shades of brown at each depth depict variation in SOC concentrations with depth. In the eroding profile and native profile at the depositional site, SOC concentrations decline with depth. In eroded material deposited at depositional site, colors are inverted to represent topsoil layers with relatively high SOC concentrations being deposited prior to formerly deep layers. Note that the coloring does not reflect new SOC production at the depositional setting. At both eroding and depositional sites, SOC production (dashed downward-facing arrows) occurs concurrently with SOC oxidation (solid, upward-facing arrows) and CO2 production by autotrophs (dashed, upward-facing arrows). SOrCERODe allows the user to define the erosion rate, the deposition rate, and the degree to which SOC production and oxidation at each depth is influenced by erosion at the eroding site and by deposition at the depositional site. Figure adapted from Billings et al. (2010).
We applied SOrCERODe in two contrasting forested ecosystems. Our objective was to assess the relative importance of erosion rate, oxidation of SOC during transport, deposition rate, and altered SOC production and oxidation in both eroding and depositional profiles as influences on ecosystem SOC balances. Our efforts represent one step toward constraining the watershed-scale C dynamics that result from the lateral movement of SOC across a landscape. One forest is a mesic, warm temperate forest supported by soils containing relatively low SOC content that have experienced anthropogenically enhanced erosion rates. This forest was the subject of our original explorations with SOrCERO of eroding profiles' influence on atmospheric CO2 (Billings et al., 2010). It is leveraged here as representative of forest soils in the southeastern U.S. that experienced significant erosion upon conversion to agricultural land upon European settlement (Trimble, 2008), prompting widespread deposition of formerly upland soil materials in riparian areas (Trimble and Lund, 1982; James, 2013), some aided by mill dams (Walter and Merritts, 2008). The second forest is a mesic boreal forest with relatively high SOC content (Ziegler et al., 2017) that experiences relatively low erosion rates due to its closed canopy status, the low erosional impact of high latitude precipitation, and the snowmelt-dominated annual hydrographs. We employ these forests as contrasting environments (low SOC and high erosion rates, and high SOC and low erosion rates) to explore the influences of SOC erosion and deposition, and associated changes in SOC production and oxidation on soil profile and watershed SOC pools.
Methods
The Model
Details of the original SOrCERO model are found in Billings et al. (2010). Briefly, the original model prompts users to parameterize initial conditions in any soil profile of interest with SOC contents at multiple, evenly-spaced depths. Each interval's thickness is dictated by a user-determined erosion rate. For example, an erosion rate of 1 mm y−1 defines each soil layer as 1 mm thick. For each depth, the user provides SOC content (kg C m−2) and initial rates of SOC oxidation (kox, y−1) and production (I, kg C m−2). These processes are held at steady state as an initial condition prior to the onset of erosion. Functions for smooth interpolations between known values are provided such that each layer, regardless of thickness, is populated. A key advance made by SOrCERO was the introduction of mixing coefficients that compute how SOC oxidation and production rates at the eroding profile change over time (nox and nprod, respectively). These mixing coefficients are provided by the model user, and reflect the user's assumptions about any changes in SOC oxidation and production at the eroding profile as erosion proceeds, an elusive value to estimate in soil profiles. The inclusion of these coefficients in the model allows the user to assess the importance of this knowledge gap. Values of nox and nprod can vary between zero and one, inclusive, and are independent of each other. They reflect oxidation and production rates that are either absolute or relative, respectively. Absolute rates of SOC oxidation and production define rates as originally assigned to each soil layer in the profile, and remain unmodified throughout model runs even as layers become increasingly shallow as erosion occurs. In contrast, relative rates are those originally assigned to each depth increment, not each layer, and thus change for all layers as they become increasingly shallow upon the onset of erosion.
As erosion proceeds at the user-defined rate for the specified time period, the model modifies each layer's SOC content at the end of the previous time step (or, for the initial time step, from initial values) according to Equation (1):
where Ct is the amount of SOC in the layer at the end of time step t, kox,R is the new SOC oxidation rate constant assigned to the layer (relative), kox,A is the SOC oxidation rate constant originally assigned to the layer (absolute), t is the time step, IR is the SOC production rate newly assigned to the layer (relative), and IA is the SOC production rate originally assigned to the layer (absolute). Prior to the onset of erosion, the soon-to-be-eroded profile is assumed to be in steady state with respect to SOC inputs and outputs; this changes according to the user's designations of nox and nprod. Model outputs include changing profile SOC content over time, and the net CO2 sink or source of the eroding profile in the specified time period.
The expanded SOrCERODe model is comprised of SOrCERO plus a new module that accounts for C dynamics in depositional profiles. Here, the depositional profile is assumed to be in steady state with respect to SOC inputs and outputs until eroded SOC is deposited. At that point, SOC content in a profile's layer at the end of time step t (Ct(d)) will equal Ct−1(d) minus the SOC oxidized plus SOC produced at the deposition profile during the time period specified, plus the SOC deposited. Both oxidation and production of SOC at the depositional profile are defined according to some combination of the originally-defined (absolute) and changing (relative) rates, as per user specification. These processes are defined in Equation (2):
where subscripts d refer to the depositional profile. Note that for the eroding profile, nox and nprod prescribe SOC oxidation and production rates relative to those rates in the surface horizon, and for the depositional profile these mixing coefficients prescribe rates relative to those in the surface horizon of the buried profile; as a result, arriving SOC has the potential to enhance SOC production at the depositional profile, presumably via enhanced ecosystem productivity, and to mitigate oxidation of buried SOC. Any enhanced SOC production would presumably arise due to at least partial mineralization of, and associated CO2 losses from, arriving soil organic matter. The final term in Equation (2), D, is the amount of SOC deposited immediately upon erosion at the specified time point. This term is derived from a user-defined fraction of the eroded material that reflects assumptions about the probability that eroded SOC arrives at the depositional location instead of undergoing mineralization during transport, or export to streams; either scenario prevents eroded SOC from residing in a depositional profile. Depending on the user's intentions, D also can be modified to reflect the proportion of eroding relative to depositional settings in the area of interest. The amount of eroded SOC subjected to those assumptions depends on the user's assigned values of nox and nprod at the eroding profile. Note that though both erosion and deposition are phenomena distributed across landscapes, Equations (1, 2) treat both erosion and deposition as one-dimensional processes. However, by considering erosional and depositional functions in conjunction with each other, we can take a large step forward in understanding potential responses of watershed C fluxes to erosion.
Model Limitations and Assumptions
There are multiple scenarios that can govern SOC fluxes into and out of soil profiles that SOrCERODe does not explicitly accommodate. For example, SOrCERODe does not account for leaching losses of dissolved organic C (DOC) or other known pathways of C loss from terrestrial ecosystems, which combined can represent a meaningful fraction of an ecosystem's C losses (Chapin et al., 2006). Another limitation of the model is that it offers no means of incorporating soil texture or lithologic discontinuities, both of which can be important drivers of SOC transit times within soil profiles (e.g., Nadeu et al., 2012) and SOC concentrations of eroded material (Papanicolaou et al., 2015). Similarly, phenomena responsible for non-monotonic depth distributions of SOC such as freeze-thaw events and animal burrowing (Matzner and Borken, 2008; Clark et al., 2016) are not explicitly accounted for in the model, and size separation during overland transport (Hu and Kuhn, 2014) is not explicitly defined. However, by prescribing each soil layer's SOC production and oxidation functions, the user can prescribe input parameters that implicitly account for such features. It also is important to note that SOrCERODe is best suited for assessing the influence of SOC erosion and deposition on ecosystem C dynamics when erosion rates are relatively constant. If event-based erosion temporally interspersed with longer-term, slower erosion rates is of interest, the user must concatenate model runs defined by varying erosion rates and erosion duration. Given the stochastic arrival of sediment packages comprised of diverse soil textures in depositional settings (e.g., Wilson et al., 2012) and spatial heterogeneity in profile characteristics across watersheds (Dialynas et al., 2016), an important next step for model development is more elegant integration of temporal and spatial heterogeneity in delivery of sediment packages.
In addition to these limitations, SOrCERODe implicitly assumes several ecosystem features. First, current parameterization assumes equivalent depth distributions of SOC content and turnover characteristics and equivalent profile depths at both erosional and depositional sites prior to the onset of erosion, and that SOC inputs and losses from these profiles are at steady state prior to the onset of erosion. We parameterize the model in this way to permit exploration of landscape evolution (i.e., a deepening depositional profile) as the system departs from steady state. SOrCERODe also makes no explicit provisions for lighter SOC to escape terrestrial, depositional environments (e.g., into streams). Instead, the user must incorporate their assumption of how much eroded SOC is lost into the fraction of SOC arriving at the depositional setting. Additionally, the model assumes uniform, layer-by-layer erosion and deposition. In reality, overland transit can be a turbulent and stochastic process (Hu and Kuhn, 2014), with depositional profiles subjected to spatially and temporally heterogeneous inputs from erosional areas of varying magnitudes. Finally, though SOrCERODe is a one-dimensional model, we can upscale modeled results; however, we must know the proportion of eroding to depositional settings in a watershed, an idea explored in our analyses. In spite of these limitations, the model represents a step toward developing the process models needed to better constrain the dominant processes responsible for watershed-scale C balances as they evolve with landscape evolution over time.
Model Application
We apply SOrCERODe in two contrasting forests. One is a hardwood stand within the Calhoun Critical Zone Observatory (CZO) in South Carolina, USA. Dominant species include white oak (Quercus alba), northern red oak (Quercus rubra), hickory (Carya spp.), sweetgum (Liquidambar styraciflua), and yellow poplar (Liriodendron tulipifera). Tree age derived from breast height cores averages 129 ± 21 (s.d.) y. Soils are Oxyaquic Kanhapludults on granitic gneiss; the surface mineral horizon is a sandy loam underlain by a clay-rich Bt horizon and regolith extends ~38 m in depth (Bacon et al., 2012). We infer from multiple sources (W. Cook and D. Richter, pers. comm.) that soils in the forest stand employed in the current study have not been subjected to the plow, though the region experienced widespread, agriculturally accelerated erosion (Richter and Markewitz, 2001; Trimble, 2008). Thus, this forest's soils exhibit characteristics we take to be similar to those that experienced accelerated erosion upon clearing, a widespread historical phenomenon in this region (Richter and Markewitz, 2001). We consider these forest soils to be representative of those upslope of depositional, floodplain soils prior to European settlement in a ~638 ha watershed where SOC depth distributions of depositional settings recently have been well-characterized, and where previous landscape-level work indicates that depositional settings comprise <10% of the landscape (K. Godsey and D.D. Richter, personal communication).
The second forest lies within the Newfoundland and Labrador Boreal Ecosystem Latitudinal Transect (NL-BELT) in eastern Canada, part of the Critical Zone Exploratory Network. The dominant overstory species is balsam fir (Abies balsamifera) averaging 47 y (±6 s.d.) at breast height. The forest has developed on post-glacial till and moderately coarse grained glaciofluvial materials (Ricketts, 2001). Soils in these forests are well-drained, humic ferric podzols (as designated by the Canadian Forest Service; Haplorthods in the U.S. system). These soils possess well-developed organic horizons (average thickness of 8 ± 1.5 cm) overlying sandy loam B horizons (A horizons are often not expressed and E horizons only weakly so) underlain by relatively shallow till (i.e., <50 cm; McCuaig, 2002). There is no evidence or record of harvesting activity in these stands, and the major stand disturbance is insect outbreaks (D. Harris, pers. comm.). We consider these forest soils to be representative of those upslope of streambank soils in a ~345 ha watershed. The forested headwater streams monitored in conjunction with these forest profiles exhibit clear waters even during storm events, with particulate organic matter representing a minor fraction of total organic matter concentrations (S. Ziegler, pers. comm.), consistent with relatively low erosion rates.
For both forests, we populated model input parameters for the eroding profile following the approach described in Billings et al. (2010). Briefly, we used depth distributions of bulk density and SOC concentrations obtained in both forests from previous work (Markewitz and Richter, 1998; Richter et al., 1999; Ziegler et al., 2017) to generate SOC content in each soil layer (Figure 2). In both forests, the first order oxidation rate constants kox were derived from the inverse of estimated SOC mean residence times (MRT), which in turn were constrained by radiocarbon signatures of SOC stocks derived from previous studies (Richter et al., 1999; Ziegler et al., 2017) and as described in Billings et al. (2010). We appreciate that MRT estimates of SOC based on radiocarbon rely on several assumptions that are likely false in many forest soil profiles (Sierra et al., 2017) and employ these preliminary values as a simplified, first attempt to characterize these profiles' SOC dynamics. We defined MRT of SOC as 10 and 2,000 y at the surface and 100 cm depth, respectively, at the Calhoun CZO (i.e., 0.1 and 0.0005 y−1, respectively). Values between these surface and deep estimates were interpolated following a function defined by the depth distribution of SOC fraction. At NL-BELT, estimates of MRT of SOC are much younger, exhibiting surprisingly modern values throughout the relatively shallow profiles: 33 and 62 y in surface O horizons and at 10 cm depth in the mineral soil, respectively (i.e., 0.030 and 0.016 y−1, respectively); these estimated mineralization reactivities are discussed in Ziegler et al. (2017). We parameterized the model with no interpolation between these values, but instead an abrupt shift in value to reflect the sharp horizon distinction between O and mineral horizons. Within each forest, we assumed that eroding and depositional profiles exhibited identical depth distributions of SOC content and kox prior to the onset of modeled erosion and deposition; in this way, we are able to observe the influence of erosion and deposition, de novo, on these profiles' depth distributions of SOC. Note that each layer's kox value defines that layer's SOC input rate I with the assumption that the eroding and depositional profiles are at steady state prior to erosion, and both kox and I are modified as erosion occurs according to user assumptions about nox and nprod.
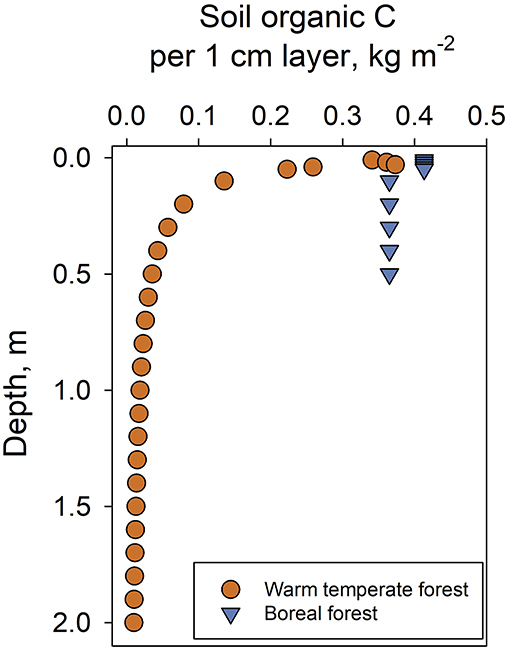
Figure 2. Depth distributions of soil organic C (SOC) content in a warm temperate forest (Calhoun Critical Zone Observatory, South Carolina, USA) and a mesic boreal forest (Newfoundland and Labrador Boreal Ecosystem Latitudinal Transect, Canada) used as input parameters for the Soil Organic C Erosion Replacement and Oxidation-Deposition (SOrCERODe) model. Values are smoothed from actual values (Markewitz and Richter, 1998; Ziegler et al., 2017). Note that soil profiles in the boreal forest are shallower than in the warm temperate forest. In the current study, each forest's erosional and depositional profiles are assumed to exhibit these depth distributions prior to initiation of modeled erosion and deposition, allowing model users to investigate the influence of erosion, deposition, and SOC production and oxidation on profile SOC content post-erosion.
These two forests contrast in ways relevant to erosion-induced changes in the C cycle. In the boreal forest, erosion of the shallow soil profiles is primarily driven by hydrologic flows of Oi sub-horizon material (~47% C, that of recent plant litterfall) downslope to riparian areas. Hydrologic data from this and nine additional forests in the region indicate that runoff is a substantial fraction of incoming precipitation (S. Ziegler and K. Prestegaard, pers. comm.), but we assume low erosive precipitation in this closed-canopy, high latitude forest, and that erosion rates are very low in spite of the forests' mesic nature. In the warm temperate forest, O horizons are thinner, mineral soils are thicker and are less C-rich than in the boreal forest. The relatively high erosion rates that soils in the warm, temperate, southeastern U.S. experienced upon conversion of hardwood forest to agriculture in the late eighteenth, nineteenth, and early twentieth centuries resulted in relatively low-C mineral soil being transported rapidly to floodplains downslope, driven by highly erosive rainfall in conjunction with poor soil management practices (Richter and Markewitz, 2001). Thus, these two forests contrast in soil depth to bedrock, soil organic C concentrations, and erosion rates—all important features to consider when investigating the influence of erosion on C budgets over time.
Employing these two contrasting forests, we ran SOrCERODe for 100 y at two erosion rates broadly representative of or higher than either their current or historic erosional histories: 1 mm y−1, which represents a conservative estimate of historical erosion rates in the warm temperate forest soils after conversion to agriculture (Trimble, 2008; Billings et al., 2010), and 0.1 mmy−1, an order of magnitude lower (though still higher than many natural systems as inferred over geologic timescales; Wilkinson and McElroy, 2007; Bacon et al., 2012). We also varied the fraction of eroded SOC that reaches the depositional profile. For each of these scenarios, we explored two combinations of nox and nprod values. First, we set these terms to represent maximum SOC production for both eroding and depositional profiles in each forest. At the eroding profiles, we thus assumed that SOC production was maintained in spite of erosion, and that each profile layer's SOC oxidation was maintained in spite of a presumed increase in oxygen access as erosion occurs. At the depositional profiles, we assumed that SOC production was enhanced, and oxidation of buried SOC mitigated, upon deposition. Next, we set these terms to represent minimum SOC production and maximum oxidation for both eroding and depositional profiles in each forest. This combination of nox and nprod values at the eroding profile corresponds to an assumption of reduced SOC production and each profile layer's SOC oxidation becoming enhanced upon erosion. At the depositional profiles, these nox and nprod values correspond to no enhancement of SOC production, and maintenance of SOC oxidation in spite of its burial.
The boreal forest region invoked here has relatively shallow soils (Figure 2), so we limited our analyses to relatively shallow depths in this forest. In contrast, the warm temperate forest has a soil profile many meters deep (Bacon et al., 2012). For this forest, we present results for a soil profile truncated at the same depth as in the boreal forest (termed the shallow scenario) to allow for a direct comparison of the two forest types across the same depths. We also present results for warm temperate forest profiles >1 m deep (termed the deep scenario; this represents the original top meter in the depositional profile plus deposited material). These deeper modeled profiles more likely represent these warm temperate forests' C dynamics upon erosion and deposition. These shallow and deep scenarios are distinct only at the warm temperate forest depositional profile, where deposition can generate relatively deep profiles in some modeled scenarios, consistent with the concept of legacy sediments (James, 2013). For all model runs, we report net CO2 source (+) or sink (–) strength at the eroding and depositional profiles and their combined influence.
The model simulations do not require the user to know the relative proportion of erosional vs. depositional areas within a watershed. This approach compares eroding and depositional settings that are equivalent in area (i.e., each m2 of eroding profile contributes SOC to each m2 of depositional profile). This is not reflective of most watersheds' geomorphologies, where depositional settings receive a disproportionately large amount of sediment from surrounding hillslopes (Anderson and Anderson, 2010). We thus also performed model runs that account for the additional annual SOC inputs that depositional profiles would receive given a specified proportion of eroding and depositional soil types in a given watershed. For these model runs, we leveraged recent estimates of upland and floodplain soils comprising 90 and 10% of the Calhoun CZO's warm temperate forests, respectively (D. Richter, personal communication); we applied these same values to the boreal forest watershed to provide a point of comparison. In these model runs, erosion rates of 1.0 and 0.1 mm y−1 from 90% of a watershed prompt a maximum of 9.0 and 0.9 mm y−1 to be deposited on 10% of the watershed's area (though recall that the user can modify the fraction of eroding SOC arriving at the depositional profile). Note that assuming that only 10% of the watershed receives eroding material thus generates deeper profiles than was previously modeled, an additional factor contributing to changing profile SOC content upon erosion. Specifically, these calculations assume that depositional profiles deepen by 0.09 and 0.9 m with a 0.1 and 1.0 mm y−1 erosion rate, respectively. In both the boreal and the warm temperate forest, we report how accounting for these disproportionately large SOC inputs in modeled depositional profiles may modify watershed-scale SOC content after 100 y of erosion at these two rates.
Results
Eroding Profile C Sinks and Sources
In both forests, model maximization of SOC production and minimization of SOC oxidation at the eroding profiles—i.e., enhancing each profile layer's SOC production while preventing its oxidation from increasing as it becomes shallower—resulted in stronger C sinks or weaker C sources, as would be expected (Figure 3, Tables 1–3). At both forests' eroding profiles, both the C sink and C source strengths increased with erosion rate, though potential sink strengths increased to a greater degree than potential source strengths (Figure 3A vs. Figure 3B).
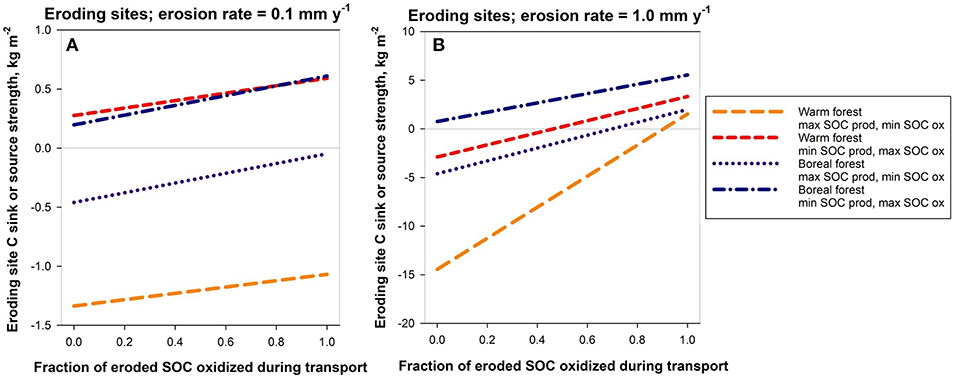
Figure 3. The net C sink or source strength of eroding profiles as a function of the fraction of SOC oxidized during transport for a warm temperate forest and a boreal forest after 100 y of erosion at two specified erosion rates 0.1 mmy−1 (A) and 1.0 mmy−1 (B). The two labeled scenarios represent contrasting assumptions about (1) potential enhancement of each depth's SOC oxidation rate as it nears the surface upon erosion, and (2) potential decline of SOC production rates for each depth as it nears the surface upon erosion. Negative values indicate net C sinks; positive values indicate net C sources to the atmosphere. Note change in Y axis scaling across erosion rates. Max, maximum; min, minimum. See text for model description and definitions of maximum and minimum SOC production and oxidation.
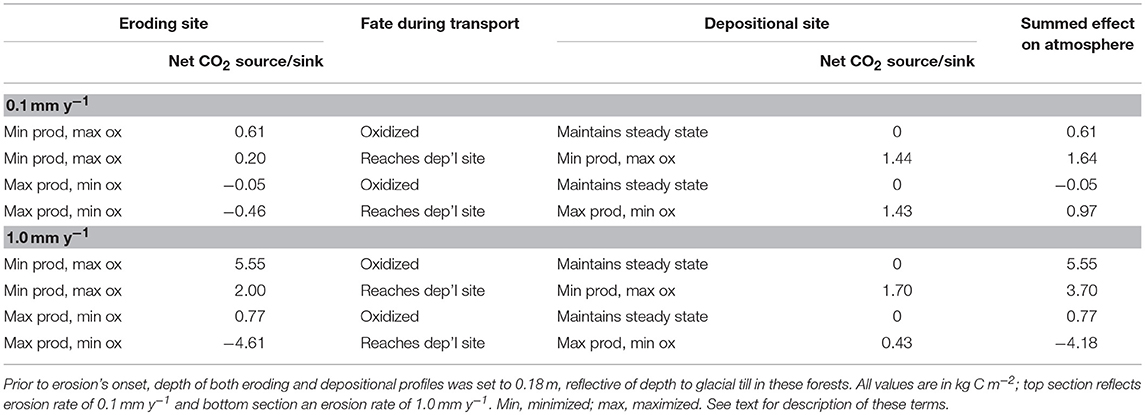
Table 1. Boreal forest eroding and depositional sites' net CO2 source (+) or sink (–) strengths, and their summed effects on the atmosphere, for given soil organic C oxidation and production characteristics at both sites and two potential fates of eroded material for model runs of 100 y duration.
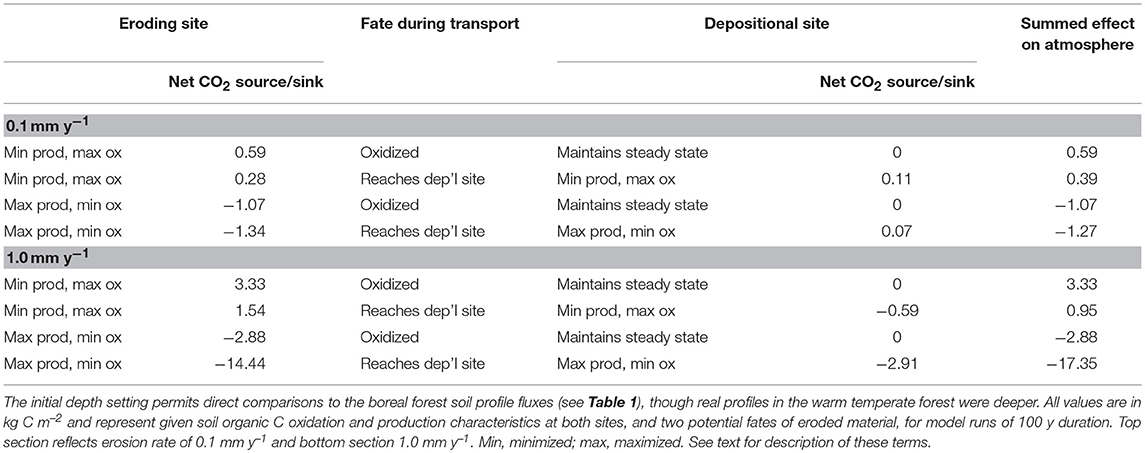
Table 2. Warm temperate forest eroding and depositional sites' net CO2 source (+) or sink (-) strengths, and their summed effects on the atmosphere, assuming that initial depth of both profiles was 0.18 m.
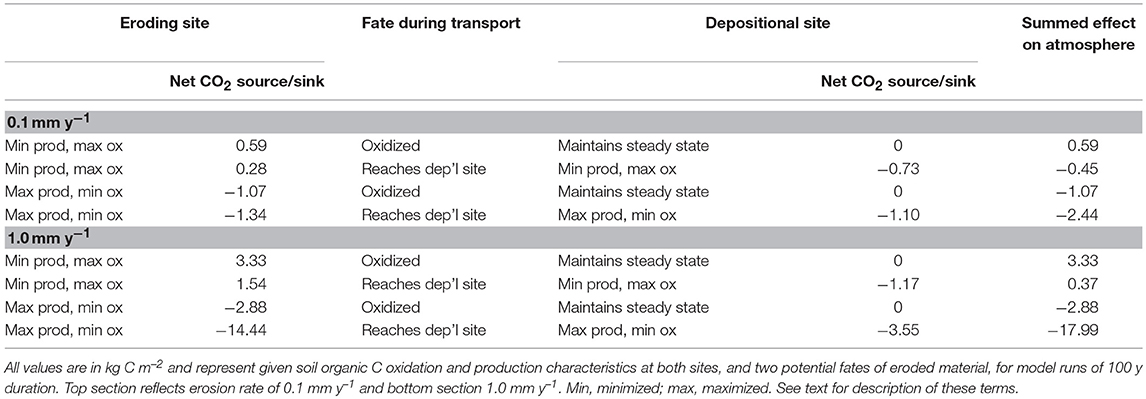
Table 3. Warm temperate forest eroding and depositional sites' net CO2 source (+) or sink (-) strengths, and their summed effects on the atmosphere, assuming that initial depth of both profiles was 1.0 m.
If no eroded SOC undergoes oxidation during transport, 100 y of erosion at 0.1 mm y−1 in the warm temperate forest resulted in a potential C sink strength of −1.3 kg C m−2 (Figure 3A, left-most point of long-dash line) when SOC production is maximized and SOC oxidation is minimized upon erosion. This is equivalent to 19% of the original profile SOC content. In contrast, 100 y of erosion at 1 mm y−1 in this same forest resulted in a potential C sink strength of −14.4 kg C m−2 if no eroded SOC undergoes oxidation during transport and if SOC production is maximized and SOC oxidation is minimized upon erosion (Figure 3B, left-most point of long-dash line). This suggests that an increase in erosion rate by one order of magnitude can increase the sink potential of the eroding profile by more than one order of magnitude. Even if we assume that no eroded SOC is oxidized and SOC production is minimized and SOC oxidation is maximized, 100 y of erosion at 1 mm y−1 in the warm temperate forest generated a C sink of −2.9 kg C m−2, equivalent to 43% of the original profile SOC content.
In the boreal forest, potential C sources to the atmosphere after 100 y of erosion were highest for both erosion rates when SOC production was minimized and SOC oxidation was maximized, ranging from 0.6 to 5.5 kg C m−2 at 0.1 and 1.0 mm y−1, respectively (right-most point of dot-dash line in Figures 3A,B, respectively). When SOC production was maximized and SOC oxidation was minimized at the boreal forest eroding profile, the lower erosion rate always induced a net sink, the largest of which represented 7% of the original profile SOC content. The higher erosion rate only induced a net CO2 source to the atmosphere when more than ~70% of eroded SOC experienced oxidation post-erosion.
Soil Organic C Arriving at Depositional Profiles
In the model, the mass of eroded SOC deposited at depositional profiles depends on two phenomena: the rate of erosion; and the rate of SOC production and oxidation within the eroding profile (i.e., nox and nprod of eroding profiles), which dictate the concentration of SOC in the eroded material. When we assumed that no eroded SOC was oxidized during transport, boreal forest depositional profiles received 0.41 and 5.37 kg C m−2 after 100 y of erosion when erosion rates were set at 0.1 and 1.0 mm y−1, respectively, and eroding profile SOC production was maximized and oxidation was minimized (Figure 4A, middle bar). In contrast, when eroding profiles experienced lower SOC production and higher SOC oxidation, boreal forest depositional profiles received 0.41 and 3.55 kg C m−2 for erosion rates of 0.1 and 1.0 mm y−1, respectively (Figure 5A, middle bar).
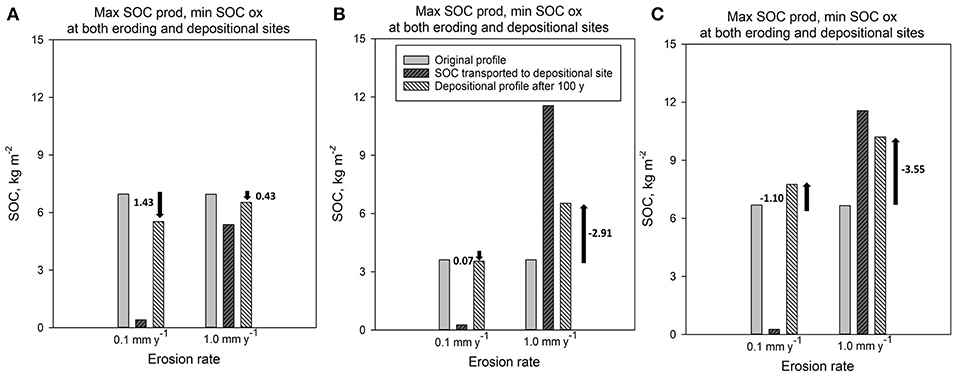
Figure 4. Soil organic C content in depositional profiles prior to erosion onset (left most bar in each set), SOC content arriving at depositional sites (middle bar in each set), and SOC content in depositional profiles after 100 y (right-most bar in each set) at the specified erosion rates for boreal forest soils (A) and warm temperate forest soils (B,C). In all scenarios, both eroding and depositional sites experienced maximized SOC production and minimized SOC oxidation upon erosion and deposition (see text for details of model parameterization). Boreal forest soil profiles (A) were 0.18 m deep prior to the onset of deposition, and 0.19 or 0.28 m deep after 100 y of deposition at 0.1 and 1.0 mm y−1, respectively. In (B), warm temperate forest soils were truncated at the same depth as the boreal forest soils (A) to enable direct comparison across these forests; (C) reflects the top 1.01 (0.1 mm y−1) and 1.1 (1.0 mm y−1) of depositional profiles in the warm temperate forest to enable projection of more realistic fluxes in these deep soils. Arrows reflect net SOC loss from profile (downward arrows) or net SOC gain to profile (upward arrows); numbers represent corresponding net SOC source to atmosphere or net SOC sink, respectively. Note that middle bars in each set remain constant across (B,C), because SOC amount deposited does not depend on depositional site conditions.
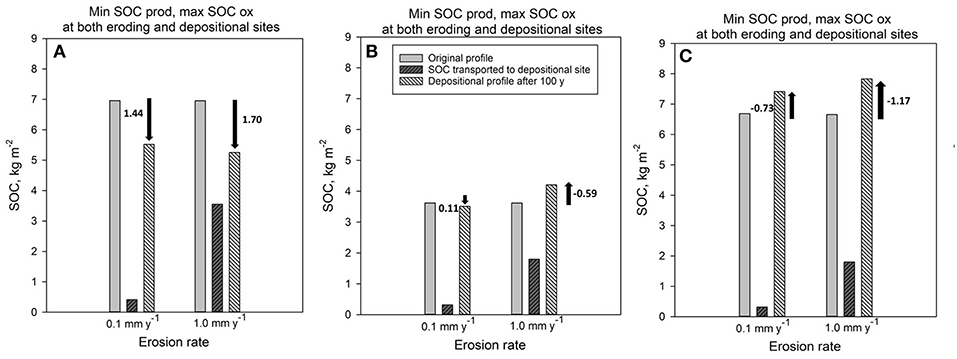
Figure 5. Soil organic C content in depositional profiles prior to erosion onset (left most bar in each set), SOC content arriving at depositional sites (middle bar in each set), and SOC content in depositional profiles post-deposition (right-most bar in each set) at the specified erosion rates for boreal forest soils (A) and warm temperate forest soils (B,C). In all scenarios, both eroding and depositional sites experienced minimized SOC production and maximized SOC oxidation upon erosion and deposition (see text for details of model parameterization). Boreal forest soil profiles (A) were 0.18 m deep prior to the onset of deposition, and 0.19 or 0.28 m deep after 100 y of deposition at 0.1 and 1.0 mm y−1, respectively. Warm temperate forest soils were truncated at the same depth as the boreal forest soils in (B) to enable direct comparison across these forests; (C) considered the top 2 m of depositional profiles in the warm temperate forest to enable projection of more realistic fluxes in these deep soils. Arrows reflect net SOC loss from profile (downward arrows) or net SOC gain to profile (upward arrows); numbers represent corresponding net SOC source to atmosphere or net SOC sink, respectively. Note that middle bars in each set remain constant across (B,C), because SOC amount deposited does not depend on depositional site conditions.
When nox and nprod at eroding profiles were set to maximize SOC production and minimize SOC oxidation, the warm temperate forest depositional profiles received 0.27 and 11.56 kg C m−2 for erosion rates of 0.1 and 1.0 mm y−1, respectively (Figures 4B,C, middle bars). Note that these values are constant regardless of the depth of the warm temperate forest depositional profile (Figure 4B vs. Figure 4C). When eroding profiles experienced lower SOC production and high SOC oxidation than prior to erosion, the warm temperate forest depositional profiles received 0.32 and 1.80 kg C m−2 for erosion rates of 0.1 and 1.0 mm y−1, respectively (middle bars in Figures 5B,C).
Depositional Profile C Sinks and Sources
Depositional profiles were assumed to remain in steady state when all eroded SOC underwent oxidation during transport and no eroded material arrived at depositional profiles. Model runs depicting this scenario thus indicate that depositional profiles had no net influence as a CO2 source or sink (Table 1, see rows in which depositional profile is designated as maintaining a steady state). In contrast, when eroded SOC reached depositional profiles (i.e., was not oxidized during transport), depositional profiles served as either a CO2 sink or source (Figures 4, 5, far right bars). Depositional profile sink or source strength depended on the mass of material deposited (section Soil Organic C Arriving at Depositional Profiles) and the degree to which deposition of SOC influenced SOC production and oxidation at the depositional profile (i.e., nox and nprod at depositional profiles).
When eroded material reached the depositional profiles and SOC production was maximized and SOC oxidation was minimized at both eroding and depositional profiles, the boreal forest depositional profiles served as a small net CO2 source to the atmosphere regardless of erosion rate after 100 y of erosion and deposition (1.43 kg C m−2 at 0.1 mm y−1 and 0.43 kg C m−2 at 1.0 mm y−1; Figure 4A). Under these same constraints, depositional profiles in the warm temperate forest served as either a small net CO2 source to the atmosphere (0.07 kg C m−2 at 0.1 mm y−1) or a net CO2 sink (−2.91 kg C m−2 at 1.0 mm y−1) when we considered a depositional profile the same depth as in the boreal forest (Figure 4B). When we deepened the depositional profile, the sink strength of the warm temperate forest depositional profile increased to −1.10 and −3.55 kg C m−2 at 0.1 and 1.0 mm y−1, respectively, under these same conditions of maximized SOC production and minimized SOC oxidation at both eroding and depositional profiles (Figure 4C).
When we assigned nox and nprod values that minimized SOC production and maximized SOC oxidation at both eroding and depositional profiles, 100 y of erosion and deposition induced a net CO2 source in the boreal forest (1.44 and 1.70 kg C m−2 at 0.1 and 1.0 mm y−1, respectively; Figure 5A) and a small CO2 source (0.11 kg C m−2) or sink (−0.59 kg C m−2) at 0.1 and 1.0 mm y−1, respectively, in a similarly shallow warm temperate forest profile (Figure 5B). Deepening the warm temperate forest depositional profile generated a consistent CO2 sink regardless of erosion rate (−0.73 and −1.17 kg C m−2 at 0.1 and 1.0 mm y−1, respectively; Figure 5C).
Assessing Whole-System C Sinks and Sources Resulting From Erosion and Deposition of SOC
The combined influence of eroding and depositional profiles on whole-system, net C uptake or loss after 100 y of erosion varied with forest type, erosion rate, and values of nox and nprod at both eroding and depositional profiles (Tables 1–3). At the lower erosion rate (0.1 mm y−1), the boreal forest eroding and depositional profiles, combined, generated a small net CO2 sink (0.05 kg C m−2) when no eroded SOC reached the depositional profiles and eroding profile SOC productivity was maximized and SOC oxidation was minimized (Table 1). This sink effect was exhibited entirely at the eroding profile. In all other scenarios, the combined effect of eroding and depositional profiles in the boreal forest was a net CO2 source, ranging from 0.61 to 1.64 kg C m−2. In the scenarios in which eroded SOC was not oxidized during transport, net CO2 sources across the whole system were dominated by fluxes at the depositional profiles.
When the erosion rate increased to 1.0 mm y−1, the combined erosional and depositional profiles exhibited greater variation in net CO2 sinks and sources. Here, the influence of erosion and deposition ranged from a net CO2 source of 5.55 kg C m−2 to a net CO2 sink of −4.18 kg C m−2. In contrast with the lower erosion rate, the majority of these 100-y sinks and sources were exhibited at the eroding profile.
For the warm temperate forest's shallow and deep scenarios, we also observed less variation in summed eroding and depositional profiles' net CO2 sink and source terms at the lower erosion rate (Tables 2, 3). At 0.1 mm y−1, the shallow scenario resulted in net CO2 sinks and sources ranging from a net source of 0.59 kg C m−2 to a net sink of −1.27 kg C m−2 after 100 y (Table 2). At 1.0 mm y−1, the shallow scenario ranged from a net source of CO2 of 3.33 kg C m−2 to a net sink of −17.35 kg C m−2. When we allowed the depositional profile in the warm temperate forest to deepen from a starting depth of 1 m, the lower erosion rate resulted in values ranging from a maximum net source of CO2 to the atmosphere of 0.59 kg C m−2 to a maximum net sink of CO2 from the atmosphere of −2.44 kg C m−2 (Table 3). At the higher erosion rate, the deeper profile in the warm temperate forest exhibited a greater range of whole-system CO2 fluxes, ranging from a small net CO2 source of 0.37 kg C m−2 to a net CO2 sink of −17.99 kg C m−2. In this warm temperate forest, the majority of the summed, net effect of erosional and depositional profiles on atmospheric CO2 was dominated by fluxes at the eroding profile, particularly at the higher erosion rate when eroding profile SOC production was maximized and oxidation was minimized (Table 3).
Model Simulations Assuming Disproportionately Large SOC Inputs at Depositional Settings
Though the warm temperate forest watershed under study is larger (~638 ha) than the boreal forest watershed (~345 ha), model estimates suggest that these forests contain similar quantities of SOC in their pre-eroded state (6.65 and 6.96 kg m−2 or 4.24 and 2.40 Mg in each watershed, respectively; Figure 6). These values are influenced by assumptions of initial profile depths of 1.0 and 0.18 m in the warm temperate and boreal forest, respectively. Model runs that transferred nine times the eroding material to depositional profiles (i.e., assuming that 90% of both forests experience erosion and 10% receive eroded material) over 100 y of erosion at an erosion rate of 0.1 mm y−1 resulted in a net CO2 source to the atmosphere in both forests (lower post-erosion SOC content in both panels of Figure 6A). This was true regardless of whether the model was parameterized for the maximum possible CO2 sink or maximum possible CO2 source. The net CO2 source, or net loss of SOC from the watersheds, ranged from 3.04 kg m−2 (1.94 Mg) in the warm temperate forest to 3.16 kg m−2 (1.09 Mg) in the boreal forest. However, when the modeled erosion rate increased, both forests' model runs exhibited a net CO2 sink when parameterized for the maximum possible sink, ranging from −0.45 kg m−2 (0.16 Mg) in the boreal forest to −4.46 kg m−2 (2.85 Mg) in the warm temperate forest (Figure 6B). When parameterized for the maximum possible source at this higher erosion rate, CO2 sources ranged from 2.76 kg m−2 (1.76 Mg) to 4.90 kg m−2 (1.69 Mg) in the warm temperate and boreal forests, respectively (Figure 6B).
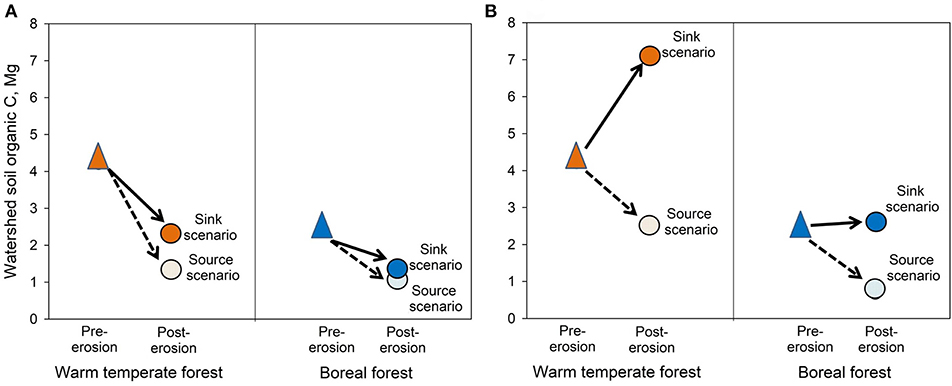
Figure 6. Model estimates of soil organic C prior to the onset of modeled erosion (triangle in all panels), and after 100 y of erosion (post-erosion points in all panels) for two erosion rates: (A) 0.1 mm y−1 and (B) 1 mm y−1 in a warm temperate forest watershed and a boreal forest watershed, assuming that 90% of the watersheds experiences erosion and 10% experiences deposition. Values reflect watershed sizes of 638 and 345 ha for the warm temperate and boreal forests, respectively. The sink or source scenario terms refer to model runs generating the maximum possible CO2 sink or source terms. Maximum sink scenario assumes maximized SOC production and minimized SOC oxidation; maximum source scenario assumes minimized SOC production and maximized SOC oxidation in both eroding and depositional settings. Differences between the warm temperate and boreal forest are most pronounced at high erosion rates (B). Note that at low erosion rates (A), even when the sink strength is maximized the SOC content post-erosion is lower than the pre-erosion content in both forests, and thus this scenario does not represent a true sink, but rather a smaller CO2 source (i.e., greater SOC content relative to the maximum source scenario).
Discussion
By using SOrCERODe to compare two forests with contrasting characteristics relevant to erosional C dynamics—high erosion rate and lower SOC concentrations vs. low erosion rate and higher SOC concentrations—we estimate how erosion rate, fraction of eroded SOC arriving in depositional settings, and changing rates of SOC production and oxidation at eroding and depositional profiles can govern profile- to watershed-scale net soil CO2 sinks and sources. Some modeled CO2 fluxes were of meaningful magnitude; net C sink and source strengths of eroding and depositional profiles of the two studied forests reach or surpass the same order of magnitude as measured dissolved organic C exports from the surface horizon to deeper horizons in these boreal forests (~30 g C m−2 y−1; S. Ziegler, pers. comm.) and in the warm temperate forest (~20 g C m−2 y−1; calculated from Markewitz et al., 1998).
Eroding Profile CO2 Source and Sink Strengths
The enhancement of eroding profile CO2 sink strength when SOC production at the eroding profile is maintained (i.e., nprod = 1) in spite of surficial horizon losses was exaggerated with a higher erosion rate, a phenomenon also observed after 150 y of modeled erosion in the original presentation of SOrCERO that invoked the same warm temperate forest (Billings et al., 2010). Model results from both forests in the current study are consistent with Stallard's (1998) idea of dynamic replacement of SOC. However, we note that the eroding system consistently exhibited a net CO2 source for the boreal forest at both erosion rates when SOC production was minimized and oxidation was maximized (blue dot-dash lines, Figures 3A,B). Thus, in the extreme scenario of the eroding profile experiencing a decline in SOC production and increases in SOC oxidation of each layer of the profile as it becomes shallower, the boreal forest eroding profile serves as a small net CO2 source to the atmosphere. Observations of intact woody and leaf material in high-latitude regions (e.g., France et al., 1996; Köhler et al., 2009; Guillemette et al., 2017) including this boreal forest's streams (S. Ziegler, pers. comm.) and in many streams, lakes, and coastal sediments (Hedges et al., 1982; Golladay, 1997) suggest that some fraction of eroded material in these ecosystems undergoes lateral export to non-terrestrial environments. Thus, C dynamics of eroded material in watershed aquatic systems along with eroding profile C dynamics are important focal points for understanding the influence of erosion on terrestrial C dynamics.
In contrast, the warm temperate forest serves as a net CO2 sink from the atmosphere even when SOC production was minimized and oxidation was maximized at the higher erosion rate, when less than ~50% of eroded SOC is oxidized post-erosion (orange dashed line, Figure 3B). Indeed, an increase in erosion rate of one order of magnitude increased the potential sink strength of the eroding profile by more than one order of magnitude in the warm temperate forest. This, in conjunction with the much stronger potential sink strength of the warm temperate forest relative to the boreal forest, highlights the importance of these forests' contrasting depth distributions of SOC reactivity in governing eroding profile CO2 dynamics. In the boreal forest, the difference between estimates of SOC turnover time in surficial and the deepest modeled horizons was 29 y; in the warm temperate forest, that difference across equivalent depths was 785 y. The relatively greater reactivity of SOC in the boreal forest, even at depth, means that over a 100 y model run all original SOC in the boreal profiles has left those reservoirs, resulting in stronger net CO2 sources and weaker net CO2 sinks at eroding profiles in the boreal forest than in the warm temperate forest.
Depositional Profile CO2 Source and Sink Strengths
The frequent status of warm temperate forest depositional profiles as net CO2 sinks across model runs was driven by two features. First, when arriving material fueled greater SOC production (presumably via enhanced ecosystem productivity), sink strength increased. This result is consistent with forests in riparian areas exhibiting high productivity when flood disturbances are not too frequent or severe (Petit et al., 2017). Second, when oxidation of buried SOC was slowed, CO2 sources from native SOC at the depositional profile were mitigated. This is congruent with observations of buried paleo-A horizons in riparian areas at the Calhoun CZO (D. Richter, pers. comm.) and, more generally, preservation of SOC in buried profiles (van Oost et al., 2012; Marín-Spiotta et al., 2014). We emphasize that this second feature does not constitute a CO2 sink, but rather dampens a potential source term.
In spite of the frequent net sink strength of depositional profiles in the warm temperate forest, there is evidence of significant SOC loss from these depositional profiles. Even when a significant quantity of SOC arrived at depositional profiles, depositional profile SOC content after 100 y (right-most bar, Figures 4B,C) could be less than the amount of arriving SOC (middle bar, Figures 4B,C). This feature highlights the lability—and thus the oxidative potential—of arriving SOC, consistent with eroded material being typically comprised of SOC-rich, A horizon materials that are resource-rich for soil microbes (Berhe and Kleber, 2013). The dynamism of surface horizons is also highlighted by the relatively small difference in sink strength of shallow vs. deeper depositional profiles in the warm temperate forest. Incorporating relatively deep subsoils into assessments of depositional profile C dynamics can be relevant for accurate projections of C stocks (Doetterl et al., 2016), but in these forests' profiles, deepening the depositional profile enhanced sink potential less than might be expected of a linear system.
In contrast to the warm temperate forest, the boreal forest depositional profile was always a net CO2 source to the atmosphere no matter the erosion rate or the oxidation or production characteristics of the depositional profile. Thus, depositional profile SOC content was always lower than the original depositional profile, even after 100 y of deposition. This counterintuitive result likely reflects two phenomena. First, the material eroded and then deposited in the boreal forest is either all O horizon material (at the lower erosion rate) or ~80% O horizon material (at the higher erosion rate; O horizons in this forest average ~8 cm deep). Thus, material arriving at the depositional profile has high oxidation potential (Li et al., 2011). Second, the <100 y turnover time estimates of this material dictates that all eroded material undergoes oxidation within our 100 y model run. This feature means that SOC production must overwhelm oxidation of all arriving SOC to generate a net CO2 sink. We note that net CO2 source strength of the boreal depositional profile was weaker when erosion rate increased. This suggests that as material is deposited at boreal forest depositional profiles, it mitigates SOC oxidation and promotes SOC production, as we might expect. However, these processes were not sufficient to outpace the relatively high reactivity—and thus CO2 loss—of the highly labile deposited material.
Contrasting and Linking Eroding and Depositional Profile Influences on Atmospheric CO2
The generally increasing sink or source strength (i.e., increasing absolute values) for eroding and depositional profiles with an increase in erosion rate highlights the importance of erosion rate as a primary driver of C fluxes across landscapes. This was true in both forests, though the direction of the C flux varied widely. The potential for eroding profiles to serve as a strong C sink was heightened at eroding profiles in both forests as erosion rate increased, and in the warm temperate forest at depositional profiles as well. These observations particularly highlight the apparently strong influence of SOC's “dynamic replacement” (Stallard, 1998) at eroding profiles and, to a lesser extent, of eroding material's ability to promote SOC production at depositional profiles. This effect seems plausible when we consider that eroded and subsequently deposited material can be relatively nutrient-rich (Quinton et al., 2010; Kuhn, 2011), and thus that depositional profiles can experience nutrient enhancement over time. Indeed, downslope movement of organic matter is a significant contributor to organic carbon and nutrient stocks in depositional environments (Gregory et al., 1991; Köhler et al., 2009; Sanderman et al., 2009; James, 2013).
Summing the influence of erosional and depositional profiles on biosphere-atmosphere C fluxes allows us to estimate the influence of these processes at larger scales. Quantifying how SOC production and oxidation rates are modified upon erosion and deposition is notoriously difficult (van Oost et al., 2007; Billings et al., 2010), but we can make reasonable assumptions about other erosion-relevant factors in these forests to make valuable comparisons of their erosion-induced influence on atmospheric CO2. There are two cross-forest comparisons of particular interest. First, we can compare boreal forest land-atmosphere C fluxes resulting from that forest's relatively low erosion rates to those that likely occurred to warm temperate forest soils prior to European settlement, when erosion rates were also relatively low. Second, we can compare boreal forest soil C fluxes to those in the warm temperate forest soils during their period of accelerated erosion as agricultural soils. For both of these comparisons, we use the deeper depositional scenario in the warm temperate forest, as it likely reflects that region's deep profiles more accurately. We initially consider scenarios in which depositional profiles receive SOC at the same rate at which SOC erodes. We then turn to scenarios in which depositional profiles receive a disproportionately large amount of SOC due to their small areal extent relative to eroding profiles. Combined, these scenarios represent the diverse ways in which SOrCERODe can be leveraged to investigate the influence of erosion on profile- and watershed-scale C dynamics.
Land-Atmosphere C Fluxes With Relatively Low Erosion Rates in Two Contrasting Forests
In both forests at the lower erosion rate the summed, net effect of eroding and depositional profiles on system CO2 exchange was low in most scenarios compared to those same scenarios at higher erosion rates (contrast top vs. bottom sections of Tables 1, 3). This suggests that the low erosion rates typically observed on low to moderate hillslope gradients (Heimsath et al., 1997; Bacon et al., 2012) do not serve as large contributors to annual C fluxes. Indeed, summed erosional and depositional profile C fluxes after 100 y of erosion at the lower rate in both forests are a small fraction of estimated annual net primary productivity (NPP) for boreal (~0.19 kg C m−2 y−1) and temperate (~0.78 kg C m−2 y−1) forests (Schlesinger and Bernhardt, 2013).
The degree to which eroding vs. depositional soils governed whole-system C fluxes prompts important inferences about depositional profile dynamics in eroding landscapes. In both forests, lower erosion rates prompted depositional soils to comprise a greater fraction of whole-system C fluxes than eroding profiles, compared to higher erosion rates (compare top vs. bottom sections of Tables 1, 3). The larger influence of the depositional profile on whole-system C dynamics at the lower erosion rate was dependent on assumptions about how depositional profile SOC production and oxidation were modified by the arriving material as well as the amount of material arriving at the profile, and was not due to the simpler, lateral movement of already-fixed SOC across the landscape. Though multiple studies either hint or explicitly state that ecosystem C sinks can result from movement of fixed C from one pool to another, we emphasize that preservation of SOC, regardless of its position on the landscape, does not draw additional CO2 from the atmosphere (Billings and Schlesinger, 2015).
Land-Atmosphere C Fluxes in Two Forests Experiencing Contrasting Erosion Rates
Another relevant comparison across these forests is that of the higher erosion rate (1.0 mm y−1) in the warm temperate forest, and the low erosion rate (0.1 mm y−1) in the boreal forest. Comparing the values from these scenarios allows us to consider what two contrasting land use histories—one anthropogenically dominated with extremely high erosion rates for at least 100 y, the other far less so—may have meant for whole-system C fluxes. Perhaps the most salient feature of the higher erosion rate in the warm temperate forest is the strong, whole-system C sink it induced after 100 y. The annualized largest sink estimate of −17.99 kg C m−2 over 100 y in the warm temperate forest (i.e., −0.18 kg C m−2 y−1) equates to ~23% of annual temperate forest NPP (Schlesinger and Bernhardt, 2013). Though this flux was dominated by the sink strength of the eroding profile (bottom section, Table 3), model results also suggest that the eroding profile C sink was augmented by C uptake at the depositional profile (up to 20% of the whole-system flux). This enhancement of whole-system C flux by the depositional profile occurred even when SOC production at the depositional profile was minimized (bottom section Table 3).
In contrast, model results suggest that the same duration of erosion at a lower erosion rate in the boreal forest likely induced a small, whole-system C source to the atmosphere. Increasing the erosion rate in the boreal forest to an unrealistically high 1.0 mm y−1 was not sufficient to enhance potential C sink strengths there. The difference in these forests' behavior stems from contrasting estimated depth distributions of SOC reactivity (Richter et al., 1999; Ziegler et al., 2017). Specifically, estimates of relatively low SOC reactivity near the surface in the warm temperate forest (i.e., estimated MRT of ~1,700 y at 50 cm) translated to an eroding profile with low oxidation rates even as deeper soil became shallower upon erosion. This effect was far more muted at the boreal forest profile, where estimates of SOC reactivity were greater (Ziegler et al., 2017), and thus modeled SOC oxidation relatively greater, even at depth in this forest's shallow profiles.
Leveraging Watershed Characteristics to Upscale SOC Content and Assess Model Accuracy
Until now, our discussion of erosional and depositional profiles has assumed that each m2 of eroding area contributes to 1 m2 of depositional area. However, depositional settings typically represent a smaller fraction of watersheds than do eroding uplands (Anderson and Anderson, 2010). We leveraged estimates from the Calhoun CZO of the areal extent of upland and floodplain soil types in both forests to estimate how disproportionately large amounts of SOC deposited in depositional settings can modify watershed-scale C dynamics. At the higher erosion rate, accounting for a relatively large area of eroding profiles in the watersheds prompted net gains of modeled SOC in both forests when SOC production was maximized and SOC oxidation was minimized (Figure 6B). With a lower erosion rate, both forests experienced modest net losses of SOC to the atmosphere, even in the maximum sink scenarios (Figure 6A). These results differ from those model runs that assume each m2 of eroding soil contributes to each m2 of depositional soil; with those model runs, when the warm temperate forest experienced relatively slow erosion, it served as a small net C sink (Table 3, top part). Such discrepancies result from two factors: when the model accounts for the distribution of eroding vs. depositional profiles, it weights eroding profile C dynamics more heavily than those at the depositional profiles (here, by a factor of nine), and it allows depositional profiles to deepen to a greater extent.
We can assess the accuracy of modeling disproportionate deepening of depositional profiles and surficial SOC dynamics by employing well-characterized SOC depth distributions in Calhoun CZO depositional settings (Figure 7). Buried A horizons are evident via relatively high SOC at depths ranging from ~60 cm to ~175 cm in some depositional profiles (Figure 7A). Congruent with this, modeled depositional profiles hint that preservation of SOC promoted by deposition of 0.9 m of soil (9 mm y−1 for 100 y) extends through the top ~0.5 m of the original profile (i.e., from 0.9 to 1.4 m in Figure 7B). The muted preservation of modeled, buried SOC compared to some profiles' higher SOC content at depth suggests that SOrCERODe may underestimate SOC preservation in some settings. This is consistent with stronger CO2 source strengths and a dampening of CO2 sink strengths when we assume that eroding profiles represent 90% of a watershed (Figure 6) than when model runs are conducted on a m2-to-m2 basis (Table 3). Surficial SOC dynamics were also captured by SOrCERODe: while the most surficial modeled horizon in the strongest sink scenario (orange triangles, Figure 7B) reflects an over-estimation of SOC content in that layer, the strongest sink scenario is similar in shape and content to multiple observed profiles (Figure 7A). Thus, although SOrCERODe does not account for the variable nature of the Calhoun CZO's historic erosion (Trimble and Lund, 1982; Walter and Merritts, 2008; James, 2013) or heterogeneity in the fraction of watershed area contributing to each depositional profile, these congruencies highlight how SOrCERODe simulations can reflect partial preservation of deep SOC and faithfully mimic post-deposition SOC formation in surficial layers.
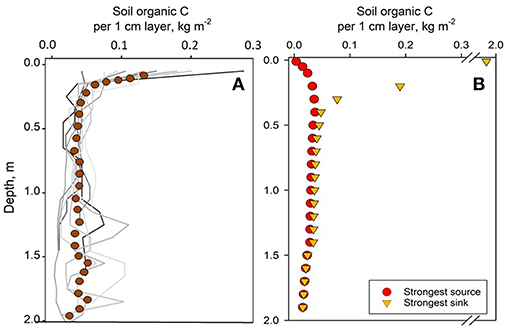
Figure 7. Observed (A) and modeled (B) depth distributions of soil organic C (SOC) at depositional settings in the Calhoun Critical Zone Observatory, a warm temperate forest in South Carolina, USA. Lines in (A) represent observations in 10 profiles along a stream channel that have received eroded SOC prior to and post-European settlement at rates varying from extremely low up to ~1 mm y−1; symbols in (A) represent a smoothed mean of all 10 profiles. Note evidence of buried, high-SOC content horizons (i.e., buried A horizons) in several observed profiles. Symbols in (B) represent model runs with contrasting assumptions about SOC production and oxidation in eroding and depositional profiles that result in varying magnitudes of land-atmosphere CO2 fluxes. In the strongest source scenario, SOC oxidation is maximized and SOC production is minimized at eroding and depositional sites. In the strongest sink scenario, the opposite phenomena are assumed. In (A,B), symbols represent SOC content in each 1 cm-thick layer; for clarity, not all 1 cm-thick layers are plotted. See text for model description and estimated influence of the described processes on land-atmosphere CO2 fluxes.
Conclusions
We investigate erosion-induced modifications to C inputs and losses in eroding and depositional profiles and associated watershed-scale C dynamics. We demonstrate how ecosystem C fluxes and storage are inextricably linked to landscape evolution on relatively short, centennial timescales. We also demonstrate the importance of eroded SOC retention in a terrestrial depositional setting vs. its escape via mineralization or transport to an aquatic system for estimating a watershed's C balance. Our work reveals four key points:
• The quantity of SOC moving across a landscape depends on the erosion rate and the degree to which SOC production and oxidation at the eroding profile is modified as deeper horizons become shallower. The amount of eroded material arriving at the depositional profile determines the degree to which depositional profile SOC production and oxidation are modified, illuminating the importance of cross-landscape linkages between upland and depositional environments in determining watershed-scale, biosphere-atmosphere C fluxes.
• Changes in SOC formation and oxidation in eroding profiles can result in strong C sink effects in erosional settings that increase with erosion rate in most scenarios. Some model simulations indicate a sink strength at eroding profiles equivalent to more than 40% of the original profile's SOC content in a warm temperate forest experiencing relatively high erosion over 100 y. In a boreal forest, modeled eroding site SOC sink scenarios generally were smaller, reflecting greater SOC mineralization reactivity in those profiles compared to the warm temperate forest.
• Legacy sediments can comprise a meaningful fraction of depositional soils in contemporary landscapes (Walter and Merritts, 2008; James, 2013) and autochthonous SOC additions to depositional profiles can be large relative to initial depositional stocks. However, the current study demonstrates how even large amounts of SOC experiencing cross-landscape transport may not promote a large net C sink in depositional profiles, particularly if oxidation of buried SOC is not sufficiently retarded.
• When we assumed that depositional profiles received a disproportionately large amount of eroded SOC, simulations of depositional profiles reflect modest preservation of buried SOC, congruent with observed profiles in depositional settings. SOrCERODe also faithfully mimicked observed SOC gains in surficial horizon of depositional profiles when the model was parameterized for a strong potential C sink scenario.
Combined, these results suggest that model scenarios representing increasing C sink strength with increasing erosion rates have merit, and that SOrCERODe represents a step toward process modeling of the influence of erosion and deposition on watershed C fluxes. We illuminate the importance of cross-landscape linkages between upland and depositional environments in determining watershed-scale biosphere-atmosphere C fluxes, and emphasize the need for quantifying time-varying depth distributions of SOC reactivity across evolving watersheds if we seek accurate projections of ecosystem C balances.
Author Contributions
SB built and implemented the model, interpreted results, wrote the first draft of the manuscript, and serves as point of contact for model dissemination. AW and DR provided soil organic C data for Figure 7A. DR, SZ, KP, and AW assisted with interpreting results and writing the manuscript.
Funding
NSF's grant EAR-1331846: funded modeling and empirical research conducted by SB, DR, and AW. Canada's NSERC Discovery and Strategic Project Grant #397494-10: funded SZ and KP's involvement.
Conflict of Interest Statement
The authors declare that the research was conducted in the absence of any commercial or financial relationships that could be construed as a potential conflict of interest.
Acknowledgments
We are grateful for engaging discussions with Daniel Markewitz and Darrell Harris, for Gil Ortiz's assistance with Figure 1, for the contributions of the two reviewers, and for funding from the NSF's grant EAR-1331846 and Canada's NSERC Discovery and Strategic Project Grant program (#397494-10).
References
Anderson, R. S., and Anderson, S. P. (2010). Geomorphology: The Mechanics and Chemistry of Landscapes. Cambridge: Cambridge University Press. doi: 10.1017/CBO9780511794827
Bacon, A. R., deB Richter, D., Bierman, P. R., and Rood, D. H. (2012). Coupling meteoric 10Be with pedogenic losses of 9Be to improve soil residence time estimates on an ancient North American interfluve. Geology 40, 847–850. doi: 10.1130/G33449.1
Berhe, A. A., Harden, J. W., Torn, M. S., and Harte, J. (2008). Linking soil organic matter dynamics and erosion-induced terrestrial carbon sequestration at different landform positions. J. Geophys. Res. 113:G04039. doi: 10.1029/2008JG000751
Berhe, A. A., Harte, J., Harden, J. W., and Torn, M. S. (2007). The significance of the erosion-induced terrestrial carbon sink. Bioscience 57, 337–346. doi: 10.1641/B570408
Berhe, A. A., and Kleber, M. (2013). Erosion, deposition, and the persistence of soil organic matter: mechanistic considerations and problems with terminology. Earth Surf. Proc. Landforms 38, 908–912. doi: 10.1002/esp.3408
Billings, S. A., Buddemeier, R. W., deB Richter, D., van Oost, K., and Bohling, G. (2010). A simple method for estimating the influence of eroding soil profiles on atmospheric CO2. Global Biogeochem. Cycles 24:GB2001. doi: 10.1029/2009GB003560
Billings, S. A., and Schlesinger, W. (2015). Letter to the editor on “pyrogenic organic matter production from wildfires: a missing sink in the global carbon cycle.” Glob. Chang. Biol. 28:2831. doi: 10.1111/gcb.12836
Chapin, F. S. III., Woodwell, G. M., Randerson, J. T., Rastetter, E. B., Lovett, G. M., Baldocchi, D. D., et al. (2006). Reconciling carbon-cycle concepts, terminology, and methods. Ecosystems 9, 1041–1050. doi: 10.1007/s10021-005-0105-7
Clark, K., Branch, L., Hierro, J., and Villarreal, D. (2016). Burrowing herbivores alter soil carbon and nitrogen dynamics in a semi-arid ecosystem, Argentina. Soil Biol. Biochem. 103, 253–261. doi: 10.1016/j.soilbio.2016.08.027
Dialynas, Y. G., Bastola, S., Bras, R. L., Marín-Spiotta, E., Silver, W. L., Arnone, E., et al. (2016). Impact of hydrologically driven hillslope erosion and landslide occurrence on soil organic carbon dynamics in tropical watersheds. Water Resour. Res. 52, 8895–8919. doi: 10.1002/2016WR018925
Doetterl, S., Berhe, A. A., Nadeu, E., Wang, Z., Sommer, M., and Fiener, P. (2016). Erosion, deposition and soil carbon: a review of process-level controls and experimental tools and models to address C cycling in dynamic landscapes. Earth Sci. Rev. 154, 102–122. doi: 10.1016/j.earscirev.2015.12.005
Doetterl, S., Cornelis, J. T., Six, J., Bodé, S., Opfergelt, S., Ooeckx, P., et al. (2015). Soil redistribution and weathering controlling the fate of geochemical and physical carbon stabilization mechanisms in soils of an eroding landscape. Biogeosciences 12, 1357–1371. doi: 10.5194/bg-12-1357-2015
Ebelman, J. J. (1845). Sur les produits de la decomposition des especes minerals de la famille des silicates. Annales Mines 7, 3–66.
Fontaine, S., Barot, S., Barre, P., Bdioui, N., Mary, B., and Rumpel, C. (2007). Stability of organic carbon in deep soil layers controlled by fresh carbon supply. Nature 450, 277–280. doi: 10.1038/nature06275
France, R., Culbert, H., and Peters, R. (1996). Decreased carbon and nutrient input to boreal lakes from particulate organic matter following riparian clear-cutting. Environ. Manage. 20, 579–583. doi: 10.1007/BF01474657
Golladay, S. W. (1997). Suspended particulate organic matter concentration and export in streams. J. North Am. Benthol. Soc. 16, 122–131. doi: 10.2307/1468245
Gregory, S. V., Swanson, F. J., McKee, W. A., and Cummins, K. W. (1991). An ecosystem perspective of riparian zones. Bioscience 41, 540–551. doi: 10.2307/1311607
Guillemette, F., von Wachenfeldt, E., Kothawala, D. N., Bastviken, D., and Tranvik, L. J (2017). Preferential sequestration of terrestrial organic matter in boreal lake sediments. J. Geophys. Res. 122, 863–874. doi: 10.1002/2016JG003735
Haff, P. K. (2010). Hillslopes, rivers, plows, and trucks: mass transport or Earth's surface by natural and technological processes. Earth Surf. Proc. Landforms 35, 1157–1166. doi: 10.1002/esp.1902
Harden, J. W., Sharpe, J. M., Parton, W. J., Ojima, D. S., Fries, T. L., Huntington, T. G., et al. (1999). Dynamic replacement and loss of soil carbon on eroding cropland. Global Biogeochem. Cycles 13, 885–901. doi: 10.1029/1999GB900061
Hedges, J. I., Ertel, J. R., and Leopold, E. S. (1982). Lignin geochemistry of a late quaternary sediment core from Lake Washington. Geochim. Cosmochim. Acta. 46, 1869–1877. doi: 10.1016/0016-7037(82)90125-9
Heimsath, A. M., Dietrich, W. E., Nishiizumi, K., and Finkel, R. C. (1997). The soil production function and landscape equilibrium. Nature 388, 358–361. doi: 10.1038/41056
Hook, R., Martin-Duque, J. F., and Pedraza, J. (2012). Land transformation by humans: a review. GSA Today 22, 4–10. doi: 10.1130/GSAT151A.1
Hu, Y., and Kuhn, N. J. (2014). Aggregates reduce transport distance of soil organic carbon: are our balances correct? Biogeosciences 11, 6209–6219. doi: 10.5194/bg-11-6209-2014
Jacinthe, P. A., and Lal, R. (2001). A mass balance approach to assess carbon dioxide evolution during erosional events. Land Degrad. Dev. 12, 329–339. doi: 10.1002/ldr.454
Jacinthe, P. A., Lal, R., and Kimble, J. M. (2002). Carbon dioxide evolution in runoff from simulated rainfall on long-term no-till and plowed soils in southwestern Ohio. Soil Tillage Res. 66, 23–33. doi: 10.1016/S0167-1987(02)00010-7
James, L. (2013). Legacy sediment: definitions and processes of episodically produced anthropogenic sediment. Anthropocene 2, 16–26. doi: 10.1016/j.ancene.2013.04.001
Köhler, S. J., Buffam, I., Seibert, J., Bishop, K. H., and Laudon, H. (2009). Dynamics of stream water TOC concentrations in a boreal headwater catchment: controlling factors and implications for climate scenarios. J. Hydrol. 374, 44–56. doi: 10.1016/j.jhydrol.2009.04.012
Kuhn, N. (2011). Connecting the cycles: impact of sediment, carbon and nutrient erosion on GHG emissions. Appl. Geochem. 26:S63. doi: 10.1016/j.apgeochem.2011.03.030
Lal, R. (1987). Effects of soil-erosion on crop productivity. Crit. Rev. Plant Sci. 5, 303–367. doi: 10.1080/07352688709382244
Lal, R. (1995). Erosion-crop productivity relationships for soils of Africa. Soil Sci. Soc. Am. J. 59, 661–667. doi: 10.2136/sssaj1995.03615995005900030004x
Lenka, N. K., Satapathy, K. K., Lal, R., Singh, N. A. K., Singh, P. K., Agrawal, P. C., et al. (2017). Weed strip management for minimizing soil erosion and enhancing productivity in the sloping lands of north-eastern India. Soil Tillage Res. 170, 104–113. doi: 10.1016/j.still.2017.03.012
Li, J., Ziegler, S., Lane, C. S., and Billings, S. A. (2011). Warming-enhanced preferential microbial mineralization of humified boreal forest soil organic matter: interpretation of soil profiles along a climate transect using laboratory incubations. J. Geophys. Res. 117:G02008. doi: 10.1029/2011JG001769
Liu, S., Bliss, N., Sundquist, E., and Huntington, T. G. (2003). Modeling carbon dynamics in vegetation and soil under the impact of soil erosion and deposition. Global Biogeochem. Cycles 17:1074. doi: 10.1029/2002GB002010
Marín-Spiotta, E., Chaopricha, N. T., Plante, A. F., Diefendorf, A. F., Mueller, C. W., Grandy, A. S., et al. (2014). Long-term stabilization of deep soil carbon by fire and burial during early holocene climate change. Nat. Geosci. 7, 428–432. doi: 10.1038/ngeo2169
Markewitz, D., and Richter, D. D. (1998). The bio in aluminum and silicon geochemistry. Biogeochemistry 42, 235–252.
Markewitz, D., Richter, D. D., Allen, H. L., and Urrego, J. B. (1998). Three decades of observed soil acidification in the calhoun experimental forest: has acid rain made a difference? Soil Sci. Soc. Am. J. 62, 1428–1439. doi: 10.2136/sssaj1998.03615995006200050040x
Matzner, E., and Borken, A. (2008). Do freeze-thaw events enhance C and N losses from soils of different ecosystems? a review. Eur. J. Soil Sci. 59, 274–284. doi: 10.1111/j.1365-2389.2007.00992.x
McCuaig, S. J. (2002). Quaternary Geology of the Alexis River Area, and the Blanc-Sablon To Mary's Harbour Road Corridor, Southern Labrador. Current Research. Newfoundland Department of Mines and Energy, Geological Survey Branch, Report, 1–20.
McKenney, R., Jacobson, R. B., and Wetheimer, R. C. (1995). Woody vegetation and channel morphogenesis in low-gradient, gravel-bed streams in the Ozark Plateaus, Missouri and Arkansas. Geomorphology 13, 175–198. doi: 10.1016/0169-555X(95)00034-3
Nadeu, E., Berhe, A. A., de Vente, J., and Boix-Fayos, C. (2012). Erosion, deposition and replacement of soil organic carbon in Mediterranean catchments: a geomorphological, isotopic and land use change approach. Biogeosciences 9, 1099–1111. doi: 10.5194/bg-9-1099-2012
Papanicolaou, A. N., Wacha, K. M., Abban, B. K., Wilson, C. G., Hatfield, J. L., Stanier, C. O., et al. (2015). From soilscapes to landscapes: a landscape-oriented approach to simulate soil organic carbon dynamics in intensively managed landscapes. J. Geophys. Res. 120, 2375–2401. doi: 10.1002/2015JG003078
Petit, N. E., Naiman, R. J., Warfe, D. M., Jardine, T. D., Douglas, M. M., Bunn, S. E., et al. (2017). Productivity and connectivity in tropical riverscapes of northern Australia: ecological insights for management. Ecosystems 20, 492–514. doi: 10.1007/s10021-016-0037-4
Quinton, J. N., Govers, G., van Oost, K., and Bardgett, R. D. (2010). The impact of agricultural soil erosion on biogeochemical cycling. Nature Geosci. 3, 311–314. doi: 10.1038/ngeo838
Richter, D. D., and Markewitz, D. (2001). Understanding Soil Change. New York, NY: Cambridge University Press.
Richter, D. D., Markewitz, D., Trumbore, S. E., and Wells, C. G. (1999). Rapid accumulation and turnover of soil carbon in a re-establishing forest. Nature 400, 56–58. doi: 10.1038/21867
Ricketts, M. J. (2001). Granular Aggregate Mapping in NTS Map Areas 1N/2, 1N/11, 110/14 and 110/15. Current Research, Newfoundland Department of Mines and Energy, Geological Survey, Report 200, 279–291.
Sanderman, J., Lohse, K. A., Baldock, J. A., and Amundson, R. (2009). Linking soils and streams: sources and chemistry of dissolved organic matter in a small coastal watershed. Water Resourc. Res. 45:W03418. doi: 10.1029/2008WR006977
Schlesinger, W. H., and Bernhardt, E. S. (2013). Biogeochemistry: An Analysis of Global Change. Cambridge, MA: Academic Press.
Sierra, C. A., Müller, M., Metzler, H., Manzoni, S., and Trumbore, S. E. (2017). The muddle of ages, turnover, transit, and residence times in the carbon cycle. Glob. Chang. Biol. 23, 1763–1773. doi: 10.1111/gcb.13556
Smith, S. V., Renwick, W. H., Buddemeier, R. W., and Crossland, C. J. (2001). Budgets of soil erosion and deposition for sediments and sedimentary organic carbon across the conterminous United States. Global Biogeochem. Cycles 15, 697–707. doi: 10.1029/2000GB001341
Stallard, R. F. (1998). Terrestrial sedimentation and the carbon cycle: coupling weathering and erosion to carbon burial. Global Biogeochem. Cycles 12, 231–257. doi: 10.1029/98GB00741
Syvitski, J. P., Vörösmarty, C. J., Kettner, A. J., and Green, P. (2005). Impact of humans on the flux of terrestrial sediment to the global coastal ocean. Science 308, 376–380. doi: 10.1126/science.1109454
Trimble, S., and Lund, S. (1982). Soil Conservation and the Reduction of Erosion and Sedimentation in the Coon Creek Basin. Washington, DC: Geological Survey Professional Paper. doi: 10.3133/pp1234
Trimble, S. W. (2008). Man-Induced Soil Erosion on the Southern Piedmont, 1700–1970. Ankeny, IA: Soil and Water Conservation Society.
Van Loo, M., Dusar, B., Verstraeten, G., Renssen, H., Notebaert, B., D'Haen, K., et al. (2017). Human induced soil erosion and the implications on crop yields in a small mountainous Mediterranean catchment (SW-Turkey). Catena 149, 491–504. doi: 10.1016/j.catena.2016.08.023
van Oost, K., Quine, T. A., Govers, G., De Gryze, S., Six, J., Harden, J. W., et al. (2007). The impact of agricultural soil erosion on the global carbon cycle. Science 318, 626–629. doi: 10.1126/science.1145724
van Oost, K., Verstraeten, G., Doetterl, S., Notebaert, B., Wiaux, F., Broothaerts, N., et al. (2012). Legacy of human-induced C erosion and burial on soil-atmosphere C exchange. Proc. Natl. Acad. Sci. U.S.A. 109, 19492–19497. doi: 10.1073/pnas.1211162109
Walter, R. C., and Merritts, D. J. (2008). Natural streams and the legacy of water-powered mills. Science 319, 299–304. doi: 10.1126/science.1151716
Wang, X., Cammeraat, E. L. H., Cerli, C., and Kalbitz, K. (2014). Soil aggregation and the stabilization of organic carbon as affected by erosion and deposition. Soil Biol. Biochem. 72, 55–65. doi: 10.1016/j.soilbio.2014.01.018
Wang, Z., Hoffmann, T., Six, J., Kaplan, J. O., Govers, G., Doetterl, S., et al. (2017). Human-induced erosion has offset one-third of carbon emissions from land cover change. Nat. Clim. Chang. 7, 345–349. doi: 10.1038/nclimate3263
Wilkinson, B. H., and McElroy, B. J. (2007). The impact of humans on continental erosion and sedimentation. GSA Bulletin 119, 140–156. doi: 10.1130/B25899.1
Wilson, C. G., Papanicolaou, A. N., and Denn, K. D. (2012). Partitioning fine sediment loads in a headwater system with intensive agriculture. J. Soils Sed. 12, 966–981. doi: 10.1007/s11368-012-0504-2
Keywords: erosion, deposition, hillslope, floodplain soils, carbon fluxes, soil organic carbon, dynamic replacement, terrestrial carbon sink
Citation: Billings SA, Richter DdB, Ziegler SE, Prestegaard K and Wade AM (2019) Distinct Contributions of Eroding and Depositional Profiles to Land-Atmosphere CO2 Exchange in Two Contrasting Forests. Front. Earth Sci. 7:36. doi: 10.3389/feart.2019.00036
Received: 29 June 2018; Accepted: 14 February 2019;
Published: 13 March 2019.
Edited by:
Ashlee Dere, University of Nebraska Omaha, United StatesReviewed by:
Ronny Lauerwald, Free University of Brussels, BelgiumGary E. Stinchcomb, Murray State University, United States
Copyright © 2019 Billings, Richter, Ziegler, Prestegaard and Wade. This is an open-access article distributed under the terms of the Creative Commons Attribution License (CC BY). The use, distribution or reproduction in other forums is permitted, provided the original author(s) and the copyright owner(s) are credited and that the original publication in this journal is cited, in accordance with accepted academic practice. No use, distribution or reproduction is permitted which does not comply with these terms.
*Correspondence: Sharon A. Billings, c2hhcm9uLmJpbGxpbmdzQGt1LmVkdQ==