 Scott W. Bailey
 Kevin J. McGuire
 Donald S. Ross
 Mark B. Green4
 Olivia L. Fraser
- 1Northern Research Station, United States Department of Agriculture Forest Service, North Woodstock, NH, United States
- 2Department of Forest Resources and Environmental Conservation, Virginia Water Resources Research Center, Virginia Tech, Blacksburg, VA, United States
- 3Department of Plant and Soil Science, University of Vermont, Burlington, VT, United States
- 4Northern Research Station, United States Department of Agriculture Forest Service, Center for the Environment, Plymouth State University, Plymouth, NH, United States
- 5Department of Natural Resources and the Environment, University of New Hampshire, Durham, NH, United States
Headwater streams in the White Mountains, NH, United States have been shown to have downstream gradients of increasing pH and concentrations of base cations coupled with decreasing concentrations of aluminum. A two-stage acid neutralization model involving shallow soil exchange processes in headwaters coupled with deeper mineral weathering downstream had been proposed to explain these gradients. We conducted synoptic sampling of three headwater catchments in this region that showed variations in this longitudinal pattern, ranging from streams that remain acidic throughout their length to streams with circumneutral pH beginning at their source. To explain these differences, we mapped soils using a hydropedologic approach that emphasizes the influence of groundwater saturation frequency and water table regime on soil formation processes. Stream segments with lower pH and base cation concentrations, coupled with higher concentrations of dissolved organic carbon (DOC), aluminum, and in one case iron, were in subcatchments mapped with shallow to bedrock soils where eluvial soil forming processes dominated. In contrast, stream segments with higher pH and base cation concentrations coupled with low concentrations of DOC and aluminum were associated with subcatchments with deeper soils where illuvial processes were more dominant. Concentrations of sodium and silicon were relatively uniform across these gradients. Coupled with the higher concentrations of dissolved aluminum and small pools of exchangeable aluminum in the areas of bedrock outcrops and shallow soils, these data suggest that primary mineral dissolution is an important process influencing upper stream reaches, not just along longer, deeper flowpaths in downslope areas. In contrast, some stream reaches with obvious groundwater springs show a more abrupt transition in pH and base cation concentrations higher along the stream, suggesting that neutralization along deeper flowpaths may play a role in upslope areas as well. These data suggest a new three stage model of stream chemistry evolution. First, organic acids are introduced by frequent flushing of organic soils on shallow bedrock along ridge areas. Second, upper acidic reaches are controlled by mineral dissolution coupled with eluvial soil development. Third, downstream reaches are influenced by illuviation as organometallic complexes precipitate in spodic soil horizons, removing organic acids, and acid-mobile metals from drainage waters. This new model highlights differences in critical zone evolution along hillslopes in glaciated catchments with implications for understanding gradients in water quality, soil fertility, and response and recovery from disturbances.
Introduction
Surface water chemistry in forested catchments is highly regulated by the ecosystem/critical zone of the catchment, with concentrations of major solutes typically varying temporally by a factor or two or three while streamflow varies by five or more orders of magnitude (Likens et al., 1977; Godsey et al., 2009; Kim et al., 2017). Despite this tight temporal control of surface water chemistry (i.e., chemostatic behavior), much spatial variability in stream chemistry is commonly observed, as seen in longitudinal or synoptic stream sampling studies (Johnson et al., 1981; Bailey et al., 1987; Likens and Buso, 2006), with spatial chemical patterns stable over a broad range of catchment wetness or flow conditions (Zimmer et al., 2013; Abbott et al., 2018). The mechanisms by which catchments regulate surface water quality are important to understand in order to inform management of forests for reliable delivery of high quality water, of particular concern in the United States where approximately 50–70% of public water supplies, including nearly all larger municipal supplies in the Northeastern United States, are derived from surface waters flowing from forested lands (Brown et al., 2008; Barnes et al., 2009).
Variation in metal cations and overall acidity, reflected in pH, are commonly controlled by catchment scale processes and may reflect overall structure of the critical zone. Various studies have examined controls on spatial water quality patterns (e.g., Phillips and Stewart, 1990; Ross et al., 1994; Fitzhugh et al., 1999; Palmer et al., 2005; Ågren et al., 2014; Herndon et al., 2015a,b; Peralta-Tapia et al., 2015; Kim et al., 2017) and have interpreted controls from various properties such as stream connectivity with hillslopes, depth of flowpaths, amount of groundwater inputs, and depth and location of organic soils, particularly in riparian areas. While all of these explanations involve properties of soils or deeper portions of the critical zone, none of these studies included a coupled investigation of spatial variation in stream chemistry with a complete catchment-scale analysis of soil development processes.
At the Hubbard Brook Experimental Forest (HBEF), in central New Hampshire, United States, Johnson et al. (1981) studied longitudinal variation in the chemistry of Falls Brook, a second order tributary of Hubbard Brook and proposed a two stage acid neutralization model that explained the dominant longitudinal chemical gradient. In the headwaters, mineral acidity derived from atmospheric precipitation was partially replaced by aluminum (Al), which they interpreted as a soil cation exchange process. Further downstream, acidity from both hydrogen ion (H) and dissolved Al decreased, balanced by increasing concentrations of base cations (especially Ca, Mg, Na) interpreted to have been supplied by mineral dissolution reactions along longer hydrologic flowpaths. A follow up study of all of the ∼15 tributaries of Hubbard Brook by Likens and Buso (2006) found similar longitudinal patterns with gradients of pH (Figure 1) as well as total monomeric (Alm) and base cations along most of the tributaries. However, a smaller number of tributaries remained acidic all the way to their mouth at the main stem of Hubbard Brook while a few other tributaries had circumneutral pH and higher concentrations of base cations from source to mouth. Little advancement of the conceptual model proposed by Johnson et al. (1981) has been offered by subsequent studies and an explanation for the contrasting longitudinal gradients shown by several of the streams has not been addressed.
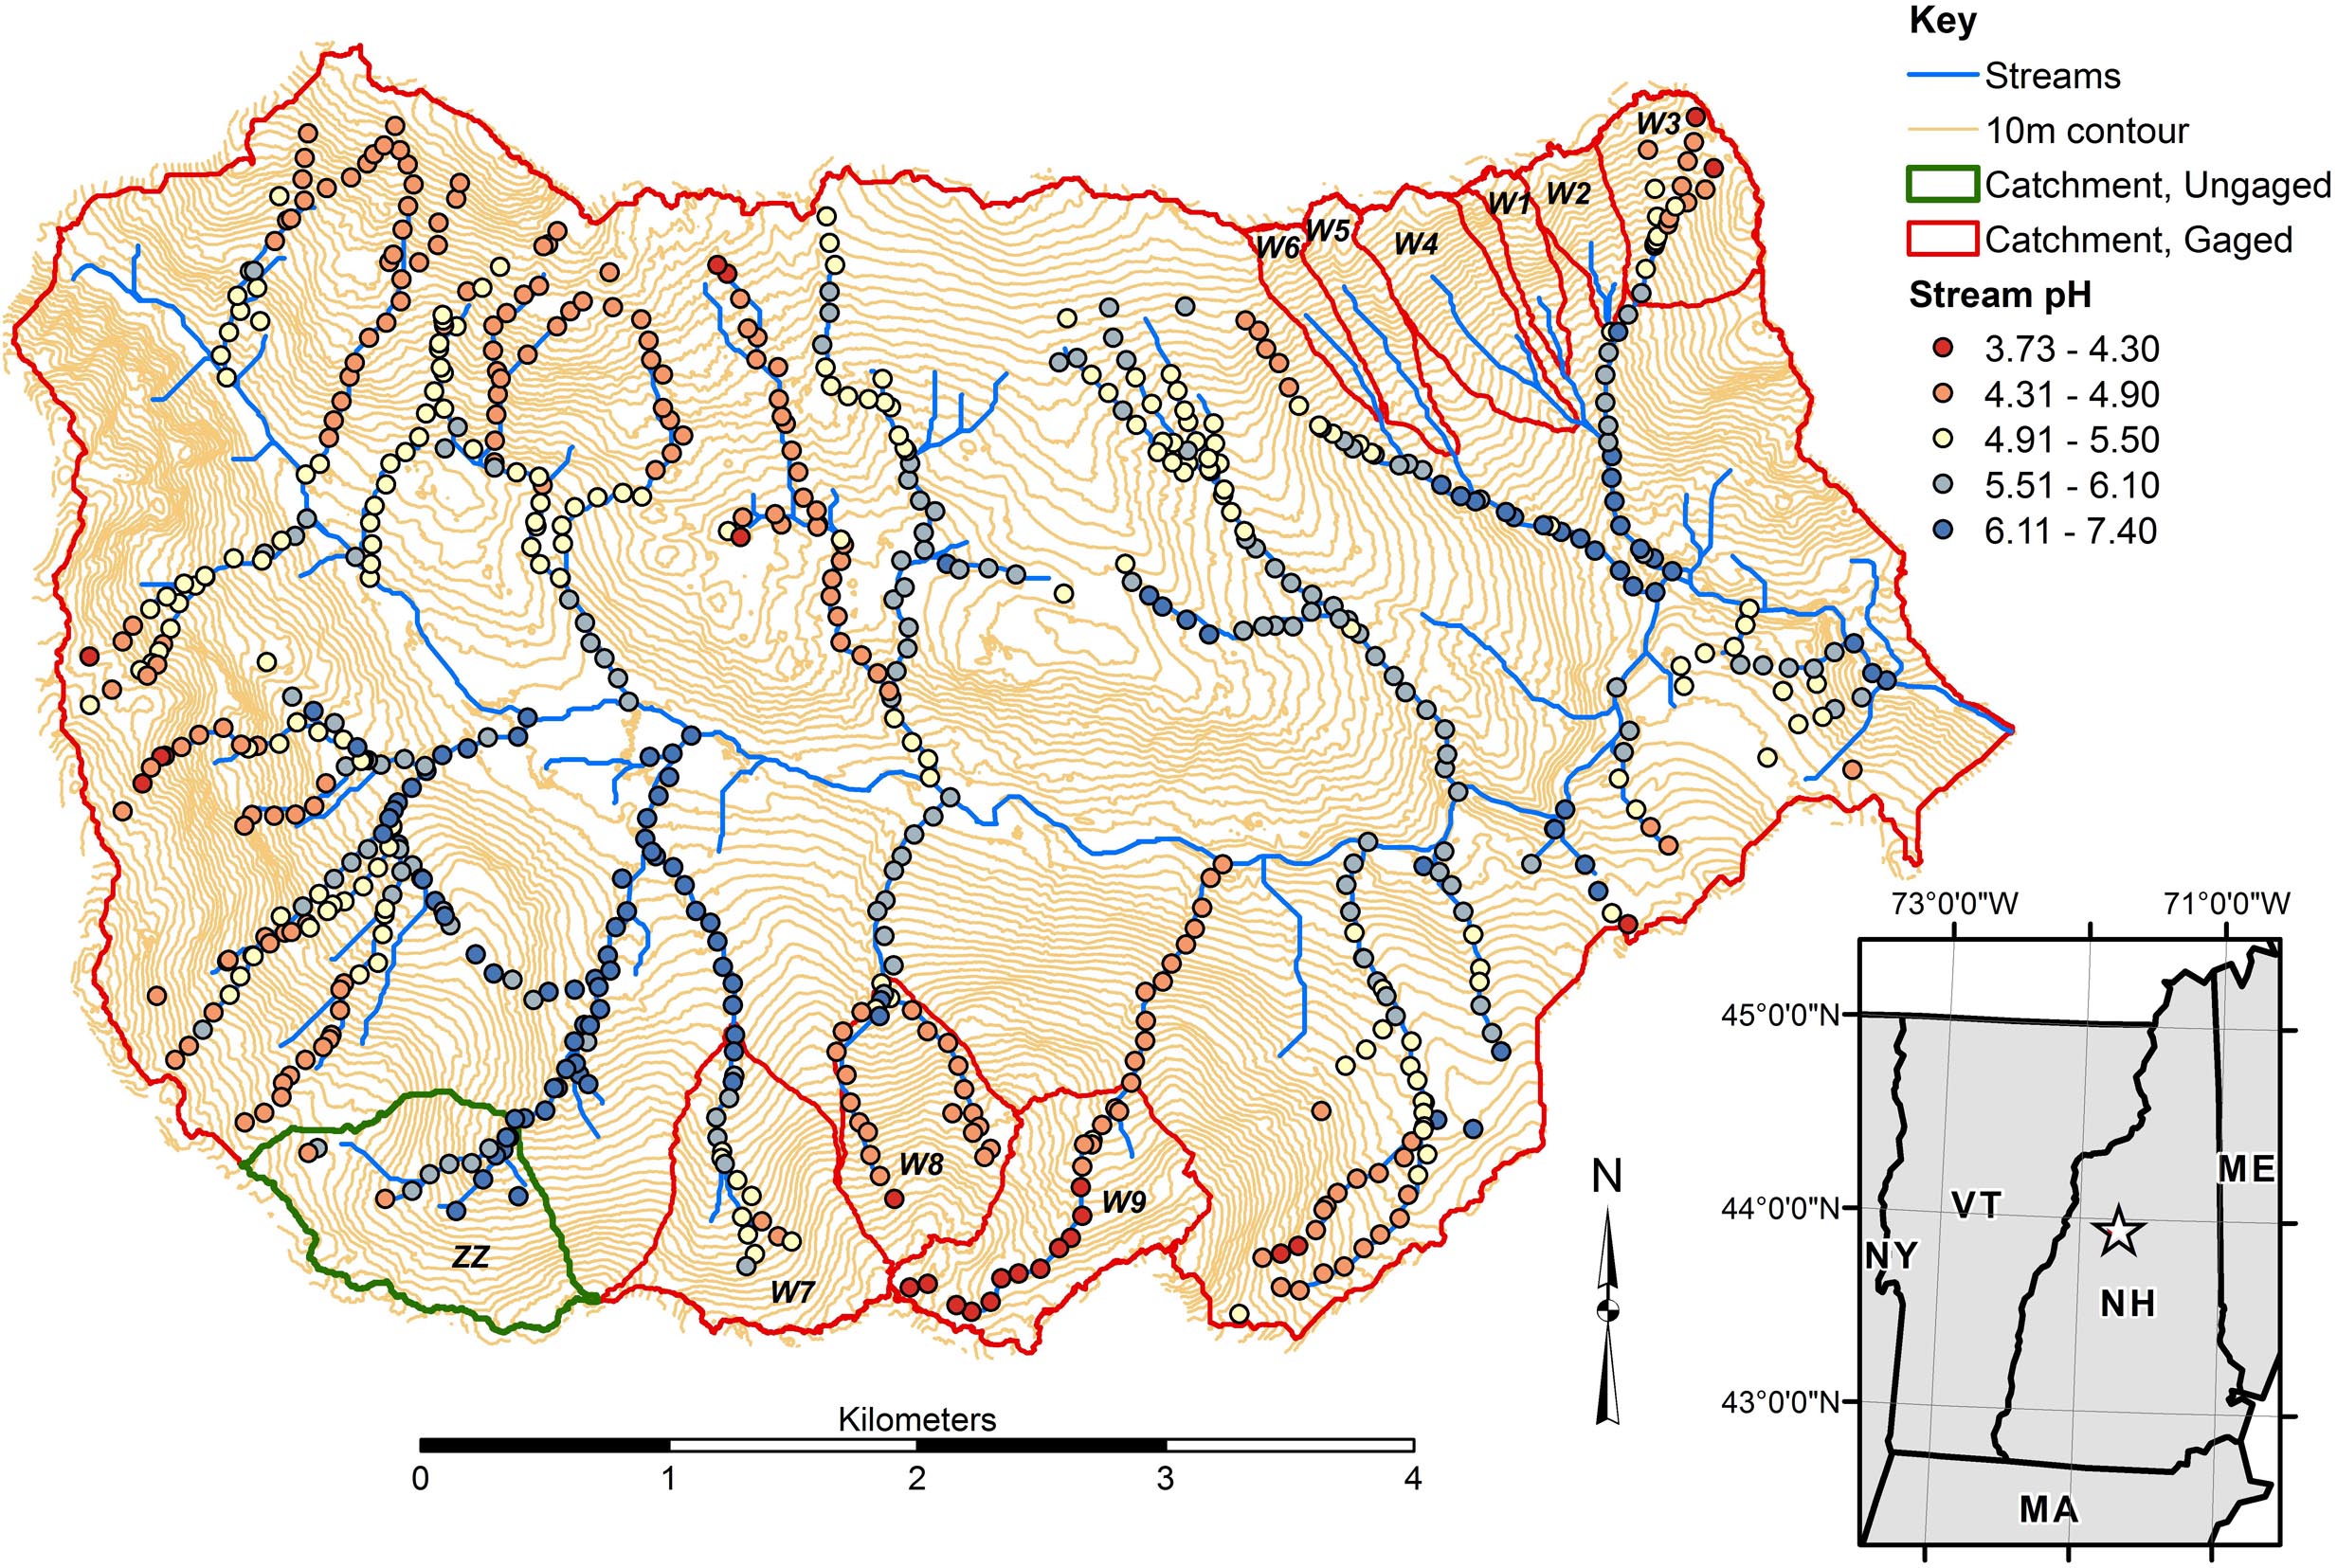
Figure 1. Locus map and variation in surface water pH across the tributaries of Hubbard Brook. pH data are from Likens and Buso (2006), further described statistically by McGuire et al. (2014). Catchments considered in the present study include Zig Zag (ZZ) and Watershed 9 (W9) along the southern edge of the Hubbard Brook catchment and Watershed 3 (W3) at the northeastern edge.
While the Hubbard Brook tributary catchments are generally similar with respect to geologic substrate, soils, vegetation, and disturbance history (Likens et al., 1977), Bailey et al. (2014) showed strong hillslope-scale gradients in soil development that reflect variation in frequency and depth of groundwater incursions into the soil zone. Soils at HBEF are dominantly Spodosols, a common soil type in cool humid forested regions (Sauer et al., 2007) where primary mineral weathering and leaching and precipitation of Al and Fe complexed by organic acids are dominant soil forming processes. A hydropedologic soil classification (Gannon et al., 2014; Table 1), based on relationships between soil morphology and groundwater regime observed at the soil profile- and catena-scale distinguishes between soils formed primarily by vertical leaching processes, above the influence of the water table, and laterally formed soils that reflect groundwater influence on soil development and lateral translocations between profiles at the hillslope scale (Bourgault et al., 2017; Gannon et al., 2017). Thus soil development patterns may be used to understand processes occurring along hydrologic flowpaths.
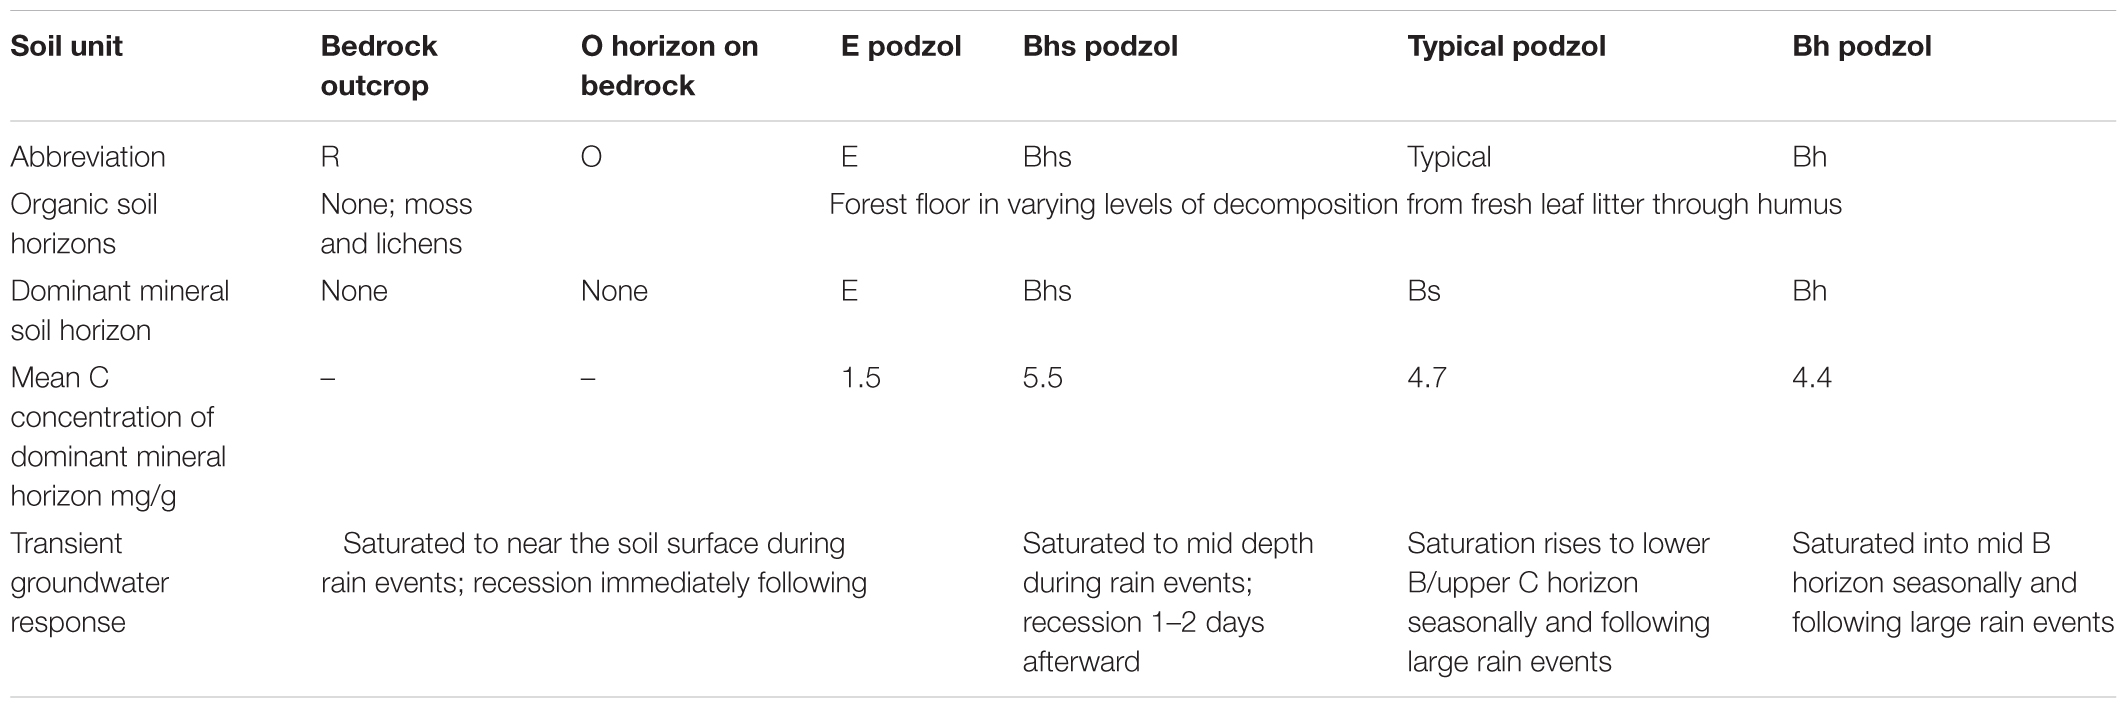
Table 1. Summary of functional soil units showing the dominant horizons, carbon concentration, and general groundwater response in each.
On portions of the hillslope where groundwater remains deeper in the subsoil, vertical leaching leads to a common horizon sequence (hence called a typical podzol), consisting of a thin E horizon at the top of the mineral soil, leached of organic matter, Al, and Fe. This overlies a zone of deposition showing a vertical gradient of illuviation, i.e., accumulated soil organic matter (SOM) composed of secondary Al and Fe organic complexes (i.e., spodic B horizons). In contrast to better drained profiles that show a gradient in the eluvial to illuvial development at the point scale, soil profiles influenced by lateral flow of shallow groundwater tend to have exaggerated thickness of one type of mineral horizon, displaying one dominant portion of the podzolization process, either eluvial or illuvial, depending on what portion of a hillslope they occur and the water table saturation frequency. Thus, an E podzol is dominated by a thick mineral layer leached of organic matter, Al, and Fe and may have no B horizon in the same profile while shortly downslope, a Bhs podzol may have little or no E horizon, instead primarily expressing a thick Bhs horizon high in SOM complexed with Al, and Fe (Bourgault et al., 2017). These functionally defined soil types occur in distinct portions of the catchment and their distribution is largely predictable by topographic analysis via a high resolution LiDAR derived terrain model (Gillin et al., 2015). Furthermore, initial sampling of groundwater wells used to characterize variation in water table fluctuations showed distinctions in the solute composition of groundwater among soil types (Zimmer et al., 2013), suggesting that varying contributions of groundwater from contrasting soils may explain spatial patterns seen in surface water chemistry.
The purpose of this study was to investigate the possibility that differences in the spatial dynamics of soil formation processes within and between catchments could explain longitudinal patterns in stream solute concentrations. We chose three catchments to study based on contrasting longitudinal stream chemistry gradients. We compiled groundwater data from previous studies at the site to evaluate differences in groundwater quality between soil types and extended the soil distribution model of Gillin et al. (2015) from Watershed3 (W3), where it was developed, to our other study catchments. Together with a detailed synoptic stream chemistry survey, these data allowed us to evaluate the hypothesis that differences in soil distribution, and resulting groundwater inputs to streams, explain chemical gradients in stream chemistry within and between catchments.
Materials and Methods
Study Site
Hubbard Brook Experimental Forest is located in west-central New Hampshire, United States (43° 56′N, 71° 45′W; Figure 1) within the White Mountain National Forest. The climate is humid continental with a mean annual precipitation of 140 cm and stream runoff of 90 cm (Bailey A.S. et al., 2003). Much of the research is centered on nine headwater catchments located in the northern (W1–6) and southern (W7–9) portions of the experimental forest (Figure 1) where water and solute input and output is measured at a series of meteorological and stream gauging stations. This study focuses on catchments W3, and Watershed 9 (W9), which are maintained in a natural, unmanaged condition and serve as reference catchments, and the ungauged upper west branch of Zig Zag Brook (ZZ), a similar headwater catchment that is not gauged but maintained in a natural, unmanaged condition (Figure 1).
Land cover at HBEF is forest with northern hardwoods dominated by Acer saccharum Marsh. (sugar maple), Betula alleghaniensis Britt. (yellow birch), and Fagus grandifolia Ehrh. (American beech) on deeper and better drained soils; mixed conifers dominated by Picea rubens Sarg. (red spruce), Abies balsamea (L.) Mill. (balsam fir), and Betula papyrifera var. cordifolia (Regel) Fern. (mountain paper birch) occupy wetter sites and areas where soils are shallow to bedrock. Forests on the reference catchments are mature, mostly second growth following partial cutting in the period of 1890–1920, and partial blowdown during a hurricane in 1938. The study catchments have had no direct human disturbance or management since partial harvesting, which ended in the 1910s.
Bedrock in the portions of HBEF considered in this study is the Silurian Rangeley Formation, a sillimanite-grade metapelite consisting of mica schist with minor amounts of calc-silicate granulite (Burton et al., 2000). Bedrock is poorly exposed, outcropping mostly along ridges and in some stream channels, and is covered by a veneer of late Wisconsinan glacial drift. In the study watersheds, drift is thin and interspersed with exposed bedrock in the uppermost portion of the catchments, particularly along catchment divides while it is variable and up to 10 m thick in central to lower portions of the catchments. Catchment W9 is distinct in having much more bedrock outcrops while the remainder of the catchment is underlain by thin drift, with bedrock less than 1 m deep.
Glacial drift is dominated by granitic lithologies, transported from the north and west of the study catchments, with lesser contributions from local bedrock (Bailey S.W. et al., 2003), and is the parent material for soil development. Based on review of published bedrock mineralogy, till lithologic sources, and direct microprobe analyses of soil minerals (Hyman et al., 1998; Bailey S.W. et al., 2003), plagioclase feldspar is of composition oligoclase (Ca0.2Na0.8Al1.2Si2.8O8) and a dominant source of calcium (Ca) and sodium (Na), as well as the most easily weathered source of aluminum (Al) and silicon (Si). Other relatively reactive minerals include minor amounts of biotite and hornblende and trace amounts of apatite. Bailey (2019a) showed that oligoclase is the major supply of Ca, Na, Al, and Si in mineral dissolution while biotite and hornblende are likely the major sources of dissolved Fe (Hyman et al., 1998; Bailey S.W. et al., 2003).
Where not confined by shallow bedrock, soils average 0.7 m to the top of the C-horizon, corresponding to the depth of major alteration of glacial drift by soil forming processes, as well as the limit of the rooting zone (Bailey et al., 2014). Podzolization is a dominant soil forming process, with organic acids leaching iron (Fe) and Al from surficial mineral soil layers (eluviation) and depositing them as organic Fe and Al complexes in lower mineral soil layers (illuviation). Soil profiles vary in their expression of eluvial horizons, i.e., mineral soil low in organic matter and extractable metals, where leaching processes dominate, and illuvial horizons, with mineral surfaces coated by amorphous organometallic complexes, where precipitation processes dominate (Bourgault et al., 2015; Table 1). Presence and thickness of eluvial and illuvial horizons depends on thickness of the soil parent material, subsurface drainage limitations, and upslope drainage area (Bailey et al., 2014; Bourgault et al., 2017).
Water Sampling and Analysis
Based on the variations in longitudinal stream chemical gradients seen by Likens and Buso (2006), we chose to investigate W3, the headwaters of Paradise Brook, as an example of a catchment with the longitudinal acid neutralization gradient described by Johnson et al. (1981). We chose W9, the headwaters of Cascade Brook, as an example of a more uniformly acidic catchment (Wellington and Driscoll, 2004), and ZZ, an ungauged catchment in the upper west branch of Zig Zag Brook, as an example of a more uniformly circumneutral catchment (Palmer et al., 2005). A synoptic surface water sampling campaign was conducted in W3 and W9 on July 22, 2015; the west branch of Zig Zag Brook was sampled the following day on July 23, 2015. Catchment conditions during the survey were relatively wet as a large rain event centered on July 19, 2015 left 117 and 109 mm of precipitation on W3 and W9, respectively. On the sampling date, daily streamflow was 2.43 and 1.78 mm (or daily flow exceedance 24 and 28%) for W3 and W9, respectively. As the streams were in recession from high flow earlier in the week, most of the intermittent portions of the stream network were actively flowing, allowing a relatively complete sampling of the channel network. We resampled sites in W3 established by Zimmer et al. (2013), at about half the sampling density of that earlier study, or about one sample site per 100 m of stream length. New sampling sites at a similar density were established in W9 and ZZ, with sites chosen to fall just above junctions or at breaks in channel slope or substrate type. Zimmer et al. (2013) showed that stream chemistry was relatively persistent spatially in W3 across flow exceedance probabilities from 0.2 to 87%.
Sampling sites were classified as stream sites if they were on a channel with obvious signs of sustained fluvial activity. A smaller number of sites were designated as seeps and are interpreted to be point discharge sites where groundwater returns to the surface. These included sites that were close to but not directly on the stream network, or channel heads where low water temperature or anomalously well-developed channels with perennial flow at first flowing water suggested the importance of a groundwater spring.
Grab samples of surface water were collected in 0.5 L bottles and brought to the HBEF field laboratory for processing within an hour or two of collection. For this study, we focused on pH as a general indicator of acidity, dissolved organic carbon (DOC), Al, and Fe, as indicators of the podzolization process, and Na and Si as indicators of primary mineral dissolution (Bailey, 2019a). Fresh untreated samples were analyzed for pH. Subsamples were filtered through an ashed 0.45 μm glass microfiber filter and frozen for later analysis for DOC, refrigerated untreated for later analysis of Alm, or acidified to pH 2 with nitric acid for later analysis of cations. pH was measured potentiometrically with a Thermo Scientific Orion 3-Star pH meter at HBEF. All other analyses were performed at the United States Department of Agriculture Forest Service, Forestry Sciences Laboratory, Durham, NH, United States. Dissolved metals, including Ca, Fe, Na, and Si were analyzed on a Varian Vista axial inductively coupled plasma spectrometer. Total monomeric Al (Alm) was measured on a Lachat automated flow cell with the pyrocatechol violet technique. DOC was measured on a Shimadzu TOC-5000A. Other major solutes were measured but not reported here; complete analyses are available at Bailey et al. (2019).
Groundwater samples were collected across W3 from a suite of wells installed during 2008–2012 by Detty and McGuire (2010); Zimmer et al. (2013); and Gannon et al. (2014). Each well was constructed of SDR 21 PVC pipe (3.18 cm outer diameter) with a 31 cm screen length consisting of 0.025 cm width lateral slots with 0.32 cm spacing between slots. The wells were installed so the base of the screen was in the upper C horizon, between 40 and 100 cm deep. Wells were stratified into soil groups based on description of a nearby soil sampling pit or based on soil morphology observed during well installation. A battery-operated peristaltic pump was used to purge the wells of a minimum of two well volumes followed by collection of water samples for chemical analyses.
For the shallowest soils considered, consisting of a thin forest floor (O horizon) overlying shallow bedrock, construction of and sampling a well was not feasible. In this case, we cut a short section of a 10 cm diameter PVC pipe longitudinally in half and inserting it, concave side up, at the O horizon-bedrock interface. A cap at the downslope end of the half pipe was fitted with a tygon tube that ran down to a 0.5 L HDPE collection bottle. The collection bottle was installed when a rainfall event to be sampled was forecast and retrieved immediately at the end of the rain event. Groundwater samples were analyzed for the same parameters and with the same methods as surface water samples.
Soil Mapping and Analysis
A soil map for W3 was produced by Gillin et al. (2015) and modified for the current study following a similar approach as described by Gillin et al. (2015). This map was made by using an ordination of soil morphology and topographic metrics derived from LiDAR analysis to identify metrics predictive of the various soil units (Table 1). Three soil units, bedrock outcrops (R), O horizon on bedrock (O), and E podzols (E), intermingle in bedrock-controlled portions of the catchment and were mapped as a complex of the three (R–O–E). A multinomial logistic regression was used to determine the probability of the presence of each soil unit at each grid cell in a 5 m raster. In 99% of the cells, one soil unit was predicted to have a greater than 50% probability of occurrence. The most probable soil present was assigned to each grid cell. This model had a 70% success rate in correctly classifying fifty soil profiles withheld from the analysis for validation (Gillin et al., 2015).
The map for W3 was updated for the present study by refining the procedure used to map bedrock outcrops and shallow soils. Field verification combined with visual interpretation of 1-m LiDAR derived hillshades illuminated from three different angles were used to update and delineate bedrock-controlled portions of the catchments. This procedure for bedrock outcrop delineation was used with model coefficients derived from the logistic regression analysis in W3 to predict soil distribution across W9 and ZZ. Over 75% of soil profile descriptions collected in W9 and ZZ, none of which were used in model development, were properly classified by the predictive soil map (Bailey, 2019b). The proportion of soil functional units R–O–E, Bhs podzol (Bhs), typical podzol (Typical), and Bh podzol (Bh) were calculated for each catchment. The watershed tool from SAGA GIS (Conrad et al., 2015) was used to delineate subcatchments draining to each stream sampling point and then queried to determine the proportion of the four soil map units in each subcatchment. Subcatchments for seep sampling sites were not calculated as many of them did not lie directly along drainage ways and the GIS delineation failed. The perennial nature of the seeps, particularly at upper slope positions, suggests that their sources were not confined to topographically defined drainage areas.
Soil profiles were described and sampled by genetic horizon by Bailey et al. (2014) and Bourgault et al. (2017) in W3 to characterize the hydropedologically defined soil units. In the present study, the presence of the same soil units, and a prediction of their distribution via the model of Gillin et al. (2015) was confirmed by profile description and sampling in W9 (n = 20 soil profiles) and ZZ (n = 18 soil profiles; Bailey (2019b). Samples from previous studies in W3 were used to estimate salt extractable Al pools by soil type. Samples were air-dried, sieved through a 2 mm screen and subsampled for analysis. Total carbon content was analyzed by combustion. Extractable Al was measured in a 1 M solution of ammonium acetate buffered to pH 4.8. Similar to the water samples, soil analyses were made at the USFS laboratory in Durham, NH, United States. Exchangeable Al concentrations multiplied by horizon thickness and bulk density estimated by carbon content (Federer et al., 1993), and summed for each soil profile to obtain estimates of exchangeable Al pools on a per unit landscape area basis.
Results
Synoptic Stream Survey
Stream chemical gradients in the three catchments were similar to those reported by Likens and Buso (2006) although we sampled the intermittent portions of the upper stream network more thoroughly and thus found a truncated gradient in stream acidity in the upper reaches of ZZ not seen by the earlier survey (Figures 1, 2). W3 tributaries generally showed the strongest longitudinal gradient in pH, with stream heads starting at a pH in the mid fours and increasing to 5.8 at the catchment outlet. W9 tributaries remained quite acidic throughout their reaches, starting with pH in the range of 3.8–4.2 and increasing to 4.5 at the outlet. ZZ had the highest pH at its outlet, at a value of 6.3, with pH in the upper fives and sixes in much of the network. However, we did find acidic reaches in the uppermost intermittent portions of the network in ZZ, with the lowest pH recorded in the study of 3.79.
Several groundwater seeps were sampled in each catchment, and distinguished from regular stream sampling sites as being springs outside of the channel area, or channel sites with lower water temperature than stream sites and/or with channels with anomalously perennial conditions at or near channel heads. In W3, the seeps span the elevational range of the stream network and appear in a near-linear pattern in the central part of the catchment, subparallel to the central stream tributary (Figure 2). W3 seeps had pH in the sixes including one seep with a pH of 6.70, the highest pH measured in the study. W9 only had three sites identified as seeps, all in the lower eastern part of the catchment (Figure 2). All had pH in the mid to upper fives, higher than any of the stream sites in the catchment. ZZ had five sites classified as seeps. All occurred at mid to upper portions of tributary streams and had pH values in the sixes.
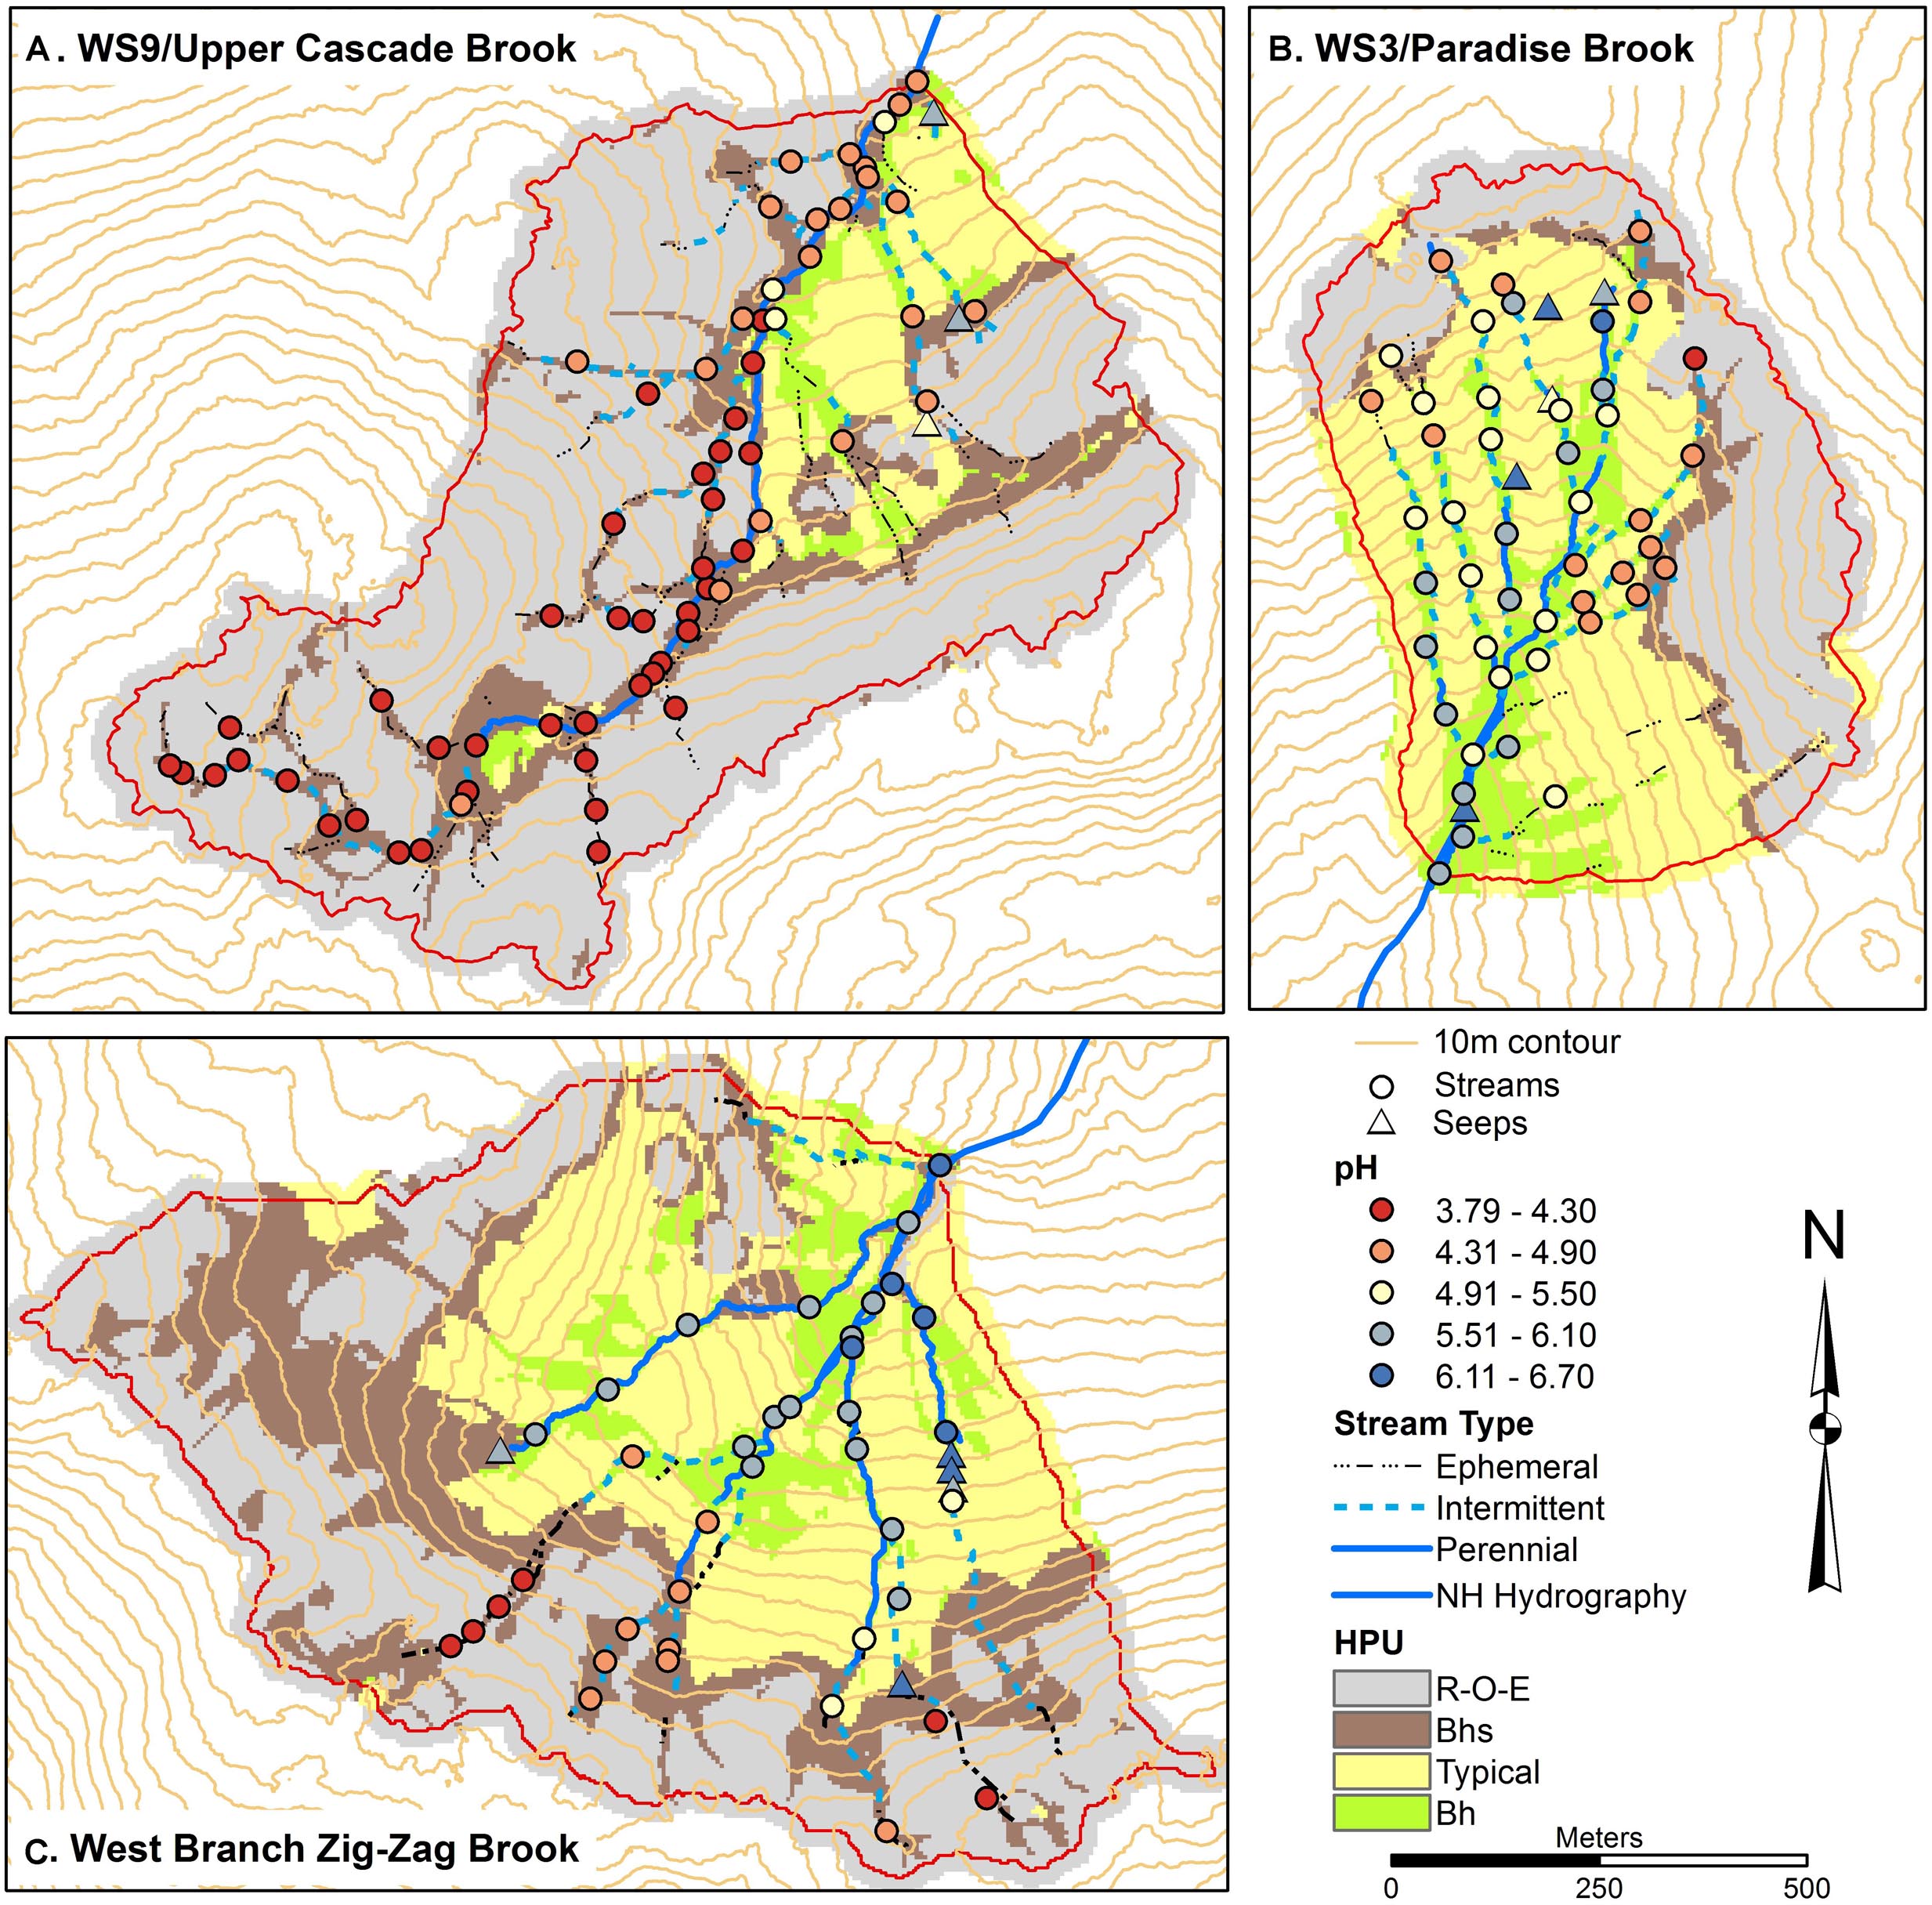
Figure 2. Soils maps for W9 (A), W3 (B), and West Branch Zig Zag Brook (C) with variation in surface water pH from a synoptic survey conducted July 22–23, 2015. Surface water samples were classified as streams (circles) or seeps (triangles). Soil units include bedrock outcrops, bedrock Histosols, and E podzols (R–O–E), Bhs podzols (Bhs), typical podzols (Typical), and Bh podzols (Bh).
Spatial patterns of DOC, Al, and Fe (Figures 3–5) were examined as complexation, leaching, and subsequent deposition of Al and Fe organometallic complexes are predominant soil forming processes in Spodosols. DOC concentrations were mostly low in W3, between 80 and 500 μM, with several locations in the upper part of the network, particularly on the eastside showing higher concentrations up to 1200 μM. In contrast, the lowest concentrations in streams in W9 were in the range of 400–500 μM, with most sites >2500 μM and a peak of 4000 μM at one station. ZZ DOC concentrations were more similar to those seen in W3, typically less than 500 μM while the upper portions of most of the tributaries had concentrations up to 2400 μM. In all three catchments, seeps had low DOC concentrations, <500 μM (Figure 3).
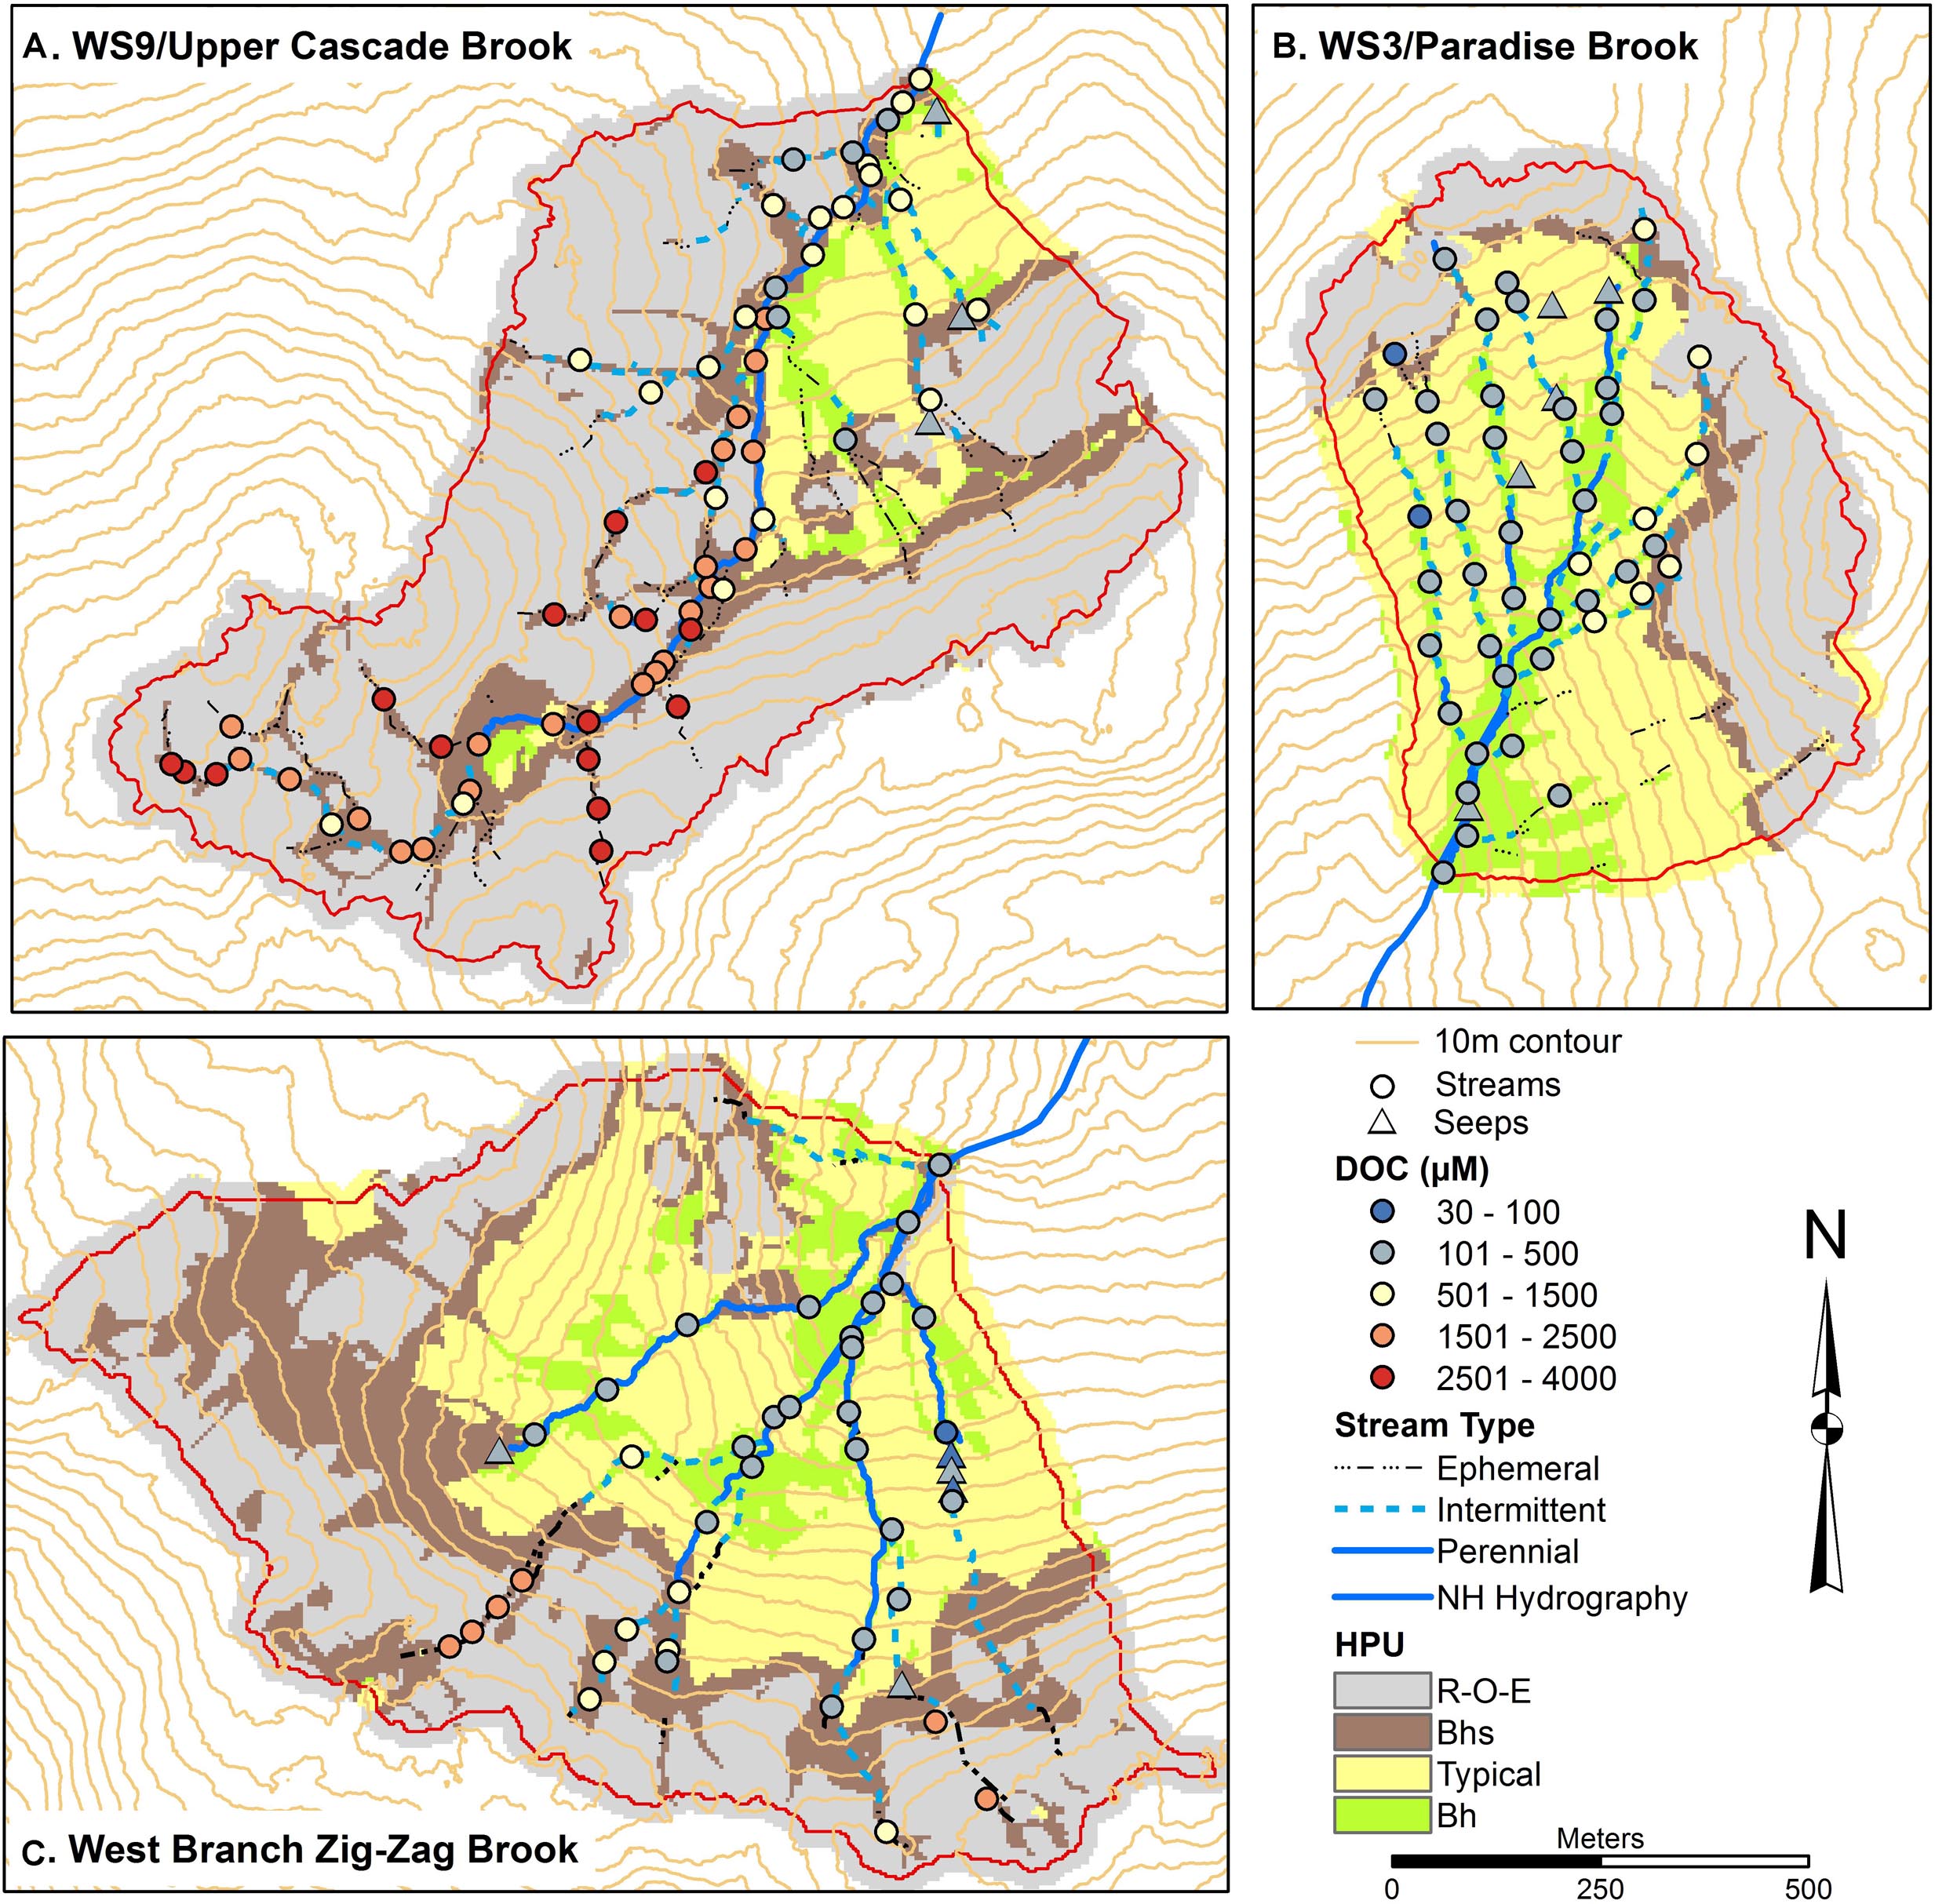
Figure 3. Soils maps for W9 (A), W3 (B), and West Branch Zig Zag Brook (C) with variation in surface water dissolved organic carbon (DOC) concentrations from a synoptic survey conducted July 22–23, 2015. Surface water samples were classified as streams (circles) or seeps (triangles). Soil units include bedrock outcrops, bedrock Histosols, and E podzols (R–O–E), Bhs podzols (Bhs), typical podzols (Typical), and Bh podzols (Bh).
Total monomeric Al concentrations (Figure 4) showed a range in each catchment, with concentrations >9 μM common in the upper part of W3, particularly on the eastside, throughout W9, including at the outlet, and along the upper parts of the tributaries in ZZ. Seeps had among the lowest concentrations of Alm, generally below the method detection limit (MDL) of 0.6 μM, while some seeps and stream sites in W3 and ZZ had concentrations below the limit of quantification (LOQ) of 2 μM. Fe concentrations were very low in W3 (Figure 5), with most stream and all seep sites either less than the MDL of 0.6 μM or the LOQ of 1.8 μM. In contrast, many stream sites in W9, particularly in mid to upper portions of the network had Fe concentrations in excess of 10 μM with a peak concentration of 33 μM. Some of the uppermost sites in ZZ had concentrations in the 10–20 μM range.
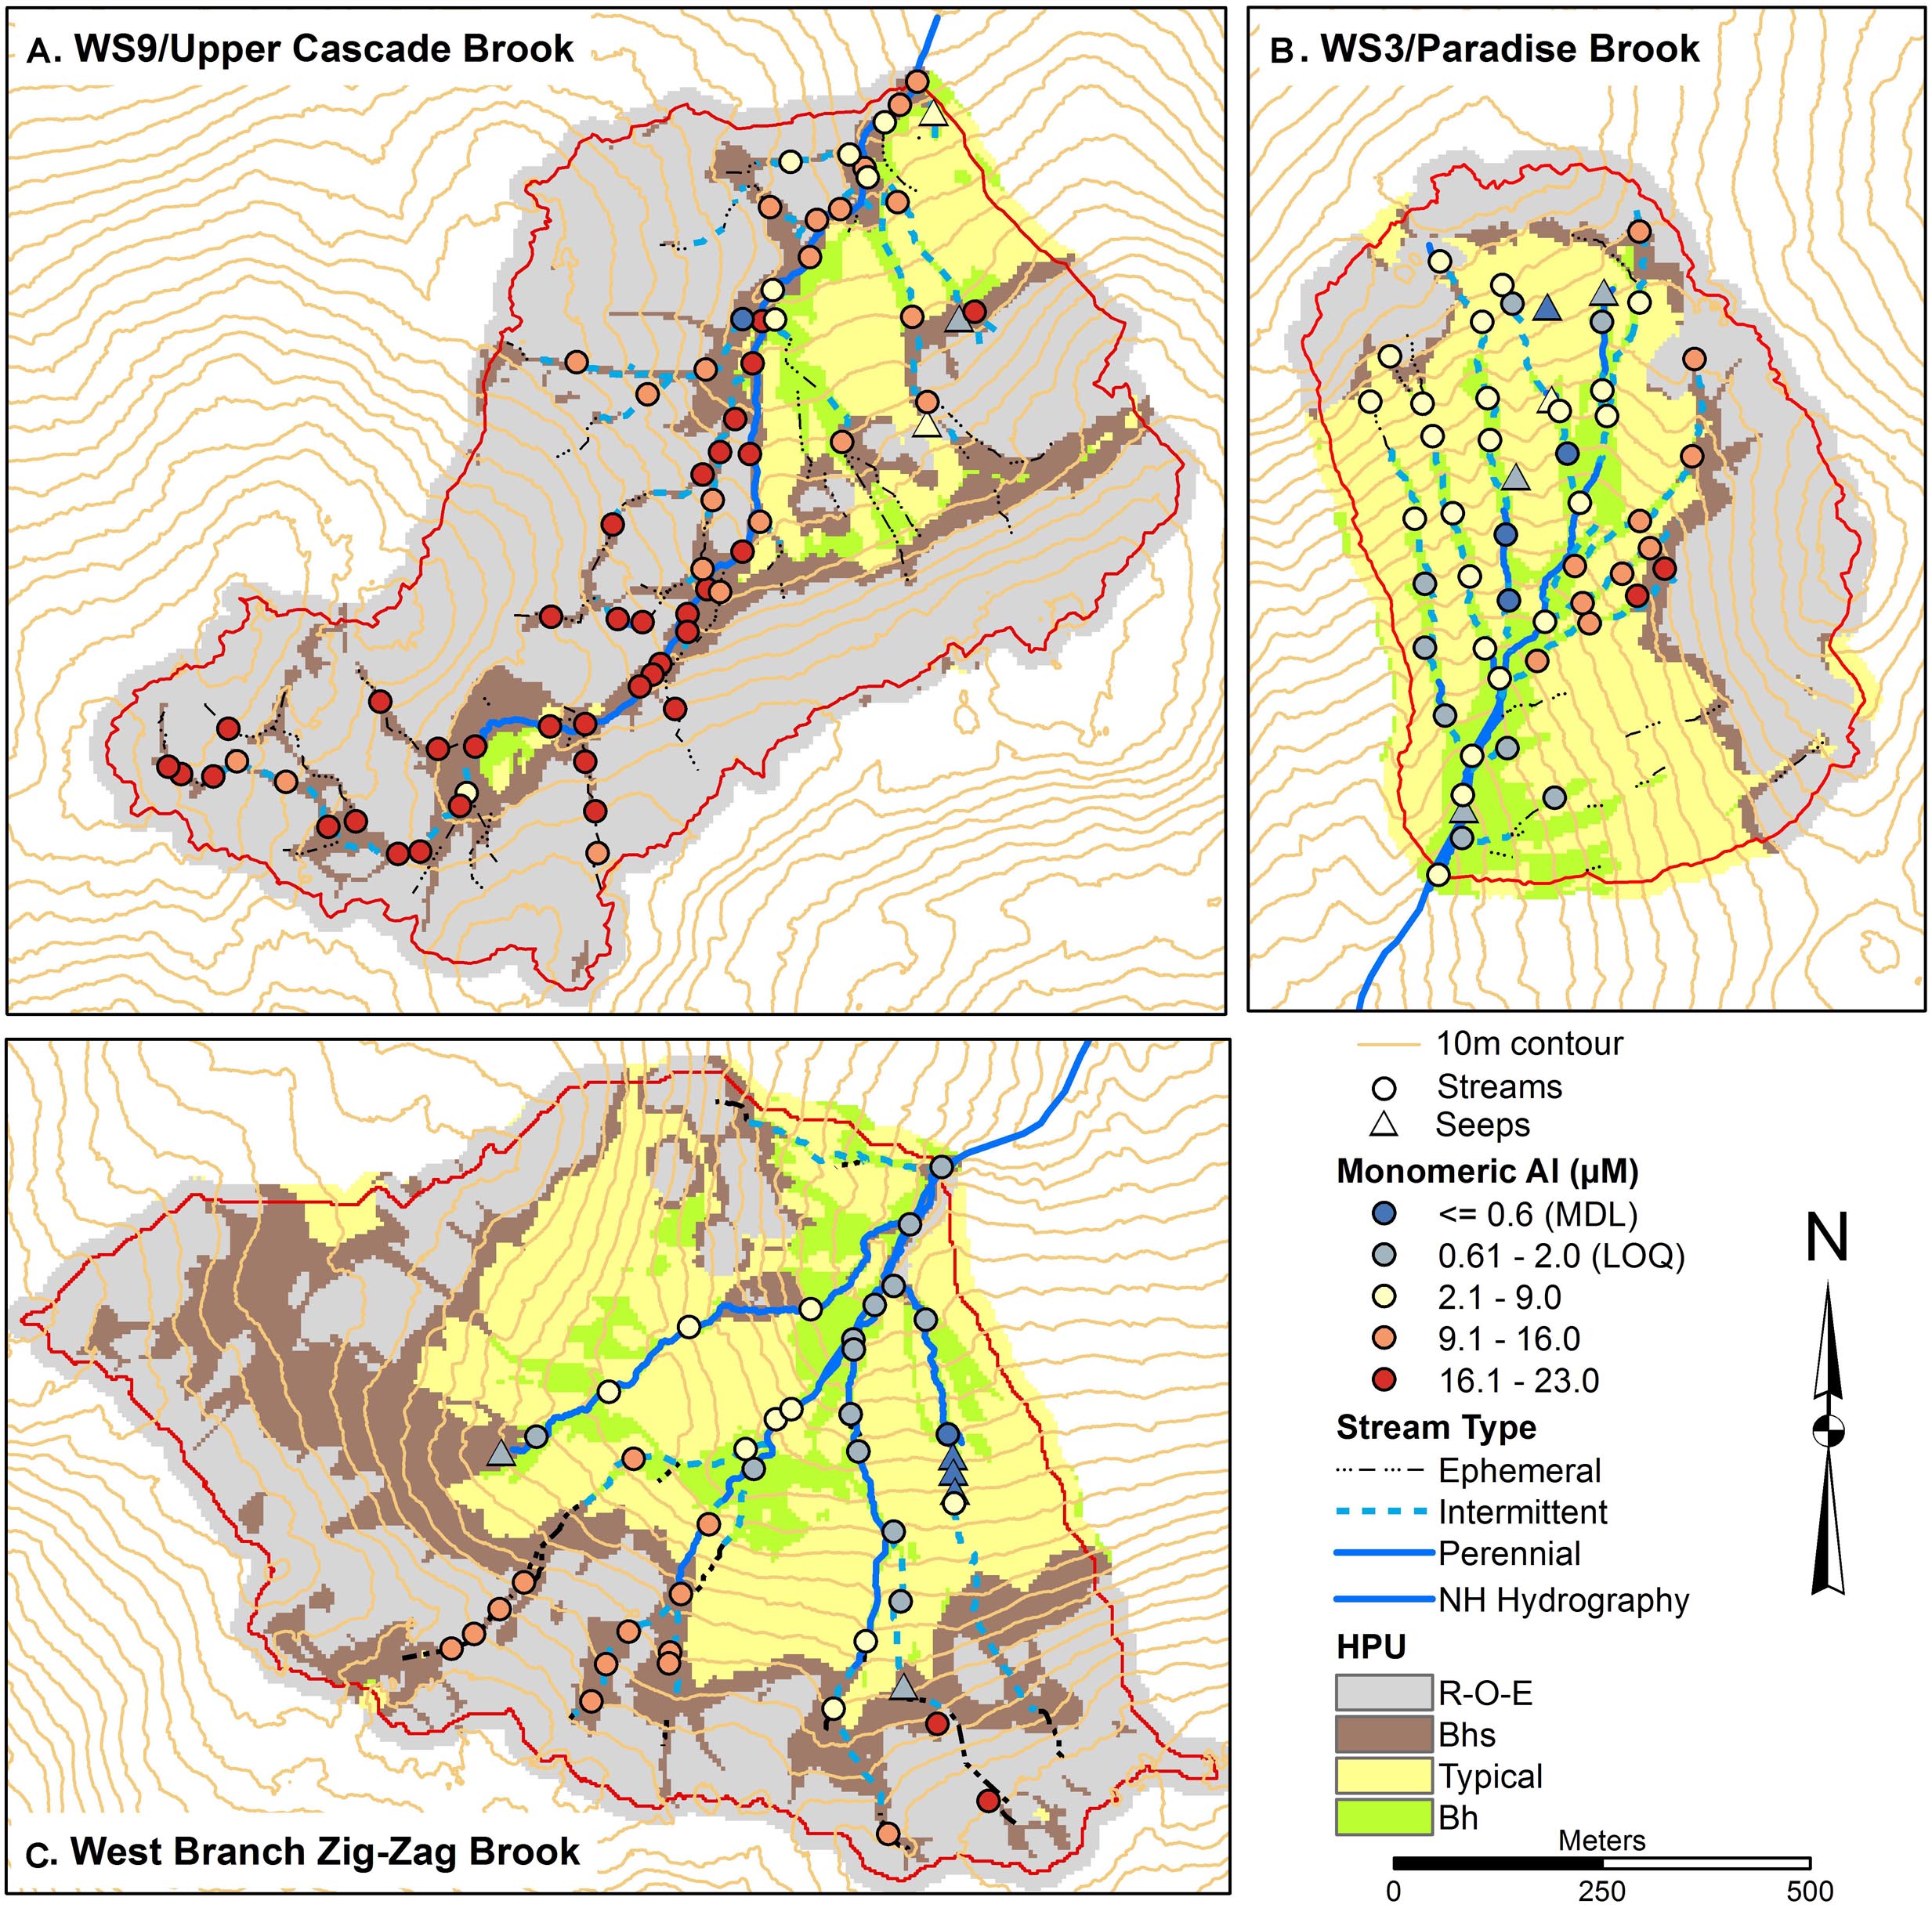
Figure 4. Soils maps for W9 (A), W3 (B), and West Branch Zig Zag Brook (C) with variation in surface water total monomeric aluminum (Alm) concentrations from a synoptic survey conducted July 22–23, 2015. Surface water samples were classified as streams (circles) or seeps (triangles). Soil units include bedrock outcrops, bedrock Histosols, and E podzols (R–O–E), Bhs podzols (Bhs), typical podzols (Typical), and Bh podzols (Bh).
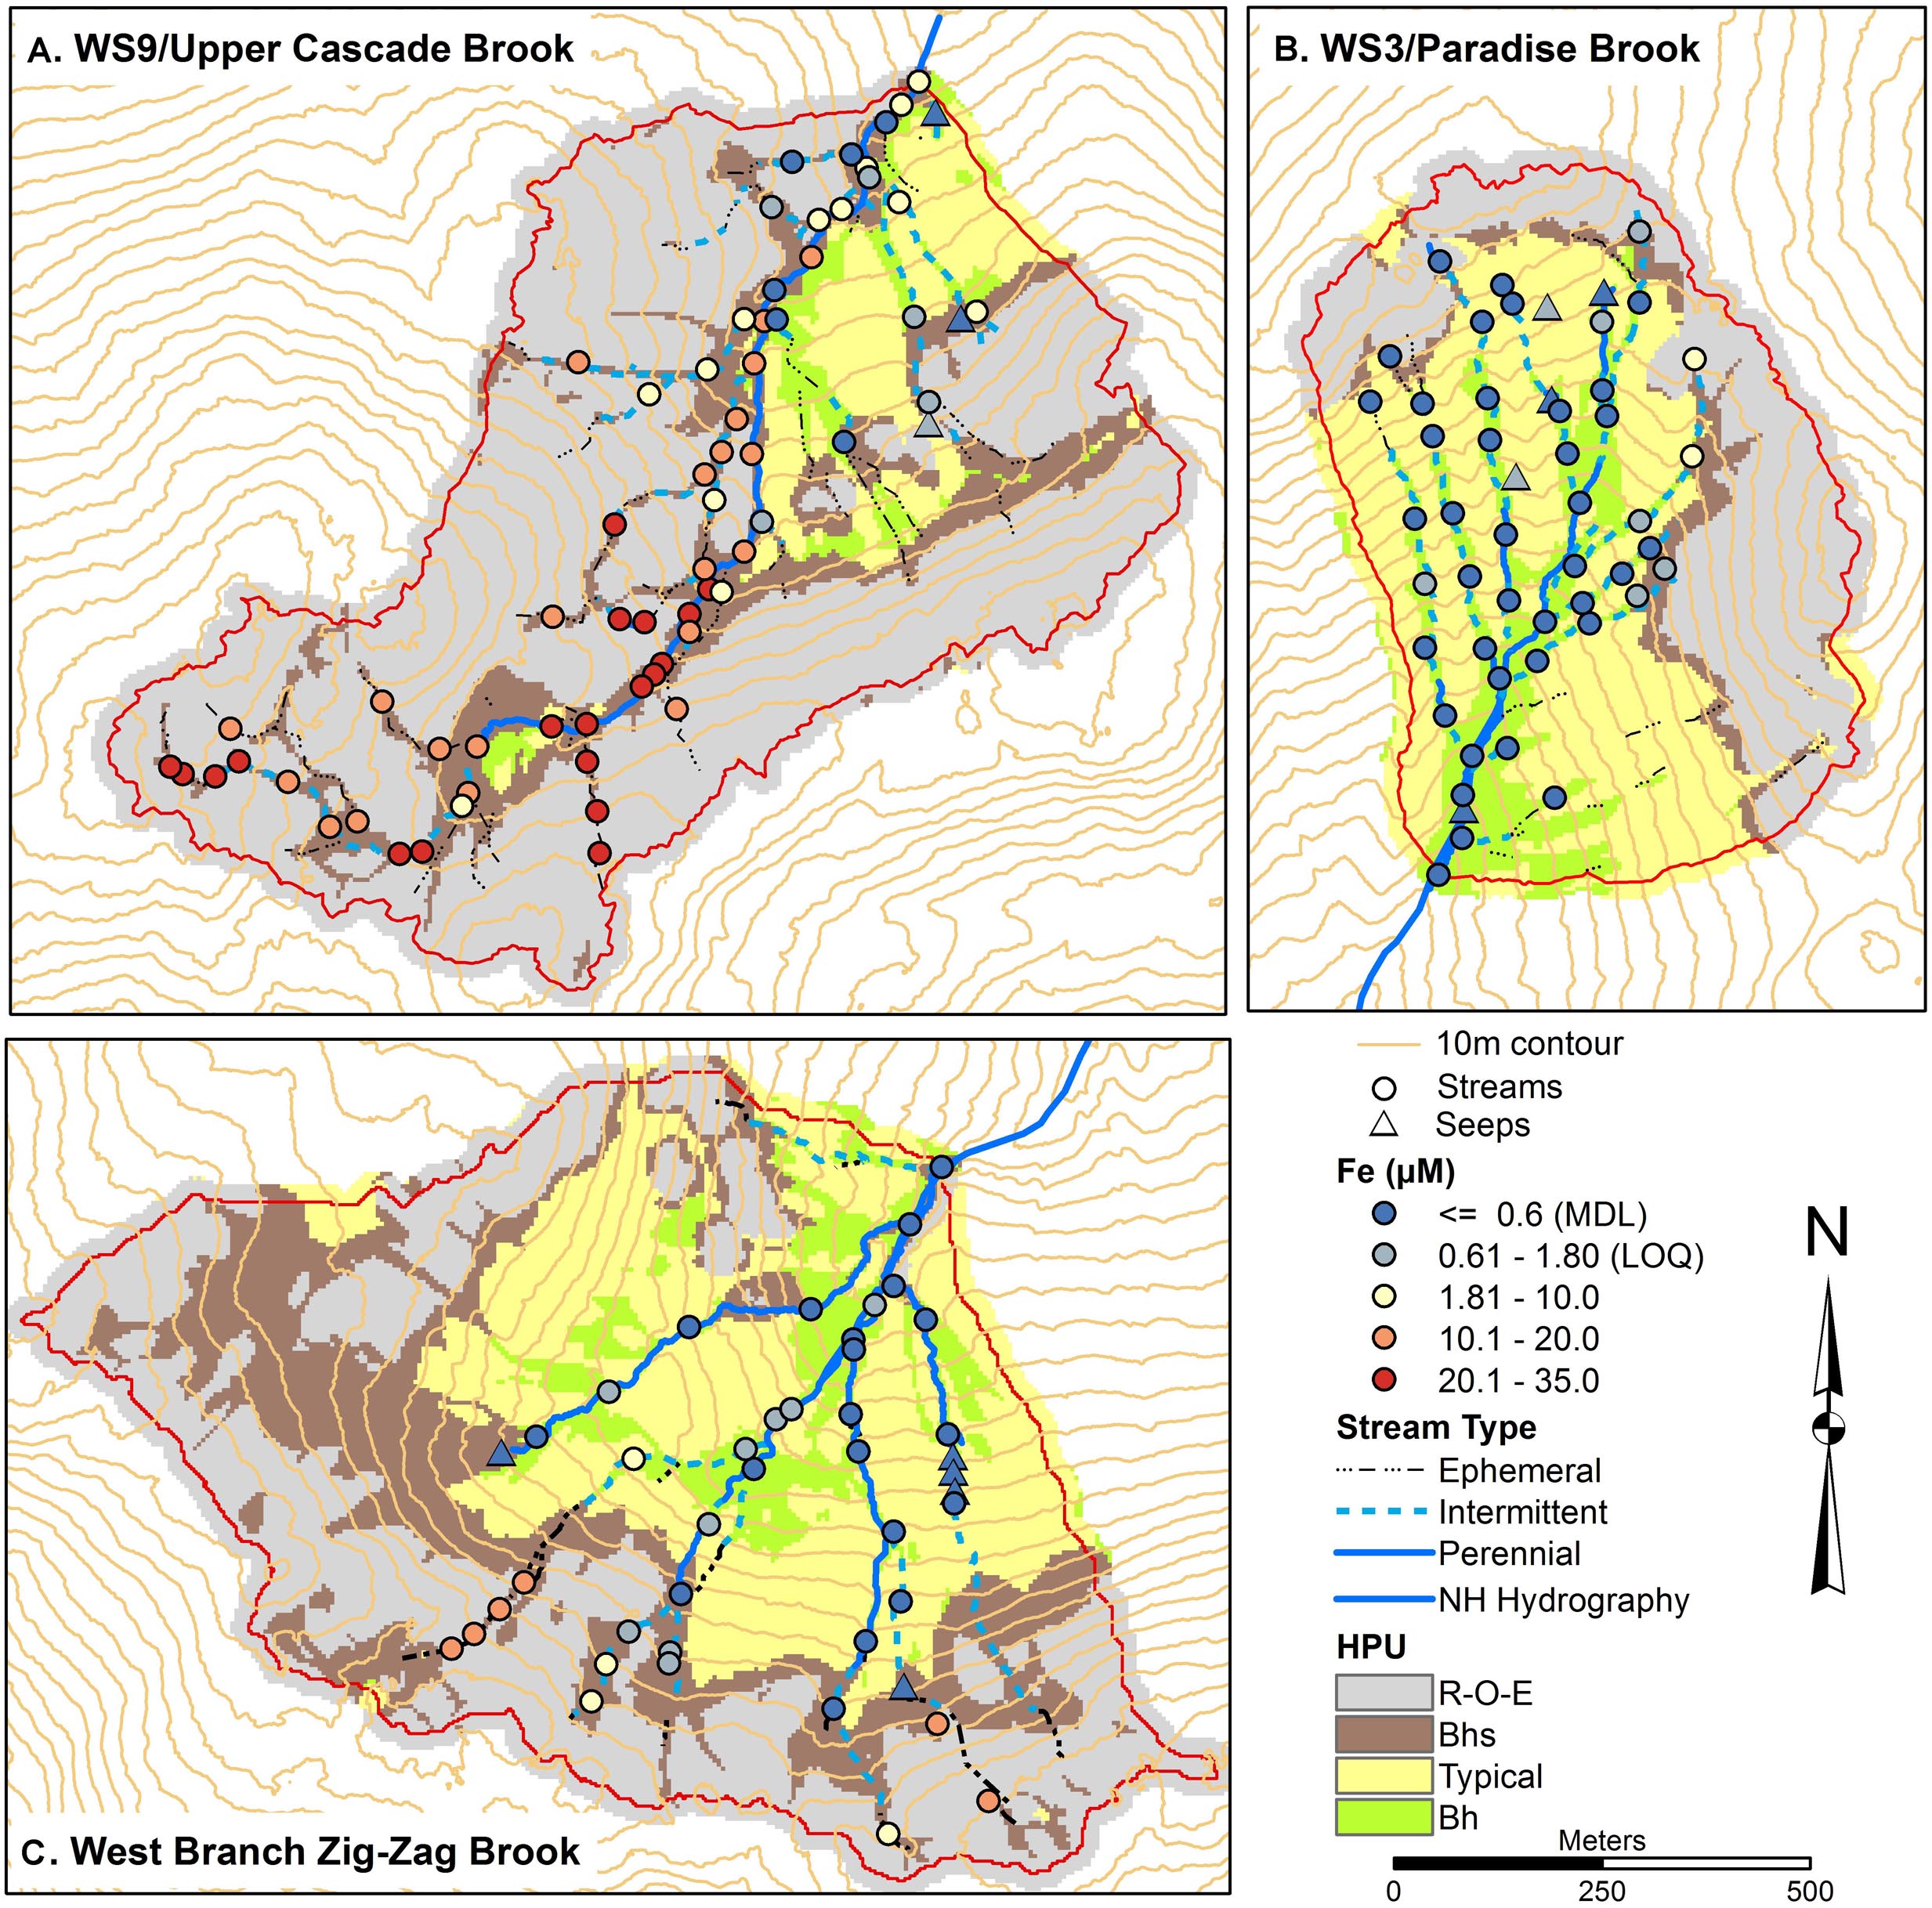
Figure 5. Soils maps for W9 (A), W3 (B), and West Branch Zig Zag Brook (C) with variation in surface water iron (Fe) concentrations from a synoptic survey conducted July 22–23, 2015. Surface water samples were classified as streams (circles) or seeps (triangles). Soil units include bedrock outcrops, bedrock Histosols, and E podzols (R–O–E), Bhs podzols (Bhs), typical podzols (Typical), and Bh podzols (Bh).
Spatial patterns of Na and Si were examined as indicators of primary mineral dissolution (Figures 6, 7) as these solutes are less impacted by other ecosystem processes. Concentrations of Na in all catchments were generally in similar ranges and increased slightly moving downstream, with concentrations 12–20 μM typical of headwaters, tending to increase to 20–30 μM in the lower catchment. Na concentrations were highest in seeps, modestly higher, in a range of 30–40 μM in W9 seeps and 40–60 μM in W3 and ZZ seeps. Si concentrations were more variable longitudinally within the catchments, with concentrations in a range of 20–100 μM seen in upper and lower portions of all catchments, except that lowest concentrations in ZZ were about 60 μM. Concentrations of Si in a range of 100–150 μM were seen in the three seeps in W9 and in two stream sites, and in most of the seeps and a larger number of stream sites in ZZ. One seep in ZZ and two seeps in W9 had concentrations in the range of 150–200 μM Si (Figure 7).
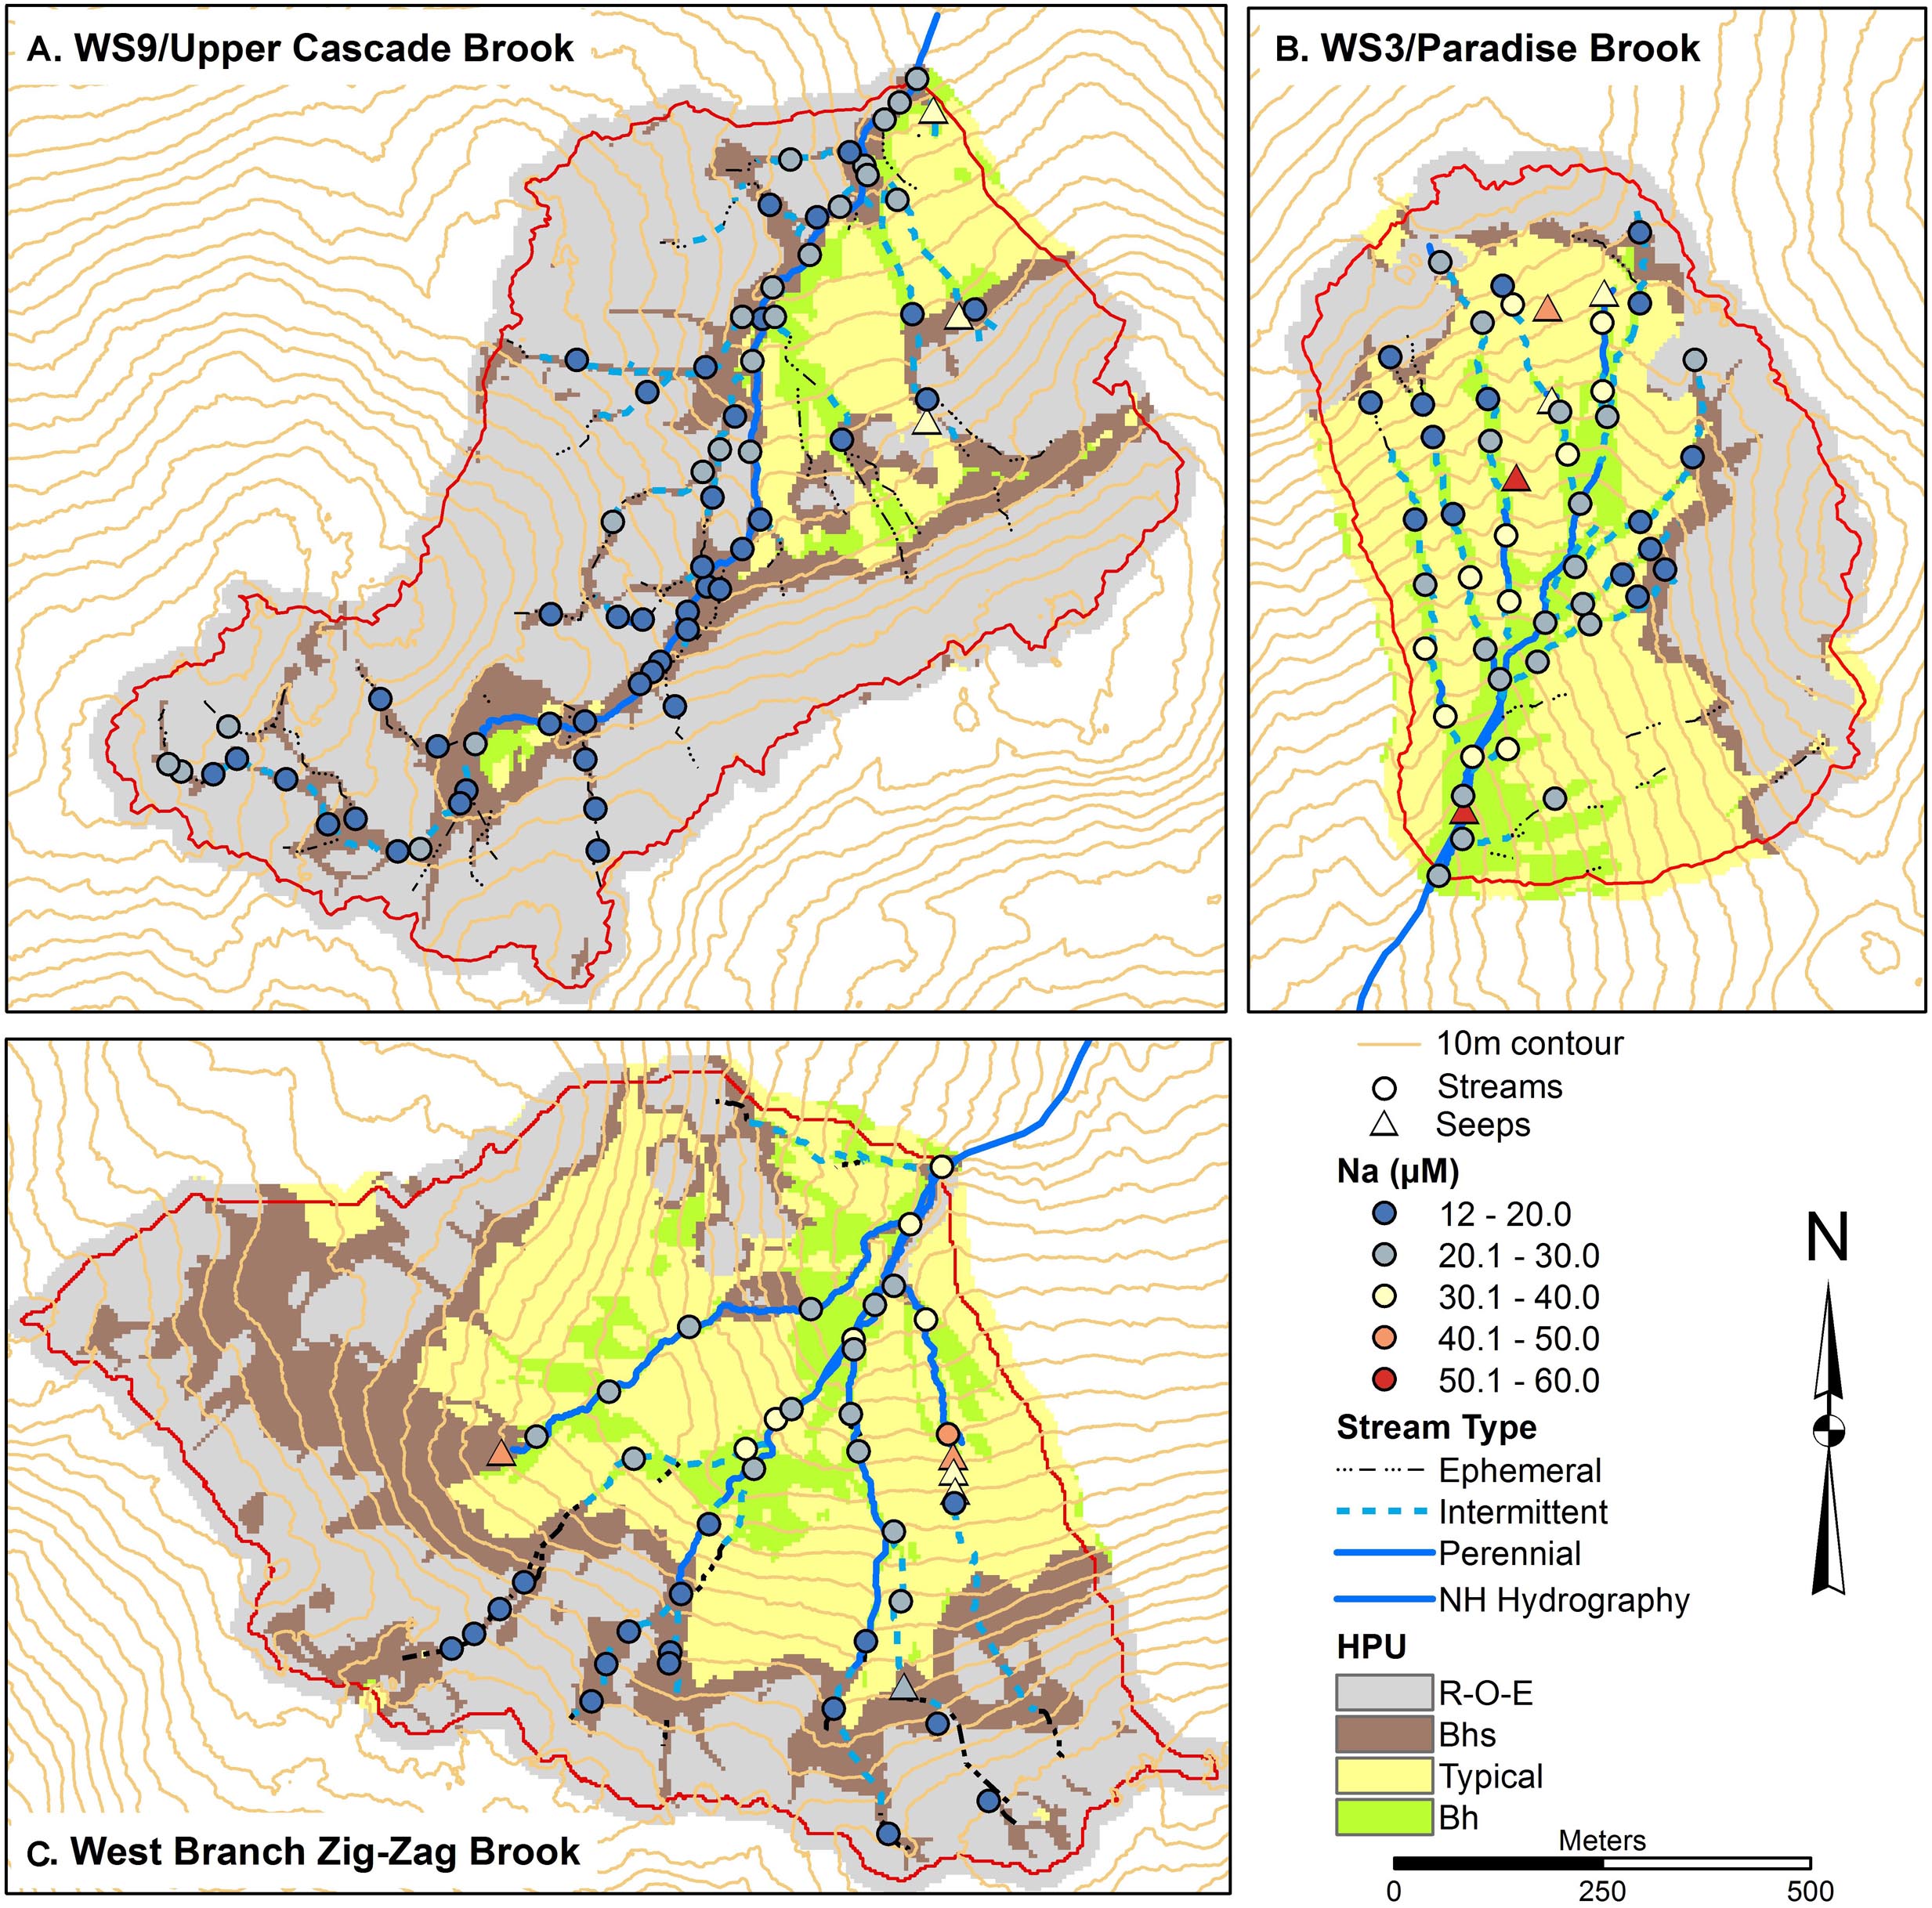
Figure 6. Soils maps for W9 (A), W3 (B), and West Branch Zig Zag Brook (C) with variation in surface water sodium (Na) concentrations from a synoptic survey conducted July 22–23, 2015. Surface water samples were classified as streams (circles) or seeps (triangles). Soil units include bedrock outcrops, bedrock Histosols, and E podzols (R–O–E), Bhs podzols (Bhs), typical podzols (Typical), and Bh podzols (Bh).
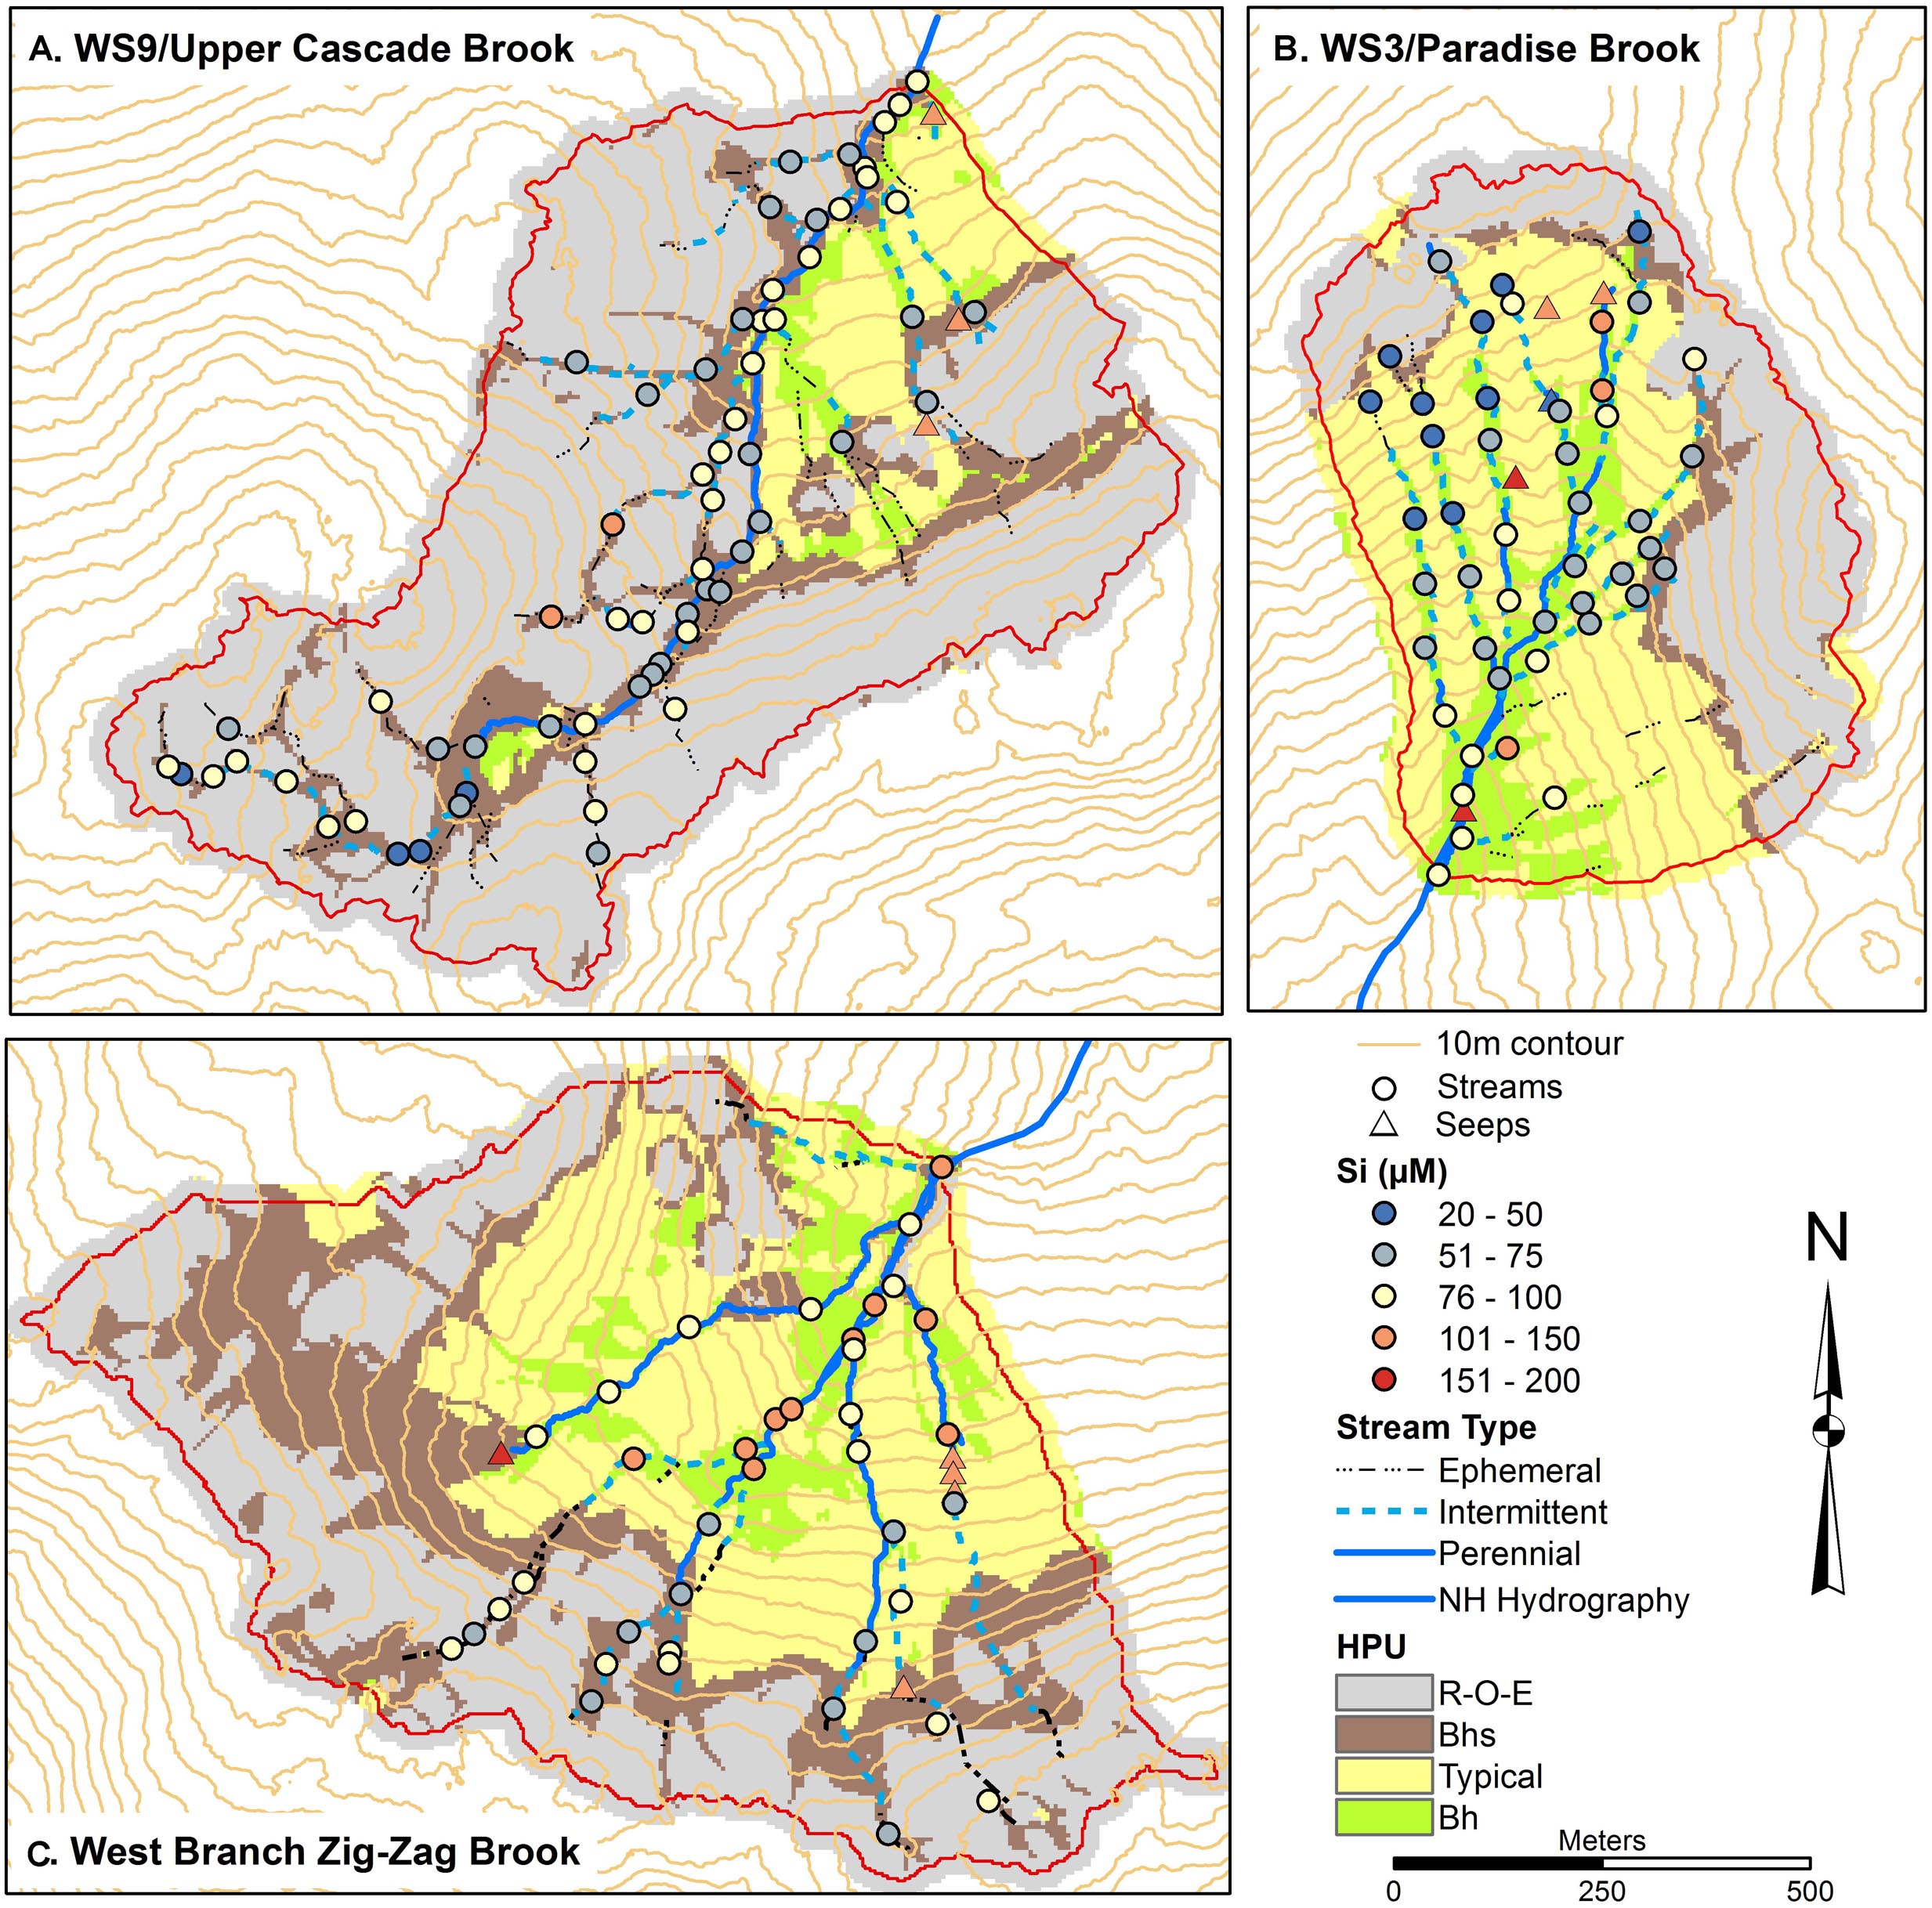
Figure 7. Soils maps for W9 (A), W3 (B), and West Branch Zig Zag Brook (C) with variation in surface water silicon (Si) concentrations from a synoptic survey conducted July 22–23, 2015. Surface water samples were classified as streams (circles) or seeps (triangles). Soil units include bedrock outcrops, bedrock Histosols, and E podzols (R–O–E), Bhs podzols (Bhs), typical podzols (Typical), and Bh podzols (Bh).
Soil Distribution
The catchments differed in the proportion of hydropedologically defined soil units present in each. W9 had the greatest contribution, 70%, of the shallowest soils, including bedrock outcrops, O horizon on bedrock, and E podzols (together mapped as R–O–E; Figures 2–7), whereas ZZ and W3 had 38 and 33%, respectively, of R–O–E soils. These soils are typically saturated to near the surface (i.e., within 10–20 cm of the surface) with every rainfall and snowmelt event, rapidly draining upon the conclusion of those events (Table 1). At the other end of the soil depth and groundwater influence spectrum, typical podzols, with little incursion of groundwater in the zone of greatest soil formation (Table 1), were most prevalent in W3, contributing 44% whereas they made up 30 and 9% of the ZZ and W9 catchments, respectively (Figures 2–7). Bhs podzols, soils of intermediate depth and just downslope of the bedrock controlled portions of the catchments were least common in W3, making up 6% of the catchment, with larger contributions of 17 and 24% in W9 and ZZ, respectively. Bh podzols, the wettest soils mapped in the catchments and generally associated with the near-stream zone in mid to lower portions (Figures 2–7) made up 16% of W3 but only 4 and 9% of W9 and ZZ, respectively.
Groundwater Composition by Soil Type
Groundwater composition was distinct between soil units (Figure 8). pH and DOC concentration showed the most regular gradients across the general hillslope sequence. pH was lowest (median 4.0) and DOC was highest (median 2670 μM) in soils consisting of O horizon directly on shallow bedrock. pH increased to a median of 5.2 in typical podzols while DOC concentrations fell along the same sequence of soils, with a median of 110 μM in typical podzols. Bh podzols had similar pH and DOC to typical podzols.
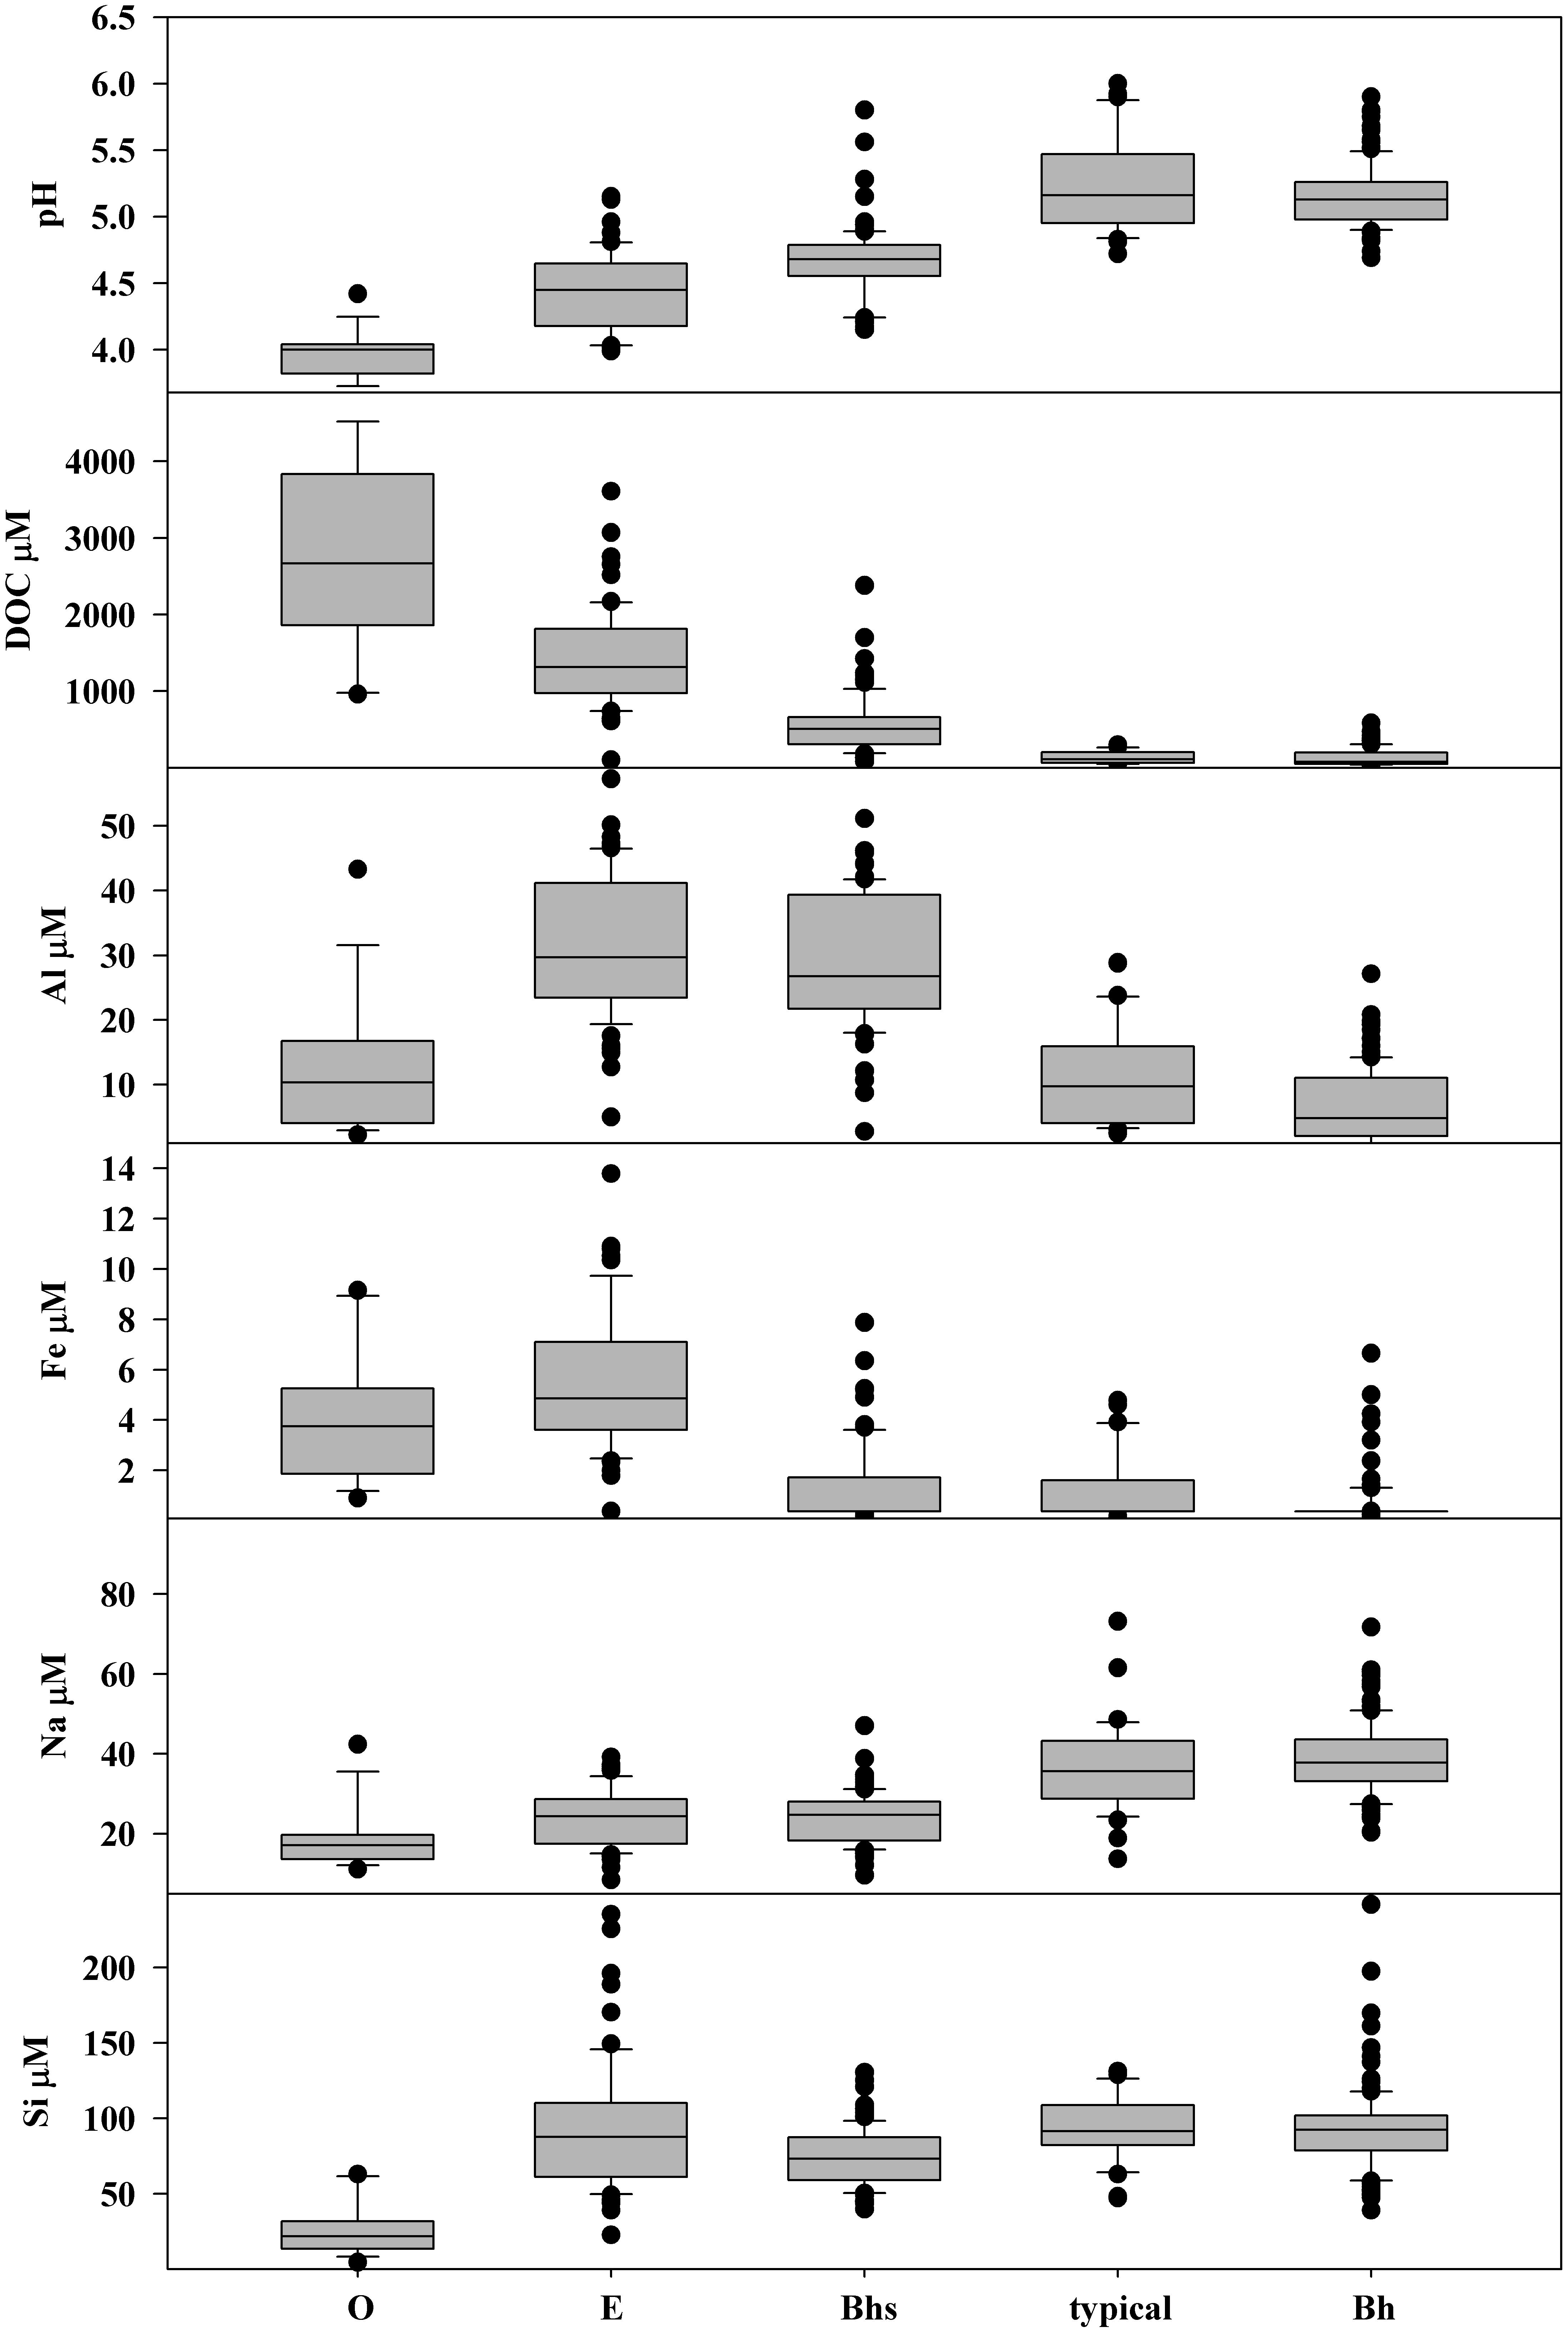
Figure 8. Box plots showing the distribution of pH and concentrations of dissolved organic carbon (DOC), total dissolved aluminum Al, iron (Fe), sodium (Na), and silicon (Si) in groundwater samples from shallow wells stratified by soil type. The number of groundwater samples included was O = 16, E = 67, Bhs = 89, typical = 35, Bh = 120.
Al concentrations were highest in E podzols with a median of 30 μM, dropping slightly to 27 μM in Bhs podzols. O podzols and typical podzols had similar median Al concentrations of 10 μM while concentrations in Bh podzols were lower, with a median of 5 μM. Fe concentrations were highest in the O and E units, with median concentrations of 4 and 5 μM. In contrast, most samples from Bhs podzols, typical podzols, and Bh podzols had Fe concentrations below the LOQ of 1.8 μM.
Na showed a low but consistent gradient in groundwater concentrations across the soil sequence, with a low median of 17 μM in O, increasing to 24 μM in E and Bhs podzols, to 36 μM in typical podzols and 38 μM in Bh podzols. Si concentrations in groundwater were low in O horizon on bedrock, with a median of 21 μM while the other soils all had similar Si concentrations, with medians varying between 73 and 92 μM.
Relationship Between Stream Chemistry and Soil Distribution
The O and E soils generally had the most distinct groundwater chemistry, with low pH, and high DOC, Al, and Fe concentrations. Together with bedrock outcrops, these units comprise the bedrock controlled portions of the catchment landscape. In order to evaluate differences in soil influence across sampling sites, the portion of the subcatchment of each stream sampling site underlain by the R–O–E soil complex was calculated and then plotted against the water solute data (Figure 9). pH generally increased with decreasing proportion of R–O–E soil units while concentrations of DOC, Al, and Fe were highest when the R–O–E complex made up greater proportions of subcatchments. Subcatchment in R–O–E complex appears to be a threshold with all sites with elevated DOC, AL, and Fe, and the lowest pH sites confined to subcatchments with greater than 50% R–O–E contribution. Na and Si concentrations showed less distinct gradients across this range of subcatchment soil composition. Na concentrations increased slightly with decreasing proportion of R–O–E, with a number of sites in the range of 30–50% R–O–E having the highest concentrations. Si concentrations were highest in a similar range of soil compositions, but showed even less of a consistent gradient across the soil sequence spectrum.
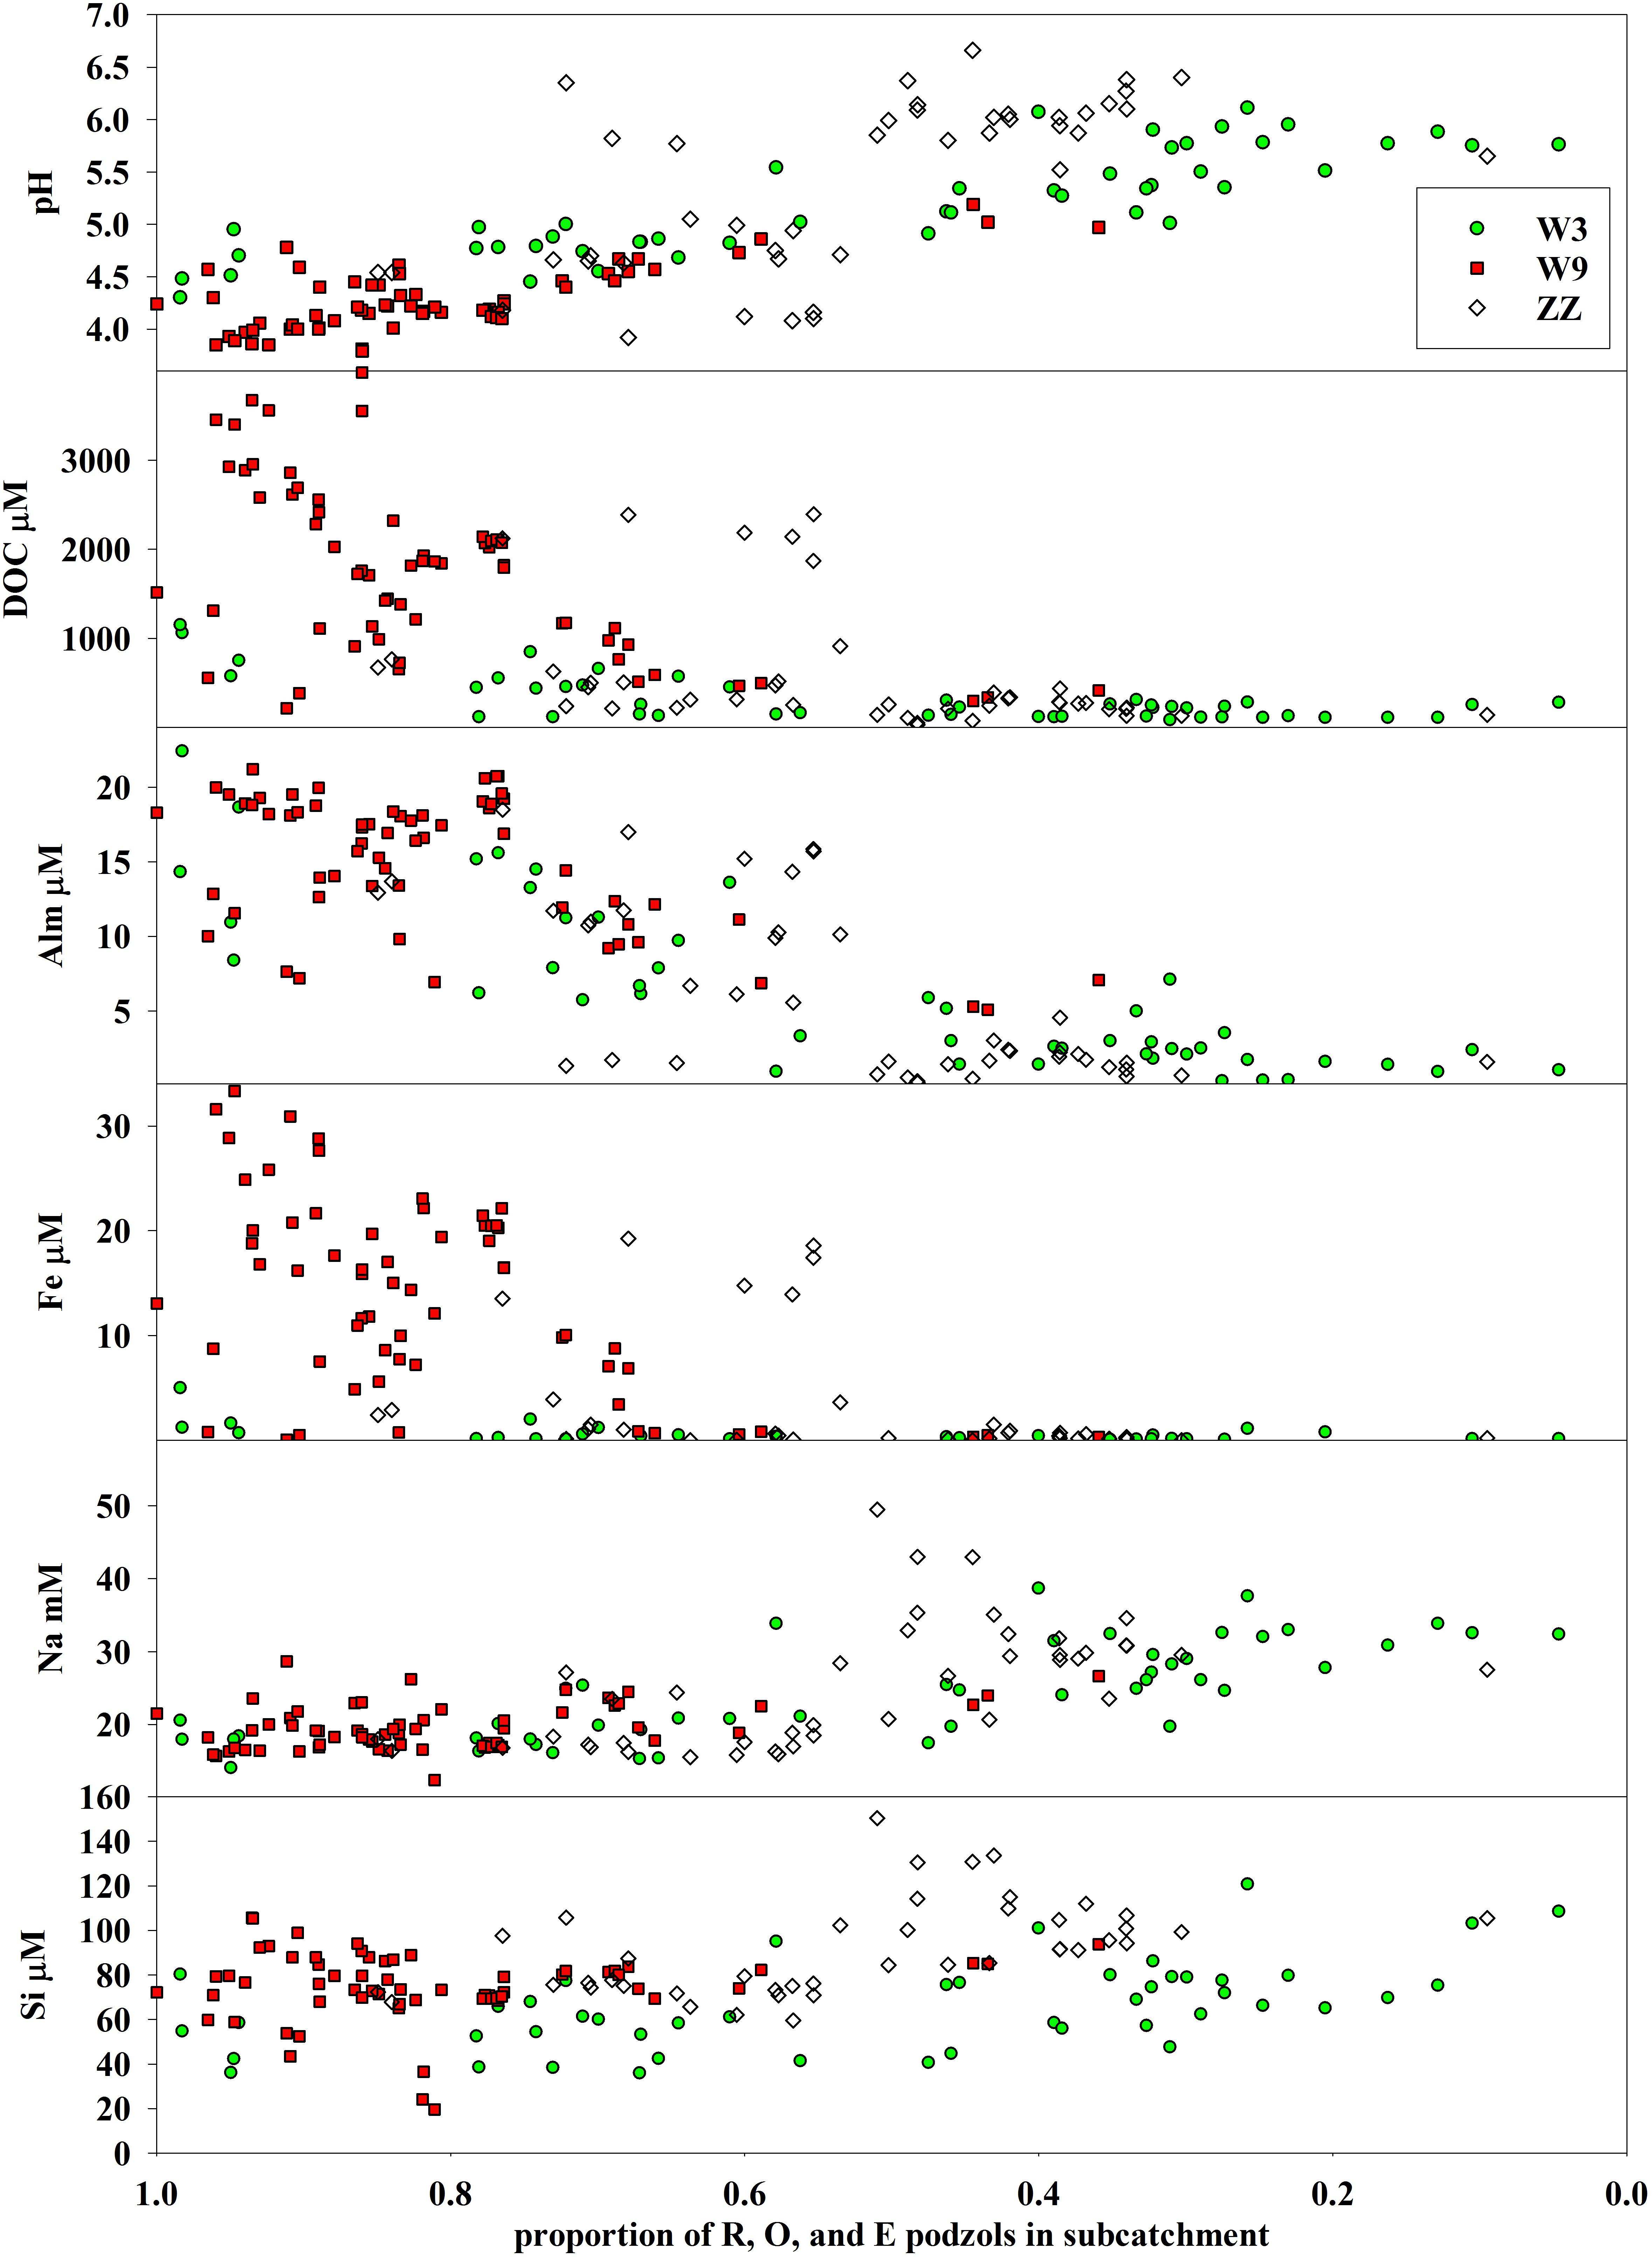
Figure 9. Variation in surface water pH and concentrations of dissolved organic carbon (DOC), monomeric aluminum (Alm), iron (Fe), sodium (Na), and silicon (Si) versus proportion of each sampling site’s contributing subcatchment in rock outcrops, O-horizon on shallow bedrock, and E-podzols (R–O–E). The proportion of R–O–E soils decreases toward the right, and generally moving downstream along any given tributary.
Sampling sites with relatively high pH, low DOC, Al, and Fe that fell off the general relationship with R–O–E tended to be immediately downstream of seeps. W3 fell off of the relationship between Fe and R–O–E seen at W9 and ZZ, with generally low concentrations of Fe in surface water across W3.
Salt extractable soil pools of Al were very low in O horizon on bedrock and E podzols and highest in the deeper soils with thicker illuvial horizons, downslope, including Bhs, typical, and Bh podzols (Figure 10).
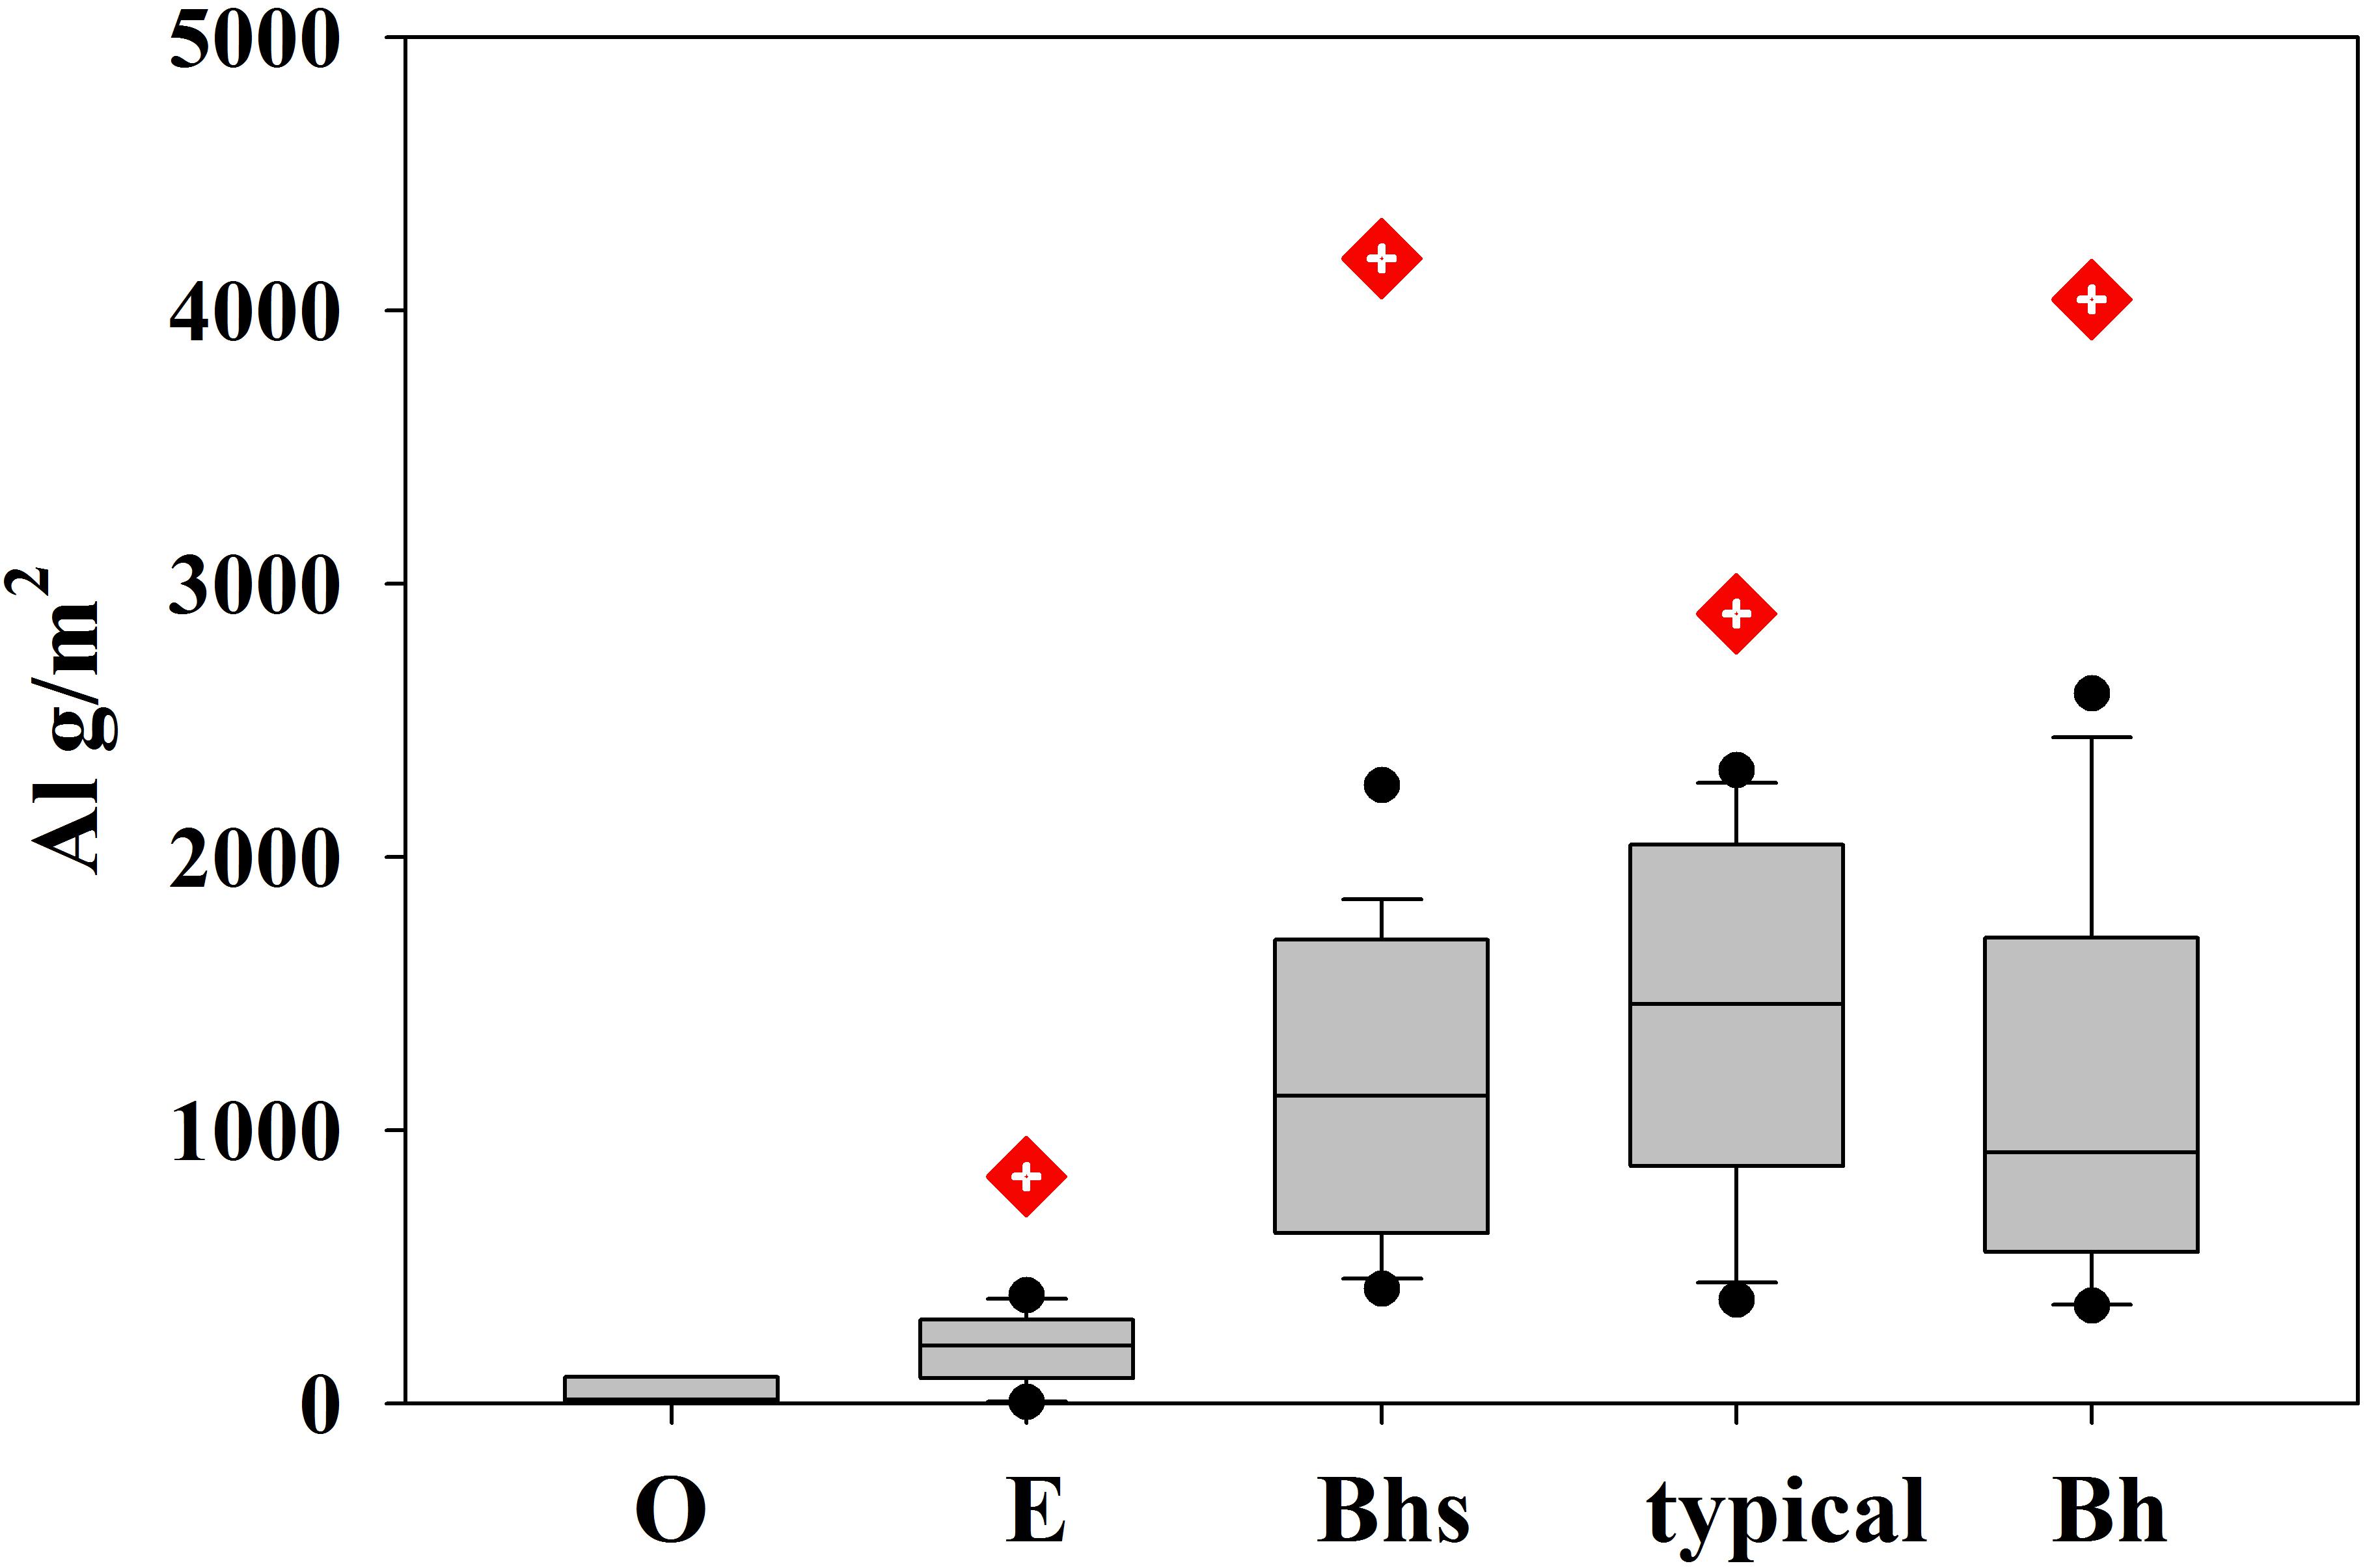
Figure 10. Box plots showing the distribution of salt extractable pools of aluminum (Al) stratified by soil type. The number of profiles used for pool size estimates was O = 6, E = 14, Bhs = 19, typical = 11, Bh = 11. For comparison, the mean soil pool of oxalate extractable Al in each soil type (Bourgault, 2014) is also shown.
Discussion
Podzolization Controls on Stream Chemical Gradients
At HBEF, typical of acidic forested landscapes in the Northeastern United States, podzolization is a dominant soil forming process. Organic acids developed through decomposition processes in the forest floor bind with Al and Fe released from primary mineral dissolution to form soluble organometallic complexes, which then leach downward through the soil profile, or downslope via lateral flow of groundwater. Deeper in the soil profile or downslope, in spodic B horizons, these complexes precipitate to form coatings and discrete particles of spodic materials, or SOM stabilized by Al and Fe complexation (e.g., see Bourgault et al., 2015).
Our study shows how headwater streams participate in, and reflect this soil forming process. Upslope portions of the catchments (Figures 2–7) are dominated by soils with only, or predominately, the horizons that represent the first stage of the podzolization process. These include soils where O horizon sits directly on bedrock and E podzols, where the leached E horizon is the dominant mineral horizon. Complexation of metals with organic matter is followed by transport down through deeper better drained soil profiles, or downslope through shallower soils and soils with frequent groundwater incursions into upper horizons. Many intermittent, or seasonally flowing, stream channels originate and drain this portion of the catchment. Groundwater and streams in this zone reflect this eluvial portion of the podzolization process, with relatively low pH and high concentrations of DOC, Al, and Fe (Figures 2–8).
Of our three study catchments, W9 best exemplifies these processes. The R–O–E soil complex makes up 70% of the catchment, extending all the way to the catchment outlet on the west side of the main stream (Figures 2–7). Most of the stream sampling sites in W9 have a subcatchment drainage area with >70% in the R–O–E subcatchment, and show low pH and elevated DOC, Al, and Fe (Figure 9). For DOC, the highest R–O–E stream sites show concentrations that are at least an order of magnitude higher than the lowest R–O–E sites. These portions of the landscape with R–O–E >70% may be considered to be eluvial landscapes. This fits the concept of Sommer (2006) that landscape pedology can be used for understanding biogeochemical spatial patterns.
Lower portions of the catchments are dominated by soil units with horizons reflecting the illuvial component of the podzolization process. Typical podzols tend to have a thin Bhs horizon over a thicker Bs horizon. The Bhs horizon with the darkest reddish brown colors generally has the highest illuvial carbon content, reflecting the greatest degree of illuviation. In the Bhs podzol, this darker reddish brown horizon makes up most of the mineral portion of the soil profile, reflecting the greatest degree of illuviation. Bh podzols with a dark but less red Bh horizon are associated with near-stream zones and topographic benches and may reflect a different mode of podzolization based on distinct micromorphology (Bourgault et al., 2015). Stream chemistry at sampling sites with 50% or more the Bhs, typical, and Bh soil units (i.e., 50% or less R–O–E units) tend to have higher pH and lower concentrations of DOC, Al, and Fe. There are several theories that have been proposed to explain illuviation in podzols, which include precipitation of Al and Fe due to decreasing solubility of increasingly metal-rich complexes, microbial degradation of organically bound Al and Fe, co-precipitation between organic-rich soil water and Al from groundwater, and the formation of imogolite-type-materials (Farmer et al., 1983; Lundström et al., 2000).
Where a given sampling site sits relative to this eluvial-illuvial landscape balance may vary with catchment wetness conditions. Gannon et al. (2015) showed how DOC concentrations at the outlet to W3 increased when water table rose in E podzols, and intermittent streams in the bedrock-controlled portion of the drainage network became active. Expansion of the active channel network into the eluvial zone, and the balance of runoff produced from this zone compared to deeper zones in the lower catchment, would influence how far downstream the solute characteristics of the eluvial zone would be detected. The largest runoff events, when the entire channel network is active, and when contributions from deeper soils are limited in a relative sense, likely describe conditions when a pulse of water with lower pH and higher concentrations of DOC, Al, and Fe would influence water composition farthest downslope. Such conditions may contribute to the formation of Bh podzols in the near-stream zone. Similar near-stream soils with illuvial horizons relatively high in Al have been observed elsewhere in similar catchments (Pellerin et al., 2002).
In this landscape with eluvial zones of R–O–E soils upslope, and illuvial zones of typical and Bh podzols downslope, the position of the Bhs podzols in the middle may represent a hinge point where soil and water compositions reflect some characteristics of each zone. Groundwater in Bhs podzols still had elevated DOC concentrations compared to typical and Bh podzols (Figure 8) and Al concentrations were nearly as high as they were in E-podzols. Thus, groundwater still partially reflects the mobilization of soluble organometallic complexes of the eluvial zone. On the other hand, storage of organometallic complexes as spodic materials in the solid phase and secondary Al and Fe are as high in this soil unit as they are anywhere along the soil sequence (Figures 8, 10; Bailey et al., 2014; Bourgault et al., 2017), reflecting the strong illuviation in this zone. In some Bhs podzol profiles, organic carbon and secondary Al and Fe concentrations are high and relatively uniform from the top of the mineral soil all the way to the base of the profile at the bedrock interface. In these cases, the soil profile may be approaching a point where the mineral soil has reached its capacity for accumulating spodic material. Similarly, as the portion of a soil profile with high concentrations of spodic materials in the solid phase increases, the efficiency of deposition of further spodic coatings may decrease, leading to more transfer of DOC, Al, and Fe to either lower in the profile or downslope.
Gradients in Primary Mineral Weathering
As neither Al, Fe, nor Si is contributed to the catchment in soluble form from atmospheric deposition (Likens et al., 1977), appearance of these metals in ionic form in groundwater or streamwater ultimately reflects dissolution from primary minerals. Minor amounts of Na are brought into the catchment dissolved in rain and snow, with a mean concentration of about 5 μM, much less than the median concentration of Na in groundwater, which is 17 μM in organic horizons on bedrock. Thus, the presence of these solutes in groundwater in the shallow soils in the uppermost portions of the catchments is evidence of the action of mineral dissolution, another important soil forming process occurring at the site.
While the concentrations of Al and Fe, metals involved in podzolization, is highest in the groundwater in the eluvial zone, concentrations of Na and Si are more similar across the soils sequence. Si is taken up by plants and sequestered in biogenic phytoliths, which accumulate in soil (Ronchi et al., 2013), a process that may be approximately at steady state in the mature forest of these unmanipulated reference catchments (Conley et al., 2008). In contrast little Na is taken up by plants or stored in secondary soil pools (Bailey S.W. et al., 2003) and may represent the most conservative of the solutes released by primary mineral dissolution. Low gradients in the concentrations of Na and Si in the groundwater (Figure 8) and in the streams (Figures 6, 7) suggests that mineral weathering is more or less a contributor to mobile waters throughout the system.
Another piece of evidence of the dominance of primarily mineral dissolution in the eluvial zone of the catchments comes from catchment scale mass balance. Bailey (2019a) found that net export (i.e., streamwater output minus precipitation input) from W9 had a molar ratio of Al:Na of about 1.2–1.4 compared to the ratio in oligoclase, the primary source of both solutes, of 1.5. This is consistent with little net storage of Al in this catchment which is dominated by shallow soils where eluvial processes dominate and where secondary Al pools in the soil are small. In contrast, the net export of Al:Na from W3, where deeper illuvial soils dominate was only 0.2–0.3, suggesting that most Al derived from oligoclase dissolution is stored in secondary soil pools.
A New Model of Acid Neutralization and Stream Chemistry Evolution
Johnson et al. (1981) proposed a two stage acid neutralization model to explain longitudinal gradients in streamwater pH, and concentrations of Al and base cations, including Na. In their model, hydrogen ion input from mineral acidity delivered from atmospheric deposition was partially replaced by Al derived from soil exchange processes in the headwaters, with further neutralization occurring downstream as the concentrations of base cations rose in response to mineral weathering inputs along longer flowpaths. The spatial patterns in groundwater and stream chemistry observed in our work suggest that mineral weathering is occurring throughout the system, including in shallow mineral soils, and even in soils where O horizon is in direct contact with bedrock. Furthermore, exchangeable metal pools are small in the R–O–E zone, as evidenced by low pools of salt extractable and oxalate extractable Al (Figure 10). Most of the cation exchange capacity in these soils is associated with organic matter and most of the pool of exchangeable cations occurs in the B horizon (Johnson et al., 1991; Johnson, 2002), which is more prevalent in the deeper soils further downslope. A final contrast with the Johnson et al. (1981) model is that we find the most acidic waters, including groundwater and streams draining the R–O–E soils, where DOC concentrations are highest, to have pH values lower than atmospheric inputs, highlighting an organic acidity component to the gradient rather than just mineral acidity from atmospheric inputs that Johnson et al. (1981) focused on.
Therefore, we propose a new conceptual model to explain the dominant longitudinal gradients observed in stream chemistry. Organic acids generated in shallow soils in the upper portions of the catchments serve to drive mineral weathering, even in soils with little or no mineral soil, where weathering is promoted at the bedrock surface frequently flushed by low pH water with high concentrations of metal complexing organic acids. Moving downslope, this organic acidity is partially replaced by Al acidity and partially neutralized by base cations, both derived from mineral dissolution in the eluvial zone. Further downslope, neutralization continues with Al and Fe precipitation with organic ligands in illuvial soil horizons. In catchments where the R–O–E complex dominates, this gradient is truncated with catchment stream exports still low in pH and with high concentrations of DOC, Al, and sometimes Fe. In catchments where a large zone of typical and Bh podzols form in mid to lower sections, a strong gradient in stream chemistry will be expected within the catchment, with export of waters of higher pH and low concentrations of DOC, Al, and Fe.
This conceptual model may be expected to apply to other catchments in upland regions where similar soil forming processes (i.e., podzolization and dissolution of granitic mineral assemblies) predominate. As examples, Bailey et al. (1987) documented a similar longitudinal stream gradient to that seen at W9 at the Cone Pond inlet stream, a site on the White Mountain National Forest away from the Hubbard Brook valley. The Cone Pond catchment is dominated by exposed and shallow bedrock with a high proportion of shallow soils with deep eluvial horizons (Bailey et al., 1996). In contrast (Bailey et al., 1987) showed the highest pH and base cation concentrations at the source of the inlet stream to Black Pond, a catchment where the stream initiation point was in deep soils influenced by a perennial groundwater seep. Development of statistical relationships between soil distribution and stream chemistry (e.g., patterns such as shown in Figure 9) may provide a predictive tool that could be applied to other catchments to infer stream chemistry gradients in the absence of stream monitoring data. It may be expected that such a tool may be applicable where soil development processes are similar to those at HBEF, i.e., podzolization and dissolution of a granitic mineral assemblage. Coupled with topographic analysis of LiDAR-based DEMs to predict soil distribution, such tools could provide a powerful reconnaissance method for predicting spatial variations in soils and surface waters.
Conclusion
Three headwater catchments in close proximity to each other, and with many characteristics in common, were found to differ in their longitudinal patterns of stream chemical composition due to differences in the prevalence of functional soil types, which they all had in common, but in much different proportions in each catchment. In this setting, Spodosols are the dominant soil type. However, recently recognized functional types have been distinguished, reflecting the role of groundwater on soil development, resulting in the partitioning of portions of the podzolization process into different zones. Bedrock-controlled landscapes are dominated by bedrock outcrops, thin soils consisting only of organic horizons over shallow bedrock, and E-podzols, mineral soils where organic matter, Al, and Fe are leached from soils developed in thin glacial drift. Deeper soils downslope constitute an illuvial portion of the landscape where organometallic complexes precipitate. Stream chemistry gradients reflect the relative dominance of these two zones in a given catchment. Stream reaches with subcatchments dominated by soils in the predominately eluvial zone have lower pH and higher concentrations of DOC, Al, and Fe, while stream reaches in the illuvial zone have the opposite chemical characteristics.
Past studies have highlighted the role of longer and/or deeper flowpaths in delivering products of mineral dissolution to streams, resulting in higher pH and higher concentrations of base cations. We see some of this influence particularly around groundwater seeps where the transition from eluvial to illuvial dominance may be more abrupt or higher upslope. However, the relatively low gradients in Na and Si in the streams in our study, coupled with high concentrations of Al and Fe in zones where secondary pools of these metals are small suggests the importance of mineral dissolution in bringing all of these metals to the streams right from the headwaters. The role of mineral weathering in shallow soils, or even in exposed bedrock has not been much considered in the past but warrants more study. High concentrations of organic ligands, and frequent flushing of acidic groundwater could counteract the relatively small mineral surface area in bedrock-controlled zone in promoting mineral dissolution.
Author Contributions
SB conceived the study, compiled and processed the data, created the figures, and wrote the first draft of the manuscript. MG led the synoptic sampling campaign. OF conducted the soil modeling and generated subcatchments for the sampling sites. All authors contributed to data interpretation and edited the manuscript.
Funding
Funding for this study was provided by the Northern Research Station, United States Department of Agriculture Forest Service and the National Science Foundation through the Research Experience for Undergraduates Program (DBI/EAR-0754678) and the Hydrological Sciences (EAR-1014507) and Geobiology and Low-Temperature Geochemistry (EAR-1643415/1643327) Programs.
Conflict of Interest Statement
The authors declare that the research was conducted in the absence of any commercial or financial relationships that could be construed as a potential conflict of interest.
The handling Editor declared a shared affiliation, though no other collaboration, with one of the authors DR at the time of review.
Acknowledgments
We thank Jane Hislop and Jeff Merriam, USFS, Durham, NH, United States for water and soil analyses and Rebecca Bourgault, Patricia Brousseau, Margaret Burns, Denise Burchsted, Kyle Corcoran, Dan Demers, Stephanie Duston, J. P. Gannon, Benjamin Geyman, Cody Gillin, Tyler Hampton, Kaitland Harvey, Michaela Kuhn, Brittany LeBeau, Tomoki Oda, Kristen Sapnas, Johali Soleto, Rieko Urakawa, Tammy Wooster, and Margaret Zimmer for fieldwork. Hubbard Brook Experimental Forest is maintained and operated by Northern Research Station, United States Department of Agriculture Forest Service, Newtown Square, PA, United States.
References
Abbott, B. W., Gruau, G., Zarnetske, J. P., Moatar, F., Barbe, L., Thomas, Z., et al. (2018). Unexpected spatial stability of water chemistry in headwater stream networks. Ecol. Lett. 21, 296–308. doi: 10.1111/ele.12897
Ågren, A. M., Buffam, I., Cooper, D. M., Tiwari, T., Evans, C. D., and Laudon, H. (2014). Can the heterogeneity in stream dissolved organic carbon be explained by contributing landscape elements? Biogeosciences 11, 1199–1213. doi: 10.5194/bg-11-1199-2014
Bailey, A. S., Hornbeck, J. W., Campbell, J. L., and Eagar, C. (2003). Hydrometeorological Database for Hubbard Brook Experimental Forest: 1955-2000. Newtown Square, PA: US Department of Agriculture, Forest Service, Northeastern Research Station Available at: http://www.fs.fed.us/ne/newtown_square/publications/technical_reports/pdfs/2003/gtrne305.pdf (accessed June 14, 2013).
Bailey, S. W., Buso, D. C., and Likens, G. E. (2003). Implications of sodium mass balance for interpreting the calcium cycle of a forested ecosystem. Ecology 84, 471–484. doi: 10.1890/0012-9658(2003)084[0471:IOSMBF]2.0.CO;2
Bailey, S. W. (2019a). “Tracking the fate of plagioclase weathering products: pedogenic and human influences,” in Biogeochemical Cycles: Ecological Drivers and Environmental Impact. Geophysical Monographs, eds K. Dontsova, Z. Balogh-Brunstad, and G. Le Roux (Washington, DC: American Geophysical Union).
Bailey, S. W. (2019b). Hubbard Brook Experimental Forest: Pedon Locations, 1995-Present. Environmental Data Initiative. Available at: https://doi.org/10.6073/pasta/a7bffc2c0be8052e83b2145993ffa46c (accessed February 22, 2019).
Bailey, S. W., Brousseau, P. A., McGuire, K. J., and Ross, D. S. (2014). Influence of landscape position and transient water table on soil development and carbon distribution in a steep, headwater catchment. Geoderma 22, 279–289. doi: 10.1016/j.geoderma.2014.02.017
Bailey, S. W., Hornbeck, J. W., Driscoll, C. T., and Gaudette, H. E. (1996). Calcium inputs and transport in a base-poor forest ecosystem as interpreted by Sr isotopes. Water Resour. Res. 32, 707–719. doi: 10.1029/95WR03642
Bailey, S. W., Hornbeck, J. W., Martin, C. W., and Buso, D. C. (1987). Watershed factors affecting stream acidification in the White Mountains of New Hampshire, USA. Environ. Manage. 11, 53–60. doi: 10.1007/BF01867179
Bailey, S. W., McGuire, K. J., Ross, D. S., and Green, M. B. (2019). Hubbard Brook Experimental Forest: Synoptic Surface Water Chemistry, 2015. Environmental Data Initiative. Available at: https://doi.org/10.6073/pasta/fafd7b2334e34a633577764bc36cbb66 (accessed February 22, 2019).
Barnes, M. C., Todd, A. H., Lilja, R. W., and Barten, P. K. (2009). Forests, Water and People: Drinking Water Supply and Forest Lands in the Northeast and Midwest United States. Newtown Square, PA: USDA Forest Service.
Bourgault, R. R. (2014). Hydropedology of Podzols at Hubbard Brook, New Hampshire. Ph.D. dissertation, University of Vermont, Burlington, VT, 182.
Bourgault, R. R., Ross, D. S., and Bailey, S. W. (2015). Chemical and morphological distinctions between vertical and lateral podzolization at Hubbard Brook. Soil Sci. Soc. Am. J. 79, 428–439. doi: 10.2136/sssaj2014.05.0190
Bourgault, R. R., Ross, D. S., Bailey, S. W., Bullen, T. D., McGuire, K. J., and Gannon, J. P. (2017). Redistribution of soil metals and organic carbon via lateral flowpaths at the catchment scale in a glaciated upland setting. Geoderma 307, 238–252. doi: 10.1016/j.geoderma.2017.05.039
Brown, T. C., Hobbins, M. T., and Ramirez, J. A. (2008). Spatial distribution of water supply in the coterminous United States. JAWRA J. Am. Water Resour. Assoc. 44, 1474–1487. doi: 10.1111/j.1752-1688.2008.00252.x
Burton, W. C., Walsh, G. J., and Armstrong, T. R. (2000). Bedrock Geologic Map of the Hubbard Brook Experimental Forest, Grafton County, New Hampshire. Washington, DC: U.S. Department of the Interior.Conley, D. J., Likens, G. E., Buso, D. C., Saccone, L., Bailey, S. W., and Johnson, C. E. (2008). Deforestation causes increased dissolved silicate losses in the Hubbard Brook Experimental Forest. Glob. Change Biol. 14, 2548–2554.
Conrad, O., Bechtel, B., Bock, M., Dietrich, H., Fischer, E., Gerlitz, L., et al. (2015). System for automated geoscientific analyses (SAGA) v. 2.1.4. Geosci. Model Dev. 8, 1991–2007. doi: 10.5194/gmd-8-1991-2015
Detty, J. M., and McGuire, K. J. (2010). Topographic controls on shallow groundwater dynamics: implications of hydrologic connectivity between hillslopes and riparian zones in a till mantled catchment. Hydrol. Process. 24, 2222–2236. doi: 10.1002/hyp.7656
Farmer, V. C., Skjemstad, J. O., and Thompson, C. H. (1983). Generation of humus B horizons in hydromorphic humus podzols. Nature 304, 342–344. doi: 10.1038/304342a0
Federer, C. A., Turcotte, D. E., and Smith, C. T. (1993). The organic fraction-bulk density relationship and the expression of nutrient content in forest soils. Can. J. For. Res. 23, 1026–1032. doi: 10.1139/x93-131
Fitzhugh, R. D., Furman, T., Webb, J. R., Cosby, B. J., and Driscoll, C. T. (1999). Longitudinal and seasonal patterns of stream acidity in a headwater catchment on the Appalachian Plateau, West Virginia, U.S.A. Biogeochemistry 47, 39–62. doi: 10.1007/BF00993096
Gannon, J. P., Bailey, S. W., and McGuire, K. J. (2014). Organizing groundwater regimes and response thresholds by soils: a framework for understanding runoff generation in a headwater catchment. Water Resour. Res. 50, 8403–8419. doi: 10.1002/2014WR015498
Gannon, J. P., Bailey, S. W., McGuire, K. J., and Shanley, J. B. (2015). Flushing of distal hillslopes as an alternative source of stream dissolved organic carbon in a headwater catchment. Water Resour. Res. 51, 8114–8128. doi: 10.1002/2015WR016927
Gannon, J. P., McGuire, K. J., Bailey, S. W., Bourgault, R. R., and Ross, D. S. (2017). Lateral water flux in the unsaturated zone: a mechanism for the formation of saptial soil heterogeneity in a headwater catchment. Hydrol. Process. 31, 3568–3579. doi: 10.1002/hyp.11279
Gillin, C. P., Bailey, S. W., McGuire, K. J., and Gannon, J. P. (2015). Mapping of hydropedologic spatial patterns in a steep headwater catchment. Soil Sci. Soc. Am. J. 79, 440–453. doi: 10.2136/sssaj2014.05.0189
Godsey, S. E., Kirchner, J. W., and Clow, D. W. (2009). Concentration-discharge relationships reflect chemostatic characteristics in US catchments. Hydrol. Process. 23, 1844–1864. doi: 10.1002/hyp.7315
Herndon, E. M., Dere, A. L., Sullivan, P. L., Norris, D., Reynolds, B., and Brantley, S. L. (2015a). Biotic controls on solute distribution and transport in headwater catchments. Hydrol. Earth Syst. Sci. 12, 213–243. doi: 10.5194/hessd-12-213-2015
Herndon, E. M., Dere, A. L., Sullivan, P. L., Norris, D., Reynolds, B., and Brantley, S. L. (2015b). Landscape heterogeneity drives contrasting concentration-discharge relationships in shale headwater catchments. Hydrol. Earth Syst. Sci. 19, 3333–3347. doi: 10.5194/hess-19-3333-2015
Hyman, M. E., Johnson, C. E., Bailey, S. W., Hornbeck, J. W., and April, R. H. (1998). Chemical weathering and cation loss in a base-poor watershed. Geol. Soc. Am. Bull. 110, 85–95. doi: 10.1130/0016-7606(1998)110<0085:CWACLI>2.3.CO;2
Johnson, C. E. (2002). Cation exchange properties of acid forest soils of the northeastern USA. Eur. J. Soil Sci. 53, 271–282. doi: 10.1046/j.1365-2389.2002.00441.x
Johnson, C. E., Johnson, A. H., and Siccama, T. G. (1991). Whole-tree clear-cutting effects on exchangeable cations and soil acidity. Soil Sci. Soc. Am. J. 55, 502–508. doi: 10.2136/sssaj1991.03615995005500020035x
Johnson, N., Driscoll, C. T., Eaton, J. S., Likens, G. E., and McDowell, W. H. (1981). “Acid rain”, dissolved aluminum and chemical weathering at the Hubbard Brook Experimental Forest, New Hampshire. Geochim. Cosmochim. Acta 45, 1421–1437. doi: 10.1016/0016-7037(81)90276-3
Kim, H., Dietrich, W. E., Thurnhoffer, B. M., Bishop, J. K. B., and Fung, I. Y. (2017). Controls on solute concentration-discharge relationships revealed by simultaneous hydrochemistry observations of hillslope runoff and stream flow: the importance of critical zone structure. Water Resour. Res. 53, 1424–1443. doi: 10.1002/2016WR019722
Likens, G. E., Bormann, F. H., Pierce, R. S., Eaton, J. S., and Johnson, N. (1977). Biogeochemistry of A Forested Ecosystem. New York, NY: Springer-Verlag. doi: 10.1007/978-1-4615-9993-7
Likens, G. E., and Buso, D. C. (2006). Variation in streamwater chemistry throughout the Hubbard Brook Valley. Biogeochemistry 78, 1–30. doi: 10.1007/s10533-005-2024-2
Lundström, U. S., van Breemen, N., and Bain, D. (2000). The podzolization process. A review. Geoderma 94, 91–107. doi: 10.1016/S0016-7061(99)00036-1
McGuire, K. J., Torgersen, C. E., Likens, G. E., Buso, D. C., Lowe, W. H., and Bailey, S. W. (2014). Network analysis reveals multiscale controls on streamwater chemistry. Proc. Natl. Acad. Sci. U.S.A. 111, 7030–7035. doi: 10.1073/pnas.1404820111
Palmer, S. M., Wellington, B. I., Johnson, C. E., and Driscoll, C. T. (2005). Landscape influences on aluminium and dissolved organic carbon in streams draining the Hubbard Brook valley, New Hampshire, USA. Hydrol. Process. 19, 1751–1769. doi: 10.1002/hyp.5660
Pellerin, B. A., Fernandez, I. J., Norton, S. A., and Kahl, J. S. (2002). Soil aluminum distribution in the near-stream zone at the Bear Brook watershed in Maine. Water. Air Soil Pollut. 134, 189–204. doi: 10.1023/A:1014115717784
Peralta-Tapia, A., Sponseller, R. A., Ågren, A. M., Tetzlaff, D., Soulsby, C., and Laudon, H. (2015). Scale-dependent groundwater contributions influence patterns of winter baseflow stream chemistry in boreal catchments. J. Geophys. Res. Biogeosci. 120, 847–858. doi: 10.1002/2014JG002878
Phillips, R. A., and Stewart, K. M. (1990). Longitudinal and seasonal water chemistry variations in a northern Appalachian stream. Water Resour. Bull. 26, 489–498. doi: 10.1111/j.1752-1688.1990.tb01387.x
Ronchi, B., Clymans, W., Barao, A. L. P., Vandevenne, F., Struyf, E., Batelaan, O., et al. (2013). Transport of dissolved Si from soil to river: a conceptual mechanistic model. Silicon 5, 115–133. doi: 10.1007/s12633-012-9138-7
Ross, D. S., Bartlett, R. J., Magdoff, F. R., and Walsh, G. J. (1994). Flow path studies in forested watersheds of headwater tributaries of Brush Brook. Vermont. Water Resour. Res. 30, 2611–2618. doi: 10.1029/94WR01490
Sauer, D., Sponagel, H., Sommer, M., Giani, L., Jahn, R., and Stahr, K. (2007). Podzol: soil of the year 2007. A review on its genesis, occurrence, and functions. J. Plant Nutr. Soil Sci. 170, 581–597. doi: 10.1002/jpln.200700135
Sommer, M. (2006). Influence of soil pattern on matter transport in and from terrestrial biogeosystems—A new concept for landscape pedology. Geoderma 133, 107–123. doi: 10.1016/j.geoderma.2006.03.040
Wellington, B. I., and Driscoll, C. T. (2004). The episodic acidification of a stream with elevated concentrations of dissolved organic carbon. Hydrol. Process. 18, 2663–2680. doi: 10.1002/hyp.5574
Keywords: critical zone, streamwater, biogeochemistry, groundwater, soil development, podzolization, mineral weathering, glaciated catchments
Citation: Bailey SW, McGuire KJ, Ross DS, Green MB and Fraser OL (2019) Mineral Weathering and Podzolization Control Acid Neutralization and Streamwater Chemistry Gradients in Upland Glaciated Catchments, Northeastern United States. Front. Earth Sci. 7:63. doi: 10.3389/feart.2019.00063
Received: 27 July 2018; Accepted: 14 March 2019;
Published: 05 April 2019.
Edited by:
Samuel Abiven, University of Zurich, SwitzerlandReviewed by:
Jason Austin, University of Georgia, United StatesPamela L. Sullivan, The University of Kansas, United States
Copyright © 2019 Bailey, McGuire, Ross, Green and Fraser. This is an open-access article distributed under the terms of the Creative Commons Attribution License (CC BY). The use, distribution or reproduction in other forums is permitted, provided the original author(s) and the copyright owner(s) are credited and that the original publication in this journal is cited, in accordance with accepted academic practice. No use, distribution or reproduction is permitted which does not comply with these terms.
*Correspondence: Scott W. Bailey, c3diYWlsZXlAZnMuZmVkLnVz