 Julia S. Mulhern
 Cari L. Johnson
 John M. Martin
- 1Shell International Exploration and Production, New Orleans, LA, United States
- 2Department of Geology and Geophysics, University of Utah, Salt Lake City, UT, United States
- 3Shell International Exploration and Production, Houston, TX, United States
Ancient barrier islands are poorly understood relative to other clastic depositional environments, despite being prominent features along modern coastlines and important for understanding transgressive shoreline deposits. A new dataset of ancient barrier island dimensions (n = 83 examples) addresses this knowledge gap with a quantitative analysis of barrier island sand body dimensions including thickness (vertical), length (shore-parallel direction), and width (shore-perpendicular direction). This dataset of barrier island deposits was compared to planform measurements made for modern islands (n = 274), to investigate possible scaling relationships and other aspects of modern to ancient linkages. These measurements are nuanced and challenging to perform, and first-pass comparisons show that modern barrier islands should not be used as direct analogs for ancient systems. Nevertheless, results emphasize key depositional and preservation processes, and the dimensional differences between deposits formed over geologic vs. modern time scales. Using the methods outlined herein, barrier island deposits appear to be 2-5x longer (p50 modern = 10.7 km; p50 ancient = 20.0 km), and 6–15x wider (p50 modern = 1.2 km; p50 ancient = 7.3 km) than modern barrier islands. We interpret the results to indicate that ancient barrier islands are time-transgressive deposits recording vertical amalgamation, and barrier island growth by lateral accretion, and progradation. When comparing single barrier islands, thickness measurements do not vary systemically between modern and ancient examples, suggesting that local accommodation dictates barrier island thickness as a preservation control. Gross length, width, and thickness measurements are too coarse for robust paleomorphodynamic calculations, therefore more detailed sub-environment analysis (e.g., upper shoreface delineation), with improved facies models, is required before rigorous quantifications can be generated. However, these initial comparisons do show scaling trends between length and width which could be leveraged, with caution, in the interim. As sea levels continue to rise, understanding barrier island motion and preservation will be central to predicting coastal change.
Introduction
Barrier islands are elongate coastal sand bodies which comprise 10% of the world's coastlines (Hoyt, 1967; Oertel, 1985; Stutz and Pilkey, 2011). Modern barrier islands have been thoroughly studied, largely due to their relevance to growing coastal populations and infrastructure (Fisher and Dolan, 1977; Davis, 1994b; Short, 1999; Dronkers, 2005; Dyke, 2007; Anthony, 2009; Moore et al., 2010; McBride et al., 2013). Well-known examples from the U.S. Atlantic and Gulf coasts as well as the Dutch Wadden Sea form the basis of facies models that are used to interpret ancient barrier island deposits (Davies, 1978; Barwis and Hayes, 1979; Reinson, 1979; McCubbin, 1982).
While barrier island deposits have been interpreted for over 80 years, their dimensions have not been rigorously quantified (c.f. Reynolds, 1999). The dimensions of preserved barrier island deposits lend insight into transgressive processes on siliciclastic coastlines (McCubbin, 1982; Cooper et al., 2018a; Jones et al., 2018). Barrier islands commonly form the thickest sandstone units within a transgressive succession, therefore quantifying the range of preserved barrier island dimensions could improve predictions for subsurface hydrocarbon reservoirs (Davies et al., 1971; Reinson, 1992; Reynolds, 1999). Barrier islands will become an increasingly important hydrocarbon reservoir type as exploration expands beyond regressive sequences (Hampson et al., 2004).
Modern coastlines provide a natural laboratory for understanding barrier island processes and dimensions, and therefore are commonly used as analogs to interpret both outcrops and subsurface data (Chiang, 1984; Reinson, 1992; Hubbard et al., 2002; Boyd, 2010). However, the accuracy and effectiveness of analog usage is limited by a lack of dimensional comparisons between modern and ancient barrier islands. Paleomorphodynamics is the broad term for the field of quantitative sedimentology that uses equations and empirical relationships to link and scale modern and ancient depositional systems (Syvitski and Milliman, 2007; Sømme et al., 2009; Blum et al., 2013). Although these relationships have been developed for fluvial (Mohrig et al., 2000; Parker, 2006; Hajek and Wolinsky, 2010; Milliken et al., 2012), deltaic (Edmonds and Slingerland, 2007; Jerolmack and Swenson, 2007; Martin et al., 2018), and deepwater (Pirmez and Imran, 2003; Covault et al., 2012) settings, comparable research in shallow marine settings, including barrier islands, lags behind (cf. Hudock et al., 2014; Lazarus, 2016). For barrier island systems specifically, the modern morphodynamics are a topic of ongoing research (Hayes, 1980; McBride et al., 2013; Short and Jackson, 2013; Cooper et al., 2018a; Mellett and Plater, 2018), however, comparisons to ancient barrier islands are lacking. In developing the dataset presented here, we explore the methods that can be used to measure and compare barrier islands, an initial step toward shallow marine paleomorphodynamics, and, in the process, enhanced understanding of barrier island deposits.
The new dataset helps constrain the range of ancient barrier island dimensions, and was used to assess the feasibility of measurement comparisons between modern and ancient systems. This first order comparison of modern and ancient barrier island systems is used to refine existing models of barrier island motion and preservation. Specifically, we compare the thickness, length, and width of modern and ancient barrier islands. This approach highlights some of the challenges of using modern barrier island measurement data, because truly analogous architectures are not necessarily preserved in the rock record due to processes like ravinement, reworking, and stacking through time (e.g., Hendricks, 1994; Sixsmith et al., 2008). These comparisons also reveal inherent measurement inconsistencies, and terminology problems in barrier island literature. Articulating and highlighting these challenges provides a cautionary message to those using direct analog comparisons, especially for predictive purposes. Although complicated, these results highlight the difference between barrier islands and other depositional settings in terms of paleomorphodynamic potential, and create a starting point for further analysis.
Methods
Database Development
Ancient barrier island dimensions were collected from an extensive literature review (n = 123 publications; Figure 1; Table 1). The database includes studies that use the term “barrier,” or that suggest the preservation of barrier island deposits (e.g., Heward, 1981; Rawn-Schatzinger and Schatzinger, 1993). To establish internal consistency, the depositional environment of each example was assessed and reclassified as needed (Table 1). In straightforward examples, the extent of barrier island deposits was measured or recorded directly from the publication (e.g., Bridges, 1976; Franks, 1980). For more ambiguous examples, however, the sedimentology and geologic context was considered in detail (e.g., Berg, 1976; Guscott et al., 2003). Deposits were interpreted as barrier islands if the preserved shoreface was directly associated with estuarine, lagoon (Davies, 1978), or back barrier deposits, as per widely-used definitions (Oertel, 1985; Otvos, 2012). This designation includes examples of recently drowned barriers on the present day shelf (Mellett et al., 2012; Green et al., 2013, 2018; Salzmann et al., 2013; Cooper et al., 2016, 2018b; Pretorius et al., 2016; Brooke et al., 2017; Mellett and Plater, 2018).
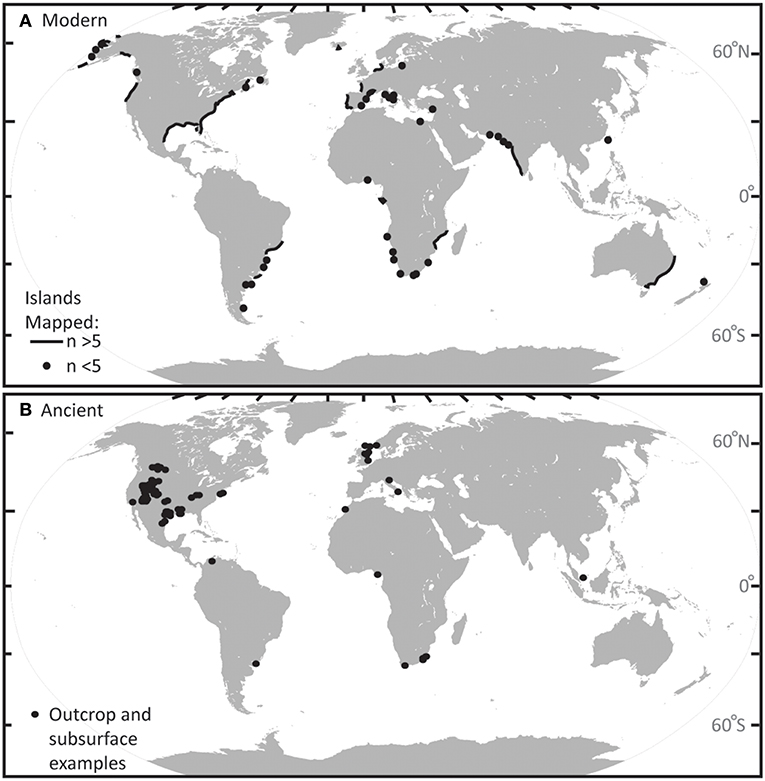
Figure 1. Distribution of modern (A) and ancient (B) barrier islands used in the databases.
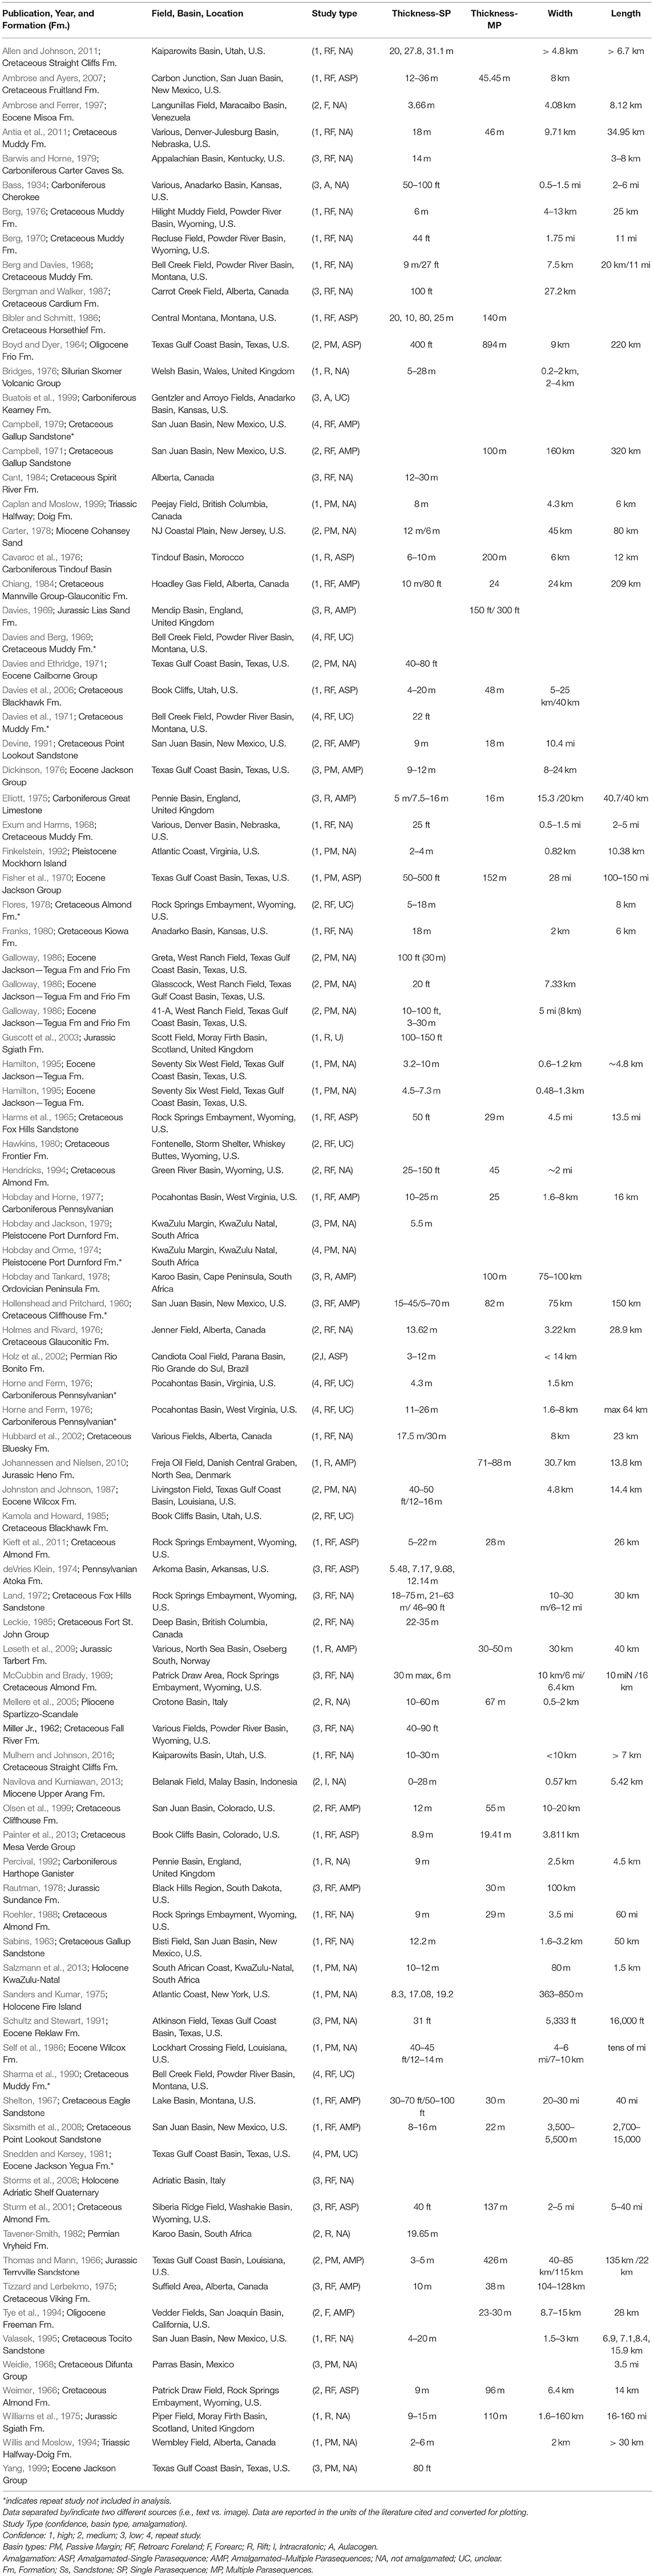
Table 1. Barrier Island dimensions from ancient literature.
Of the 123 total ancient examples documented, 83 were determined to be barrier island deposits (Table 1). Other studies were interpreted as back barriers (n = 1), tidal inlets (n = 3), tidal bars (n = 2), spits (n = 3), strand plains (n = 3), and delta fronts (n = 2), or were designated as uncertain (n = 4), and not included in analysis. Duplicate studies of the same strata and locations (n = 9) were included in the database, but only one value for each unique island deposit was used in this analysis. Barrier islands closely associated with deltas (n = 13) are not included in this analysis because the proximity to deltaic processes likely influences the growth, shape, and preservation statistics of this subset of barrier island systems relative to those developed away from direct fluvial input (Hoyt, 1969; Penland et al., 1988; Penland and Suter, 1989; Van Maren, 2005). Although this is clearly an oversimplification of the processes controlling the interaction between deltaic and barrier island deposits (amalgamation, reworking, etc.), these examples were excluded in this first pass analysis.
Measurements from ancient examples were estimated using scaled figures (e.g., measured sections and maps), or pulled from the text of each publication. Key dimensions (length, width, and thickness) available from each study vary: the majority of examples (56%) have all spatial dimensions measured, whereas 24% have thickness and width, and 14% have only thickness (Figure 2). Maps and cross-sections are stored as images within the database, as are key contextual metadata, including age, location, and nomenclature used to describe the deposits. Each study was given a confidence designation (1-high to 3-low), which indicates the quality of the available data and the confidence in the measurements, high (1) indicates clear and well-supported data, whereas low (3) indicates poorly-supported data or vague figures (Table 1).
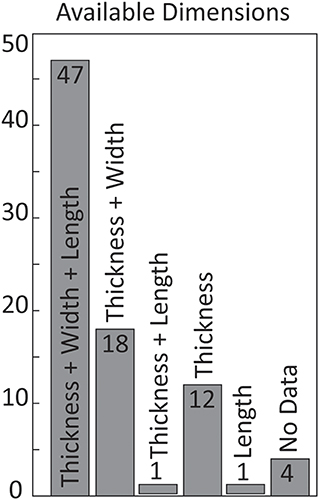
Figure 2. Histogram showing the dimension data available (length, width, and thickness) for the 83 ancient barrier island examples used in analysis.
These ancient barrier island dimensions were compared to a previously generated dataset of planform dimensions of modern barrier islands (n = 274) mapped using Google Earth aerial imagery (Figure 1A; Mulhern et al., 2017). Barrier islands (visibly separated by water on all sides) and spits (partially attached; Oertel, 1985) were mapped by tracing each individual object at the water line along roughly 29,000 km of global coastlines (Figure 1A; Mulhern et al., 2017). The spatial data were combined with thickness values gathered from the literature and measured from core, seismic, and ground penetrating radar studies of Holocene deposits as described below (e.g., Davis, 1994b; Salzmann et al., 2013; Fruergaard et al., 2015).
A key challenge in this approach is that modern examples consist of a single island, whereas ancient examples can have multiple barrier island parasequences preserved, either stacked vertically or en echelon (Figure 3). Here the term parasequence is used to describe a single preserved barrier island shoreface succession, indicating the preservation of a distinct barrier island (Van Wagoner et al., 1988; cf. Arnott, 1995; Catuneanu et al., 2010). More specifically, for this study a parasequence is considered a single, genetically related, stacked successions of depositional enviroments bound by either flooding or ravinement surfaces. To investigate the importance of vertical amalgamation and barrier island stacking, examples with multiple barrier island parasequences were designated as amalgamated if the parasequences are in vertical contact with one another (Figure 3A). When possible, the dimensions of individual island deposits within these amalgamated deposits were measured. If the individual parasequences are not clearly separated, the entire amalgamated succession was measured, and designated as a separate subset. Ancient examples were considered not amalgamated (Figure 3B) if they contain only a single parasequence, or if they contain multiple parasequences which are not in sand-on-sand contact with one another and thus were measured individually.
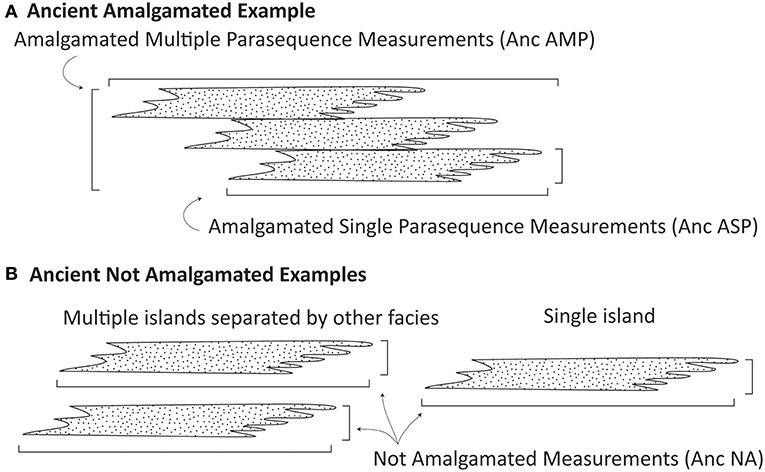
Figure 3. Diagram showing how ancient barrier island examples were separated by amalgamation. The classic coarsening upwards model for a shoreface profile was used to determine and define paraseqeunces. Examples with multiple coarsening upwards progressions stacked vertically were considered amalgamated (A). Examples were designated as amalgamated multiple parasequence (Anc AMP) examples if the boundary between the parasequences was not marked clearly enough for them to be differentiated. Examples that showed amalgamation but single, clear, individual parasequences could be measured were designated as amalgamated single parasequence measurement (Anc ASP). Not amalgamated examples do not have sand-on-sand contact between each coarsening upwards succession (B). These were individually measured and designated as not amalgamated (Anc NA).
Measurement Comparisons
Modern and ancient barrier islands were measured using the most straightforward methods and the most readily available data (Figure 4), but clearly these data are not directly analogous. Subaerial exposure of modern barrier islands is most conducive to measuring through global imagery (e.g., Google Earth). In contrast, the entire shoreface, rather than just the sub-aerial foreshore and dune, is most conducive to measuring ancient examples (Figure 4), because the shoreface is commonly preserved, forms large outcrops (Allen and Johnson, 2011; Kieft et al., 2011), and creates distinct well-log patterns (Tizzard and Lerbekmo, 1975; Willis and Moslow, 1994). Our procedures for collecting database measurements are outlined here (Figure 4), the limitations and implications of which are explored in the discussion.
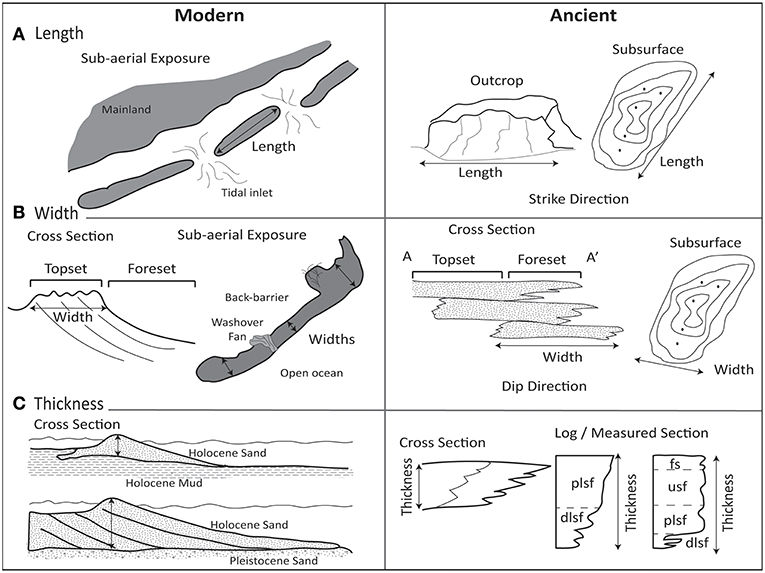
Figure 4. Modern and ancient barrier island measurement methods. Modern lengths (A) are measured along the island centerline parallel to the shoreline from inlet to inlet. Ancient lengths were measured in the strike direction while width are measured in the dip direction. Modern widths (B) are measured in across the island in the shore-perpendicular direction in three locations and averaged. Modern widths represent only the island topset. Ancient width measurements include both the topset and foreset width. Modern thickness (C) measurements were made to the underlying substrate. Ancient thicknesses are measured vertically through the preserved shoreface.
Modern lengths were measured along each island centerline in the shore-parallel direction from one tidal inlet to the next (Figure 4A). While tidal inlet location may be transient, sub-aerial exposure provides a consistent way to measure islands globally and the shore-parallel length of modern islands is used extensively in the morphodynamic literature (McBride et al., 2013; Short and Jackson, 2013). Ancient lengths were measured from one end of the preserved shoreface to the other in the strike (shore-parallel) direction, potentially including or crossing the tidal inlet (Figure 5). If a range of values was evident from the text or figures of a particular example, the range was recorded in the database and a representative value is used for analysis. Examples with tidal channel or tidal inlet deposits associated with the barrier island were included because these facies are often contiguous with the barrier island shoreface facies and thus form part of preserved barrier islands successions (Davies and Ethridge, 1971; Davies, 1978; Flores, 1978; Self et al., 1986). Easily measurable modern planform extent allows us to consider whether or not the sub-aerial expression of the barrier island carries any scaling capability relative to outcrop and subsurface measurements to potentially develop dimensional scaling proxies for the subsurface.
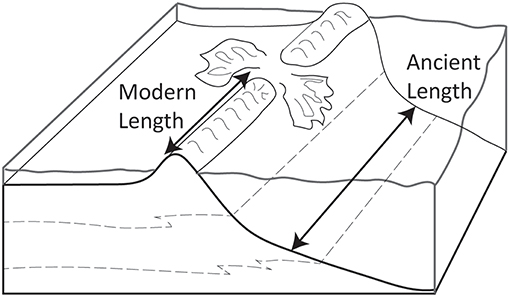
Figure 5. Block diagram showing the conceptual difference between modern and ancient length measurements. Modern lengths are limited by short-term inlet location, whereas ancient lengths can span inlets, recording shore-perpendicular motion through time.
Modern widths were measured in the shore-perpendicular direction in three locations along the length of the island, and averaged. These measurements document the subaerial extent of the island for a single snapshot in time, thus recording the topset width (Figure 4B). In ancient examples, the extent of the preserved shoreface in the dip-direction was measured, documenting both topset and foreset widths (Figure 4B). As such, these measurements reflect the width of the whole barrier island deposit, rather than just the subaerial portion. It is not feasible to measure strictly the subaerial portion of ancient barrier island deposits because the water line moves through time and deposits are potentially subject to removal during ravinement. Additionally, the foreshore is rarely specifically designated in literature examples (Allen and Johnson, 2011; Kieft et al., 2011; Painter et al., 2013). Inversely, subaqueous width measurements for the modern are not feasible at a global scale because they are inhibited by the scarcity of available data and the difficulty in defining, constraining, and documenting the subsurface back-barrier and shoreface boundary without ground penetrating radar or seismic data (Jol et al., 1996; Daly et al., 2002; Wernette et al., 2018). Again, while these measurements are not analogous, their comparison will determine whether the sub-aerial extent can be scaled and used as a proxy for ancient width.
Modern thicknesses were measured vertically from the dune crest to the underlying substrate based on published images and figures (Figure 4C). These values reflect the thickness of multiple shoreface sub-environments (i.e., dune, foreshore, upper shoreface, etc.) depending on the slope of the shoreface and the underlying shelf (Figure 6; Roy et al., 1994). Cores through some modern islands contain a range of depositional environments (e.g., Bernard et al., 1962), while others contain only thin upper shoreface deposits above underlying lagoonal facies (e.g., Belknap and Kraft, 1981).
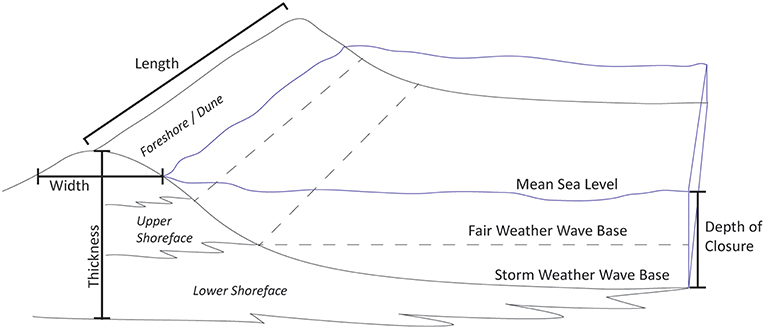
Figure 6. Schematic diagram of a barrier island showing the relationship between the inner and outer depth of closure and fair and storm weather wave base.
Ancient thicknesses were measured vertically through the sandstone portion of preserved barrier island deposits. These thickness measurements also represent variable sub-environments, depending on which portions of the barrier island are preserved (Figure 4C). For example, some outcrops preserve only the upper shoreface (e.g., Mulhern and Johnson, 2016) while others record stacked offshore, lower shoreface, and middle shoreface successions (e.g., Løseth et al., 2009). For examples with multiple barrier island parasequences, the thickness of each individual sequence was measured when possible. In some cases, only the thickness of the entire interval was available, so these examples were given different amalgamation designations (Figure 3) to distinguish the type of measurements recorded.
Although different portions of the barrier island are being measured in modern and ancient settings, the expression of progradation via either topset width (modern) or a dip-oriented shoreface width (ancient) represents a similar process, which is the underlying morphodynamic link between modern and ancient systems. Modern examples with the full island (topset and forest) documented bolster comparisons. This attempt to quantify and compare barrier island features provides an initial focus on the feasibility of such comparisons, as well as insight into barrier island processes and preservation. Direct 1:1 relationships between modern and ancient examples are not expected precisely because of non-stationality. If offsets between the two databases are systematic, however, then there could be predictive scaling relationships between the two. The modern planform expression of barrier islands could be scaled and used to predict ancient dimensions once preservation processes are better understood.
Results
A total of 123 ancient examples were documented and 83 were determined to be barrier island deposits (as described above; Table 1). Gathering and quantifying preserved barrier island dimensions was more difficult than anticipated, highlighting trends and problems with nomenclature as well as potential literature bias. Barrier island studies vary in frequency over time, with 39 studies between 1970 and 1979 compared to 20 studies between 1980 and 1989 (Figure 7). Authors describe the deposits using 29 different terms (Figure 8). Reported barrier island deposits occur mainly in passive margin (n = 42) and retroarc foreland basin (n = 58) settings, relative to other basins [forearc (n = 2), rift (n = 13), intracratonic (n = 3), and aulacogen (n = 4); Figure 9]. The majority of ancient barrier island examples are Mesozoic Western Interior Seaway deposits from the U.S. (n = 32) and Canada (n = 8; Figure 9). A large number are also Tertiary Gulf of Mexico passive margin deposits (n = 14; Figure 9).
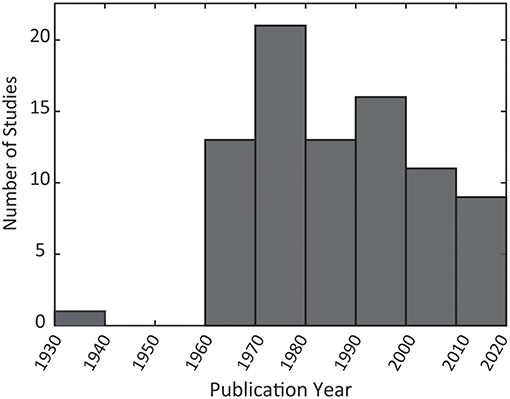
Figure 7. Plot of barrier island studies by publication year showing variable usage over time. All ancient studies determined to be barrier islands (n = 83) included.
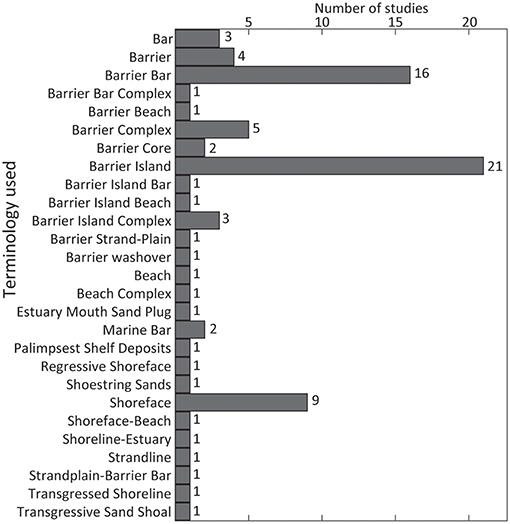
Figure 8. A variety of terminology is used to describe barrier islands. This bar graph shows the prevalence of each term within the database. All ancient studies determined to be barrier islands (n = 83) included.
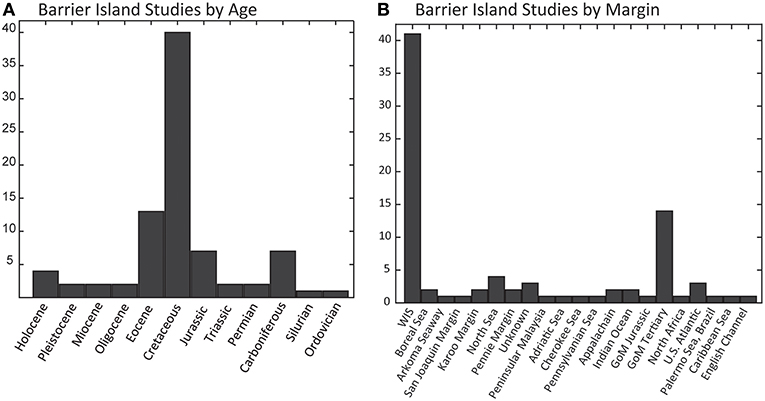
Figure 9. Age (A) and paleo-margin (B) distribution of ancient barrier island studies.
Kernel distributions (Figure 10) of dimensional data show that, using these measurement methods, modern and ancient barrier islands are quantitatively different. Ancient barrier islands are 2–5 times longer (p50 modern = 10.7 km; p50 ancient = 20.0 km), and 6–15 times wider (p50 modern = 1.2 km; p50 ancient = 7.3 km) than modern barrier islands. The median thickness values of the two datasets are similar (p50 modern = 11.0; p50 ancient = 15.2), however, the range of ancient thicknesses is three times greater than the modern range (Figure 10A).
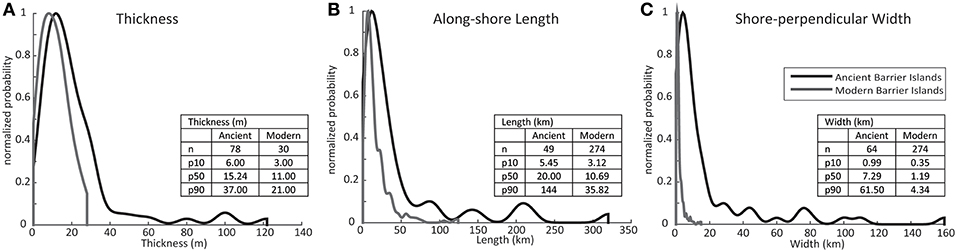
Figure 10. Normalized kernel distributions (non-parametric representations of the probability density function) showing the range of thickness (A), length (B), and width (C) values of modern barrier islands (gray) and ancient barrier islands (black). The lower ten percent (p10), median (p50), and upper ten percent (p90) values are listed for each dimension.
Because of these distinct size differences, modern examples were compared to ancient examples separated by vertical amalgamation. Ancient examples were split into three groups (Figure 3): vertically amalgamated ancient examples with multiple parasequence measurements (Anc AMP), vertically amalgamated ancient examples with single parasequence measurements (Anc ASP), and non-amalgamated ancient examples (Anc NA). Box-and-whisker plots (Figure 11) show that vertically amalgamated ancient examples with multiple sequences (Anc AMP) are significantly thicker (5–10x) and wider (4–20x) than the other groups. Both types of amalgamated ancient examples, i.e., both multiple (Anc AMP; p50 = 40.70 km) and single (Anc ASP; p50 = 26.00 km) parasequence measurements, are longer than non-amalgamated ancient examples (Anc NA; p50 = 14.7) and modern examples (p50 = 10.69; Figure 11B).
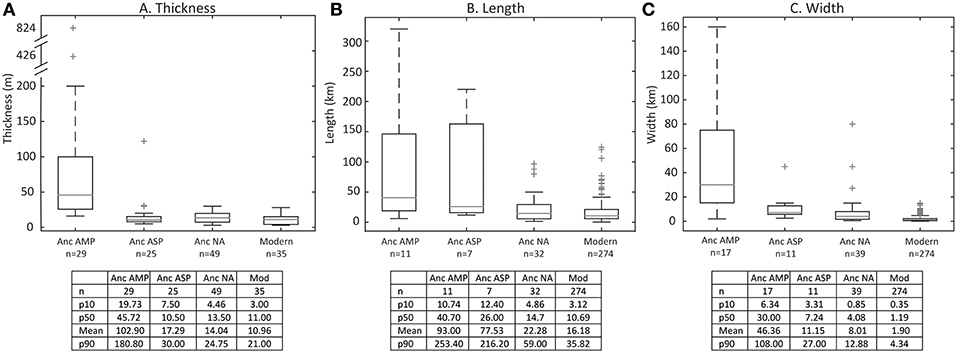
Figure 11. Box-and-whisker plots the ancient data separated as ancient amalgamated multiple parasequence (Anc AMP), ancient amalgamated single parasequence (Anc ASP), ancient not amalgamated (Anc NA) compared to the modern (Mod). While amalgamated ancient examples with multiple parasequences measured (Anc AMP) are larger than the other categories, comparisons between the single parasequence examples (Anc ASP and Anc NA) lend insight into barrier island preservation. Gray lines mark the median. Plus signs mark outliers. The lower ten percent (p10), median (p50), and upper ten percent (p90) values are listed for each dimension.
Cross-plots (Figure 12) were used to compare modern dimensions to non-amalgamated and single parasequence amalgamated ancient examples. Cross-plotting thickness vs. length (Figure 12A) shows direct overlap between the modern and ancient with a single outlier. Cross-plotting thickness vs. width (Figure 12B) shows some overlap between modern and ancient datasets, with the ancient examples skewed toward larger width values. Cross-plotting length vs. width shows a distinct separation between modern and ancient values (Figure 12C). The datasets have unique lines of best fit (Figure 12C) with some overlap of their 90% confidence intervals. Scaling relationships exist between length and width for both modern (R2 = 0.30) and the combined ancient single parasequence data (R2 = 0.51), however, these lines of best fit do not intersect, indicating scaling between the modern and ancient using the offset between these trends.
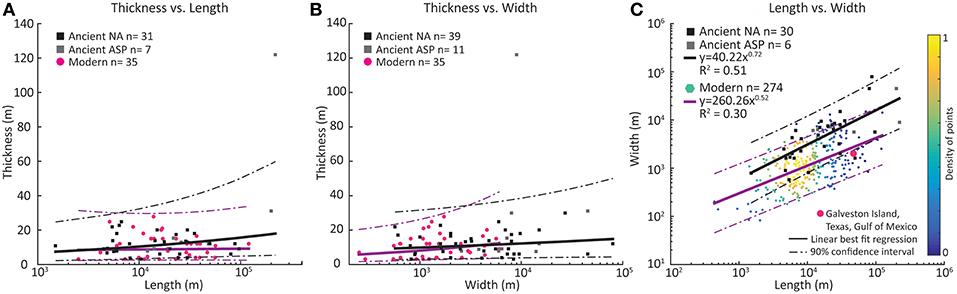
Figure 12. Cross plots of thickness vs. length (A) and thickness vs. width (B) for modern (pink), ancient not amalgamated (NA-black), and ancient amalgamated single parasequences (ASP-gray) barrier island dimensions. Length vs. width (C) cross-plot showing ancient not amalgamated (NA-black), ancient amalgamated single parasequences (ASP-gray), and modern thickness data are colored by density (color bar on right), ranging from more dense data (yellow) to less dense (blue). On all three plots, the solid lines (modern: purple, ancient: black) show the best-fit trend through the data, while the dashed lines show the 10 and 90% confidence limits on the dataset. Galveston Island (pink circle) is large relative to the modern global dataset.
Discussion
Dimensional Comparisons
Initial comparisons using the dataset presented here show that ancient barrier island dimensions are systematically longer, thicker, and wider than modern barrier islands (Figure 10). These results suggest that barrier islands are time-transgressive, underscoring that for barrier islands, the modern is only indirectly the key to the past. At a first order, it is clear that modern barrier island dimensions should not be directly extrapolated to predict subsurface or outcrop dimensions, nor should such interpretations from the rock record be used exclusively to choose modern analogs. Instead, modern to modern and ancient to ancient comparisons are more appropriate and can be informed by the new datasets compiled for this analysis (Table 1; Mulhern et al., 2017). When evaluated from a process-based perspective, this database highlights the challenges associated with making comparable measurements as short time-scale processes are overprinted by geologic time-scale processes. These results reveal the importance of factors such as parasequence stacking, accretion through motion, and post depositional processes like ravinement in ancient barrier island deposits.
The ancient systems documented here are overwhelmingly from the Cretaceous of North America (48%; Figure 9). Many of these ancient barrier island examples were deposited in the high accommodation, high sediment supply setting of the Cordilleran foredeep (DeCelles, 2004) during a monsoonal greenhouse climate (Kauffman, 1977; Dennis et al., 2013). These temperate and high sediment supply conditions are thought to be ideal for modern barrier island development (Hoyt, 1967; Weidie, 1968; Hayes, 1979; Otvos, 2012) which, along with excellent outcrop exposures, accessibility, and subsurface data, could explain the abundance of Western Interior Seaway examples. The prevalence of these examples might suggest that climate should be considered during analog selection, and in developing systematic paleomorphodynamic relationships. A component of the scaling difference described here is likely resulting from the non-ideal comparison between these ancient islands, dominated by examples deposited in Cretaceous greenhouse conditions, and modern examples, formed during current interglacial conditions.
Another factor impacting the ancient database is the historical context of barrier island interpretations, which were most common in the 1960's and 1970's, following a detailed characterization of Galveston Island by Bernard et al. (1962). Interestingly, the database presented here shows that Galveston Island, one of the most heavily cited analogs for ancient barrier island deposits (e.g., Miller, 1962; Shelton, 1967; Davies and Berg, 1969; deVries Klein, 1974; Tizzard and Lerbekmo, 1975; Chiang, 1984; Yoshida et al., 2004; Ambrose and Ayers, 2007) is unusually large compared to the modern global dataset (Figure 12C), and therefore may be a very poor choice as a modern analog for many ancient systems, at least based on scaling relationships.
Barrier island interpretations declined slightly in the 1980's (Figure 7) relative to the previous two decades, which may reflect the proliferation of sequence stratigraphic models during this time. Simple sequence stratigraphic models predict a condensed interval or lag deposits during transgression (Vail et al., 1977; Galloway and Hobday, 1983; Posamentier et al., 1988; Van Wagoner et al., 1988; Cattaneo and Steel, 2003; Coe et al., 2003). Although the processes favoring preservation of transgressive deposits including barrier island-lagoon systems are now recognized, and sequence stratigraphic models are expanding (Jones et al., 2018; Pattison, 2018), a lack of updated facies models likely compounds the terminology problem in barrier island literature (Figure 8). Consequently, barrier island interpretations remain controversial because barrier island motion and preservation are poorly understood (Reinson, 1992; Cooper et al., 2018a). These challenges may explain why some interpretations avoid barrier island terminology and use descriptive but less environmentally-specific “shoreface” nomenclature (Figure 8) to describe shallow marine sandstones deposited during transgression (Allen and Johnson, 2011; Kieft et al., 2011; Olsen et al., 2017). As a result, barrier island deposits are likely under-represented in the last 30 years of geologic literature (Figure 7).
Compiling and comparing modern and ancient barrier islands sheds light on the role of time and preservation in controlling barrier island dimensions, increasing understanding to improve comparisons, interpretations, and predictions. Ancient barrier islands preserve motion at the 105-107 year timescales while modern barrier island motion takes place over 101-103 year timescales (Cooper et al., 2018a). Given that modern barrier islands build landward, seaward, laterally, and vertically (Figure 13), larger dimensions from ancient examples can likely be attributed to motion-driven accretion and/or the stacking of individual islands through time (Ambrose and Ayers, 2007). The stacking and erosional processes that occur at geologic timescales are more complex than the accretion and washover processes dictating barrier island motion at modern time scales. A more detailed look the initial comparisons presented here (Figure 10) sheds light on the processes of barrier island preservation and areas of further study required for the development of robust paleomorphodynamic relationships.
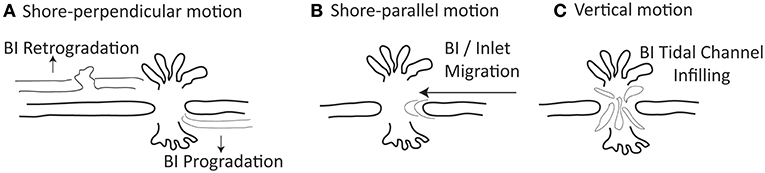
Figure 13. Modern barrier islands are highly ephemeral and display multiple directions of localized motion. Schematic plan-form maps show that (A) barrier islands move in the shore-perpendicular direction through basinward progradation or landward washover processes (Davis, 1994a; Cooper et al., 2018a). (B) Barrier islands move in the shore-parallel direction through tidal inlet migration and accretion driven by long-shore drift (Moslow and Tye, 1985; Hayes and FitzGerald, 2013). (C) Barrier islands build and accrete vertically with sufficient sediment supply and accommodation (Simms et al., 2006).
To investigate the impact of amalgamation and stacking over geologic time, ancient barrier island examples that contain multiple stacked parasequences were separated from those interpreted as a single island (Figure 3). While determining vertical amalgamation is not always straightforward (Figure 14), these comparisons (Figure 11) show that ancient barrier island examples with multiple parasequences are larger (longer, wider, and thicker) than all other examples. This is a logical result given that multiple barrier islands can be stacked and preserved in conjunction with one another as the shoreline shifts over geologic timescales. Nevertheless, the prevalence of not amalgamated (n = 51) relative to amalgamated barrier island examples (n = 32) suggests that both island motion and stacking take place, emphasizing that barrier island accretion and preservation are key considerations for barrier island system evolution (Dickinson et al., 1972; Barwis and Hayes, 1979; Reinson, 1992).
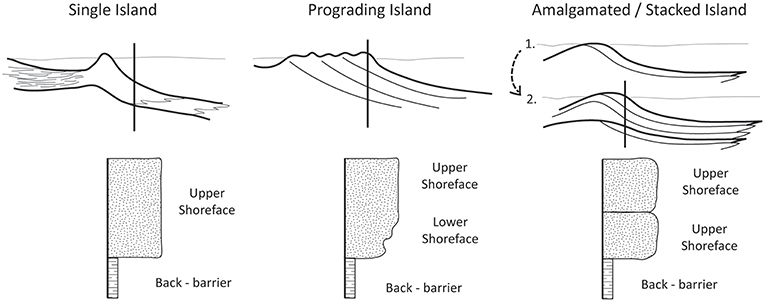
Figure 14. Schematic cross-sections and measured sections through barrier islands at three different stages of amalgamation. These sections illustrate that barrier island amalgamation and reworking likely increases as a function of time, therefore, most preserved barrier islands contain some degree of amalgamation. Additionally, the degree of amalgamation may be difficult to determine due to the similarity in the preserved facies.
Here we discuss both the full dataset results and the results separated by vertical amalgamation for each dimensional measurement (length, width, thickness) to consider the processes dictating those dimensions and the impact of barrier island motion and preservation dynamics.
Thickness
Ancient barrier island examples are thicker than modern examples (Figure 10A). The median thickness values of the two datasets are similar (p50 modern = 11.0 m; p50 ancient = 15.2 m; Figure 10A), however the range of ancient barrier island thicknesses is three times greater than the modern range. The range in ancient barrier island thicknesses could partly reflect measurement uncertainty, given that thickness can vary laterally along strike and that the measurement requires an interpretation of the base of the island deposits (Figure 4). Nevertheless, a logical result is that vertically amalgamated islands with multiple parasequences (Anc AMP; p50 = 45.72 m) are significantly thicker than individual (single) ancient (~6x; Anc ASP; p50 = 10.50 m) and modern (~10x; p50 = 11.00 m) barrier islands (Figure 11A). The thickness of ancient multiple parasequence examples (Anc AMP; p50 = 45.72 m) is likely a function of the available accommodation through time, assuming sufficient sediment supply. In contrast, the other two groups of ancient examples (amalgamated single parasequence (Anc ASP; p50 = 10.50 m) and non-amalgamated (Anc NA; p50 = 13.50 m), are both similar to modern thicknesses (Mod; p50 = 11.00 m), a result that increases confidence in thickness measurements for individual modern and ancient barrier islands. The values likely reflect local accommodation and variability in the depth of closure, which could potentially be used to quantitatively link modern and ancient systems.
Length
Ancient barrier island lengths (p50 ancient = 20 km) are 2–5 times modern lengths (p50 modern = 10.69 km; Figure 10B) demonstrating that, as a whole, ancient islands preserve lateral migration at geologic timescales. When separated by vertical amalgamation (Figure 11B), comparisons show that both multiple (Anc AMP; p50 = 40.70 km) and single (Anc ASP; p50 = 26.00 km) parasequence amalgamated ancient examples are longer than ancient non-amalgamated (Anc NA; p50 = 14.7 km) and modern examples (p50 = 10.69 km).
In addition to the parasequence stacking preserved by the ancient amalgamated multiple parasequence examples, the long lengths of single parasequence amalgamated examples (relative to the modern) demonstrates that barrier island systems can preserve lateral, shore-parallel, accretion, and amalgamation over geologic time. Modern barrier islands move in the shore-parallel direction through tidal inlet migration and island accretion driven by long-shore transport (e.g., recurved spit migration; FitzGerald, 1988; Seminack and McBride, 2015). Evidence of barrier island reworking through inlet generation, migration, and healing, is commonly observed in preserved deposits (Davies and Ethridge, 1971; Davies, 1978; Galloway, 1986; Self et al., 1986; Hendricks, 1994; Mulhern and Johnson, 2016) and these processes likely increase the length of single parasequence amalgamated examples. In addition to lateral migration, if an inlet infills with sand vertically, it can link two separate barrier islands into a single larger one. In some cases, migrating tidal inlet deposits comprise the primary barrier island succession, recording lateral motion of the island across the inlet channel through time (Moslow and Tye, 1985). Alternatively, in some modern examples, the shoreface can extend across the inlet mouth, uninterrupted by inlet process, particularly on wave-dominated coasts where ebb-tidal deltas tend to be smaller and sand is readily reworked across the inlet mouth (Figure 5; Hayes, 1979; FitzGerald et al., 2012). The increased length of ancient examples suggests that barrier island deposits are inherently time-transgressive, recording lateral island motion via tidal inlet migration (lateral accretion) and amalgamation on a different time scale than modern barrier island migration.
Modern (p50 = 10.69 km) and non-amalgamated ancient (Anc NA; p50 = 14.70 km) examples have similar lengths (Figure 11B), however the processes limiting island length in the modern and ancient are different. In modern systems, tidal inlets can limit barrier island length (Figure 4A; Hayes, 1979), and inlet location and frequency can depend on a variety of factors including the tidal range, tidal prism, the location of storm scours or paleovalleys, longshore transport, and spit migration (Phleger, 1969; Hayes and FitzGerald, 2013; Mulhern et al., 2017). These limiting factors are less clear in the rock record, where measurements are derived from the preserved shoreface, which commonly grades laterally from shoreface to tidal facies along the length (strike-direction) of a single island (Figure 5; Davies and Ethridge, 1971; Davies, 1978; Galloway, 1986; Self et al., 1986; Hendricks, 1994; Mulhern and Johnson, 2016). Thus a given inlet location may not be discernable in ancient barrier island systems, and certainly cannot be recognized without very detailed facies analysis (e.g., Reddering, 1983; Caplan and Moslow, 1999). Non-amalgamated ancient examples are more likely limited by the outcrop exposure or type and spacing of available subsurface data. Therefore, while modern and ancient non-amalgamated length values are similar, the large range of values (both modern and ancient) could reflect database limitations rather than an inherent sedimentary process.
Width
Ancient barrier islands are 6–15 times wider (p50 modern = 1.2 km; p50 ancient = 7.3 km) than modern barrier islands (Figure 10C). This large width difference is likely due to both measurement techniques and amalgamation processes. Comparisons separated by amalgamation (Figure 11C) show that ancient amalgamated examples with multiple parasequences (Anc AMP; p50 = 30.00 km) are significantly wider than other ancient examples (4–5x) and modern examples (23x). Similarly, the remaining ancient examples, ancient amalgamated single parasequence (Anc ASP; p50 = 7.24 km) and ancient non-amalgamated examples (Anc NA; p50 = 4.08 km), are both wider than modern examples (Mod; p50 = 1.19 km). The topset vs. foreset widths of some modern examples were measured to understand whether the systematically greater ancient widths are a function of how the width measurements were made, or whether they are geologically significant. In modern settings, the subaerial topset defines the width; in ancient examples, both the topset width and the final foreset width combine to define the preserved width (Figure 4B). In order to better mirror the ancient width scale in the modern, both subaerial topset width and foreset length would need to be measured. Foreset data are quite rare from modern barrier systems, because core studies and data constraining modern barrier island clinothems are sparse. The few complete examples in the modern barrier island database (n = 5) have foresets that are 1.2–4.0 times the topset width (Rampino and Sanders, 1980; Chiang, 1984; Davis and Hayes, 1984; Moslow and Heron, 1994). Ancient examples are 3.4–6.1 times wider than modern examples (based on their mean values). This large difference, compared to the 1.2–4.0 topset vs. foreset difference, suggests that there is more variability than can be explained by measurement differences, indicating that ancient barrier island deposits preserve some shore-perpendicular motion through time.
Further evidence for ancient barrier island motion is manifest in the internal facies patterns of preserved barrier island deposits. Some preserved examples show coarsening and shallowing upwards successions (Sabins, 1963; Land, 1972; Bridges, 1976; Roehler, 1988; Roy et al., 1994; Sixsmith et al., 2008), indicating progradation of the shoreface via Walther's law (Middleton, 1973). Other examples show internal washover processes, suggesting retrogradation ((Hobday and Orme, 1974; Hobday and Jackson, 1979; Willis and Moslow, 1994)a). Because similar processes occur in both modern and ancient systems, the increased relative width of ancient examples suggests that ancient barrier islands are time-transgressive and that the deposit widths record motion at longer time scales than modern barrier island widths. In summary, these comparisons show that the processes occurring at geologic time scales alter the dimensions of ancient barrier islands. Comparisons by amalgamation (Figure 11) emphasize the complexity of barrier island motion and reworking, highlighting the need for an improved understanding of barrier island preservation. Amalgamation and reworking of barrier islands likely increases through time. Barrier islands can be deposited rapidly (Stutz and Pilkey, 2011) resulting in massive and undifferentiated sandbodies lacking internal differentiation. This homogeneity may mask internal sedimentological evidence or trends in grainsize which can be used to interpret parasequence boundaries. Reworking of units through tidal ravinement or lateral motion can complicate the depositional history and overwrite sedimentological evidence of parasequence boundaries within a single deposit. Depending on how islands stack and the degree of ravinement, the preserved vertical sequence of an amalgamated system may look similar to that of a single island or a prograding system. Considering the possible complexities preserved in barrier island deposits highlights the additional research needed to fully understand barrier island preservation, enable modern to ancient analog selection, and develop paleomorphodynamic relationships. As coastlines continue to change in response to the warming climate, a detailed understanding of the role of accommodation, sediment supply, and preservation timescales will be helpful in predicting future coastal morphology and creating effective environmental policy, development plans, and coastal remediation strategies.
While this analysis starts to investigate modern and preserved barrier island dimensions, it does not include a full analysis of the multitude of factors thought to play a role in determining barrier island morphology, which, in addition to those discussed above, include sediment supply, sediment composition, basement slope, and substrate geology (Cooper et al., 2018a). Both datasets, modern and ancient, are comprised of examples from a wide range of sediment supply regimes, therefore the interpretations discussed here can be applied to a variety of settings. Sediment supply in barrier islands is complicated by the intermingling of direct fluvial inputs to the coast line, reworking, long shore transport, and sediment storage offshore, therefore quantifying sediment supply fluctuations and links barrier island motion may be difficult.
Paleomorphodynamic Implications
Cross-plots of length vs. thickness and width vs. thickness (Figures 12A,B) do not show systematic scaling relationships between modern and ancient examples, and therefore are not helpful in developing predictive modern to ancient relationships. This is unsurprising given the various time-based factors influencing the thickness of ancient examples (accretion, stacking, and ravinement) in addition local accommodation and post-depositional erosion. However, thickness similarities between ancient and modern examples could potentially be linked to a process-based control, such as depth of closure.
The depth of closure is vertical height between the mean sea level and storm weather wave base (Figure 6) calculated using wave height, wave period and sediment grain size (Brutsché et al., 2014) and is the depth below which there is no significant net sediment transport (Birkemeier, 1985; Kraus, 1988; Nicholls et al., 1998; Wallace et al., 2010). A variety of time-dependent equations estimate depth of closure for use in modern morphodynamics and hydrodynamics (Hallermeier and Nauman, 1978; Hallermeier, 1981; Birkemeier, 1985; Brutsché et al., 2014), empirically quantifying the limit of storm and wave processes on near shore sediments. Because the depth of closure relates to levels of wave base, it could be used to precisely compare specific portions of modern and ancient barrier island shorefaces. For example, ancient upper and lower shoreface thicknesses could be compared to inner and outer depth of closure values, respectively (Figure 6).
While conceptually straightforward, these comparisons would be difficult to execute because of limited data availability, ambiguity in the rock record, and difficulty in measuring and/or modeling the depth of closure in modern settings (Bernabeu et al., 2003a; Kana et al., 2011). Utilizing depth of closure would require careful consideration because depth of closure is highly variable (both along strike on a given barrier island and through time) and is dependent on the timescale over which it is measured (Bernabeu et al., 2003b; Phillips and Williams, 2007; Wallace et al., 2010). These complexities in determining the depth of closure in the modern would likely be magnified when extrapolating between modern and ancient.
More broadly, the fields of nearshore hydrodynamics and numerical modeling can help to quantify and predict modern barrier island geometries, generating relationships that could be used in paleomorphodynamics. Although imperfect (Cooper and Pilkey, 2004; Cooper et al., 2018a), equilibrium beach profile equations (Bruun, 1962) could be adapted and modified to account for variable erosion rates, impact of storms, and multiple modes of barrier island motion (roll over, erosion, over-stepping) to better estimate shelf morphology and slope to predict available accommodation (Loureiro et al., 2012; Mellett et al., 2012; Cooper et al., 2018a; Mellett and Plater, 2018). Tidal inlet depth (de Swart and Zimmerman, 2009), cross-sectional area (Gao and Collins, 1994; van de Kreeke, 2004), or symmetry (Hoyt and Henry, 1965) calculations could be linked to island characteristics and morphology. Direct comparisons between specific modern and ancient sub-environments (i.e., upper shoreface) could also potentially aid in understanding scaling. Recently drowned barrier island examples on modern shelves may provide clues to understanding the link between the modern and the ancient. Drowned barrier islands have been the focus of ongoing research (Mellett et al., 2012; Green et al., 2013, 2018; Salzmann et al., 2013; Cooper et al., 2016, 2018b; Pretorius et al., 2016; Brooke et al., 2017; Mellett and Plater, 2018). Measurements show that drowned islands are smaller than equivalent modern barriers (Green et al., 2013), emphasizing the importance of understanding timescale and motion processes in linking modern and ancient barrier islands.
Although crossplots using thickness values are not currently insightful, length, and width differences between the modern and ancient realms are significant and persist once multiple amalgamated parasequence examples are removed (Figures 11B,C). Increased lengths and widths of ancient barrier islands suggest that preserved deposits are time-transgressive. Cross-plotting length vs. width highlights the dimensional difference between modern and ancient barrier islands (single parasequence measurements only; Figure 12C). The ancient barrier islands are skewed to longer and wider values relative to the modern examples. There is some overlap in the 90% confidence intervals, however, modern dimensions do not directly predict ancient dimensions because the trend lines of both datasets are offset. These trend lines are predictive (modern R2 = 0.30, ancient R2 = 0.51) meaning that length predicts width and vice versa for both systems for the two datasets independently, but not together. The offset between the lines implies that modern dimensions need to be scaled to be used in subsurface predictions, and vice versa.
In summary, future development of paleomorphodynamic relationships for barrier islands cannot escape the fundamental complication that ancient barrier islands preserve motion through time and post-depositional processes, which dictate their dimensions. In contrast to channelized systems, which are self-organized and display dynamic scaling (Sapozhnikov and Foufoula-Georgiou, 1997; Paola and Foufoula-Georgiou, 2001; Lane, 2006; Martin et al., 2018), the barrier island dynamics are time-scale dependent: processes occurring at short time scales (accretion and washover) vary from those occurring at geologic time scales (amalgamation, stacking, back-stepping, ravinement, reworking). Consequently, ancient barrier island deposits cannot be linked to a single modern snapshot in time. This complexity will influence the way paleomorphodynamics can be developed for the shallow marine realm. This dataset outlines a workflow for quantifying ancient barrier islands and begins quantitative comparison of modern and ancient systems. The significant scaling relationships between length and width (Figure 12C) suggest that rotation and translation could potentially be used to relate the two datasets, pending more data. Although more examples are needed, gathering and measuring ancient barrier island dimensions constrains the range and distribution of dimensional values (Table 1; Figures 11, 12). These examples could be leveraged as analogs for modeling and subsurface predictions and combined with other shallow marine datasets (Colombera et al., 2016; Brooke et al., 2017) to refine paleomorphodynamic comparisons.
Conclusions
Ancient barrier island dimensions are highly variable, ranging widely by age and tectonic and climatic settings. Simple measurement methods are not directly analogous for modern and ancient datasets, therefore unsurprisingly, first pass comparisons show that modern and ancient barrier island dimensions do not scale 1:1. Consequently, modern analog dimensions should not be directly applied to ancient interpretations and predictions, and caution should be used when comparing between ancient examples. First-order comparison of modern and ancient barrier island dimensions shows that ancient barrier island deposits are wider and longer than modern barrier islands, recording lateral and shore-perpendicular motion through time. Thickness differences suggest that ancient barrier island deposits can record vertical stacking of multiple barrier islands through time, emphasizing the role of accommodation in determining barrier island preservation potential. Available accommodation determines the thickness of ancient deposits, rather than the size of the paleo-island. There appear to be systematic shifts in modern vs. ancient barrier island dimensions (length and width), suggesting that ancient barrier island deposits are time-transgressive. These results are a first step toward understanding and quantifying the paleomorphodynamic relationships between modern and ancient barrier islands. The dataset also highlights inconsistencies in barrier island terminology and facies models based on depositional trends, underscoring the need for updated barrier island facies models. Additional research into barrier island facies and preservation processes may provide key insight to predicting how coast lines respond to climate change.
Author Contributions
JSM was the primary author of this paper as it was original research conducted as part of her Ph.D., advised by CLJ. JMM helped with database construction, coding, and analysis. All authors provided input to the methods, interpretation, and writing process.
Funding
A variety of sources funded this original research as part of JSM Ph.D. Her work was supported by the Rocks2Models research consortium with funding from Chevron, ConocoPhillips, Hess Corporation, Shell, and Statoil. Support was also received from University of Utah Graduate Research Fellowship, ConocoPhillips Graduate Research Fellowship, Rocky Mountain Association of Geologists Foundation Babock Scholarship and SEPM Rocky Mountain section Donald Smith Research Grant.
Conflict of Interest Statement
This research was completed while JSM was at the University of Utah. After completing this work JSM became, and is currently, employed by Shell Exploration and Production Company (United States). JMM is employed by Shell Exploration and Production Company (United States).
The remaining author declares that the research was conducted in the absence of any commercial or financial relationships that could be construed as a potential conflict of interest.
References
Allen, J. L., and Johnson, C. L. (2011). Architecture and formation of transgressive-regressive cycles in marginal marine strata of the John Henry Member, straight cliffs formation, Upper Cretaceous of southern Utah, USA. Sedimentology 58, 1486–1513. doi: 10.1111/j.1365-3091.2010.01223.x
Ambrose, W. A., and Ayers, W. B. (2007). Geologic controls on transgressive-regressive cyles in the upper pictured cliffs sandstone and coal geometry in the lower fruitland formation, northern San Juan Basin, New Mexico and Colorado. Am. Assoc. Pet. Geol. Bull. 91, 1099–1122. doi: 10.1306/03080706040
Ambrose, W. A., and Ferrer, E. R. (1997). Seismic stratigraphy and oil recovery potential of tide-dominated depositional sequences in the Lower Misoa Formation (Lower Eocene), LL-652 Area, Lagunillas Field, Lake Maracaibo, Venezuela. Geophysics 62, 1483–1495. doi: 10.1190/1.1444252
Anthony, E. J. (2009). Shore Processes and Their Palaeoenvironmental Applications, 1st Edn. Amsterdam: Elsevier.
Antia, J., Fielding, C. R., and Joeckel, R. M. (2011). Multiple cycles of wave-dominated estuarine deposits in low-accommodation settings, Cretaceous J sandstone, northwestern Nebraska. Am. Assoc. Pet. Geol. Bull. 95, 1227–1256. doi: 10.1306/11051009105
Arnott, R. W. C. (1995). The parasequence definition-are transgressive deposits inadequately addressed? J. Sediment. Res. 65, 1–6. doi: 10.1306/D42681D0-2B26-11D7-8648000102C1865D
Barwis, J. H., and Hayes, M. O. (1979). “Regional patterns of modern barrier island and tidal inlet deposits as applied to paleoenvironmental studies,” in Carboniferous Depositional Environments in the Appalachian Region, eds J. C. Ferm and J. C. Horne (Columbia, SC: University of South Carolina Geology Department), 472–498.
Barwis, J. H., and Horne, J. C. (1979). “Paleotidal range indicators in the carboniferous barriers of northeastern kentucky,” in Carboniferous Depositional Environments in the Appalachian Region, eds J. C. Ferm, J. C. Horne, G. A. Weisenfluh, and J. R. Staub Columbia (Columbia, SC: United States: Univ. S.C., Dep. Geol).
Bass, N. W. (1934). Origin of Bartlesville shoestring sands, Greenwood and Butler Counties, Kansas. Am. Assocation Pet. Geol. Bull. 18, 1313–1345. doi: 10.1306/3D932C7A-16B1-11D7-8645000102C1865D
Belknap, D. F., and Kraft, J. C. (1981). Preservation potential of transgressive coastal lithosomes on the U.S. Atlant. Shelf. Mar. Geol. 42, 429–442. doi: 10.1016/S0070-4571(08)70309-1
Berg, R. R. (1970). Identification of sedimentary environments in reservoir sandstones. Trans. Gulf Coast Assicat. Geol. Soc. 20, 137–143.
Berg, R. R. (1976). Hilight muddy field-lower cretaceous transgressive deposits in the powder river basin, Wyoming. Mt. Geol. 13, 33–45.
Berg, R. R., and Davies, D. (1968). Origin of lower cretaceous muddy sandstone at bell creek field, Montana. Am. Assoc. Pet. Geol. Bull. 52, 1888–1898. doi: 10.1306/5D25C53B-16C1-11D7-8645000102C1865D
Bergman, K. M., and Walker, R. G. (1987). The importance of sea-level fluctuations in the formation of linear conglomerate bodies; carrot creek member of cardium formation, cretaceous western interior seaway, Alberta, Canada. J. Sediment. Res. 57, 651–665. doi: 10.1306/212F8BCA-2B24-11D7-8648000102C1865D
Bernabeu, A. M., Medina, R., and Vidal, C. (2003a). A morphological model of the beach profile integrating wave and tidal influences. Mar. Geol. 197, 95–116. doi: 10.1016/S0025-3227(03)00087-2
Bernabeu, A. M., Medina, R., and Vidal, C. (2003b). Wave reflection on natural beaches: an equilibrium beach profile model. Estuar. Coast. Shelf Sci. 57, 577–585. doi: 10.1016/S0272-7714(02)00393-1
Bernard, H. A., LeBlanc, R. J., and Major, C. F. (1962). “Recent and Pleistocene geology of southeast Texas, Field excursion no. 3,” in Geology of the Gulf Coast and Central Texas and Guidebook of Excursions, eds E. H. Rainwater and R. P. Zingula (Houston, TX: Houston Geological Society), 175–224.
Bibler, C. J., and Schmitt, J. G. (1986). Barrier-island coastline deposition and paleogeographic implications of the upper cretaceous horsethief formation, Northern Disturbed Belt, Montana. Mt. Geol. 23, 113–127.
Birkemeier, W. A. (1985). Field data on seaward limit of profile change. J. Waterw. Port Coast. Ocean Eng. 111, 598–602. doi: 10.1061/(ASCE)0733-950X(1985)111:3(598)
Blum, M., Martin, J., Milliken, K., and Garvin, M. (2013). Paleovalley systems: insights from quaternary analogs and experiments. Earth Sci. Rev. 116, 128–169. doi: 10.1016/j.earscirev.2012.09.003
Boyd, D. R., and Dyer, B. F. (1964). Frio barrier bar system of south Texas. Trans. Gulf Coast. Assoc. Geol. Soc. 14, 309–322.
Boyd, R. (2010). “Transgressive wave-dominated coasts,” in Facies Models 4, eds N. P. James and R. W. Dalrymple (St. John's, NL: Geological Association of Canada), 265–294.
Bridges, P. H. (1976). Lower Silurian transgressive barrier islands, southwest Wales. Sedimentology 23, 347–362. doi: 10.1111/j.1365-3091.1976.tb00054.x
Brooke, B. P., Nichol, S. L., Huang, Z., and Beaman, R. J. (2017). Palaeoshorelines on the Australian continental shelf: morphology, sea-level relationship and applications to environmental management and archaeology. Cont. Shelf Res. 134, 26–38. doi: 10.1016/j.csr.2016.12.012
Brutsché, K. E., Rosati, J., Pollock, C. E., McFall, B. C., Iii, J. R., and Cheryl, E. (2014). Calculating Depth of Closure Using WIS Hindcast Data. US Army Corps Eng. ERDC/CHL C, 1–10.
Buatois, L. A., Mángano, M. G., and Carr, T. R. (1999). Sedimentology and ichnology of Paleozoic estuarine and shoreface reservoirs, Morrow Sandstone, Lower Pennsylvanian of southwest Kansas, USA. Geol. Soc. Bull. 243, 1–35.
Campbell, C. V. (1971). Depositional model: upper cretaceous Gallup beach shoreline, Ship Rock area, northwestern New Mexico. J. Sediment. Res. 41, 395–409. doi: 10.1306/74D7227F-2B21-11D7-8648000102C1865D
Campbell, C. V. (1979). Model for Beach Shoreline in Gallup Sandstone (Upper Cretaceous) of Northwestern New Mexico. Socorro, NM: NM Bur Mines Min. Resour Circ.
Cant, D. J. (1984). Development of shoreline-shelf sand bodies in a Cretaceous epeiric sea deposit. J. Sediment. Petrol. 54, 541–556. doi: 10.1306/212F8463-2B24-11D7-8648000102C1865D
Caplan, M. L., and Moslow, T. F. (1999). Depositional origin and facies variability of a middle triassic barrier island complex, peejay field, northeastern British Columbia. Am. Assoc. Pet. Geol. Bull. 83, 128–154.
Carter, C. H. (1978). A regressive barrier and barrier-protected deposit: depositional environments and geographic setting of the late tertiary cohansey sand. J. Sediment. Res. 48, 933–949. doi: 10.1306/212F75AE-2B24-11D7-8648000102C1865D
Cattaneo, A., and Steel, R. J. (2003). Transgressive deposits: a review of their variability. Earth Sci. Rev. 62, 187–228. doi: 10.1016/S0012-8252(02)00134-4
Catuneanu, O., Bhattacharya, J. P., Blum, M. D., Dalrymple, R. W., Eriksson, P. G., Fielding, C. R., et al. (2010). Sequence stratigraphy: common ground after three decades of development. First Break 28, 21–34. doi: 10.3997/1365-2397.2010002
Cavaroc, V. V., Padgett, G., Stephens, D. G., Kanes, W. H., Boudda, A., and Woolen, I. D. (1976). Late Paleozoic of the Tindouf Basin-North Africa. J. Sediment. Res. 46, 77–88. doi: 10.1306/212F6EC4-2B24-11D7-8648000102C1865D
Chiang, K. K. (1984). “The giant Hoadley gas field, south-central Alberta,” in Elmworth: Case Study of a Deep Basin Gas Field, ed J. A. Masters (Tulsa, OK: American Association of Petroleum Geologists Memior, 38), 297–313.
Coe, A. L., Bosence, D. W., Church, K. D., Flint, S. S., Howell, J. A., and Wilson, R. C. L (eds). (2003). The Sedimentary Record of Sea-Level Change. Cambridge: Cambridge University Press.
Colombera, L., Mountney, N. P., Hodgson, D. M., and McCaffrey, W. D. (2016). The shallow-marine architecture knowledge store: a database for the characterization of shallow-marine and paralic depositional systems. Mar. Pet. Geol. 75, 83–99. doi: 10.1016/j.marpetgeo.2016.03.027
Cooper, J. A. G., Green, A. N., and Loureiro, C. (2018a). Geological constraints on mesoscale coastal barrier behaviour. Glob. Planet. Change 168, 15–34. doi: 10.1016/j.gloplacha.2018.06.006
Cooper, J. A. G., Green, A. N., Meireles, R. P., Klein, A. H. F., Souza, J., and Toldo, E. E. (2016). Sandy barrier overstepping and preservation linked to rapid sea level rise and geological setting. Mar. Geol. 382, 80–91. doi: 10.1016/j.margeo.2016.10.003
Cooper, J. A. G., Meireles, R. P., Green, A. N., Klein, A. H. F., and Toldo, E. E. (2018b). Late quaternary stratigraphic evolution of the inner continental shelf in response to sea-level change, Santa Catarina, Brazil. Mar. Geol. 397, 1–14. doi: 10.1016/j.margeo.2017.11.011
Cooper, J. A. G., and Pilkey, O. H. (2004). Sea-level rise and shoreline retreat: time to abandon the Bruun Rule. Glob. Planet. Change 43, 157–171. doi: 10.1016/j.gloplacha.2004.07.001
Covault, J. A., Shelef, E., Traer, M., Hubbard, S. M., Romans, B. W., and Fildani, A. (2012). Deep-water channel run-out length: insights from seafloor geomorphology. J. Sediment. Res. 82, 21–36. doi: 10.2110/jsr.2012.2
Daly, J., McGeary, S., and Krantz, D. E. (2002). Ground-penetrating radar investigation of a late Holocene spit complex: cape Henlopen, Delaware. J. Coast. Res. 18, 274–286.
Davies, D. K. (1969). Shelf sedimentation: an example from the Jurassic of Britain. J. Sediment. Res. 39, 1344–1370. doi: 10.1306/74D71E29-2B21-11D7-8648000102C1865D
Davies, D. K. (1978). “Models and concepts for exploration in barrier islands,” in Sedimentary Environments and Hydrocarbons, ed R. S. Saxena (New Orleans, LA: Gulf Coast Association of Geological Societies), 79–115.
Davies, D. K., and Berg, R. R. (1969). “Sedimentary characteristics of Muddy barrier-bar reservoir and lagoonal trap at Bell Creek Field,” in The Economic Geology of Eastern Montana and Adjacent Areas 20th Annual Conference 1969 Eastern Montana Symposium Oct 19-22, 1969 (Billings, MT: Montana Geological Society), 97–105.
Davies, D. K., and Ethridge, F. G. (1971). The Claiborne group of central Texas. Trans. Gulf Coast Assoc. Geol. Soc. 21, 115–124.
Davies, D. K., Ethridge, F. G., and Berg, R. R. (1971). Recognition of barrier environments. Am. Assoc. Pet. Geol. Bull. 4, 550–565.
Davies, R., Howell, J., Boyd, R., Flint, S., and Diessel, C. (2006). High-resolution sequence-stratigraphic correlation between shallow-marine and terrestrial strata: examples from the sunnyside member of the cretaceous blackhawk formation, book cliffs, eastern Utah. Am. Assoc. Pet. Geol. Bull. 90, 1121–1140. doi: 10.1306/02210604077
Davis, R. A. Jr. (1994a). “Barrier island systems- a geologic overview,” in Geology of Holocene Barrier Island Systems, ed R. A. Davis Jr. (Berlin: Springer-Verlag), 1–46. doi: 10.1007/978-3-642-78360-9_1
Davis, R. A. Jr., and Hayes, M. O. (1984). What is a wave-dominated coast? Mar. Geol. 60, 313–329. doi: 10.1016/S0070-4571(08)70152-3
de Swart, H. E., and Zimmerman, J. T. F. (2009). Morphodynamics of tidal inlet systems. Annu. Rev. Fluid Mech. 41, 203–229. doi: 10.1146/annurev.fluid.010908.165159
DeCelles, P. G. (2004). Late jurassic to eocene evolution of the Cordilleran thrust belt and foreland basin system, western, U.S.A. Am. J. Sci. 304, 105–168. doi: 10.2475/ajs.304.2.105
Dennis, K. J., Cochran, J. K., Landman, N. H., and Schrag, D. P. (2013). The climate of the late cretaceous: new insights from the application of the carbonate clumped isotope thermometer to Western Interior Seaway macrofossil. Earth Planet. Sci. Lett. 362, 51–65. doi: 10.1016/j.epsl.2012.11.036
Devine, P. E. (1991). Transgressive origin of channeled estuarine deposits in the Point Lookout Sandstone, northwestern New Mexico: a model for Upper Cretaceous, cyclic regressive parasequences of the U.S. Western Interior. Am. Assoc. Pet. Geol. Bull. 75, 1039–1063. doi: 10.1306/0C9B28C1-1710-11D7-8645000102C1865D
deVries Klein, G. (1974). Estimating water depths from analysis of barrier island and deltaic sedimentary sequences. Geology 2:409. doi: 10.1130/0091-7613(1974)2<409:EWDFAO>2.0.CO;2
Dickinson, K. A. (1976). Sedimentary depositional environments of uranium and petroleum host rocks of the Jackson Group, south Texas. J. Res. US Geol. Surv. 4, 615–629.
Dickinson, K. A., Berryhill, H. L., and Holmes, C. W. (1972). “Criteria for recognizing ancient barrier coastlines,” in Recognition of Ancient Sedimentary Environments, eds J. K. Rigby and W. K. Hamblin (Tulsa, OK: SEPM, Special Publication 16), 108–145. doi: 10.2110/pec.72.02.0192
Edmonds, D. A., and Slingerland, R. L. (2007). Mechanics of river mouth bar formation: implications for the morphodynamics of delta distributary networks. J. Geophys. Res. Earth Surf. 112, 1–14. doi: 10.1029/2006JF000574
Elliott, T. (1975). The sedimentary history of a delta lobe from a Yoredale (Carboniferous) cyclothem. Proc. Yorksh. Geol. Soc. 40, 505–536. doi: 10.1144/pygs.40.4.505
Exum, F. A., and Harms, J. C. (1968). Comparison of marine-bar with valley-fill stratigraphic traps, western Nebraska. Am. Assoc. Pet. Geol. Bull. 52, 1851–1868. doi: 10.1306/5D25C537-16C1-11D7-8645000102C1865D
Finkelstein, K. (1992). “Stratigraphy and preservation potential of sediments from adjacent Holocene and Pleistocene barrier-island systems, Cape Charles, Virginia,” in Quaternary Coasts of the United States: Marine and Lacustrine Systems, eds C. H. Fletcher III and J. F. Wehmiller (Tulsa, OK: SEPM Special Publication, 48), 129–140. doi: 10.2110/pec.92.48.0129
Fisher, J. S., and Dolan, R (eds) (1977). Beach Processes and Coastal Hydrodynamics. Stroudsburg, PA: Dowden, Hutchinson & Ross.
Fisher, W. L., Proctor, C. V. Jr., Galloway, W. E., and Nagle, J. S. (1970). Depositional systems in the jackson group of Texas– their relationship to oil, gas, and uranium. Geol. Circ. 70–74, 234–261.
FitzGerald, D. M. (1988). “Shoreline erosional-depositional processes associated with tidal inlets,” in Hydrodynamics and Sediment Dynamics of Tidal Inlets (Washington, DC: AGU), 186–225. doi: 10.1007/978-1-4757-4057-8_11
FitzGerald, D. M., Buynevich, I., and Hein, C. (2012). “Morphodynamics and facies architecture of tidal inlets and tidal deltas,” in Principles of Tidal Sedimentology, eds R. A. Davis, Jr., and R. W. Dalrymple (Dordrecht: Springer Netherlands), 301–333. doi: 10.1007/978-94-007-0123-6_12
Flores, R. M. (1978). Barrier and back-barrier environments of deposition of the upper cretaceous almond formation, Rock Springs Uplift, Wyoming. Mt. Geol. 15, 57–65.
Franks, P. C. (1980). Models of marine transgression - example from Lower Cretaceous fluvial and paralic deposits, north-central Kansas. Geology 8, 56–61. doi: 10.1130/0091-7613(1980)8<56:MOMTEF>2.0.CO;2
Fruergaard, M., Møller, I., Johannessen, P. N., Nielsen, L. H., Andersen, T. J., Nielsen, L., et al. (2015). Stratigraphy, evolution, and controls of a holocene transgressive – regressive barrier island under changing sea level: danish North Sea coast. J. Sediment. Res. 85, 820–844. doi: 10.2110/jsr.2015.53
Galloway, W. E. (1986). Reservoir facies architecture of microtidal barrier systems. Am. Assoc. Pet. Geol. Bull. 70, 787–808. doi: 10.1306/9488634E-1704-11D7-8645000102C1865D
Galloway, W. E., and Hobday, D. K (eds) (1983). Terrigenous Clastic Depositional Systems: Applications to Petroleum, Coal, and Uranium Exploration. New York, NY: Springer-Verlag. doi: 10.1007/978-1-4684-0170-7
Gao, S., and Collins, M. (1994). Tidal inlet equilibrium, in relation to cross-sectional area and sediment transport patterns. Estuar. Coast. Shelf Sci. 38, 157–172. doi: 10.1006/ecss.1994.1010
Green, A. N., Cooper, J. A. G., Leuci, R., and Thackeray, Z. (2013). Formation and preservation of an overstepped segmented lagoon complex on a high-energy continental shelf. Sedimentology 60, 1755–1768. doi: 10.1111/sed.12054
Green, A. N., Cooper, J. A. G., and Salzmann, L. (2018). The role of shelf morphology and antecedent setting in the preservation of palaeo-shoreline (beachrock and aeolianite) sequences: the SE African shelf. Geo-Marine Lett. 38, 5–18. doi: 10.1007/s00367-017-0512-8
Guscott, S., Russell, K., Thickpenny, A., and Poddubiuk, R. (2003). “The Scott Field, Blocks 15/21a, 15/22, UK North Sea,” in United Kingdom Oil and Gas Fields Commemorative Millennium Volume, eds J. G. Gluyas and H. M. Hichens (Geological Society, London, Memoirs, 20), 467–482. doi: 10.1144/GSL.MEM.2003.020.01.38
Hajek, E. A., and Wolinsky, M. A. (2010). Simplified process modeling of river avulsion and alluvial architecture: connecting models and field data. 2.
Hallermeier, R. J. (1981). A profile zonation for seasonal sand beaches from wave climate. Coast. Eng. 4, 253–277. doi: 10.1016/0378-3839(80)90022-8
Hallermeier, R. J., and Nauman, K. E. (1978). “Uses for a calculated limit depth to beach erosion,” in Proceedings of the Coastal Engineering Conference (New York, NY: American Society of Civil Engineers), 1493–1512. doi: 10.1061/9780872621909.090
Hamilton, D. S. (1995). Approaches to identifying reservoir heterogeneity in barrier/strandplain reservoirs and the opportunities for increased oil recovery: an example from the prolific oil-producing Jackson-Yegua trend, south Texas. Mar. Pet. Geol. 12, 273–290. doi: 10.1016/0264-8172(95)98380-N
Hampson, G. J., Sixsmith, P. J., and Johnson, H. D. (2004). A sedimentological approach to refining reservoir architecture in a mature hydrocarbon province: the Brent Province, UK North Sea. Mar. Pet. Geol. 21, 457–484. doi: 10.1016/S0264-8172(03)00094-1
Harms, J. C., MacKenzie, D. B., and McCubbin, D. G. (1965). Depositional Environment of the Fox Hills Sandstone, Near Rock Springs Wyoming. Sediment. Late Cretac. Tert. Outcrops Rock Springs Uplift, 113–130.
Hawkins, C. M. (1980). Barrier bar Sands in the Second Frontier Formation, Green River basin, Wyoming. Guideb. Wyoming Geol. Assoc., 155–161.
Hayes, M. O. (1979). “Barrier island morphology as a function of tidal and wave regime,” in Barrier Islands from the Gulf of Mexico to the Gulf of St. Lawrence, ed S. P. Leatherman (New York, NY: Academic Press), 1–28.
Hayes, M. O. (1980). General morphology and sediment patterns in tidal inlets. Sediment. Geol. 26, 139–156. doi: 10.1016/0037-0738(80)90009-3
Hayes, M. O., and FitzGerald, D. M. (2013). Origin, evolution, and classification of tidal inlets. J. Coast. Res. 69, 14–33. doi: 10.2112/SI_69_3
Hendricks, M. L. (1994). “Ravinement surface control on hydrocarbon accumulation in transgressive systems tracts: Almond Formation, Green River Basin, Wyoming,” in Unconformity Related Hydrocarbons in Sedimentary Sequences, eds J. C. Dolson, M. Hendricks, and W. Westcott (Denver, CO: Rocky Mountain Association of Geologists), 209–218.
Heward, A. P. (1981). A review of wave-dominated clastic shoreline deposits. Earth Sci. Rev. 17, 223–276. doi: 10.1016/0012-8252(81)90022-2
Hobday, D. K., and Horne, J. C. (1977). Tidally influenced barrier island and estuarine sedimentation in the Upper Carboniferous of southern West Virginia. Sediment. Geol. 18, 97–122. doi: 10.1016/0037-0738(77)90007-0
Hobday, D. K., and Jackson, M. P. A. (1979). Transgressive shore zone sedimentation and syndepositional deformation in the Pleistocene of Zululand, South Africa. J. Sediment. Res. 49, 145–158. doi: 10.1306/212F76DA-2B24-11D7-8648000102C1865D
Hobday, D. K., and Orme, A. R. (1974). The port durnford formation. Verh. van die Geol. Ver. van Suid Afrika 77, 141–149.
Hobday, D. K., and Tankard, A. J. (1978). Transgressive-barrier and shallow-shelf interpretation of the lower paleozoic peninsula formation, South Africa. Bull. Geol. Soc. Am. 89, 1733–1744. doi: 10.1130/0016-7606(1978)89<1733:TASIOT>2.0.CO;2
Hollenshead, C. T., and Pritchard, R. I. (1960). “Geometry of producing Mesaverde sandstones, San Juan Basin,” in Geometry of Sandstone Bodies, eds J. A. Peterson and J. C. Osmond (Tulsa, OK: American Association of Petroleum Geologists Special Publication, 22), 98–118.
Holmes, I. G., and Rivard, Y. A. (1976). “A marine barrier island bar, Jenner Field, southeastern Alberta,” in The Sedimentology of Selected Clastic Oil and Gas Reservoirs in Alberta, ed M. M. Lerand (Calgary, AB: Canadian Society of Petroleum Geology), 44–61.
Holz, M., Kalkreuth, W., and Banerjee, I. (2002). Sequence stratigraphy of paralic coal-bearing strata: an overview. Int. J. Coal Geol. 48, 147–179. doi: 10.1016/S0166-5162(01)00056-8
Horne, J. C., and Ferm, J. C. (1976). Carboniferous Depositional Environments in the Pocahontas Basin, eastern Kentucky and southern West Virginia. Columbia, SC: University of South Carolina.
Hoyt, J., and Henry, J.r. V. J (1965). “Significance of inlet sedimentation in the recognition of ancient barrier islands,” in Sedimentation of Late Cretaceous and Tertiary Outcrops, Rock Springs Uplift, eds R. H. DeVoto and R. K. Bitter (Casper, WY: Ninteenth Annual Field Conference Guidebook, Wyoming Geological Association), 190–194.
Hoyt, J. H. (1967). Barrier island formation. Geol. Soc. Am. Bull. 78, 1125–1136. doi: 10.1130/0016-7606(1967)78[1125:BIF]2.0.CO;2
Hoyt, J. H. (1969). Chenier versus barrier, genetic and stratigraphic distinction. Am. Assoc. Pet. Geol. Bull. 53, 299–306. doi: 10.1306/5D25C60D-16C1-11D7-8645000102C1865D
Hubbard, S. M., Gingras, M. K., Pemberton, S. G., and Thomas, M. B. (2002). Variability in wave-dominated estuary sandstones: implications on subsurface reservoir development. Bull. Can. Pet. Geol. 50, 118–137. doi: 10.2113/50.1.118
Hudock, J. W., Flaig, P. P., and Wood, L. J. (2014). Washover fans: a modern geomorphologic analysis and proposed classification scheme to improve reservoir models. J. Sediment. Res. 84, 854–865. doi: 10.2110/jsr.2014.64
Jerolmack, D. J., and Swenson, J. B. (2007). Scaling relationships and evolution of distributary networks on wave-influenced deltas. Geophys. Res. Lett. 34:L23402. doi: 10.1029/2007GL031823
Johannessen, P. N., and Nielsen, L. H. (2010). Architecture of an upper jurassic barrier island sandstone reservoir, Danish Central Graben: implications of a holocene-recent analogue from the Wadden Sea. Pet. Geol. Conf. Ser. 7, 145–155. doi: 10.1144/0070145
Johnston, D. D., and Johnson, R. J. (1987). Depositional and diagenetic controls on reservoir quality in first wilcox Sandstone, Livingston Field, Louisiana. Am. Assoc. Pet. Geol. Bull. 71, 1152–1161. doi: 10.1306/703C8038-1707-11D7-8645000102C1865D
Jol, H. M., Smith, D. G., Meyers, R., Jol, H. M., Smith, D. G., and Meyers, R. a (1996). Digital ground penetrating radar (GPR): a new geophysical tool for coastal barrier research (examples from the Atlantic, Gulf and Pacific Coasts, U.S.A.). J. Coast. Res. 12, 960–968.
Jones, M. T., Dashtgard, S. E., and MacEachern, J. A. (2018). A conceptual model for the preservation of thick, transgressive shoreline successions: examples from the forearc Nanaimo Basin, British Columbia, Canada. J. Sediment. Res. 88, 811–826. doi: 10.2110/jsr.2018.40
Kamola, D. L., and Howard, J. D. (1985). Back Barrier and Shallow Marine Depositional Facies Spring Canyon Member, Blackhawk Formation.
Kana, T. W., Rosati, J. D., and Traynum, S. B. (2011). Lack of evidence for onshore sediment transport from deep water at decadal time scales: Fire Island, New York. J. Coast. Res. 59, 61–75. doi: 10.2112/SI59-007.1
Kauffman, E. G. (1977). Geological and biological overview: western interior cretaceous basin. Mt. Geol. 14, 75–99.
Kieft, R. L., Hampson, G. J., Jackson, C. A. L., and Larsen, E. (2011). Stratigraphic architecture of a net-transgressive marginal- to shallow-marine succession: upper almond formation, rock springs uplift, Wyoming, U.S.A. J. Sediment. Res. 81, 513–533. doi: 10.2110/jsr.2011.44
Kraus, N. C. (1988). “Inlet cross-sectional area calculated by process-based model,” in 26th International Conference on Coastal Engineering (Copenhagen: American Society of Civil Engineers), 3265–3278.
Land, C. B. (1972). Stratigraphy of fox hills sandstone and associated formations, rock springs uplift and Wamsutter Arch area, Sweetwater County, Wyoming: a shoreline-estuary sandstone model for the Late Cretaceous. Q. Color. Sch. Mines 67, 1–69.
Lane, S. N. (2006). “Approaching the system-scale understanding of braided river behaviour,” in Braided Rivers: Processes, Deposits, Ecology, and Management, eds G. H. Sambrook Smith, J. L. Best, C. S. Bristow, and G. E. Petts (Oxford: Special Publication of the International Association of Sedimentologists), 107–135. doi: 10.1002/9781444304374.ch5
Lazarus, E. D. (2016). Scaling laws for coastal overwash morphology. Geophys. Res. Lett. 43, 12,113–12,119. doi: 10.1002/2016GL071213
Leckie, D. (1985). The lower cretaceous notikewin member (Fort St. John Group), northeastern British Columbia: a progradational barrier island system. Bull. Can. Pet. Geol. 33, 39–51.
Løseth, T. M., Ryseth, A. E., Young, M., and Asa, S. (2009). Sedimentology and sequence stratigraphy of the middle Jurassic Tarbert Formation, Oseberg South area (northern North Sea). Basin Res. 21, 597–619. doi: 10.1111/j.1365-2117.2009.00421.x
Loureiro, C., Ferreira, Ó., and Cooper, J. A. G. (2012). Extreme erosion on high-energy embayed beaches: influence of megarips and storm grouping. Geomorphology 139–140, 155–171. doi: 10.1016/j.geomorph.2011.10.013
Martin, J., Fernandes, A. M., Pickering, J., Howes, N., Mann, S., Neil, K. M. C., et al. (2018). The stratigraphically preserved signature of persistent backwater dynamics in a large paleodelta system: the Mungaroo Formation, northwest shelf, Australia. J. Sediment. Res. 88, 850–872. doi: 10.2110/jsr.2018.38
McBride, R. A., Anderson, J. B., Buynevich, I. V., Cleary, W., Fenster, M. S., FitzGerald, D. M., et al. (2013). “Morphodynamics of barrier systems: a synthesis,” in Treatise on Geomorphology: Volume 10 Coastal Geomorphology, ed D. J. Sherman (San Diego, CA: Academic Press), 166–244. doi: 10.1016/B978-0-12-374739-6.00279-7
McCubbin, D. G. (1982). “Barrier-island and strand plain facies,” in Sandstone Depositional Environments, eds P. A. Scholle and D. Spearing (Tulsa, OK: American Association of Petroleum Geologists Memior, 31), 247–279.
McCubbin, D. G., and Brady, M. J. (1969). Depositional environment of the almond reservoirs, Patrick Draw field, Wyoming. Mt. Geol. 6, 3–23.
Mellere, D., Zecchin, M., and Perale, C. (2005). Stratigraphy and sedimentology of fault-controlled backstepping shorefaces, middle pliocene of crotone basin, Southern Italy. Sediment. Geol. 176, 281–303. doi: 10.1016/j.sedgeo.2005.01.010
Mellett, C. L., Hodgson, D. M., Lang, A., Mauz, B., Selby, I., and Plater, A. J. (2012). Preservation of a drowned gravel barrier complex: a landscape evolution study from the north-eastern English Channel. Mar. Geol. 315–318, 115–131. doi: 10.1016/j.margeo.2012.04.008
Mellett, C. L., and Plater, A. J. (2018). “Drowned barriers as archives of coastal-response to sea-leve rise,” in Barrier Dynamics and Response to Changing Climate, eds L. J. Moore and A. B. Murray (Cham: Springer International Publishing), 57–89. doi: 10.1007/978-3-319-68086-6_2
Middleton, G. V. (1973). Johannes Walther's Law of the correlation of facies. Geol. Soc. Am. Bull. 84, 979. doi: 10.1130/0016-7606(1973)84<979:JWLOTC>2.0.CO;2
Miller, Jr D. N (1962). “Patterns of barrier bar sedimentation and its similarity to Lower Cretaceous Fall River Stratigraphy,” in Symposium of Early Cretaceous Rocks of Wyoming and Adjacent Areas 17th Annual Field Conference Guidebook, eds R. L. Enyert and W. H. Curry III (Casper, WY: Wyoming Geological Association), 232–247.
Milliken, K., Blum, M., and Martin, J. (2012). “Scaling relationships in fluvial depostional systems. in Search and Discovery Article #30245,” in American Association of Petroleum Geologists Annual Conference and Exhibition (Long Beach, CA, April 22–25).
Mohrig, D., Heller, P. L., Paola, C., and Lyons, W. J. (2000). Interpreting avulsion process from ancient alluvial sequences: guadalope-matarranya system (northern Spain) and Wasatch Formation (western Colorado). Geol. Soc. Am. Bull. 112, 1787–1803. doi: 10.1130/0016-7606(2000)112<1787:IAPFAA>2.0.CO;2
Moore, L. J., List, J. H., Williams, S. J., and Stolper, D. (2010). Complexities in barrier island response to sea level rise: Insights from numerical model experiments, North Carolina Outer Banks. J. Geophys. Res. Earth Surf. 115, 1–27. doi: 10.1029/2009JF001299
Moslow, T. F., and Heron, S. D. (1994). “The Outer Banks of North Carolina,” in Geology of Holocene Barrier Island Systems, ed R. A. Davis Jr. (Berlin: Springer-Verlag), 47–76. doi: 10.1007/978-3-642-78360-9_2
Moslow, T. F., and Tye, R. S. (1985). Recognition and characterization of Holocene tidal inlet sequences. Mar. Geol. 63, 129–151. doi: 10.1016/0025-3227(85)90081-7
Mulhern, J. S., and Johnson, C. L. (2016). “Time–space variability of paralic strata deposited in a high accommodation, high sediment supply setting: example from the Cretaceous of Utah,” in Geological Society, London, Special Publications, eds G. J. Hampson, A. D. Reynolds, B. Kostic, and M. R. Wells (London, UK: Geological Society, London, Special Publication, 444). doi: 10.1144/SP444.7
Mulhern, J. S., Johnson, C. L., and Martin, J. M. (2017). Is barrier island morphology a function of tidal and wave regime? Mar. Geol. 387, 74–84. doi: 10.1016/j.margeo.2017.02.016
Navilova, H., and Kurniawan, B. A. (2013). “Comparing and contrasting a meandering point bar sequence and barrier island system within the Upper Arang Formation, Belanak Field, West Natuna Basin,” in Proceedings, Indonesian Petroleum Association Thirty-Seventh Annual Convention & Exhibition (Jakarta).
Nicholls, R. J., Larson, M., Capobianco, M., and Birkemeier, W. A. (1998). Depth of closure: improving understanding and prediction. Proc. Coast. Eng. Conf. 3, 2888–2901.
Oertel, G. F. (1985). The barrier island system. Mar. Geol. 63, 1–18. doi: 10.1016/0025-3227(85)90077-5
Olsen, H., Briedis, N. A., and Renshaw, D. (2017). Sedimentological analysis and reservoir characterization of a multi-darcy, billion barrel oil field – The Upper Jurassic shallow marine sandstones of the Johan Sverdrup field, North Sea, Norway. Mar. Pet. Geol. 84, 102–134. doi: 10.1016/j.marpetgeo.2017.03.029
Olsen, T. R., Mellere, D., and Olsen, T. (1999). Facies architecture and geometry of landward-stepping shoreface tongues: the Upper Cretaceous Cliff House Sandstone (Mancos Canyon, south-west Colorado). Sedimentology 46, 603–625. doi: 10.1046/j.1365-3091.1999.00234.x
Otvos, E. G. (2012). Coastal barriers - nomenclature, processes, and classification issues. Geomorphology 139–140, 39–52. doi: 10.1016/j.geomorph.2011.10.037
Painter, C. S., York-Sowecke, C. C., and Carrapa, B. (2013). Sequence stratigraphy of the upper cretaceous sego sandstone member reveals spatio-temporal changes in depositional processes, northwest Colorado, U.S.A. J. Sediment. Res. 83, 323–338. doi: 10.2110/jsr.2013.21
Paola, C., and Foufoula-Georgiou, E. (2001). “Statistical geometry and dynamics of braided rivers,” in Gravel Bed Rivers V, ed M. P. Mosley (Wellington: New Zealand Hydrological Society), 47–69.
Parker, G. (2006). 1D Sediment Transport Morphodynamics With Applications to Rivers And Turbidity Currents. University of Illinois Available online at: http://hydrolab.illinois.edu/people/parkerg//morphodynamics_e-book.htm?q=people/parkerg/morphodynamics_e-book.htm
Pattison, S. A. J. (2018). Using classic outcrops to revise sequence stratigraphic models: reevaluating the Campanian Desert Member (Blackhawk Formation) to lower Castlegate Sandstone interval, Book Cliffs, Utah and Colorado, USA. Geology 46, 1–4. doi: 10.1130/G45592.1
Penland, S., Boyd, R., and Suter, J. R. (1988). Transgressive depositional systems of the Mississippi Delta plain. J. Sediment. Petrol. 58, 932–949.
Penland, S., and Suter, J. R. (1989). The geomorphology of the Mississippi River chenier plain. Mar. Geol. 90, 231–258. doi: 10.1016/0025-3227(89)90127-8
Percival, C. J. (1992). The Harthope Ganister; a transgressive barrier island to shallow-marine sand-ridge from the Namurian of northern England. J. Sediment. Res. 62, 442–454. doi: 10.1306/D426791F-2B26-11D7-8648000102C1865D
Phillips, M. R., and Williams, A. T. (2007). Depth of closure and shoreline indicators: empirical formulae for beach management. J. Coast. Res. 232, 487–500. doi: 10.2112/05-0593.1
Phleger, F. B. (1969). “Some general features of coastal lagoons,” in Coastal Lagoons, A Symposium: Memoir of the International Symposium on Coastal Lagoons, eds F. B. Phleger and A. A. Castañares (Mexico City: Universidad nacional autónoma de México), 5–26.
Pirmez, C., and Imran, J. (2003). Reconstruction of turbidity currents in Amazon Channel. Mar. Pet. Geol. 20, 823–849. doi: 10.1016/j.marpetgeo.2003.03.005
Posamentier, H. W., Jervey, M. T., and Vail, P. R. (1988). “Eustatic controls on clastic deposition I - conceptual framework,” in Sea-Level Changes: An Integrated Approach, eds C. K. Wilgus, B. S. Hastings, H. W. Posamentier, J. C. Van Wagoner, C. A. Ross, and C. G. S. C. Kendall (Tulsa, OK: SEPM Special Publication, 42), 109–124. doi: 10.2110/pec.88.01.0109
Pretorius, L., Green, A., and Cooper, A. (2016). Submerged shoreline preservation and ravinement during rapid postglacial sea-level rise and subsequent “slowstand.” Geol. Soc. Am. Bull. 128, 1059–1069. doi: 10.1130/B31381.1
Rampino, M. R., and Sanders, J. E. (1980). Evolution of the barrier: islands of southern Long Island, New York. Sedimentology 28, 37–47. doi: 10.1111/j.1365-3091.1981.tb01661.x
Rautman, C. A. (1978). Sedimentology of late Jurassic barrier-island complex; lower sundance formation of black hills. Am. Assoc. Pet. Geol. Bull. 62, 2275–2289. doi: 10.1306/C1EA53D2-16C9-11D7-8645000102C1865D
Rawn-Schatzinger, V., and Schatzinger, R. A. (1993). Annotated Bibliography of Selected References on Shoreline Barrier Island Deposits With Emphasis on Patrick Draw Field, Sweetwater County, Wyoming. Bartlesville, OK: ITT Research Institute, U.S. Department of Energy, Technical Report, NIPER-622.
Reddering, J. S. V. (1983). An inlet sequence produced by migration of a small microtidal inlet against longshore drift: the Keurbooms Inlet, South Africa. Sedimentology 30, 201–218. doi: 10.1111/j.1365-3091.1983.tb00665.x
Reinson, G. E. (1979). “Barrier island systems,” in Facies Models, ed R. G. Walker (Toronto, ON: Geosciences Canada), 57–74.
Reinson, G. E. (1992). “Transgressive barrier island and estuarine systems,” in Facies Models: Response to Sea-Level Changes, eds R. G. Walker and N. P. James (St. John's, NL: Geological Association of Canada), 179–194.
Reynolds, A. D. (1999). Dimensions of paralic sandstone bodies. Am. Assoc. Pet. Geol. Bull. 83, 211–229. doi: 10.1306/00AA9A48-1730-11D7-8645000102C1865D
Roehler, H. W. (1988). The Pintail Coal Bed and Barrier Bar G - a Model for Coal of Barrier Bar - Lagoon Origin, Upper Cretaceous Almond Formation, Rock Springs Coal Field, Wyoming. U.S. Geol. Surv. Prof. Pap. 1398. doi: 10.3133/pp1398
Roy, P. S., Cowell, P. J., Fernland, M. A., and Thom, B. G. (1994). “Wave-dominated coasts,” in Coastal Evolution: Late Quaternary Shoreline Morphodynamics, eds R. W. G. Carter and C. D. Woodroffe (Cambridge: Cambridge University Press), 121–186. doi: 10.1017/CBO9780511564420.006
Sabins Jr, F. F. (1963). Anatomy of stratigraphic trap, Bisti field, New Mexico. Am. Assocation Pet. Geol. Bull. 47, 193–228. doi: 10.1306/BC74397F-16BE-11D7-8645000102C1865D
Salzmann, L., Green, A., and Cooper, J. A. G. (2013). Submerged barrier shoreline sequences on a high energy, steep and narrow shelf. Mar. Geol. 346, 366–374. doi: 10.1016/j.margeo.2013.10.003
Sanders, J. E., and Kumar, N. (1975). Evidence of shoreface retreat and in-place “drowning” during Holocene submergence of barriers, shelf off Fire Island, New York. Geol. Soc. Am. Bull. 86, 65–76. doi: 10.1130/0016-7606(1975)86<65:EOSRAI>2.0.CO;2
Sapozhnikov, V., and Foufoula-Georgiou, E. (1997). Experimental evidence of dynamic scaling and indications of self organized criticality in braided rivers. Water Resour. Res. 33, 1983–1991. doi: 10.1029/97WR01233
Schultz, A. L., and Stewart, G. F. (1991). Atkinson field: barrier bar or channel-fill sandstone? Evidence from geologic well-log analysis. Bull. South Texas Geol. Soc. 31, 11–36.
Self, G. A., Breard, S. Q., Rael, H. P., Stein, J. A., Thayer, P. A., Traugott, M. O., et al. (1986). Lockhart crossing field: new Wilcox Trend in Southeastern Louisiana. Am. Assoc. Pet. Geol. Bull. 70, 501–515.
Seminack, C. T., and McBride, R. A. (2015). Geomorphic history and diagnostic features of former tidal inlets along Assateague Island, Maryland-Virginia: a life-cycle model for inlets along wave-dominated barrier islands. Shore Beach 83, 3–24.
Sharma, B., Honarpo, J. S. R., Schatzinger, R. A., and Tomutsa, L. (1990). Determining the productivity of a barrier island sandstone deposit from integrated facies analysis based on log and core data and fluid production. SPE Formation Eval. 133–148. doi: 10.2118/19584-PA
Shelton, J. W. (1967). Stratigraphic models and general criteria for recognition of alluvial, barrier-bar, and turbidity-current sand deposits. Am. Assoc. Pet. Geol. Bull. 51, 2441–2461. doi: 10.1306/5D25C27F-16C1-11D7-8645000102C1865D
Short, A. D (ed.). (1999). Handbook of Beach and Shoreface Morphodynamics. Chichester: John Wiley & Sons.
Short, A. D., and Jackson, D. W. T. (2013). “10.5 Beach Morphodynamics,” in Coastal Geomorphology, ed J. F. Shroder (San Diego, CA: Academic Press), 106–129. doi: 10.1016/B978-0-12-374739-6.00275-X
Simms, A. R., Anderson, J. B., and Blum, M. (2006). Barrier-island aggradation via inlet migration: Mustang Island, Texas. Sediment. Geol. 187, 105–125. doi: 10.1016/j.sedgeo.2005.12.023
Sixsmith, P. J., Hampson, G. J., Gupta, S., Johnson, H. D., and Fofana, J. F. (2008). Facies architecture of a net transgressive sandstone reservoir analog: the Cretaceous Hosta Tongue, New Mexico. Am. Assoc. Pet. Geol. Bull. 92, 513–547. doi: 10.1306/01020807017
Snedden, J. W., and Kersey, D. G. (1981). Origin of the San Miguel lignite deposit and associated lithofacies, Jackson Group, south Texas. Am. Assoc. Pet. Geol. Bull. 65, 1099–1109. doi: 10.1306/03B59602-16D1-11D7-8645000102C1865D
Sømme, T. O., Helland-hansen, W., Martinsen, O. J., Thurmond, J. B., Sømme, T. O., Helland-hansen, W., et al. (2009). Relationships between morphological and sedimentological parameters in source-to-sink systems: a basis for predicting semi-quantitative characteristics in subsurface systems. Basin Res. 21, 361–387. doi: 10.1111/j.1365-2117.2009.00397.x
Storms, J. E. A., Weltje, G. J., Terra, G. J., Cattaneo, A., and Trincardi, F. (2008). Coastal dynamics under conditions of rapid sea-level rise: Late Pleistocene to Early Holocene evolution of barrier-lagoon systems on the northern Adriatic shelf (Italy). Quat. Sci. Rev. 27, 1107–1123. doi: 10.1016/j.quascirev.2008.02.009
Sturm, S., Evans, L., Keusch, B., and Clark, W. (2001). “Almond Formation reservoir characterization and sweet spot analysis in Siberia Ridge field, Wyoming,” in Gas in the Rockies, ed D. Anderson (Denver, CO: Rocky Mountain Association of Geologists), 145–170.
Stutz, M. L., and Pilkey, O. H. (2011). Open-ocean barrier islands: global influence of climatic, oceanographic, and depositional settings. J. Coast. Res. 27, 207–222. doi: 10.2112/09-1190.1
Syvitski, J. P. M., and Milliman, J. D. (2007). Geology, geography, and humans battle for dominance over the delivery of fluvial sediment to the coastal ocean. J. Geol. 115, 1–19. doi: 10.1086/509246
Tavener-Smith, R. (1982). Prograding coastal facies associations in the Vryheid formation (Permian) at Effingham quarries near Durban, South Africa. Sediment. Geol. 32, 111–140. doi: 10.1016/0037-0738(82)90017-3
Thomas, W. A., and Mann, C. J. (1966). Late Jurassic depositional environments, Louisiana and Arkansas. Am. Assoc. Pet. Geol. Bull. 50, 178–182. doi: 10.1306/5D25B47B-16C1-11D7-8645000102C1865D
Tizzard, P. G., and Lerbekmo, J. F. (1975). Depositional history of the Viking Formation, Suffield area, Alberta, Canada. Bull. Can. Pet. Geol. 22, 715–752.
Tye, R. S., Hewlett, J. S., Thompson, P. R., and Goodman, D. K. (1994). “Integrated stratigraphic and depositional-facies analysis of parasequences in a transgressive systems tract, San Joaquin Basin, California,” in Siliciclastic Sequence Stratigraphy: Recent Developments and Applications, eds P. Weimer and H. W. Posamentier (Tulsa, OK: American Association of Petroleum Geologists, Memior, 58), 99–133.
Vail, P. R., Mitchum, J.r., R. M., and Thompson III, S. (1977). “Seismic stratigraphy and global changes of sea level, part 3: relative changes of sea level from coastal onlap,” in Seismic Stratigraphy: Applications to Hydrocarbon Exploration, ed. C. E. Payton (American Association of Petroleum Geologists Memior, 26), 63–81.
Valasek, D. (1995). “The Tocito Sandstone in a sequence stratigraphic framework: an example of landward-stepping small-scale genetic sequences,” in Sequence Stratigraphy of Foreland Basin Deposits, eds J. C. Van Wagoner and G. T. Bertram (Tulsa, OK: American Association of Petroleum Geologists Memior, 64), 349–369.
van de Kreeke, J. (2004). Equilibrium and cross-sectional stability of tidal inlets: Application to the Frisian Inlet before and after basin reduction. Coast. Eng. 51, 337–350. doi: 10.1016/j.coastaleng.2004.05.002
Van Maren, D. S. (2005). Barrier formation on an actively prograding delta system: the Red River Delta, Vietnam. Mar. Geol. 224, 123–143. doi: 10.1016/j.margeo.2005.07.008
Van Wagoner, J. C., Posamentier, H. W., Mitchum, R. M., Vail, P. R., Sarg, J. F., Loutit, T. S., et al. (1988). “An overview of the fundamentals of sequence stratigraphy and key definitions,” in Sea-level Changes: An integrated approach, eds C. K. Wilgus, H. W. Posamentier, C. K. Ross, and C. G. Kendall (Tulsa, OK: SEPM Special Publication, 42), 39–45. doi: 10.2110/pec.88.01.0039
Wallace, D. J., Anderson, J. B., and Fernández, R. A. (2010). Transgressive ravinement versus depth of closure: a geological perspective from the upper Texas coast. J. Coast. Res. 26, 1057–1067. doi: 10.2112/JCOASTRES-D-10-00034.1
Weidie, A. E. (1968). Bar and barrier island sands. Trans. Gulf Coast Assoc. Geol. Soc. 18, 405–415.
Weimer, R. J. (1966). Time-stratigraphic analysis and petroleum accumulations, Patrick Draw Field, Sweetwater County, Wyoming. Am. Assoc. Pet. Geol. Bull. 50, 2150–2175. doi: 10.1306/5D25B713-16C1-11D7-8645000102C1865D
Wernette, P. A., Houser, C., Weymer, B. A., Everett, M. E., Bishop, M. P., and Reece, B. (2018). Directional dependency and coastal framework geology: implications for barrier island resilience. Earth Surf. Dynam. 6, 1139–1153. doi: 10.5194/esurf-6-1139-2018
Williams, J. J., Conner, D. C., and Peterson, K. E. (1975). Piper Oil Field, North Sea: fault-block structure with Upper Jurassic beach/bar reservoir sands. Am. Assoc. Pet. Geol. Bull. 59, 1585–1601. doi: 10.1306/83D9200A-16C7-11D7-8645000102C1865D
Willis, A. J., and Moslow, T. F. (1994). Stratigraphic setting of transgressive barrier-island reservoirs with an example from the Triassic Halfway Formation, Wembley Field, Alberta, Canada. Am. Assoc. Pet. Geol. Bull. 78, 775–791. doi: 10.1306/A25FE3B5-171B-11D7-8645000102C1865D
Yang, W. (1999). Stratigraphic Architecture and Dynamic Evolution of Barrier Bar-Lagoon Depositional Systems, Eocene Jackson Group, Duval County, South Texas. Gulf Coast Assoc. Geol. Soc. Trans. XLIX.
Yoshida, S., Johnson, H. D., Pye, K., and Dixon, R. J. (2004). Transgressive changes from tidal estuarine to marine embayment depositional systems: the Lower Cretaceous Woburn Sands of southern England and comparison with Holocene analogs. Am. Assoc. Pet. Geol. Bull. 88, 1433–1460. doi: 10.1306/05140403075
Keywords: paleomorphodynamics, barrier island, scaling relationships, accommodation, shallow marine, dimension prediction, modern analog, transgressive
Citation: Mulhern JS, Johnson CL and Martin JM (2019) Modern to Ancient Barrier Island Dimensional Comparisons: Implications for Analog Selection and Paleomorphodynamics. Front. Earth Sci. 7:109. doi: 10.3389/feart.2019.00109
Received: 23 January 2019; Accepted: 26 April 2019;
Published: 17 May 2019.
Edited by:
Amanda Owen, University of Glasgow, United KingdomReviewed by:
Andrew Green, University of KwaZulu-Natal, South AfricaJorge Lorenzo-Trueba, Montclair State University, United States
Copyright © 2019 Mulhern, Johnson and Martin. This is an open-access article distributed under the terms of the Creative Commons Attribution License (CC BY). The use, distribution or reproduction in other forums is permitted, provided the original author(s) and the copyright owner(s) are credited and that the original publication in this journal is cited, in accordance with accepted academic practice. No use, distribution or reproduction is permitted which does not comply with these terms.
*Correspondence: Julia S. Mulhern, anVsaWFtdWxoZXJuNUBnbWFpbC5jb20=