 Stephen Brough
 J. Rachel Carr
 Neil Ross
 James M. Lea
- 1School of Geography, Politics and Sociology, Newcastle University, Newcastle upon Tyne, United Kingdom
- 2Department of Geography and Planning, School of Environmental Sciences, University of Liverpool, Liverpool, United Kingdom
Kangerlussuaq Glacier is one of Greenland’s largest tidewater outlet glaciers, accounting for approximately 5% of all ice discharge from the Greenland ice sheet. In 2018 the Kangerlussuaq ice front reached its most retreated position since observations began in 1932. We determine the relationship between retreat and: (i) ice velocity; and (ii) surface elevation change, to assess the impact of the retreat on the glacier trunk. Between 2016 and 2018 the glacier retreated ∼5 km and brought the Kangerlussuaq ice front into a major (∼15 km long) overdeepening. Coincident with this retreat, the glacier thinned as a result of near-terminus acceleration in ice flow. The subglacial topography means that 2016–2018 terminus recession is likely to trigger a series of feedbacks between retreat, thinning, and glacier acceleration, leading to a rapid and high-magnitude increase in discharge and sea level rise contribution. Dynamic thinning may continue until the glacier reaches the upward sloping bed ∼10 km inland of its current position. Incorporating these non-linear processes into prognostic models of the ice sheet to 2100 and beyond will be critical for accurate forecasting of the ice sheet’s contribution to sea level rise.
Introduction
The Greenland ice sheet is a major source of global sea level rise and contributed 171 Gt a−1 (∼0.47 ± 0.23 mm a−1) to sea level rise between 1991 and 2015 (van den Broeke et al., 2016). Mass loss has accelerated since the mid-1990s and coincided with both elevated atmospheric temperatures (e.g., Hanna et al., 2012) and warmer oceanic waters reaching marine-terminating glacier margins (e.g., Straneo and Heimbach, 2013). Approximately 40% of Greenland’s mass loss since 1991 was due to increased ice discharge from marine-terminating outlet glaciers and it accounted for ∼60% of ice loss during the phase of rapid outlet glacier retreat observed between 2000 and 2005 (Rignot and Kanagaratnam, 2006; Enderlin et al., 2014; Andersen et al., 2015; van den Broeke et al., 2016). As such, predictions of ice discharge from Greenland’s marine-terminating outlet glaciers are critical for forecasting near-future sea level rise. Despite their importance, substantial uncertainty remains over the response of Greenland’s outlet glacier to climatic and oceanic warming (e.g., Carr et al., 2013; Enderlin et al., 2013; Stocker et al., 2013). This response is complicated by glacier-specific factors, particularly the bed and fjord geometry, which can strongly enhance/suppress glacier response to forcing (e.g., Moon et al., 2012; Carr et al., 2015).
Kangerlussuaq Glacier (68.5°N, 33.0°W; Kangerlussuaq herein), east Greenland, is one of Greenland’s largest tidewater glaciers, draining approximately 3% of the total area of the ice sheet (Bevan et al., 2012), and accounting for 5% of ice sheet discharge (Enderlin et al., 2014). Following a period of sustained low-elevation thinning during the mid to late 1990s (Thomas et al., 2000; Khan et al., 2014), Kangerlussuaq retreated abruptly by 5 km between April 2004 and April 2005 (Luckman et al., 2006; Howat et al., 2007). Coincident with this retreat, the glacier accelerated from ∼7,500 m a−1 (∼20 m d−1) to ∼13,000 m a−1 (∼35 m d−1) (Luckman et al., 2006). Ice losses returned to pre-retreat values by the summer of 2008 (Howat et al., 2011). However, these changes in speed, frontal position, and subsequent diffusive thinning (Stearns and Hamilton, 2007) resulted in mass loss of 80 Gt of ice between September 2004 and January 2008; a three-fold increase on pre-retreat rates of ice loss (Howat et al., 2011). Following the 2005 retreat, Kangerlussuaq decelerated and its calving front re-advanced by ∼200 ± 30 m a−1 between 2008 and 2016 (Howat et al., 2007; Bevan et al., 2012; Kehrl et al., 2017). However, continued thinning caused the grounding line to retreat until 2011, when it stabilized, likely because of retreat into shallower water (Kehrl et al., 2017). Since 2011, dynamic thinning rates have reduced and the final ∼5 km of the terminus are at or close to flotation (Kehrl et al., 2017). Between 2000 and 2012, Kangerlussuaq accounted for ∼14% (∼105 Gt) of the total cumulative discharge anomaly of the entire ice sheet (∼750 Gt; Enderlin et al., 2014), second only to Jakobshavn Isbræ (Sermeq Kujalleq; ∼21% or 158 Gt).
The most recent published records of Kangerlussuaq’s variations in frontal-position and speed end by 2016 (Bevan et al., 2012; Khan et al., 2014; Murray et al., 2015; Kehrl et al., 2017). Since then, Kangerlussuaq has entered a new phase of rapid retreat. Here we present an intra-annual time-series of ice frontal position between March 2013 and September 2018 from Landsat 8 satellite imagery. We couple this time-series of ice frontal positions with ice velocity and surface elevation datasets to evaluate the dynamic response of Kangerlussuaq to recent changes in terminus position. Finally, we discuss local topographic setting as a control on recent and future glacier behavior.
Materials and Methods
Glacier Frontal Position
Terminus positions of Kangerlussuaq were manually digitized from all available Level 1T pansharpened (15 m) Landsat 8 Operational Land Imager (OLI) satellite imagery between 2013 and 2018 using the Google Earth Digitisation Tool (GEEDiT) (Lea, 2018). We visualized (within a web-browser) every Landsat 8 image available between 20 March 2013 (first available Landsat 8 image for Kangerlussuaq) and 03 September 2018 (end of study period), and manually digitized the glacier termini for each image where an ice front was visible. The presence of year round mélange precluded the mapping of part or all of the glacier terminus for some images. In such scenarios, only the contiguous portion of the terminus that could be differentiated from the mélange was mapped. Due to overlap in satellite tracks, where multiple images were available for the same day we measured the ice front using the first image acquired unless there was any discernible change. Mapped glacier termini were subsequently exported from GEEDiT in vector format as GeoJSON files and were converted to ESRI shapefiles using the Margin change Quantification Tool (MaQiT) (Lea, 2018). As each terminus trace has metadata automatically appended within GEEDiT, including the unique path identifier (Supplementary Table S1 and Data Set S1 in the Supplementary Material), it is possible to directly and easily identify the original image used in the mapping; for example using GEEDiT Reviewer (Lea, 2018).
Changes in frontal position were assessed using the curvilinear box method in MaQiT (Lea, 2018). This method is an extension of the commonly used ‘box method’ (e.g., Moon and Joughin, 2008), and used a reference box of fixed width (3 km here) and upstream extent spanning the center line that intersects with contiguously mapped glacier termini. Any termini that did not fully cover the width of the reference box were excluded from the analysis. Here we defined the center line as the line representing the midpoint between the 0 m elevation contour from the BedMachine v3 dataset (Morlighem et al., 2017a). The center line was extracted by tracing the line following the maximum Euclidean distance between the 0 m contour, from its furthest point up-glacier to an arbitrary point beyond the glacier’s maximum extent (e.g., Lea et al., 2014; Figure 1). Mean retreat was subsequently calculated by normalizing the change in reference box area by its width. This method therefore captured spatially asymmetric retreat and advance of a calving margin (Moon and Joughin, 2008). Based on the above method, from a possible 199 images, we obtained 124 terminus traces between 2013 and 2018 (Supplementary Figure S1 in the Supplementary Material). Cloud and/or mélange obscured imagery precluded a constant temporal sampling frequency. However, an average of 20 (σ = 8) terminus traces were obtained per year, with an average sampling frequency of 15 days (σ = 32). We coupled these newly derived terminus positions with the datasets of Khan et al. (2014) (annual 1932, 1966, 1972, 1981, 1985, 1991, and 1999 – 2012) and Murray et al. (2015) (seasonal 2000 – 2010) to provide historical (back to 1932) context to the ice front evolution of Kangerlussuaq (Figure 1).
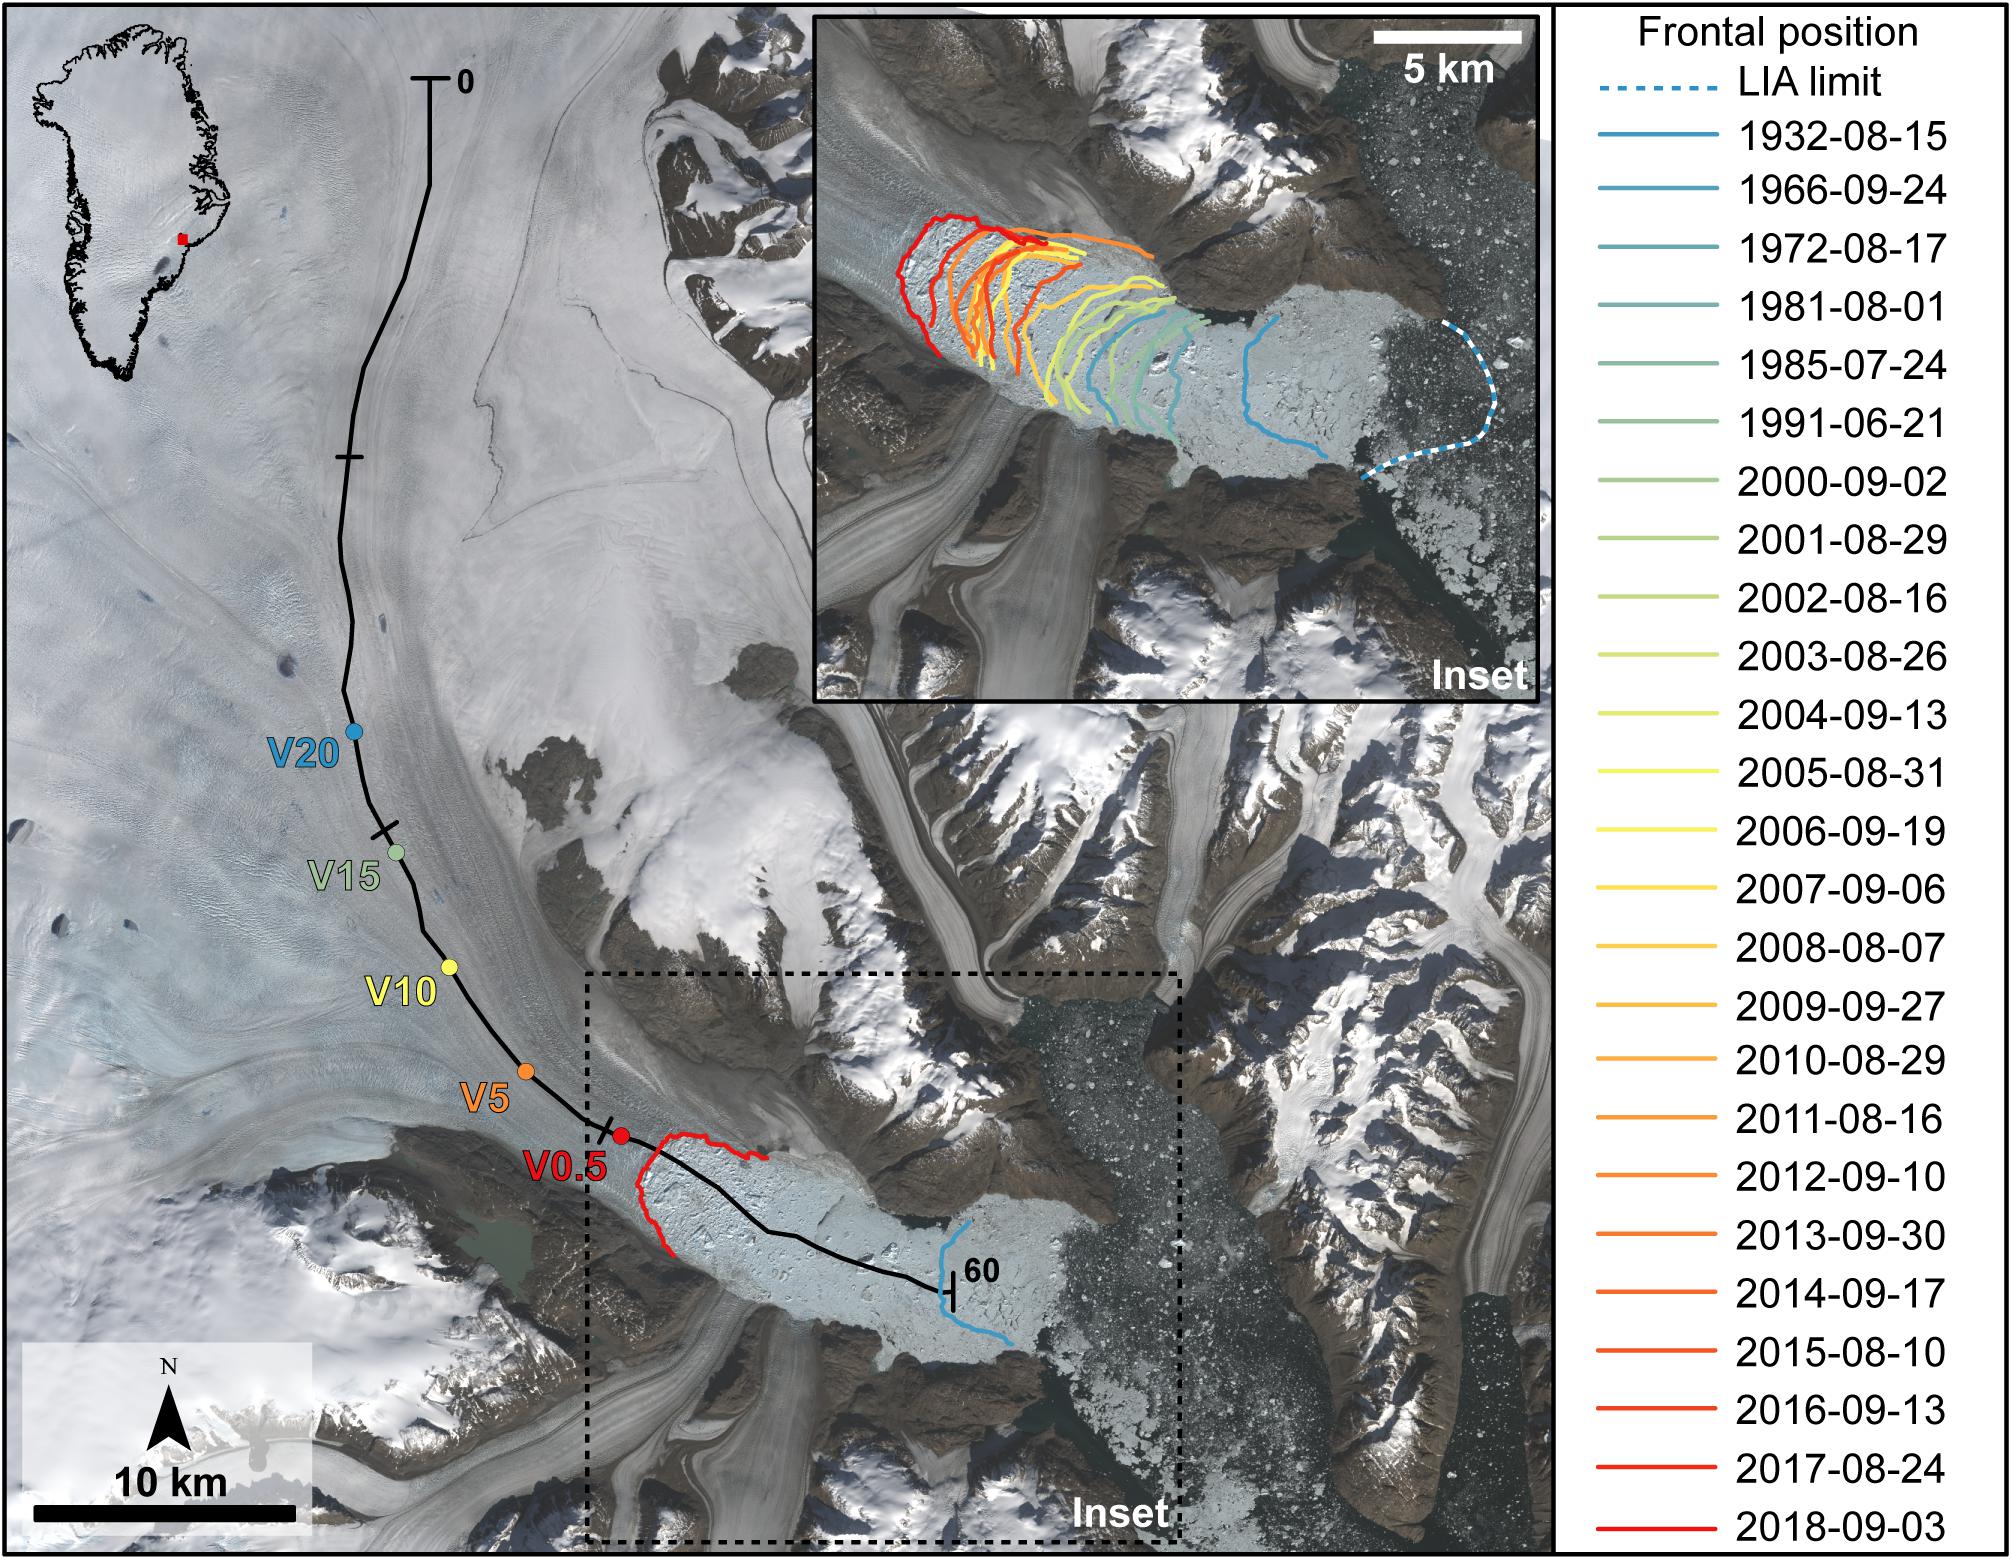
Figure 1. Overview of Kangerlussuaq Glacier and mapped historical terminus positions (inset). Black line indicates the center line profile plotted in Figures 4, 7. Points V0.5 – V20 mark the locations for the velocity series shown in Figure 3B and indicate the distance (in km) from the most retreated ice front (16 May 2018). Annual ice fronts between 2013 and 2018 are from this study and ice fronts prior to 2013, including the Little Ice Age limit, are from Khan et al. (2014). Background image is Landsat 8 scene from 03 September 2018 (path 231 and row 012).
Uncertainty in ice front positions is attributed to error in both geolocational accuracy of imagery and precision in manual digitisation of the ice fronts (e.g., Carr et al., 2015). The former was assessed by digitizing a section of rock coastline adjacent to the terminus of Kangerlussuaq for a sub-sample of 30 Landsat 8 images that covered the whole time-period and path/row combinations, using the curvilinear box method, where there should be no discernible change between images (e.g., Bevan et al., 2012; Carr et al., 2013). The mean error was ± 3.6 m. The latter was assessed by repeatedly digitizing the termini of the glacier 30 times in a single Landsat 8 image (e.g., Moon et al., 2015), using the curvilinear box method, again there should be no discernible change. The mean error was ± 2.5 m. Propagating these errors gives an overall mapping uncertainty of ± 4.4 m, which is less than the pixel resolution (15 m) of our imagery.
Ice Velocity
Datasets on ice velocity, basal topography and surface elevation change were compiled from publicly available sources (Supplementary Table S2). Ice surface velocities for Kangerlussuaq were acquired from the MEaSUREs program (Joughin et al., 2010, 20111). These velocity maps were produced from 11 to 33 day Interferometric Synthetic Aperture Radar (InSAR) image pairs measured by TerraSAR-X / TanDEM-X, and have a resolution of 100 m (Joughin et al., 2011). 187 velocity maps were available between February 2009 and August 2018 (Supplementary Figures S2, S3), with an average of 18 (σ = 6) velocity maps available per year. Velocity time-series were extracted from fixed points along the ice flow center line (Figure 1) at 100 m intervals. Velocity errors were calculated using the dataset error values for each velocity maps (Joughin et al., 2011), and resulted in a mean error of ± 11.5 m a−1 for our center line.
Surface Elevation Change
The rate of surface elevation change was determined using Operation IceBridge ATM L4 Surface Elevation Rate of Change data (Studinger, 20142). Measurements were made at all points where coincident Airborne Topographic Mapper (ATM) widescan ILATM1B elevation data existed from two different campaigns, and were provided as average rate of change (dH/dT) of the surface elevation between the two measurement times. Data availability varied spatially and temporally, so values that exactly followed our center line could not be extracted. To overcome this, we assessed surface elevation change along the profiles where data were available for each time step. We determined annual change for all available years (n = 12) between 2001 and 2018, and cumulative change relative to a 2001 baseline (n = 15). The latter were converted from average rate of change to cumulative elevation change using the time difference information provided in the dataset’s metadata. Time series of surface elevation change were extracted from two locations ∼0.5 and ∼10 km from the most retreated ice front, respectively. As flight lines do not perfectly overlap year-on-year, the maximum distance between our sample points and the observed ATM point measurement is 275 m. Using the dataset errors (Studinger, 2014) for all points in our selected time periods, resulted in a mean error of ± 1.4 m for the annual change datasets and ± 1.9 m for the cumulative change datasets.
Basal Topography
Basal topography was acquired from the Operation IceBridge BedMachine v3 dataset (Morlighem et al., 2017a,b3), which is derived from ice thickness and mass conservation, and is coupled with ocean bathymetry to provide a 150 m resolution bed map of Greenland (Morlighem et al., 2017b). Bed topography was sampled at 150 m intervals along the center line. Errors were calculated using the dataset error values (Supplementary Figure S4; Morlighem et al., 2017a), and resulted in a mean error of ± 84 m. We compared the BedMachine v3 derived profile against the ice thickness measurements used to constrain the mass conservation approach (Supplementary Figure S5). We utilized all bed-elevation point measurements within 150 m of our center line (Kehrl et al., 2017) from the Center for Remote Sensing of Ice Sheets’ (CReSIS) Kangerlussuaq 2006–2014 composite v3 ice thickness product (Center for Remote Sensing of Ice Sheets [CReSIS], 20184). Although there was some spread in the elevation point measurements relative to the mass conservation solution – particularly inland (e.g., at ∼15 km in Supplementary Figure S5) – the solution does reproduce the general shape, and therefore slope, of the bed. Such an association has also previously been found for multiple tidewater glaciers in central western Greenland (Catania et al., 2018). Therefore, we argue that the basal topography provided in the BedMachine v3 dataset is suitable for assessing topographic influence on terminus behavior.
Results
Between 2013 and 2016 Kangerlussuaq’s frontal position followed a typical seasonal progression: before our first available position in late February the ice front advanced with limited calving, reaching its most advanced position toward the middle of the year (∼July; Figures 2, 3A). After this, the ice front retreated, often via a series of large calving episodes, and retreat continued until at least our last available frontal position in October/November (Figures 2, 3A). During each winter (December to February), the ice front would re-advance so that the early spring terminus position was seaward of the previous autumn position. This 2–3 km seasonal oscillation has been typical of Kangerlussuaq since at least 1985 (Figure 3A; e.g., Luckman et al., 2006; Bevan et al., 2012; Murray et al., 2015; Kehrl et al., 2017). However, the behavior of the glacier changed markedly in winter 2016/2017, when the ice front retreated by 2.5 km, rather than the usual winter advance (Figures 2, 3A). As a result, the spring 2017 ice front was ∼2.5 km behind the spring 2016 position (Figures 2, 3A). In 2017, the early season advance was interrupted by a series of calving events, limiting the seasonal advance (Figures 2, 3A). During winter 2017, Kangerlussuaq’s ice front underwent a second phase of extended retreat through to May 2018, with total retreat of 3 km (Figures 2, 3A). This brought the spring 2018 ice front ∼2.5 km behind its position in spring 2017, and ∼5 km behind its location in spring 2016 (Figures 2, 3A). As in 2017, early seasonal advance in 2018 was punctuated by further calving events. Kangerlussuaq has therefore entered a new phase of retreat, which occurred through extended winter retreat and limited spring readvance in 2017 and 2018. This retreat has brought Kangerlussuaq’s ice front to its most retreated position since at least 1932 (Figure 1).
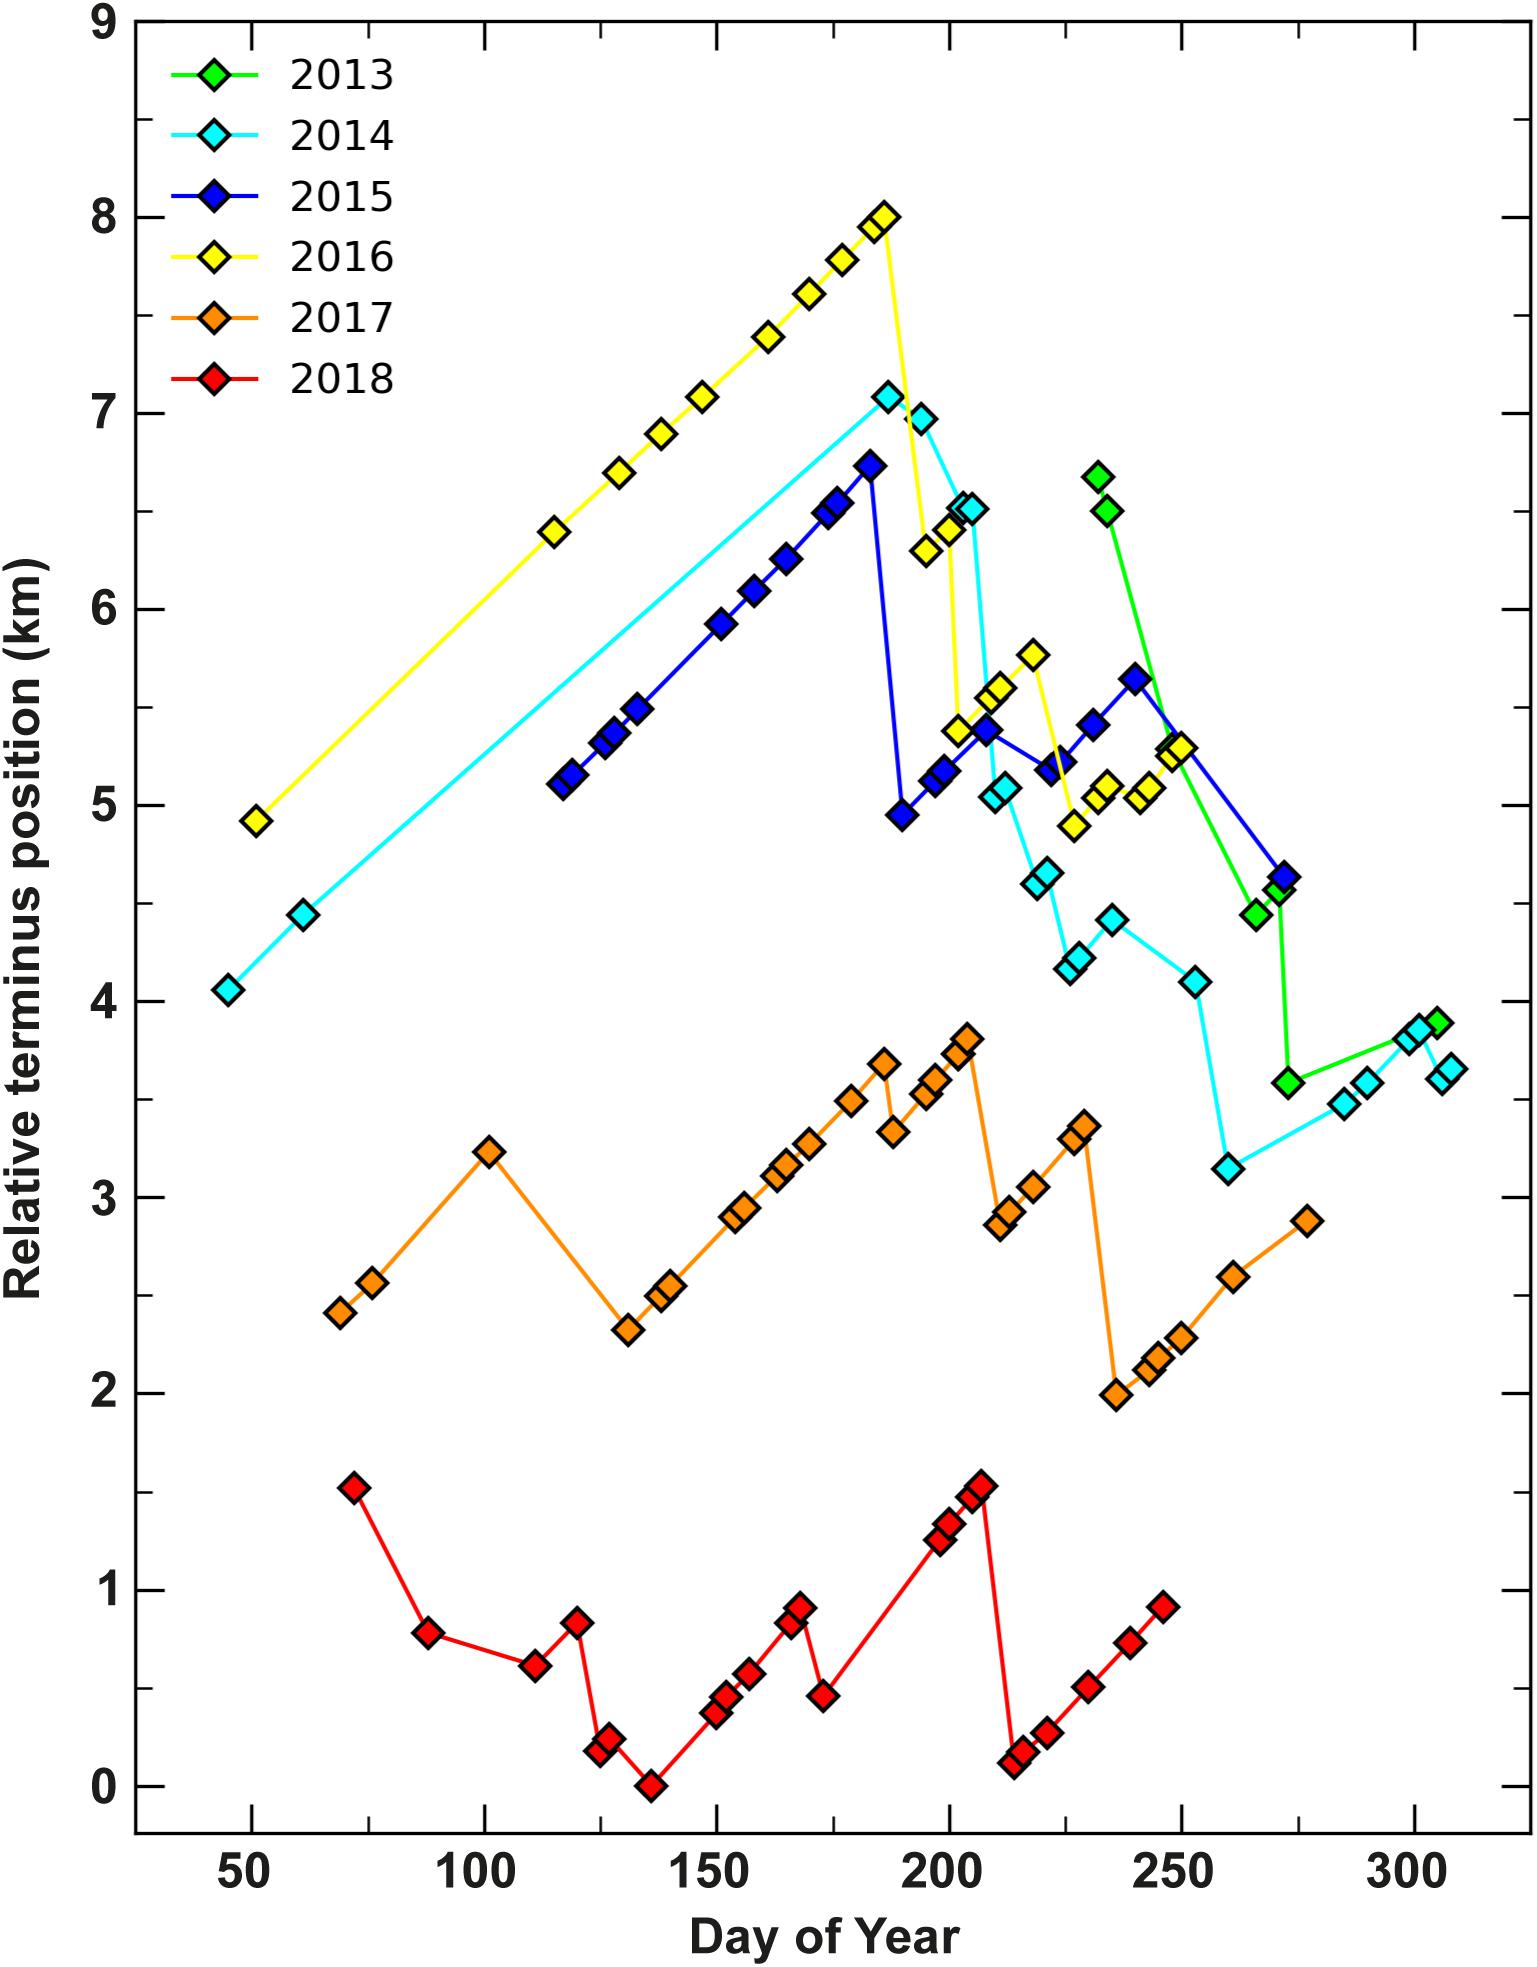
Figure 2. Terminus position of Kangerlussuaq relative to the most retreated ice front (16 May 2018) plotted by day of the year from 2013 to 2018.
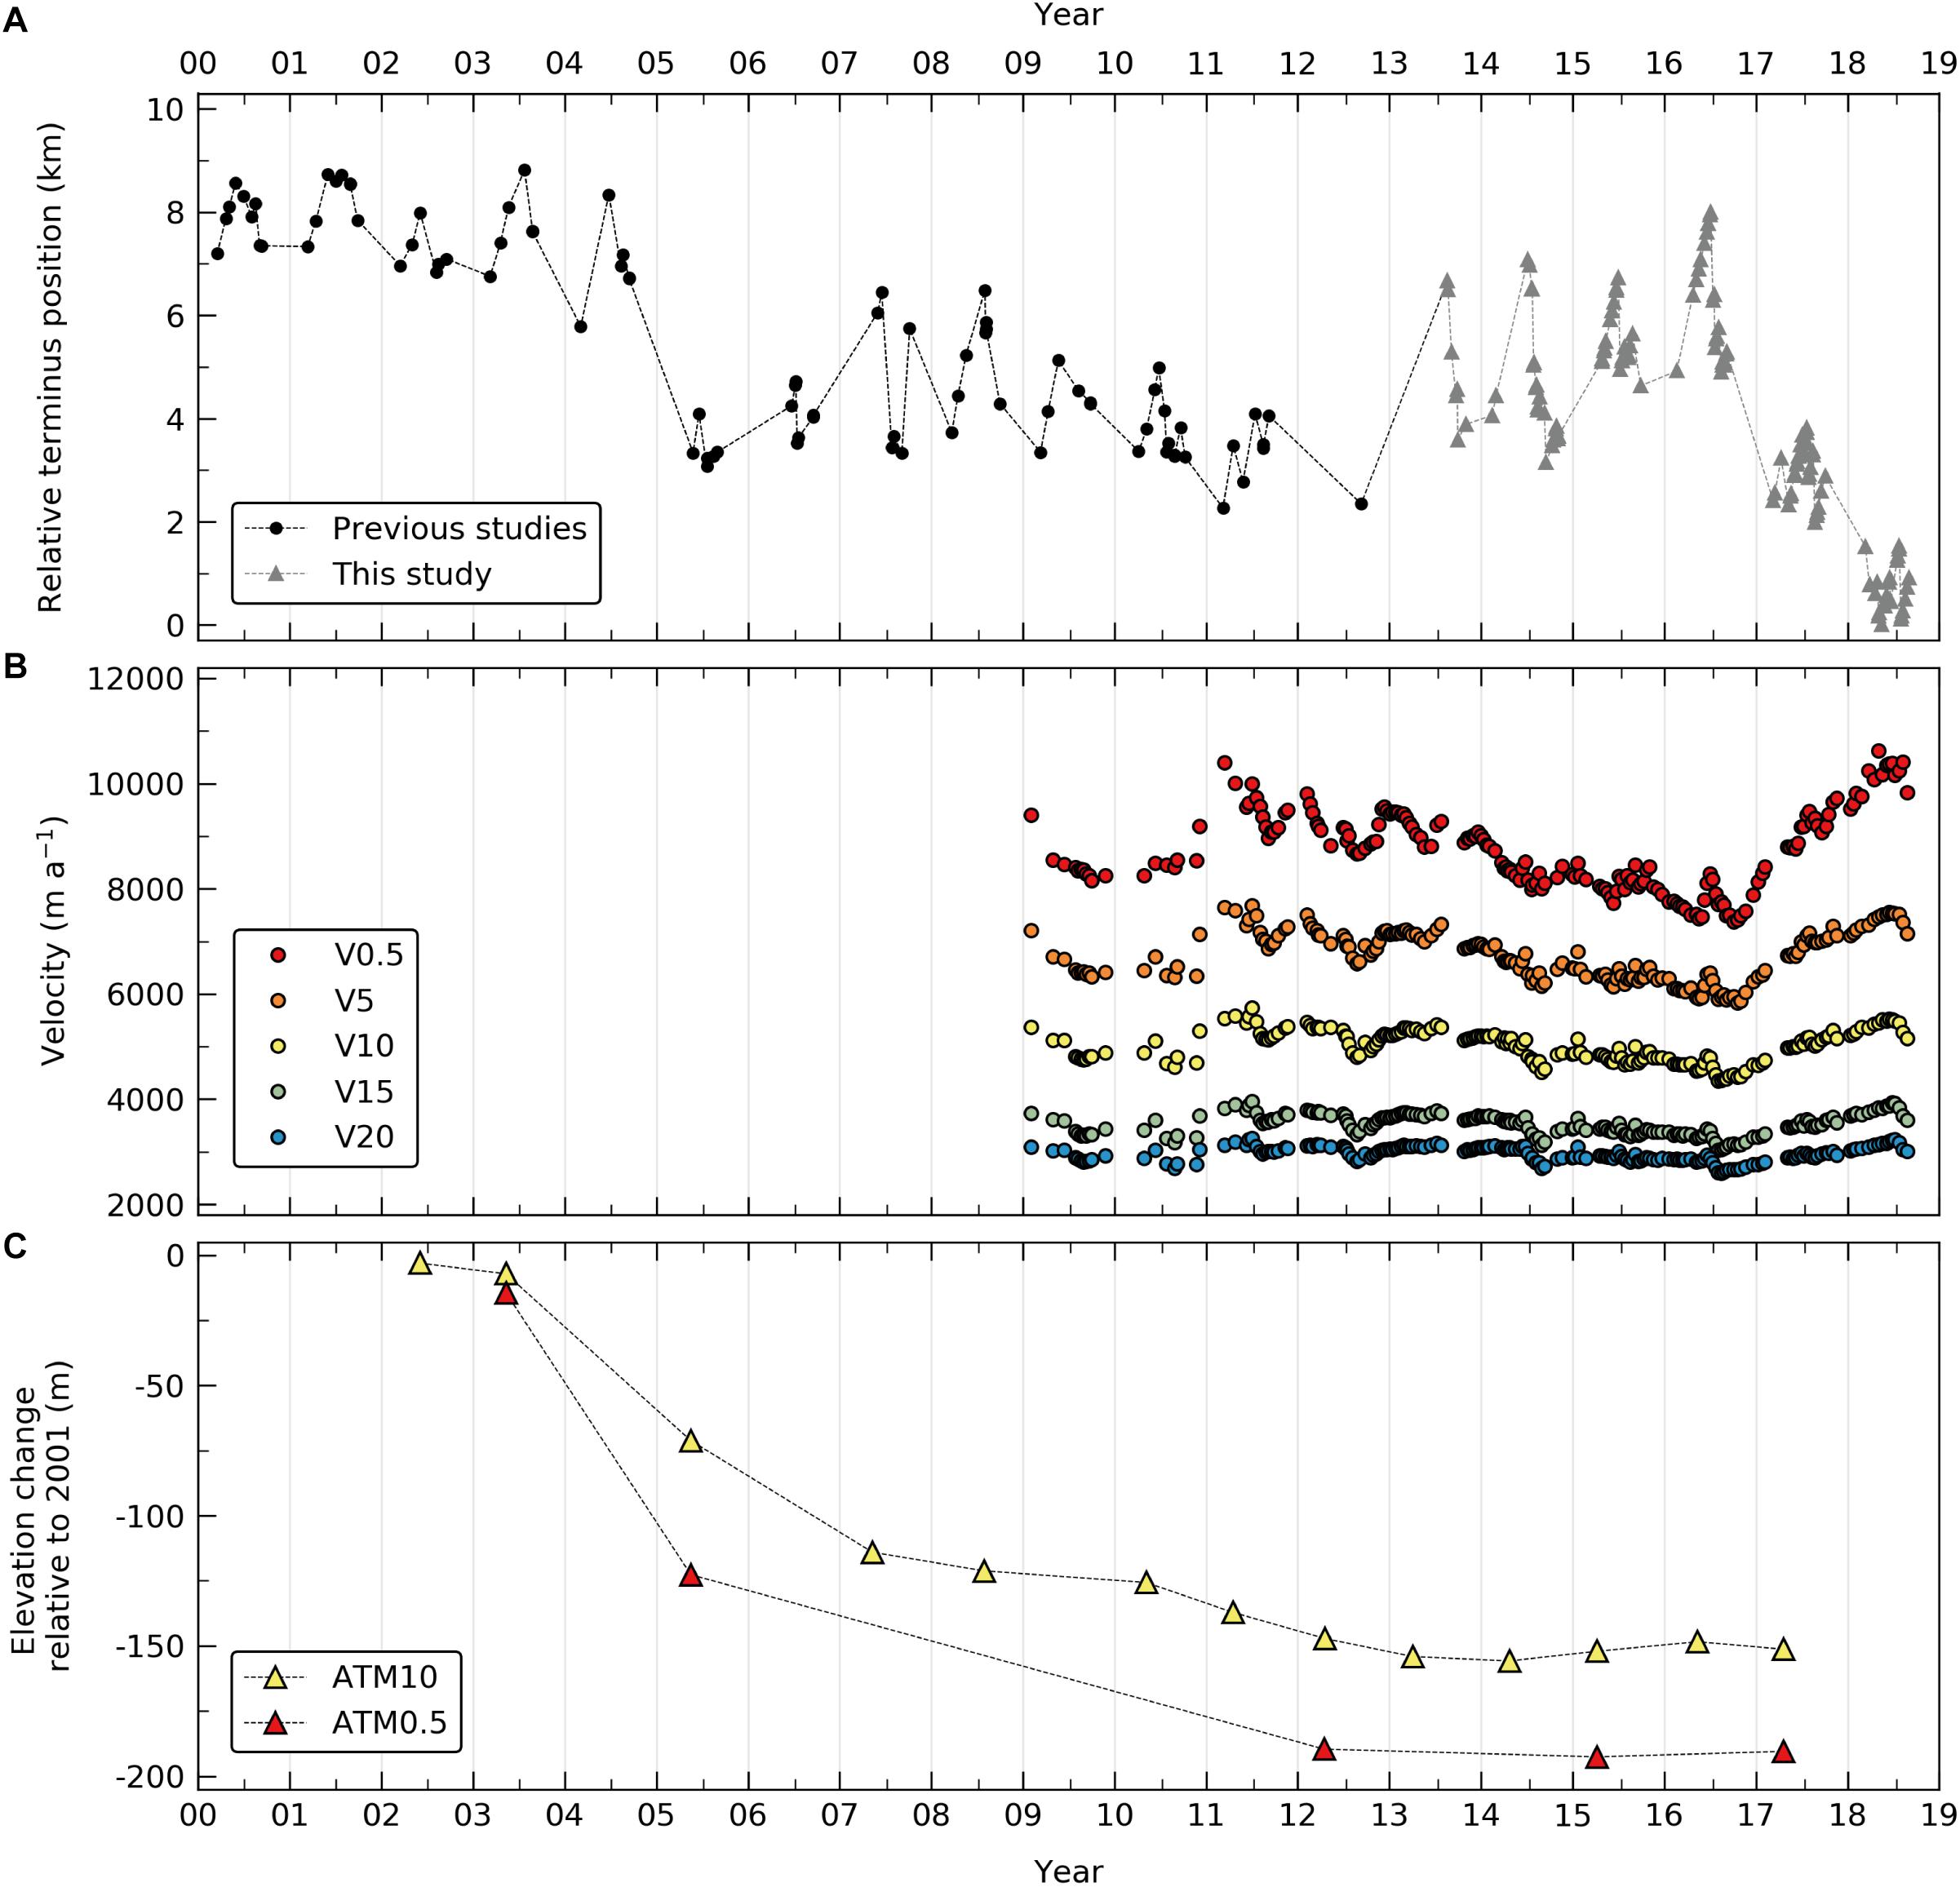
Figure 3. Time series of terminus, velocity and surface elevation change for Kangerlussuaq. (A) Change in terminus position between 2000 and 2018, plotted relative to the most retreated ice front (16 May 2018). (B) Plots of velocity for selected points along the center line as shown in Figure 1. Points were coded such that the numerical designation (e.g., V5) indicates the distance in kilometers from the most retreated ice front (16 May 2018). (C) Surface elevation change relative to 2001 for locations marked by the white star (∼10 km from the most retreated ice front) and red star (∼0.5 km from the most retreated ice front) in Figure 5.
Our data demonstrate that Kangerlussuaq decelerated between 2011 and 2016, with peak summer velocity reducing by ∼1,500 m a−1 from ∼10,000 m a−1 in 2011 to ∼8,500 m a−1 in 2016. The glacier then accelerated throughout 2017 and 2018, such that early spring velocities in 2017 (∼8,500 m a−1) equalled the previous year’s summer velocities, reaching a peak velocity of ∼10,500 m a−1 in May 2018 (Figures 3B, 4). This near-terminus (V0.5; Figures 1, 3B) peak velocity was the largest velocity recorded during the time series (Figure 3B). Summer velocity in 2018 (∼10,500 m a−1) was ∼2,500 m a−1 above the same period in 2016 (∼8,000 m a−1; Figures 3B, 4), representing a ∼30% increase. This velocity increase is far greater than annual velocity cycles of the preceding years (∼1,000 m; Figure 3B). Changes in velocity were apparent at least 20 km inland of the terminus but were of greatest amplitude nearer to the ice front (Figures 3B, 4).
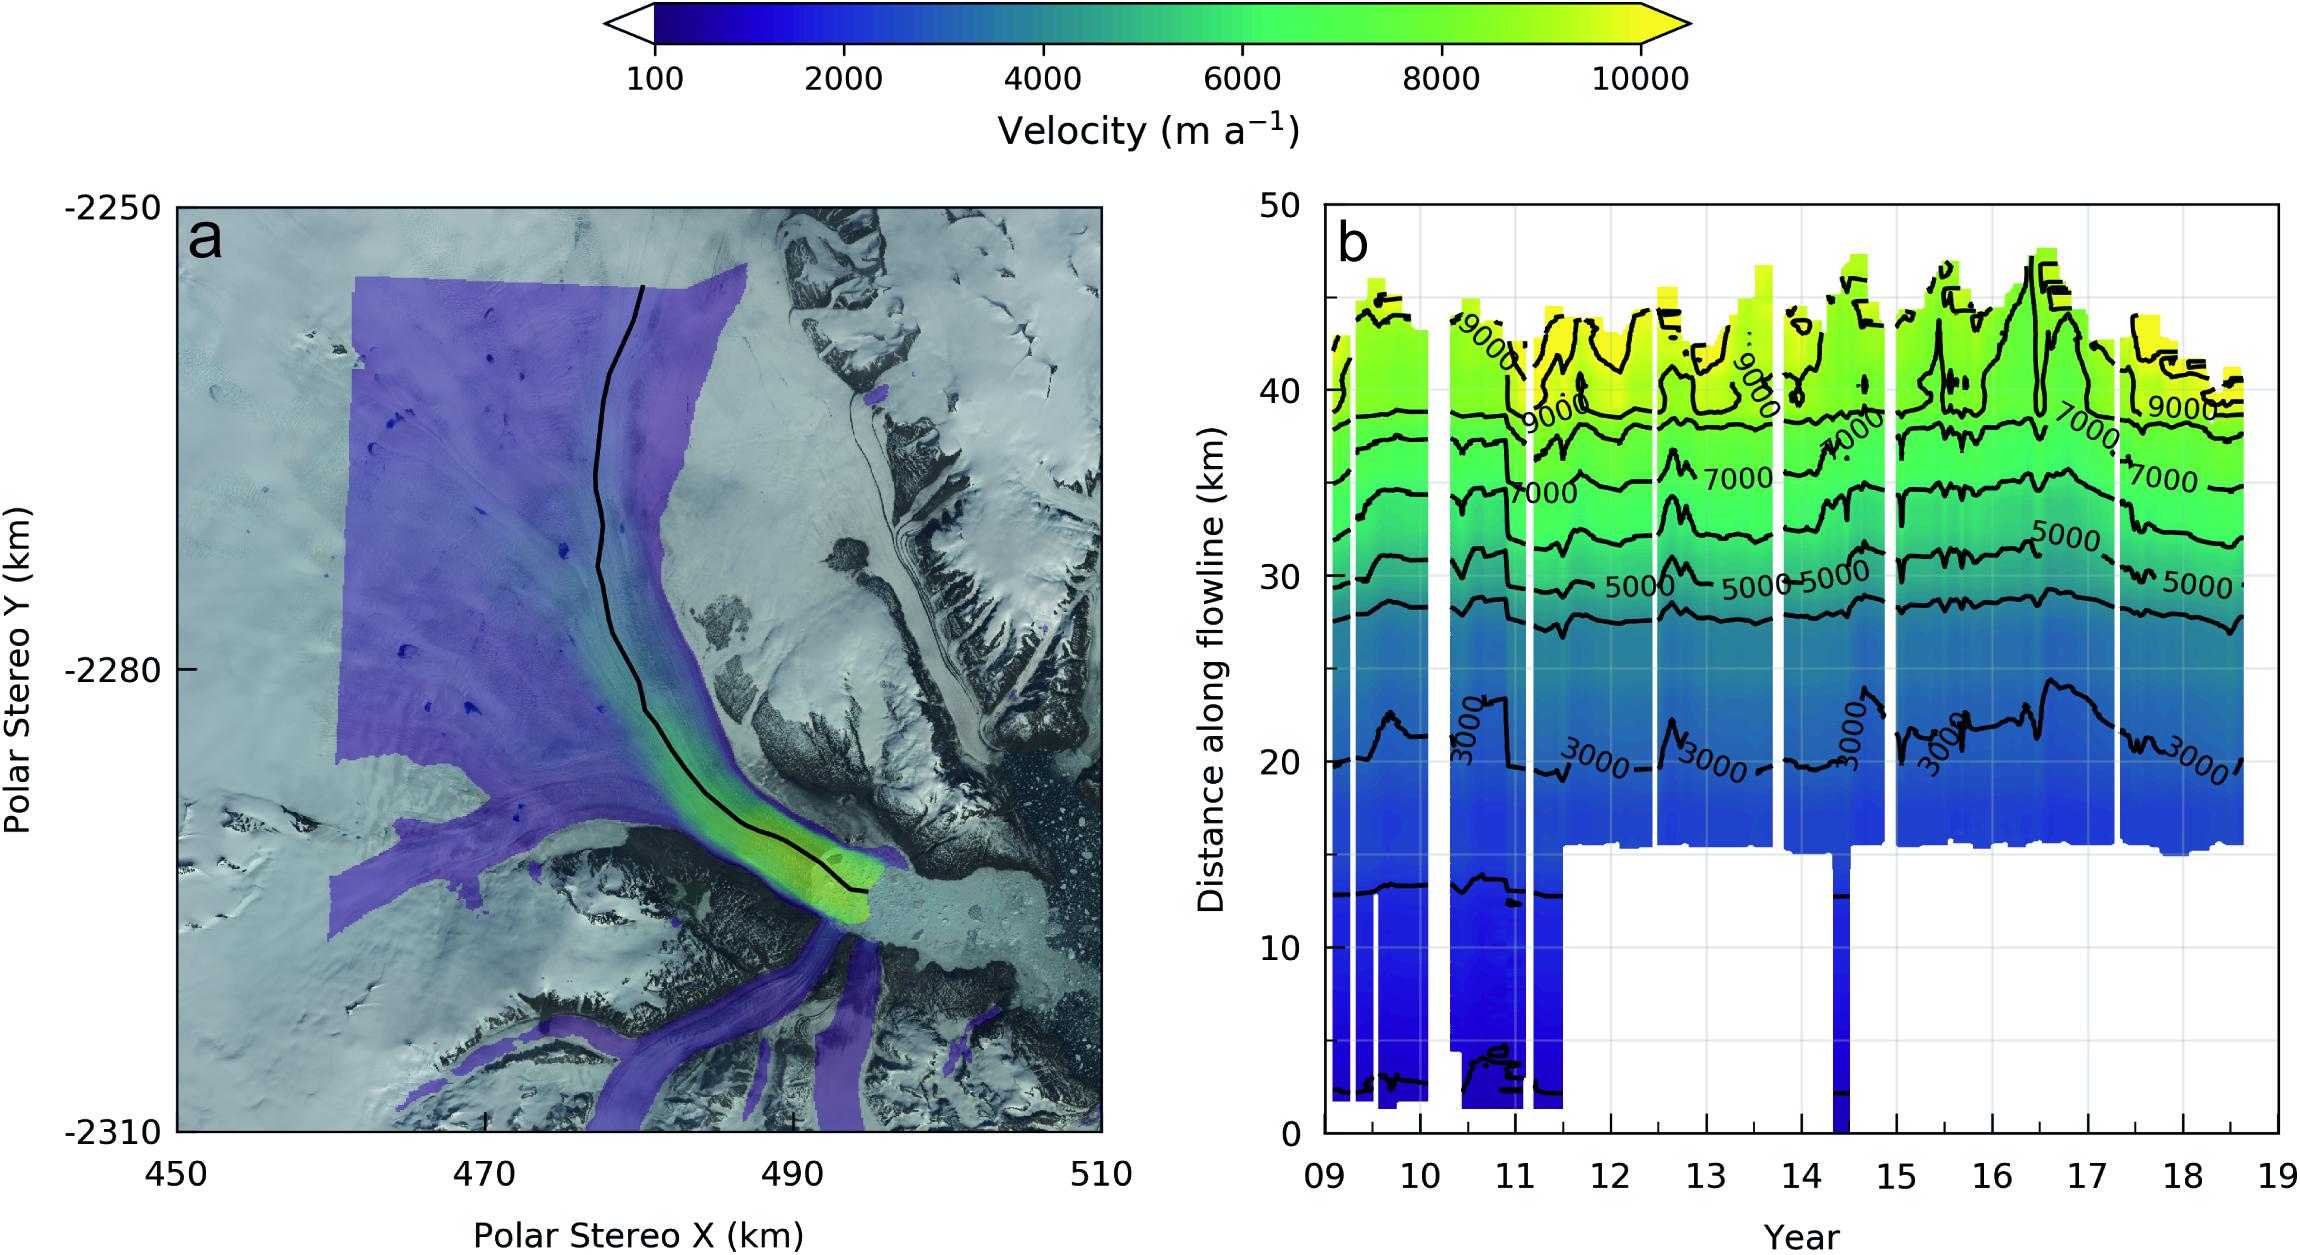
Figure 4. InSAR derived down-glacier velocity profiles for Kangerlussuaq between 2009 and 2018. (a) Mean glacier velocity between 2009 and 2018. (b) Contour plot of down-glacier velocity profile for center line shown in (a). For visualization purposes, and to obtain a more complete velocity record that accounts for irregular sampling intervals, velocity was linearly interpolated in time if the observation intervals are shorter than 66 days (i.e., six repeat pass cycles). Background image is Landsat 8 scene from 07 July 2017 (path 230 and row 012).
Changes in elevation vary during the observation period (Figures 3C, 5, 6). For our inland location (ATM10; white star in Figure 5), following thinning of 7 m between 2001 and 2003, the surface then entered a period of major thinning between 2003 and 2007 where it thinned by more than 100 m (Figures 3C, 5). More moderate thinning of 12 m occurred between 2007 and 2010, followed by a second phase of more intensive thinning of 30 m between 2010 and 2013 (Figures 3C, 5). The general pattern of thinning changed between 2013 and 2016, as thickening of 7 m was observed. Following this punctuation, the surface once again entered a period of thinning between 2016 and 2017 (Figures 3C, 5, 6). There are fewer observations near the terminus (ATM0.5; red star in Figure 5), but elevation changes broadly follow the inland pattern, with a period of major thinning between 2003 and 2012, followed by smaller magnitude thickening and thinning between 2012 and 2017 (Figures 3C, 5, 6). No data is available for 2018 at either location (Figures 5, 6).
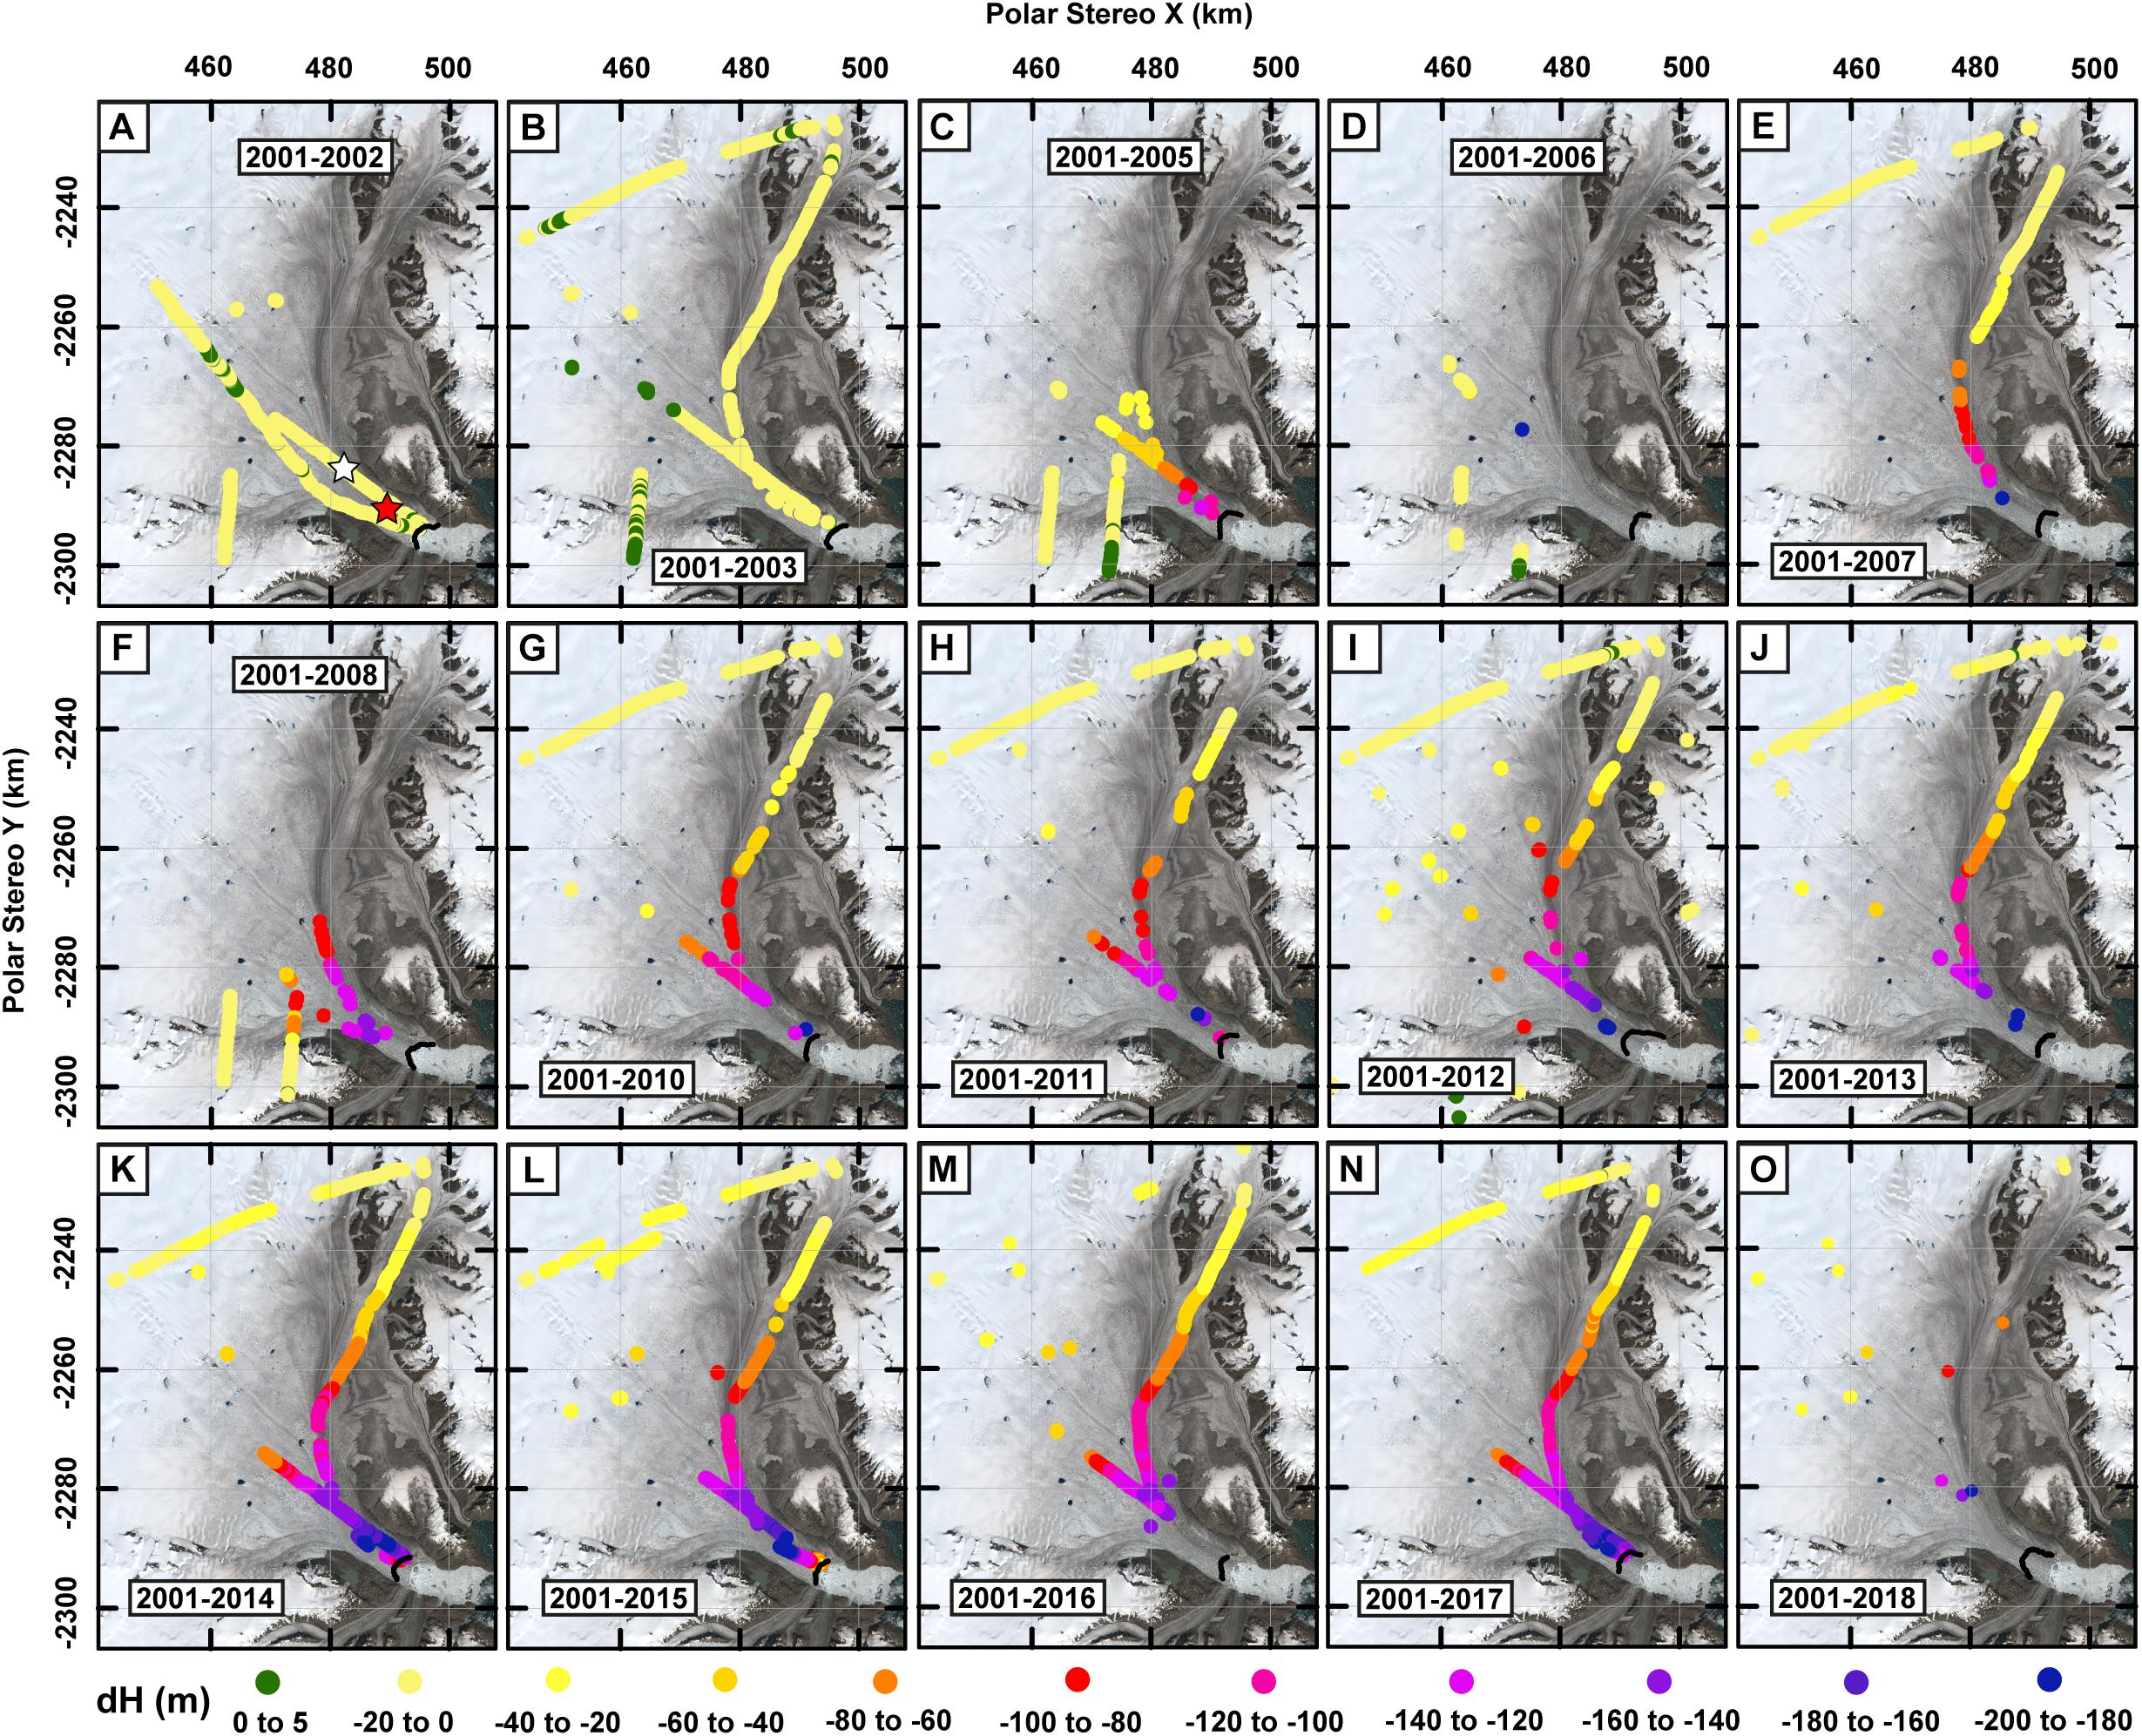
Figure 5. Surface elevation change for Kangerlussuaq relative to 2001 baseline from Operation IceBridge ATM data. Panels relate to surface elevation change for the time periods 2001–2002 (A), 2001–2003 (B), 2001–2005 (C), 2001–2006 (D), 2001–2007 (E), 2001–2008 (F), 2001–2010 (G), 2001–2011 (H), 2001–2012 (I), 2001–2013 (J), 2001–2014 (K), 2001–2015 (L), 2001–2016 (M), 2001–2017 (N), and 2001–2018 (O). The most retreated terminus position for the given time period is demarcated in black. Background image is Landsat 8 scene from 05 August 2016 (path 230 and row 012).
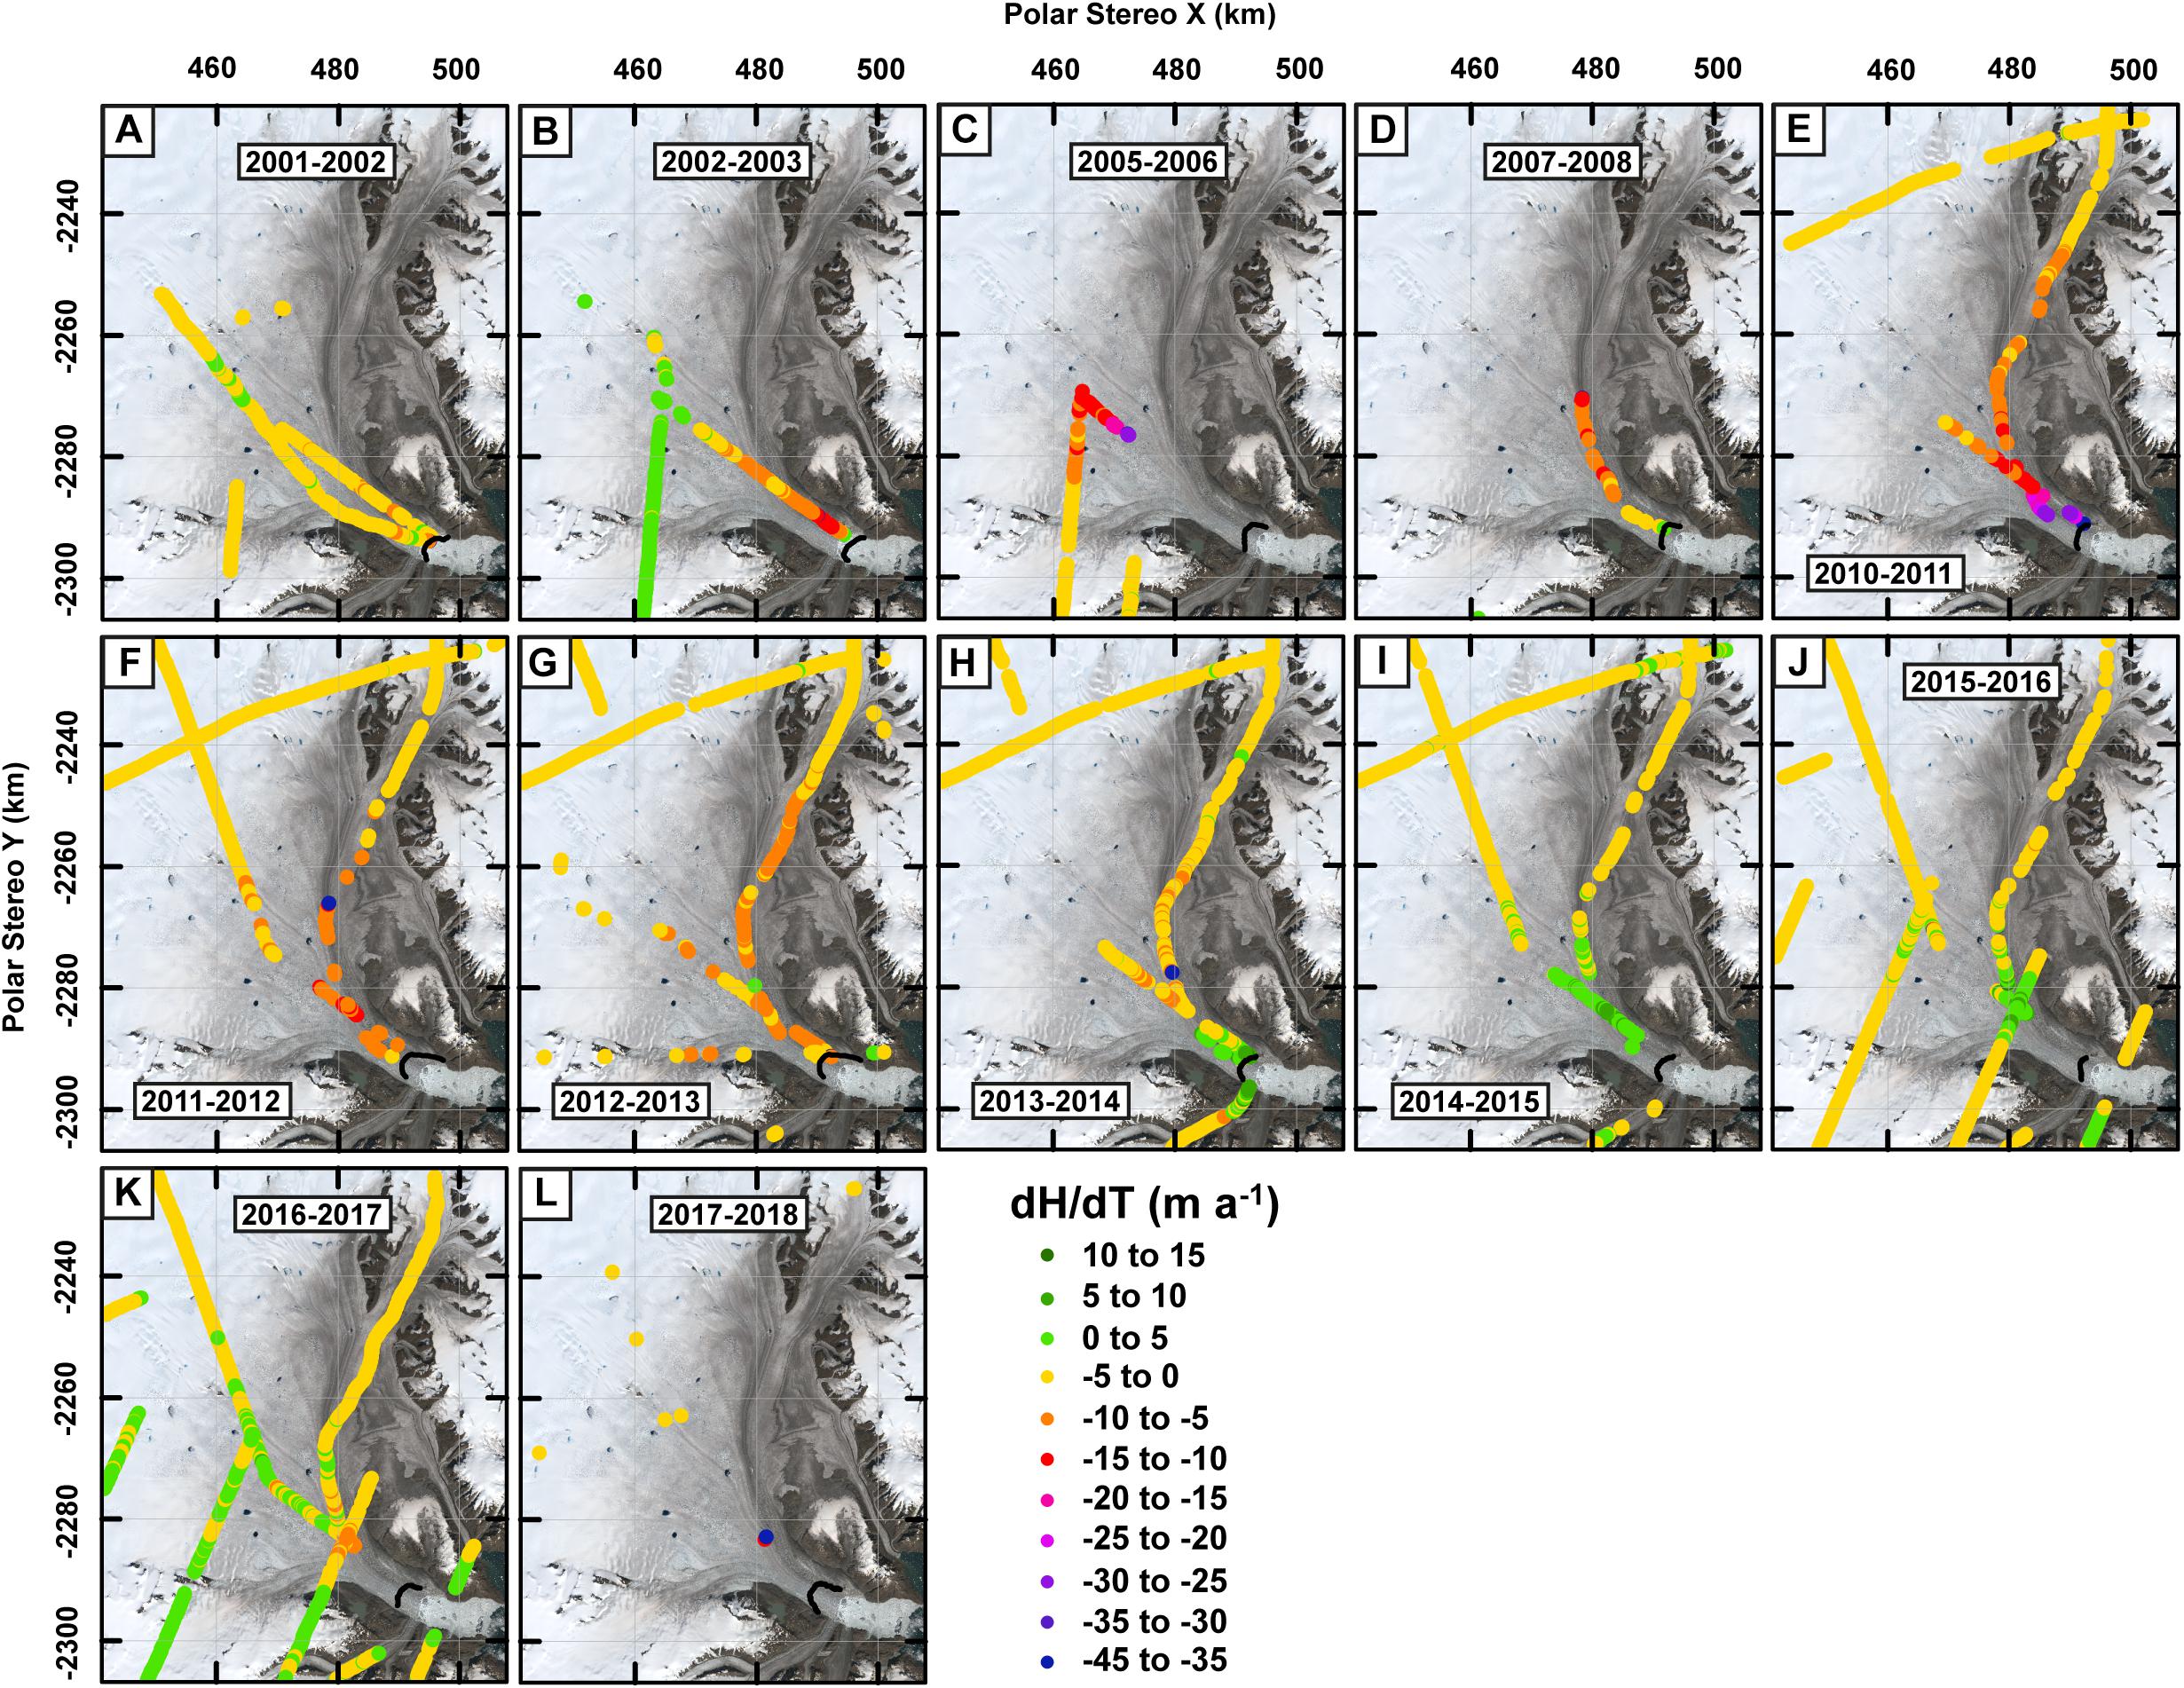
Figure 6. Annual surface elevation change for Kangerlussuaq between 2001 and 2018 from Operation IceBridge ATM data. Panels relate to surface elevation change for the time periods 2001–2002 (A), 2002–2003 (B) 2005–2006 (C), 2007–2008 (D), 2010–2011 (E), 2011–2012 (F), 2012–2013 (G), 2013–2014 (H), 2014–2015 (I), 2015–2016 (J), 2016–2017 (K), and 2017–2018 (L). The most retreated terminus position for the given time period is demarcated in black. Background image as in Figure 5.
Discussion
Our observations demonstrate that between 2016 and 2017 Kangerlussuaq’s dynamics changed substantially (Figures 2, 3). Following a period of terminus advance between summer 2011 and summer 2016, Kangerlussuaq’s ice front rapidly retreated by 5 km between winter 2016 and spring 2018 (Figures 2, 3A). Although comparable rates of retreat have occurred at least twice since 1932 (Luckman et al., 2006; Khan et al., 2014), this current phase of retreat has left the glacier terminus at its most inland position since the earliest known observations in 1932 (Figure 1; Bevan et al., 2012; Khan et al., 2014). Following late 2016/early 2017 retreat, Kangerlussuaq accelerated throughout 2017 and 2018 (Figures 3B, 4) and began to thin close to the terminus (Figures 3C, 5, 6). This dynamic response has been observed on other Greenland outlet glaciers, and stems from a loss of resistive stress (backstress) at the glacier front, leading to ice acceleration, thinning, and further retreat (e.g., Howat et al., 2007; Stearns and Hamilton, 2007; Nick et al., 2009; Joughin et al., 2010; Moon et al., 2012). Following retreat, the glacier accelerates to produce the additional longitudinal and lateral stress gradients required to restore force balance (Howat et al., 2005), leading to an increase in the longitudinal strain rate, stretching, and thinning the ice (Figure 3C). In turn, this thinning can steepening the ice surface, which increases the driving stress, leading to further increases in ice velocity (Figure 3B). As such, these feedbacks between increased driving stress and ice acceleration cause thinning and acceleration to propagate upglacier and can lead to major ice losses developing (e.g., Thomas, 2004; Howat et al., 2005; Thomas et al., 2011; Joughin et al., 2012). However, along-flow changes in fjord geometry (bed and width) can strongly influence spatial patterns of longitudinal stress gradients, which in turn can act to exacerbate or dampen the initial dynamic response (O’Neel et al., 2005; Carr et al., 2015).
Given the influence of basal topography on the rate and extent of glacier retreat (e.g., Weertman, 1974; Thomas, 1979; Schoof, 2007) we investigated the position of the ice front with respect to basal topography over time (Figure 7). Since the turn of the 21st-century, Kangerlussuaq has undergone a number of changes in its dynamic behavior (Figure 3). In general, periods of accelerated ice flow correspond to periods of retreat and dynamic thinning, and vice versa (Khan et al., 2014; Kehrl et al., 2017). Extensive thinning as a result of the 2004/2005 retreat (Figures 3C, 5, 6) reduced terminus thickness close to flotation. Continued thinning through to 2010 caused the lower (∼5 km) portion of the terminus to float between winter 2010 and 2011 (Kehrl et al., 2017). This thinning caused retreat of the grounding line from a bedrock high into a ∼3 km long region of reverse bed slope that deepens inland by ∼150 m of elevation, and into a wider section of the fjord (located at between ∼46 and 48 km in Figure 7). This explains the acceleration and thinning of the near terminus during this period (Figure 3; Kehrl et al., 2017). The slowdown in speed, advance of the ice front and subsequent reduction in dynamic thinning between winter 2011 and 2016 (Figures 3, 5, 6) implies that the grounding line was in a more stable position. This likely resulted from the grounding line retreating into shallower water after the 2010/2011 retreat event, leaving the lower ∼5 km of the glacier floating (Kehrl et al., 2017). Ice front retreat since 2016 is therefore likely to have had one of two impacts: (i) the retreat has removed most/all of the floating ice tongue, leaving the ice front/grounding line resting at the base of an ∼750 m wide, ∼50 m high bedrock ridge (located at ∼46 km in Figure 7). Immediately beyond this bump there is a reverse bed slope where elevation decreases for ∼10 km inland from ∼950 m to ∼1,150 m below sea level (located at between ∼35 and 45 km in Figure 7); or (ii) retreat and associated acceleration and thinning (Figure 3) has caused further inland migration of the grounding line, moving it beyond the bedrock bump and into the ∼10 km long trough.
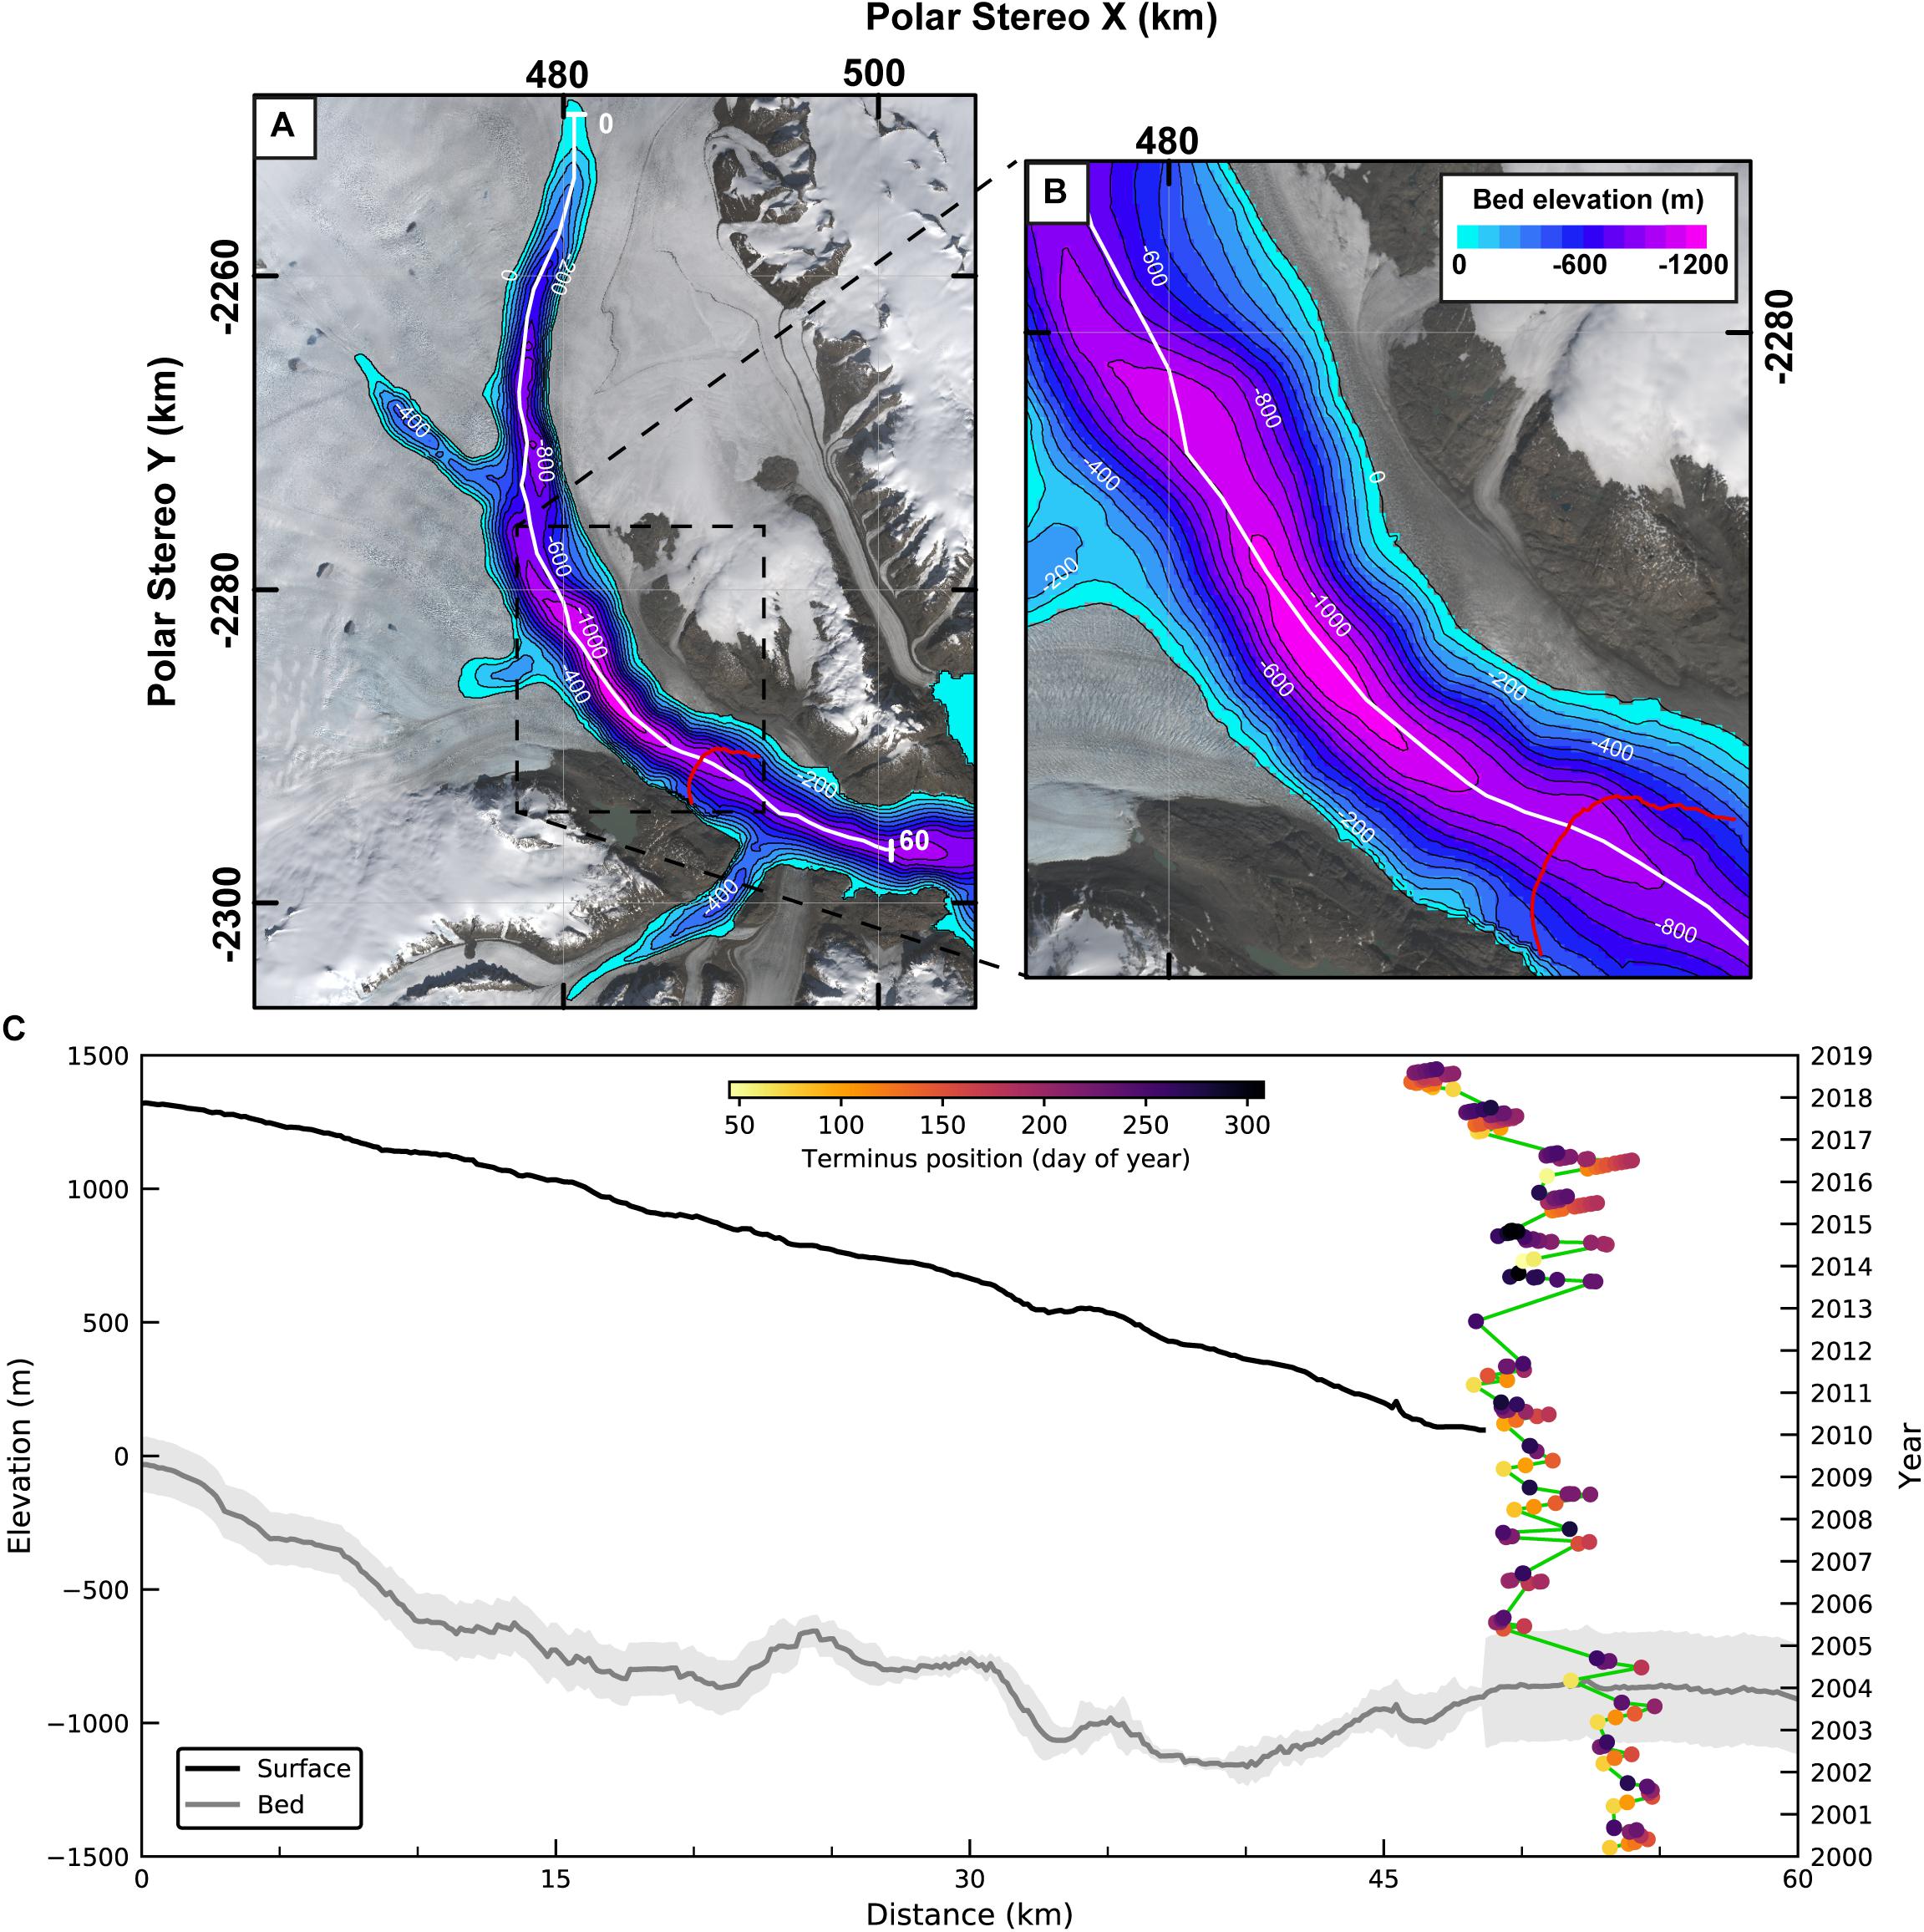
Figure 7. Bed and surface profiles along the center line of Kangerlussuaq. (A) Bed elevation from BedMachine v3 (Morlighem et al., 2017a). White line indicates center line profile shown in (C) and red line demarcates most retreated ice front (16 May 2018). (B) Near-terminus view of (A). (C) Bed and surface profiles overlain with terminus positions between 2000 and 2018. Terminus positions are colored by day of year. Gray line and shading correspond to the bed profile and spatially varying error obtained from BedMachine v3. Surface elevation data is obtained from the Greenland Ice Mapping Project (GIMP) surface digital elevation model provided as part of the BedMachine v3 distribution, and has a nominal date of 2007 (Howat et al., 2014). Background image in (A) and (B) as in Figure 1.
In both scenarios Kangerlussuaq’s ice front is likely primed for further retreat to the head of this trough (Khan et al., 2014) as retreat down a reverse bedrock slope can cause large increases in ice discharge, due to feedbacks between ice thickness at the grounding line, terminus retreat, acceleration, and dynamic thinning (Meier and Post, 1987; Schoof, 2007; Gudmundsson et al., 2012). This is due to ice flux at the grounding line having a strong dependence on ice thickness, such that an increasing ice thickness will lead to a higher ice flux across the grounding line (Gudmundsson et al., 2012). Glacier retreat across a reverse bed slope will cause the grounding line to retreat into deeper water, increasing the ice flux and leading to further retreat. Increasing the ice thickness at the grounding line also increases the surface area of the terminus that is directly coupled to the ocean (Gudmundsson et al., 2012), which in turn can lead to increased frontal ablation through enhanced submarine melting at the ice-ocean interface and enhanced calving (Enderlin et al., 2013; Straneo and Heimbach, 2013; Morlighem et al., 2016). Given that Kangerlussuaq’s bed topography is several hundred meters below sea level (Figure 7), warm (>2.5°C) subsurface Atlantic Water, typically found at depths >200 m below sea level (e.g., Holland et al., 2008), that penetrates into Kangerlussuaq’s fjord could certainly interact with the terminus (e.g., Inall et al., 2014). Such a situation likely contributed to the 2004/2005 retreat event (e.g., Christoffersen et al., 2011).
Theoretically, these feedbacks will only stop once the terminus reaches an area of horizontal or forward-sloping bed (Weertman, 1974; Schoof, 2007; Gudmundsson et al., 2012). Although upstream fluctuations in fjord width (e.g., narrowing between ∼40 and 45 km in Figure 7) could modulate the rate of retreat as the ice front moves into the deepest part of the trough, as a terminus moving into a narrowing fjord can promote stability (Raymond, 1996; Gudmundsson et al., 2012; Jamieson et al., 2012; Carr et al., 2013). Taking all of these recent observations into account, the near-future change (retreat) in Kangerlussuaq’s ice front position may largely be governed by changes in ice dynamics, with only a weak/dampened dependence on atmospheric or oceanographic forcings.
Variations in ice discharge from Kangerlussuaq have substantial implications for total ice sheet mass loss (e.g., Stearns and Hamilton, 2007). In 2004/2005, Kangerlussuaq experienced similar retreat and acceleration to those observed in 2016/17 (Figure 3; Luckman et al., 2006). During 2004/2005, increased speed, retreating frontal position and diffusive thinning caused Kangerlussuaq to lose 80 Gt of ice before it returned to the pre-event balance rate (∼-6.5 Gt a−1) in the summer of 2008. This enhanced period of mass loss represented a three-fold increase in ice discharge compared to pre-retreat rates of ice loss (Howat et al., 2011). Therefore, the observed dynamic changes at Kangerlussuaq since 2016 are likely to lead to an increase in discharge and contribution to global sea level rise over at least the next 1–5 years. However, unlike the 2004/2005 event where the glacier rapidly (1–2 years) re-adjusted to near-balance following a perturbation in geometry (Howat et al., 2007; Bevan et al., 2012), our observation of multi-year retreat (Figures 2, 3A), coupled with a subglacial topography that deepens significantly inland (Figure 7) suggests that Kangerlussuaq is likely to experience substantial rapid retreat and accelerated ice flow, and thus enter an extended phase of enhanced mass loss. At present, Jakobshavn Isbræ (Sermeq Kujalleq) is the only glacier on the ice sheet that has experienced comparable sustained acceleration over multiple years (e.g., Van Der Veen et al., 2011; Joughin et al., 2012).
Furthermore, these recent changes in Kangerlussuaq’s dynamics are likely to have a number of implications for regional and ice sheet-wide mass loss patterns. At the basin scale, Kangerlussuaq dominates mass loss from the eastern sector of the ice sheet (basin 3 of Andersen et al., 2015). Unlike the majority of the ice sheet, it is ice dynamics and not surface mass balance that contributes the largest fractional proportion to mass loss in this sector (Andersen et al., 2015). We expect this trend to continue in the near future. At the ice sheet-scale, 80% of total ice discharge is from glaciers in the south-east and north-west of Greenland (Enderlin et al., 2014). These regions also accounted for 86% of ice sheet-wide increases in ice discharge as it increased from 462 ± 6 Gt in 2000 to 546 ± 7 Gt in 2012 (Enderlin et al., 2014). Therefore, understanding the patterns of retreat in these regions is especially important due to their control on ice loss and overall mass balance of the ice sheet. Since 2006 discharge has stabilized in south-east Greenland following the slowdown of Kangerlussuaq and Helheim glaciers (e.g., Howat et al., 2007), and recent (2008–2012) increases in ice sheet discharge have been attributed to glaciers from the north-west (Enderlin et al., 2014). Given Kangerlussuaq’s impacts on both the magnitude and pattern of ice sheet wide mass loss (Rignot and Kanagaratnam, 2006; Stearns and Hamilton, 2007; Enderlin et al., 2014), its new phase of retreat, acceleration and thinning (e.g., Figure 3) is likely to markedly increase discharge from south-east Greenland, and may result in the south-east region dominating future increases in discharge from the ice sheet.
Conclusion
We have shown that since 2017, Kangerlussuaq has entered a new phase of rapid retreat and acceleration, the second time this has occurred within the last two decades, and its ice front is now at its most retreated position since at least the early 20th-century. This retreat has left Kangerlussuaq’s ice front in a major (∼15 km long) overdeepening. Coincident with retreat, Kangerlussuaq accelerated and thinned near the terminus, and is likely to result in substantial dynamic draw down and loss of ice to the oceans. Glacier geometry strongly modulates Kangerlussuaq’s behavior. Given the proximity of the ice front to further reverse bed slope, further retreat would very likely result in a ∼10 km retreat to the head of this trough. Due to these uncertainties, high temporal resolution monitoring of geometry, frontal position and velocity change, coupled with accurate bed topography, will be critical for accurately predicting and quantifying future patterns of ice loss at Kangerlussuaq. Given Kangerlussuaq’s previous impacts on both the magnitude and pattern of ice sheet wide mass loss, we predict that its new phase of retreat, acceleration and thinning will markedly enhance the south-east region’s contribution to increasing discharge from the ice sheet. More broadly, accurate forecasting of the ice sheet’s contribution to sea level rise will require a deeper understanding of, and responses to, these non-linear ice dynamic processes.
Author Contributions
SB, JC, and NR designed the study. JL provided the code for GEEDiT and MaQiT. SB conducted all data analysis and led the writing of the manuscript. JC, NR, and JL gave conceptual and technical advice, and edited the manuscript.
Funding
SB, JC, and NR gratefully acknowledge support from Newcastle University through its Research Excellence Academy funding scheme, which supported SB’s post-doctoral position.
Conflict of Interest Statement
The authors declare that the research was conducted in the absence of any commercial or financial relationships that could be construed as a potential conflict of interest.
Acknowledgments
We acknowledge a number of freely available datasets used in this study. We are grateful to Khan et al. (2014) and Murray et al. (2015) for making available historical terminus data; Joughin et al. (2011) for velocity and Howat et al. (2014) for surface topography data, both available as part of the MEaSUREs program; and Morlighem et al. (2017a) and Studinger (2014) for topographic and surface elevation change data, both available as port of Operation IceBridge. We thank the editor SS and two reviewers for their helpful and insightful comments. We acknowledge the use of data products from Center for Remote Sensing of Ice Sheets (CReSIS), 2018 generated with support from NSF grant ANT-0424589 and NASA grant NNX10AT68G.
Supplementary Material
The Supplementary Material for this article can be found online at: https://www.frontiersin.org/articles/10.3389/feart.2019.00123/full#supplementary-material
Footnotes
- ^ https://nsidc.org/data/NSIDC-0481
- ^ https://nsidc.org/data/IDHDT4
- ^ https://nsidc.org/data/IDBMG4
- ^ https://data.cresis.ku.edu/data/grids/
References
Andersen, M. L., Stenseng, L., Skourup, H., Colgan, W., Khan, S. A., Kristensen, S. S., et al. (2015). Basin-scale partitioning of Greenland ice sheet mass balance components (2007–2011). Earth Planet. Sci. Lett. 409, 89–95. doi: 10.1016/j.epsl.2014.10.015
Bevan, S. L., Luckman, A. J., and Murray, T. (2012). Glacier dynamics over the last quarter of a century at Helheim, Kangerdlugssuaq and 14 other major Greenland outlet glaciers. Cryosphere 6, 923–937. doi: 10.5194/tc-6-923-2012
Carr, J. R., Vieli, A., and Stokes, C. (2013). Influence of sea ice decline, atmospheric warming, and glacier width on marine-terminating outlet glacier behavior in northwest Greenland at seasonal to interannual timescales. J. Geophys. Res. Earth Surf. 118, 1210–1226. doi: 10.1002/jgrf.20088
Carr, J. R., Vieli, A., Stokes, C. R., Jamieson, S. S. R., Palmer, S. J., Christoffersen, P., et al. (2015). Basal topographic controls on rapid retreat of Humboldt Glacier, northern Greenland. J. Glaciol. 61, 137–150. doi: 10.3189/2015JoG14J128
Catania, G. A., Stearns, L. A., Sutherland, D. A., Fried, M. J., Bartholomaus, T. C., Morlighem, M., et al. (2018). Geometric controls on tidewater glacier retreat in central western Greenland. J. Geophys. Res. Earth Surf. 123, 2024–2038. doi: 10.1029/2017JF004499
Center for Remote Sensing of Ice Sheets [CReSIS] (2018). CReSIS Radar Depth Sounder Data L3 Gridded Ice Thickness, Surface, and Bottom. [Subset: Kangerdlugssuaq_2006_2014_Composite_v3]. Lawrence, KA: CReSIS. doi: 10.1029/2017jf004499
Christoffersen, P., Mugford, R. I., Heywood, K. J., Joughin, I., Dowdeswell, J. A., Syvitski, J. P. M., et al. (2011). Warming of waters in an East Greenland fjord prior to glacier retreat: mechanisms and connection to large-scale atmospheric conditions. Cryosphere 5, 701–714. doi: 10.5194/tc-5-7012011
Enderlin, E. M., Howat, I. M., Jeong, S., Noh, M.-J., van Angelen, J. H., and van den Broeke, M. R. (2014). An improved mass budget for the Greenland ice sheet. Geophys. Res. Lett. 41, 866–872. doi: 10.1002/2013GL059010
Enderlin, E. M., Howat, I. M., and Vieli, A. (2013). High sensitivity of tidewater outlet glacier dynamics to shape. Cryosphere 7, 1007–1015. doi: 10.5194/tc-7-1007-2013
Gudmundsson, G. H., Krug, J., Durand, G., Favier, L., and Gagliardini, O. (2012). The stability of grounding lines on retrograde slopes. Cryosphere 6, 1497–1505. doi: 10.5194/tc-6-1497-2012
Hanna, E., Mernild, S. H., Cappelen, J., and Steffen, K. (2012). Recent warming in Greenland in a long-term instrumental (1881–2012) climatic context: I. Evaluation of surface air temperature records. Environ. Res. Lett. 7:045404. doi: 10.1088/1748-9326/7/045404
Holland, D. M., Thomas, R. H., de Young, B., Ribergaard, M. H., and Lyberth, B. (2008). Acceleration of Jakobshavn Isbræ triggered by warm subsurface ocean waters. Nat. Geosci. 1, 659–664. doi: 10.1038/ngeo316
Howat, I. M., Ahn, Y., Joughin, I., van den Broeke, M. R., Lenaerts, J. T. M., and Smith, B. (2011). Mass balance of Greenland’s three largest outlet glaciers, 2000–2010. Geophys. Res. Lett. 38:L12501. doi: 10.1029/2011GL047565
Howat, I. M., Joughin, I., and Scambos, T. A. (2007). Rapid changes in ice discharge from greenland outlet glaciers. Science 315, 1559–1561. doi: 10.1126/science.1138478/78
Howat, I. M., Joughin, I., Tulaczyk, S., and Gogineni, S. (2005). Rapid retreat and acceleration of Helheim Glacier, east Greenland. Geophys. Res. Lett. 32:L22502. doi: 10.1029/2005GL024737
Howat, I. M., Negrete, A., and Smith, B. E. (2014). The Greenland Ice Mapping Project (GIMP) land classification and surface elevation data sets. Cryosphere 8, 1509–1518. doi: 10.5194/tc-8-1509-2014
Inall, M. E., Murray, T., Cottier, F. R., Scharrer, K., Boyd, T. J., Heywood, K. J., et al. (2014). Oceanic heat delivery via Kangerdlugssuaq Fjord to the south-east Greenland ice sheet. J. Geophys. Res. Oceans 119, 631–645. doi: 10.1002/2013JC009295
Jamieson, S. S. R., Vieli, A., Livingstone, S. J., Cofaigh, C. Ó, Stokes, C., Hillenbrand, C.-D., et al. (2012). Ice-stream stability on a reverse bed slope. Nat. Geosci. 5, 799–802. doi: 10.1038/ngeo1600
Joughin, I., Howat, I. M., Smith, B. E., and Scambos, T. (2011). MEaSUREs Greenland Ice Velocity: Selected Glacier Site Velocity Maps from InSAR, Version 1.2. [Subset: Ecoast-68.80N]. Boulder, CO: NASA National Snow and Ice Data Center Distributed Active Archive Center. doi: 10.5067/MEASURES/CRYOSPHERE/nsidc-0481.001 (accessed March 06, 2019).
Joughin, I., Smith, B. E., Howat, I. M., Floricioiu, D., Alley, R. B., Truffer, M., et al. (2012). Seasonal to decadal scale variations in the surface velocity of Jakobshavn Isbrae, Greenland: observation and model-based analysis. J. Geophys. Res. 117:F02030. doi: 10.1029/2011JF002110
Joughin, I., Smith, B. E., Howat, I. M., Scambos, T., and Moon, T. (2010). Greenland flow variability from ice-sheet-wide velocity mapping. J. Glaciol. 56, 415–430. doi: 10.3189/002214310792447734
Kehrl, L. M., Joughin, I., Shean, D. E., Floricioiu, D., and Krieger, L. (2017). Seasonal and interannual variabilities in terminus position, glacier velocity, and surface elevation at Helheim and Kangerlussuaq Glaciers from 2008 to 2016. J. Geophys. Res. Earth Surf. 122, 1635–1652. doi: 10.1002/2016JF004133
Khan, S. A., Kjeldsen, K. K., Kjær, K. H., Bevan, S., Luckman, A., Aschwanden, A., et al. (2014). Glacier dynamics at Helheim and Kangerdlugssuaq glaciers, southeast Greenland, since the little ice age. Cryosphere 8, 1497–1507. doi: 10.5194/tc-8-1497-2014
Lea, J. M. (2018). The Google Earth Engine Digitisation Tool (GEEDiT) and the Margin change Quantification Tool (MaQiT) – simple tools for the rapid mapping and quantification of changing Earth surface margins. Earth Surf. Dynam. 6, 551–561. doi: 10.5194/esurf-6-551-2018
Lea, J. M., Mair, D. W. F., and Rea, B. R. (2014). Evaluation of existing and new methods of tracking glacier terminus change. J. Glaciol. 60, 323–332. doi: 10.3189/2014JoG13J061
Luckman, A., Murray, T., de Lange, R., and Hanna, E. (2006). Rapid and synchronous ice-dynamic changes in East Greenland. Geophys. Res. Lett. 33:L03503. doi: 10.1029/2005GL025428
Meier, M. F., and Post, A. (1987). Fast tidewater glaciers. J. Geophys. Res. 92, 9051–9058. doi: 10.1029/JB092iB09p09051
Moon, T., and Joughin, I. (2008). Changes in ice front position on Greenland’s outlet glaciers from 1992 to 2007. J. Geophys. Res. 113:F02022. doi: 10.1029/2007JF000927
Moon, T., Joughin, I., and Smith, B. (2015). Seasonal to multiyear variability of glacier surface velocity, terminus position, and sea ice/ice mélange in northwest Greenland. J. Geophys. Res. Earth Surf. 120, 818–833. doi: 10.1002/2015JF003494
Moon, T., Joughin, I., Smith, B., and Howat, I. (2012). 21st-century evolution of greenland outlet glacier velocities. Science 336, 576–578. doi: 10.1126/science.1219985
Morlighem, M., Bondzio, J., Seroussi, H., Rignot, E., Larour, E., Humbert, A., et al. (2016). Modeling of Store Gletscher’s calving dynamics, West Greenland, in response to ocean thermal forcing. Geophys. Res. Lett. 43, 2659–2666. doi: 10.1002/2016GL067695
Morlighem, M., Williams, C. N., Rignot, E., An, L., Arndt, J. E., et al. (2017a). IceBridge BedMachine Greenland, Version 3. [Subsets: bed; errbed; source; surface]. Boulder, CO: NASA National Snow and Ice Data Center Distributed Active Archive Center. doi: 10.5067/2CIX82HUV88Y (accessed August 29, 2018).
Morlighem, M., Williams, C. N., Rignot, E., An, L., Arndt, J. E., Bamber, J. L., et al. (2017b). BedMachine v3: complete bed topography and ocean bathymetry mapping of greenland from multibeam echo sounding combined with mass conservation. Geophys. Res. Lett. 44, 11051–11061. doi: 10.1002/2017GL074954
Murray, T., Scharrer, K., Selmes, N., Booth, A. D., James, T. D., Bevan, S. L., et al. (2015). Extensive retreat of Greenland tidewater glaciers, 2000–2010. Arct. Antarct. Alpine Res. 47, 427–447. doi: 10.1657/AAAR0014-049
Nick, F. M., Vieli, A., Howat, I. M., and Joughin, I. (2009). Large-scale changes in Greenland outlet glacier dynamics triggered at the terminus. Nat. Geosci. 2, 110–114. doi: 10.1038/ngeo394
O’Neel, S., Pfeffer, W. T., Krimmel, R., and Meier, M. (2005). Evolving force balance at Columbia Glacier, Alaska, during its rapid retreat. J. Geophys. Res. 110:F03012 doi: 10.1029/2005JF000292
Raymond, C. (1996). Shear margins in glaciers and ice sheets. J. Glaciol. 42, 90–102. doi: 10.3189/S0022143000030550
Rignot, E., and Kanagaratnam, P. (2006). Changes in the velocity structure of the greenland ice sheet. Science 311, 986–990. doi: 10.1126/science.1121381
Schoof, C. (2007). Ice sheet grounding line dynamics: steady states, stability, and hysteresis. J. Geophys. Res. 112:F03S28. doi: 10.1029/2006JF000664
Stearns, L. A., and Hamilton, G. S. (2007). Rapid volume loss from two East Greenland outlet glaciers quantified using repeat stereo satellite imagery. Geophys. Res. Lett. 34:L05503. doi: 10.1029/2006GL028982
Stocker, T. F., Qin, D., Plattner, G.-K., Tignor, M. M. B., Allen, S. K., Boschung, J., et al. (eds) (2013). Climate change 2013: The Physical Science Basis. Contribution of Working Group I to the Fifth Assessment Report of the Intergovernmental Panel on Climate Change. Cambridge: Cambridge University Press, 1535.
Straneo, F., and Heimbach, P. (2013). North Atlantic warming and the retreat of Greenland’s outlet glaciers. Nature 504, 36–43. doi: 10.1038/nature12854
Studinger, M. (2014). IceBridge ATM L4 Surface Elevation Rate of Change, Version 1. [Subsets: 2001.05.20; 2002.05.18; 2005.05.14; 2007.05.10; 2010.03.23; 2011.03.16; 2012.03.30; 2013.04.02; 2014.03.12; 2015.04.08; 2016.05.09; 2017.03.22]. Boulder, CO: NASA National Snow and Ice Data Center Distributed Active Archive Center. doi: 10.5067/BCW6CI3TXOCY (accessed March 06, 2019).
Thomas, R. H. (1979). The dynamics of marine ice sheets. J. Glaciol. 24, 167–177. doi: 10.3189/S0022143000014726
Thomas, R. H. (2004). Force-perturbation analysis of recent thinning and acceleration of Jakobshavn Isbræ. Greenland. J. Glaciol. 50, 57–66. doi: 10.3189/172756504781830321
Thomas, R. H., Abdalati, W., Akins, T. L., Csatho, B. M., Frederick, E. B., Gogineni, S. P., et al. (2000). Substantial thinning of a major east Greenland outlet glacier. Geophys. Res. Lett. 27, 1291–1294. doi: 10.1029/1999GL008473
Thomas, R. H., Frederick, E., Li, J., Krabill, W., Manizade, S., Paden, J., et al. (2011). Accelerating ice loss from the fastest Greenland and Antarctic glaciers. Geophys. Res. Lett. 38:L10502. doi: 10.1029/2011GL047304
van den Broeke, M. R., Enderlin, E. M., Howat, I. M., Kuipers Munneke, P., Noël, B. P. Y., van de Berg, W. J., et al. (2016). On the recent contribution of the Greenland ice sheet to sea level change. Cryosphere 10, 1933–1946. doi: 10.5194/tc-10-1933-2016
Van Der Veen, C. J., Plummer, J. C., and Stearns, L. A. (2011). Controls on the recent speed-up of Jakobshavn Isbræ, West Greenland. J. Glaciol. 57, 770–782. doi: 10.3189/002214311797409776
Keywords: Greenland ice sheet, marine-terminating glaciers, basal topography, ice discharge, mass balance, glacier retreat, sea level rise, remote sensing
Citation: Brough S, Carr JR, Ross N and Lea JM (2019) Exceptional Retreat of Kangerlussuaq Glacier, East Greenland, Between 2016 and 2018. Front. Earth Sci. 7:123. doi: 10.3389/feart.2019.00123
Received: 22 December 2018; Accepted: 08 May 2019;
Published: 31 May 2019.
Edited by:
Shin Sugiyama, Hokkaido University, JapanReviewed by:
Johannes Jakob Fürst, Friedrich–Alexander University Erlangen–Nürnberg, GermanyDavid Loibl, Humboldt University of Berlin, Germany
Copyright © 2019 Brough, Carr, Ross and Lea. This is an open-access article distributed under the terms of the Creative Commons Attribution License (CC BY). The use, distribution or reproduction in other forums is permitted, provided the original author(s) and the copyright owner(s) are credited and that the original publication in this journal is cited, in accordance with accepted academic practice. No use, distribution or reproduction is permitted which does not comply with these terms.
*Correspondence: Stephen Brough, c3RlcGhlbi5icm91Z2hAbmNsLmFjLnVr