 Katherine L. Maier1,2*†
 Jennifer A. Gales3
 Charles K. Paull1
 Kurt Rosenberger2
 Peter J. Talling4
 Stephen M. Simmons5
 Roberto Gwiazda1
 Mary McGann6
 Matthieu J. B. Cartigny4
 Eve Lundsten1
 Krystle Anderson1
 Michael A. Clare7Jingping Xu8Daniel Parsons5James P. Barry1Monica Wolfson-Schwehr1Nora M. Nieminski9Esther J. Sumner10
- 1Monterey Bay Aquarium Research Institute, Moss Landing, CA, United States
- 2Pacific Coastal and Marine Science Center, U.S. Geological Survey, Santa Cruz, CA, United States
- 3School of Biological and Marine Sciences, University of Plymouth, Plymouth, United Kingdom
- 4Department of Geography and Department of Earth Sciences, University of Durham, Durham, United Kingdom
- 5Energy and Environment Institute, University of Hull, Hull, United Kingdom
- 6Pacific Coastal and Marine Science Center, U.S. Geological Survey, Menlo Park, CA, United States
- 7National Oceanography Centre, University of Southampton, Southampton, United Kingdom
- 8Southern University of Science and Technology of China, Shenzhen, China
- 9Department of Geological Sciences, Stanford University, Stanford, CA, United States
- 10School of Ocean and Earth Science, University of Southampton, Southampton, United Kingdom
Submarine canyons are conduits for episodic and powerful sediment density flows (commonly called turbidity currents) that move globally significant amounts of terrestrial sediment and organic carbon into the deep sea, forming some of the largest sedimentary deposits on Earth. The only record available for most turbidity currents is the deposit they leave behind. Therefore, to understand turbidity current processes, we need to determine the degree to which these flows are represented by their deposits. However, linking flows and deposits is a major long-standing scientific challenge. There are few detailed measurements from submarine turbidity currents in action, and even fewer direct measurements that can be compared to resulting seabed deposits. Recently, an extensive array of moorings along Monterey Canyon, offshore California, took measurements and samples during sediment density flow events, providing the most comprehensive dataset to date of turbidity current flows and their deposits. Here, we use sediment trap samples, velocity measurements, and seafloor cores to document how sand is transported through a submarine canyon, and how the transported sediment is represented in seafloor deposits. Sediment trap samples from events contain primarily fine to medium-grained sand with sharp bases, normal grading, and muddy tops. Sediment captured from the water column during the flow shows normal grading, which is broadly consistent with the initial peak and waning of flow velocities measured at a single height within the flow, and may be enhanced by collapsing flows. Flow events contain coarser sand concentrated toward the seafloor and larger grain sizes on the seafloor or in the dense near-bed layer, possibly representative of stratified flows. Although flow velocity varies, sand grain sizes in sediment traps are similar over distances of 50 km down-canyon, suggesting that grain size is an unfaithful record of down-canyon changes in maximum flow speeds. Sand transported within flow events and sampled in sediment traps is similar to sand sampled from the seafloor shortly after the events, but traps do not contain pebbles and gravel common in seabed deposits. Seabed deposits thus appear to faithfully record the sand component that is transported in the water column during sub-annual turbidity currents.
Introduction
The stratigraphic record is the primary archive from which Earth’s history is deciphered. Persistent challenges in sampling directly from sediment-laden flows in many environments, and subsequently sampling their deposits, have resulted in continued debate regarding the fidelity to which sedimentary deposits record sediment transport processes (e.g., Hodgson et al., 2018). Modern sediment transport processes in the deep sea have been especially difficult to observe, measure, and sample in submarine canyon environments (e.g., Paull et al., 2010, 2018; Talling et al., 2015) because of great water depths, and the often-unpredictable timing, and destructive potential of some powerful flows (e.g., Harris and Whiteway, 2011; Xu, 2011; Xu et al., 2014; Clare et al., 2017). Turbid mixtures of sediment and seawater are driven down submarine canyons by density differences between the flow and surrounding seawater. These mixtures, termed sediment density flows (and commonly referred to as turbidity currents), are responsible for the offshore transport of large amounts of sediment into the deep sea and accumulation of submarine fans (e.g., Talling et al., 2015). Decades of research have recognized, mapped, and sampled sediment density flow deposits (e.g., turbidites) (e.g., Shepard, 1951; Normark, 1974; Mutti and Normark, 1987; Cronin and Kidd, 1998; Williams et al., 1998; Anderson et al., 2006) without the benefit of comprehensive observations of modern processes. In a small number of submarine canyons, sediment traps have been successfully deployed to capture sediment directly from within turbidity currents (e.g., Xu et al., 2010, 2014; Liu et al., 2016). However, there are very few examples of comparisons between direct flow measurements and resulting seabed deposits (e.g., Symons et al., 2017; Hage et al., 2018). This study provides the most detailed comparison to date between measured sediment density flows (Paull et al., 2018) paired with samples of suspended sediment and resulting seabed deposits. Thus, this dataset allows us to address how sediment density flows are recorded by deposits, and the fidelity of that record.
In recent years, advances in technology have allowed turbidity currents to be monitored in unprecedented detail (e.g., Hughes Clarke, 2016; Azpiroz-Zabala et al., 2017; Hage et al., 2018; Paull et al., 2018). Monterey Canyon, offshore central California (Figure 1A), has been a focus of geologic, oceanographic, and ecologic submarine canyon studies (e.g., Matos et al., 2018), making it an important analog for other submarine canyons and turbidity currents. Specifically, Monterey Canyon studies have made significant progress measuring processes and resulting deposits of sediment density flows (e.g., Paull et al., 2003, 2005, 2010, 2011, 2018; Xu and Noble, 2004; Xu et al., 2004, 2008, 2013, 2014; Smith et al., 2005, 2007; Stevens et al., 2014; Symons et al., 2017; Paull et al., 2018). Sediment density flows travel down Monterey Canyon along the axial channel, over time accumulating the vast Monterey submarine fan 100s of kilometers from the canyon (e.g., Fildani and Normark, 2004). Frequent (sub-annual) sediment density flow events in Monterey Canyon have been sufficiently powerful to produce geomorphic change of bedforms in the canyon head and axial channel (e.g., Smith et al., 2005, 2007; Xu et al., 2008, 2014; Paull et al., 2010, 2011, 2018), although these recent flows did not continue far enough down-canyon to deposit sand on distal Monterey Fan (e.g., Stevens et al., 2014). In Monterey Canyon, internal tidal flows also transport fine-grained sediment between sediment density flow events (Xu and Noble, 2009).
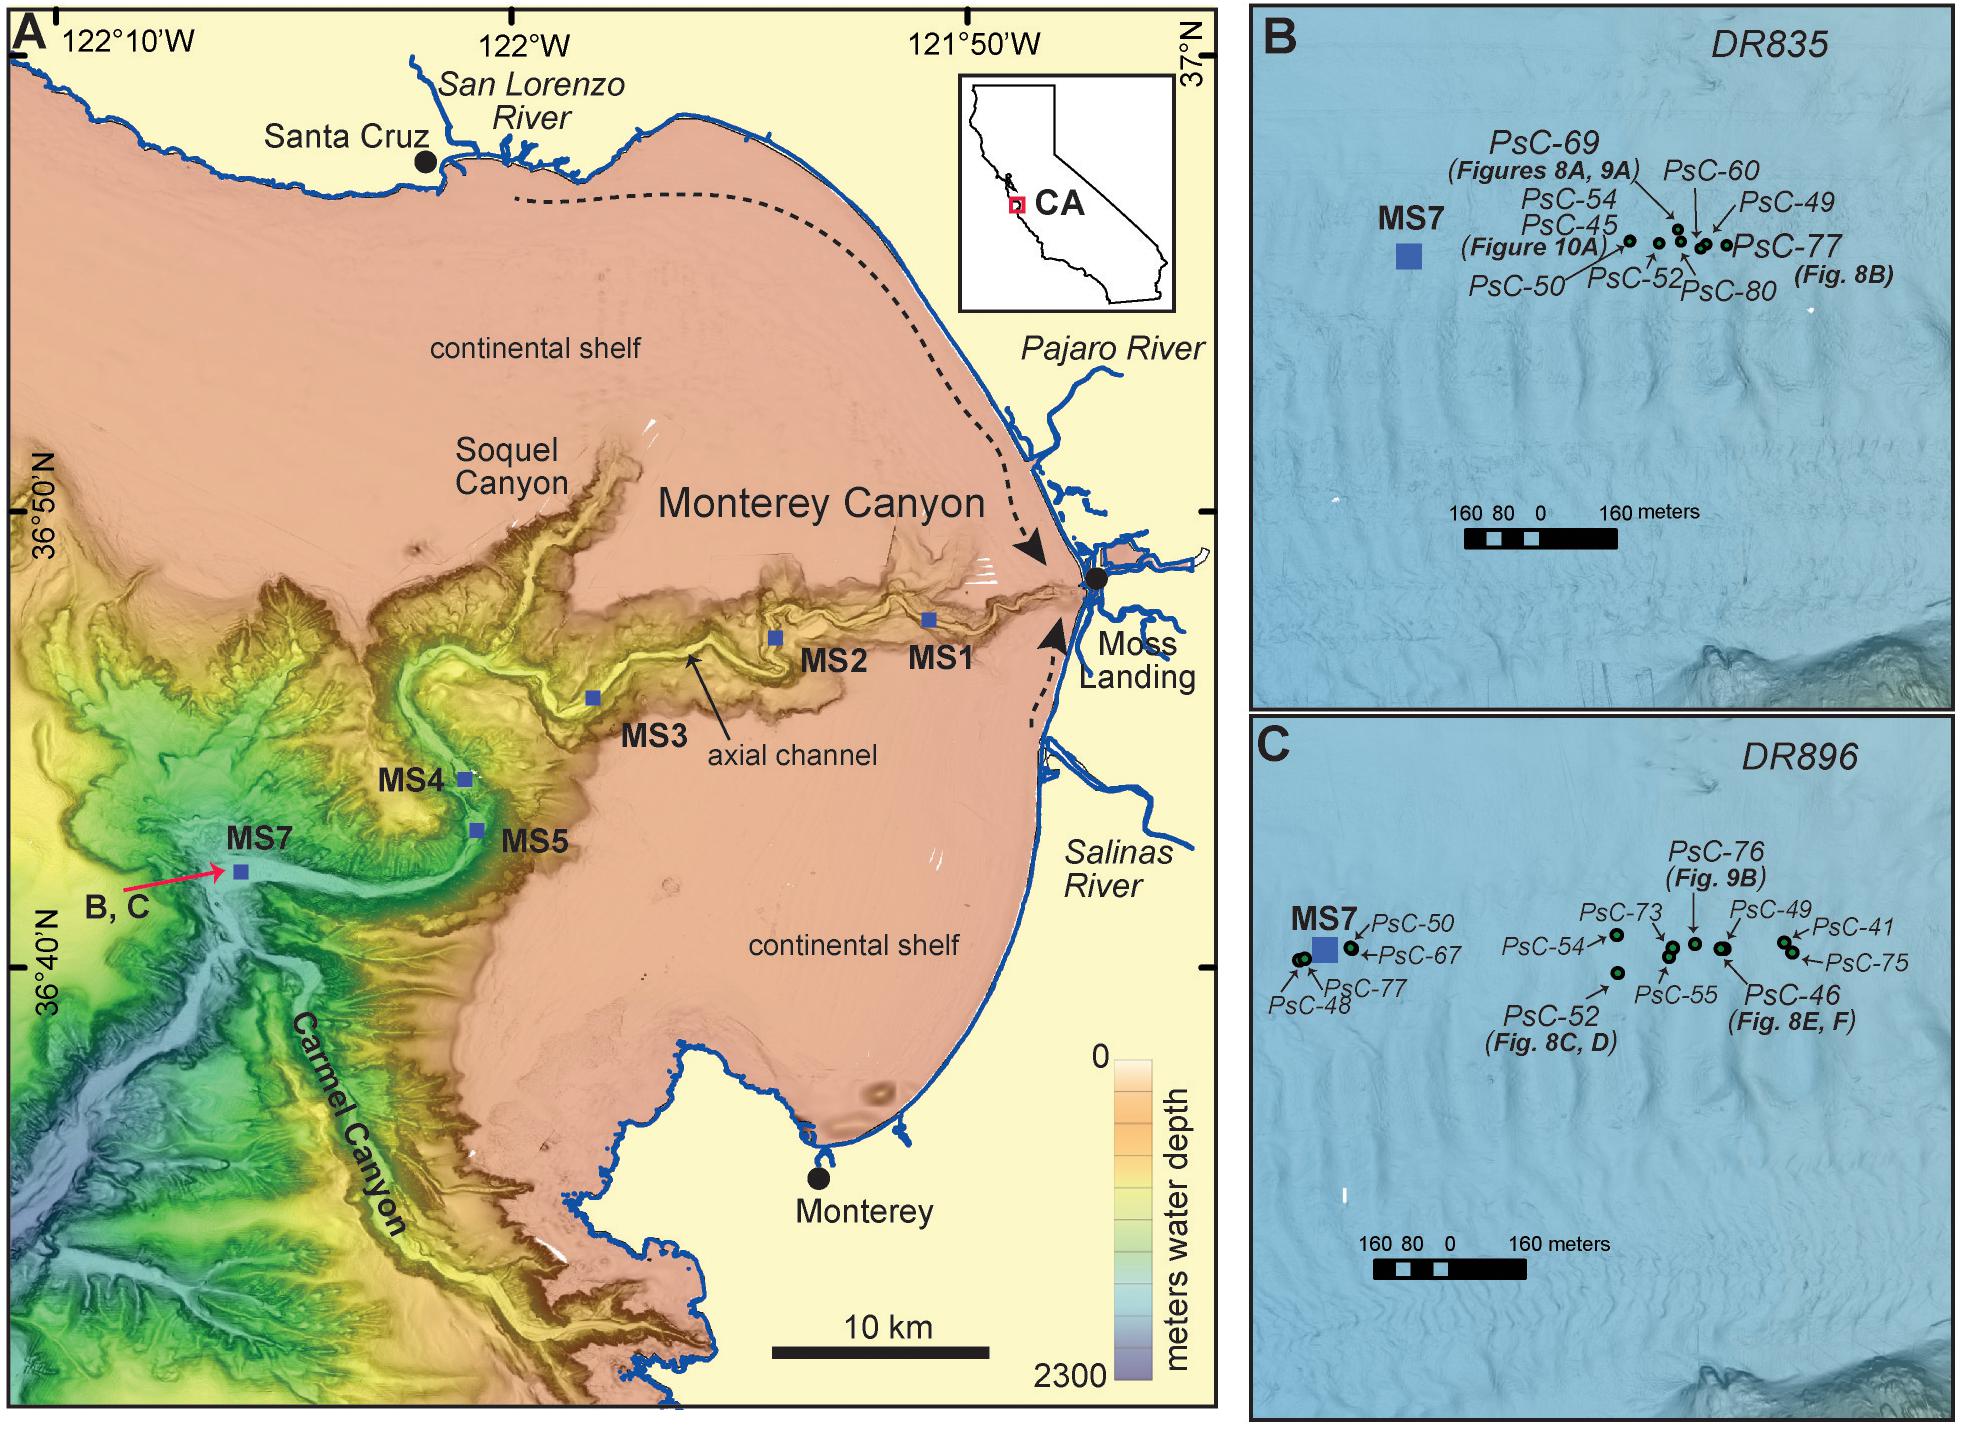
Figure 1. Sample locations in Monterey Canyon, offshore central California. (A) Coordinated Canyon Experiment (CCE) moorings along Monterey Canyon axial channel (modified from Paull et al., 2018). Dashed arrows signify longshore transport of sand into Monterey Canyon. (B) Locations of remotely operate vehicle (ROV) pushcores from DR835, collected April 19, 2016 and plotted on Monterey Bay Aquarium Research Institute (MBARI) mapping autonomous underwater vehicle (AUV) 1-m lateral resolution slope-shaded multibeam bathymetry acquired on April 18, 2016. (C) Locations of ROV pushcores from DR896, collected October 19, 2016 and plotted on MBARI AUV 1-m lateral resolution slope-shaded multibeam bathymetry acquired on December 6, 2016.
Sediment enters Monterey Canyon primarily where the canyon head is incised nearly to the shoreline and receives sediment from littoral cells fed largely by the Salinas, Pajaro, and San Lorenzo rivers, as well as coastal cliff erosion around Monterey Bay (e.g., Griggs and Hein, 1980; Inman and Jenkins, 1999; Farnsworth and Warrick, 2007). Erosion and failure of the submarine canyon walls and floor also contribute sediment to the axial channel (e.g., Maier et al., 2016, 2018; Paull et al., 2018). Frequent sediment density flow events along the axial channel deposit coarse-grained sand and bedrock clasts up to cobble size that are commonly overlain by woody plant material and a thin (few cm) layer of mud at the seafloor (Paull et al., 2005, 2010). Variations in stratigraphy occur along the canyon axis within 10s of meters and across axial channel bedforms (Paull et al., 2010).
Recent studies in Monterey Canyon have demonstrated the utility of sediment traps on oceanographic moorings to obtain samples of sediment directly from the water column during sediment density flow events (e.g., Xu et al., 2014; Symons et al., 2017). However, a persistent challenge has been sampling from the lower, powerful and destructive parts of the flow events. Xu et al. (2014) primarily recovered very fine sand and silt from sediment density flow events in traps at 70–300 m above the seafloor (masf) on three moorings. Symons et al. (2017) noted that sediment in traps deployed at 70 masf on three moorings anchored at 820–1445 m water depth along Monterey Canyon axial channel were broadly comparable to grain sizes sampled later along canyon flanks approximately 70 m above the axial channel.
To measure sediment density flows in a comprehensive manner, a multi-institution experiment, referred to as the Coordinated Canyon Experiment (CCE), was undertaken in Monterey Canyon (Paull et al., 2018). The CCE included a mooring array with an unprecedented number of sediment traps deployed closer to the seabed (∼10 masf) than previous experiments (Table 1), and these sediment traps were paired with velocity measurements and seabed samples (Figure 1), providing a unique opportunity for comparisons herein. During the 18-month-long experiment, 15 sediment density flow events were measured (Paull et al., 2018). Three of these events (January 15, 2016; September 1, 2016; February 3, 2017) traversed > 50 km down-canyon, and others (e.g., January 22, 2017) only passed through part of the CCE array (Figure 1A) (Paull et al., 2018). Events comprised a dense near-bed layer and an overriding, more dilute sediment cloud (Paull et al., 2018). These powerful events moved down-canyon at speeds up to 7.2 m/s but were not linked to obvious or major external triggers (e.g., floods, storms, earthquakes; Paull et al., 2018).
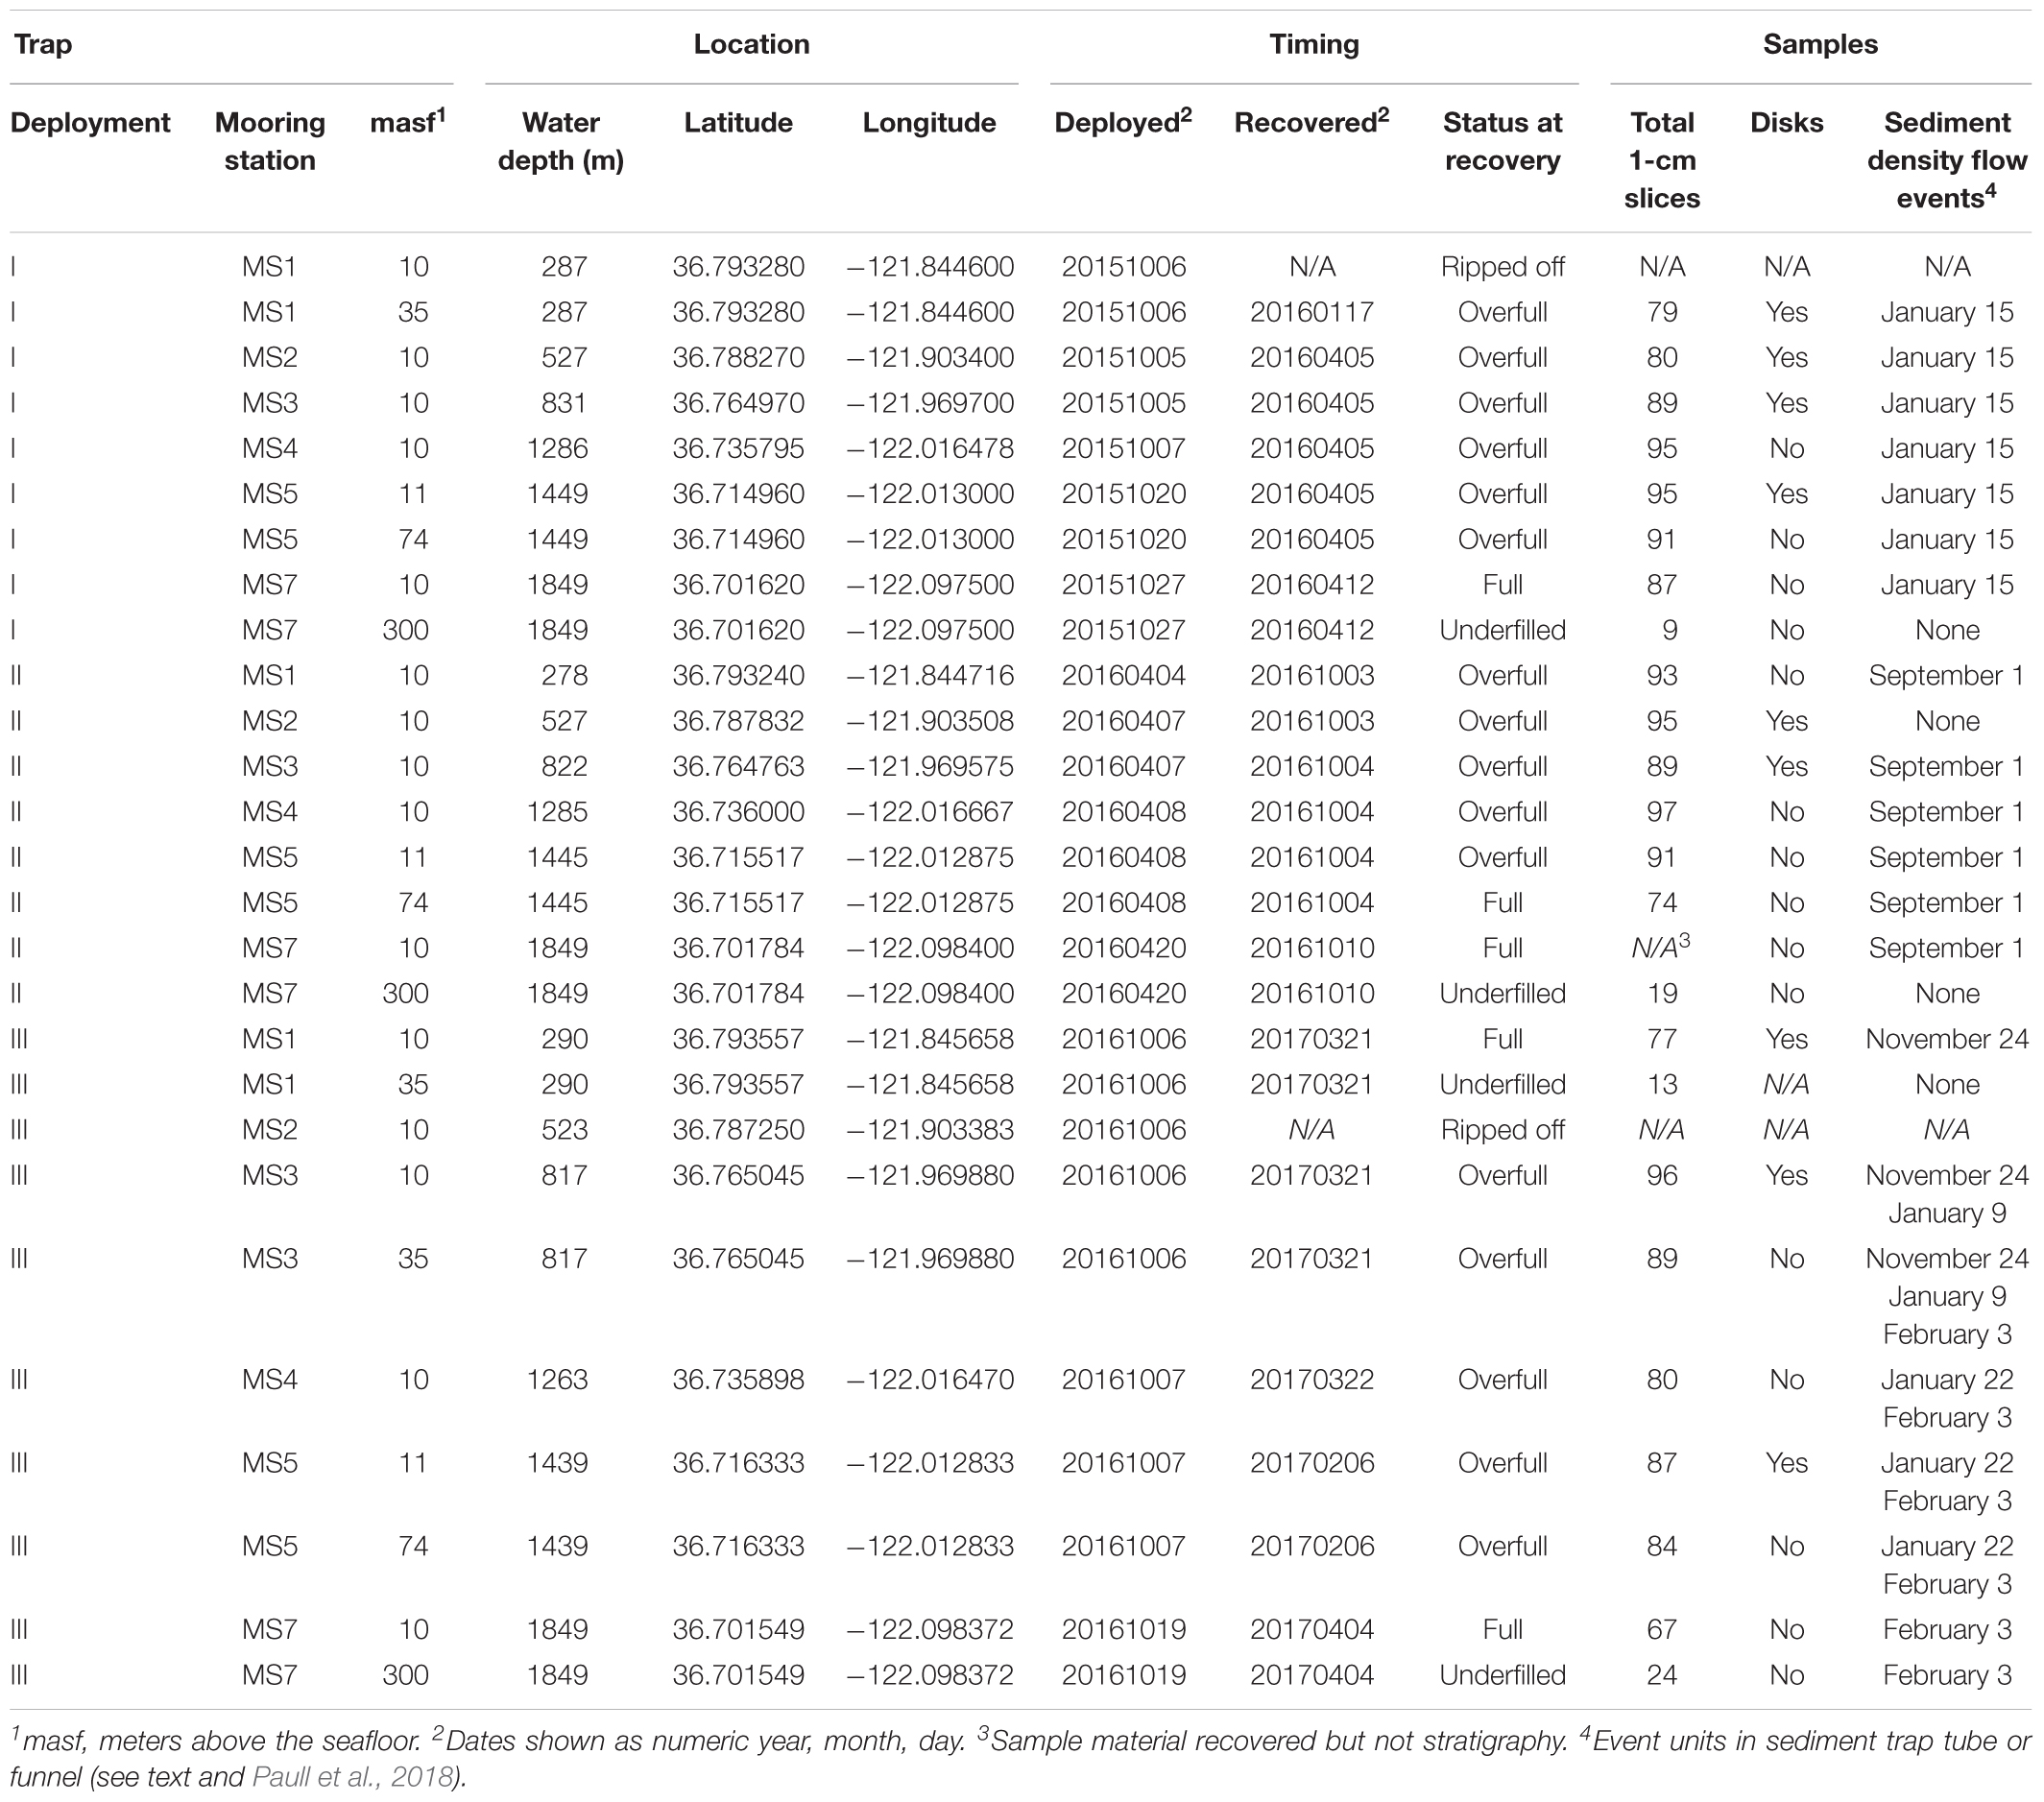
Table 1. Anderson-type sediment trap samples.
Aim
The overarching aim of this study is to test the fidelity of the depositional record of turbidity currents (i.e., how well flows are recorded by their deposits), by comparing measurements of flow velocities, sediment captured in traps within the flow, and seabed deposits. Here, we present and compare new results from sediment trap samples and seafloor cores acquired during the CCE, with flow measurements made over the same time interval (Paull et al., 2018). We aim to use the unique observational CCE dataset to consider these questions – (1) Are flow variations faithfully recorded at a single location? We address this question at single mooring locations in two parts by considering whether trends in flow velocity over time are shown by patterns of vertical grading within samples, and whether vertical variations in flow velocity are represented by vertical grain size fractionation. (2) Are flow variations recorded along the canyon? We address this question by comparing measured velocities with grain size samples along 50-km of the canyon. (3) Do seabed deposits record grain sizes that were suspended during flow events? We compare grain sizes within trap samples with grain sizes in seabed deposits remaining after a flow event (and before the next flow event).
Materials and Methods
This study focuses on samples obtained from sediment density flow events during the CCE (Figure 1A) and subsequent post-event sampling of seafloor deposits (Figures 1B,C). The CCE captured sediment density flow events in Anderson-type sediment traps deployed on six moorings along 50 km of Monterey Canyon axial channel (Paull et al., 2018). Sediment traps were suspended approximately 10 masf on each mooring, with additional traps at 35–300 masf (Figure 2A and Table 1). The 18-month-long CCE was conducted in three 6-month deployments (I: October 2015–April 2016; II: April–October 2016; III: October 2016–April 2017).
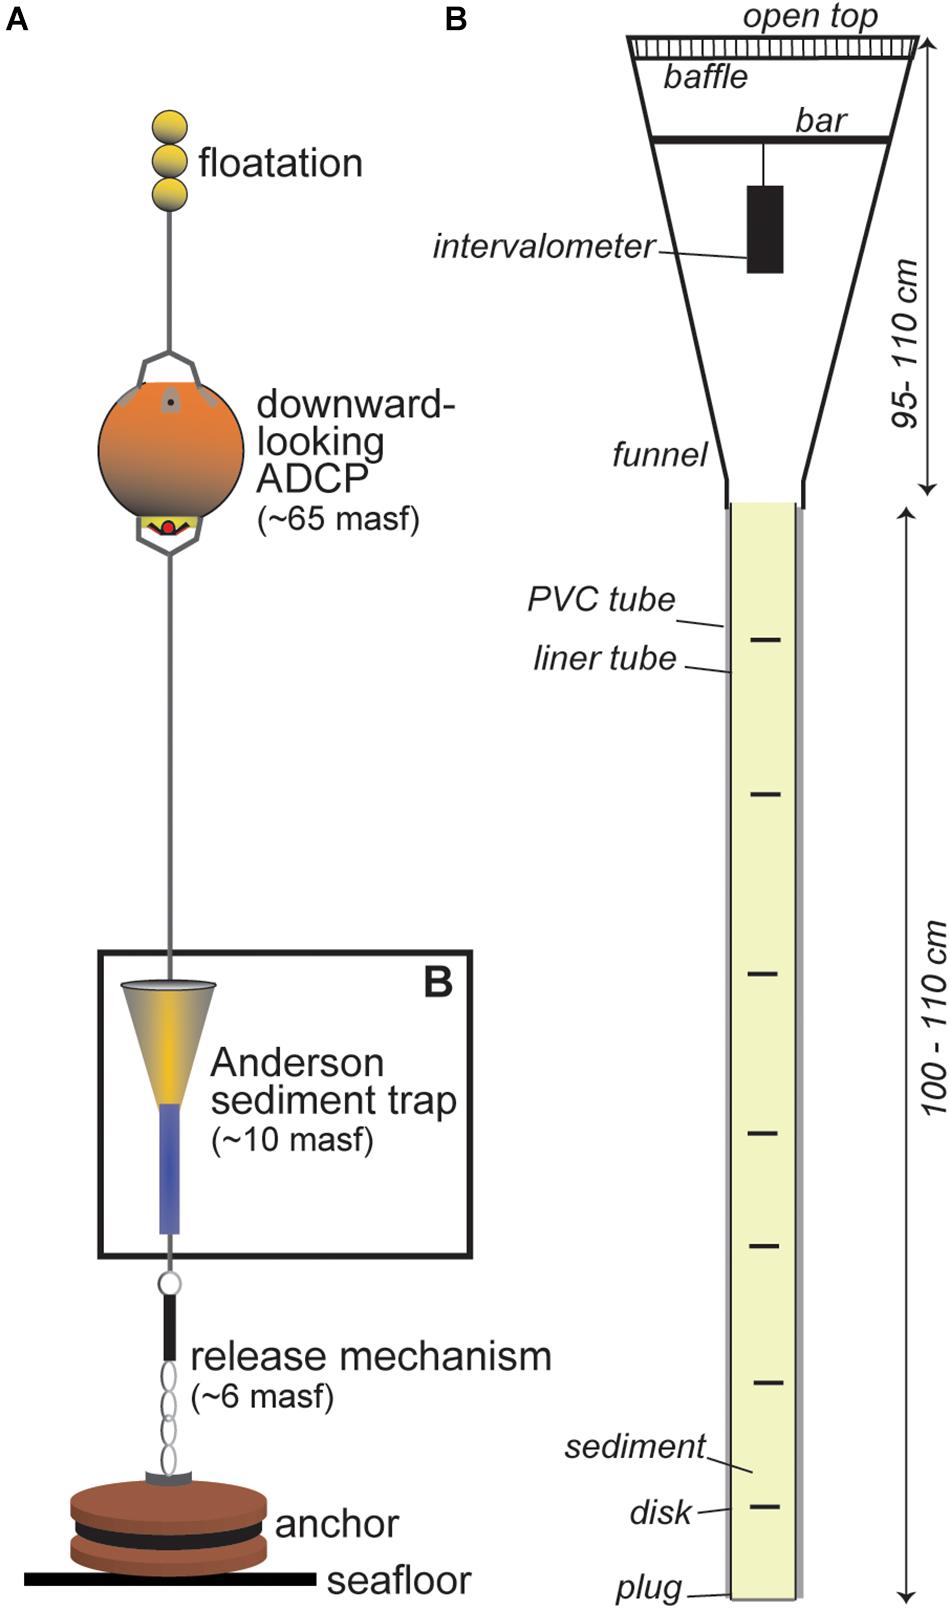
Figure 2. Schematic illustrations of Coordinated Canyon Experiment moorings and sediment traps deployed in Monterey Canyon. (A) Anderson-type sediment trap on mooring (not to scale) (modified from Paull et al., 2018). ADCP: acoustic Doppler current profiler. masf, meters above the seafloor. (B) Anderson-type sediment trap (not to scale).
Sediment enters Anderson-type sediment traps (after Anderson, 1977; Rendigs et al., 2009) through an open top, baffled funnel [∼95–110 cm long, ∼25 cm diameter (0.05 m2) top opening] and accumulates below in a clear plastic liner tube inside a PVC tube (up to ∼110 cm long) (Figure 2B). To deter bioturbation in the sediment trap, the trap was initially filled with a dilute hypersaline solution of sodium azide (<5%) (e.g., Hedges et al., 1993). Intervalometers (after Rendigs et al., 2009) in Anderson sediment trap funnels dropped up to 20 disks into the liner tube at pre-set intervals (typically 8 days).
Sediment trap liner tubes were logged using a multi-sensor core logger (MSCL) and x-ray computed tomography (CT). CT scanning used a GE LightSpeed Ultra instrument at a Stanford University Petroleum Research Institute (SUPRI-A) Enhanced Oil Recovery and Unconventional Resources laboratory facility, at 120 kV and 140 mA with 1.25 mm axial slices (Deployment I), and a General Electric LightSpeed 16 CT scanner at the Lawrence Berkeley National Laboratory Rock Dynamic and Imaging Lab at 120 kV and 160 mA reconstructed to 0.625 mm axial slices (deployments II and III). MSCL logging included gamma-ray density, p-wave velocity, and magnetic susceptibility at the U.S. Geological Survey in Santa Cruz, California. After scanning, sediment from liner tubes were extruded in 1-cm intervals, and sub-samples were stored in Whirl-Pak plastic bags.
The Monterey Bay Aquarium Research Institute’s (MBARI) remotely operated vehicle (ROV) Doc Ricketts collected two sets of pushcore samples (<22 cm) (after Paull et al., 2014) near the CCE mooring MS7 that were analyzed for grain size in the same lab as the sediment trap samples. Pushcores were extruded en masse or in 1-cm slices onboard the R/V Western Flyer. Precise timing of sediment density flow events determined by CCE instruments (Paull et al., 2018) constrains that the January 15, 2016 event was the most recent event preceding DR835 sampling in April 2016, and likewise, September 1, 2016 event was the most recent event preceding DR896 sampling in October 2016.
Grain size was measured using a laser particle size analyzer for sediment trap samples (every 1 or 5 cm) and ROV pushcore samples (every cm or selected intervals) at the National Oceanography Centre, Southampton using a Malvern II Mastersizer instrument measuring in quarter-phi bins. Prior to grain size analyses, samples were sieved to remove particles > 2 mm diameter, and ∼1 cm3 sub-samples were treated with 10% sodiumhexametaphosphate solution for a total of 20 mL. Treated samples were continuously agitated on a mechanical shaker for > 12 h. Analyses were primarily run using the Malvern II autosampler, and random samples were selected and measured manually for comparison. Reported values were averaged from three runs per sample. Representative grain-size analyses presented herein are preferentially selected from near the base of an event unit to consider the coarsest sediment transported by the flow and to reduce signals from interactions with post-event internal tide flow. Representative grain-size analyses were also preferentially selected from trap liner tubes rather than funnel samples, where available and not altered by extrusion deformation (see below), for consistency in sample collection.
Coordinated Canyon Experiment moorings with sediment traps also included downward-looking 300 kHz acoustic Doppler current profilers (ADCPs) at 65 masf that measured velocity in 7-ping ensembles every 30 s in 1-m bins between the ADCP and the seafloor (Paull et al., 2018). Herein, we use maximum ADCP-measured velocities from the entire ADCP profile during events, as well as transit velocities calculated from arrival times at successive moorings, as reported in Paull et al. (2018). For further comparison with sediment trap samples, velocities (magnitude of root mean square E-W and N-S velocities) are extracted at 10 masf (bin 055; approximately adjacent to the sediment trap samples at 10 masf) during the January 15 and September 1, 2016 events. ADCP data are not presented from the January 15, 2016 event at MS1, because the MS1 mooring was transported and ripped off its anchor during the event (Paull et al., 2018). ADCP data are also not presented from the September 1, 2016 event at MS4, where the ADCP malfunctioned.
Results
Sediment Traps
Sand layers were identified visually, in CT scan images, and in grain size analyses from 21 Anderson-type sediment trap deployments during the CCE (Figure 3 and Table 1). Sand layers up to 60 cm thick (e.g., Figure 4A) are present in the sediment trap liner tubes, and commonly overfilled the traps into the funnels in moorings MS1 to MS4 (Figure 3 and Supplementary Figures S1–S3). In CT scans of trap tubes, sands are lighter color and have sharp base contacts with the darker color underlying mud, wherein the transition to sand occurs over < 1 cm (Figures 3, 4). Deformation along the boundary between sand and mud units is apparent in CT scans of sediment trap tubes (e.g., Figures 3A, 4A). This deformation is associated with differential loading which produced diapiric penetration of underlying muds into the overlying sand and was observed to continue during extrusion.
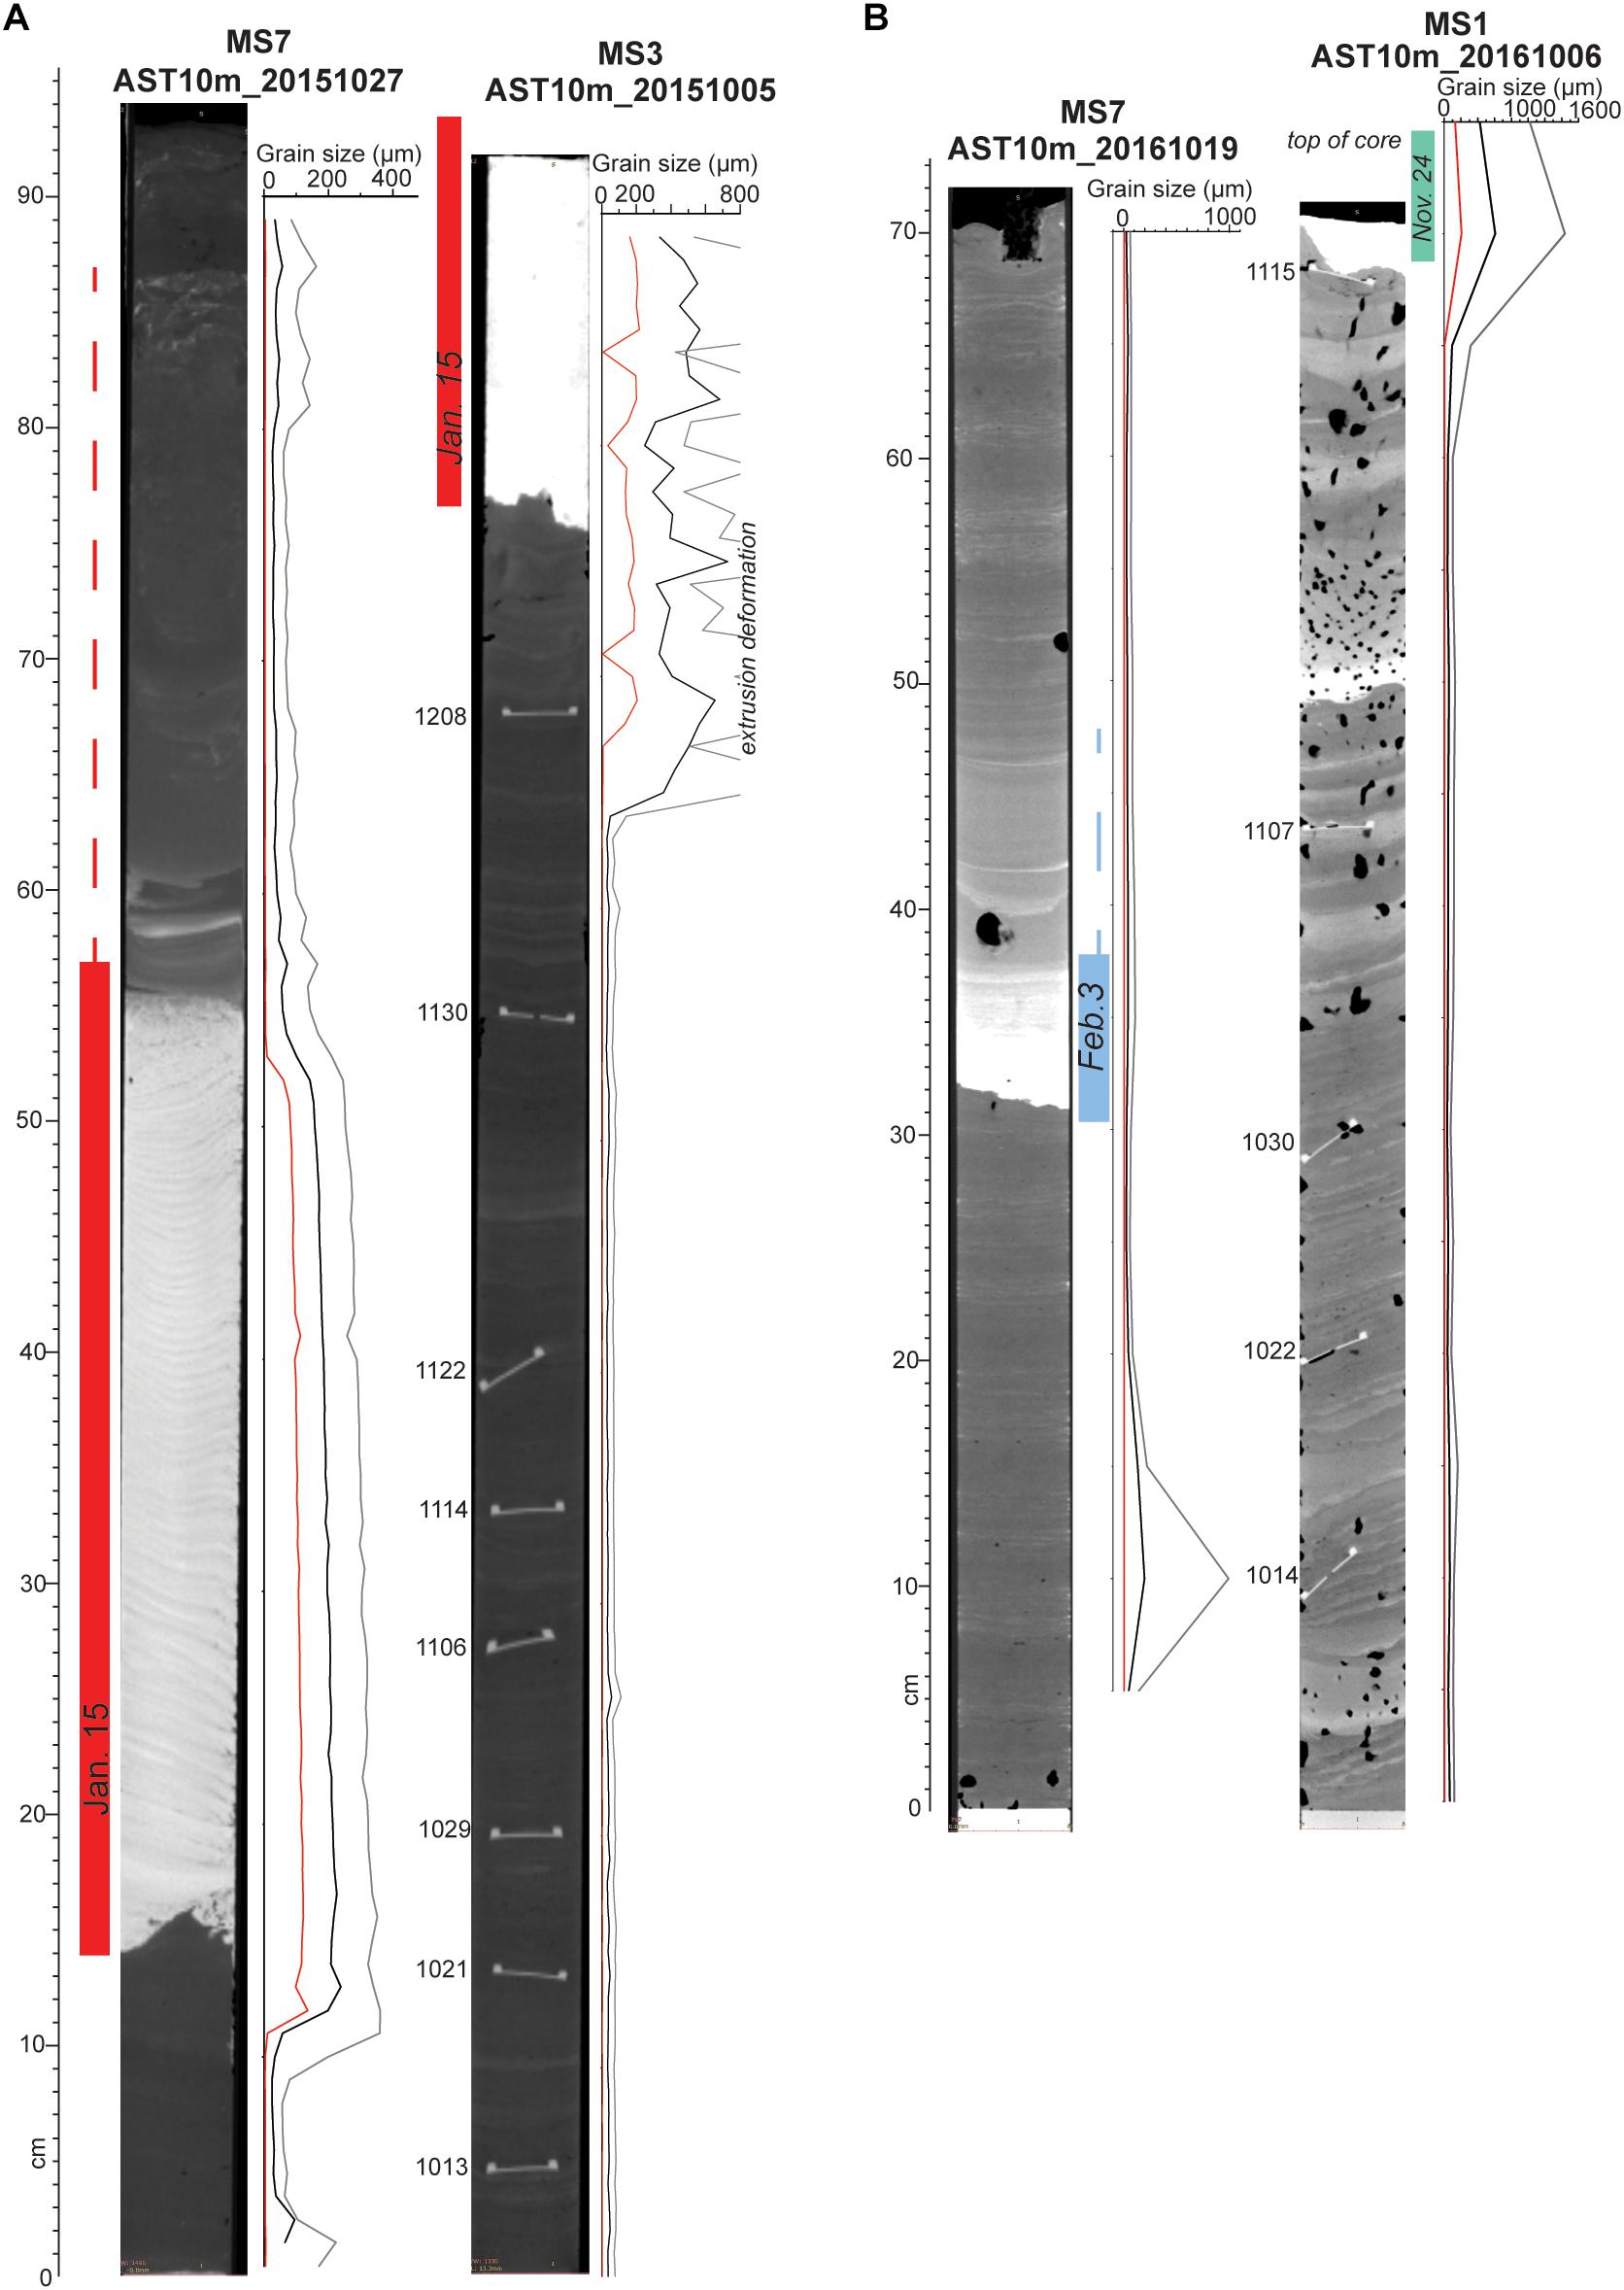
Figure 3. Sediment trap sample examples. Data is shown as computed tomography (CT) images (left; shading adjusted independently for each image) and grain size [right; d0.1 (10th percentile; red), d[4,3] (volume weighted mean; black), and d0.9 (90th percentile; gray)]. Intervalometers in the trap funnels deployed disks into the trap tubes at preset intervals during deployment; these disks are seen in cross-section in the CT images and labeled with dates as numeric month and day (e.g., 1122 is November 22). Sediment density flow event units contain coarser sediment (sand) and a lighter shade in CT than fine-grained inter-event units. (A) Deployment I. Sediment units from the January 15, 2016 event are highlighted in red. (B) Deployment III. Sediment units from the February 3, 2017 and November 24, 2016 events are highlighted in blue and green, respectively.
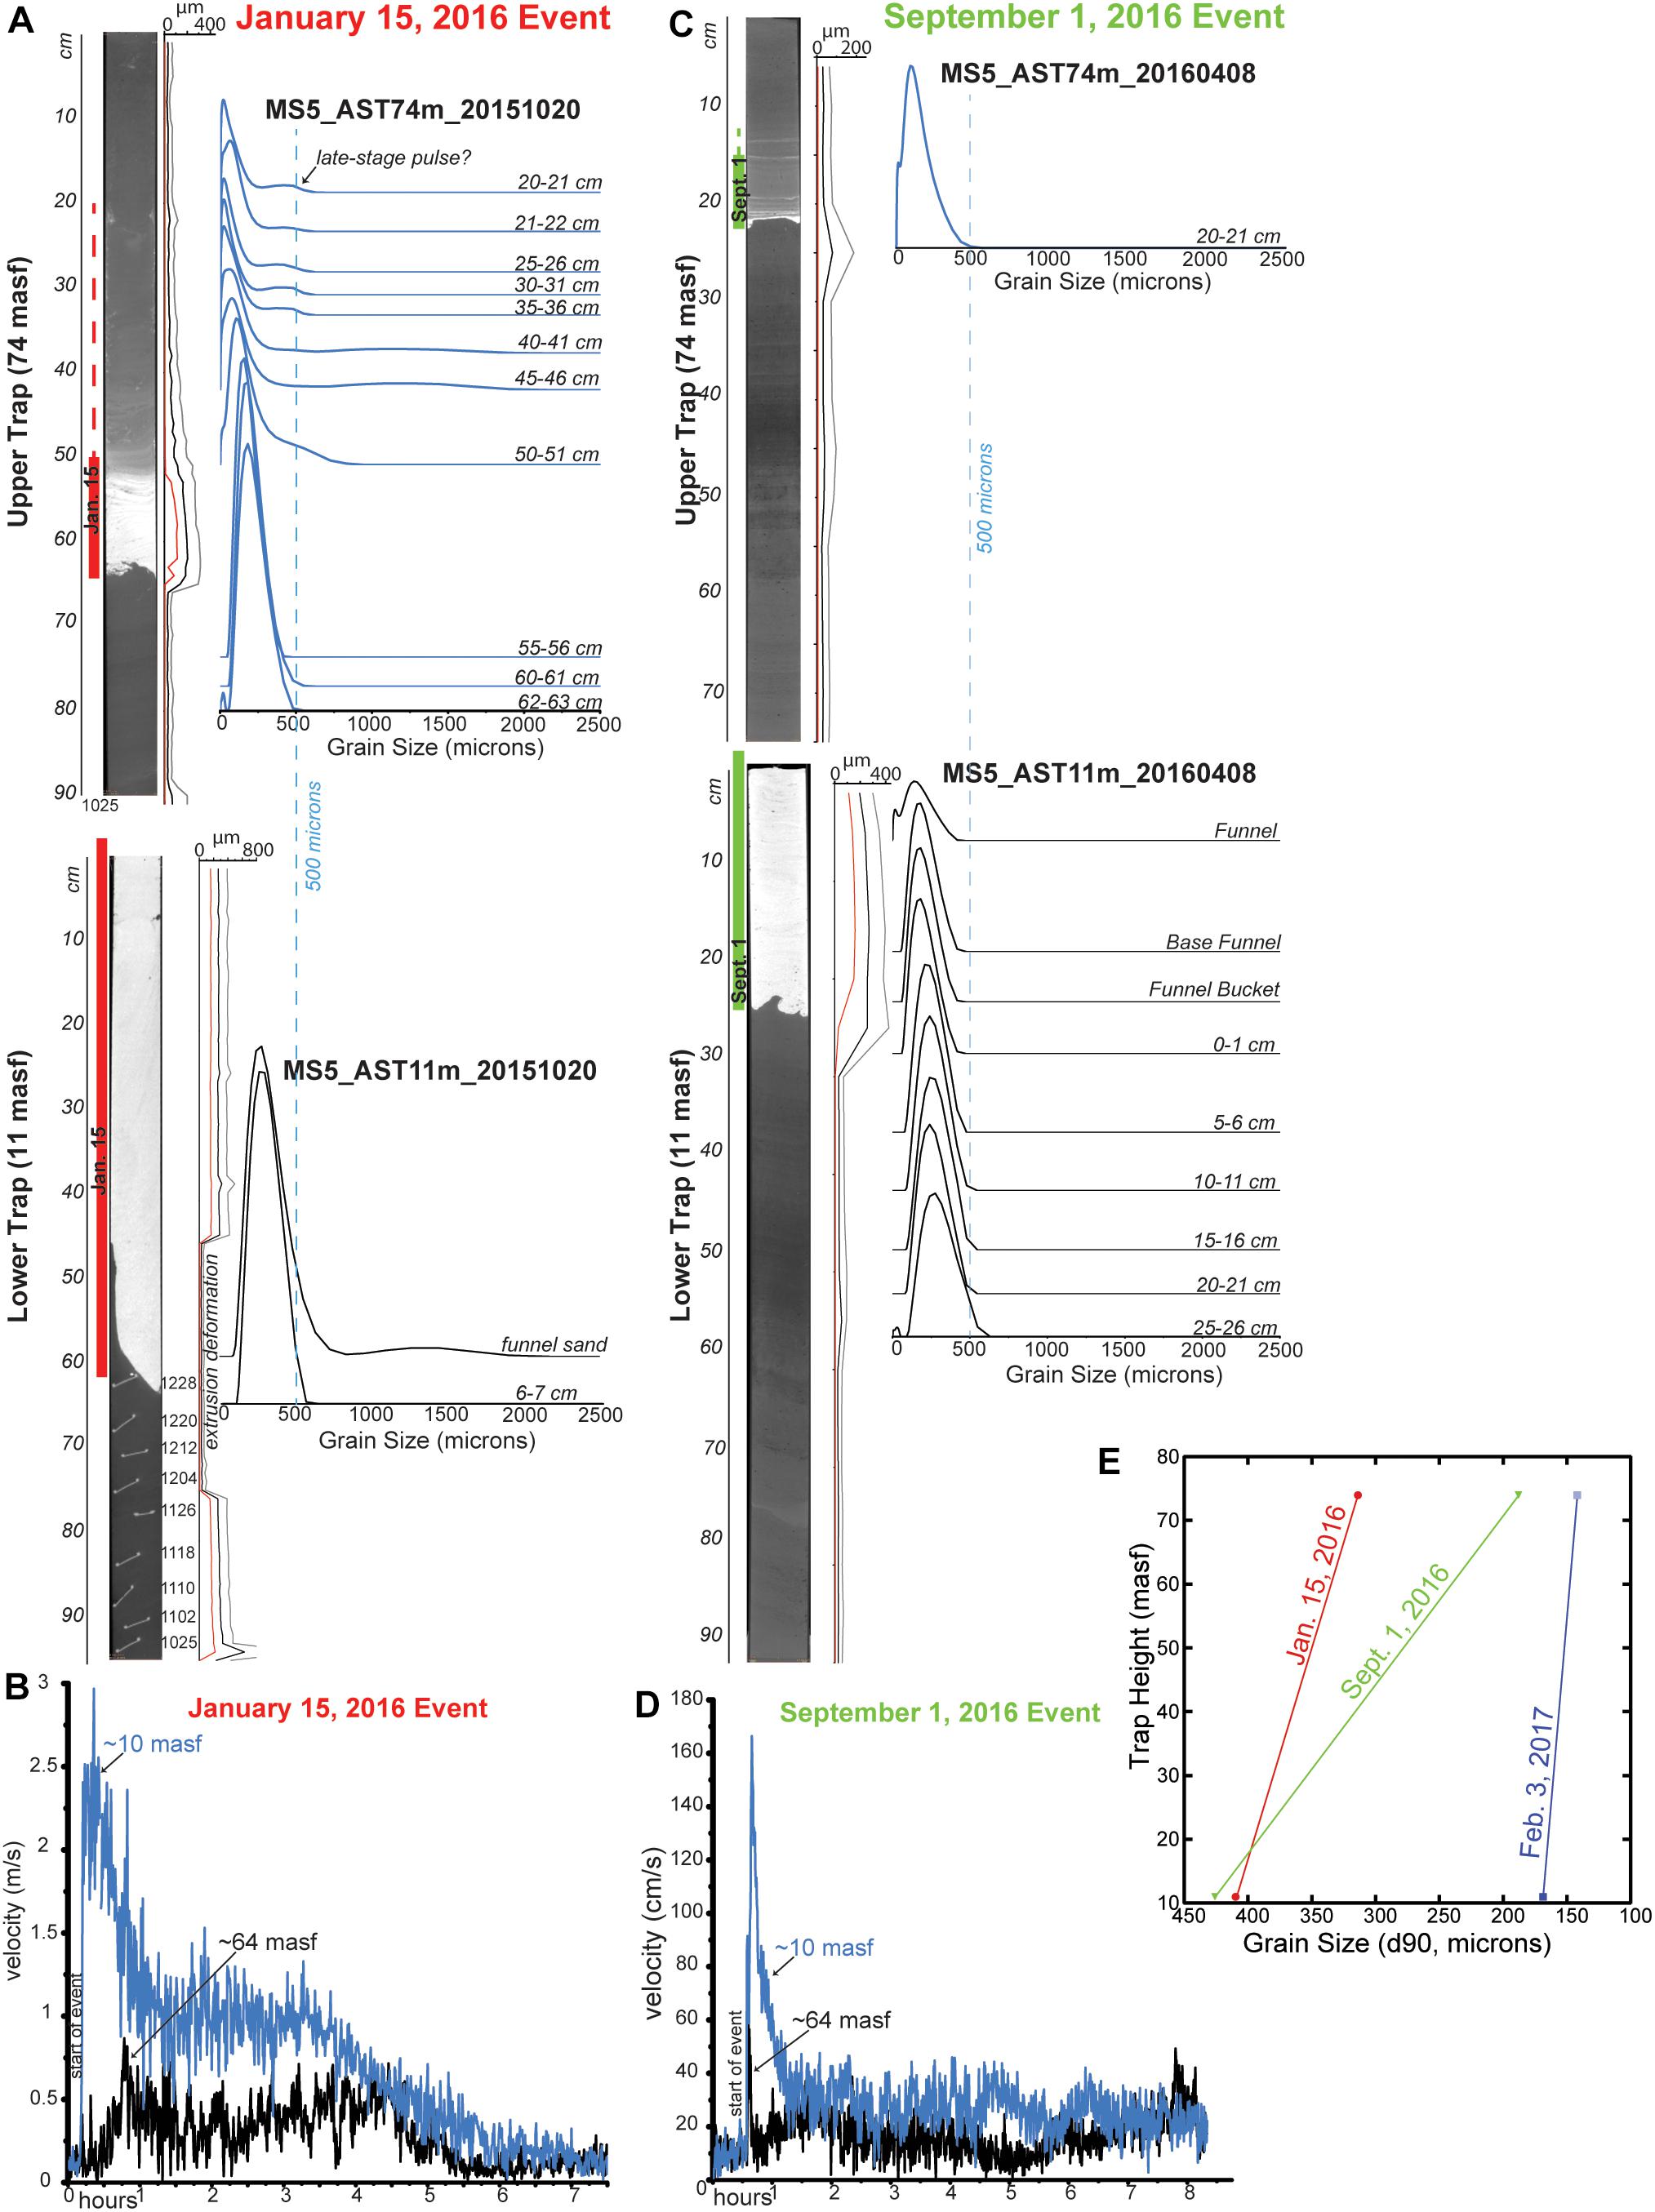
Figure 4. Variation between traps at different heights above the seafloor. (A) January 15, 2016 sediment density flow event in mooring MS5 sediment traps at 11 m above the seafloor (masf) and 74 masf. Data shown as in Figure 3 (left), with additional grain-size distribution profiles within the January 15, 2016 event unit (right). (B) MS5 ADCP-measured velocity at 10 and 64 masf from the January 15, 2016 event. (C) September 1, 2016 sediment density flow event in MS5 sediment traps. Data shown as in (A). (D) MS5 ADCP-measured velocity from the September 1, 2016 event, as in (B). (E) d0.9 grain size of coarsest extruded 1-cm samples from sediment density flow event units in MS5 sediment traps.
Sand units in sediment traps correspond with sediment density flow events identified with instruments (Paull et al., 2018). The coarsest sand in each event unit (fine to very coarse-grained sand) typically occurs at or near the base of the sand unit, and fines upward slightly for 1–60 cm (Figures 3–5 and Supplementary Table S1). The sand often has a unimodal distribution centered ∼200 microns (i.e., fine sand) (Figures 4, 5). Some samples contain a silt component and (or) a coarse-grained sand size component. The silt component may have been introduced during sample extrusion, in which previously flat sand-mud contacts were deformed and subsequent 1-cm sub-samples contained part of each unit (Figures 3, 4). In MS7 traps at 10 masf and MS5 traps at 74 masf, the sandy event unit is typically overlain by 5–10 cm (and up to ∼30 cm) of alternating thin (<1 cm) very fine to fine sand or silt layers and mud (e.g., Figures 3, 4), which appear related to the underlying sandy event unit (see section “Are Trends in Flow Velocity Over Time Shown by Patterns of Vertical Grading Within Samples?” for further discussion).
Where two traps were recovered from the same mooring, finer grain sizes and thinner sandy event units were consistently noted to occur in the upper trap compared to the lower trap (Figure 4). For example, dual traps on MS5 during each of the sediment density flow events that passed MS5 (Table 1) show a decrease in the 90th percentile (d0.9) grain size with increasing height above the seafloor (Figure 4E). These traps also contain larger median grain size in the lower trap compared with the upper trap (Supplementary Table S1), although most of the subsamples have similar shaped grain-size distributions (Figures 4A,C).
Fine to medium-grained sand occurs in event units throughout the array (Figure 5). In few samples, an additional, coarser peak centered at ∼1250 microns, is also observed (e.g., MS1 and MS7 in Figure 5B). The averaged median grain size of sand sampled from the January 15, 2016 and September 1, 2016 events at ∼10 masf are comparable along 50 km of Monterey Canyon axial channel (Supplementary Table S1). Median grain sizes sampled in ∼10 masf traps during the January 15, 2016 event range from 297 microns at MS2 to 226 microns at MS7. Median grain sizes sampled in ∼10 masf traps during the September 1, 2016 event are coarsest at MS1 (432 microns), decrease at MS3 (36 microns), increase at MS4 and MS5 (182 and 259 microns, respectively), and decrease at MS7 (121 microns). The 90th percentile grain size (d0.9) of September 1, 2016 event samples also show this down-canyon variation, decreasing from MS1 to MS3, increasing to MS4 and MS5, and decreasing to MS7 (Supplementary Table S1).
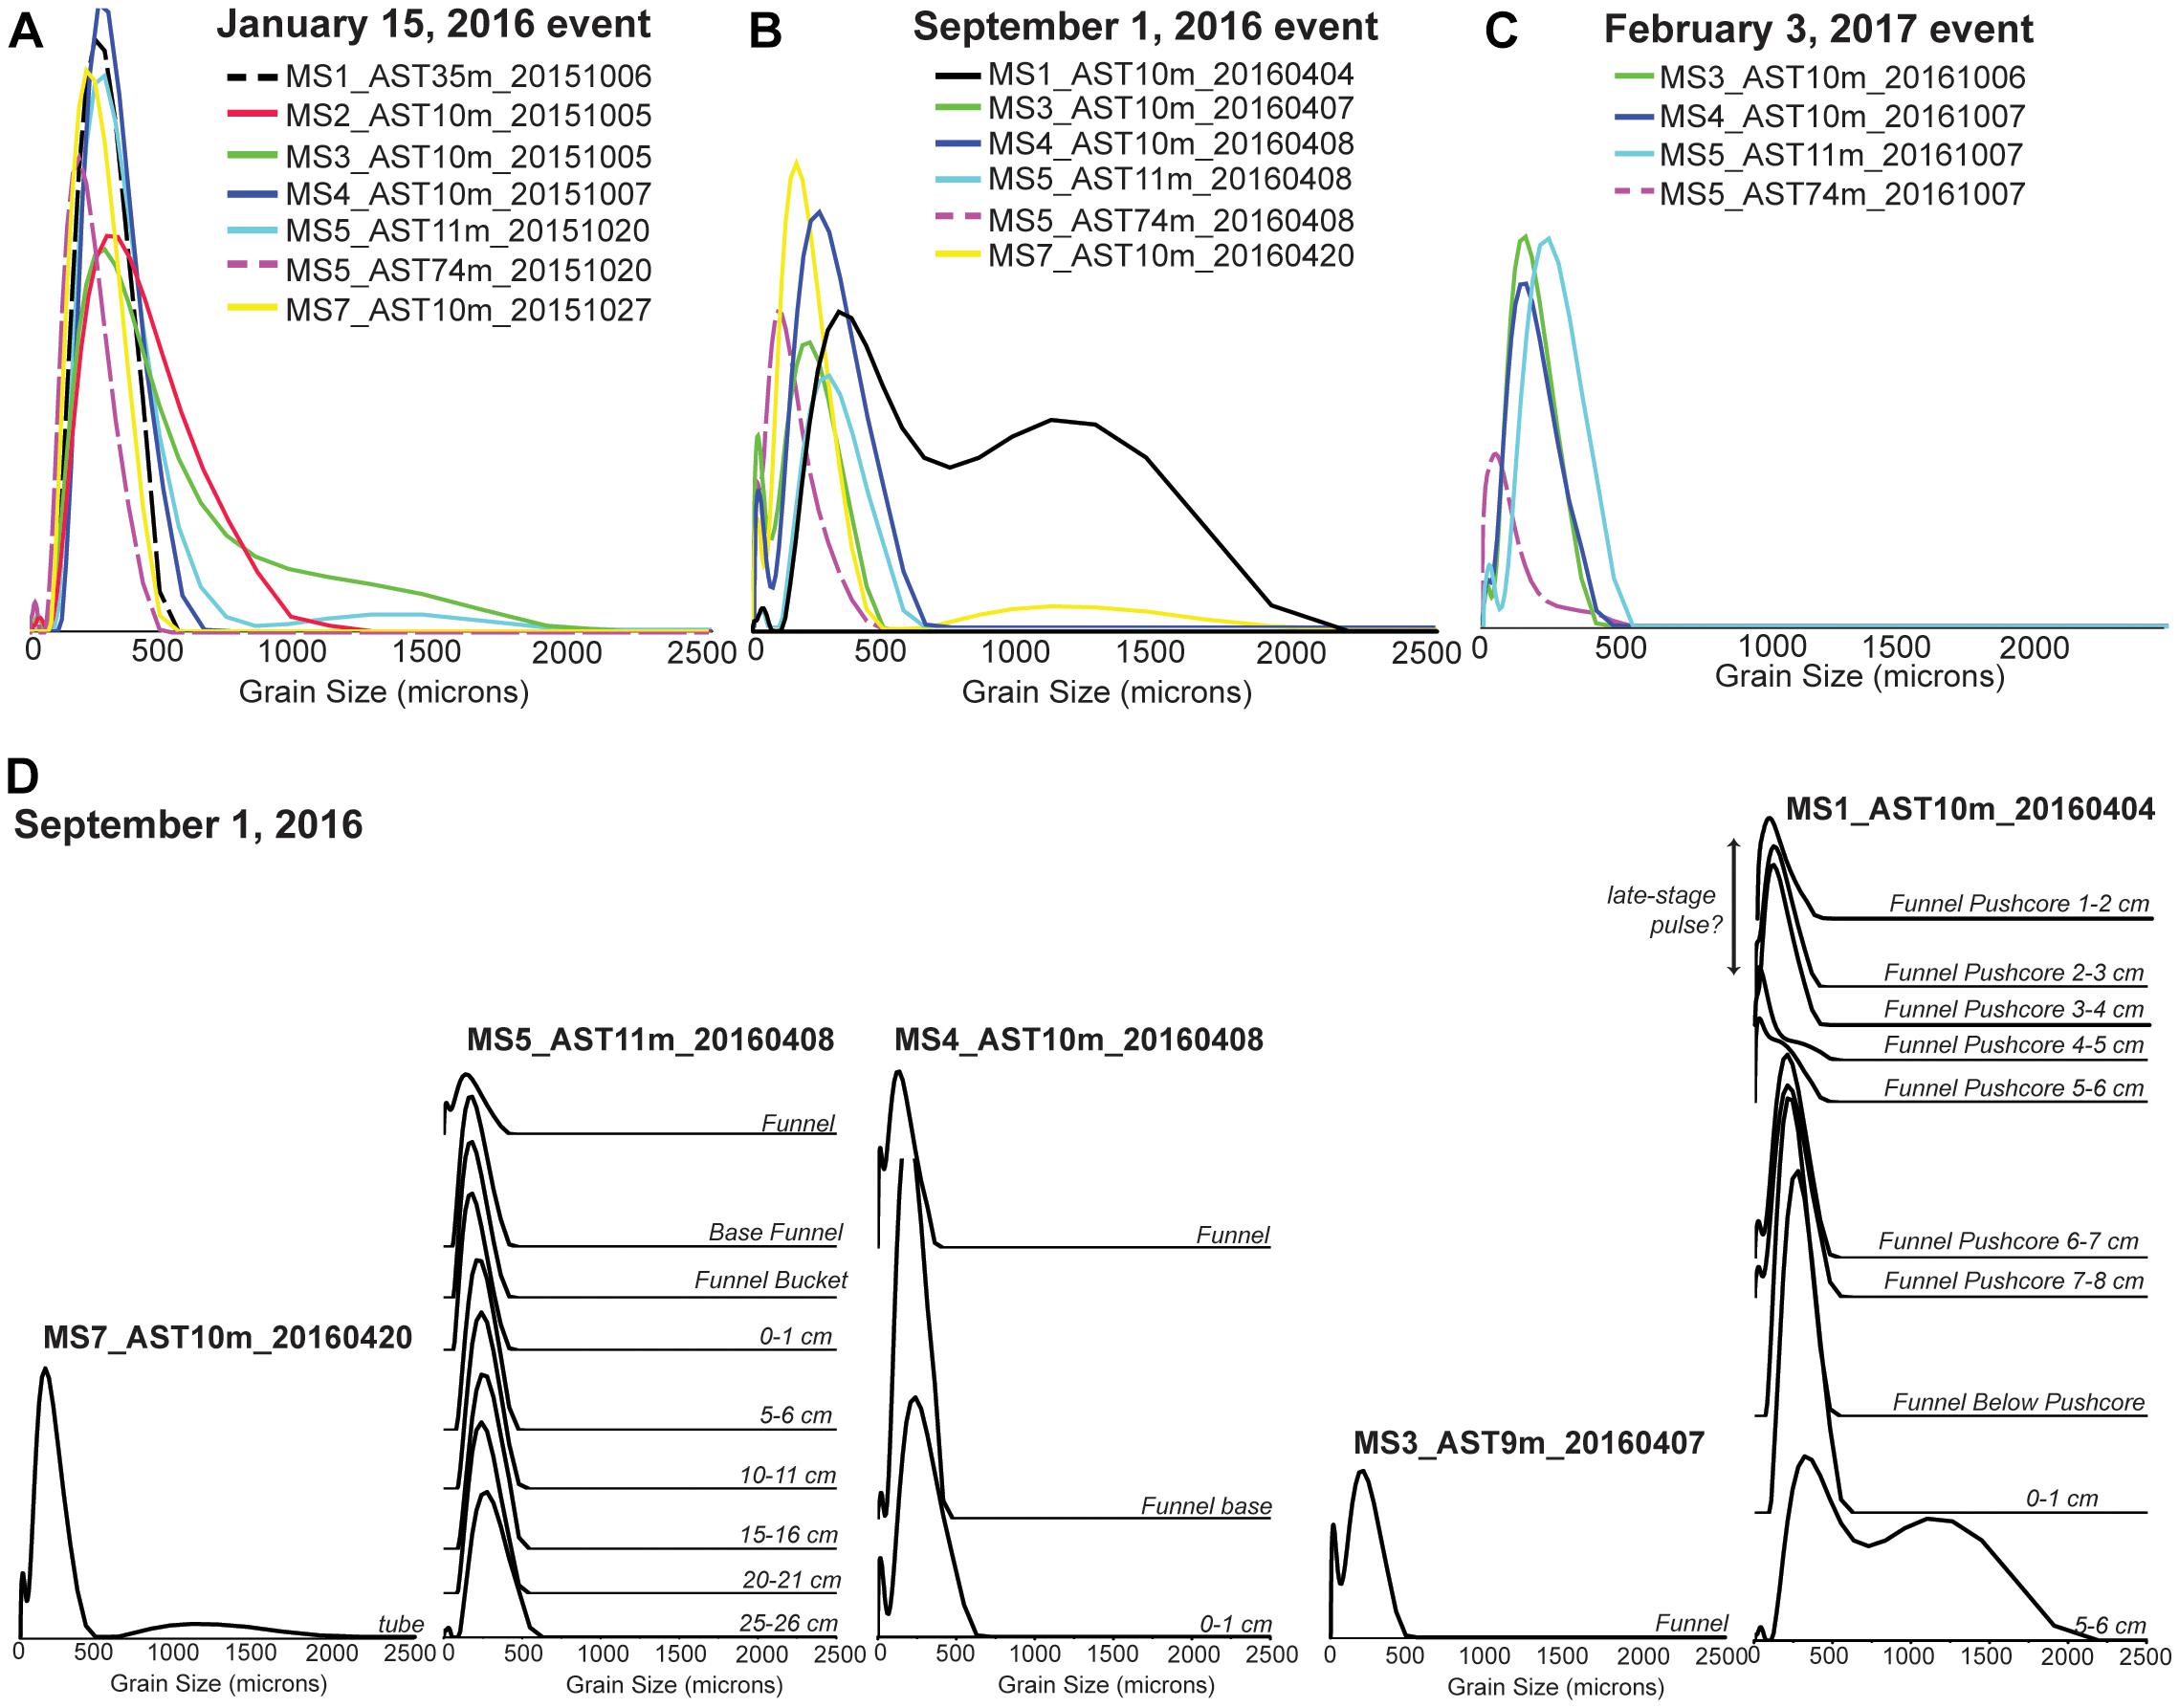
Figure 5. Grain-size distributions from sediment density flow event units in sediment traps. Solid lines indicate samples from traps deployed at ∼10 m above the seafloor (masf), and dashed lines indicate samples from traps deployed at > 10 masf. (A) January 15, 2016 event. (B) September 1, 2016 event. (C) February 3, 2017 event. (D) Stratigraphy of the September 1, 2016 event shown as grain-size distributions down-canyon (right to left, as in Figure 1).
ADCP-Measured Flow Velocities and Comparison to Sediment Traps
During the January 15 and September 1, 2016 events, maximum ADCP-measured velocities at mooring sites and transit velocities between moorings (as reported in Paull et al., 2018), were more than twice as fast at MS1 compared to MS7, and generally faster in the shallower (<1000 mwd) compared to the deeper end of the array (Table 2). Down-canyon decreases in this maximum ACDP-measured velocity do not correspond clearly or consistently with along-canyon variations in trap sample grain sizes (Figure 5). Although the trap at 10 masf was ripped from MS1 during the January 15, 2016 event, comparable grain size distributions were sampled in traps at 10 masf across the remainder of the array, instead of a clear fining down-canyon trend, or distinctly larger grain sizes in MS2 and MS3 compared to MS5 and MS7 (Figure 5A).
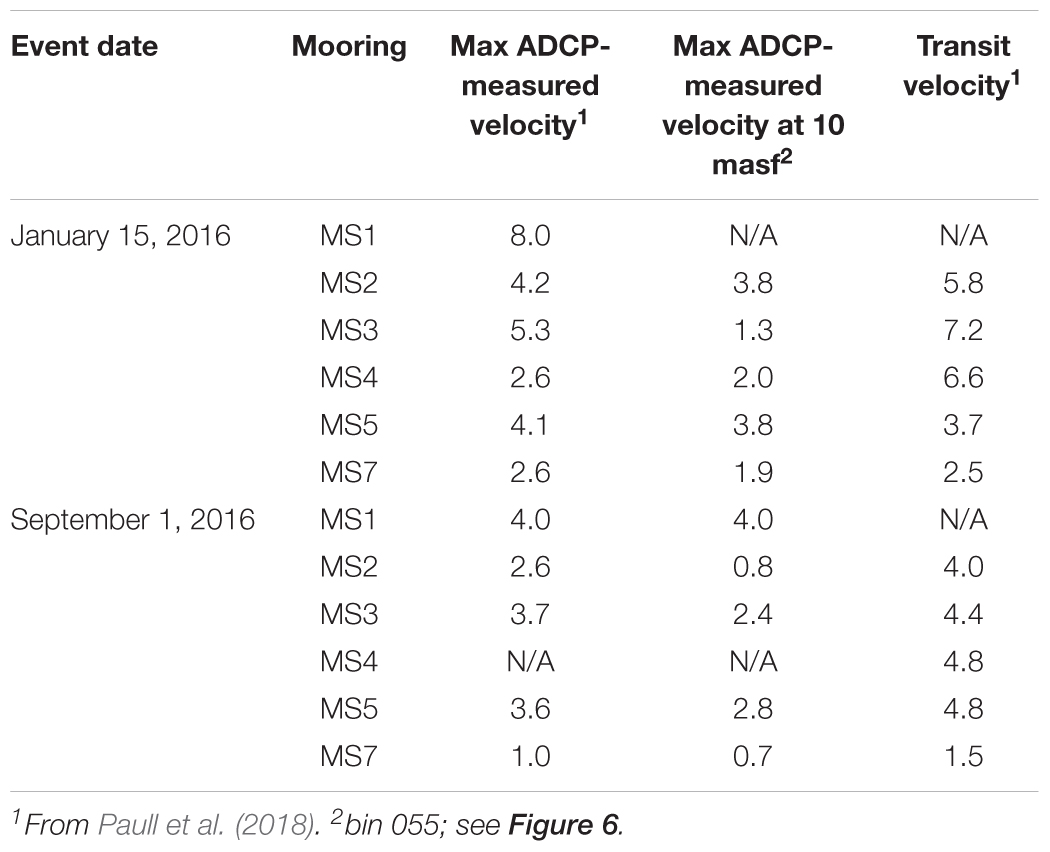
Table 2. Sediment density flow event velocities (m/s).
Maximum ADCP-measured velocities at approximately 10 masf (i.e., adjacent to sediment trap samples) vary along the canyon during the January 15 and September 1, 2016 events (1.3–3.8 m/s: January 15; 0.8–4.0 m/s: September 1) (Figure 6 and Table 2). These velocities were greater during the January 15, 2016 event than during the September 1, 2016 event, except as measured at MS3. Very coarse grain-size sand populations in MS5 (Figure 5A) occur with the greatest ADCP-measured maximum velocities (3.8 m/s) at 10 masf from the January 15, 2016 event (Figures 6A,G). However, 3.8 m/s maximum flow velocity was also measured during the January 15, 2016 event at MS2, where a similar very coarse sand population was not sampled (Figures 6A,D).
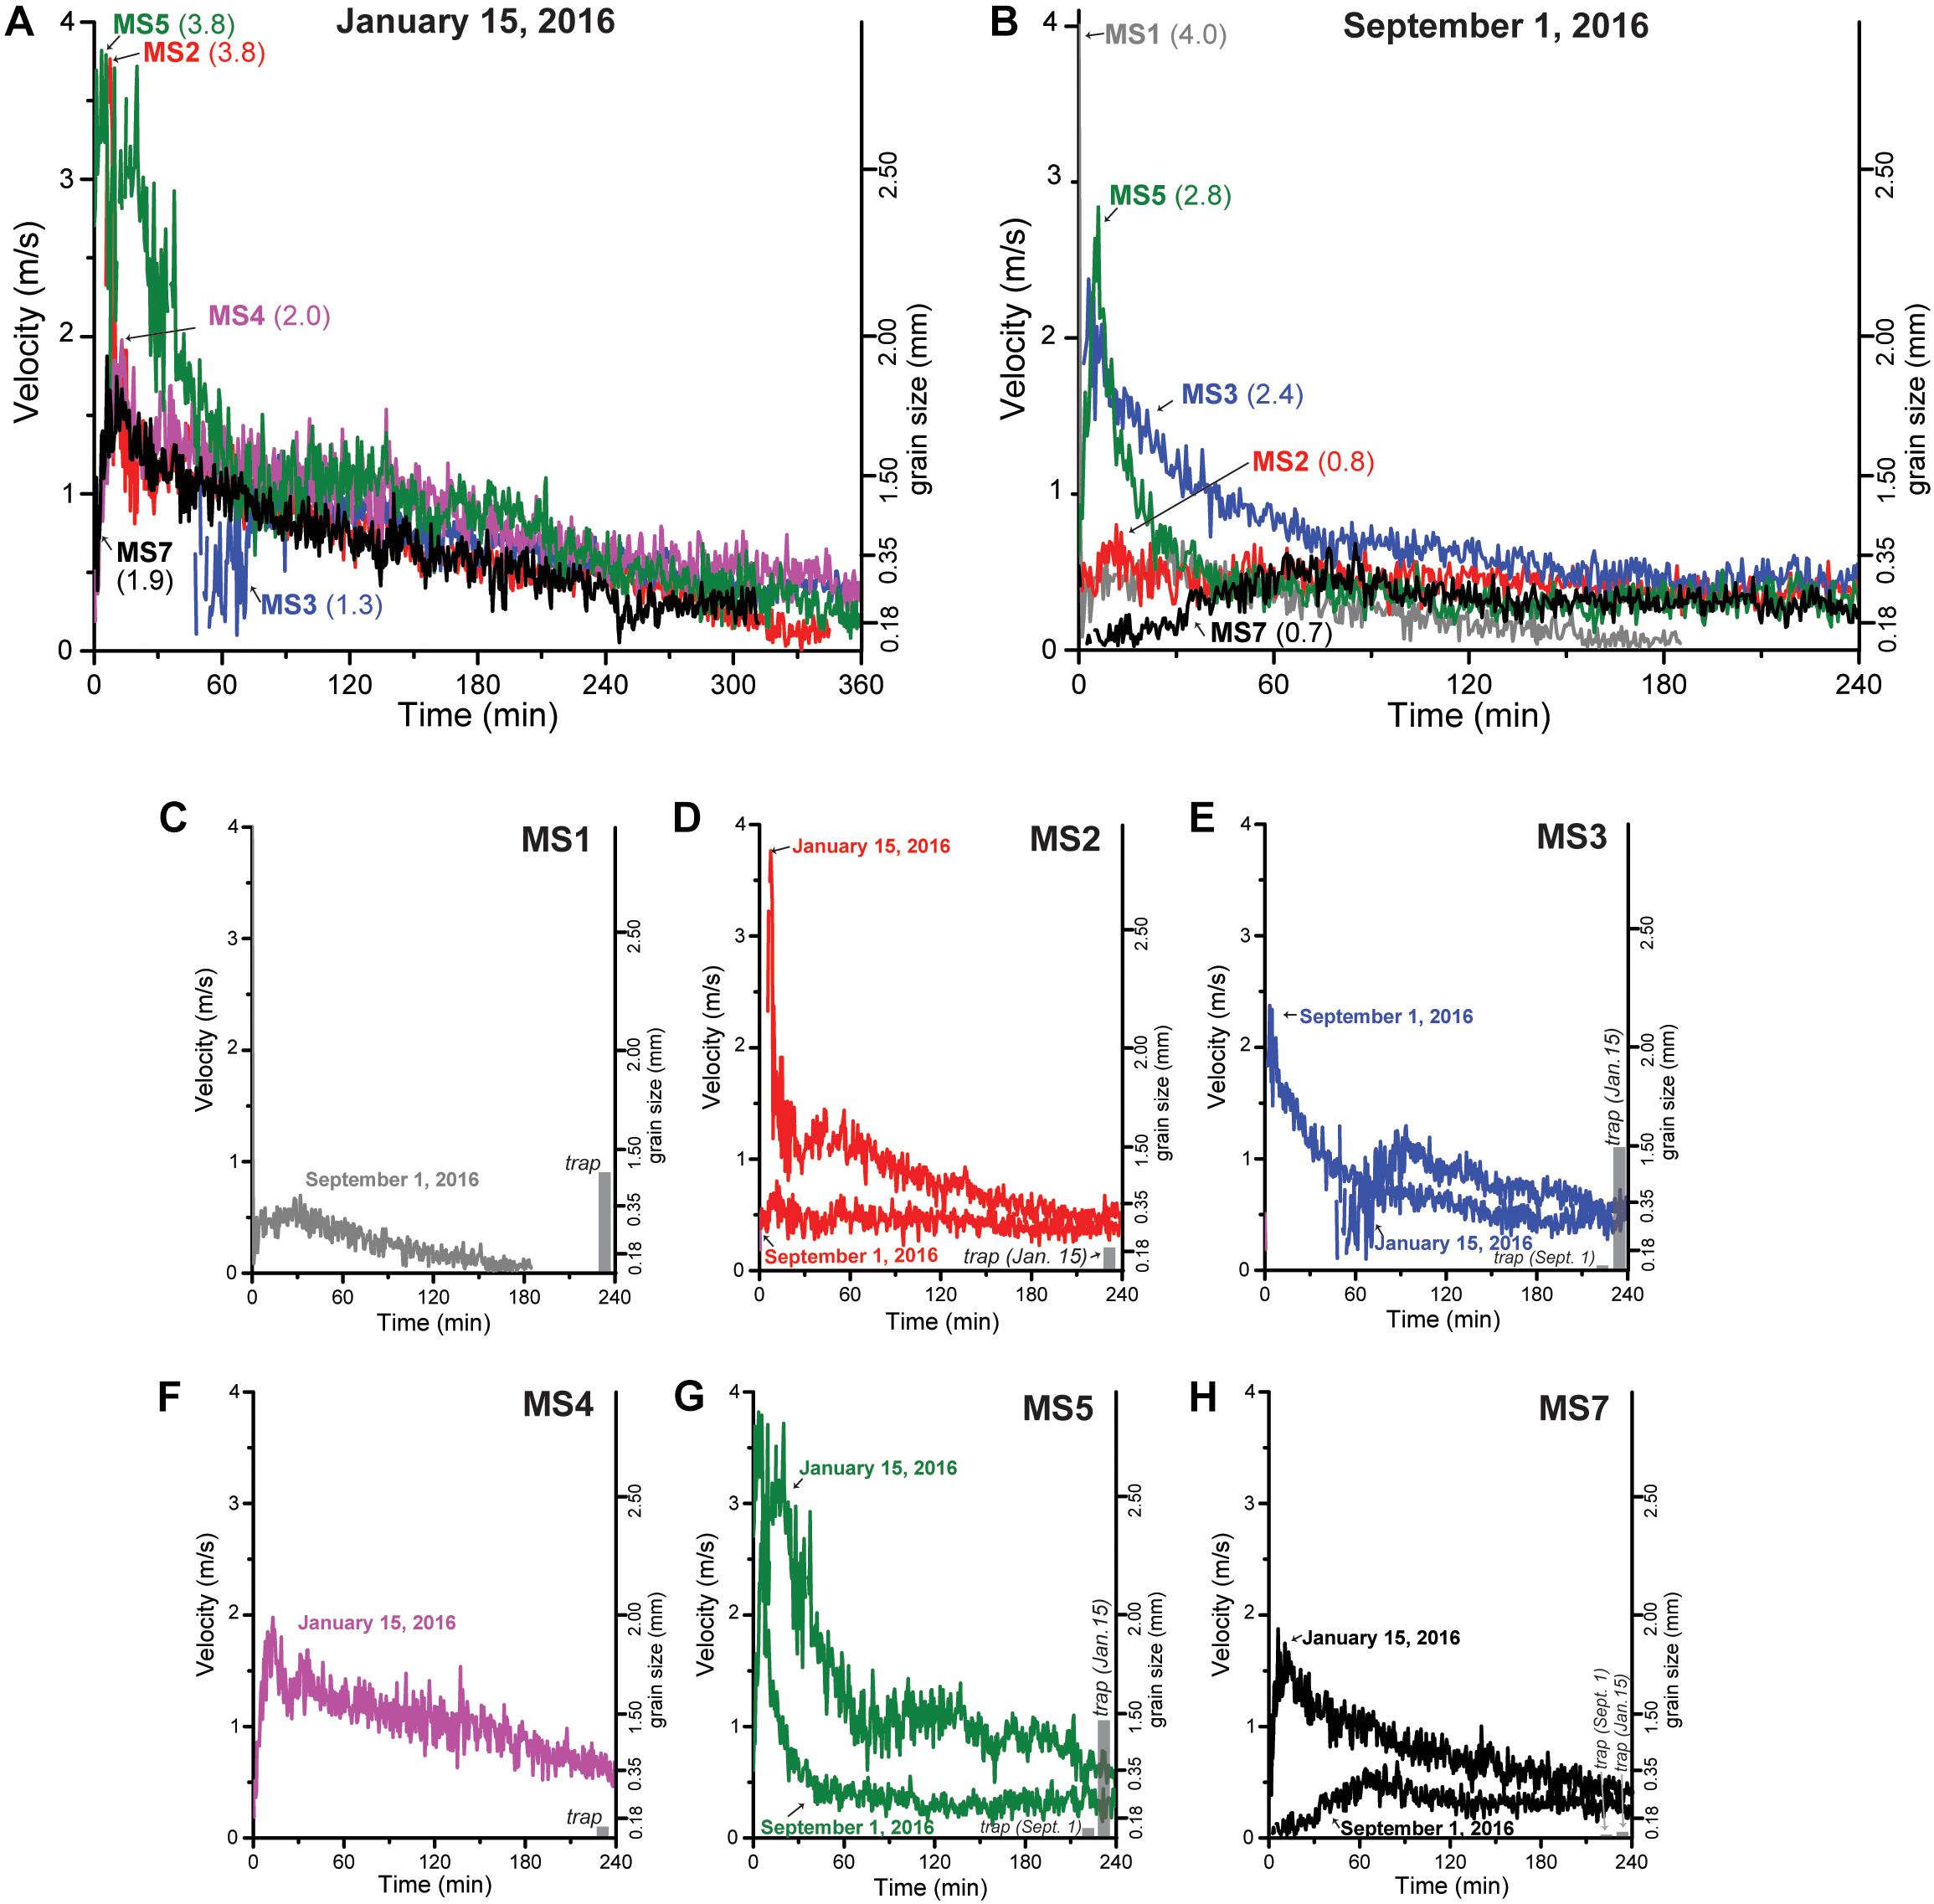
Figure 6. Acoustic Doppler current profiler (ADCP)-measured velocity from approximately 10 m above the seafloor (masf; ADCP bin 055) adjacent to sediment trap samples at 10 masf. Grain size axes calculated after Komar (1985) and Ferguson and Church (2004). Velocity profiles in (A) from the January 15, 2016 event and (B) from the September 1, 2016 event, are labeled with mooring (MS#) and maximum ADCP-measured velocity (m/s) in each event at ∼10 masf. Plots (C–H) show ADCP-measured velocities from each mooring and the range of measured d0.1 to d0.9 grain sizes in sediment traps from ∼10 masf.
Acoustic Doppler current profilers-measured velocities at approximately 10 masf generally are highest at the beginning of the event or increase within the initial 5–10 min. After 1–2 h, velocities are < 1 m/s (Figure 6). These gradually return to velocities on the order of 10s of cm/s associated with internal tides (e.g., Figure 7).
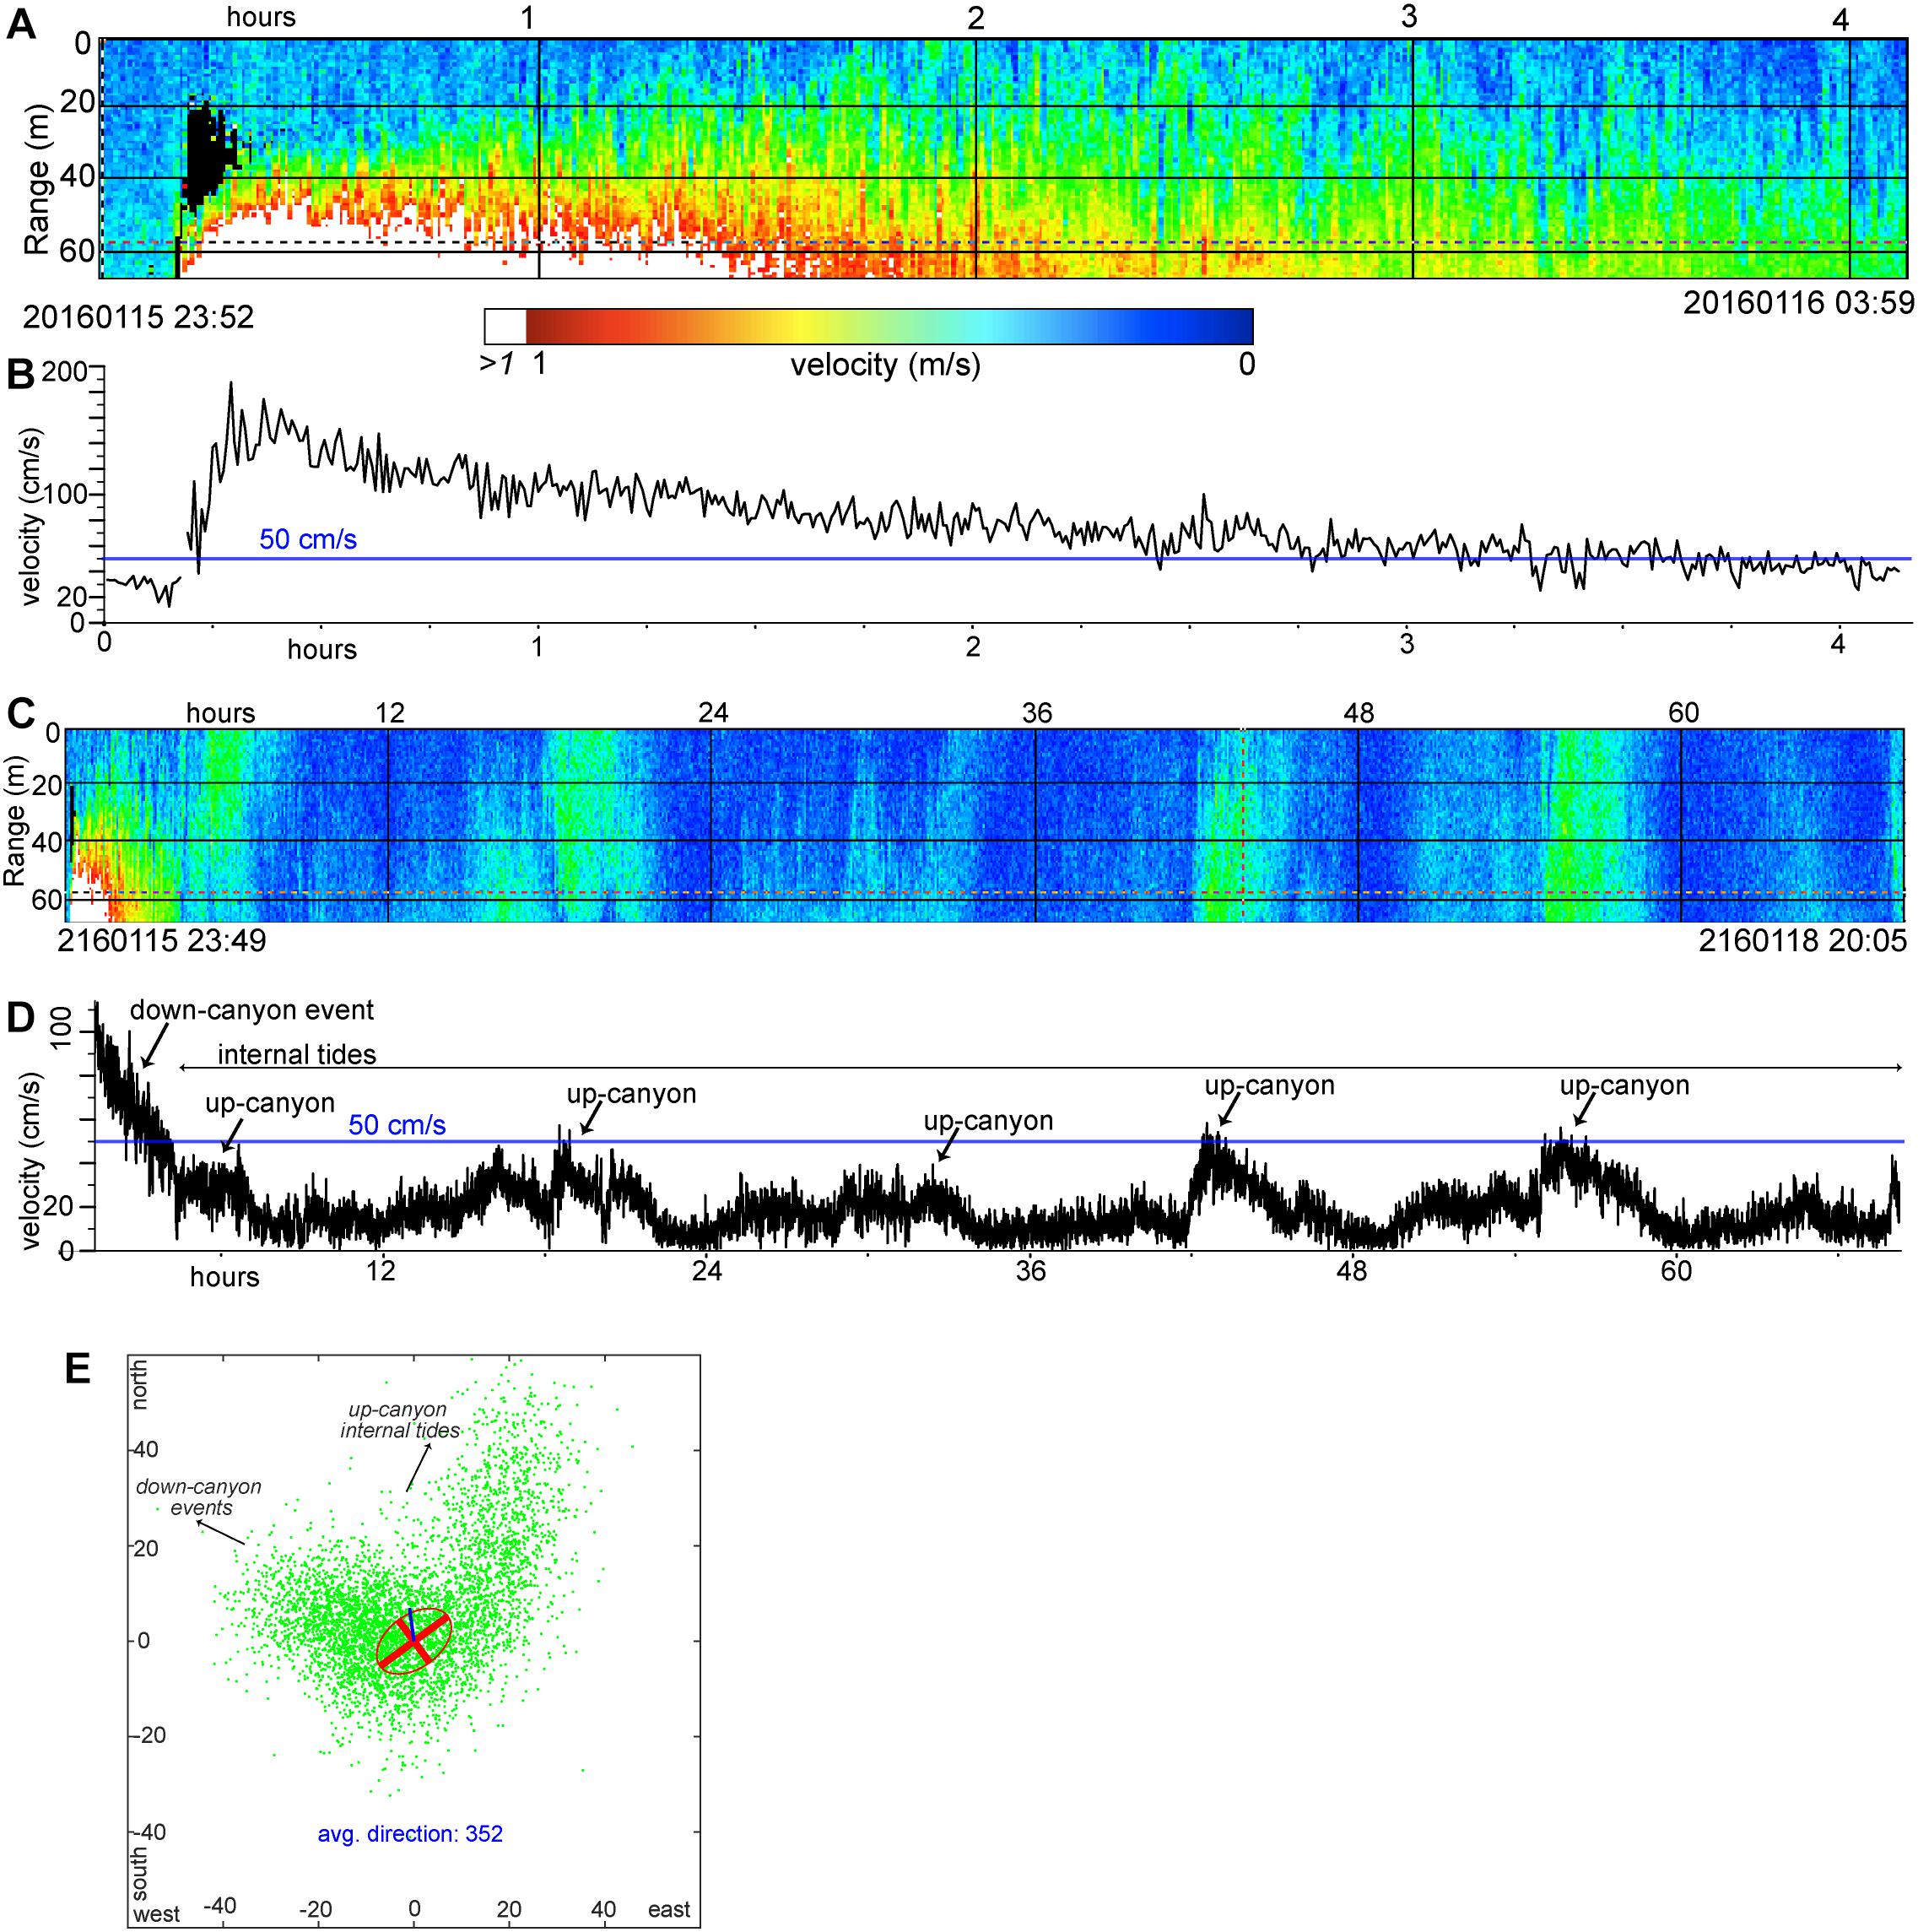
Figure 7. Velocity during and following the January 15, 2016 event measured at MS7. (A) Color-contoured ADCP velocity panel. Range (y-axis) is shown as meters below the ADCP instrument, deployed at 65 m above the seafloor on mooring MS7. When the mooring is upright, the seafloor is at range 65 m, which is the base of this plot. (B) ADCP-measured velocity at approximately 10 m above the seafloor (masf) from (A). (C) Color-contoured ADCP-measured velocity (labels as in A), showing post-event internal tide variations. (D) Velocity profile from approximately 10 masf in (C). (E) Scatter plot of MS7 velocity directions from 15 masf during Deployment I. Down-canyon internal tides and sediment density flow events are oriented primarily to the west-northwest, and up-canyon internal tides oriented primarily to the north-northeast.
Post-event Sampling From the Seafloor
Remotely operated vehicle pushcore samples acquired following the January 15 and September 1, 2016 events (and before the next event occurred) near MS7 (Figures 1B,C and Table 3), include grain sizes up to gravel and frequently medium to coarse-grained sand (Figures 8, 9). Recovery ranged from 1 to 23 cm during ROV Doc Ricketts dive number 835 (DR835) after the January 15, 2016 event, with three cores < 5 cm. No cores < 5 cm were recovered during DR896 sampling following the September 1, 2016 event.
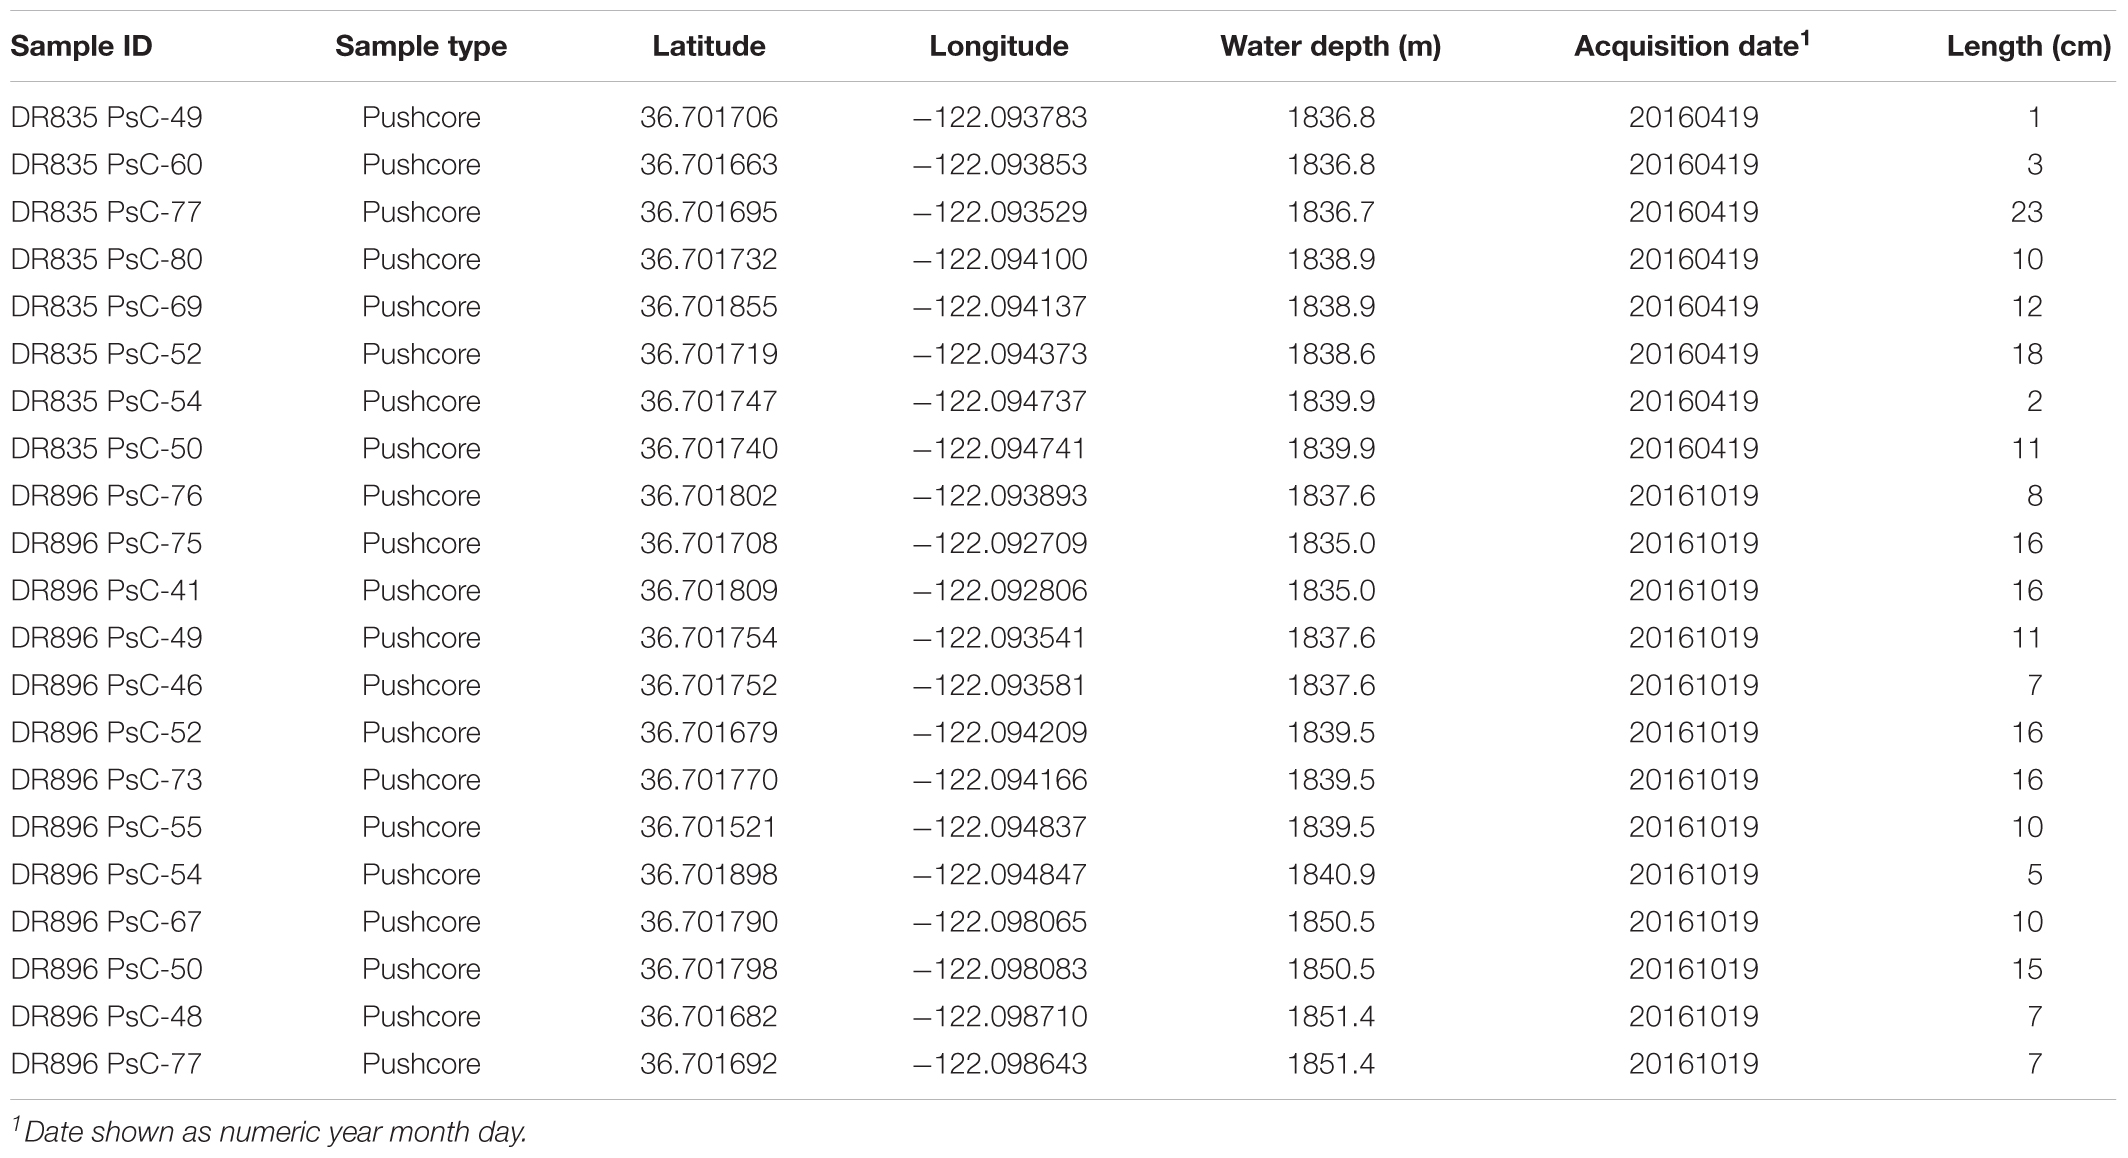
Table 3. Remotely operated vehicle (ROV) Doc Ricketts pushcore samples analyzed for grain size.
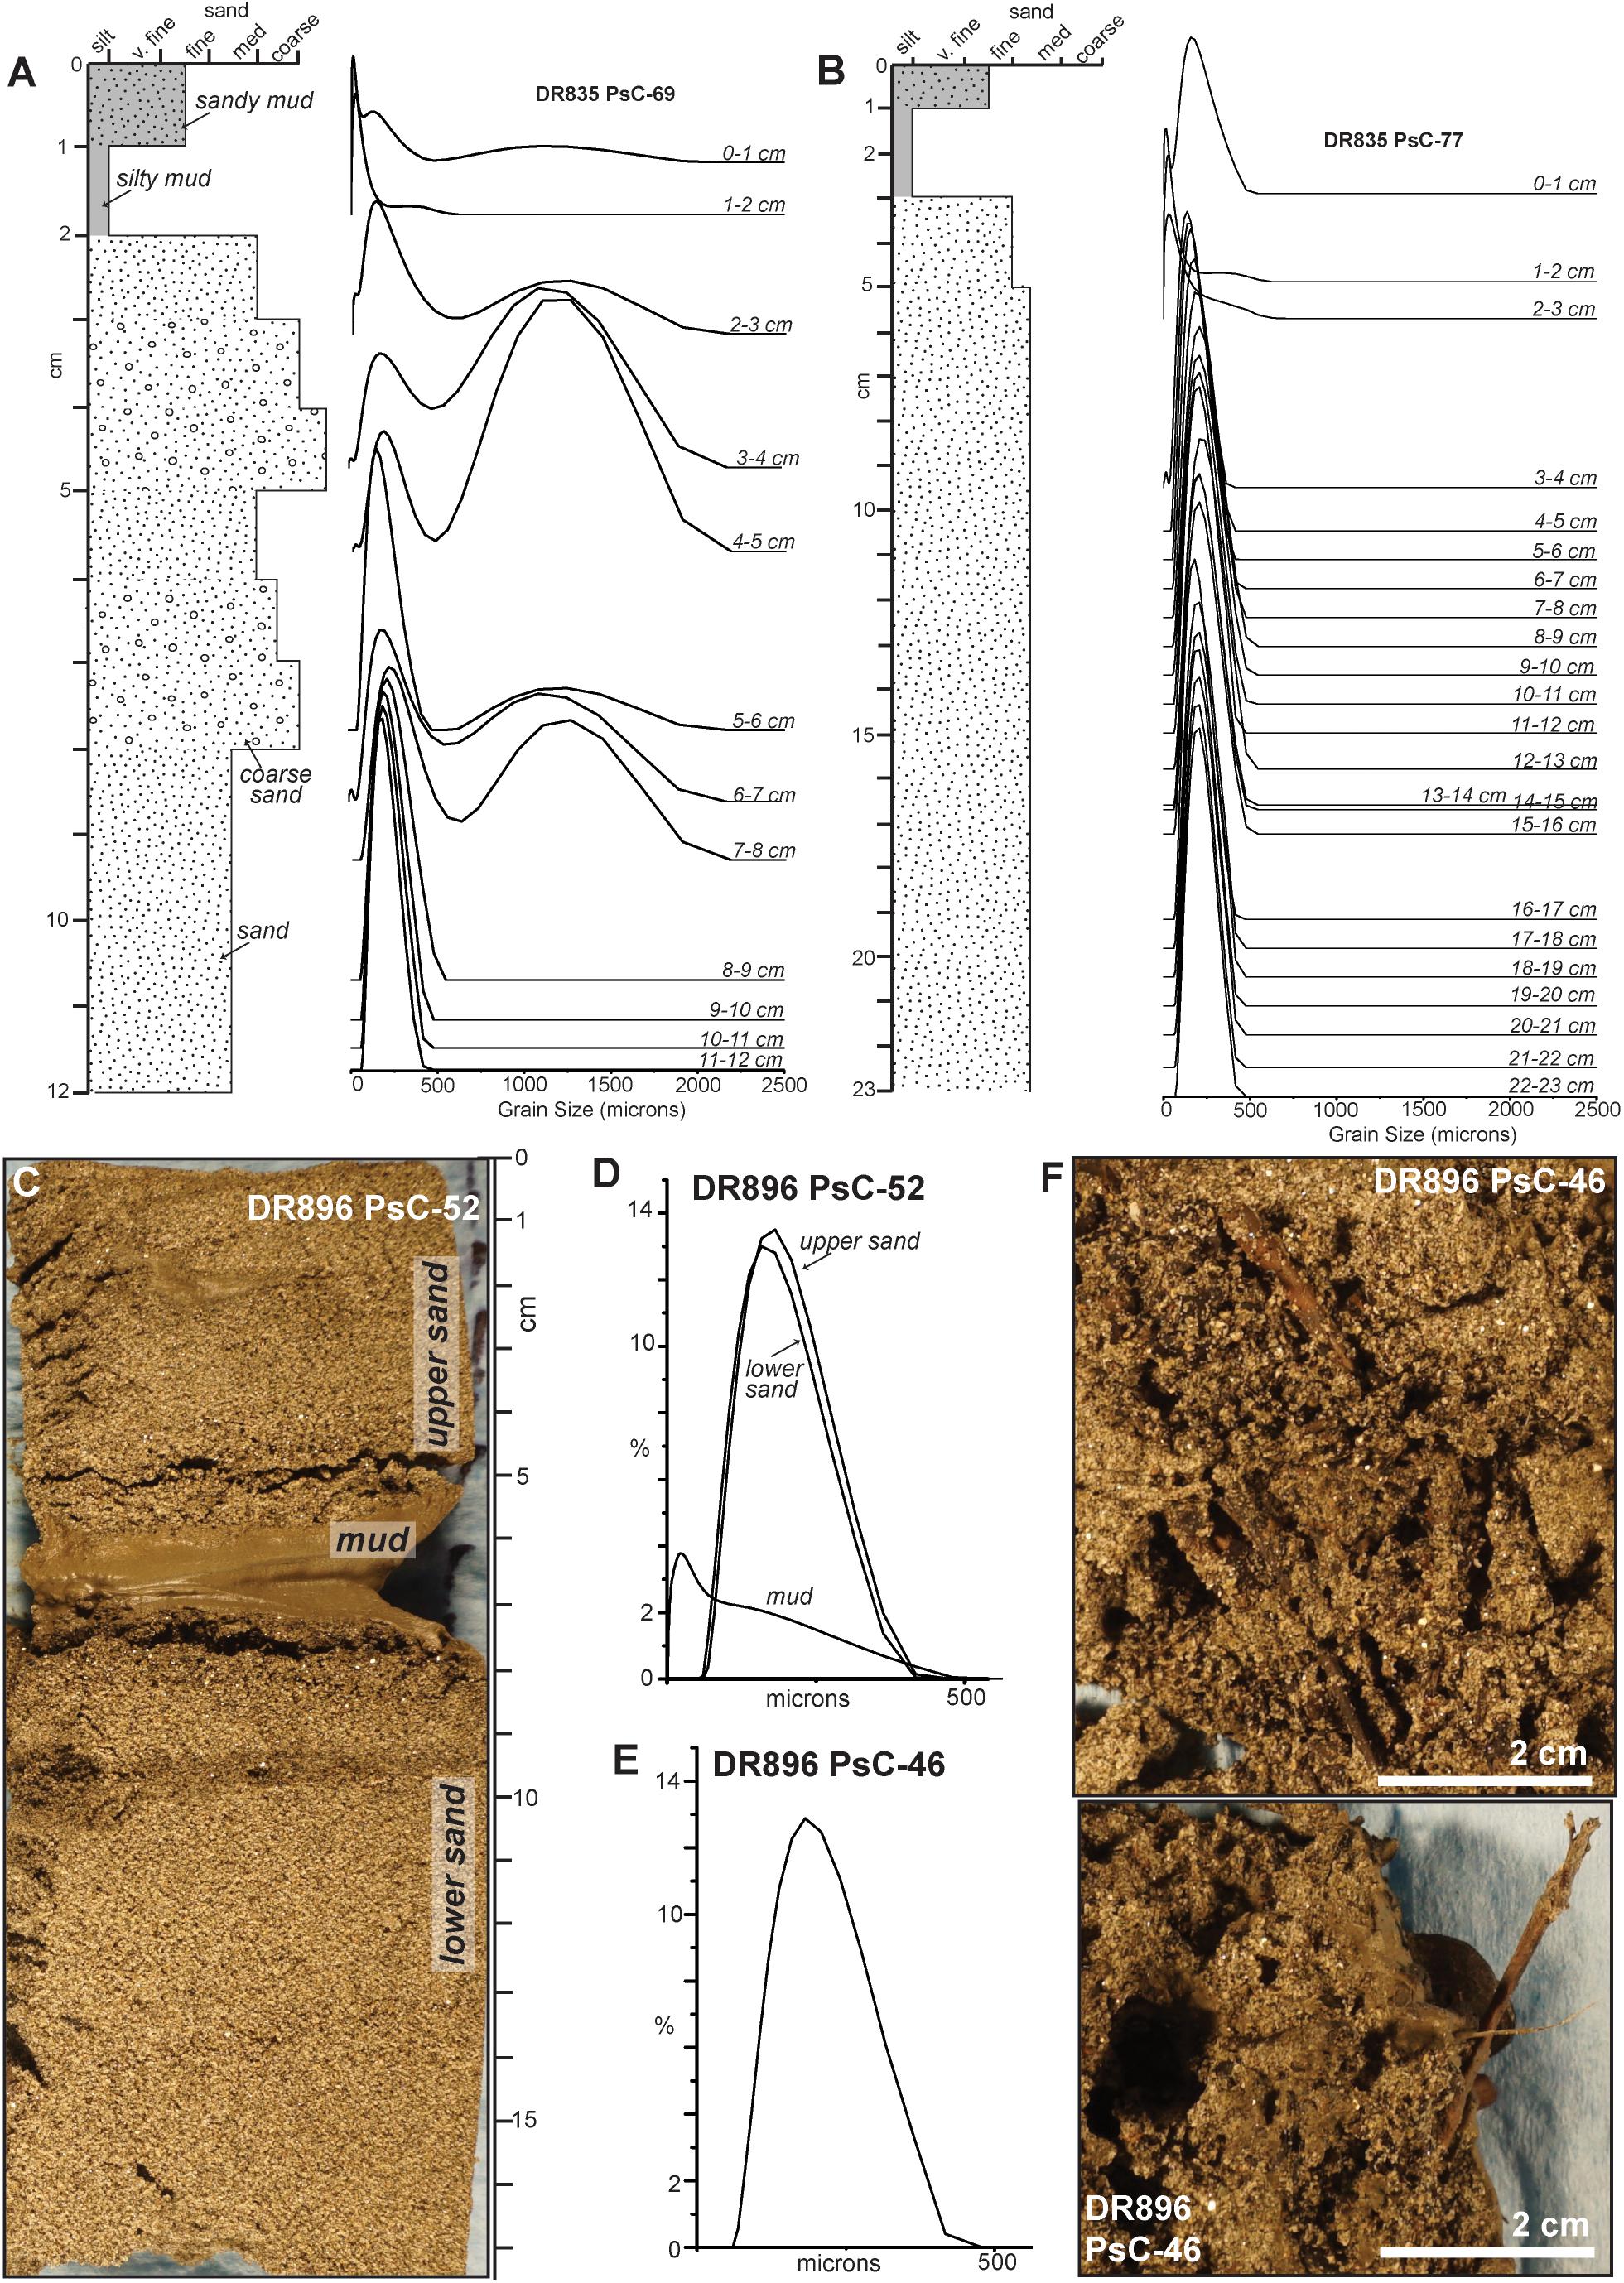
Figure 8. Remotely operated vehicle (ROV) pushcore samples acquired near MS7. (A,B) Pushcores acquired in April 2016, following the January 15, 2016 event, shown as schematic log (left) and grain-size distributions (right). Stratigraphy and coarse grain size populations differ between these two closely spaced pushcores (57 m apart). See Figure 1B for sample locations. (C–F) Pushcores acquired in October 2016, after the September 1, 2016 event, shown as photographs and grain-size distributions. Woody plant material in sand is highlighted in (F). See Figure 1C for sample locations.
Most of the pushcores contain at least one sand layer overlain by a thin (<1 to 3 cm thick) mud layer (e.g., Figures 8A–C). Woody plant material is most common within 1 cm of the seafloor (e.g., Figure 8F). The averaged median grain size of pushcore analyses is fine sand (155 microns) (Supplementary Table S2). Medium grain size sand is common throughout (average d0.9 = 403 microns), and very coarse sand is identified in layers of some pushcores, particularly from DR835 acquired following the January 15, 2016 event (Figure 8). Both DR835 PsC-77 and DR835 PsC-69 show a slightly coarser grain-size distribution in the top centimeter (Figures 8A,B). Median grain sizes in sandy pushcore layers are up to 767 microns, but mostly less than 400 microns. Likewise, 90th percentile of these same sandy samples is mostly 250–400 microns, but nine samples have d0.9 > 1000 microns (Supplementary Table S2).
Substantial variations in grain size distributions and stratigraphy are observed within pushcores (e.g., Figure 8) and between closely spaced pushcores < 100 m apart (Figures 1B,C). For example, at least two layers with coarse to very coarse sand are present within DR835 PsC-69 (Figure 8A), while a single 22-cm-thick layer of fine and medium sand is observed in nearby DR835 PsC-77 (Figure 8B). Likewise, macroscopic woody plant material is present in DR896 PsC-46 (Figure 8F) but not < 200 m down-canyon in DR896 PsC-52 (Figure 8C). Lithologic heterogeneity is also observed on the seafloor, where the high-definition ROV camera shows sub-meter lateral variation (Figure 9).
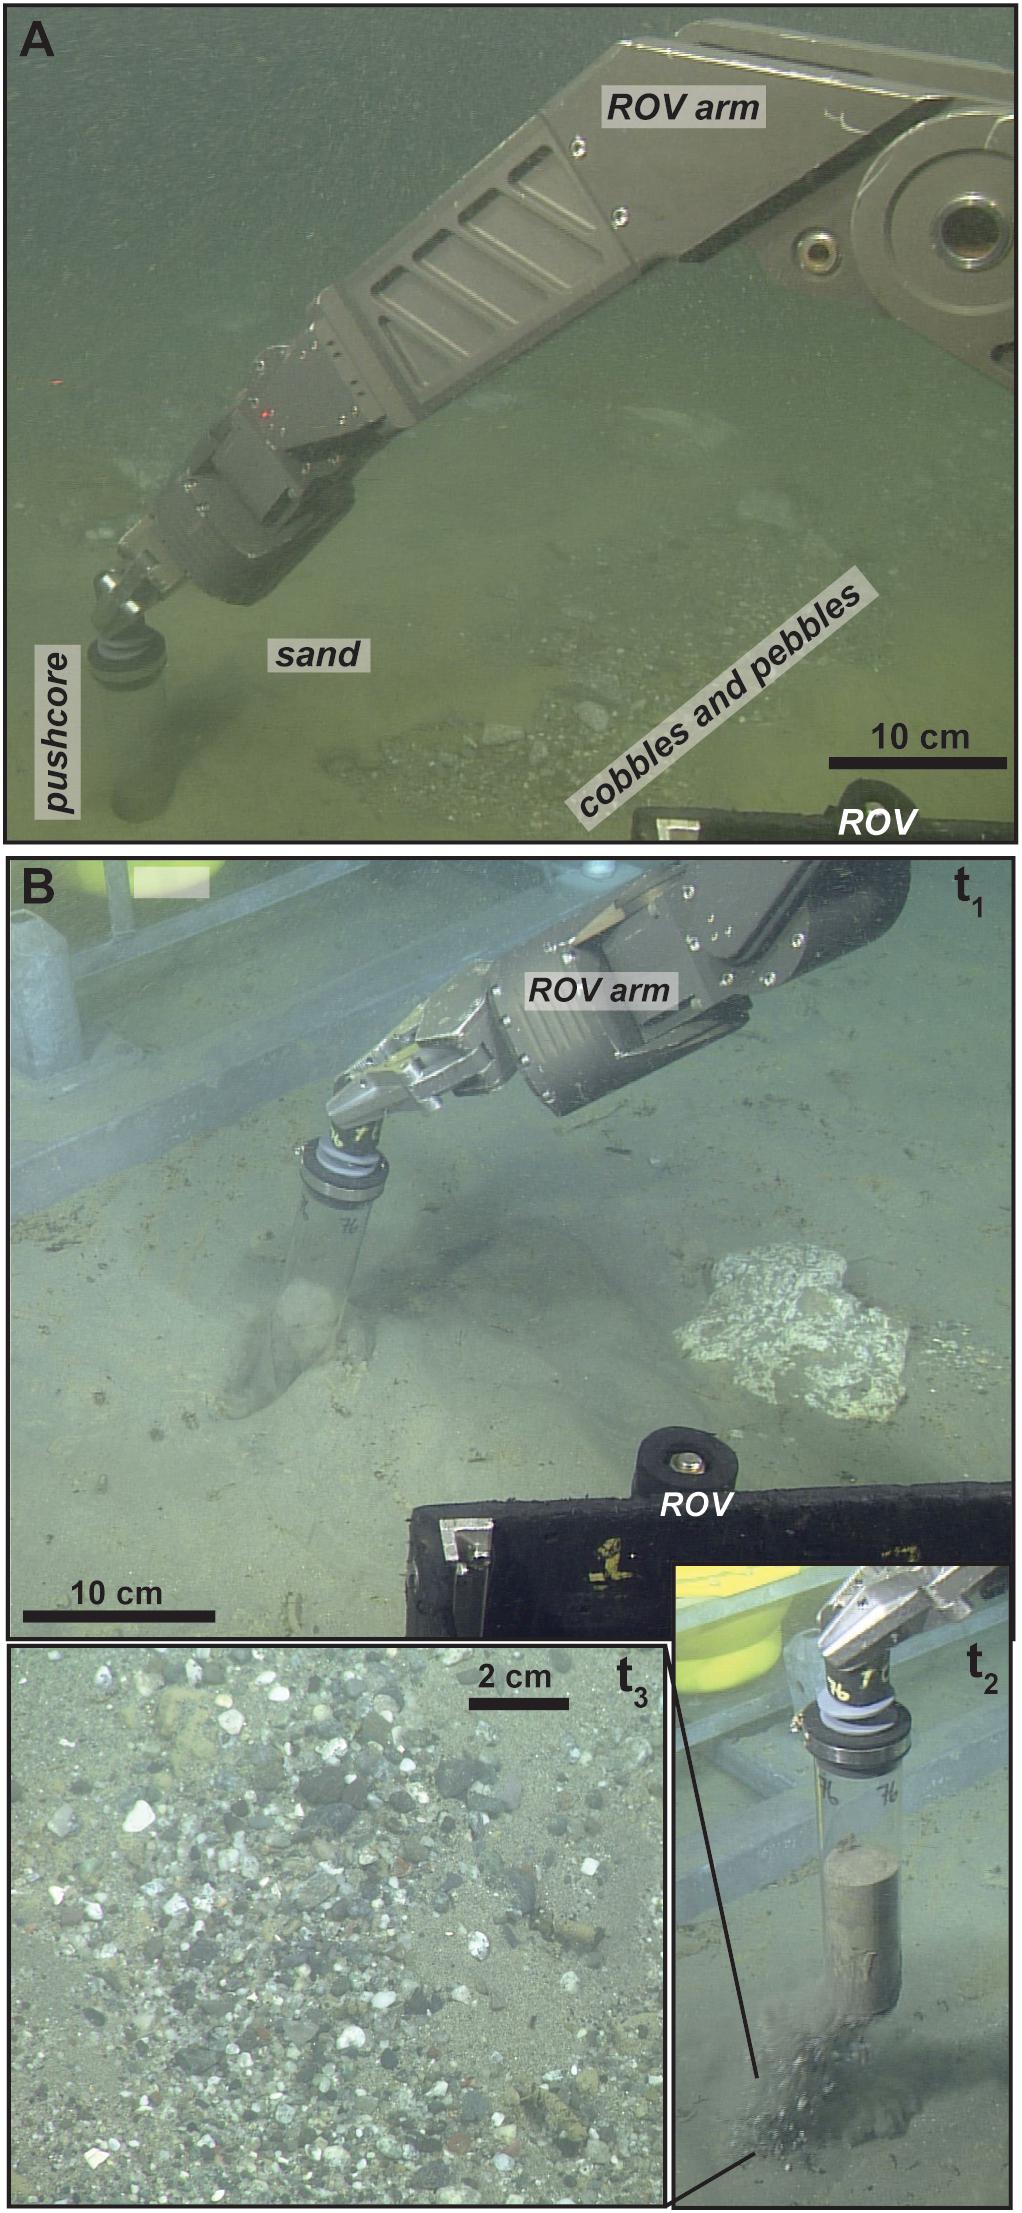
Figure 9. Remotely operated vehicle (ROV) photographs of seafloor heterogeneity observed during pushcore sampling. (A) Photograph of pushcore DR835 PsC-69 from an area of sand adjacent to exposed cobbles and pebbles. (B) Photographs of DR896 PsC-76 acquisition at times t1 – t3. Large clasts are exposed adjacent to the pushcore (t1), and buried pebbles fell out of the base of the pushcore (t2 and t3).
Comparisons of Trap and Core Samples
Sediment trap samples from the January 15 and September 1, 2016 events are compared to pushcores of seabed deposits sampled following each event, and before the subsequent event (Figures 1B,C). Targeted ROV pushcore samples of seabed deposits are concentrated at the distal end of the array, so we compare with MS7 sediment trap samples from approximately 10 masf for deployments I and II, respectively.
Grain size distributions from the January 15, 2016 event show both similarities and differences between trap and pushcore samples (Figure 10). Sand (peak centered ∼200 microns) occurs in both the trap and pushcores. Pushcore samples contain muddy layers (smaller median sizes and distributions skewed toward silt) that resemble the upper part of events in trap samples (Figure 10B). Some sandy layers in pushcores contain larger grain sizes (peak ∼1250–1500 microns) (Figures 8A, g., 10C) that are not present consistently in the trap samples.
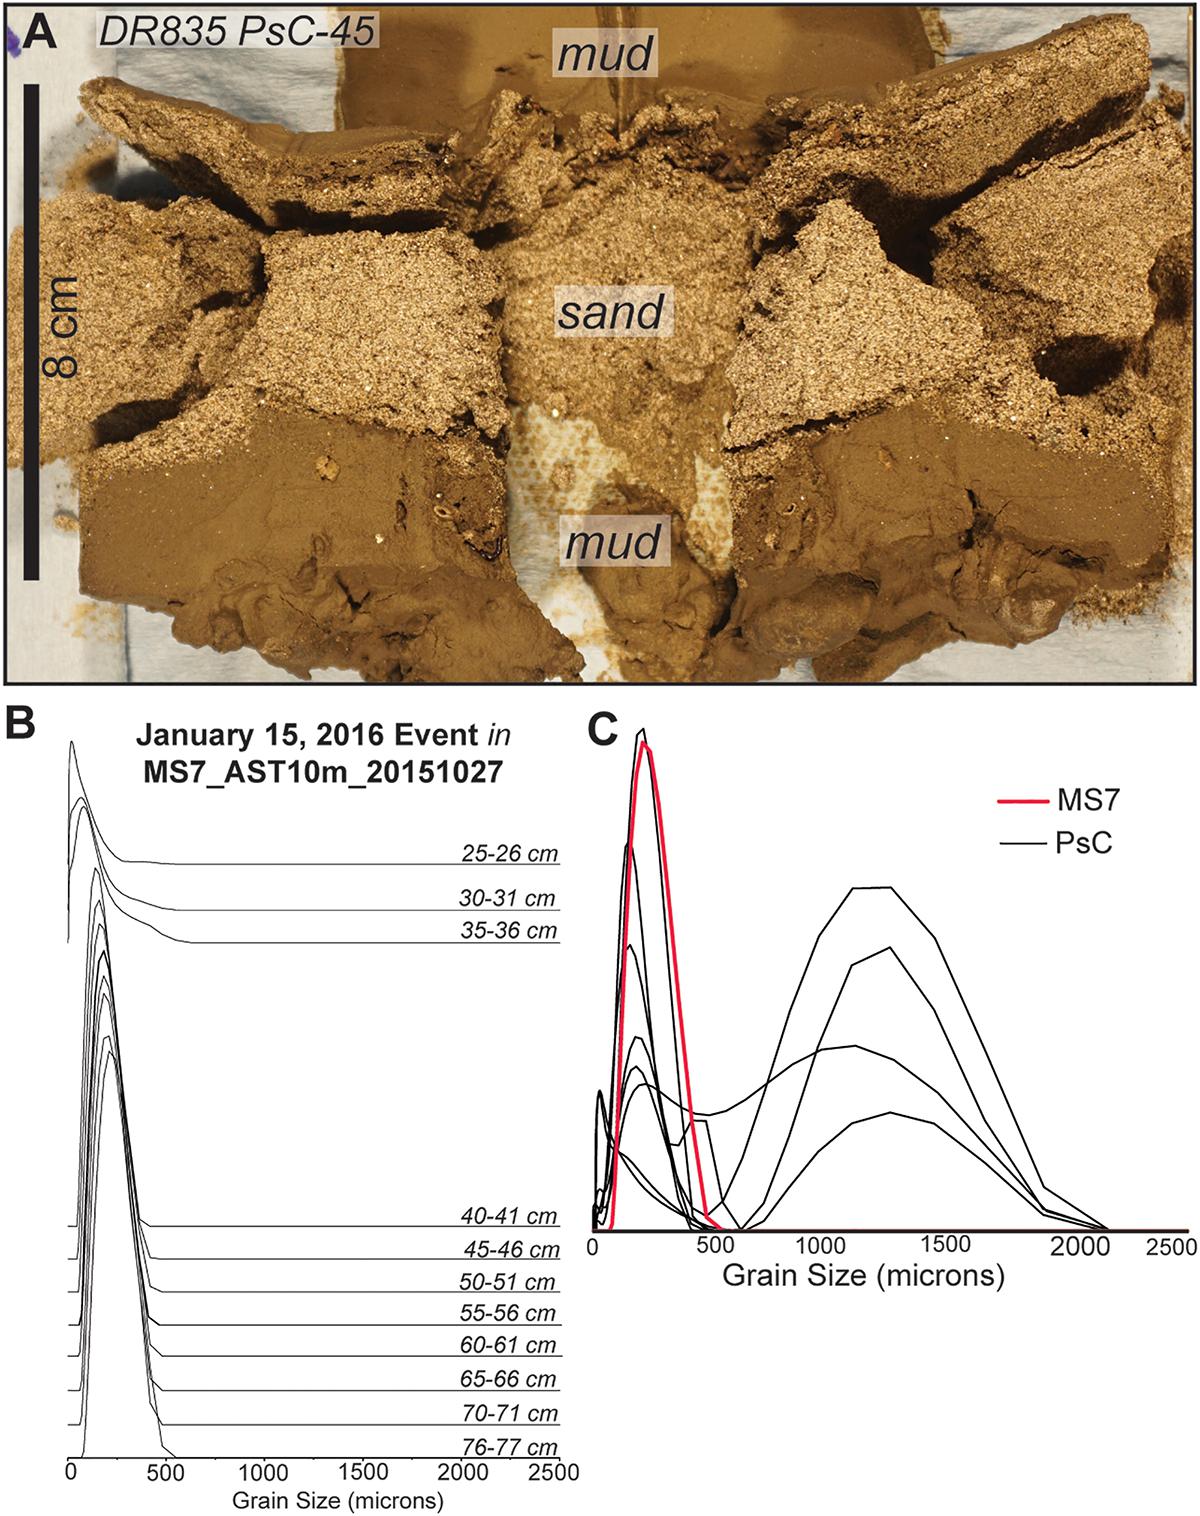
Figure 10. Comparison of sediment from the January 15, 2016 sediment density flow event in MS7 trap and seabed samples. See Figure 1B for sample locations. (A) Photograph of an extruded and split pushcore acquired following the January 15, 2016 event. (B) Stratigraphy of grain-size distributions from the January 15, 2016 event unit in MS7 sediment trap at 10 masf. (C) Comparison of grain-size distributions from MS7 and coarsest grain-size distributions from 1-cm extruded pushcore intervals of ROV pushcores (Supplementary Table S2).
In comparison to the January 15, 2016 event, grain size distributions for the September 1, 2016 event appear more similar between traps and cores (Figure 11B). All samples have a comparable sand peak at ∼200 microns, and most samples have a minor silt peak. MS7 trap and two pushcores have samples with an additional coarse sand peak ∼1250 microns.
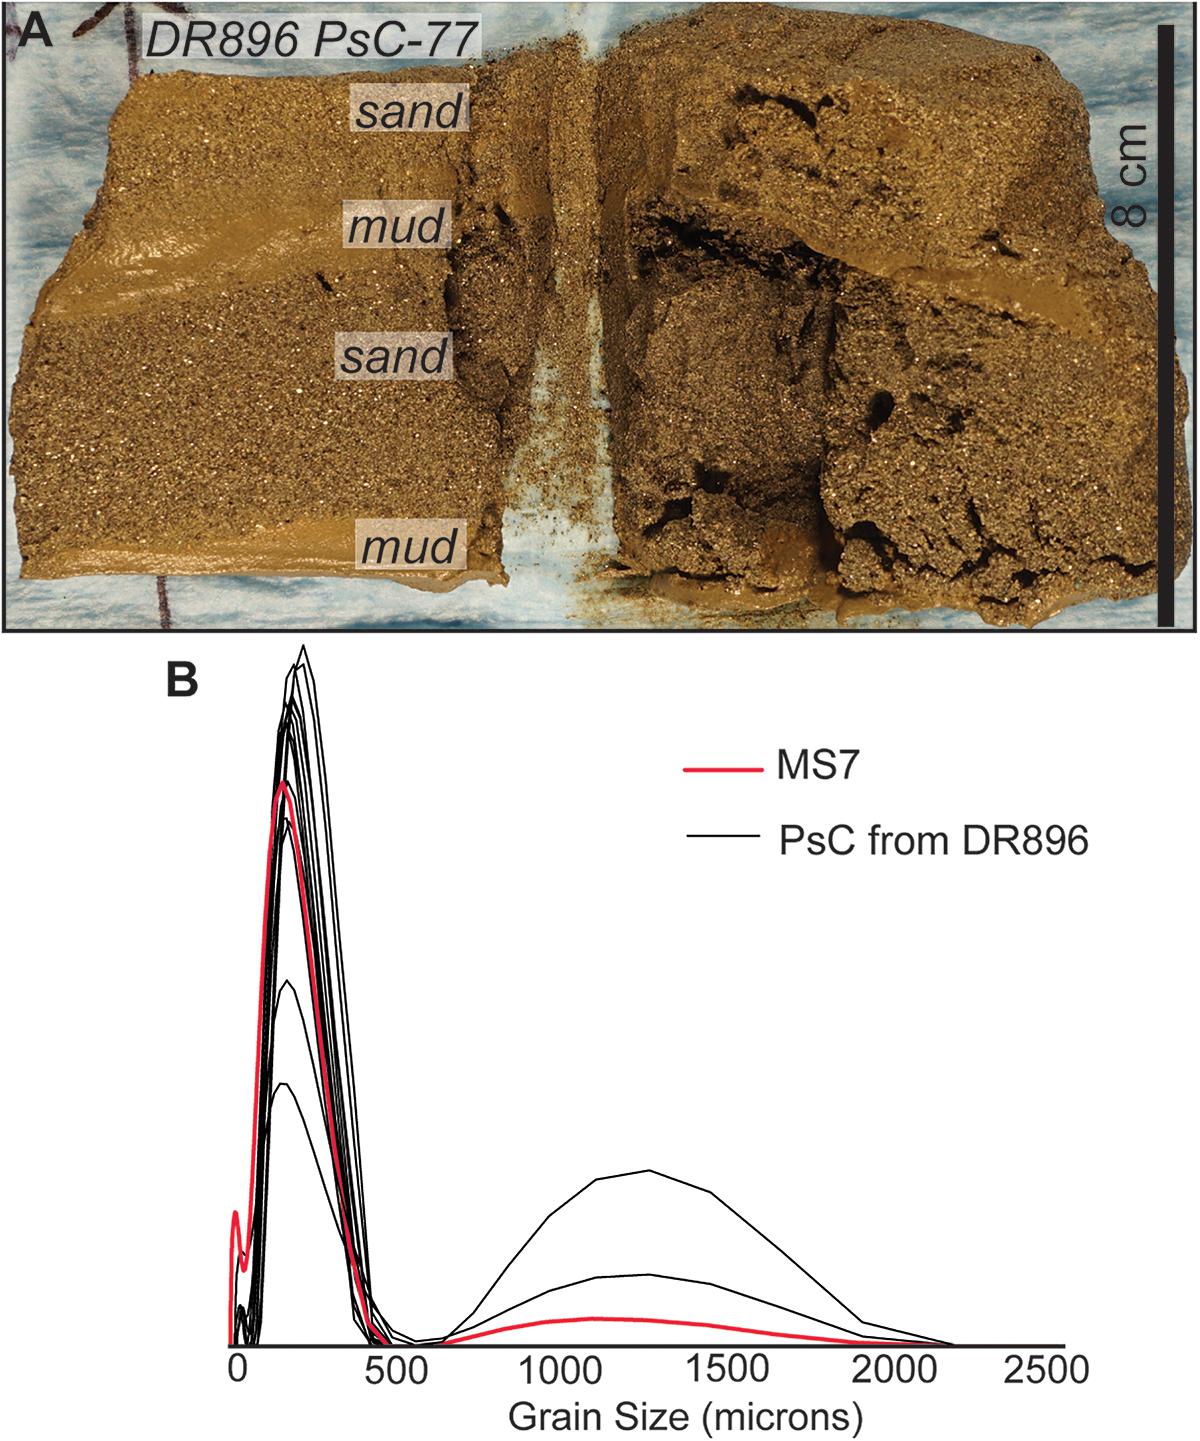
Figure 11. Comparison of sediment from the September 1, 2016 sediment density flow event in MS7 trap and seabed samples. See Figure 1C for sample locations. (A) Photograph of an extruded and split pushcore acquired following the September 1, 2016 event. (B) Comparison of the coarsest grain-size distributions from MS7 sediment trap at 10 masf and nearby pushcores (Supplementary Table S2).
Discussion
Turbidity current velocity measurements, samples from the water column, and seabed deposits presented in this study provide a unique opportunity to link flow processes with sediment transport and resulting deposits. We consider these questions: (1) Are flow variations faithfully recorded at a single location? (2) Are flow variations faithfully recorded along the canyon? (3) Do seabed deposits record grain sizes suspended during flow events?
Are Flow Variations Faithfully Recorded at a Single Location?
Are Trends in Flow Velocity Over Time Shown by Patterns of Vertical Grading Within Samples?
Phases of decreasing ADCP-measured flow velocity over time at approximately 10 masf during each event (e.g., Figure 6) could result in upward decreases in grain sizes of sediments from each event. Normally graded sediment trap event units (e.g., Figures 3–5, 10B) and some seabed deposits from events in this study (e.g., Figure 8) may reflect waning and thinning flows. Normally graded deposits are common in Monterey Canyon floor (e.g., Paull et al., 2005) and may record a common waning flow structure over time.
Above sandy event units in sediment trap tubes, slightly coarser-grained pulses of very fine-grained sand and silt likely result from sediment in the turbulent plume that either remained suspended in the water column following sediment density flow events, or were resuspended into the water column shortly after the events by internal tides (Figure 7) (e.g., Xu and Noble, 2009). If some of this fine-grained (silt-dominated) sediment settled out of the plume during periods of lower flow velocities when internal tides switched between up- and down-canyon orientations, this unconsolidated, fine-grained sand and silt could have been easily eroded and resuspended during internal tide velocities that frequently exceeded 50 cm/s (e.g., Figure 7) (Xu and Noble, 2009).
Sources of uncertainty in linking sediment trap samples with measurements of flow velocity and seabed deposits include exactly how and when sediment entered the traps from high-velocity flows (e.g., Symons et al., 2017). Although the moorings were designed for traps to be at 10 masf when moorings were upright, pressure records from ADCPs deployed on moorings at 65 masf show that the entire mooring string is pulled downward during the flow events (Paull et al., 2018). Presumably sediment traps tilted as they were pulled closer to the seafloor (<10 masf) during sediment density flow events, but the angles of tilt, precise height of the traps, and effect on sediment collection efficiency during the events cannot be confidently constrained from ADCP pressure or inclination records 55 m above the traps. Traps likely moved away from the seafloor as the mooring straightened, sampling from successively higher portions of the flow with time and possibly contributing to the observed normal grading in trap samples. Traps likely collected sediment most efficiently when upright in the water column, and normal grading may be enhanced by faster settling of larger grains into the trap tubes. The lack of abrasion on the outside of recovered sediment traps suggests that the recovered traps were not primarily scraping sediment from the seafloor and did not encounter the coarsest parts of the dense remobilized layer (up to ∼2 m thick after Paull et al., 2018). However, traps that were ripped off the moorings, may have.
Are Vertical Variations in Flow Velocity Represented by Vertical Grain Size Fractionation?
Traps deployed at different heights above the seafloor on the same mooring suggest that sediment density flows contained smaller grain size sediment with increasing height above the seafloor (e.g., Figure 4), and were possibly stratified. For example, at MS5, 90th percentile sand grain size (e.g., d0.9) decreased with increasing height above the seafloor (Figure 4E). This may be a record of sediment that was lofted 10s of meters above the seafloor during sediment density flow events, as imaged in expanding high backscatter in both the January 15, and September 1, 2016 events (Paull et al., 2018). Similar lofting of sediment into turbulent plumes was interpreted from previous sampling of Monterey Canyon turbidity currents by Xu et al. (2014). Additionally, the upper sediment trap could have been pulled closer to the seafloor, particularly during initial high-velocity parts of the events, allowing the upper trap to sample coarser grain sizes than ever reached 74 masf (e.g., Symons et al., 2017).
An additional source of uncertainty includes which phases of the sediment density flow events were sampled by sediment traps. The sediment traps may not sample efficiently (e.g., Gardner, 1985), or at all, during the early, fastest phases of flow events when moorings may have been highly tilted downstream. Traps may preferentially sample from collapsing portions of the flow events when they likely returned to a more upright position, and thus, trap event layers could appear more stratified and normally graded than earlier portions of the flow event. Herein, samples from sediment traps are considered as near seafloor (<10 masf) samples from sediment density flow events and are used comparatively to discuss along-canyon trends and comparison to seafloor samples.
Are Flow Variations Recorded Along the Canyon?
Sand grain sizes in traps along 50 km of the axial channel do not clearly reflect the variations in maximum ADCP-measured flow velocities nor transit velocities presented in Paull et al. (2018) (Table 2). Neither do sand grain sizes in sediment traps clearly reflect down-canyon variations in maximum ADCP-measured velocities adjacent to the sediment trap samples (∼10 masf; Figures 6C–H). Sediment trap samples from the January 15 and September 1, 2016 events have similar sharp basal contacts and normal grading along 50 km down-canyon (Figures 3, 4). Grain size distributions are also rather similar along the array during individual events (Figure 5), considering that maximum ADCP-measured velocities from approximately 10 masf (near the height of the traps) vary down-canyon on the order of meters per second (Figures 6A,B). Likewise, the presence, or absence, of coarser sand populations in the sediment trap samples does not clearly reflect these variations in flow velocity measurements along the canyon. Apparent differences in grain-size populations between sediment traps, specifically the presence of coarse sand peaks (Figure 5), may be related to the complex canyon-floor morphology and down-canyon changes in slope and confinement (Figure 1; Paull et al., 2011, 2018), variations in velocities during the events (e.g., Figure 6; Paull et al., 2018), other aspects of flow velocities not captured in these measurements, and (or) erosion and deposition along the canyon axial channel (Paull et al., 2018).
Do Seabed Deposits Record Grain Sizes Suspended During Flow Events?
Comparisons of trap and seabed samples suggest that the deposit remaining on the seafloor immediately following a sediment density flow event provides a faithful record of the sand that was suspended by that flow. Coarse sand, gravel, and organic material in seafloor samples are not consistently present in sediment traps, further suggesting stratified flows. Conversely, fine-grained silty sediment in traps transported in both events and internal tidal flows (e.g., Xu and Noble, 2009) is less prevalent in seafloor deposits than traps.
We argue that trap samples are representative of sediment transported in the water column during an event. Owing to the lack of abrasion and tool marks on the sediment traps and other instruments on the same mooring, it is unlikely that mooring sediment traps scooped sediment directly from the seafloor during powerful sediment density flow events, although this possibility cannot be completely eliminated. Although traps may have sampled from the collapsing portions of the flow events, these stages are likely most closely related to seabed deposits, particularly in the upper reaches of the canyon. Comparing sediment suspended in the water column during events and seabed deposits following flow events is important, particularly because much of our knowledge of sediment density flow events has been derived largely from their remaining deposits (e.g., Talling et al., 2015; Hodgson et al., 2018).
Both sediment traps and pushcores contain sand (peak centered ∼200 microns), but the seafloor deposits variably also contain additional coarse- to very coarse-grained sand and gravel (Figures 8–11). Greater variability is apparent between pushcore samples and MS7 trap samples from the January 15, 2016 event compared to the September 1, 2016 event, possibly owing to the slight difference in location between these two sample sets (Figures 1B,C). Larger grain-size populations in seabed cores, but not trap samples, may also be related to (1) baffles on traps that would have prevented large particles in the water column from entering the sediment trap, (2) velocity gradients and flow stratification that may have restricted large particles in flows to levels below the height of sediment traps, (3) large particles that may have moved primarily below traps as bedload, and (or) (4) large clasts that may represent winnowed deposits remaining where sand may have been removed during the event. Maximum ADCP-measured flow velocities and transit velocities reported in Paull et al. (2018) for the January 15, 2016 event (Table 2) may have been sufficient to transport some of these large particles below trap height during the event.
Our results highlight additional complexity in comparing sediment from flows and seafloor deposits, even when contemporaneous samples are available. For example, seafloor heterogeneity, reworking of seafloor sediments, and flow bypass may all lead to individual pushcores that are not fully representative of the preceding flow. Heterogeneity observed on the seafloor (Figure 9) and between pushcores (Figure 8) suggests that single events may generate deposits with different grain-size distributions. The differences in grain size populations and stratigraphy between closely-spaced pushcore samples in this study may be related to migration or modification of crescent-shaped bedforms on the canyon floor (Figures 1B,C) (Paull et al., 2010). These bedforms are prevalent in other canyons and channels, where they may generate similar small-scale heterogeneity and stratigraphic incompleteness (e.g., Normark et al., 2009; Symons et al., 2016; Hage et al., 2018; Vendettuoli et al., 2019). Seafloor heterogeneity could also result from reworking of existing deposits, including erosion and deposition with bedform migration, that could mix deposits of sediment transported in different flows. Erosion and deposition of Monterey Canyon axial channel floor occurred during individual sediment density flow events measured in the CCE, as noted by geomorphic change in the axial channel on the order of meters, bedform modification, and dense remobilized layers in flow events (e.g., Paull et al., 2018). Bypass of parts of event flows may also account for some variability in grain-size distributions and apparent thickness between trap and pushcore samples, although neither sampling method is likely to have captured the entire event unit.
Identifying such reworking or bypass is complicated by the visually apparent similarity between the two sets of pushcores in this and previous Monterey Canyon studies. For example, grain sizes are comparable between sediment traps at approximately 10 masf along the canyon axis in this study and visual descriptions of previously acquired pushcore samples from benches and canyon walls approximately 10 m above the adjacent axial channel (e.g., Paull et al., 2005, 2010; Symons et al., 2017). These similarities may suggest some consistency in sediment density flow processes and sediment recycling, making this study of modern processes in Monterey Canyon a relevant analog for older deposits and flows that continued farther toward the fan.
Macroscopic woody organic material in pushcores (e.g., Figure 8F) has been noted in Monterey Canyon in the last stages of the event deposits during previous sampling studies (e.g., Paull et al., 2005), but macroscopic organics were not observed in sediment trap samples from this study. These two possibilities should be considered: (1) It remains possible that, despite the baffles, turbulence around the traps and (or) the hypersaline solution in the traps, may have prevented small (< ∼2 cm) macroscopic organic material from entering the trap (e.g., Fawcett et al., 2018); however, this fails to explain apparent preferential exclusion of organic matter compared to fine-grained sediment that accumulated in the traps (e.g., Figures 3, 8); (2) Alternatively, organic material may be transported near the seafloor and below the trap height.
Fine-grained sediment in the traps (e.g., Figure 3) is underrepresented in axial channel deposits (e.g., Figure 8; Paull et al., 2005, 2010). At most, thin (cm-scale) mud layers are present above or between sand layers in pushcores (e.g., Figure 8). Over short timeframes, seafloor deposits appear to record sand transported during sediment density flow events, but may fail to clearly record other sediment and organic matter transport processes in the water column and along the seafloor.
Conclusion
This study presents a rare dataset of numerous samples from, and measurements of, sediment density flow events (commonly referred to as turbidity currents) in a submarine canyon. Comparisons of sediment trap grain sizes, seabed deposits, and flow velocity measurements from the same events show the degree to which deposits represent flow events. Thus, this study links direct measurements from powerful flows, samples of sediment suspended within flows from near the seafloor (∼10 masf), and resulting seabed deposits, which has been a persistent challenge in sedimentary research. The unique dataset from the proximal 50 km along Monterey Canyon may serve as a useful analog for, or comparison with, sediment transport extending 100s of kilometers farther onto Monterey Fan, occurring in other submarine canyons, modeled in future studies, and observed in ancient deposits.
Normal grading in sediment trap event units, as well as some seabed deposits, appears to reflect temporal waning of velocities, and thinning and collapsing of flows. Sediment density flows vary in grain size with height above the seafloor, with coarse sediment concentrated toward the seafloor and possible stratification. Sand suspended near the seafloor (∼10 masf) during sediment density flow events was similar along 50 km of Monterey Canyon axial channel, suggesting some consistency in sediment transport throughout long-run-out flows measured in this study. Variations in maximum velocities measured along the canyon within sediment density flow events are not reflected clearly or consistently in sediment samples from the same flows. Although comparing trap and seafloor samples is complicated by vertical variation in the water column and seafloor heterogeneity, sand transported within the water column during events appears to be faithfully recorded in seabed deposits following two well-documented events. Conversely, fine-grained sediment transported during events and internal tidal flows that is less prevalent, and coarse sand and gravel that are observed more frequently, on the seafloor compared to traps may reflect flow stratification, transport as bedload or in a near-seafloor dense layer, and bedform migration not recorded in suspended sediment sampled in traps.
Data Availability
Data used in this study and generated in the CCE are available from Lundsten (2019), Ferreira et al. (2019), and Paull et al. (2018). Sediment trap data are available in Supplementary Files and in the IEDA marine geoscience data system at doi: 10.1594/IEDA/324760=and doi: 10.1594/IEDA/324761.
Author Contributions
All authors contributed to the design and implementation of the Monterey Coordinated Canyon Experiment, sample acquisition and processing, and/or development of the manuscript.
Funding
Funding was provided by the David and Lucile Packard Foundation, Natural Environment Research Council (Grant No. NE/K011480/1), U.S. Geological Survey (USGS) Coastal and Marine Program, and Ocean University of China. Additional funding for MAC was provided by NERC National Capability CLASS programme (Climate Linked Atlantic Sector Science Programme).
Conflict of Interest Statement
The authors declare that the research was conducted in the absence of any commercial or financial relationships that could be construed as a potential conflict of interest.
Acknowledgments
This study would not have been possible without the entire Monterey Coordinated Canyon Experiment (CCE) Team. Special thanks to the USGS Marine Facilities team, especially Cordell Johnson, Dan Powers, Joanne Ferreira, Rob Wyland, Tim Elfers, Pete Dal Ferro, and Jenny White, for operation of sediment traps and upper canyon moorings; Ashley Tuton and University of Southampton for grain size analyses; Sharon Borglin and Tim Kneafsey at the Lawrence Berkeley National Laboratory Rock Dynamic and Imaging Lab, and Elliot Kim and Anthony Kovscek at the SUPRI-A Laboratory; Mike Torresan and PCMSC Sediment Laboratories; MBARI’s ship crews, ROV pilots, and CCE shipboard scientific parties.
Supplementary Material
The Supplementary Material for this article can be found online at: https://www.frontiersin.org/articles/10.3389/feart.2019.00144/full#supplementary-material
FIGURE S1 | Summary of Anderson sediment trap results and interpretations of sediment density flow event units from Deployment I (October 2015–April 2016). Datum is base of trap tube sediment (i.e., start of deployment). From left to right, data shown are CT images, intervalometer disk dates (numeric month and day), and grain size measurements at 1 cm intervals, including d0.1 in red, d[4,3] in black, and d0.9 in gray. Grain size results from bulk samples extracted from the sediment trap funnels are shown above trap tube data. Interpreted sediment from January 15, 2016 sediment density flow event is highlighted in red.
FIGURE S2 | Summary of Anderson sediment trap results and interpretations of sediment density flow event units from Deployment II (April 2016–October 2016). Data shown as in Supplementary Figure S1, with grain size measurements every 5 cm. Interpreted sediment from September 1, 2016 sediment density flow event is highlighted in green.
FIGURE S3 | Summary of Anderson sediment trap results and interpretations of sediment density flow event units from Deployment III (October 2016–April 2017). Data shown as in Supplementary Figure S2. Interpretation of events on November 24, 2016 and January 9, January 22, February 3, and February 18, 2017 are highlighted. For more information, see event chart in Paull et al. (2018).
TABLE S1 | Grain size summary for sediment density flow events in sediment traps.
TABLE S2 | Grain size summary for pushcore samples.
References
Anderson, K. S., Graham, S. A., and Hubbard, S. M. (2006). Facies, architecture, and origin of a reservoir-scale sand-rich succession within submarine canyon fill: Insights from Wagon Caves Rock (Paleocene), Santa Lucia Range, California, U.S.A. J. Sed. Res. 76, 819–838. doi: 10.2110/jsr.2006.066
Anderson, R. Y. (1977). Short term sedimentation response in lakes in western United States as measured by automated sampling. Limnol. Oceanogr. 22, 423–433. doi: 10.4319/lo.1977.22.3.0423
Azpiroz-Zabala, M., Cartigny, M. J. B., Talling, P. J., Parsons, D. R., Sumner, E. J., Clare, M. A., et al. (2017). Newly recognized turbidity current structure can explain prolonged flushing of submarine canyons. Sci. Adv. 3:e1700200. doi: 10.1126/sciadv.1700200
Clare, M. A., Vardy, M. E., Cartigny, M. J. B., Talling, P. J., Himsworth, M. D., Dix, J. K., et al. (2017). Direct monitoring of active geohazards: Emerging geophysical tools for deep-water assessments. Near Surf. Geophys. 15, 427–444. doi: 10.3997/1873-0604.2017033
Cronin, B. T., and Kidd, R. B. (1998). Heterogeneity and lithotype distribution in ancient deep-sea canyons: point Lobos deep-sea canyon as a reservoir analogue. Sed. Geol. 115, 315–349. doi: 10.1016/s0037-0738(97)00099-7
Farnsworth, K. L., and Warrick, J. A. (2007). Sources, Dispersal, and Fate of Fine Sediment Supplied to Coastal California. Reston, VA: U.S. Geological Survey.
Fawcett, S. E., Johnson, K. S., Riser, S., Van Oostende, N., and Sigman, D. M. (2018). Low-nutrient organic matter in the Sargasso Sea thermocline: a hypothesis for its role, identity, and carbon cycle implications. Mar. Chem. 207, 108–123. doi: 10.1016/j.marchem.2018.10.008
Ferguson, R. I., and Church, M. (2004). A simple universal equation for grain settling velocity. J. Sed. Res. 74, 933–937. doi: 10.1306/051204740933
Ferreira, J. T., Rosenberger, K. J., and (2019). Time-Series Oceanographic Data From the Monterey Canyon, CA October 2015–March 2017. Reston, VA: U.S. Geological Survey.
Fildani, A., and Normark, W. R. (2004). Late Quaternary evolution of channel and lobe complexes of Monterey Fan. Mar. Geol. 206, 199–223. doi: 10.1016/j.margeo.2004.03.001
Gardner, W. D. (1985). The effect of tilt on sediment trap efficiency. Deep Sea Res. 32, 349–361. doi: 10.1016/0198-0149(85)90083-4
Griggs, G. B., and Hein, J. R. (1980). Sources, dispersal, and clay mineral composition of fine-grained sediment off central and northern California. J. Geol. 88, 541–566. doi: 10.1086/628543
Hage, S., Cartigny, M. J. B., Clare, M. A., Sumner, E. J., Vendettuloi, D., Hughes Clarke, J. E., et al. (2018). How to recognize crescentic bedforms formed by supercritical turbidity currents in the geologic record: insights from active submarine channels. Geology 46, 563–566. doi: 10.1130/G40095.1
Harris, P. T., and Whiteway, T. (2011). Global distribution of large submarine canyons: geomorphic differences between active and passive continental margins. Mar. Geol. 285, 69–86. doi: 10.1016/j.margeo.2011.05.008
Hedges, J. I., Lee, C., Wakeham, S. G., Hernes, P. J., and Peterson, M. L. (1993). Effects of poisons and preservatives on the fluxes and elemental compositions of sediment trap materials. J. Mar. Res. 51, 651–668. doi: 10.1357/0022240933223990
Hodgson, D. M., Bernhard, A., Clare, M. A., Da Silva, A.-C., Fosdick, J. E., Mauz, B., et al. (2018). Grand challenges (and great opportunities) in sedimentology, stratigraphy, and diagenesis research. Front. Earth Sci. 6:173. doi: 10.3389/feart.2018.00173
Hughes Clarke, J. E. (2016). First wide-angle view of channelized turbidity currents links migrating cyclic steps to flow characteristics. Nat. Comm. 7:11986. doi: 10.1038/ncomms11896
Inman, D. L., and Jenkins, S. A. (1999). Climate change and the episodicity of sediment flux of small California rivers. J. Geol. 107, 251–270. doi: 10.1086/314346
Komar, P. D. (1985). The hydraulic interpretation of turbidites from their grain sizes and sedimentary structures. Sedimentology 32, 395–407. doi: 10.1111/j.1365-3091.1985.tb00519.x
Liu, J. T., Hsu, R. T., Hung, J.-J., Chang, Y.-P., Wang, Y.-H., Rendle-Bühring, R. H., et al. (2016). From the highest to the deepest: the Gaoping River – Gaoping Submarine Canyon dispersal system. Earth Sci. Rev. 153, 274–300. doi: 10.1016/j.earscirev.2015.10.012
Lundsten, E. (2019). Coordinated Canyon Experiment (CCE) data report. MBARI.org. Available at: https://www.mbari.org/science/seafloor-processes/geological-changes/coordinated-canyon-experiment-datareport-main-page/ (accessed May 21, 2019).
Maier, K. L., Hartwell, S. R., Johnson, S. Y., Davenport, C., and Greene, H. G. (2016). “Offshore and onshore geology and geomorphology, Monterey Canyon and Vicinity map area, California, sheet 10,” in California State Waters Map Series—Monterey Canyon and Vicinity. U.S. Geol. Surv. Open-File Report 2016-1072, eds P. Dartnell, K. L. Maier, M. D. Erdey, B. E. Dieter, N. E. Golden, S. Y. Johnson, et al. (Reston, VA: U.S. Geological Survey).
Maier, K. L., Johnson, S. Y., and Hart, P. (2018). Controls on submarine canyon head evolution, migration, and fill in Monterey Bay, offshore central California. Mar. Geol. 404, 24–40. doi: 10.1016/j.margeo.2018.06.014
Matos, F. L., Ross, S. W., Huvenne, V. A. I., Davies, J. S., and Cunha, M. R. (2018). Canyons pride and prejudice: Exploring the submarine canyon research landscape, a history of geographic and thematic bias. Progr. Oceanogr. 169, 6–19. doi: 10.1016/j.pocean.2018.04.010
Mutti, E., and Normark, W. R. (1987). “Comparing examples of modern and ancient turbidite systems: problems and concepts,” in Marine Clastic Sedimentology: Concepts and Case Studies, eds J. K. Leggett and G. G. Zuffa (London: Graham and Trotman), 1–38. doi: 10.1007/978-94-009-3241-8_1
Normark, W. R. (1974). “Submarine canyons and fan valleys: Factors affecting growth patterns of deep-sea fans,” in Modern and Ancient Geosynclinals Sedimentation, Vol. 19, eds R. H. Dott and R. Shaver (Tulsa: Society of Economic Paleontologists and Mineralogists Special Publication), 56–68. doi: 10.2110/pec.74.19.0056
Normark, W. R., Paull, C. K., Caress, D. W., Ussler, W. I. I. I., and Sliter, R. (2009). Fine-scale relief related to late holocene channel shifting within the floor of the upper Redondo Fan, offshore Southern California. Sedimentology 56, 1690–1704. doi: 10.1111/j.1365-3091.2009.10152.x
Paull, C. K., Caress, D. W., Ussler, W. I. I. I., Lundsten, E., and Meiner-Johnson, M. (2011). High-resolution bathymetry of the axial channels within monterey and soquel submarine canyons, offshore central California. Geosphere 7, 1077–1101. doi: 10.1130/GES00636.1
Paull, C. K., McGann, M., Sumner, E. J., Barnes, P. M., Lundsten, E. M., Anderson, K., et al. (2014). Sub-decadal turbidite frequency during the early Holocene: Eel Fan, offshore northern California. Geology 42, 855–858. doi: 10.1130/G35768.1
Paull, C. K., Mitts, P., Ussler, W. I. I. I., Keaten, R., and Greene, H. G. (2005). Trail of sand in upper Monterey Canyon: Offshore California. Geol. Soc. Am. Bull. 117, 1134–1145. doi: 10.1130/B25390.1
Paull, C. K., Talling, P. J., Maier, K. L., Parsons, D., Xu, J., Caress, D. W., et al. (2018). Powerful turbidity currents driven by dense basal layers. Nat. Commun. 9:4114. doi: 10.1038/s41467-018-06254-6
Paull, C. K., Ussler, W. I. I. I., Caress, D. W., Lundsten, E., Covault, J. A., Maier, K. L., et al. (2010). Origins of large crescent-shaped bedforms within the axial channel of Monterey Canyon, offshore California. Geosphere 6, 1–20. doi: 10.1130/GES00527.1
Paull, C. K., Ussler, W. I. I. I., Greene, H. G., Keaten, R., Mitts, P., and Barry, J. (2003). Caught in the act: the 20 December 2001 gravity flow event in Monterey Canyon. Geo. Mar. Lett. 22, 227–232. doi: 10.1007/s00367-003-0117-2
Rendigs, R. R., Anderson, R. Y., Xu, J., Davis, R. E., and Bergeron, E. (2009). The Partition Intervalometer: A programmable Underwater Timer for Marking Accumulated Sediment Profiles Collected in Anderson Sediment Traps: Development, Operation, Testing Procedures, and Field Results. U.S. Geol. Surv. Open-File Report 2009-1101. Reston, VA: USGS.
Shepard, F. P. (1951). Mass movements in submarine canyon heads. Trans. Am. Geophys. Un. 32, 405–418.
Smith, D. P., Kvitek, R., Iampietro, P. J., and Wong, K. (2007). Twenty-nine months of geomorphic change in upper Monterey Canyon (2002–2005). Mar. Geol. 236, 79–94. doi: 10.1016/j.margeo.2006.09.024
Smith, D. P., Ruiz, G., Kvitek, R., and Iampietro, P. J. (2005). Semiannual patterns of erosion and deposition in upper Monterey Canyon from serial multibeam bathymetry. Geol. Soc. Am. Bull. 117, 1123–1133. doi: 10.1130/B25510.1
Stevens, T., Paull, C. K., Ussler, W. I. I. I., McGann, M., Buylaert, J.-P., and Lundsten, E. (2014). The timing of sediment transport down Monterey Submarine Canyon, offshore California. Geol. Soc. Am. Bull. 126, 103–121. doi: 10.1130/B30931.1
Symons, W. O., Sumner, E. J., Paull, C. K., Cartigny, M. J. B., Xu, J. P., Maier, K. L., et al. (2017). A new model for turbidity current behavior based on integration of flow monitoring and precision coring in a submarine canyon. Geology 45, 367–370. doi: 10.1130/G38764.1
Symons, W. O., Sumner, E. J., Talling, P. J., Cartigny, M. J. B., and Clare, M. A. (2016). Large-scale sediment waves and scours on the modern seafloor and their implications for the prevalence of supercritical flows. Mar. Geol. 371, 130–148. doi: 10.1016/j.margeo.2015.11.009
Talling, P. J., Allin, J., Armitage, D. A., Arnott, R. W. C., Cartigny, M. J. B., Clare, M. A., et al. (2015). Key future directions for research on turbidity currents and their deposits. J. Sed. Res. 85, 153–169. doi: 10.2110/jsr.2015.03
Vendettuoli, D., Clare, M. A., Hughes Clarke, J. E., Vellinga, A., Hizzett, J., Hage, S., et al. (2019). Daily bathymetric surveys document how stratigraphy is built and its extreme incompleteness in submarine channels. Earth Plant. Sci. Lett. 515, 231–247. doi: 10.1016/j.epsl.2019.03.033
Williams, T. A., Graham, S. A., and Constenius, K. N. (1998). Recognition of a Santonian submarine canyon, Great Valley Group, Sacramento Basin, California: Implications for petroleum exploration and sequence stratigraphy of deep-marine strata. Am. Assoc. Petrol. Bull. 82, 1575–1595.
Xu, J. P. (2011). Measuring currents in submarine canyons: Technological and scientific progress in the past 30 years. Geosphere 7, 868–876. doi: 10.1130/GES00640.1
Xu, J. P., Barry, J. P., and Paull, C. K. (2013). Small-scale turbidity currents in a big submarine canyon. Geology 41, 143–146. doi: 10.1130/G33727.1
Xu, J. P., and Noble, M. A. (2004). In-situ measurements of velocity structure within turbidity currents. Geophys. Res. Lett. 31:L09311. doi: 10.1029/2004GL019718
Xu, J. P., and Noble, M. A. (2009). Currents in Monterey Submarine Canyon. J. Geophys. Res. 114:C03004. doi: 10.1029/2008JC004992
Xu, J. P., Noble, M. A., and Rosenfeld, L. K. (2004). In-situ measurements of velocity structure within turbidity currents. Geophys. Res. Lett. 31:L09311. doi: 10.1029/2004GL019718
Xu, J. P., Sequeiros, O. E., and Noble, M. A. (2014). Sediment concentrations, flow conditions, and downstream evolution of two turbidity currents, Monterey Canyon, USA. Deep-Sea Res. I 89, 11–34. doi: 10.1016/j.dsr.2014.04.001
Xu, J. P., Swarzenski, P. W., Noble, M., and Li, A.-C. (2010). Event-driven sediment flux in Hueneme and Mugu submarine canyons, southern California. Mar. Geol. 269, 74–88. doi: 10.1016/j.margeo.2009.12.007
Keywords: submarine canyon, sediment density flow, turbidity current, turbidite, sediment trap, Monterey Canyon
Citation: Maier KL, Gales JA, Paull CK, Rosenberger K, Talling PJ, Simmons SM, Gwiazda R, McGann M, Cartigny MJB, Lundsten E, Anderson K, Clare MA, Xu J, Parsons D, Barry JP, Wolfson-Schwehr M, Nieminski NM and Sumner EJ (2019) Linking Direct Measurements of Turbidity Currents to Submarine Canyon-Floor Deposits. Front. Earth Sci. 7:144. doi: 10.3389/feart.2019.00144
Received: 15 January 2019; Accepted: 20 May 2019;
Published: 06 June 2019.
Edited by:
David Mark Hodgson, University of Leeds, United KingdomCopyright © 2019 Maier, Gales, Paull, Rosenberger, Talling, Simmons, Gwiazda, McGann, Cartigny, Lundsten, Anderson, Clare, Xu, Parsons, Barry, Wolfson-Schwehr, Nieminski and Sumner. This is an open-access article distributed under the terms of the Creative Commons Attribution License (CC BY). The use, distribution or reproduction in other forums is permitted, provided the original author(s) and the copyright owner(s) are credited and that the original publication in this journal is cited, in accordance with accepted academic practice. No use, distribution or reproduction is permitted which does not comply with these terms.
*Correspondence: Katherine L. Maier, S2F0aWUuTWFpZXJAbml3YS5jby5ueg==
†Present address: Katherine L. Maier, National Institute of Water and Atmospheric Research, Wellington, New Zealand