 Christiane Uhlig1
 Ellen Damm1*
 Ilka Peeken1
 Thomas Krumpen1
 Benjamin Rabe1
 Meri Korhonen2
 Kai-Uwe Ludwichowski1
- 1Alfred-Wegener-Institut Helmholtz-Zentrum für Polar- und Meeresforschung, Bremerhaven, Germany
- 2Finnish Meteorological Institute, Helsinki, Finland
Dimethylsulfide (DMS) is a biogenic trace gas with importance to aerosol formation. DMS is produced by microbial degradation of dimethylsulfoniopropionate (DMSP), an abundant metabolite in marine microalgae. We analyzed DMS and DMSP concentrations in surface water in the central Arctic Ocean during two expeditions north of 79°N in 2011 and 2015. We identified three regions, which were characterized by different DMS and DMSP concentrations, dependent on the regional water masses and the relative movement of sea ice and water to each other. In addition, correlations between DMS and DMSP and correlation of the two sulfur compounds to autotrophic biomass (as chlorophyll a) differed in the regions. In the area of the nutrient rich Atlantic water inflow and short contact of this water with sea ice, DMS is present in high concentrations and correlates to DMSP as well as chlorophyll a. At two stations, particularly high DMS concentrations were found in conjunction with under-ice phytoplankton biomass peaks. In contrast, in mixed Atlantic and Pacific water with strong polar influence, where long-term contact between sea ice and water causes persistent stratification, only little DMS is found. Further, the correlations to DMSP and chlorophyll a are lost and the ratio of DMS to DMSP is about one order of magnitude lower, pointing toward consumption of DMSP without the production of DMS. We conclude that the duration of sea ice influence and source of the surface water do not only lead to differences in phytoplankton productivity, resulting in different DMSP concentrations, but also influence microbial recycling of DMSP to DMS or other compounds. DMS production, as possible source for aerosols, is thus presumably lower in the strongly sea ice influenced central Arctic areas than what could be expected from DMSP concentration or biomass.
Introduction
Dimethylsulfide (DMS) represents the most important natural source of sulfur to the atmosphere, accounting for up to 80% of global biogenic sulfur emissions (Keller et al., 1989; Liss et al., 1997; Kettle and Andreae, 2000). In the atmosphere DMS can be oxidized to sulfate aerosols which serve as cloud condensation nuclei and thus influence solar radiation income (Charlson et al., 1987; Andreae, 1990). The contribution of DMS to cloud condensation nuclei is particularly important in remote oceanic regions, such as the Southern Ocean that is little affected by anthropogenic sources of sulfate (Vallina et al., 2007). In the Arctic, several studies show a coincidence or strong contribution of DMS to aerosol formation. This is particularly pronounced during phytoplankton blooms (Park et al., 2017) and in the summer, when other condensation nuclei, e.g., from anthropogenic sources or sea salts, are low (Chang et al., 2011; Leaitch et al., 2013; Ghahremaninezhad et al., 2016).
Dimethylsulfide is produced by degradation of dimethylsulfoniopropionate (DMSP), which is an abundant metabolite produced by marine microalgae. Different taxonomic groups of microalgae produce different amounts of DMSP per biomass. Dinoflagellates, prymnesiophytes, and chrysophytes are high DMSP producers, whereas diatoms, prasinophytes and chlorophytes produce lower amounts of DMSP (Keller et al., 1989; Stefels et al., 2007). In the polar regions, sea ice algae are important DMSP producers, for whom it probably serves as osmoregulator and cryoprotectant (Kirst et al., 1991). Marine bacteria have recently been shown to produce DMSP, but the physiological role and contribution to overall DMSP production is unknown so far (Curson et al., 2017). Phytoplankton as well as bacteria cleave DMSP to DMS with enzymes (e.g., Ishida, 1968; Kiene, 1990; Stefels and Van Boekel, 1993; Ledyard and Dacey, 1994). DMSP is further released into the seawater by active exudation or by disruption of cells, e.g., by autolysis, viral lysis, or grazing (Malin et al., 1998; Simó, 2001; Kasamatsu et al., 2004). Dissolved DMSP is then available for microbial consumption, serving as an important carbon and sulfur source, covering up to 15% of the carbon and 100% of the sulfur demand (Kiene et al., 2000). Bacteria either lyse DMSP to assimilate the carbon and produce DMS as side product, or demethylate DMSP to assimilate both carbon and sulfur. The balance between both pathways is controlled by the sulfur demand of the bacterial community. Major removal processes of DMS from seawater are bacterial uptake and degradation, photo-oxidation and sea-air flux (Kiene and Bates, 1990; Simó, 2004; del Valle et al., 2009).
The central Arctic Ocean is influenced by Atlantic water (AW) entering through Fram Strait and Pacific water (PW) entering through Bering Strait (Figure 1A). AW and PW differ in their nitrate-to-phosphate ratios, with PW being depleted in nitrate compared to AW (Jones et al., 1998). Both water masses mix while drifting from the Laptev Sea toward Fram Strait in the Transpolar Drift, which is also the primary drift direction of sea ice (Kwok et al., 2013; Figure 1A). In addition, in the central Arctic sea-ice melt and freeze influence the surface stratification. This limits winter vertical mixing and thus the resupply of nutrients from deeper water (e.g., Rudels et al., 1991).
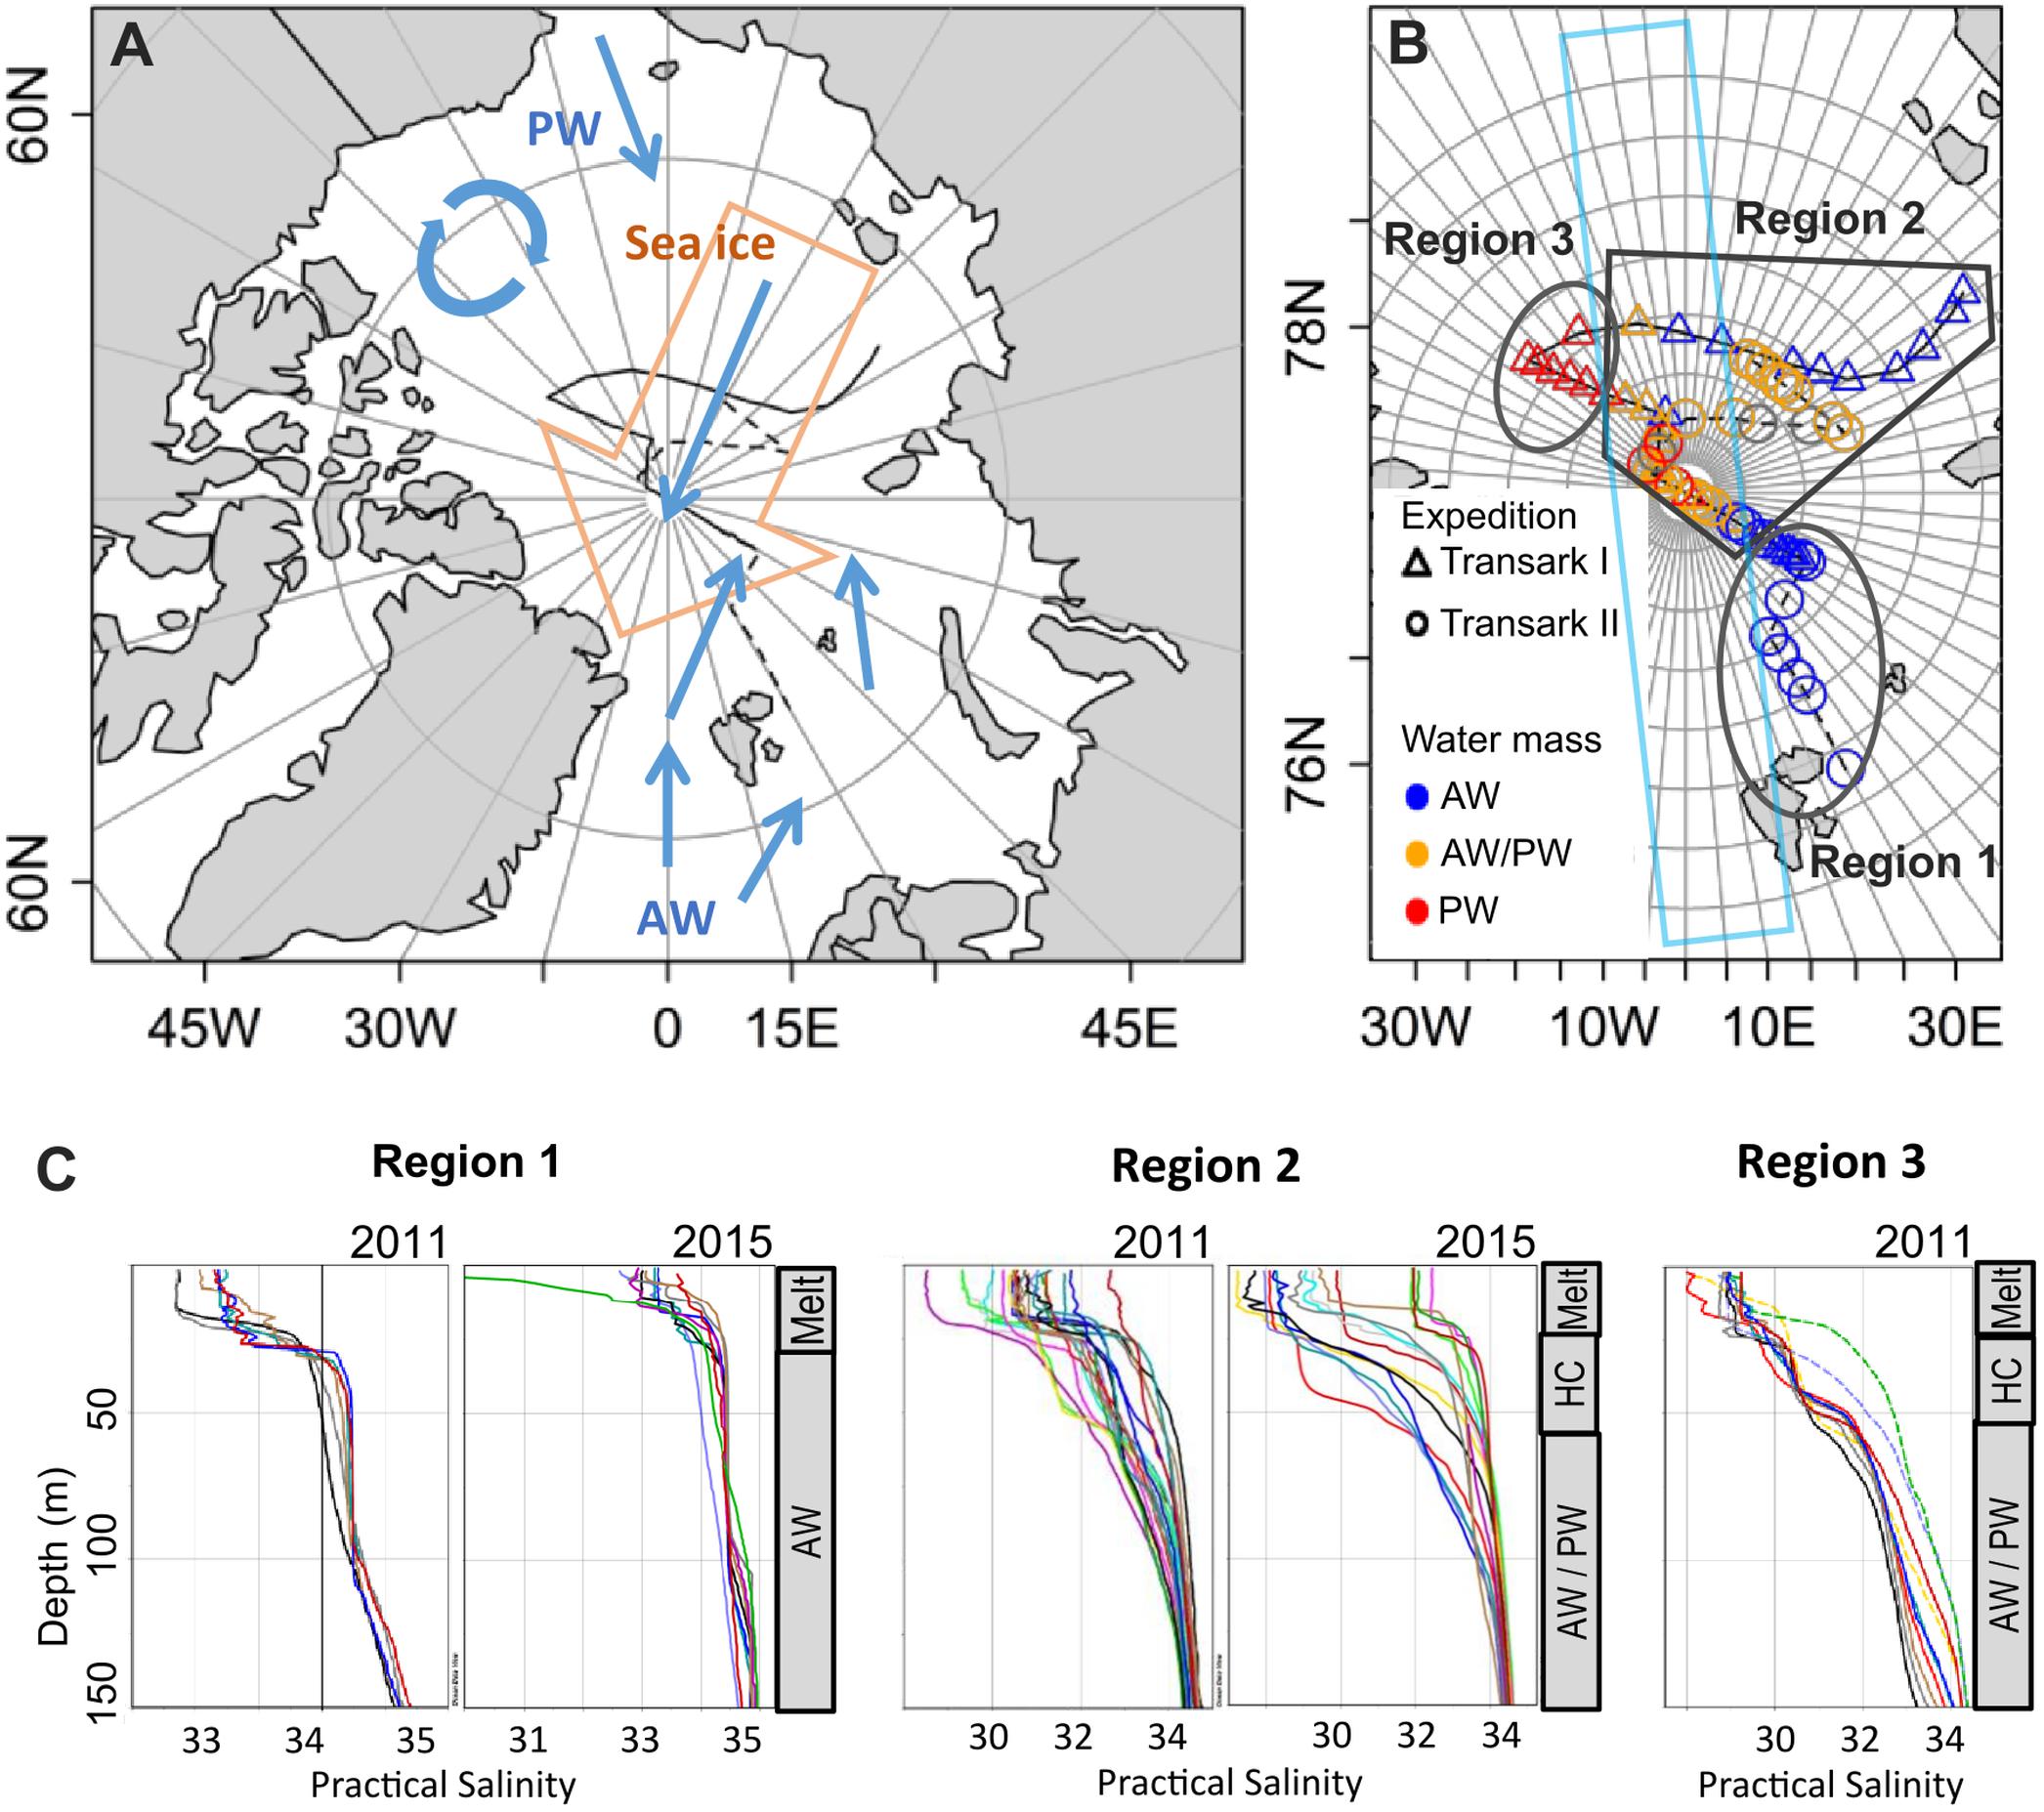
Figure 1. Study area (A), station map (B), and salinity profiles in the upper 150 m of the water column (C). (A) Schematic of general surface water (blue arrows) and sea ice (orange arrow) movement relevant for our study. Atlantic water (AW) enters the central Arctic via Fram Strait, Pacific water (PW) via the Bering Strait. The black lines indicate the cruise tracks Transark I 2011 (solid) and Transark II 2015 (dashed). Adapted from Ulfsbo et al. (2014) and Damm et al. (2018). (B) Stations during expeditions Transark I 2011 (triangles) and Transark II 2015 (circles), covered a broad area of the central Arctic Ocean spanning different water masses. Colors show the water mass dominating in the surface layer (<25 m). Region 1 is dominated by AW, Region 2 is characterized by a mix of nutrient signatures, while Region 3 is dominated by PW. The light blue box indicates the approximate coverage of previous studies in the central Arctic from Levasseur (2013). (C) Salinity profiles in the different regions for both years. Sea ice melt from the current season (Melt) causes the lower salinity in the upper 25 m. In Region 1, directly beneath is the AW. In Regions 2 and 3, the mixed AW/PW water is separated from the meltwater layer by a second halocline (HC). The gray bars on the right show the general structure of the water column. Note the different x-axis scales.
Most of the studies on DMS and DMSP in the Arctic have been performed in the Canadian Archipelago, coastal regions and some in Greenland and Barents Sea (see references in Levasseur, 2013). Only three studies (Gosselin et al., 1996; Leck and Persson, 1996; Matrai et al., 2008) were conducted in the central Arctic Ocean, covering a slim corridor along 0–10°E and continuing on 170°W (Figure 1B). Our study covers regions extending further eastward toward the Laptev Sea and toward the Beaufort Sea, which have not been investigated in previous studies. We hypothesize that DMSP and DMS concentrations differ by region, despite a full sea ice cover. We define three regions with influence of different sea ice – ocean interaction and water mass signatures. We analyzed DMS and DMSP concentrations with respect to chlorophyll a, as a marker for autotrophic biomass, as well as group-specific marker pigments, macronutrients and overlying sea-ice types. The objective of our study is to quantify DMS in the three regions and to explain how different DMSP and DMS production and consumption processes could lead to the observed findings.
Materials and Methods
Water Column Properties and Water Sampling
Samples were collected in the central Arctic Ocean during Transark I (13 August–22 September 2011) and Transark II (20 August–24 September 2015) cruises of RV Polarstern (Figure 1B and Supplementary Table 1; Schauer, 2012, 2016). The two cruises covered an area north of 79°N between 30° E and 130° W. Water column salinity and temperature were recorded with a conductivity-temperature-density (CTD) system (SBE911+, Sea-Bird Electronics Inc., Washington, DC, United States) mounted on a carousel water sampler/rosette (SBE32). Water samples from the upper 100 m of the water column were either collected with 12 L Niskin bottles mounted onto a rosette sampler during the up-cast or with 6.4 L Kemmerer bottles through a hole in the sea ice in several meters distance from the ship. Details on CTD measurement and Niskin water sampling procedures are described in Schauer (2012, 2016) and Damm et al. (2018).
At the time of observations in August/September, the depth of the Winter Mixed Layer (WML) can be identified as a temperature minimum below the much shallower summer mixed layer and the summer halocline (Rudels et al., 1996; Korhonen et al., 2013). This estimation is based on the assumption that the temperature minimum, often with temperature close to the freezing point temperature, is a remnant of the haline convection during previous winter. Since the summer warming and ice melting quickly establish strong density stratification near the surface, their effect is restricted to the shallow surface layer and the warming does not reach as deep as the winter convection.
Analysis of Inorganic Nutrients and Calculations of Pacific Water Fractions
In 2011, inorganic nutrients nitrate, phosphate and silicate were determined on an Evolution III Autoanalyzer (Alliance Instruments GmbH, Salzburg, Austria). Methods were modified after Grasshoff et al. (1998) and manufacturers instructions (Seal Analytical, https://seal-analytical.com, accessed June 27, 2019). In 2015, nutrients were analyzed colorimetrically as described in Van Ooijen et al. (2016). Data can be accessed at PANGEA (Kattner and Ludwichowski, 2014; Van Ooijen et al., 2016). Pacific water fractions (fPW) were calculated from nitrate and phosphate concentrations according to Jones et al. (2008), using endmember correlations of selected Atlantic water and Pacific water dominated stations from our study.
To express macronutrient limitations and deviations from the Redfield ratio the quasi-conservative tracer N* = (N − 16 × P + 2.9 μmol kg–1) × 0.87 was calculated according to Gruber and Sarmiento (1997). Values of 0 reflect that Redfield ratio is retained, while N* > 0 indicates a depletion of phosphate relative to nitrate (Atlantic influenced waters) and N* < 0 indicates a depletion of nitrate relative to phosphate (Pacific waters).
Quantification of DMS and DMSP
Dimethylsulfide was analyzed on a gas chromatograph (Varian 450C) which was coupled to a purge and trap system slightly modified from the method described in Kiene and Slezak (2006). Aliquots of 3 mL seawater were sampled directly into 5 mL glass vials, sealed with Teflon-coated rubber septa and crimp lids, and analyzed within 3 h after sampling. Samples were purged with helium for 10 min at a flow rate of 60 mL min–1 and dried while passing a NafionTM tube (Perma Pure LLC, NH, United States). DMS was cryo-trapped in teflon tubing immersed in liquid nitrogen, desorbed in a water bath heated to 70°C and transferred into the gas chromatograph equipped with a CP-Sil 5CB column (25 m, 0.32 mm, 0.25 μm) and a pulsed flame photometric detector (PFPD). Helium was used as carrier gas at a flow rate of 1.7 mL min–1, the oven temperature was 130°C isotherm and the detector was run at 200°C.
Since samples were not filtered prior to measurements, we cannot exclude that fragile phytoplankton cells like prymnesiophytes might have been disrupted during purging, releasing DMSP followed by conversion to DMS. As detailed in the Supplementary Material this might have led to a overestimation of DMS concentrations of up to 1.5 nM and an according underestimation of DMSP in samples with high haptophyte content (e.g., Station Transark II/54).
Total DMSP was analyzed as DMS after alkali cleavage (Dacey and Blough, 1987) with the same analytical procedure as described above. For DMSP analysis, approximately 30 mL seawater was sampled into 50 mL centrifuge tubes and stored refrigerated. Within 12 h the tubes were inverted several times to resuspend particles and 1–3 mL seawater were subsampled into 5 mL glass vials. To initiate alkali lysis of DMSP, 2 mL of 10 M NaOH were added, the vial sealed, and incubated at room temperature for 2 h. DMS and DMSP were analyzed from separate aliquots. Since DMS was not purged from the DMSP aliquot before alkali lysis, the measured DMSP concentration (DMSPgross) also contained DMS. DMSP data presented in this publication were corrected for DMS as follows: DMSP = DMSPgross – DMS.
The system was calibrated with DMS (>99%, Sigma-Aldrich) for concentrations from 0.8 to 763 pmol in 3 mL Milli-Q in 2011 (Transark I). In 2015 (Transark II) the calibration spanned 2.4–315 pmol in 3 mL Milli-Q. The limit of quantification (LOQ) was defined to the lowest calibration level. Considering the sample volume, this resulted in LOQ of 0.16 nM DMS and 0.27 nM DMSP in 2011 and 0.8 nM for DMS and DMSP in 2015. Samples below LOQ but >0 were normally distributed and treated as ½ of the LOQ for calculation of the mean and standard deviation. For further analysis (e.g., correlations, means) values <LOQ were omitted. Standard deviation on replicate standard measurements was 12% on average, while sample replicates had average standard deviations of 19% for DMS and 14% for DMSP.
Pigment Analysis
For pigment analyses, 1–2 L seawater samples were taken from Niskin bottles attached to the CTD rosette from 6 to 8 depths in the upper 100 m. During Transark I, occasionally only the upper 50 m were sampled. In addition, samples from a hand held Kemmerer bottle were taken through an ice hole. The seawater was immediately filtered on GF/F filters, frozen in liquid nitrogen, and stored at −80°C until further analyses by high performance liquid chromatography (HPLC) at the home laboratory. Pigment samples were measured with reverse-phase HPLC with a VARIAN Microsorb-MV3 C8 column (4.6 mm × 100 mm), using HPLC-grade solvents (Merck), a Waters 1525 binary pump equipped with an autosampler (OPTIMASTM ), a Waters 2996 PDA (photodiode array detector) and the EMPOWER software. For further details see Tran et al. (2013). The ratio of respective marker pigments to chlorophyll a was calculated to serve as indication of the dominant phytoplankton communities observed during this study.
Sea Ice Trajectories
To determine pathways, age and source area of sampled sea ice, a Lagrangian approach (ICETrack) was used that traces sea ice backward in time using a combination of satellite-derived low-resolution drift products. ICETrack has been used in a number of publications to examine sea ice sources, pathways, thickness changes and atmospheric processes acting on the ice cover (e.g., Krumpen et al., 2016, 2019; Damm et al., 2018; Peeken et al., 2018). The tracking approach works as follows: An ice parcel is tracked backward in time on a daily basis starting at Fram Strait. Tracking is stopped if (a) ice hits the coastline or fast ice edge, or (b) ice concentration at a specific location drops below 25% and we assume the ice to be formed.
Statistics
Data processing and analyses were performed with the software package R version 3.2.3 (R Core Team, 2015) in RStudio Version 1.0.163. Figures, except for Figures 1C, 3, were prepared with base and ggplot2 packages. Sample groups in Figures 2, 5, 6 were compared to each other applying Welch’s t-test (Welch, 1938; Andrade and Estévez-Pérez, 2014, Eqs. 5 and 5c). Boxplots in those figures show the median, the 25th and 75th percentiles, as well as 1.5 times the interquartile range as whiskers. Pearson correlation coefficients (Pearson, 1895; Hollander et al., 2015) in Figure 4 were calculated in R package Hmisc version 4.0-3. Figure 1C was created using Ocean Data View (Schlitzer, 2018). Figure 3 was created with Sigma plot 10 displaying the median, the 10th, 25th, 75th, and 90th percentiles as vertical boxes with error bars.
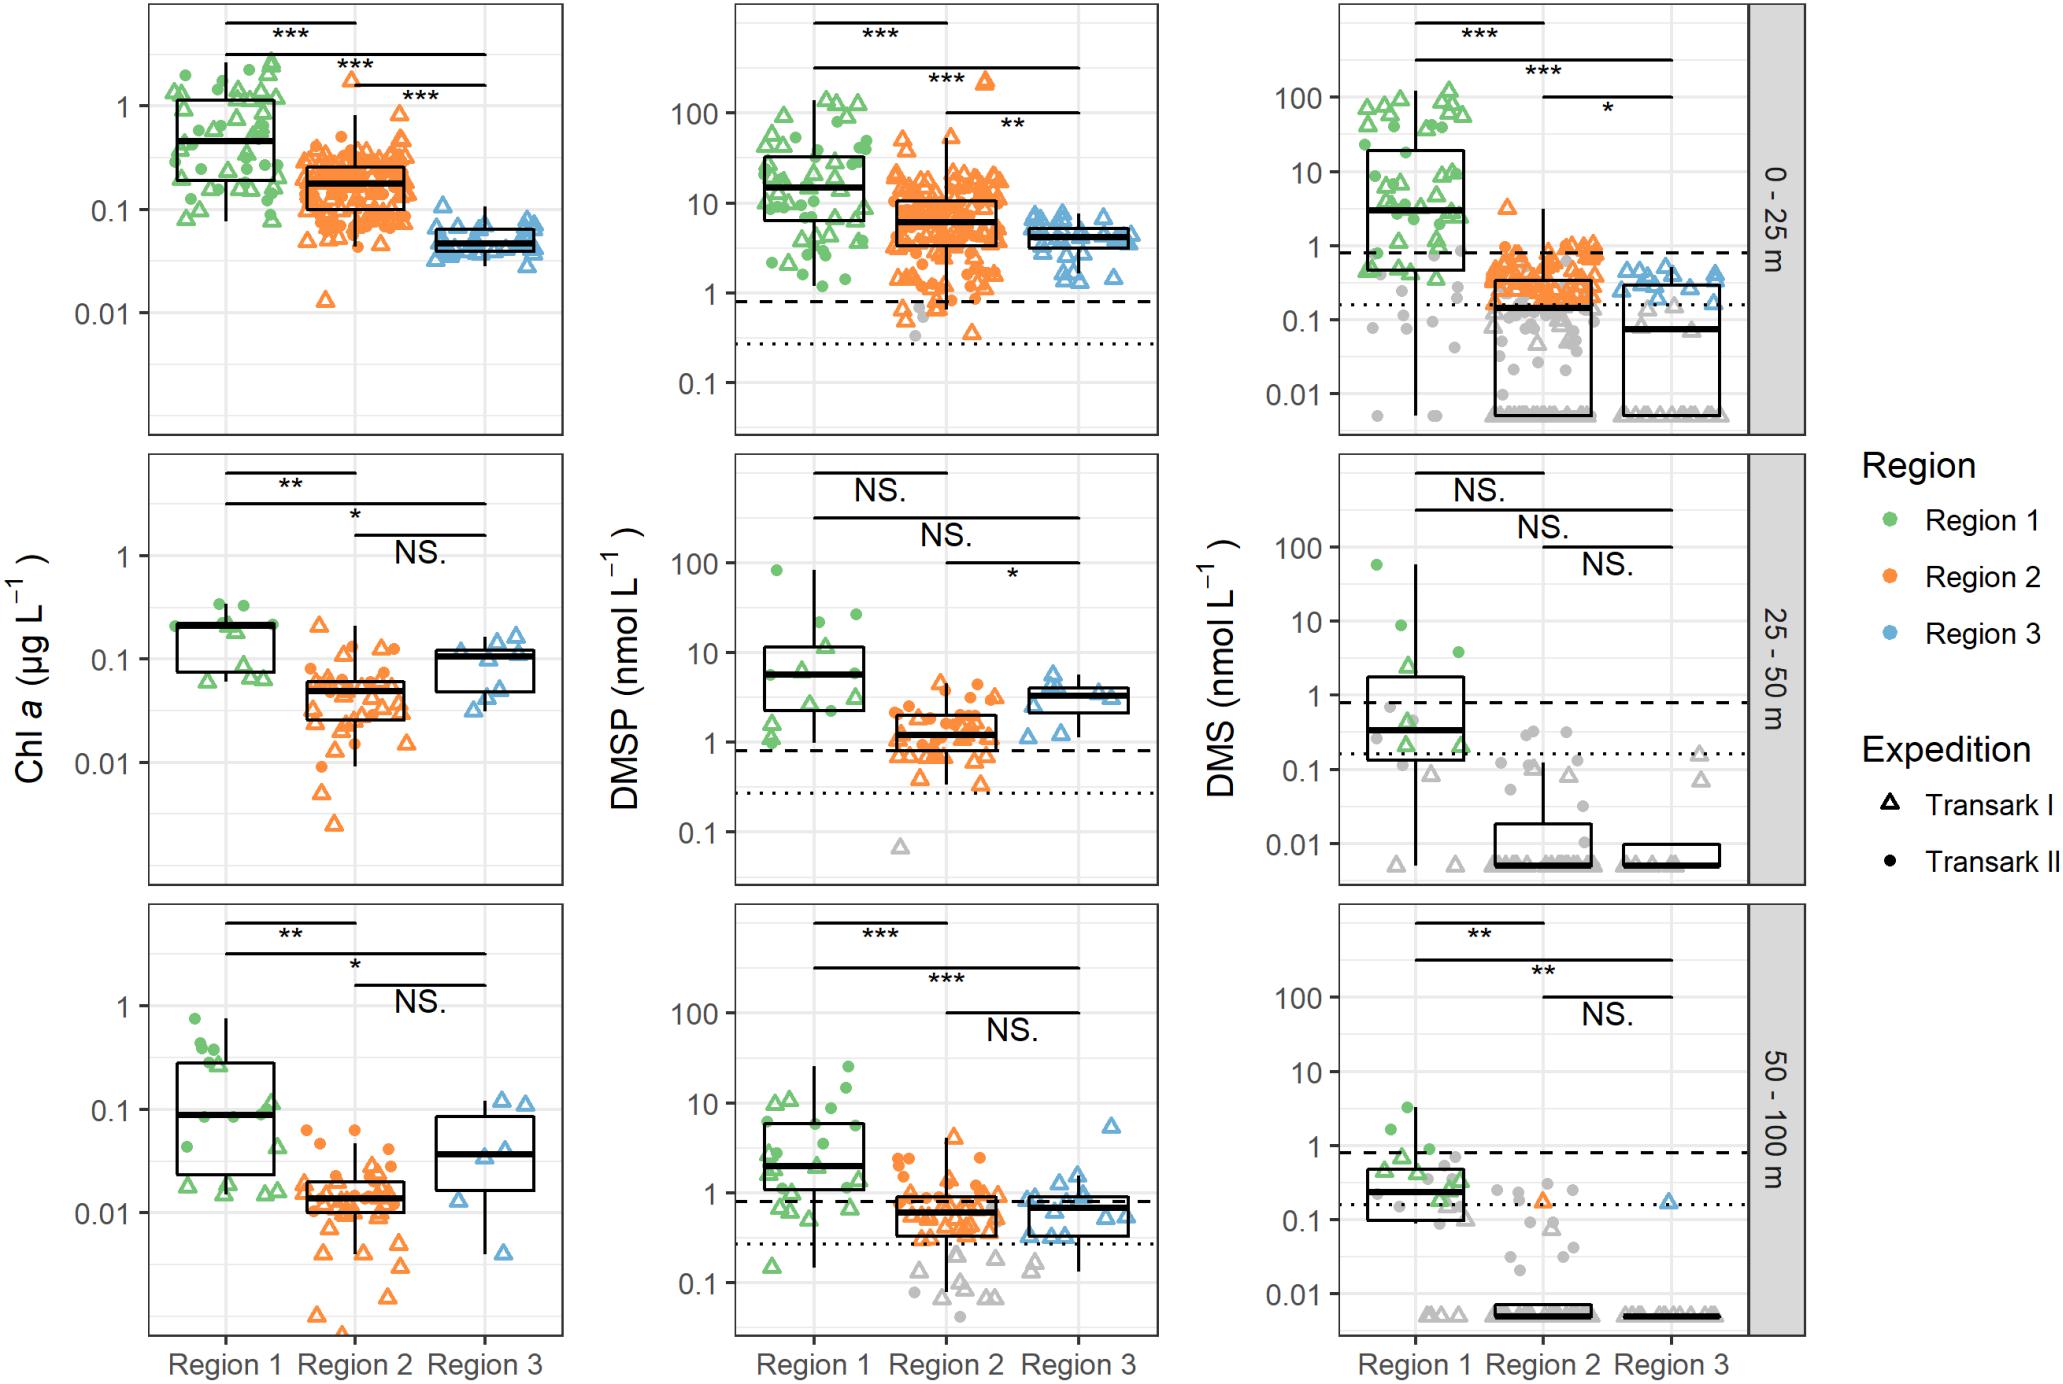
Figure 2. Chlorophyll a (Chl a), dimethylsulfoniopropionate (DMSP), and dimethylsulfide (DMS) concentrations in the upper 100 m water column during expeditions Transark I (triangles) and Transark II (circles) in the three regions. Data, of which the measured value was below the limit of quantification (LOQ), is shown in gray (Transark I: 0.16 nmol L–1 DMS and 0.27 nmol L–1 DMSP, dotted lines; Transark II: 0.8 nmol L–1 DMS and DMSP, dashed lines). In Region 1 depth 0–25 m, 25% of the DMS measurements were <LOQ, while for all other regions and depths ≥50% were <LOQ. This value was even higher with >93% for regions 2 and 3 for depths below 25 m. DMSP or DMS = 0 are shown as 0.005 due to logarithmic y-axis. Confidence levels of Welch’s t-test for significant differences between sample groups: 0.0001 ≤ ∗∗∗p < 0.001 ≤ ∗∗p < 0.01 ≤ *p ≤ 0.05 < NS. ≤ 1.
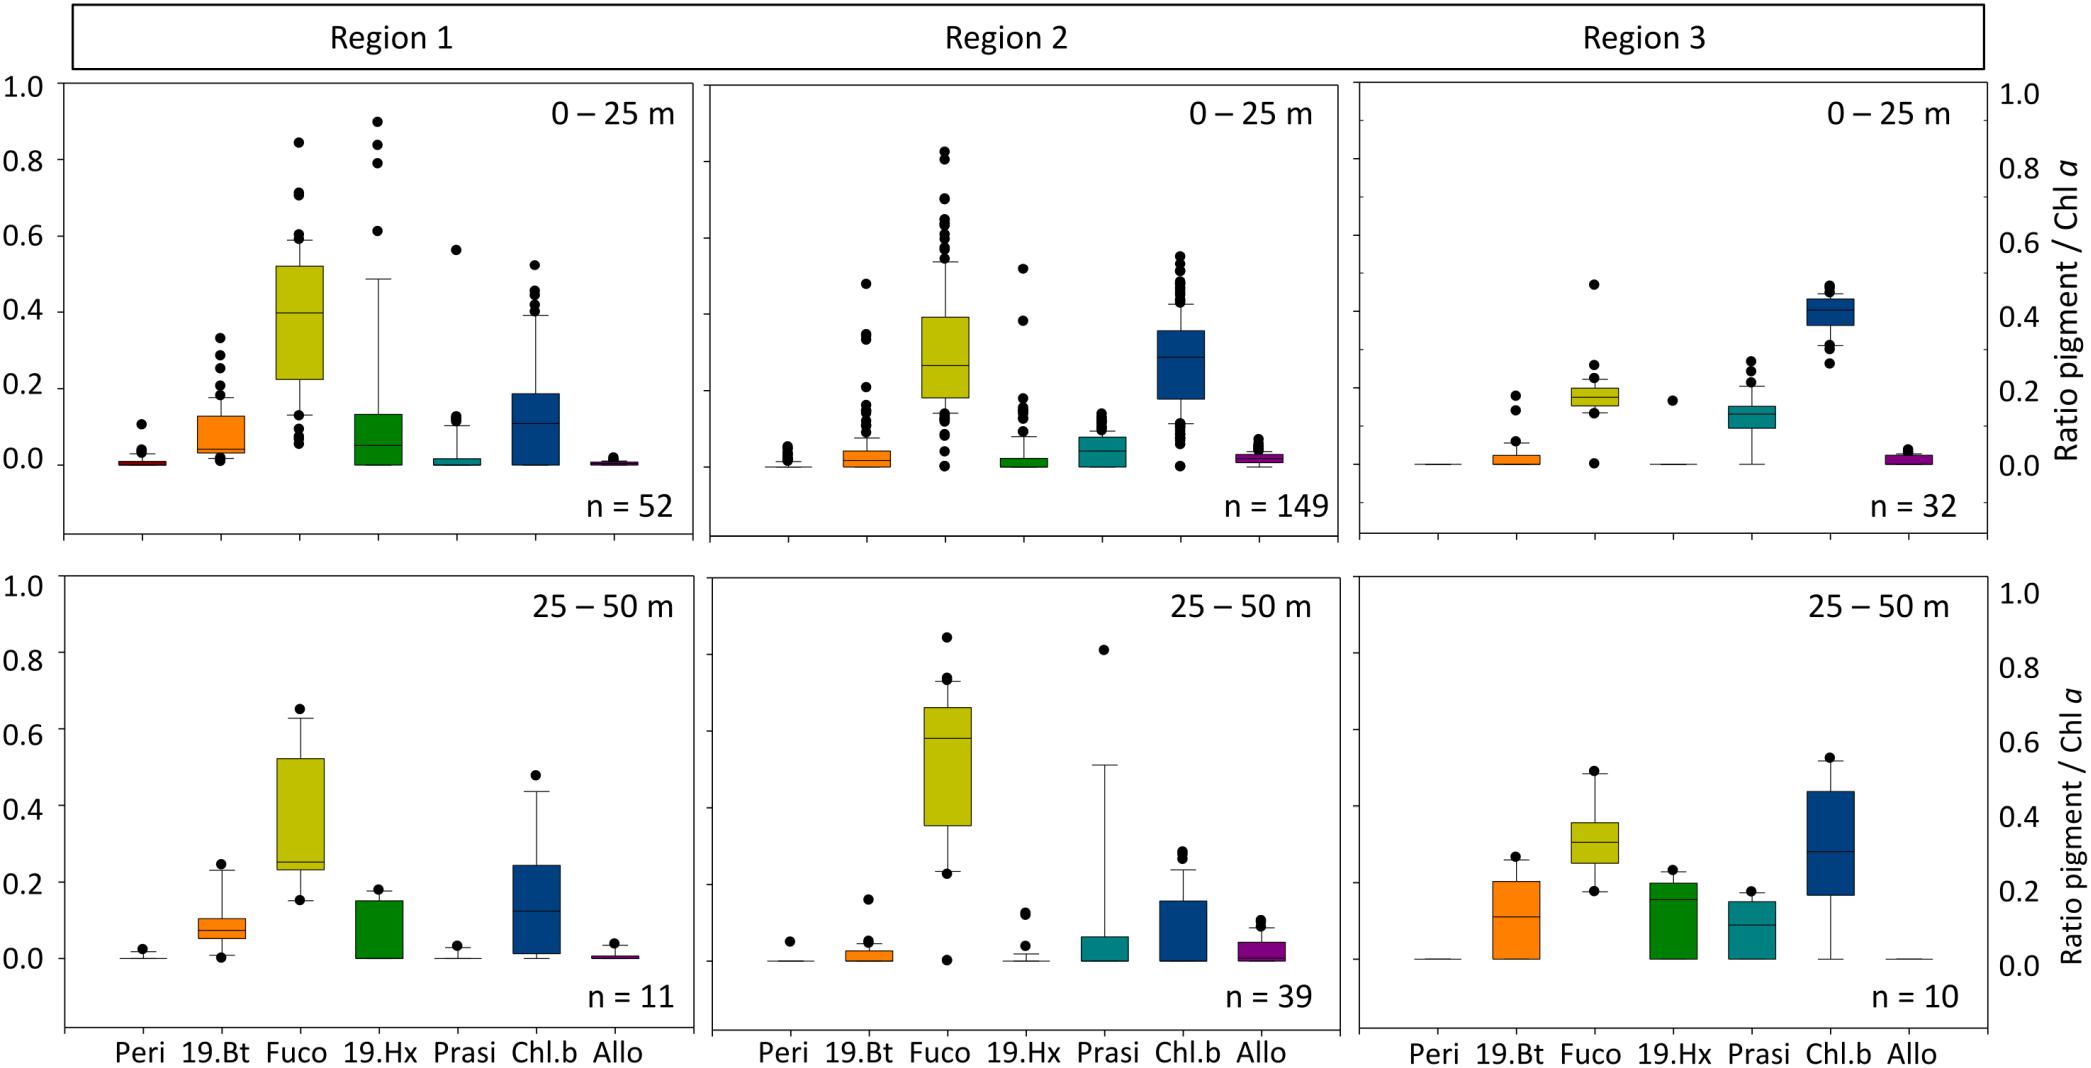
Figure 3. Marker pigment ratio to chlorophyll a for the various regions (upper panel 0–25 m; lower panel 25–50 m). Peri, Peridinin; 19.Bt, 19-butanoyloxyfucoxanthin; Fuco, fucoxanthin; 19.Hx, 19-Hexanoyloxyfucoxanthin; Prasi, Prasinoxanthin; Chl.b, Chlorophyll b; Allo, Alloxanthin indicative for Dinoflagellates, Crysophytes, Diatoms, Prymnesiophytes, Prasinophytes, Chlorophytes, and Cryptophytes, respectively.
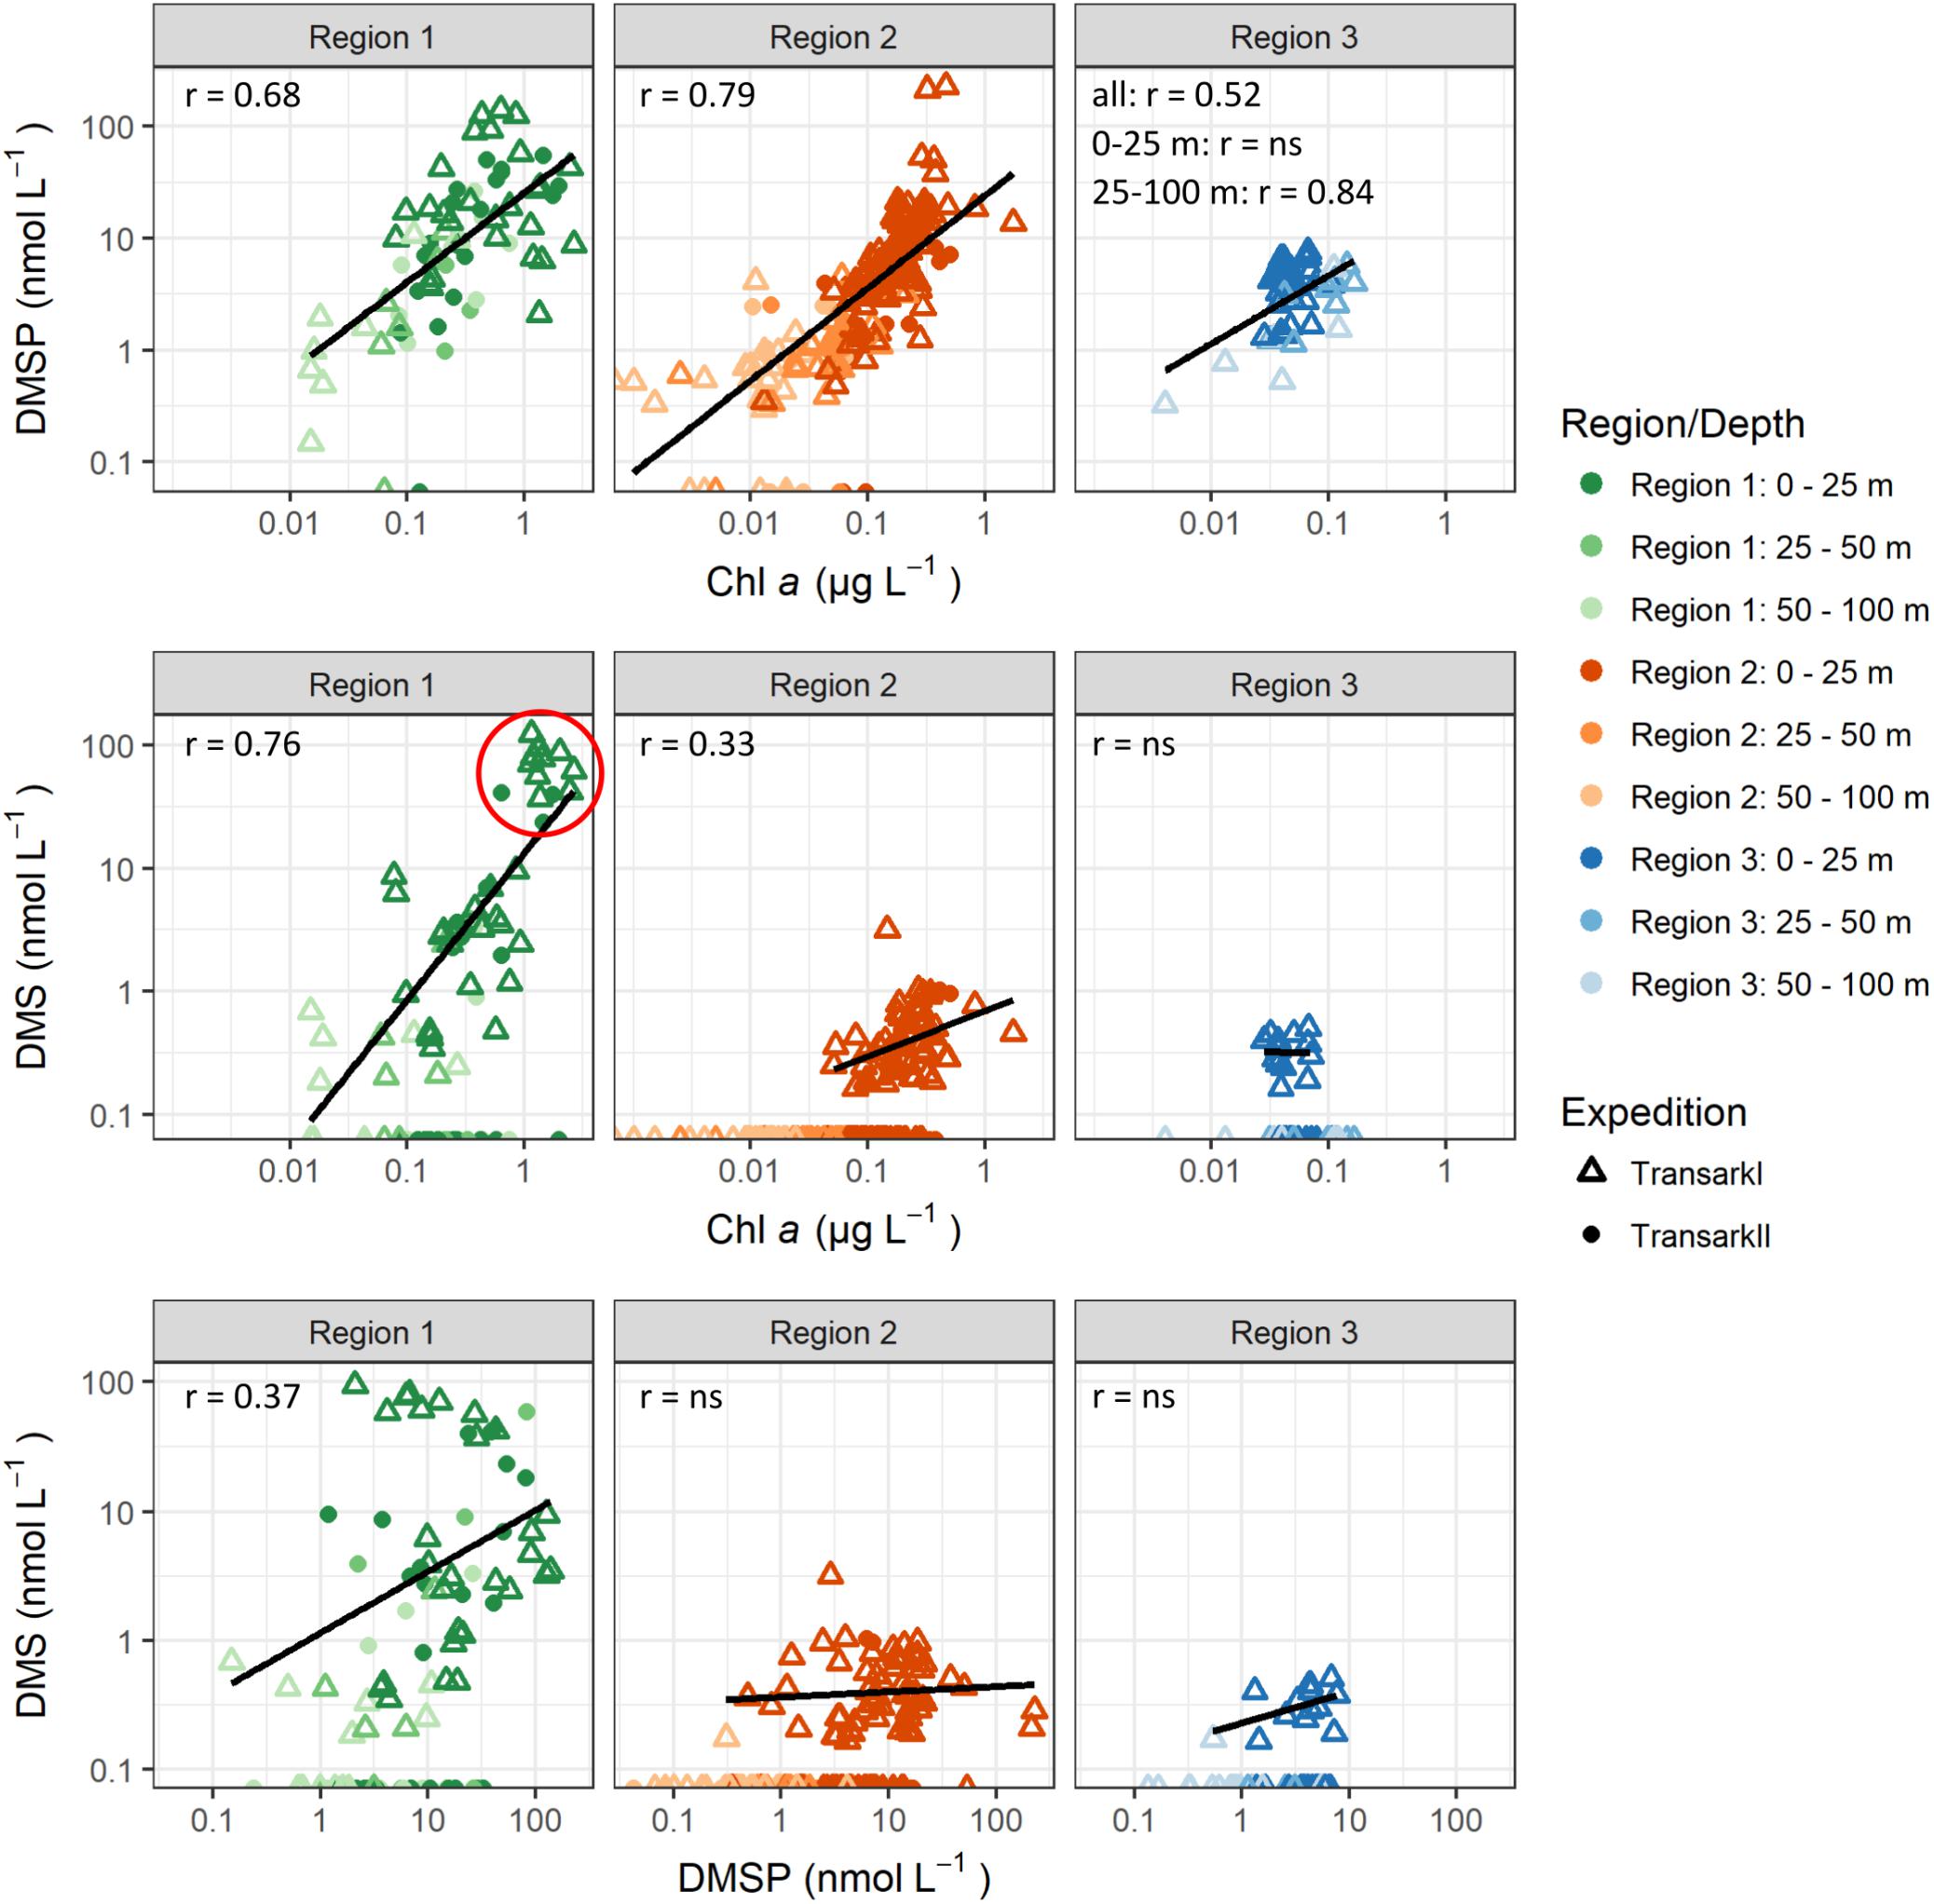
Figure 4. Correlations between DMSP and DMS to chlorophyll a and DMS to DMSP. DMS and DMSP values <LOQ are shown at the x-axis. Correlations were calculated with DMS and DMSP values >LOQ. Outliers were omitted for correlations: Region 2 DMSP >200 nmol L–1, DMS >2 nmol L–1. Pearson correlation coefficients (r) are shown for p-value <0.05. For p-value >0.05 “ns” indicates that those were not statistically significant. Stations with high DMS concentration in Region 1 (red circle) are PS78/203 (n = 10, depth <11 m), PS94/34 (n = 2, depth: 20 m, 28 m), and PS94/54 (n = 2, depth: 2 m, 10 m).
Results
We can distinguish three different regions (Figure 1), based on the dominating water masses at depths <25 m and the influence of sea ice processes on the upper water column. For each of the regions we describe the respective water mass, nutrients and ice conditions, followed by DMSP and DMS as well as the biomass and taxonomy of the phototrophic community.
Region 1
In 2011 all stations in Region 1 were sampled between 13 and 17 August, while in 2015 Region 1 was sampled between 20 August and 2 September. For both years Region 1 was characterized by northeastward directed inflow of Atlantic water from the Fram Strait with fractions of Pacific Water (fPW) smaller than 25% (Figure 1B). Salinity was high with 31.8–34.3 PSU in the upper 25 m and 34.1–34.8 PSU at 50–100 m depth (Figure 1C). The corresponding seawater densities of 1026.7 ± 0.4 kg m–3 in the upper 25 m and 1027.7 ± 0.1 kg m–3 at 50–100 m depth indicate weak stratification caused by meltwater in the upper 25 m. The Winter Mixed Layer, describing the depth of the haline convection during the previous winter, is 60–100 m deep in Region 1. Macronutrients nitrate, phosphate and silicate in Region 1 were lowest in the upper 25 m, increasing downward (Table 1). Nitrate was replete with 2.2 ± 1.6 (0–25 m) to 8.4 ± 2.4 μmol L–1 (50–100 m) compared to relatively low phosphate of 0.2 ± 0.1 to 0.6 ± 0.2 μmol L–1. The nitrate to phosphate ratio deviated slightly from the Redfield ratio toward phosphate limitation as indicated by N* of 1.3 ± 0.7 μmol kg–1. Silicate concentrations were the lowest of all three regions with values of 2.3 ± 0.9 μmol L–1.
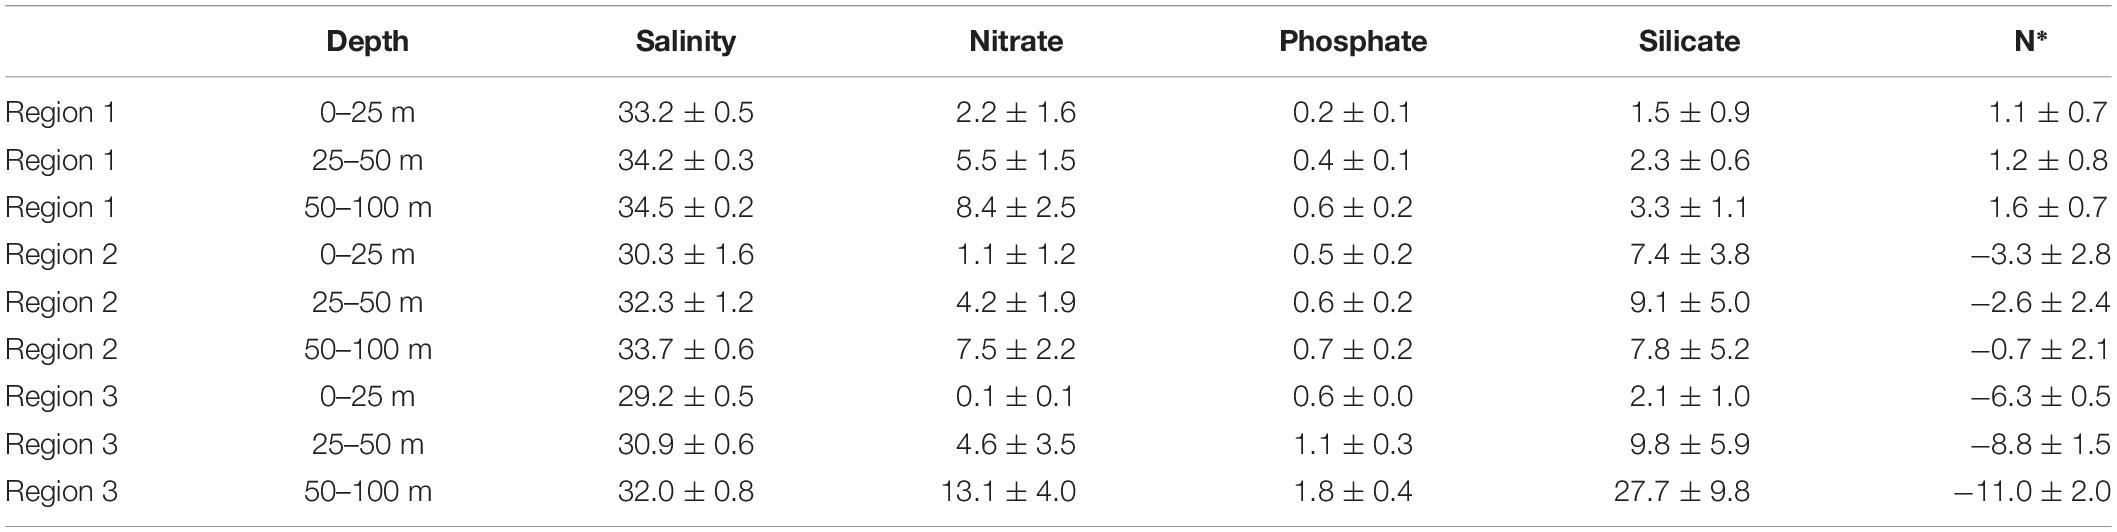
Table 1. Salinity, concentrations of macronutrients and N* (mean ± standard deviation).
A loose cover of melting summer sea ice characterized Region 1 except for one station at the ice edge in 2011 and one in open water toward Fram Strait in 2015. In both years, most of the sea ice (87%) had drifted to Region 1 from the Laptev Sea area. In 2011 all stations were covered by 2 year ice, which had formed in polynyas close to the coast. In 2015, on the other hand, most of the ice was 1-year-old and had formed during sea ice freeze-up in deeper waters.
Chlorophyll a concentration, describing total autotrophic biomass, was highest in the upper 25 m of the water column throughout all regions, with concentrations between 0.077 and 2.65 μg L–1 (0.72 ± 0.67 μg L–1, Figure 2). Below 25 m chlorophyll a concentrations were homogeneous with means of 0.18 ± 0.10 μg L–1 at 25–50 m, and 0.18 ± 0.20 μg L–1 at 50–100 m depth. Corresponding to chlorophyll a, DMSP was also high in the upper 100 m of the water column in Region 1, with concentrations of up to 139.4 nM. However, concentrations decreased from the surface layer to 100 m with mean values of 38.6 ± 37.2 nM (0–25 m), over 21.3 ± 39.3 nM (25–50 m) to 4.7 ± 5.7 nM (50–100 m). We observed maximal DMS concentrations of 122 nM in the surface layer, with a mean of 17.6 nM (±29.1 nM), while at 25–50 m DMS was only 5.4 ± 15.5 nM, with 42.8% of the samples below the LOQ (Supplementary Table 2). At 50–100 m concentrations were even lower with a maximum of 3.3 nM, and 54% of the samples below the LOQ.
In the high biomass region 1 the phytoplankton community (0–50 m) was dominated by diatoms as indicated by the high ratio of fucoxanthin to chlorophyll a. Other important groups were prymnesiophytes (19-hexanoyloxyfucoxanthin) and chlorophytes (chlorophyll b) (Figure 3). Overall, the communities in the surface <25 m and the 25–50 m range were similar except for sporadic high contributions of prymnesiophytes in the surface layer.
Region 2
Region 2 was sampled from 19 to 30 August and 6 to 22 September in 2011. In 2015, sampling in this region was performed from 4 to 24 September. Generally, Region 2 is characterized by the Transpolar Drift transporting Polar surface water from the Siberian shelf toward Fram Strait. Pacific water (fPW) fractions were largely between 25 and 60%, although some reached values outside that range (Figure 1B). Salinity spread from 27.2 to 34.5 PSU in the upper 25 m, and had a narrower range of 32.0 to 34.7 PSU at 50–100 m depth (Figure 1C). Corresponding seawater densities of 1024.3 ± 1.3 kg m–3 near the surface and 1027.1 ± 0.5 kg m–3 at depth show a moderate to strong influence of sea ice melt in the upper 25 m of the water column. The WML in Region 2 is approximately 50 m deep (Korhonen et al., 2013). Nitrate was particularly depleted near the surface, with 1.1 ± 1.2 μmol L–1 (0–25 m), increasing to 7.5 ± 2.2 μmol L–1 (50–100 m). This compares to homogeneous phosphate concentrations of 0.6 ± 0.09 μmol L–1 (Table 1). Deviation from the Redfield ratio toward nitrate limitation was strongest near the surface with N* of −3.3 ± 2.8 μmol kg–1 (0–25 m) but lower in the deeper water layers −0.7 ± 2.1 μmol kg–1 (50–100 m). Silicate concentrations were homogeneous at 8.1 ± 4.7 μmol L–1.
A loose cover of melting summer sea ice characterized Region 2 except for three ice-free stations in the Laptev Sea in 2011 (14%). Source regions and types of the ice were diverse in both years, but dominated by ice from the Laptev Sea region. Whereas 57 and 52% was freeze-up sea ice from the interior Laptev Sea, sea ice originated in the shallow Siberian polynya region made up 24 and 14% in 2011 and 2015, respectively. In 2015, 33% of the ice had formed in the Pacific Arctic during freeze-up or in shallow polynya regions close to coast in the Beaufort Sea. In 2011, the age of ice was mixed with 24% one-year, 43% two-year, and 14% multi-year ice. In 2015, one-year ice dominated with 86%, over two and multi-year ice.
Chlorophyll a concentrations were 0.20 ± 0.17 μg L–1 in the upper 25 m decreasing to 0.16 ± 0.14 μg L–1 in the deeper layers (Figure 2). In the upper 25 m DMSP had a wide spread of concentrations with the highest observed value in this study being 227.8 nM, but averaged lower than Region 1 to 11.0 ± 26.1 nM. Deeper in the water column, DMSP concentrations were small with 1.4 ± 1.0 nM in 25–50 m and 0.8 ± 0.8 nM in 50–100 m depth. DMS concentration in the upper 25 m ranged up to 3.1 nM, but averaged below the LOQ. In the upper 25 m 58% of the samples were below the LOQ, while in the deeper water layers (50–100 m) over 96% were not quantifiable in Region 2.
In the upper 50 m water column in Region 2, diatoms (marker pigment fucoxanthin) dominated the phytoplankton community (Figure 3). Chlorophytes (marker pigment chlorophyll b) were the second most abundant group. Compared to Region 1, a slightly higher contribution of prasinophytes and cryptophytes was indicated by the marker pigments prasinoxanthin and alloxanthin, while the prymnesiophyte signal 19-hexanoyloxyfucoxanthin was lower than in Region 1.
Region 3
Region 3 was sampled from 31 August to 4 September in 2011. Region 3 was characterized by Pacific water (fPW) fractions >60% (Figure 1B). Salinity was 29.2 ± 0.5 PSU in the upper 25 m, and had a narrower range of 32.0 ± 0.8 PSU at 50–100 m depth (Figure 1C). Corresponding seawater densities showed a strong stratification and decrease gradually from 1023.4 ± 0.4 kg m–3 in the surface layer to 1025.7 ± 0.6 kg m–3 at depth. The Winter Mixed Layer was relatively shallow at approximately 40 m in Region 3. The range of macronutrient concentrations was largest in Region 3 increasing from surface to deeper waters. Nitrate was fully depleted (0.09 ± 0.1 μmol L–1) in the upper 25 m of the water column, increasing toward 13.1 ± 4.0 μmol L–1 at 50–100 m depth (Table 1). Phosphate increased from 0.6 ± 0.03 μmol L–1 to 1.8 ± 0.4 μmol L–1. The strong deviation from the Redfield ratio with N* of −6.3 ± 0.5 μmol kg–1 increased with depth to −11.0 ± 2.0 μmol kg–1. Silicate ranged between 2.2 ± 1.0 and 27.66 ± 9.8 μmol L–1 from surface to deeper waters, respectively.
Sea-ice cover was 90% for Region 3, which was only sampled in 2011. The ice consisted to 86% of 2-year freeze-up ice from the Canadian Arctic. Only the northernmost station of this region was covered by multi-year sea ice that had formed during freeze-up in the East Siberian Sea.
Chlorophyll a was generally low in Region 3 but in contrast to the other two regions, there was no downward gradient (Figure 2). Highest concentrations were observed at 25–50 m water depth with 0.09 ± 0.05 μg L–1, while the above and below concentrations were 0.05 μg L–1. DMSP was 4.2 ± 1.8 nM at 0–25 m, 3.0 ± 1.5 nM at 25–50 m and 0.9 ± 1.2 nM at 50–100 m. In the surface layer DMS was present at concentration of 0.2 ± 0.2 nM, while in the underlying water 93% of the DMS samples were below LOQ.
In the upper 50 m water column, the marker pigments in Region 3 represented a community dominated by chlorophytes and prasinophytes (chlorophyll b and prasionoxanthin, Figure 3). Within the deep chlorophyll maximum, also chrysophytes (19-butanoyloxyfucoxanthin) and prymnesiophytes were present, indicating an overall flagellate dominated community. Dinoflagellates (peridinin) were almost absent, as in all other regions.
Discussion
Overall, seawater DMS and DMSP concentrations in our study (Figure 2) are similar to concentrations reported in the few previous studies north of 79°N (<10 nM DMS, <40 nM DMSP) (Gosselin et al., 1996; Leck and Persson, 1996; Matrai et al., 2008; Levasseur, 2013). However, we observe pronounced regional differences in DMS and DMSP concentrations, which match differences in water masses, the intensity of sea ice – ocean interaction, as well as differences in the phototrophic biomass. This complexity might point to different mechanisms for DMSP and DMS production and degradation processes in the regions, which eventually control the overall budget of DMSP and DMS in the central Arctic. In the following we discuss in detail the physical as well as biological drivers on the patterns of DMSP and DMS distribution.
Region 1
Influence by Inflowing AW and Short Time Sea Ice – Ocean Contact
The upper 100 m water column in Region 1 is characterized by a high fraction of Atlantic water (Figure 1A) due to the AW inflow into the Eurasian Basin via Fram Strait. While the AW circulates northeastward toward the Laptev Sea (Jones et al., 1998), wind drives sea ice drift in the opposite direction from the Siberian shelf toward Fram Strait (Kwok et al., 2013). Because of the opposite movements of water and ice (Figure 1A), the seawater in Region 1 has been in contact with sea ice for a relatively short time only. Thus, the influence of sea ice is low (Damm et al., 2018) and ice melt forms a slightly less saline, shallow (approximately 25 m) meltwater layer on top of the AW body. The presence of nitrate and phosphate (0–50 m) shows that winter mixing reaches deep enough (approximately 75 m; Supplementary Figure 1A) to resupply the surface layers with fresh nutrients before the next growth season.
The drawdown of nutrients, however, observed in mid to late August in the meltwater layer (0–25 m) compared to the deeper water, as well as high chlorophyll a concentrations (Figure 2 and Table 1), point to recent or ongoing phytoplankton growth. Due to reduced mixing between the lower saline meltwater and the underlying higher saline AW, the majority of the phytoplankton was found in the meltwater lens directly under the ice, where it receives the highest incoming radiation to support primary production (Laney et al., 2017). About 75% of the chlorophyll a signal was found in the upper 25 m of the water column.
That phytoplankton was actively growing in Region 1 during our study is corroborated by net community production rates (approximately 1 mol C m–2) derived from carbon dioxide partial pressure (pCO2) for the same region in 2011 (Ulfsbo et al., 2014). Generally, during late summer, these latitudes of the Eurasian Arctic (82–87°N) – ice covered, yet in proximity to the ice edge – show higher integrated net primary production estimates (20–30 mg C m–2 d–1) compared to higher latitudes (Fernández-Méndez et al., 2015).
DMS Production Controlled by Phytoplankton Abundance
Concurrent with the highest concentrations of chlorophyll a, we observed the highest concentration of DMSP and DMS in Region 1 (Figure 2). The strong positive correlation of DMSP to chlorophyll a (r = 0.68, Figure 4) shows, that the DMSP in this region is largely controlled by the biomass of photosynthetic microalgae in the water column. The tight correlation is striking considering the spread in species composition within Region 1 (Figure 3). The influence of species composition was identified as one of the reasons for a missing global correlation between DMSP and chlorophyll a (Stefels et al., 2007).
Beside the production of DMSP through phytoplankton, sea ice melt might release ice algal-sourced DMSP into the under ice water. Galindo et al. (2014) report maximum concentrations of 20 nM ice-sourced DMSP in the under ice water in the Canadian Archipelago. Due to the lower DMSP stocks in sea ice of the central Arctic (Levasseur, 2013 and unpublished own data) and the short time of sea ice – ocean contact, we assume that in Region 1 the effect of DMSP release from sea ice is negligible compared to the production by phytoplankton.
However, considering the sea ice-influence it is worth having a closer look on the different ice types influencing the water column. Damm et al. (2018) found that sea ice formed in the shallow shelf region transports methane from the shelf which is released to the underlying water column during the common drift into the central Arctic. Indeed, the source region of sea ice seems also be applicable to other dissolved compounds or particles. In the sea ice-influenced upper 25 m water column DMSP concentrations were significantly higher in 2011 beneath 2-year sea-ice, which had formed in polynyas close to the Siberian coast, than in 2015 beneath 1-year sea-ice, which had formed offshore in the Laptev Sea (Figure 5). In addition, nitrate and phosphate concentration were lower in 2011 below second year ice compared to 2015 below first year ice. This circumstance might also refer to the effect of different sea ice types to the sea ice influenced water underneath (Supplementary Figure 2).
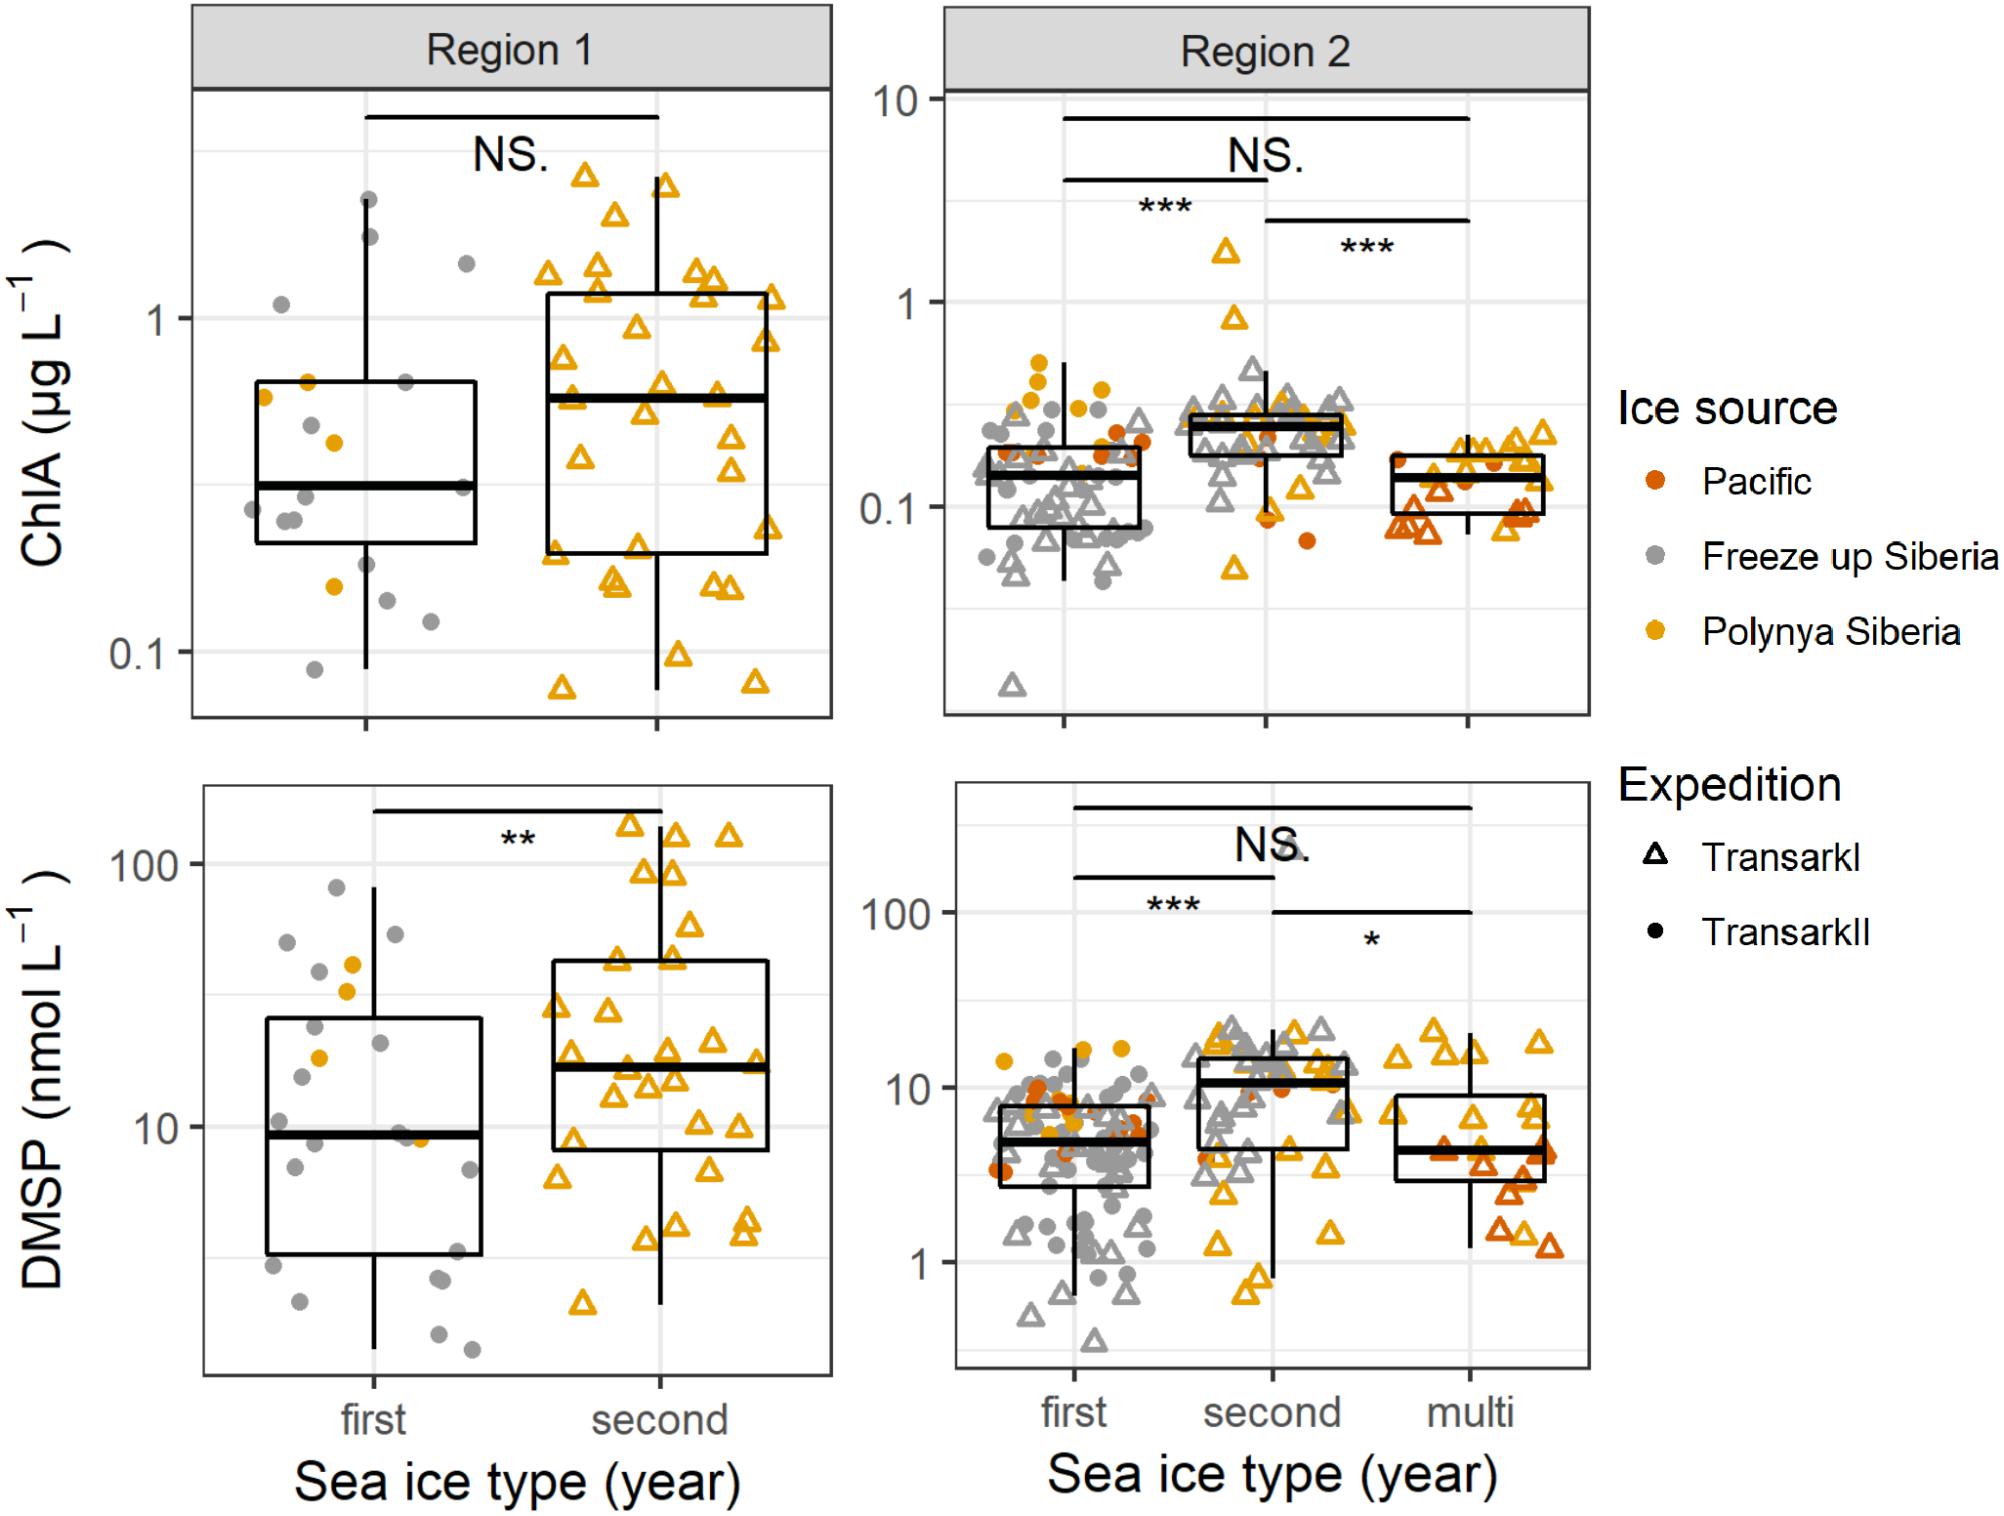
Figure 5. Chlorophyll a and DMSP concentrations in the upper 25 m water column in Regions 1 and 2. The x-axis shows different age of sea ice, color indicates the source region and symbols the two different expeditions/years. Note the different y-axis scales. Confidence levels of Welch’s t-test for significant differences between sample groups: 0.0001 ≤ ∗∗∗p < 0.001 ≤ ∗∗p < 0.01 ≤ *p ≤ 0.05 < NS. ≤ 1.
Further, we also find DMS strongly correlated with chlorophyll a and DMSP (Figure 4) in Region 1. This is typical for ice edge blooms and ice-free regions in the Arctic (Galí and Simó, 2010; Levasseur, 2013; Park et al., 2013). DMS is produced by enzymatic cleavage of DMSP by phytoplankton as well as bacteria. The latter can also take up DMSP or degrade it via demethylation/demethiolation, which does not result in the production of DMS, and is usually the dominant pathway for bacterial DMSP assimilation (Kiene et al., 2000). Although unfortunately no microbiological data is available for this study, previous studies support that also in Arctic waters bacterial conversion processes of both sulfur compounds are likely to be an important factor for the final DMS and DMSP concentrations. For example, alpha-proteobacteria been reported from Arctic surface water (Motard-Côté et al., 2012; Rapp et al., 2018). The alpha-proteobacteria include the typical DMSP degrading groups SAR11 and Roseobacter (Kiene et al., 2000; Reisch et al., 2008). In addition, alpha- and gamma-proteobacteria have been shown to incorporate DMSP-sulfur in Arctic waters (Motard-Côté et al., 2012). The balance between the DMSP lysis and demethylation pathways is controlled by the sulfur demand of the bacterial community. Once the sulfur demand is saturated, lysis of DMSP becomes dominant (Kiene et al., 2000). Based on the findings by Kiene et al. (2000) we hypothesize that the high DMSP availability in Region 1 leads to a dominance of the lysis pathway over the demethylation pathway resulting in high DMS concentrations.
Since sea-air exchange of gasses as well as incoming radiation is reduced by the sea ice cover (Loose et al., 2011; Nicolaus et al., 2012), we assume that sea-air efflux as well as photo-oxidation of DMS were low and bacterial consumption of DMS was the most important sink for dissolved DMS in the under ice water in our study. An equilibrium between microbial DMS production and consumption rates has been suggested to keep the dissolved DMS pool steady at relatively low concentrations (Wolfe et al., 1999; Galí and Simó, 2010). However, the high concentrations of DMS or DMSP found in Region 1 might overwhelm DMS consumption and allow for accumulation of high amounts of dissolved DMS. Concentrations in the range of 11–32 nM DMS or dissolved DMSP were found to saturate DMS consumption (Kiene, 1992; Wolfe et al., 1999). In the Labrador Sea, a particularly low DMS consumption rate was found at the coldest temperature of −0.1°C (Wolfe et al., 1999). Considering that the temperatures in our study are between −1.2° and −1.8°C, saturation as well as low consumption rates might cause the observed high DMS concentrations.
Under-Ice Biomass Peaks as Hotspots for DMS Production
The particularly high DMS concentrations of up to 122 nM in surface water of Region 1 (Figure 4, red circle and Supplementary Figure 3) are the highest observed in latitudes above 79°N (Gosselin et al., 1996; Leck and Persson, 1996; Matrai et al., 2008; Galí and Simó, 2010). For the ice-edge station Transark II/34 the depth of the DMS- and DMSP-peak at 28 m resembles the depth of biomass peaks previously observed in open water in vicinity to the ice edge (Arrigo et al., 2012). Chlorophyll a and other pigment data is not available for this station. At the other two stations (Transark II/54, Transark I/203) maximal DMS and DMSP values were located at a depth ≤10 m in the meltwater layer, concurrent with high phytoplankton biomass (chlorophyll a 0.6–2.6 μg/L) and a drawdown of nitrate, phosphate and silicate. These characteristics are typical for under-ice blooms that can develop, if structures like melt ponds or leads in the sea ice allow for increased incoming radiation to the underlying water column compared to an uninterrupted ice cover without ponds (Arrigo et al., 2012; Assmy et al., 2017).
In 2011, the under-ice-biomass peak was located at 86°N (station Transark I/203), 353 km from the ice edge (83°N, 14.8.2011) in an area with 92% ice cover (50 km average) and a high melt pond fraction of 25–50%. Both, the broken ice cover and melt ponds, likely allowing for light transmission to the under ice water (Nicolaus et al., 2012). The mixed community was dominated by diatoms (41 ± 3%), but also contained considerable fractions of prymnesiophytes (13 ± 2%) and chlorophytes (14 ± 2%). This resembles the average species composition in Region 1 (Figure 3 and Supplementary Figure 3). We thus conclude that the high DMS signal at station 203 in 2011 is driven by the high biomass (Chlorophyll a: 1.1–2.6 μg/L).
In 2015, the under-ice biomass peak was located at 85°N (Transark II/54), 260 km from the ice edge (83°N, 28.8.2015) in an area with 100% ice cover (50 km average). The fractions of prymnesiophytes (90 ± 14%) and crysophyte (23 ± 10%) specific pigments were distinctly higher, and the fraction of diatoms lower (13 ± 5%), compared to other stations in Region 1 (Figure 3 and Supplementary Figure 3). In the same year in May, the prymnesiophyte Phaeocystis pouchettii was reported form under-ice blooms north of Svalbard at 81°N (Assmy et al., 2017; Wollenburg et al., 2018). Prymnesiophytes and crysophytes are known to be strong DMSP producers (Keller et al., 1989; Stefels et al., 2007). However, the fraction of prymnesiophytes was neither correlated to DMSP nor DMS, while the fraction of crysophytes showed a weak negative correlation to DMSP and no correlation to DMS (Supplementary Table 3).
We conclude that in Region 1 the concentration of DMS is primarily controlled by phytoplankton biomass which controls DMSP concentration (Wolfe and Kiene, 1993; Wolfe et al., 1999; Galí and Simó, 2010), while the species composition has a minor influence on DMS concentrations. Overall, DMSP as precursor for the climate cooling gas DMS seems to be high in this Atlantic water-influenced region of the central Arctic.
Region 2
Influence by Recurrent AW/PW Mixed Water and Long-Time Sea Ice – Ocean Contact
In Region 2, Atlantic dominated waters mix with Pacific waters. While AW completes its anti-clockwise circulation in the southern Eurasian Basin, PW enters the Arctic Basin through Bering Strait (Jones et al., 1998). Surface waters as well as sea ice thus move from the Siberian shelf toward Fram Strait in a southwestward direction (Figure 1A). Because of this common drift direction, the sea water in Region 2 is strongly influenced by sea ice melt and freezing processes over one or more seasons (Damm et al., 2018). During freezing events in winter, brine release leads to haline convection in the upper water column (Rudels et al., 1996; Kikuchi, 2004). Despite the brine rejection, the resulting WML has a lower salinity than the underlying Atlantic water (Figure 1C and Table 1) and seasonal sea ice melt forms an even less saline meltwater layer in the upper 25 m of the water column. The meltwater halocline reduces downward mixing, retaining most of the phytoplankton in the meltwater layer.
Comparable to Region 1, the highest chlorophyll a signal was found at depths <25 m, below 25 m less than 25% of the surface layer chlorophyll a signal was found, and only 8% of the surface layer signal below 50 m. A similar distribution with decreasing concentrations toward depth was observed for DMSP and DMS. At depths >25 m DMS was either too low to be quantified or absent. In the AW/PW mixed water nitrate was close to depletion, while phosphate was still available, causing a deviation from the Redfield ratio toward nitrate limitation. When nitrate is depleted in late summer, primary production in the central Arctic has been found to be predominantly supported by a regenerated system based on ammonium as nitrogen source (Martin et al., 2012). Supporting this, Ulfsbo et al. (2014) found low net community production (approximately 0.25 mol C m–2) in highly ice covered areas in 2011. As a result, chlorophyll a and DMSP concentrations are lower in Region 2 compared to Region 1 (Figure 2).
As laid out for Region 1, sea ice melt might also be a source of DMSP to the water column. Since the amount of DMSP produced by phytoplankton is presumably lower in Region 2 due to the lower biomass, the relative influence of sea ice sourced DMSP might be higher assuming that the same amount is released during melting. In addition to melt, brine rejection during sea ice freezing transports dissolved compounds like salts and gasses (Rudels et al., 1996; Damm et al., 2015), but also particulates like sea ice algae (Hardge et al., 2017) from the sea ice system to the underlying water. Particularly the biogeochemical signals in the WML can still be observed in the next summer (Damm et al., 2015), since downward mixing is reduced by a strong halocline (Rudels et al., 1996). Some of the DMSP observed in 25–100 m might thus be sourced from the previous sea ice freeze up.
As in Region 1, we find significantly higher DMSP concentrations beneath 2-year sea-ice, this time accompanied by higher chlorophyll a concentrations (Figure 5). Under one-year as well as multi-year ice DMSP concentrations were lower and not significantly different from each other. Source regions were not clearly separated between the 2 years and different ice types. However, like in Region 1, the water under sea ice formed in the coastal Siberian polynyas mostly contained higher DMSP and chlorophyll a concentrations, compared to water under sea ice formed in the other source regions. Differences in nutrient availability might also contribute to the differences in DMSP concentrations (Supplementary Figure 2).
DMS Budget Controlled by Secondary Processes
Similar to Region 1, the amount of DMSP in Region 2 is tightly coupled to phytoplankton biomass indicated by the strong correlation between DMSP and chlorophyll a (r = 0.79, Figure 4). On the contrary, DMS is neither correlated to chlorophyll a nor DMSP (Figure 4). Furthermore, DMS was over-proportionally lower in Region 2 when comparing to DMSP and chlorophyll a. In the upper 25 m, chlorophyll a and DMSP were about 25% of the amount in Region 1, while this ratio was only 2% for DMS. Thus, either DMS is not produced in the first place, or DMS is removed faster or more complete than in Region 1.
Abiotic removal by photo-oxidation and sea-air efflux was supposedly low due to the high sea ice cover and in a similar magnitude than in Region 1. Microbial consumption of DMS, however, might be more complete than in Region 1, since 90% of the DMS concentrations in Region 2 were lower than the saturation concentration of 18 nM DMS determined in the Labrador Sea (Wolfe et al., 1999). This might have allowed DMS consumption to match DMS production, resulting in overall low DMS concentrations.
Second, the production of DMS via DMSP lysis might be reduced. Considering a similar sulfur demand for the bacterial communities in Region 1 and Region 2 and the lower DMSP concentrations in Region 2, a higher fraction of the DMSP would be demethylated to assimilate the sulfur. This would result in a lower fraction of DMSP being cleaved to DMS. Pinhassi et al. (2005) found higher contribution of DMSP sulfur to bacterial sulfur demand under oligotrophic conditions than under phytoplankton senescence in microcosm experiments with water from the Gulf of Mexico. The authors conclude that nutrient limitation leads to a limitation in S-containing organic molecules in dissolved organic matter, which could serve as alternate sulfur source to the bacteria besides DMSP. This might also apply to Region 2 where nitrate limitation leads to low phytoplankton biomass. In the same experiment, Pinhassi et al. (2005) identify DMSP as an important carbon source to the microbial community. Damm et al. (2010) found evidence that in nitrate limited waters of the central Arctic and when phosphate is available, bacteria use DMSP as carbon-source via the demethylation pathway and produce methane as side product. The same process might have lead to the low DMS concentrations in Region 2 in our study.
Concluding, in Region 2, phytoplankton production is low and DMSP and DMS production is decoupled. We hypothesize that DMS concentrations are mainly controlled by secondary processes like bacterial DMS production or consumption.
Region 3
Influence by PW and Intense Sea Ice – Ocean Interaction
Like in Region 2, the upper 100 m of the water column in Region 3 are strongly influenced by sea ice melting and freezing processes. However, Region 3 is mainly influenced by Pacific water. Since Pacific water has a lower salinity than Atlantic water (Jones et al., 1998) all water layers are less saline than in Region 2. In addition, the higher phosphate concentrations and low nitrate concentrations typical for Pacific Water (Jones et al., 1998), lead to a strong deviation from the Redfield ratio toward excess phosphate. At 0–25 m nitrate was fully depleted, resulting in very low concentrations of phytoplankton biomass indicated by low chlorophyll a concentrations (Figure 2).
In contrast, the underlying water still contained nitrate at similar concentrations than the other two regions and chlorophyll a peaked between 25 and 50 m in Region 3 (Supplementary Figure 1B). This deep chlorophyll a maximum could be caused by phytoplankton growth at the shallowest depth where nitrate becomes available with sufficient light to support primary production (Carmack et al., 2004). This is typically observed in very oligotrophic regions where nutrient depletion near the surface inhibits phytoplankton growth in the well illuminated surface layer (Takahashi and Hori, 1984; Agustí and Duarte, 1999) and also on the arctic shelves when the spring bloom exhausted the nutrients in the surface layer (e.g., Carmack et al., 2004; Martin et al., 2010). Since algal cells contain a higher chlorophyll a content to balance the low light levels available for photosynthesis (Beardall and Morris, 1976), the actual phytoplankton concentration is supposedly very low at this depth. In contrast to chlorophyll a, depth profiles of DMSP, showed two peaks of similar concentration, one near the surface and one at 50 m suggesting multiple sources for this compound (Figure 2 and Supplementary Figure 1B).
Low DMS Concentrations Controlled by Low Phytoplankton and Secondary Processes
Surprisingly, in Region 3 a strong positive correlation between DMSP and chlorophyll a is observed only below 25 m water depth (r = 0.84, Figure 4), pointing toward phytoplankton as major control on DMSP concentration in these deep water layers. Coinciding with the WML depth at 44 ± 3 m (Supplementary Figure 1B), the deep chlorophyll as well as DMSP maxima could be affected by brine rejection during sea-ice freeze-up in previous winter. Above 25 m, DMSP and chlorophyll a are not correlated and other factors than phytoplankton abundance must control DMSP concentration. For example, bacteria could constitute a DMSP-fraction unrelated to chlorophyll a, as marine bacteria were found to take up and accumulate DMSP intracellularly before metabolizing it (Kiene et al., 2000), and being capable of producing DMSP (Curson et al., 2017). Further, zooplankton and fecal pellets can contain DMSP (Kwint et al., 1996; Tang et al., 1999) adding to this chlorophyll a-unrelated DMSP-pool.
While the chlorophyll a-unrelated DMSP-pool might also be present in the other two regions, it is masked by the higher signal of phytoplankton derived DMSP. The low nanomolar DMSP concentrations in Region 3 are similar to concentrations previously reported under Arctic sea ice if there was no phytoplankton bloom present (Simó, 2001; Galindo et al., 2014). They are likely to be a result of a quick turnover of dissolved DMSP by the microbial community (Kiene et al., 2000). The very low DMS concentrations and DMS/DMSP ratios in Region 3 could either be the result of a high DMS turnover or of a dominance of the demethylation pathway over the lysis pathway in bacterial DMSP metabolism.
As a result DMSP as precursor for the climate cooling gas DMS seems to be low in this strongly oligotrophic Pacific influenced waters of the central Arctic. Secondary processes seem to mainly control DMS concentrations in Region 3. Additionally, and contrary to Region 1 and 2, in the surface layer (<25 m) DMSP appears to be controlled by other factors than phytoplankton biomass.
Conclusion and Outlook
Our study shows strong heterogeneity of DMS and DMSP concentrations in ice covered surface waters between different regions of the central Arctic. These differences are driven by physical as well as biological drivers, i.e., variations in water mass composition, sea ice cover, phytoplankton abundance and bacterial processes. High DMS and DMSP concentrations are found in the less ice-influenced region in the western Eurasian Basin (Region 1) where Atlantic water inflow provides nutrients for phytoplankton growth and light penetrates through the thinner or broken sea ice cover. In contrast, little DMS and DMSP are found in the eastern Eurasian Basin (Region 2) and the region influenced by Pacific waters (Region 3). Here sea ice strongly influences the underlying water causing oligotrophic conditions, which probably lead to different microbial cycling of DMSP and DMS, resulting in a 10- and 25-fold reduced DMS concentration per amount of chlorophyll a and DMSP, respectively (Figure 6 and Supplementary Table 4).
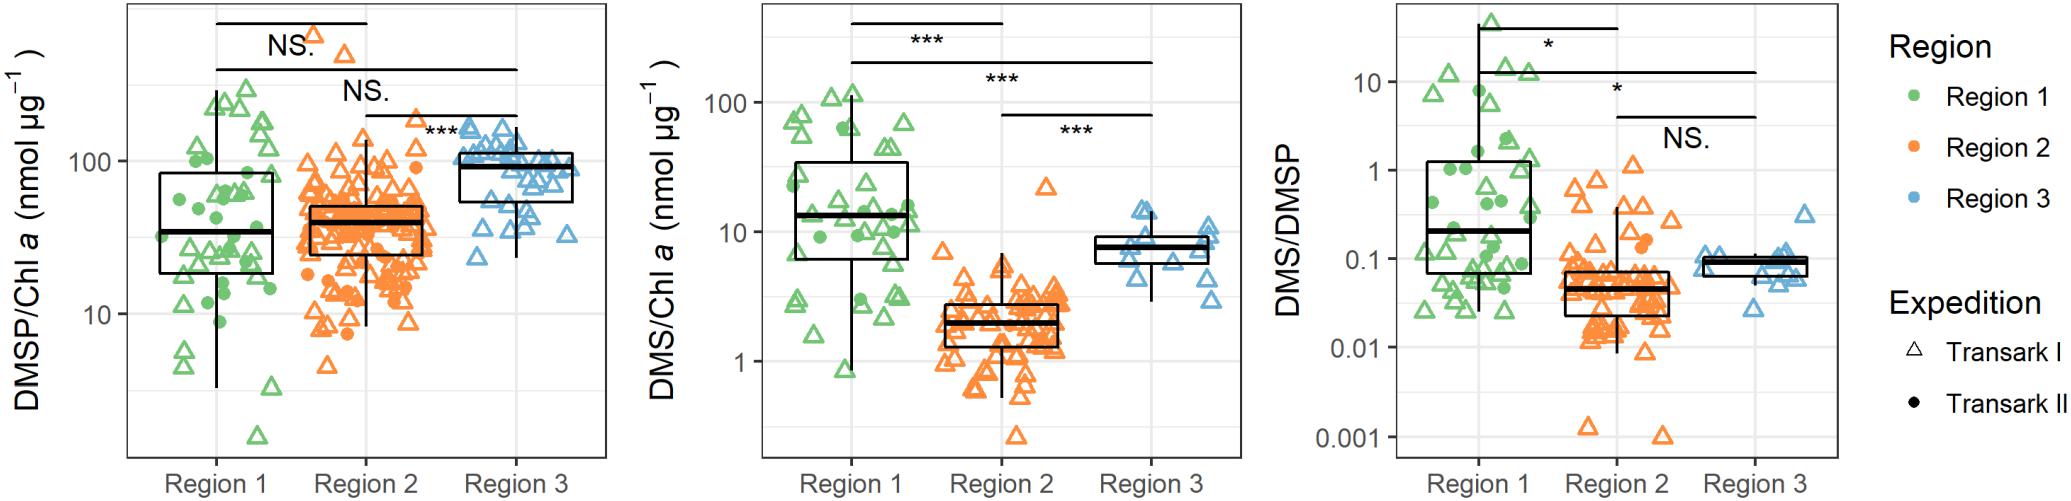
Figure 6. Ratios of DMSP and DMS to chlorophyll a (Chl a), and between DMS and DMSP in the upper 25 m water column during expeditions Transark I (triangles) and Transark II (circles) in the three regions. Confidence levels of Welch’s t-test for significant differences between means: 0.0001 ≤ ∗∗∗p < 0.001, 0.01 ≤ *p ≤ 0.05 < NS. ≤ 1.
These regional patterns of DMS are likely to change with future changes in the ocean-ice system in the Arctic due to climate warming, particularly in the Eurasian Arctic. Here, “Atlantification,” is a term used to summarize the increased importance of surface Atlantic inflow further eastward into the Eurasian Basin (Polyakov et al., 2017). It reflects the increased depth of winter mixing leading to upward mixing of the warmer and nutrient rich deeper waters coupled with loss of sea ice. Decreases in sea ice extent and duration, as well as changing properties of the sea ice cover, like higher dynamics, i.e., opening of leads are currently observed, and predicted to become more pronounced in the future (Stroeve and Notz, 2015; Comiso et al., 2017; Kwok, 2018). Further intensified melt in the marginal ice zone interrupts the transarctic conveyer belt and reduces long-ranged transport of sea ice (Krumpen et al., 2019). Extension of these conditions, i.e., less sea ice especially from the shelves, more nutrients, and warmer water could change the distinct conditions for the western and eastern part of the Eurasian basin, to more homogeneous conditions. This might enhance biological production with the potential of increased DMSP and DMS production in these ice-covered waters. A thinner and more dynamic ice cover with frequent opening of leads might allow for enhanced exchange of gasses, e.g., DMS release from the seawater to the atmosphere. On the other hand predicted stronger stratification due to higher freshwater input, e.g., by ice melt, might lead to increased oligotrophic conditions in the surface, limiting primary production (Slagstad et al., 2015). This could result in a shift of the system observed in the eastern Eurasian basin toward low DMSP and DMS production in the surface as observed in the region influenced by Pacific waters.
In light of the ongoing changes in the Arctic, our observations provide a status quo for projections of the DMS concentration and can be used in modeling approaches to access its contribution to aerosol production in the Arctic. Our study suggests that in the central Arctic macronutrient concentrations in the euphotic zone, controlled by water mass and sea ice influenced stratification, regulate not only the abundance of DMSP producing phytoplankton but also the heterotrophic cycling of DMSP to DMS and recycling of DMS itself. While our study lacks rate measurements of the suggested processes, those will be essential to confirm the autotrophic and heterotrophic processes in DMSP and DMS cycling suggested in this study and should be included in future studies. Improving the understanding of the regulation of heterotrophic processes, such as DMSP and DMS cycling, will help to build appropriate parametrizations for model studies. Already the currently available seasonally limited studies in the central Arctic, which were all performed in summer to autumn (July to October), show seasonality in DMS concentration and suggest that sea-ice melt and freeze processes are important for DMS concentrations in the upper water column. In future studies observations should be extended to a full year, ideally analyzing the same water mass to capture possible exchange of these compounds between the upper water column and sea ice particularly during freezing and melting.
Data Availability
Data on sulfur compounds and HPLC pigments are available in the database of the Data Publisher for Earth and Environmental Science, PANGAEA (https://www.pangaea.de/; 10.1594/PANGAEA.901742). Further, physical oceanography data by Schauer et al. (2012; 10.1594/PANGAEA.774181), and Rabe et al. (2016; 10.1594/PANGAEA.859558) can be accessed in PANGEA. The datasets generated for this study are available on request to the corresponding author.
Author Contributions
ED and CU designed the study, and collected and analyzed the DMS and DMSP data. IP processed and analyzed the HPLC data. TK analyzed the sea ice trajectories. BR and MK collected and analyzed the physical oceanography data. K-UL collected the inorganic nutrient data in 2011. CU wrote the manuscript with contributions from all authors.
Funding
This study was funded by the PACES (Polar Regions and Coasts in the Changing Earth System) Program of the Helmholtz Association. Backtracking of sea ice was carried out as part of the Russian–German cooperation QUARCCS funded by the BMBF under the grant 03F0777A. This study used samples and data provided by the Alfred-Wegener-Institut Helmholtz-Zentrum für Polar- und Meeresforschung in Bremerhaven (Grant Nos. ARK-XXVI/3 and AWI-PS94_00).
Conflict of Interest Statement
The authors declare that the research was conducted in the absence of any commercial or financial relationships that could be construed as a potential conflict of interest.
Acknowledgments
We would like to acknowledge the support of the captain and crew of the R/V Polarstern cruises ARK-XXVI/3 (Transark I) and PS94 (Transark II) as well as the chief scientist Ursula Schauer for facilitating the presented measurements. We are grateful to Laura Wischnewski and Elena Vinogradova for supporting sampling during ARK-XXVI/3 and PS94, respectively. Further, we would like to thank Jan van Ooijen for measurements of inorganic nutrients during PS94.
Supplementary Material
The Supplementary Material for this article can be found online at: https://www.frontiersin.org/articles/10.3389/feart.2019.00179/full#supplementary-material
References
Agustí, S., and Duarte, C. M. (1999). Phytoplankton chlorophyll a distribution and water column stability in the central Atlantic Ocean. Oceanol. Acta 22, 193–203. doi: 10.1016/S0399-1784(99)80045-0
Andrade, J. M., and Estévez-Pérez, M. G. (2014). Statistical comparison of the slopes of two regression lines: a tutorial. Anal. Chim. Acta 838, 1–12. doi: 10.1016/j.aca.2014.04.057
Andreae, M. O. (1990). Ocean-atmosphere interactions in the global biogeochemical sulfur cycle. Mar. Chem. 30, 1–29. doi: 10.1016/0304-4203(90)90059-L
Arrigo, K. R., Perovich, D. K., Pickart, R. S., Brown, Z. W., van Dijken, G. L., Lowry, K. E., et al. (2012). Massive phytoplankton blooms under Arctic Sea Ice. Science 336, 1408–1408. doi: 10.1126/science.1215065
Assmy, P., Fernández-Méndez, M., Duarte, P., Meyer, A., Randelhoff, A., Mundy, C. J., et al. (2017). Leads in Arctic pack ice enable early phytoplankton blooms below snow-covered sea ice. Sci. Rep. 7:40850. doi: 10.1038/srep40850
Beardall, J., and Morris, I. (1976). The concept of light intensity adaptation in marine phytoplankton: some experiments with Phaeodactylum tricornutum. Mar. Biol. 37, 377–387. doi: 10.1007/BF00387494
Carmack, E., Macdonald, R., and Jasper, S. (2004). Phytoplankton productivity on the Canadian Shelf of the Beaufort Sea. Mar. Ecol. Prog. Ser. 277, 37–50. doi: 10.3354/meps277037
Chang, R. Y.-W., Sjostedt, S. J., Pierce, J. R., Papakyriakou, T. N., Scarratt, M. G., Michaud, S., et al. (2011). Relating atmospheric and oceanic DMS levels to particle nucleation events in the Canadian Arctic. J. Geophys. Res. 116:D17. doi: 10.1029/2011JD015926
Charlson, R. J., Lovelock, J. E., Andreae, M. O., and Warren, S. G. (1987). Oceanic phytoplankton, atmospheric sulphur, cloud albedo and climate. Nature 326, 655–661. doi: 10.1038/326655a0
Comiso, J. C., Meier, W. N., and Gersten, R. (2017). Variability and trends in the Arctic Sea ice cover: results from different techniques: trends in the Arctic Sea Ice Cover. J. Geophys. Res. Oceans 122, 6883–6900. doi: 10.1002/2017JC012768
Curson, A. R. J., Liu, J., Bermejo Martínez, A., Green, R. T., Chan, Y., Carrión, O., et al. (2017). Dimethylsulfoniopropionate biosynthesis in marine bacteria and identification of the key gene in this process. Nat. Microbiol. 2:17009. doi: 10.1038/nmicrobiol.2017.9
Dacey, J. W. H., and Blough, N. V. (1987). Hydroxide decomposition of dimethylsulfoniopropionate to form dimethylsulfide. Geophys. Res. Lett. 14, 1246–1249. doi: 10.1029/gl014i012p01246
Damm, E., Bauch, D., Krumpen, T., Rabe, B., Korhonen, M., Vinogradova, E., et al. (2018). the transpolar drift conveys methane from the Siberian Shelf to the central Arctic Ocean. Sci. Rep. 8:4515. doi: 10.1038/s41598-018-22801-z
Damm, E., Helmke, E., Thoms, S., Schauer, U., Nöthig, E., Bakker, K., et al. (2010). Methane production in aerobic oligotrophic surface water in the central Arctic Ocean. Biogeosciences 7, 1099–1108. doi: 10.5194/bg-7-1099-2010
Damm, E., Rudels, B., Schauer, U., Mau, S., and Dieckmann, G. (2015). Methane excess in Arctic surface water- triggered by sea ice formation and melting. Sci. Rep. 5:16179. doi: 10.1038/srep16179
del Valle, D. A., Kieber, D. J., Toole, D. A., Bisgrove, J., and Kiene, R. P. (2009). Dissolved DMSO production via biological and photochemical oxidation of dissolved DMS in the Ross Sea. Antarct. Deep Sea Res. Part Oceanogr. Res. Pap. 56, 166–177. doi: 10.1016/j.dsr.2008.09.005
Fernández-Méndez, M., Katlein, C., Rabe, B., Nicolaus, M., Peeken, I., Bakker, K., et al. (2015). Photosynthetic production in the central Arctic Ocean during the record sea-ice minimum in 2012. Biogeosciences 12, 3525–3549. doi: 10.5194/bg-12-3525-2015
Galí, M., and Simó, R. (2010). Occurrence and cycling of dimethylated sulfur compounds in the Arctic during summer receding of the ice edge. Mar. Chem. 122, 105–117. doi: 10.1016/j.marchem.2010.07.003
Galindo, V., Levasseur, M., Mundy, C. J., Gosselin, M., Tremblay, J. -É, Scarratt, M., et al. (2014). Biological and physical processes influencing sea ice, under-ice algae, and dimethylsulfoniopropionate during spring in the Canadian Arctic Archipelago. J. Geophys. Res. Oceans 119, 3746–3766. doi: 10.1002/2013JC009497
Ghahremaninezhad, R., Norman, A.-L., Abbatt, J. P. D., Levasseur, M., and Thomas, J. L. (2016). Biogenic, anthropogenic and sea salt sulfate size-segregated aerosols in the Arctic summer. Atmos. Chem. Phys. 16, 5191–5202. doi: 10.5194/acp-16-5191-2016
Gosselin, M., Levasseur, M., Simard, N., Michaud, S., Sharma, S., Brickell, P., et al. (1996). in The 1994 Arctic Ocean Section: The First Major Scientific Crossing of the Arctic Ocean, eds T. Tucker and D. Cate (Hanover, NH: US Army Cold Regions Research and Engineering Laboratory). doi: 10.5194/acp-16-5191-2016
Grasshoff, K., Kremling, K., and Ehrhardt, M. (eds) (1998). Methods of Seawater Analysis, Third, Completely Revised and Extended Edition. Weinheim: Wiley-VCH Verlag GmbH.
Gruber, N., and Sarmiento, J. L. (1997). Global patterns of marine nitrogen fixation and denitrification. Glob. Biogeochem. Cycles 11, 235–266. doi: 10.1029/97GB00077
Hardge, K., Peeken, I., Neuhaus, S., Lange, B. A., Stock, A., Stoeck, T., et al. (2017). The importance of sea ice for exchange of habitat-specific protist communities in the Central Arctic Ocean. J. Mar. Syst. 165, 124–138. doi: 10.1016/j.jmarsys.2016.10.004
Hollander, M., Wolfe, D. A., and Chicken, E. (2015). Nonparametric Statistical Methods, 1st Edn. Hoboken, NJ: Wiley.
Ishida, Y. (1968). Physiological Studies on the Evolution of Dimethyl- Sulfide. Kyoto: Mem Coll Agric Kyoto Univ., 47–82.
Jones, E. P., Anderson, L. G., Jutterström, S., Mintrop, L., and Swift, J. H. (2008). Pacific freshwater, river water and sea ice meltwater across Arctic Ocean basins: results from the 2005 Beringia expedition. J. Geophys. Res. 113:C08012. doi: 10.1029/2007JC004124
Jones, E. P., Anderson, L. G., and Swift, J. H. (1998). Distribution of Atlantic and Pacific waters in the upper Arctic Ocean: implications for circulation. Geophys. Res. Lett. 25, 765–768. doi: 10.1029/98GL00464
Kasamatsu, N., Kawaguchi, S., Watanabe, S., Odate, T., and Fukuchi, M. (2004). Possible impacts of zooplankton grazing on dimethylsulfide production in the Antarctic Ocean. Can. J. Fish. Aquat. Sci. 61, 736–743. doi: 10.1139/f04-072
Kattner, G., and Ludwichowski, K.-U. (2014). Inorganic Nutrients Measured on Water Bottle Samples During POLARSTERN Cruise ARK-XXVI/3 (TransArc). Bremerhaven: Alfred Wegener Institute, Helmholtz Centre for Polar and Marine Research.
Keller, M., Bellows, W., and Guillard, R. (1989). “Dimethyl Sulfide Production in Marine Phytoplankton,” in Biogenic Sulfur in the Environment ACS Symposium Series, eds E. S. Saltzman and W. J. Cooper (Washington, DC: American Chemical Society), 167–182. doi: 10.1021/bk-1989-0393.ch011
Kettle, A. J., and Andreae, M. O. (2000). Flux of dimethylsulfide from the oceans: a comparison of updated data sets and flux models. J. Geophys. Res. Atmos. 105, 26793–26808. doi: 10.1029/2000JD900252
Kiene, R. P. (1990). Dimethyl sulfide production from dimethylsulfoniopropionate in coastal seawater samples and bacterial cultures. Appl. Environ. Microbiol. 56, 3292–3297.
Kiene, R. P. (1992). Dynamics of dimethyl sulfide and dimethylsulfoniopropionate in oceanic water samples. Mar. Chem. 37, 29–52. doi: 10.1016/0304-4203(92)90055-F
Kiene, R. P., and Bates, T. S. (1990). Biological removal of dimethyl sulphide from sea water. Nature 345, 702–705. doi: 10.1038/345702a0
Kiene, R. P., Linn, L. J., and Bruton, J. A. (2000). New and important roles for DMSP in marine microbial communities. J. Sea Res. 43, 209–224. doi: 10.1016/S1385-1101(00)00023-X
Kiene, R. P., and Slezak, D. (2006). Low dissolved DMSP concentrations in seawater revealed by small volume gravity filtration and dialysis sampling. Limnol. Oceanogr. Methods 4, 80–95. doi: 10.4319/lom.2006.4.80:
Kikuchi, T. (2004). Distribution of convective Lower Halocline Water in the eastern Arctic Ocean. J. Geophys. Res. 109:C12030. doi: 10.1029/2003JC002223
Kirst, G. O., Thiel, C., Wolff, H., Nothnagel, J., Wanzek, M., and Ulmke, R. (1991). Dimethylsulfoniopropionate (DMSP) in ice-algae and its possible biological role. Mar. Chem. 35, 381–388. doi: 10.1016/S0304-4203(09)90030-5
Korhonen, M., Rudels, B., Marnela, M., Wisotzki, A., and Zhao, J. (2013). Time and space variability of freshwater content, heat content and seasonal ice melt in the Arctic Ocean from 1991 to 2011. Ocean Sci. 9, 1015–1055. doi: 10.5194/os-9-1015-2013
Krumpen, T., Belter, H. J., Boetius, A., Damm, E., Haas, C., Hendricks, S., et al. (2019). Arctic warming interrupts the Transpolar Drift and affects long-range transport of sea ice and ice-rafted matter. Sci. Rep. 9:5459. doi: 10.1038/s41598-019-41456-y
Krumpen, T., Gerdes, R., Haas, C., Hendricks, S., Herber, A., Selyuzhenok, V., et al. (2016). Recent summer sea ice thickness surveys in Fram Strait and associated ice volume fluxes. Cryosphere 10, 523–534. doi: 10.5194/tc-10-523-2016
Kwint, R., Irigoien, X., and Kramer, K. (1996). “Copepods and DMSP,” in Biological and Environmental Chemistry of DMSP and Related Sulfonium Compounds, eds R. P. Kiene, P. T. Visscher, M. D. Keller, and G. O. Kirst (New York, NY: Plenum Press), 239–252. doi: 10.1007/978-1-4613-0377-0_21
Kwok, R. (2018). Arctic sea ice thickness, volume, and multiyear ice coverage: losses and coupled variability (1958–2018). Environ. Res. Lett. 13:105005. doi: 10.1088/1748-9326/aae3ec
Kwok, R., Spreen, G., and Pang, S. (2013). Arctic sea ice circulation and drift speed: decadal trends and ocean currents: ARCTIC SEA ICE MOTION. J. Geophys. Res. Oceans 118, 2408–2425. doi: 10.1002/jgrc.20191
Laney, S. R., Krishfield, R. A., and Toole, J. M. (2017). The euphotic zone under Arctic Ocean sea ice: vertical extents and seasonal trends: the euphotic zone under Arctic sea ice. Limnol. Oceanogr. 62, 1910–1934. doi: 10.1002/lno.10543
Leaitch, W. R., Sharma, S., Huang, L., Toom-Sauntry, D., Chivulescu, A., Macdonald, A. M., et al. (2013). Dimethyl sulfide control of the clean summertime Arctic aerosol and cloud. Elem. Sci. Anthr. 1:000017. doi: 10.12952/journal.elementa.000017
Leck, C., and Persson, C. (1996). The central Arctic Ocean as a source of dimethyl sulfide Seasonal variability in relation to biological activity. Tellus B 48, 156–177. doi: 10.3402/tellusb.v48i2.15834
Ledyard, K. M., and Dacey, J. W. H. (1994). Dimethylsulfide production from dimethyl-sulfoniopropionate by a marine bacterium. Mar. Ecol. Prog. Ser. 100, 95–103. doi: 10.3354/meps110095
Levasseur, M. (2013). Impact of Arctic meltdown on the microbial cycling of sulphur. Nat. Geosci. 6, 691–700. doi: 10.1038/ngeo1910
Liss, P. S., Hatton, A. D., Malin, G., Nightingale, P. D., Turner, S. M., and Liss, P. S. (1997). Marine sulphur emissions. Philos. Trans. Biol. Sci. 352, 159–169.
Loose, B., Schlosser, P., Perovich, D., Ringelberg, D., Ho, D. T., Takahashi, T., et al. (2011). Gas diffusion through columnar laboratory sea ice: implications for mixed-layer ventilation of CO2 in the seasonal ice zone. Tellus B 63, 23–39. doi: 10.1111/j.1600-0889.2010.00506.x
Malin, G., Wilson, W. H., Bratbak, G., Liss, P. S., and Mann, N. H. (1998). Elevated production of dimethylsulfide resulting from viral infection of cultures of Phaeocystis pouchetii. Limnol. Oceanogr. 43, 1389–1393. doi: 10.4319/lo.1998.43.6.1389
Martin, J., Tremblay, J., Gagnon, J., Tremblay, G., Lapoussière, A., Jose, C., et al. (2010). Prevalence, structure and properties of subsurface chlorophyll maxima in Canadian Arctic waters. Mar. Ecol. Prog. Ser. 412, 69–84. doi: 10.3354/meps08666
Martin, J., Tremblay, J. É, and Price, N. M. (2012). Nutritive and photosynthetic ecology of subsurface chlorophyll maxima in Canadian Arctic waters. Biogeosciences 9, 5353–5371. doi: 10.5194/bg-9-5353-2012
Matrai, P. A., Tranvik, L., Leck, C., and Knulst, J. C. (2008). Are high Arctic surface microlayers a potential source of aerosol organic precursors? Mar. Chem. 108, 109–122. doi: 10.1016/j.marchem.2007.11.001
Motard-Côté, J., Levasseur, M., Scarratt, M. G., Michaud, S., Gratton, Y., Rivkin, R. B., et al. (2012). Distribution and metabolism of dimethylsulfoniopropionate (DMSP) and phylogenetic affiliation of DMSP-assimilating bacteria in northern Baffin Bay/Lancaster Sound. J. Geophys. Res. Oceans 117:C00G11. doi: 10.1029/2011JC007330
Nicolaus, M., Katlein, C., Maslanik, J., and Hendricks, S. (2012). Changes in Arctic sea ice result in increasing light transmittance and absorption: light in A changing Arctic Ocean. Geophys. Res. Lett. 39:L24501. doi: 10.1029/2012GL053738
Park, K.-T., Jang, S., Lee, K., Yoon, Y. J., Kim, M.-S., Park, K., et al. (2017). Observational evidence for the formation of DMS-derived aerosols during Arctic phytoplankton blooms. Atmos. Chem. Phys. 17, 9665–9675. doi: 10.5194/acp-17-9665-2017
Park, K.-T., Lee, K., Yoon, Y.-J., Lee, H.-W., Kim, H.-C., Lee, B.-Y., et al. (2013). Linking atmospheric dimethyl sulfide and the Arctic Ocean spring bloom: atmospheric dms in the arctic spring bloom. Geophys. Res. Lett. 40, 155–160. doi: 10.1029/2012GL054560
Pearson, K. (1895). Note on regression and inheritance in the case of two parents. Proc. R. Soc. Lond. 58, 240–242. doi: 10.1098/rspl.1895.0041
Peeken, I., Primpke, S., Beyer, B., Gütermann, J., Katlein, C., Krumpen, T., et al. (2018). Arctic sea ice is an important temporal sink and means of transport for microplastic. Nat. Commun. 9:1505. doi: 10.1038/s41467-018-03825-5
Pinhassi, J., Simo, R., Gonzalez, J. M., Vila, M., Alonso-Saez, L., Kiene, R. P., et al. (2005). Dimethylsulfoniopropionate turnover is linked to the composition and dynamics of the bacterioplankton assemblage during a microcosm phytoplankton bloom. Appl. Environ. Microbiol. 71, 7650–7660. doi: 10.1128/AEM.71.12.7650-7660.2005
Polyakov, I. V., Pnyushkov, A. V., Alkire, M. B., Ashik, I. M., Baumann, T. M., Carmack, E. C., et al. (2017). Greater role for Atlantic inflows on sea-ice loss in the Eurasian Basin of the Arctic Ocean. Science 356, 285–291. doi: 10.1126/science.aai8204
R Core Team (2015). R: A Language and Environment for Statistical Computing. Vienna: R Foundation for Statistical Computing.
Rabe, B., Schauer, U., Ober, S., Horn, M., Hoppmann, M., Korhonen, M., et al. (2016). Physical Oceanography During POLARSTERN Cruise PS94 (ARK-XXIX/3). Bremerhaven: Alfred Wegener Institute, Helmholtz Centre for Polar and Marine Research. doi: 10.1594/PANGAEA.859558
Rapp, J. Z., Fernández-Méndez, M., Bienhold, C., and Boetius, A. (2018). Effects of ice-algal aggregate export on the connectivity of bacterial communities in the central Arctic Ocean. Front. Microbiol. 9:1035. doi: 10.3389/fmicb.2018.01035
Reisch, C. R., Moran, M. A., and Whitman, W. B. (2008). Dimethylsulfoniopropionate-dependent demethylase (DmdA) from ıtPelagibacter ubique and ıtSilicibacter pomeroyi. J. Bacteriol. 190, 8018–8024. doi: 10.1128/JB.00770-08
Rudels, B., Anderson, L. G., and Jones, E. P. (1996). Formation and evolution of the surface mixed layer and halocline of the Arctic Ocean. J. Geophys. Res. Oceans 101, 8807–8821. doi: 10.1029/96JC00143
Rudels, B., Larsson, A.-M., and Sehlstedt, P.-I. (1991). Stratification and water mass formation in the Arctic Ocean: some implications for the nutrient distribution. Polar Res. 10, 19–32. doi: 10.1111/j.1751-8369.1991.tb00631.x
Schauer, U. (2012). The Expedition of the Research Vessel Polarstern to the Arctic in 2011 (ARK-XXVI/3 - TransArc). Bremerhaven: Alfred Wegener Institute, Helmholtz Centre for Polar and Marine Research. doi: 10.2312/BzPM_0649_2012
Schauer, U. (2016). The Expedition PS94 of the Research Vessel POLARSTERN to the Central Arctic Ocean in 2015. Bremerhaven: Alfred Wegener Institute, Helmholtz Centre for Polar and Marine Research. doi: 10.2312/BzPM_0703_2016
Schauer, U., Rabe, B., and Wisotzki, A. (2012). Physical Oceanography During POLARSTERN Cruise ARK-XXVI/3 (TransArc). Bremerhaven: Alfred Wegener Institute, Helmholtz Centre for Polar and Marine Research. doi: 10.1594/PANGAEA.774181
Schlitzer, R. (2018). Ocean Data View. Available at: https://odv.awi.de (accessed March 18, 2019).
Simó, R. (2001). Production of atmospheric sulfur by oceanic plankton: biogeochemical, ecological and evolutionary links. Trends Ecol. Evol. 16, 287–294. doi: 10.1016/S0169-5347(01)02152-8
Simó, R. (2004). From cells to globe: approaching the dynamics of DMS(P) in the ocean at multiple scales. Can. J. Fish. Aquat. Sci. 61, 673–684. doi: 10.1139/f04-030
Slagstad, D., Wassmann, P. F. J., and Ellingsen, I. (2015). Physical constrains and productivity in the future Arctic Ocean. Front. Mar. Sci. 2:85. doi: 10.3389/fmars.2015.00085
Stefels, J., Steinke, M., Turner, S., Malin, G., and Belviso, S. (2007). Environmental constraints on the production and removal of the climatically active gas dimethylsulphide (DMS) and implications for ecosystem modelling. Biogeochemistry 83, 245–275. doi: 10.1007/s10533-007-9091-5
Stefels, J., and Van Boekel, W. H. M. (1993). Production of DMS from dissolved DMSP in axenic cultures of the marine phytoplankton species Phaeocystis sp. Mar. Ecol. Prog. Ser. 97, 11–18. doi: 10.3354/meps097011
Stroeve, J., and Notz, D. (2015). Insights on past and future sea-ice evolution from combining observations and models. Glob. Planet. Change 135, 119–132. doi: 10.1016/j.gloplacha.2015.10.011
Takahashi, M., and Hori, T. (1984). Abundance of picophytoplankton in the subsurface chlorophyll maximum layer in subtropical and tropical waters. Mar. Biol. 79, 177–186. doi: 10.1007/BF00951826
Tang, K., Dam, H., Visscher, P., and Fenn, T. (1999). Dimethylsulfoniopropionate (DMSP) in marine copepods and its relation with diets and salinity. Mar. Ecol. Prog. Ser. 179, 71–79. doi: 10.3354/meps179071
Tran, S., Bonsang, B., Gros, V., Peeken, I., Sarda-Esteve, R., Bernhardt, A., et al. (2013). A survey of carbon monoxide and non-methane hydrocarbons in the Arctic Ocean during summer 2010. Biogeosciences 10, 1909–1935. doi: 10.5194/bg-10-1909-2013
Ulfsbo, A., Cassar, N., Korhonen, M., van Heuven, S., Hoppema, M., Kattner, G., et al. (2014). Late summer net community production in the central Arctic Ocean using multiple approaches: NCP in the central Arctic Ocean. Glob. Biogeochem. Cycles 28, 1129–1148. doi: 10.1002/2014GB004833
Vallina, S. M., Simó, R., Gassó, S., de Boyer-Montégut, C., del Río, E., Jurado, E., et al. (2007). Analysis of a potential “solar radiation dose-dimethylsulfide-cloud condensation nuclei” link from globally mapped seasonal correlations: global “solar radiation dose-DMS-CCN” link. Glob. Biogeochem. Cycles 21:GB2004. doi: 10.1029/2006GB002787
Van Ooijen, J. C., Rijkenberg, M. J. A., Gerringa, L. J. A., Rabe, B., and Rutgers Van Der Loeff, M. M. (2016). Inorganic Nutrients Measured on Water Bottle Samples During POLARSTERN Cruise PS94 (ARK-XXIX/3). Texel: Royal Netherlands Institute for Sea Research. doi: 10.1594/PANGAEA.868396
Welch, B. L. (1938). The significance of the difference between two means when the population variances are unequal. Biometrika 29, 350–362. doi: 10.1093/biomet/29.3-4.350
Wolfe, G., and Kiene, R. (1993). Radioisotope and chemical inhibitor measurements of dimethyl sulfide consumption rates and kinetics in estuarine waters. Mar. Ecol. Prog. Ser. 99, 261–269. doi: 10.3354/meps099261
Wolfe, G., Levasseur, M., Cantin, G., and Michaud, S. (1999). Microbial consumption and production of dimethyl sulfide (DMS) in the Labrador Sea. Aquat. Microb. Ecol. 18, 197–205. doi: 10.3354/ame018197
Keywords: DMS, DMSP, aerosol, Arctic Ocean, sea ice
Citation: Uhlig C, Damm E, Peeken I, Krumpen T, Rabe B, Korhonen M and Ludwichowski K-U (2019) Sea Ice and Water Mass Influence Dimethylsulfide Concentrations in the Central Arctic Ocean. Front. Earth Sci. 7:179. doi: 10.3389/feart.2019.00179
Received: 01 November 2018; Accepted: 24 June 2019;
Published: 10 July 2019.
Edited by:
Jeff Shovlowsky Bowman, University of California, San Diego, United StatesReviewed by:
Mar Fernández-Méndez, GEOMAR Helmholtz Centre for Ocean Research Kiel, GermanyJacqueline Stefels, University of Groningen, Netherlands
Copyright © 2019 Uhlig, Damm, Peeken, Krumpen, Rabe, Korhonen and Ludwichowski. This is an open-access article distributed under the terms of the Creative Commons Attribution License (CC BY). The use, distribution or reproduction in other forums is permitted, provided the original author(s) and the copyright owner(s) are credited and that the original publication in this journal is cited, in accordance with accepted academic practice. No use, distribution or reproduction is permitted which does not comply with these terms.
*Correspondence: Ellen Damm, ZWxsZW4uZGFtbUBhd2kuZGU=