 Edoardo Grottoli
 Paolo Ciavola
- 1School of Geography and Environmental Sciences, Ulster University, Coleraine, United Kingdom
- 2Department of Physics and Earth Science, University of Ferrara, Ferrara, Italy
The role of short- to medium-term geomorphic variation is analyzed in two Italian mixed sand and gravel beaches to better understand how it could affect vulnerability assessments of oil spill events. The study sites, Portonovo and Sirolo, are in one of the most congested areas for oil transportation in the Adriatic Sea (Ancona port). A “snapshot” situation populated with field data collected in April 2015 is compared to a “changing” situation built with previous field datasets (topographic surveys and surface sediment samplings) available for the two beaches. According to the ESI guidelines established by the National Oceanic and Atmospheric Administration [NOAA], 2002, both Portonovo and Sirolo can be ranked as ESI 5 or 6A in most of the cases. Sediment size resulted in the most decisive factor for the ESI assessment. As consequence of the bimodal direction of storms, the high geomorphic variability on the two sites is mainly related to storm berms which lead to rapid burial processes on both beaches. In oil spill circumstances, burial is considered the most alarming factor, especially on microtidal mixed beaches that develop storm berms so high and close to the shoreline. A quantification of the maximum potential depth reachable by the oil in the beach body is therefore needed for the most dynamic beaches; this could be achieved with repeated field measurements to be performed in the period between two consecutive ESI updates (5–7 years) and the addition of an appendix in the ESI maps dealing with the geomorphic characteristics of the beach. The significance of a changing ESI rank is that the authorities in charge of responding to the oil spill could be improperly prepared for the conditions that exist at a spill site if the geomorphology has changed from when it was first given an ESI rank.
Introduction
Despite the increasing exploitation of renewable energies, oil is currently one of the most adopted energy sources in the world (British Petroleum [BP], 2018). Its transportation is still necessary by tankers across the sea and its extraction by means of offshore platforms is quite common, creating the potential for oil spills whether offshore or toward the coasts. The coastal value from ecological, socioeconomic, and cultural points of view is threatened by several pollution sources, and among them oil represents one of the most harmful (Santos and Andrade, 2009). Thanks to the implementation of satellite and SAR images, oil spill monitoring has recently received more attention from the scientific community (Fiscella et al., 2000; Brekke and Solberg, 2005; Gambardella et al., 2010; Xu et al., 2014). Improvements in remote sensing have allowed better identification of oil in water environments, but the many possible background interferences and the absence of ad hoc sensors to detect oil in the water still represent limitations (Fingas and Brown, 2018). When an oil spill reaches the coast, several factors dealing with the physical nature and the hydrodynamics of the site can signal the persistence of oil in the coastal environment. The first attempts of classification for oil spill vulnerability were proposed by Gundlach and Hayes (1978) and Michel et al. (1978). Those efforts were improved through the years (Jensen et al., 1998) and finally merged into the most comprehensive tool known so far to asses coastal vulnerability to oil spill, which is the Environmental Sensitivity Index (ESI) established by the National Oceanic and Atmospheric Administration (National Oceanic and Atmospheric Administration [NOAA], 2002). The aim of the ESI guidelines is to generate vulnerability maps for water environments potentially affected by oil spill events. Fattal et al. (2010) conceptually defined the coastal vulnerability to oil spill as the combination of (1) shoreline type (substrate, sand grain size, tidal range), (2) exposure to wave and tidal energy, (3) the biological sensitivity index (Nansingh and Jurawan, 1999), (4) the analysis of oil persistence on the shoreline, (5) crisis management, and (6) the value of business activities affected by the oil spill. In the European context there are no tools like ESI maps, but some studies have been led to propose an index for marine-spill risk along the entire European coastline (Fernández-Macho, 2016). At the scale of the Adriatic Sea, the SHAPE project built an atlas as a tool for storing, visualizing and managing data useful to implement the Integrated Coastal Zone Management (ICZM) and Maritime Spatial Planning (MSP) policies, among which the oil spill vulnerability assessment is also present1. An oil spill forecasting system was set up for seven specific oil platforms in the Italian seas by Ribotti et al. (2019), including three sites in the Adriatic Sea. In the Adriatic Sea there is also the oil platform closest to the coast (Sarago Mare platform), which is also 30 km SE from the study area of the present paper. Coastal hazard assessments were modeled by Olita et al. (2019) for some Italian oil platforms, and the largest hazard value resulted from the Sarago Mare platform. According to Fernández-Macho (2016), Italy occupies the fourth place in Europe for oil spill vulnerability, even though the Ancona area (namely the study site of this paper) turned out to be quite low. As stated by Pourvakhshouri and Mansor (2003), the priority in the case of an oil spill affecting a coastal environment is to stop the dispersion of pollutants in the beach and through the adjacent water column. According to Kirby and Law (2010), an effective response to an oil spill at sea must include a well planned and executed post-incident assessment of environmental contamination and damage. For all these reasons it is crucial to understand and recognize the morpho-sedimentary dynamics of beaches. The vulnerability assessment should provide guidelines to help the local authorities in taking the proper decision to contrast the oil spill consequences (Pourvakhshouri and Mansor, 2003). As stated by Aps et al. (2014), beaches cannot be simply considered from a statistical point of view, and coastal morphodynamics is an important factor to take into account in the vulnerability assessment for oil spill events. The crucial role of field measurements for evaluating ESI was already recognized by Nelson and Grubesic (2018), as they helped to decrease observational error when only remote sensing data are used. According to González et al. (2009), to minimize the impact of oil spill on beaches it is crucial to understand the modal state of the beach and its morphodynamics variability through time; the authors also highlight the importance of the beach limits (lateral and the cross-shore), which confine the water circulation and the oil transport on the beach. The ESI scale of National Oceanic and Atmospheric Administration [NOAA] (2002) still represent an impressive and comprehensive tool to assess the susceptibility to spilled oil along coastal habitats, and it represents something that still must be reproduced at a European or worldwide context. Nevertheless, an improvement on the “shoreline type” classification is possible to better adopt ESI on a more local scale and in coastal environments amply different from oceanic coasts.
The aim of this paper is to adopt the ESI guidelines of National Oceanic and Atmospheric Administration [NOAA] (2002) for two mixed sand and gravel beaches in the microtidal environment of the Adriatic Sea (Italy). Comparing a one-time (“snapshot”) situation with sequential field measurements from the same sites (“changing” situation), we want to demonstrate the crucial role of rapid geomorphic and surface sediment changes in the vulnerability assessment of mixed beaches for oil spill events. Substantial changes within relatively short time frames can take place in mixed sand and gravel beaches, therefore they may require different consideration in the preparedness and response to oil spill events.
Study Area
The study area is represented by two mixed sand and gravel beaches located on the eastern side of Conero Headland, which represents a rare case of high coast for the flat and sandy Italian side of the Adriatic Sea. Typical wave directions recorded by the Ancona offshore wave buoy (Figure 1A) between 1999 and 2006 are from SE (20%) and NE (16%) which also correspond to the main directions of storms (SE driven by “Scirocco” wind and NE driven by “Bora” wind). The significant wave height is usually between 0.25 and 2 m (80% of the time), less than 0.25 m for the 10% and higher than 2 m for the last 10% (Bencivenga et al., 2012; Figure 1B). The littoral transport is directed northward given the dominant influence of easterly winds (Colantoni et al., 2003; Regione Marche, 2005). The first site is Portonovo, a 500 m long and 20–50 m wide beach, orientated NW–SE. The beach is limited on both longshore sides by historical buildings protected at their bases by boulder-mound revetments (Figure 1C). The southern portion of the beach is slightly embayed and wider, whereas the central sector is the narrowest since the backshore is limited by a seawall protecting the local restaurants. The northern side is limited landward by a natural cliff made of limestone and marls, which also represents the only source of sediments for the beach (Grottoli et al., 2015). This cliff, locally reaching 12 m in elevation, is actually material that has fallen from Conero Headland in the Middle Ages (1249 circa; Montanari et al., 2016; Figure 1C). The grain size of beach sediment ranges from medium sand to cobbles, with a prevalent fraction of pebbles. Between 2006 and 2010, local authorities injected circa 18500 m3 of nourishment material made of alluvial sediments (D50 = 10–50 mm, limestone) to prevent beach erosion. The framework involved all the beaches of Portonovo, and the exact quantity deployed on the study site is unknown even though most of the nourishment material was deployed outside this sector, namely in the western part of the town (personal communication by local authorities, i.e., Regione Marche). The gravel fraction usually occupies the swash zone, with granules and fine pebbles normally found on the fair-weather berm and in the swash zone and cobbles and boulders usually found on the step zone. The beachface typically slopes at 0.2 (11°), whereas the seabed seaward of the step is approximately 0.01 (0.5°), as typically on the northern part of Adriatic seabed (Grottoli et al., 2017). According to the Jennings and Shulmeister (2002) classification of gravel beaches, Portonovo is a mixed sand and gravel beach (MSG) since a complete intermixing of sandy and gravelly sediments occurs (Figure 1D). The second study site is Sirolo (San Michele-Sassi Neri beach), which is located 5 km south from Portonovo. Here the beach is 1.2 km long and 30–40 m wide: it can be considered a natural embayed pocket beach since the cliff of Conero Headland confines the beach both alongshore and landward. The southernmost edge of the beach is also limited by hard structures (Figure 1E). The beach is N–S orientated, with the beachface typically sloping at 0.16 (9°) whereas the seabed seaward of the step is approximately 0.01 (0.5°; Grottoli et al., 2017). As in Portonovo, the only sediment source for Sirolo is represented by the limestone cliff behind the beach: small rockfalls occur during major storms or after heavy rainfall. Gravel nourishment was also undertaken in Sirolo by local authorities: between 2009 and 2011, 156000 m3 of alluvial material (D50 = 6–12 mm, limestone) were deposited on the beachface to counter coastal erosion (Regione Marche, 2005). According to the Jennings and Shulmeister (2002) classification, Sirolo is a mixed sand and gravel beach (MSG). Like in Portonovo, here the beach surface looks extremely heterogeneous due to the intermixing of sand and gravel (Figure 1F). The swash zone is populated by granules and fine pebbles. The two study sites are in a semidiurnal tidal regime with the maximum excursion at spring tide of 0.47 m and a maximum record of 0.58 m (Colantoni et al., 2003).
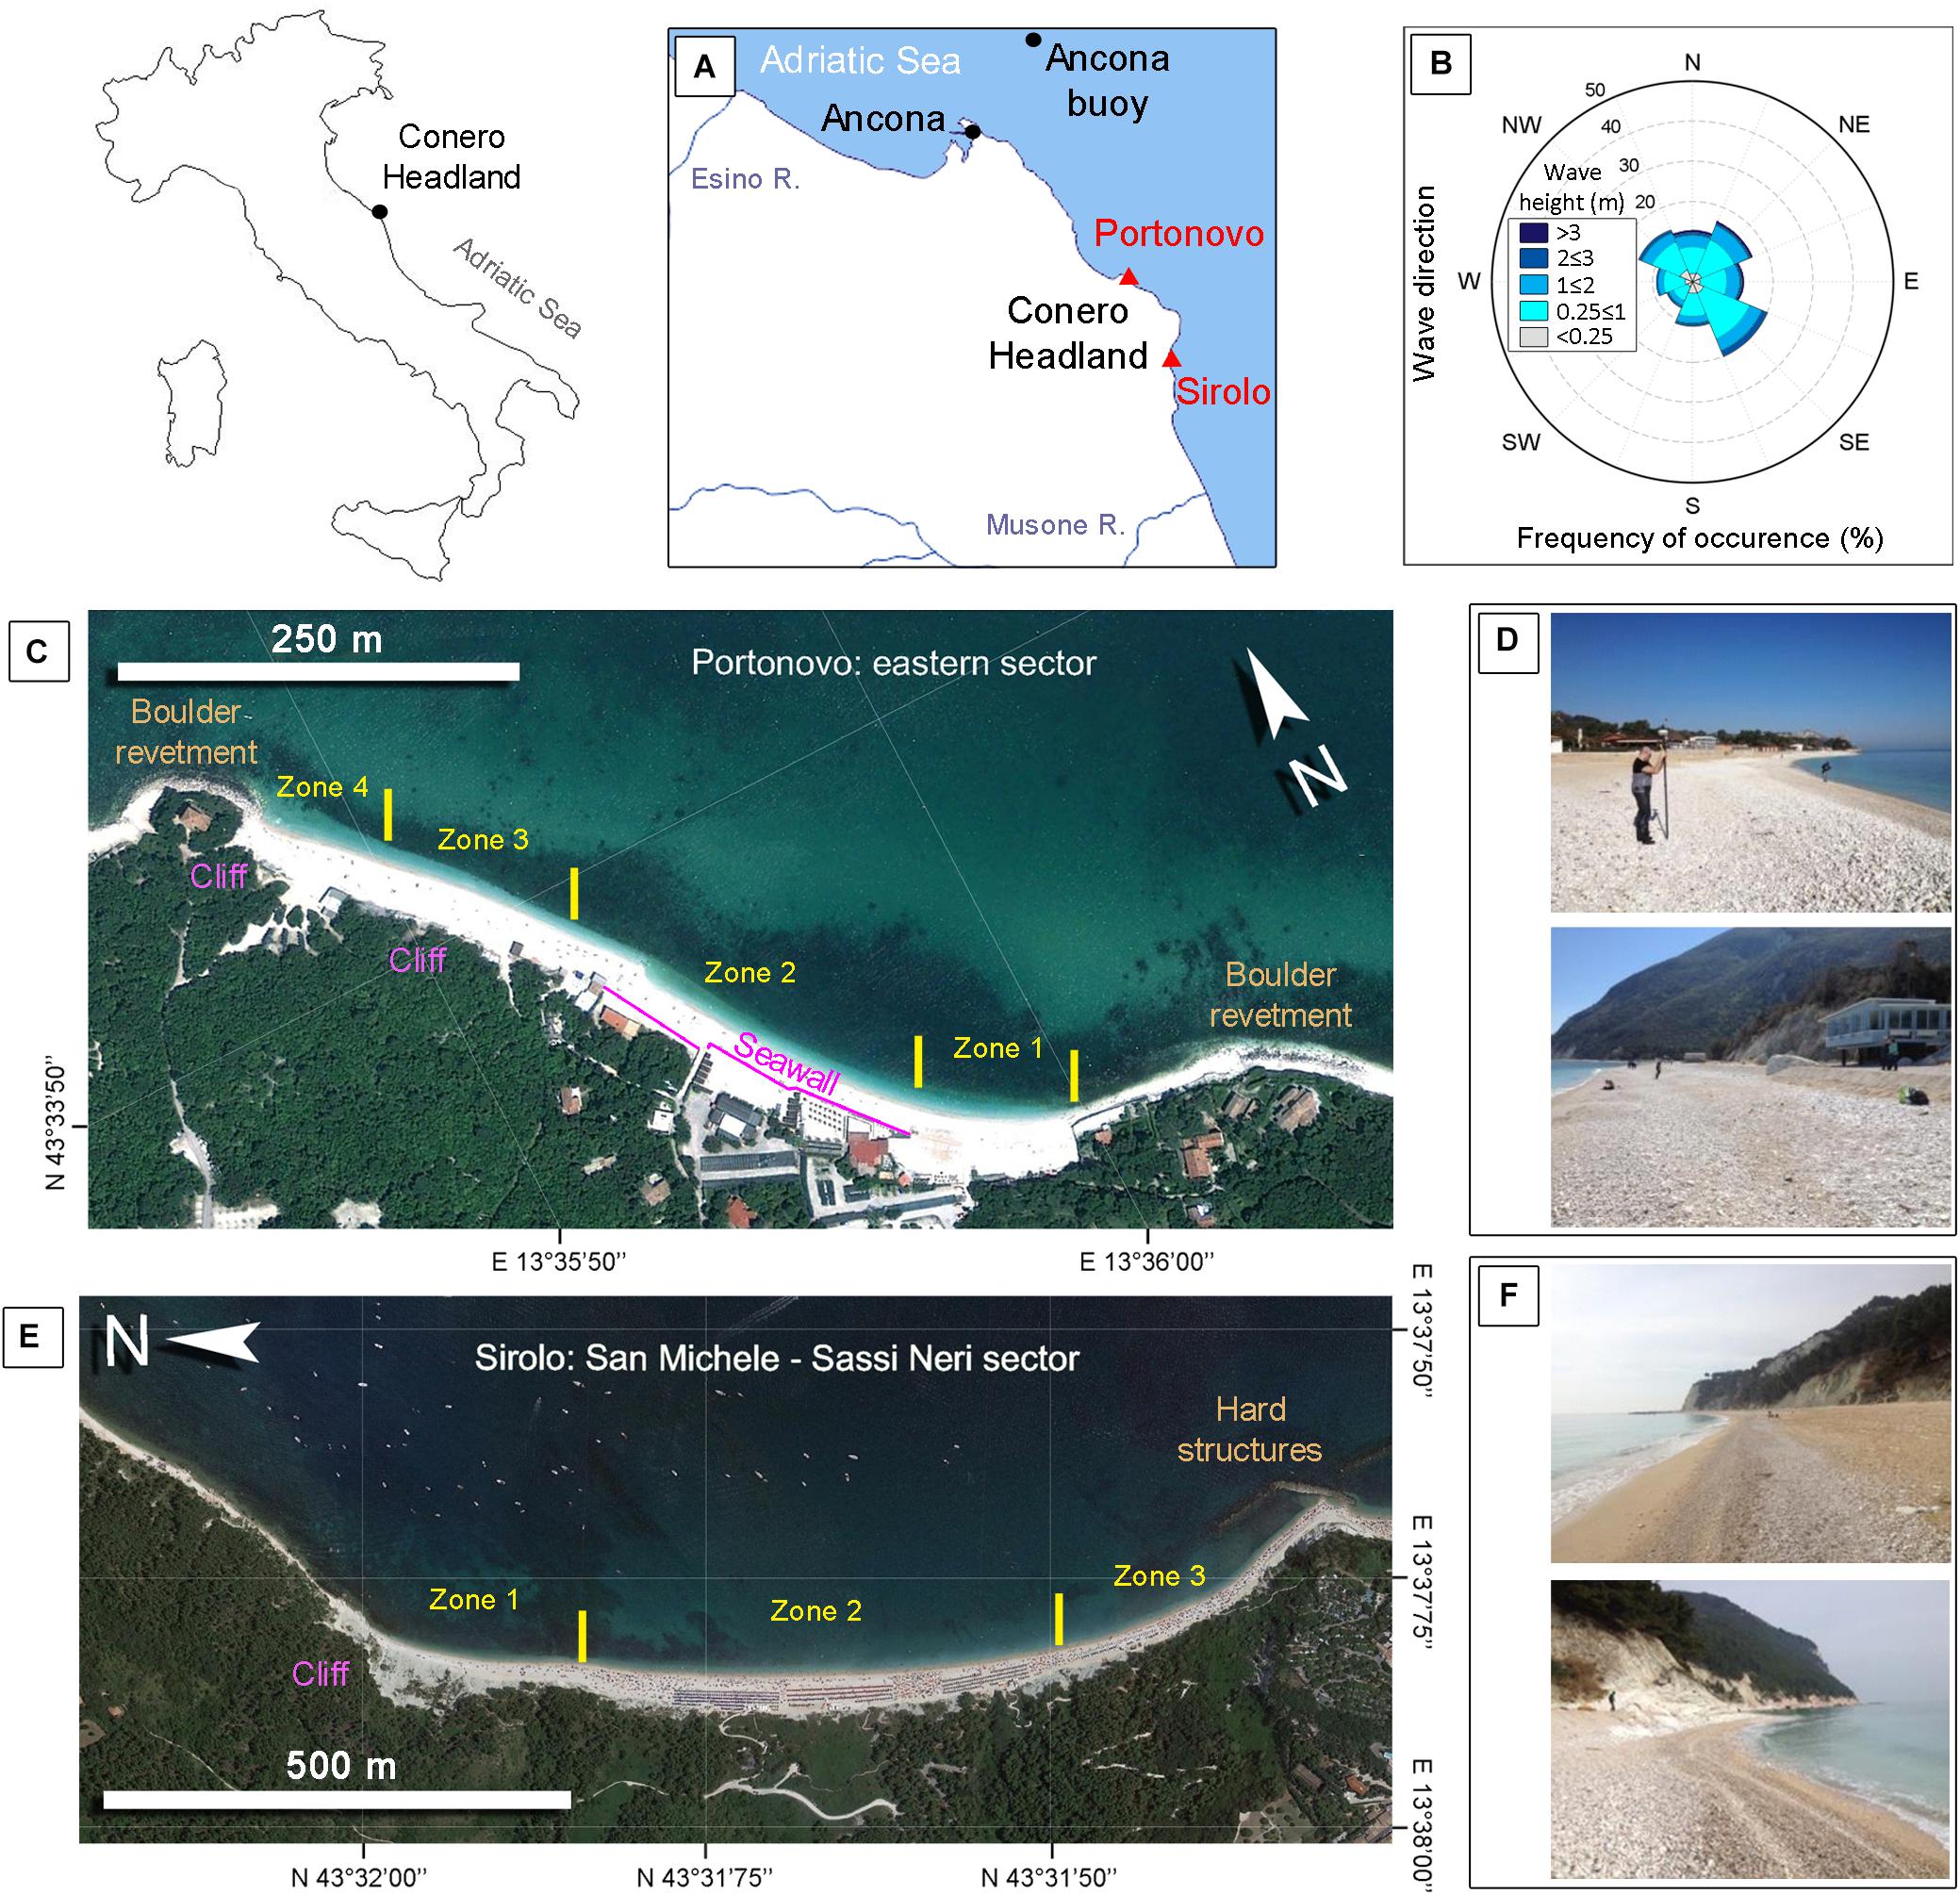
Figure 1. Study sites: (A) Location; (B) Multiyear wave climate for Portonovo and Sirolo (recording period from 1999 to 2006). Wave data recorded by ISPRA buoy of Ancona (Bencivenga et al., 2012); (C) Zone subdivision in Portonovo; (D) Beach sediments in Portonovo in April 2015; (E) Zone subdivision in Sirolo; (F) Beach sediments in Sirolo in April 2015.
Materials and Methods
In order to highlight the role of geomorphic variability in estimating the ESI for oil spill vulnerability of Portonovo and Sirolo beaches, a “snapshot” situation, obtained from direct field measurements (topographic survey and surface sediment sampling) performed in April 2015, was compared with a series of previous field datasets from the same study sites which represented a “changing” situation.
Environmental Sensitivity Index Guidelines for Oil Spill Vulnerability
In 2002, National Oceanic and Atmospheric Administration (NOAA) established the ESI guidelines in order to create vulnerability maps of the United States in the case of oil spill events (National Oceanic and Atmospheric Administration [NOAA], 2002). The aim of this classification is to collect all the critical resources and natural characteristics of each water environment (fluvial, lacustrine, and estuarine) to assess its potential oil spill vulnerability. According to National Oceanic and Atmospheric Administration [NOAA] (2002), coastal habitats are vulnerable to oil spills. The classification requires three different details to complete ESI maps: (i) type of shoreline; (ii) biological resources; and (iii) human-use resources. This study is only focused on the “type of shoreline” to better characterize the geomorphic contribution to its assessment. The type of shoreline according to National Oceanic and Atmospheric Administration [NOAA] (2002) is controlled by the following factors: (i) beach exposure to waves and tides; (ii) beach slope; (iii) substrate type (i.e., sediment grain size, mobility, penetration, and/or burial and trafficability); and (iv) biological productivity and sensitivity. Concerning wave and tide exposure, National Oceanic and Atmospheric Administration [NOAA] (2002) distinguishes three categories. High-energy shorelines (1A–2B) are regularly exposed to large waves or strong tidal currents during all seasons. Medium-energy shorelines (3A–7) often have seasonal patterns in storm frequency and wave size. Low-energy shorelines (8A–10E) are sheltered from wave and tidal energy, except during unusual or infrequent events. Beach slope is meant as the inclination of the intertidal zone. The slope categories are steep (>30°), moderate (between 5° and 30°), and flat (<5°), but more accurate subdivision is made for each vulnerability rank. The substrate type can be classified as bedrock (permeable or impermeable, depending upon the presence of surface deposits on top of the bedrock); sediments, which are divided by grain size; and man-made materials (basically riprap or seawalls). The fourth factor concerning the biological productivity and sensitivity was not considered in this work. A comprehensive description of each vulnerability rank is listed in Table 1 and is available in National Oceanic and Atmospheric Administration [NOAA] (2002). Each vulnerability level, which is characterized by different sediment sizes, beach slope and hydrodynamics, has important implications for the penetration of oil and its burial by beach sediments. Sediment size and its mixing also affect trafficability of cleaning equipment, making cleaning operations different for each environment. The higher the ESI rank, the more sensitive the environment is to oil (National Oceanic and Atmospheric Administration [NOAA], 2002).
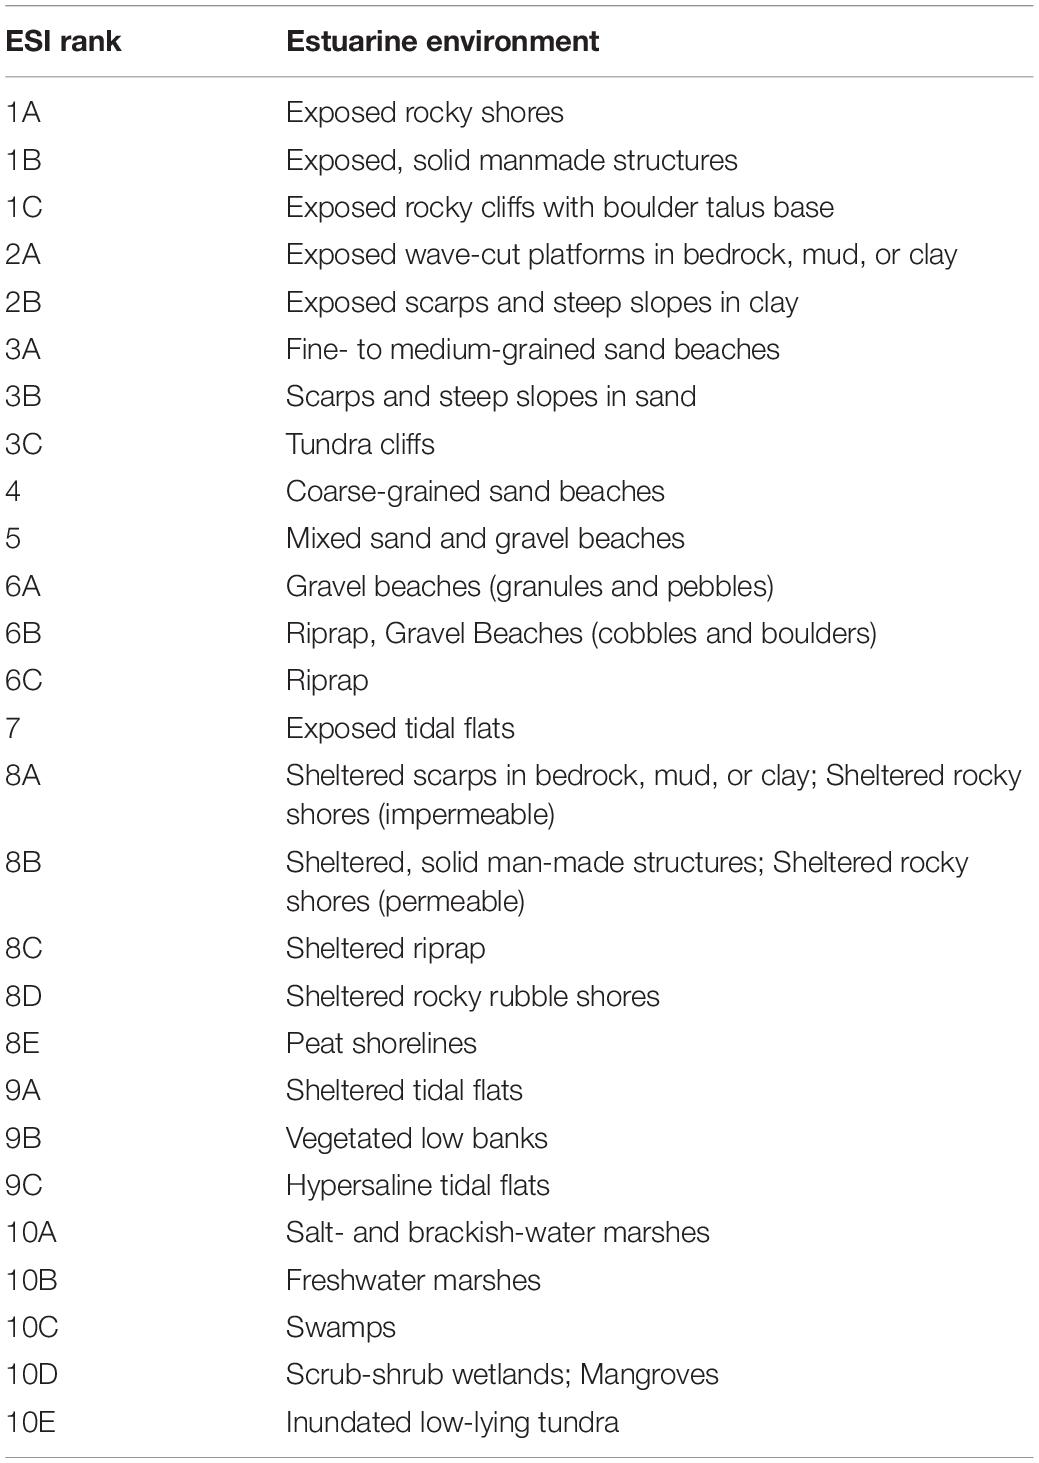
Table 1. Environmental Sensitivity Index shoreline classification for vulnerability assessment of oil spill events (National Oceanic and Atmospheric Administration [NOAA], 2002; modified).
Geomorphic Situation of April 2015 (Snapshot Situation)
To assess the oil spill vulnerability of the two beaches according to ESI guidelines (National Oceanic and Atmospheric Administration [NOAA], 2002), in situ investigations were performed in April 2015. Beach topography was measured by means of an RTK-GNSS (Trimble R6, ± 4 cm of accuracy). In Portonovo, a network of 50 cross-shore profiles, spaced 10 m apart, were surveyed. In Sirolo 18 cross-shore profiles, 50 m spaced, were measured. At the same time, surface sediment samplings were also performed in both beaches: a total of 51 samples along 14 profiles were collected (3–4 samples for each profile) at Portonovo beach: this sampling grid unfortunately covers only half the beach (zone 1 and 2 of Figure 1C) since it represents a previous sampling grid that was chosen to be maintained. In Sirolo, 26 samples were collected along nine profiles (three samples for each profile). Grain size analyses were performed by means of dry sieving with 1-phi intervals, to be consistent with previous sediment datasets. Grain size parameters (mean diameter and sorting) were computed following Folk and Ward’s (1957) method by means of GRADISTAT 8.0 software (Blott and Pye, 2001). Topographic and surface sediment data collected in April 2015 have been used to describe the oil spill vulnerability in a “snapshot” situation as if an oil pollution would reach the beaches at that time.
Geomorphic Variability From Previous Data (Changing Situation)
The analysis of the short- to medium-term changing situation was undertaken thanks to previous datasets on both beaches. At Portonovo beach, topographic data, gathered following the same profile network used in April 2015, were available from March 2012 to February 2014 (approximately 23 months). Surface sediment samples were also available from March 2012 to April 2013 (approximately 13 months) from the same sampling grid of April 2015 (zone 1 and 2 of Portonovo beach, Figure 1C). To properly estimate the ESI rank of Portonovo, only the dates when both topographic and grain size data were available have been considered. In Sirolo, topographic data were available from March 2012 to October 2012 (approximately 8 months) recorded on the same profile network used in April 2015. No sediment samples were available apart from April 2015 in this site, so ESI estimation from previous datasets has been done only considering slope data. Both beaches were divided in zones (Figures 1C,E) according to recurrent morpho-sedimentary features observed from previous data. The subdivision will be useful to test and discuss if temporal morpho-sedimentary changes in those zones may vary the vulnerability rank. A more detailed use of ESI both in time and space can represent a chance to improve ESI guidelines from a geomorphic point of view. Topographic measurements, sediment samplings and grain size analyses were performed with the same methodology used for the dataset of April 2015 which is described in the previous paragraph.
Results
ESI Shoreline Classification of April 2015 (Snapshot Situation)
In April 2015, Portonovo beach had an average slope in the intertidal zone of 13° (0.23), hence the whole beach could be alternatively considered as rank 5 or 6A according to the National Oceanic and Atmospheric Administration [NOAA] (2002) guidelines on beach slope (Table 2). The average grain size (mean diameter, Mz) was 11.6 mm (medium pebbles) and the material was generally poorly sorted (σ1 = 1.1 phi). The sand-gravel ratio for the whole beach is 0.19, therefore only one sixth of the beach is sandy and the rest is gravelly. According to grain size data and ESI guidelines by National Oceanic and Atmospheric Administration [NOAA] (2002), Portonovo beach can be classified as rank 5 (mixed beaches, Table 2). Following the zone subdivision showed in Figure 1C, Portonovo beach can be classified most of the time both as rank 5 and 6A if only the slope of the intertidal zone is considered (Table 2). On the other hand, if only grain size is considered, Portonovo beach can be classified always as rank 5 (mixed beaches; Table 2). In the same period, Sirolo beach had an average slope of 10° (0.18) in the intertidal zone, hence the beach could be classified alternatively as rank 5 or 6A according to the National Oceanic and Atmospheric Administration [NOAA] (2002) guidelines on beach slope. The average grain size (mean diameter, Mz) was 6.12 mm (fine pebbles) and the material was generally poorly sorted (σ1 = 1.2 phi). The sand-gravel ratio for the whole beach is 0.44, therefore only one third of the beach is sandy and the rest is gravelly. According to these data and the ESI guidelines by National Oceanic and Atmospheric Administration [NOAA] (2002), Sirolo beach can be classified as rank 5 (mixed beaches). Following the zone subdivision shown in Figure 1E, Sirolo beach can be classified most of the time both as rank 5 and 6A if only the intertidal beach slope is considered (Table 2). If only grain size is considered, Sirolo beach can be classified as rank 5 (mixed beaches) in zone 2 and 3 and as rank 6A (gravel beach – granules and pebbles) in zone 1 giving the absence of sandy samples and therefore a zero sand-gravel ratio (Table 2).
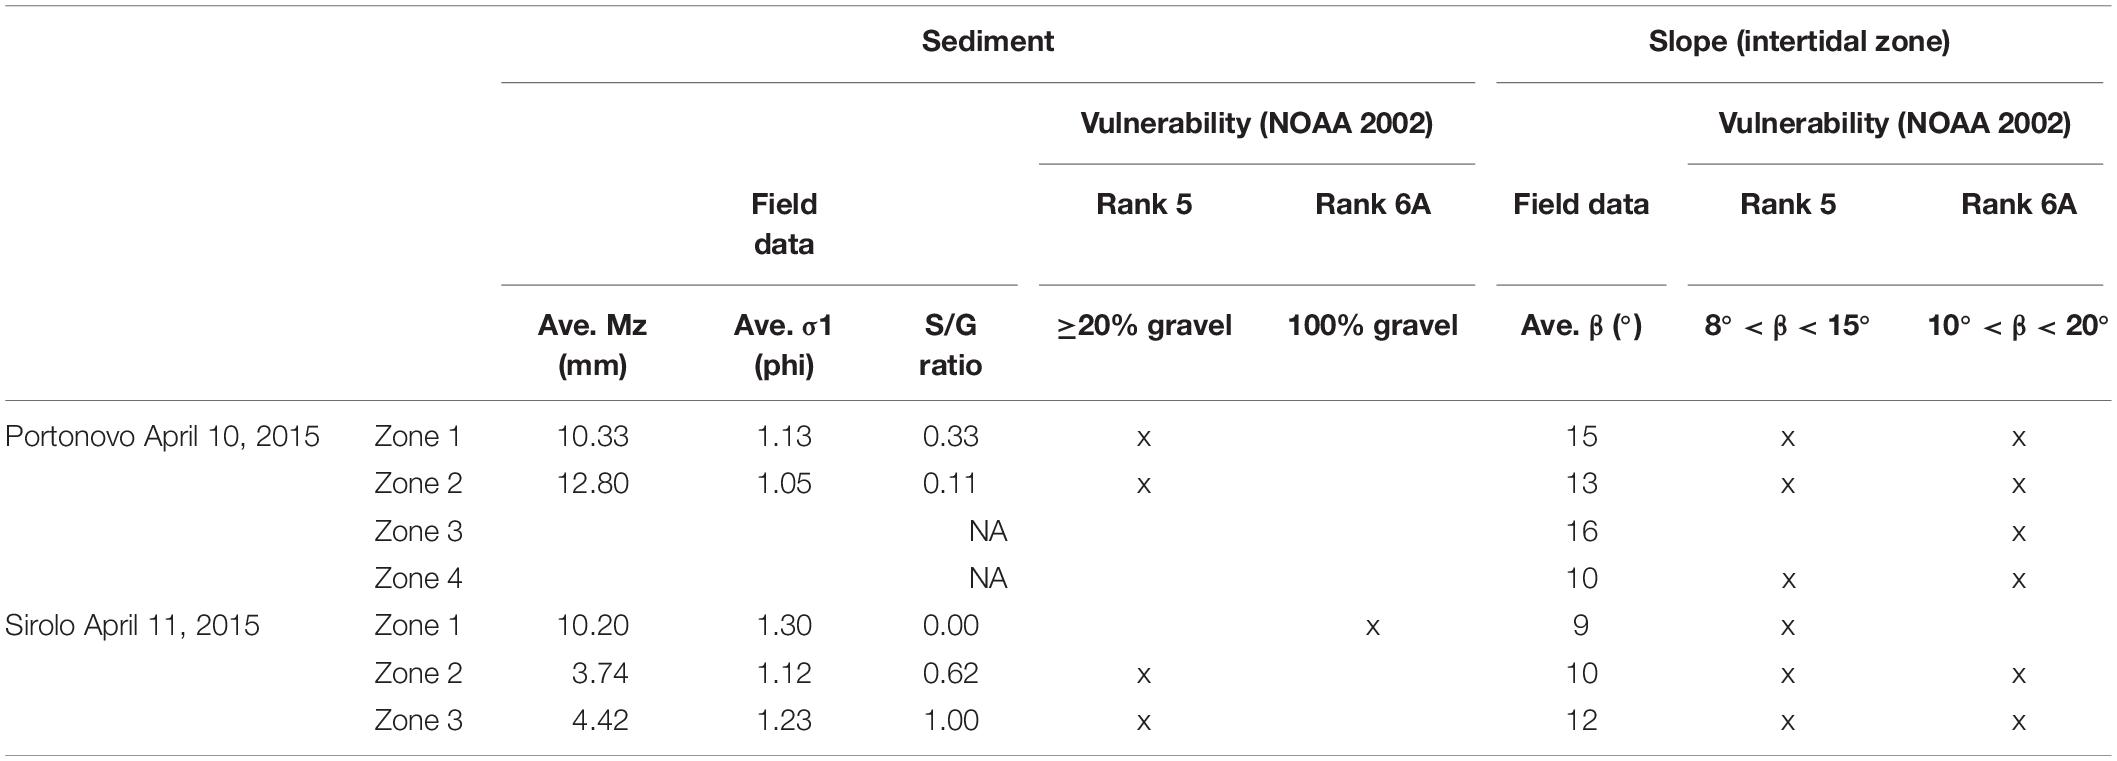
Table 2. The National Oceanic and Atmospheric Administration [NOAA] (2002) classification for Portonovo and Sirolo according to field data of April 2015.
ESI Shoreline Classification From Previous Data (Changing Situation)
According to previous sediment analyses (six samplings over 13 months), Portonovo beach can always be classified as rank 5 (mixed beaches), except for one case relating to zone 1 (the southernmost) in April 2013 (Table 3) when the area was gravelly (rank 6A, gravel beaches made by granules and pebbles). According to previous slope data of the intertidal zone (six surveys over 13 months), Portonovo beach can be classified alternatively as rank 5 or 6A in 50% of cases (Table 3). In 15% of cases, the intertidal beach slope is so high that the vulnerability rank is 6A (gravel beaches – granules and pebbles) whereas in the remaining 35% of cases the beach is ranked as 5 (mixed beaches; Table 3). In Sirolo, where only slope data were available, the beach showed a wider range of vulnerability levels (Table 4). In two surveys (March and October 2012) the central part of the beach is alternatively classifiable as rank 5 or 6A, whereas the southernmost area (zone 3) can be classified as rank 4 (coarse-grained sand beaches) and the northernmost area (zone 1) can be ranked as rank 1C (exposed rocky cliffs with boulder talus base; Table 4). In April 2012 the beach can be basically classified as rank 5 or 6A (Table 4).
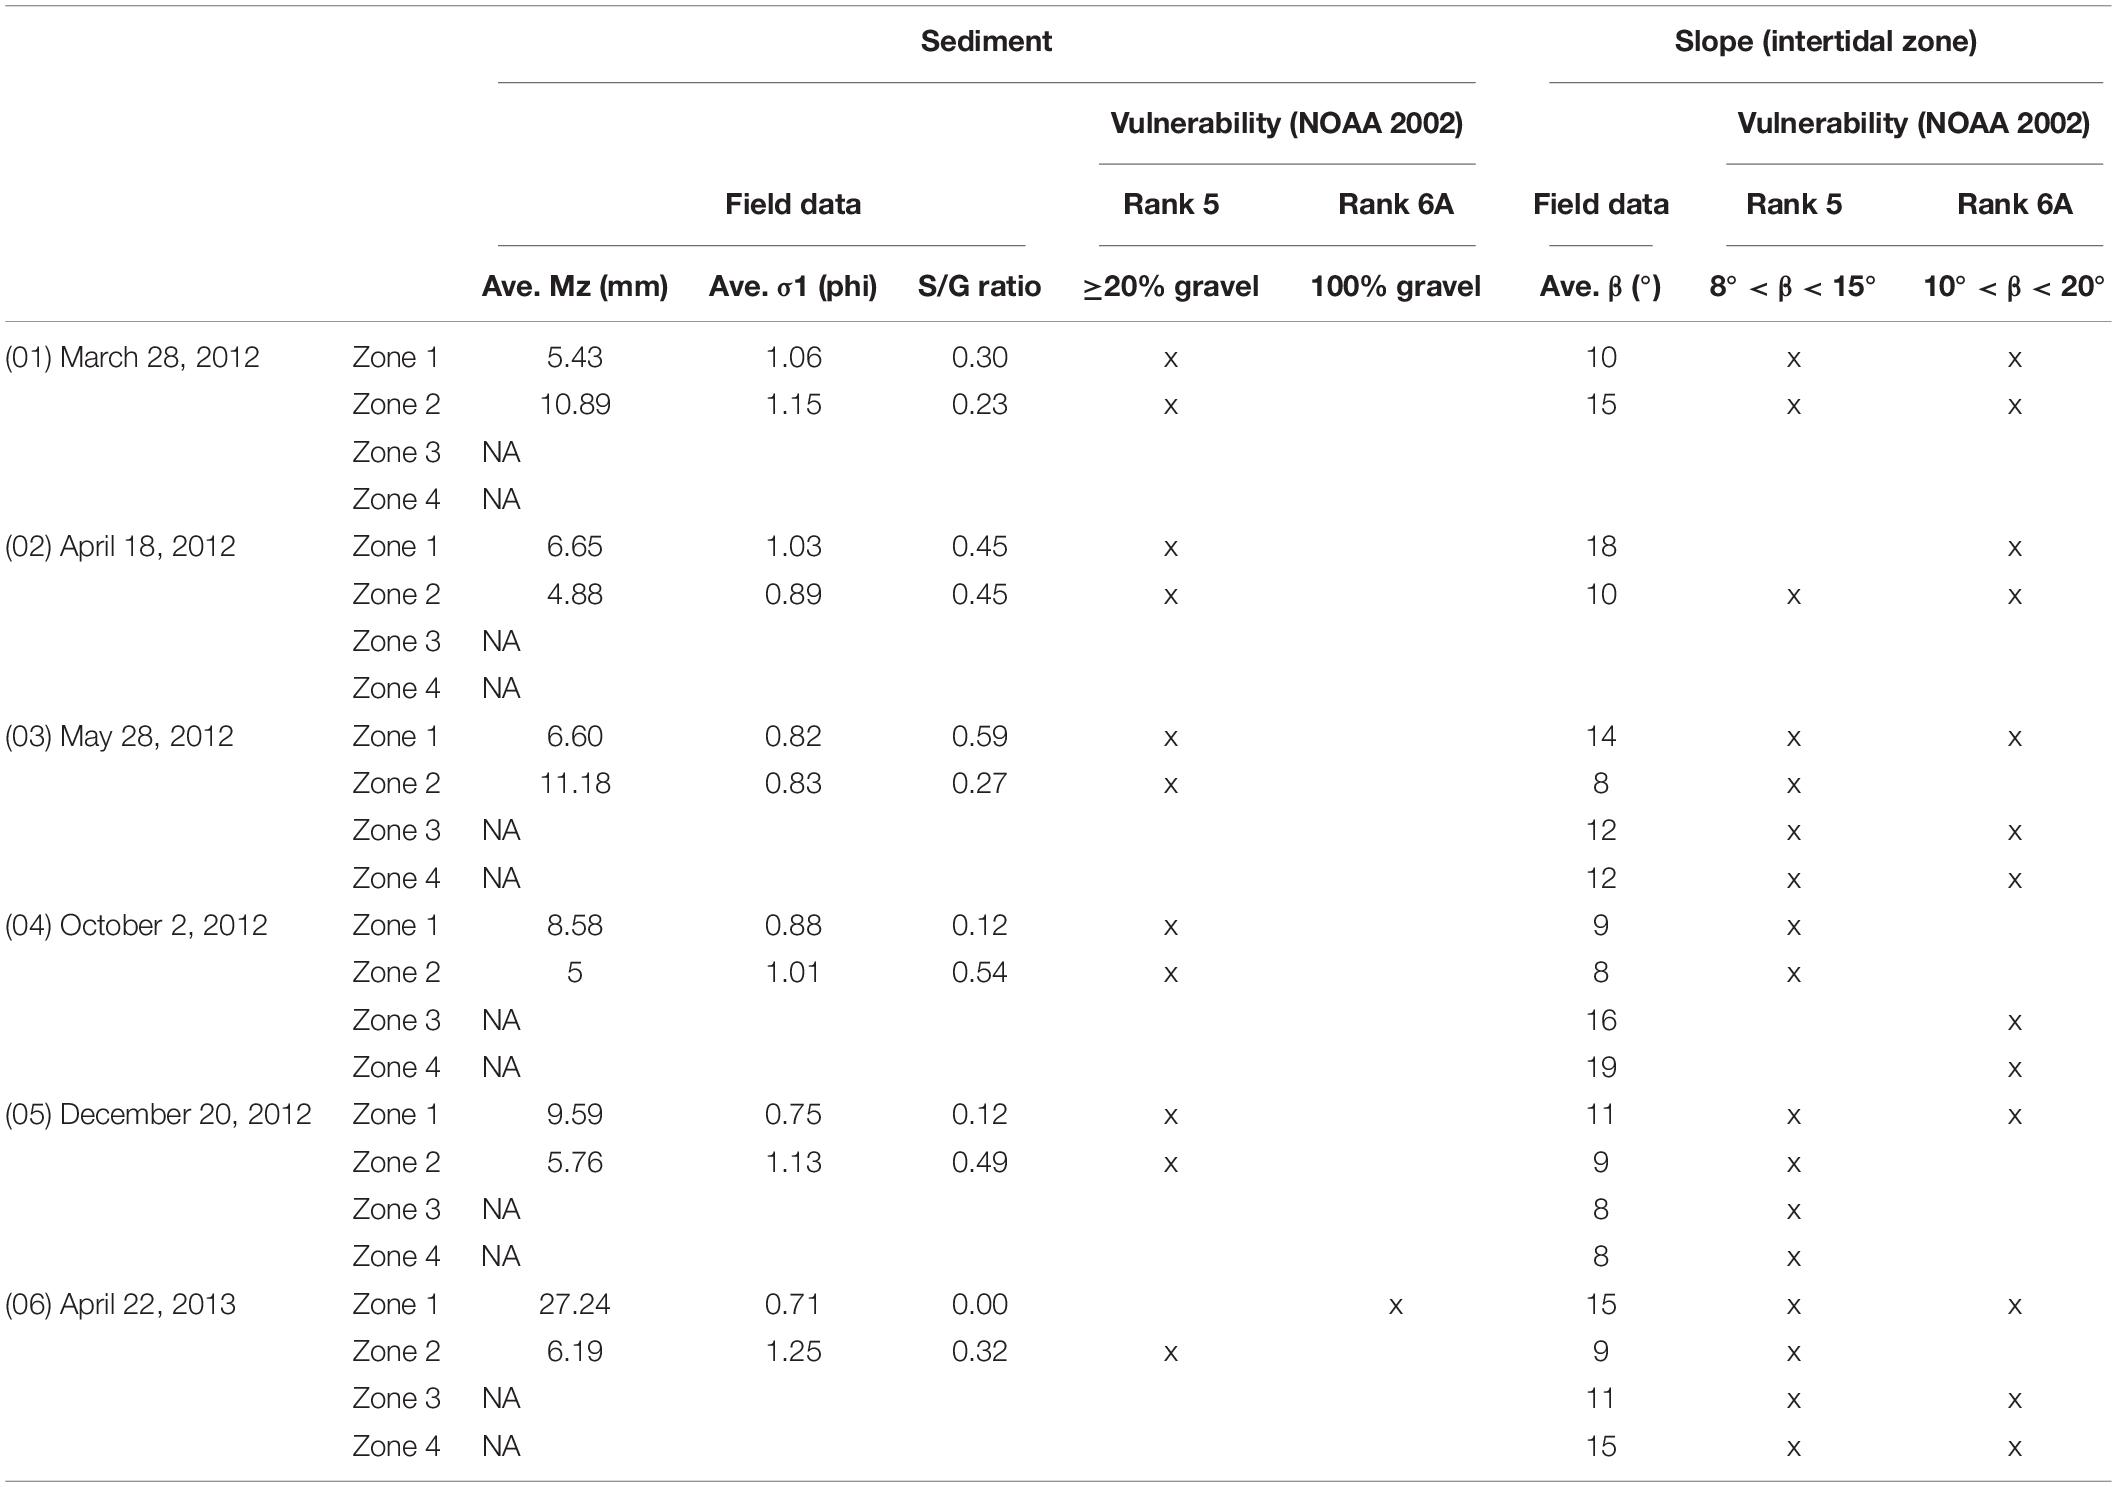
Table 3. The National Oceanic and Atmospheric Administration [NOAA] (2002) classification for Portonovo according to previous sediment and slope datasets.
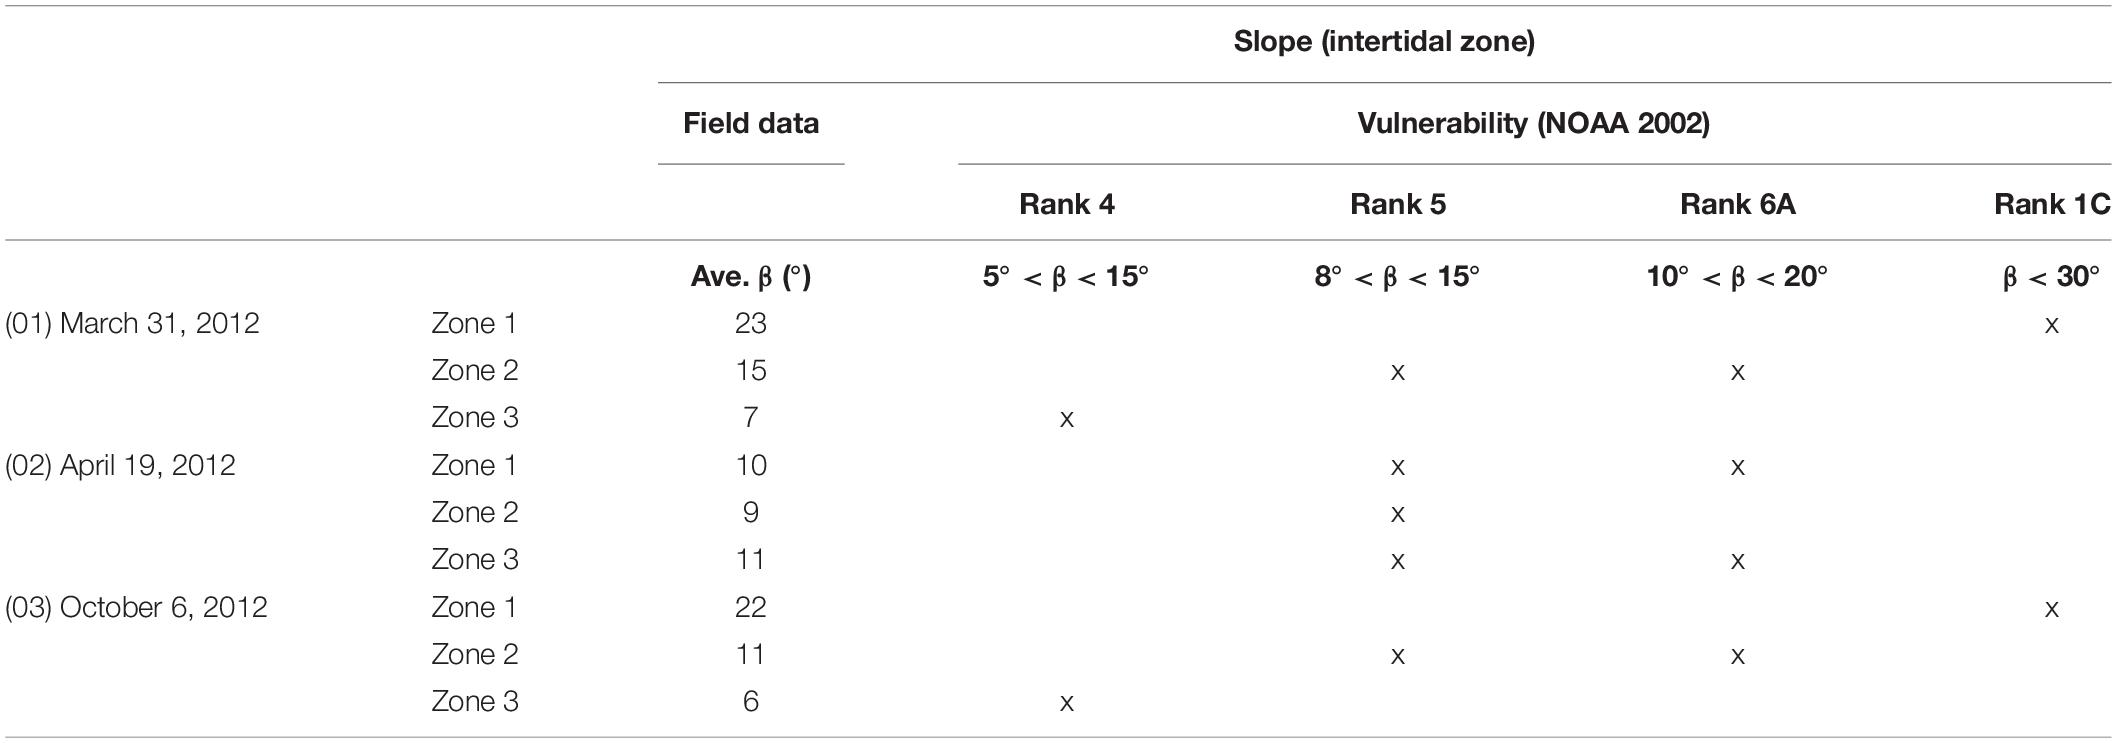
Table 4. The National Oceanic and Atmospheric Administration [NOAA] (2002) classification for Sirolo according to previous slope datasets.
Discussion
Environmental Sensitivity Index guidelines by National Oceanic and Atmospheric Administration [NOAA] (2002) were conceived to rapidly and widely asses the oil spill vulnerability for the large variety of water environments of the United States. The ESI guidelines remain a strong and exhaustive tool to assess oil spill vulnerability not only in the United States since they are also considered valid tools in different coastal environments worldwide (Hanna, 1995; Castanedo et al., 2009; Pincinato et al., 2009; Bello Smith et al., 2011; Aps et al., 2014, 2016) and take part in more comprehensive analyses of oil spill vulnerability (Fattal et al., 2010; Frazão Santos et al., 2013; Romero et al., 2013). The typical publication scale of ESI maps established by National Oceanic and Atmospheric Administration [NOAA] (2002) is 1:50000, which means that Sirolo would barely be represented by 2 cm on the map (Figure 1E), and Portonovo, with its entire length, would be only 1 cm (Figure 1C). Given the large scales adopted by NOAA, in many cases a remote interpretation of beach geomorphology and sediment characteristics is adequate in assessing the ESI rank, but sometimes this may lead to important mistakes like the case of the SHAPE project (see footnote 1), which assessed the two study sites of the present paper as sandy beaches. This is another reason why the geomorphic study presented here can be considered as detailed, and morphodynamic monitoring through time is crucial to correctly assess oil spill vulnerability, particularly on mixed beaches. NOAA is clearly aware of the factors contributing to spatial error in ESI estimation as explained by National Oceanic and Atmospheric Administration [NOAA] (2002). Understanding detailed geomorphic and grain size variability is crucial to correctly assessing the oil spill vulnerability of beaches that are, as a matter of fact, constantly changing landforms. Apart from the pure cartographic output, NOAA provides site-specific information for each rank represented in an ESI map (i.e., National Oceanic and Atmospheric Administration [NOAA], 2007). If more than one ESI rank is ascribable to a coastal site, both shoreline symbols are used [for example a riprap behind a sand beach; National Oceanic and Atmospheric Administration [NOAA] (2002)], but this means that both types of beach coexist at the same time. Some coastal areas can change dramatically with the season and this is the reason why NOAA in the past prepared seasonal summary maps at larger scales (namely 1:250000 to 1:50000; Jensen et al., 1998), but again the detail of geomorphic changes would be missed in beaches like Portonovo or Sirolo. Changes in the grain size and beach topography are particularly impressive on mixed beaches, and as already stated by Kirk (1980), the most complex aspects of mixed beaches relate to sediment characteristics and the way in which processes and sources interact to redistribute the sediments within the beach. Given the dramatic changes that a mixed sand and gravel beach can experience, an exhaustive comprehension of how a beach behaves, at least in the short period, is crucial. Aps et al. (2014) found that an extra factor should be considered by the National Oceanic and Atmospheric Administration [NOAA] (2002) classification, which is the dynamicity of a beach. In a beach of Ruhnu Island (Estonia) they found an increase after 6 years in the ESI rank from 3 to 6 because of the concomitant effect of seasonal storms and sediment deficit that no longer could nourish the beach. The surface sandy layer of the beach was then eroded, transforming it into a gravel beach (Figures 2A1,2). A similar layout was also experienced in Portonovo in only 3 months after the subsequent occurrence of comparable storms from opposite directions (Figures 2B1,2, 6). Thanks to both topographic and sediment data previously available, the four zones of Portonovo have always been ascribable to ESI 5 or 6A, and the grain size factor that better defined the ESI is 5. On the other hand, the wider vulnerability rank ascribable to Sirolo beach is mainly due to the only slope data available from previous surveys; instead, when grain size data are also available (see April 2015; Table 2), a better discrimination of its vulnerability is possible. Bello Smith et al. (2011) highlighted that the National Oceanic and Atmospheric Administration [NOAA] (2002) classification is hardly applicable to microtidal beaches because beach slope is likely overrated if compared to the wider oceanic beaches. The higher sandy fraction and the consequent gentle slope of its intertidal zone are the main reasons to assess Sirolo as ESI 5 in most cases. The least alarming area of Sirolo beach in the case of an oil spill event is the northernmost (zone 1; Figure 1E): here the narrow beach, basically comprised by the cliff and a boulder talus base, could be easily cleaned by the normal swash fluxes and wave energy (as also reported by National Oceanic and Atmospheric Administration [NOAA] (2002) for rank 1C). Unfortunately, the fact that the dataset of the two beaches is not fully comparable forced the authors to formulate their belief mainly on the more complete dataset collected for Portonovo beach. No repeated sediment sampling was undertaken in Sirolo beach as the dataset we used was originally collected for a morphodynamics study. Nevertheless, the slope variability documented for Sirolo beach is still valuable in determining the maximum potential oil depth reachable in this beach.
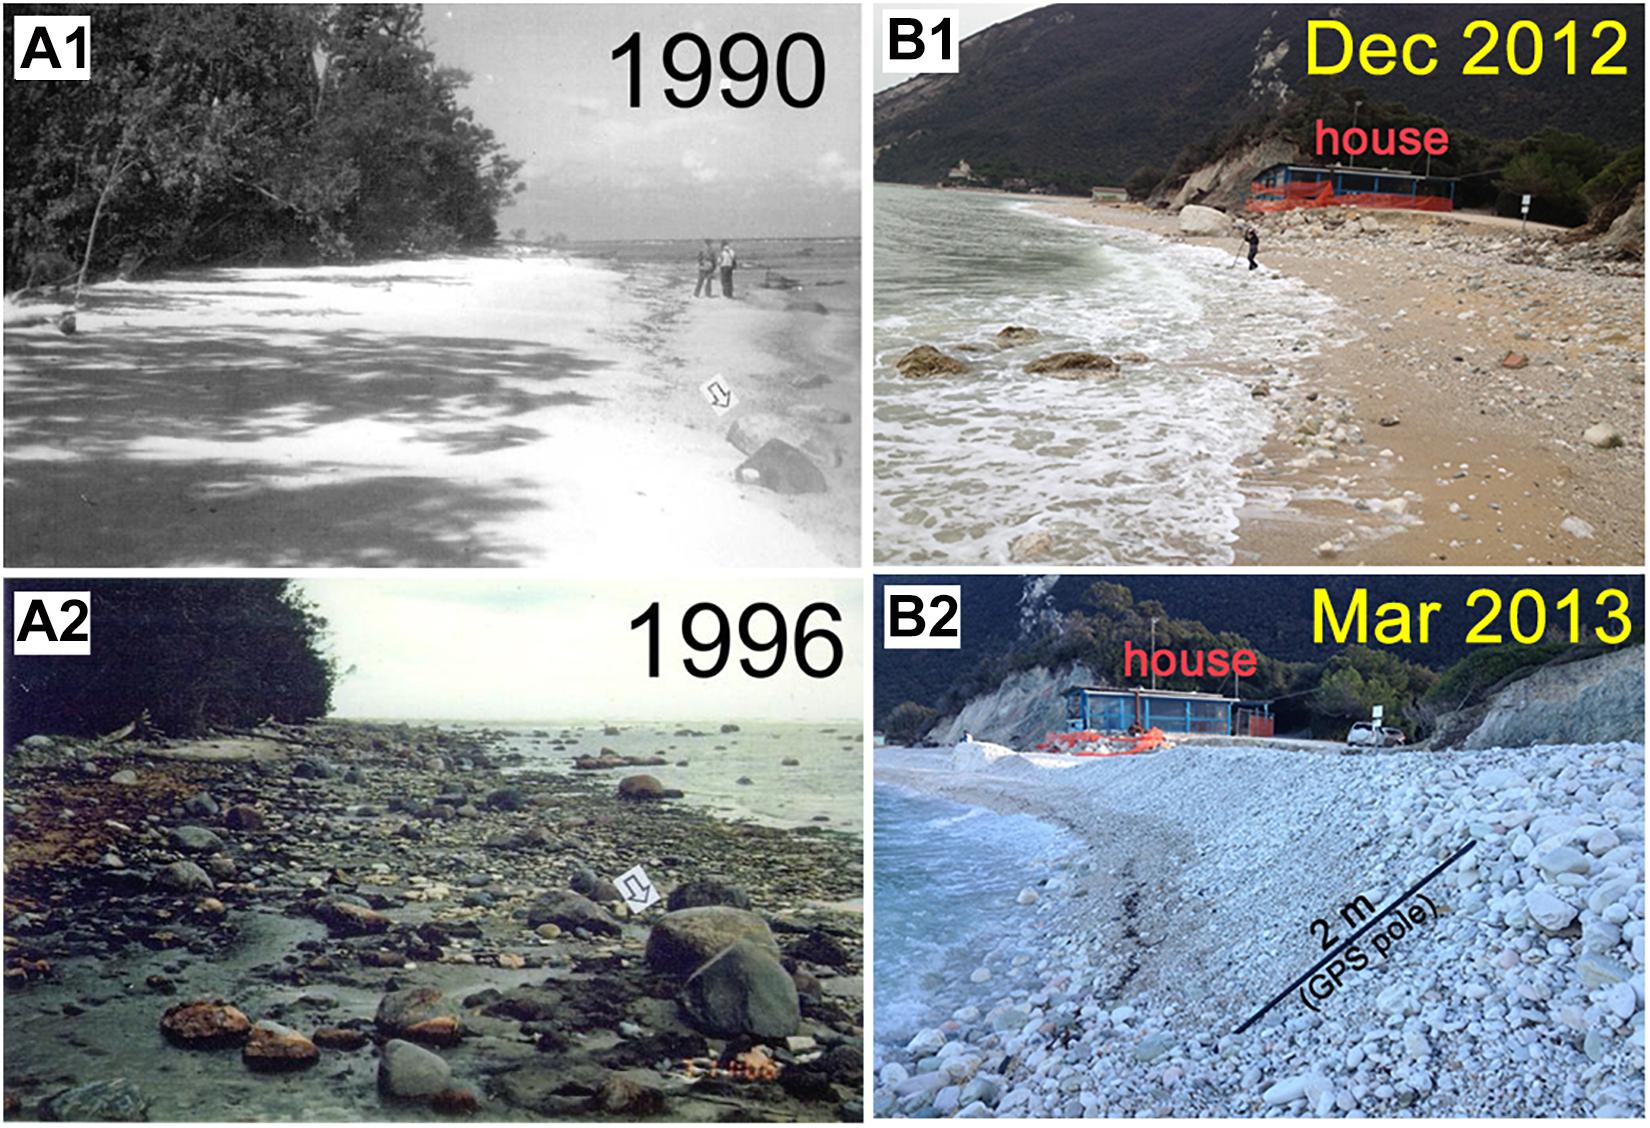
Figure 2. (A1,2) Comparison of the same beach portion of Ruhnu Island (Estonia) after 6 years (modified from Aps et al., 2014) and (B1,2) the same beach portion in Portonovo (zone 4) after 3 months. The beach portion of Portonovo is shown after two storms driven from opposite directions (B1 storm from NE, B2 storm from SE). The high dynamism associated both with burial and the variation of sediment size can be noticed comparing all the frames.
The most important information in the case of an oil spill event is the burial and penetration of oil in the beach body. National Oceanic and Atmospheric Administration [NOAA] (2002) gives some important implications for each ESI regarding burial (or erosion), penetration of oil and sediment mobility (Table 5). Given the mixture of sediments of Sirolo and Portonovo beaches, burial and penetration can be particularly rapid and could easily increase the oil persistence in the beach body, leading to potential long-term biological impacts and making cleanup procedures much more difficult and intrusive (National Oceanic and Atmospheric Administration [NOAA], 2002). As showed in Table 5, many indications given by National Oceanic and Atmospheric Administration [NOAA] (2002) are only general or qualitative, and this makes sense from their point of view given the wide application of the ESI classification. An opportunity for improvement is a quantification of the maximum potential depth, which is reachable by the oil, but this implies the collection and the analysis of site-specific data.
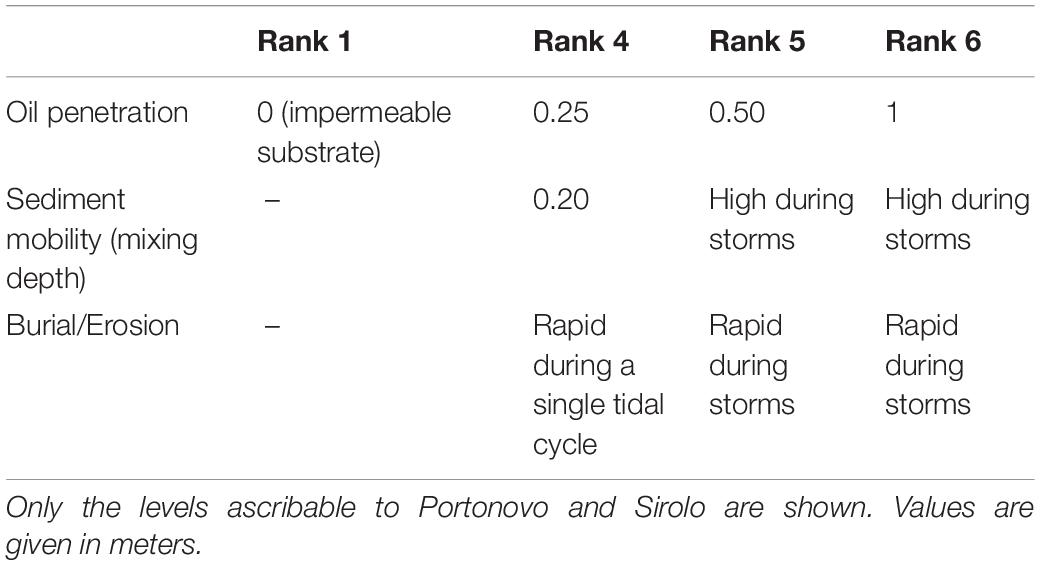
Table 5. Vertical extents of oil penetration, sediment mobility, and burial (or erosion) of the different vulnerability levels according to ESI guidelines by National Oceanic and Atmospheric Administration [NOAA] (2002).
Given its predominant gravelly fraction, Portonovo is constantly affected by rapid burial (Figures 2B1,2), which can be led not only by severe storms as already documented by Grottoli et al. (2017), who analyzed the storm response of the beach with a typical wave climate for the area. The high dynamicity of Portonovo was also experienced with low energy conditions which generated 0.5 m of burial due to the formation of the fair-weather berm in the intertidal zone (Grottoli et al., 2019). Nevertheless, storm berms represent the most dangerous geomorphic factors in the case of an oil spill event that reaches the beach. In Portonovo, the highest storm berms were always observed after storms coming from the SE (“Scirocco” wind; Figure 3). Due to its orientation (NW–SE), the beach is largely exposed to incident storm waves coming both from the SE and NE, but SE waves, due to the smaller accommodation space of zones 3 and 4 (Figure 3), can pile up larger sediments (pebbles and cobbles) in storm berms from 1 to 3 m high (Figures 3B,D,F). In sites like Portonovo (Figures 3, 4) the beach limits are crucial, not only in confining the water circulation in the case of an oil spill (González et al., 2009) but, primarily, for increasing the chances of significant burial in case of severe storms (i.e., Hs of 3.5–5 m, an approximate energy of 600–800 m2h and at least 30 h of storm conditions; Grottoli et al., 2017). The strong downdrift coarsening of sediments in accordance with the storm direction was already experienced by Carr et al. (1970) in Chesil Beach (United Kingdom). In Portonovo, when a severe storm approaches from the SE, the southern part of the beach (zone 1 and 2; Figure 4) is affected by erosive scarps of the same vertical extent of the storm berms that form in the northern part (zone 3 and 4; Figure 4). In Sirolo, where only a few datasets were available, it is not possible to clearly quantify burial (or erosion) extents, but it is likely that the larger accommodation space prevents the creation of storm berms and erosive scarps of the same size of Portonovo (Figure 5). The encouraging aspect of pocket beaches like Sirolo and Portonovo, where the tide is not an important factor, is that beach rotation, due to the bimodal direction of storms (NE and SE, Figure 6), represents the main factor responsible for beach recovery (Harley et al., 2014; Grottoli et al., 2017). Burial processes on mixed beaches were already explained by Hayes et al. (1991), highlighting the dangerous concomitance of storm berm deposition, beach rotation and downdrift coarsening of sediments after a storm event. In Portonovo, storm berms are very close to the shoreline, with their seaward steep side often joined to the beachface (Figures 3C,E,G): therefore, the burial generated by storm berms has to be taken into serious consideration in the case of an oil spill event since the contaminant is expected to penetrate the beach body from the beachface, which could be rapidly buried if severe storm waves are approaching the beach. As suggested by Quick and Dyksterhuis (1994), storm berm formation on highly permeable beaches is mainly due to wave breaking [typically by plunging on this type of beaches, Grottoli et al. (2019)], which produces a net onshore shear stress over the swash and backwash cycle, leading to net onshore transport and profile steepening as experienced in Portonovo (Figure 3). Moreover, the hydraulic conductivity, related to the coarse sediment size of the beach, is directly responsible for the steep profile (Mason and Coates, 2001) and should be an aspect that still needs further consideration on mixed sand and gravel beaches. Since in the case of an oil spill event, the oil would primarily reach the intertidal zone, another aspect that has to be taken into consideration is the typical mixing depth of the site. The mixing depth in the intertidal zone of Portonovo was already tested in the field by Grottoli et al. (2015) as 0.25–0.3 m (experienced with ordinary waves, namely Hs of 0.3–0.4 m). In Sirolo, mixing depth was derived using the experimental formulas of Ciavola et al. (1997) and Ferreira et al. (2000), specifically developed for steep and coarse sandy beaches. Those formulas, computed for the intertidal zone of Sirolo, with a typical Hs of 0.5 m, returned mixing depth values of 0.13–0.16 m (Table 6).
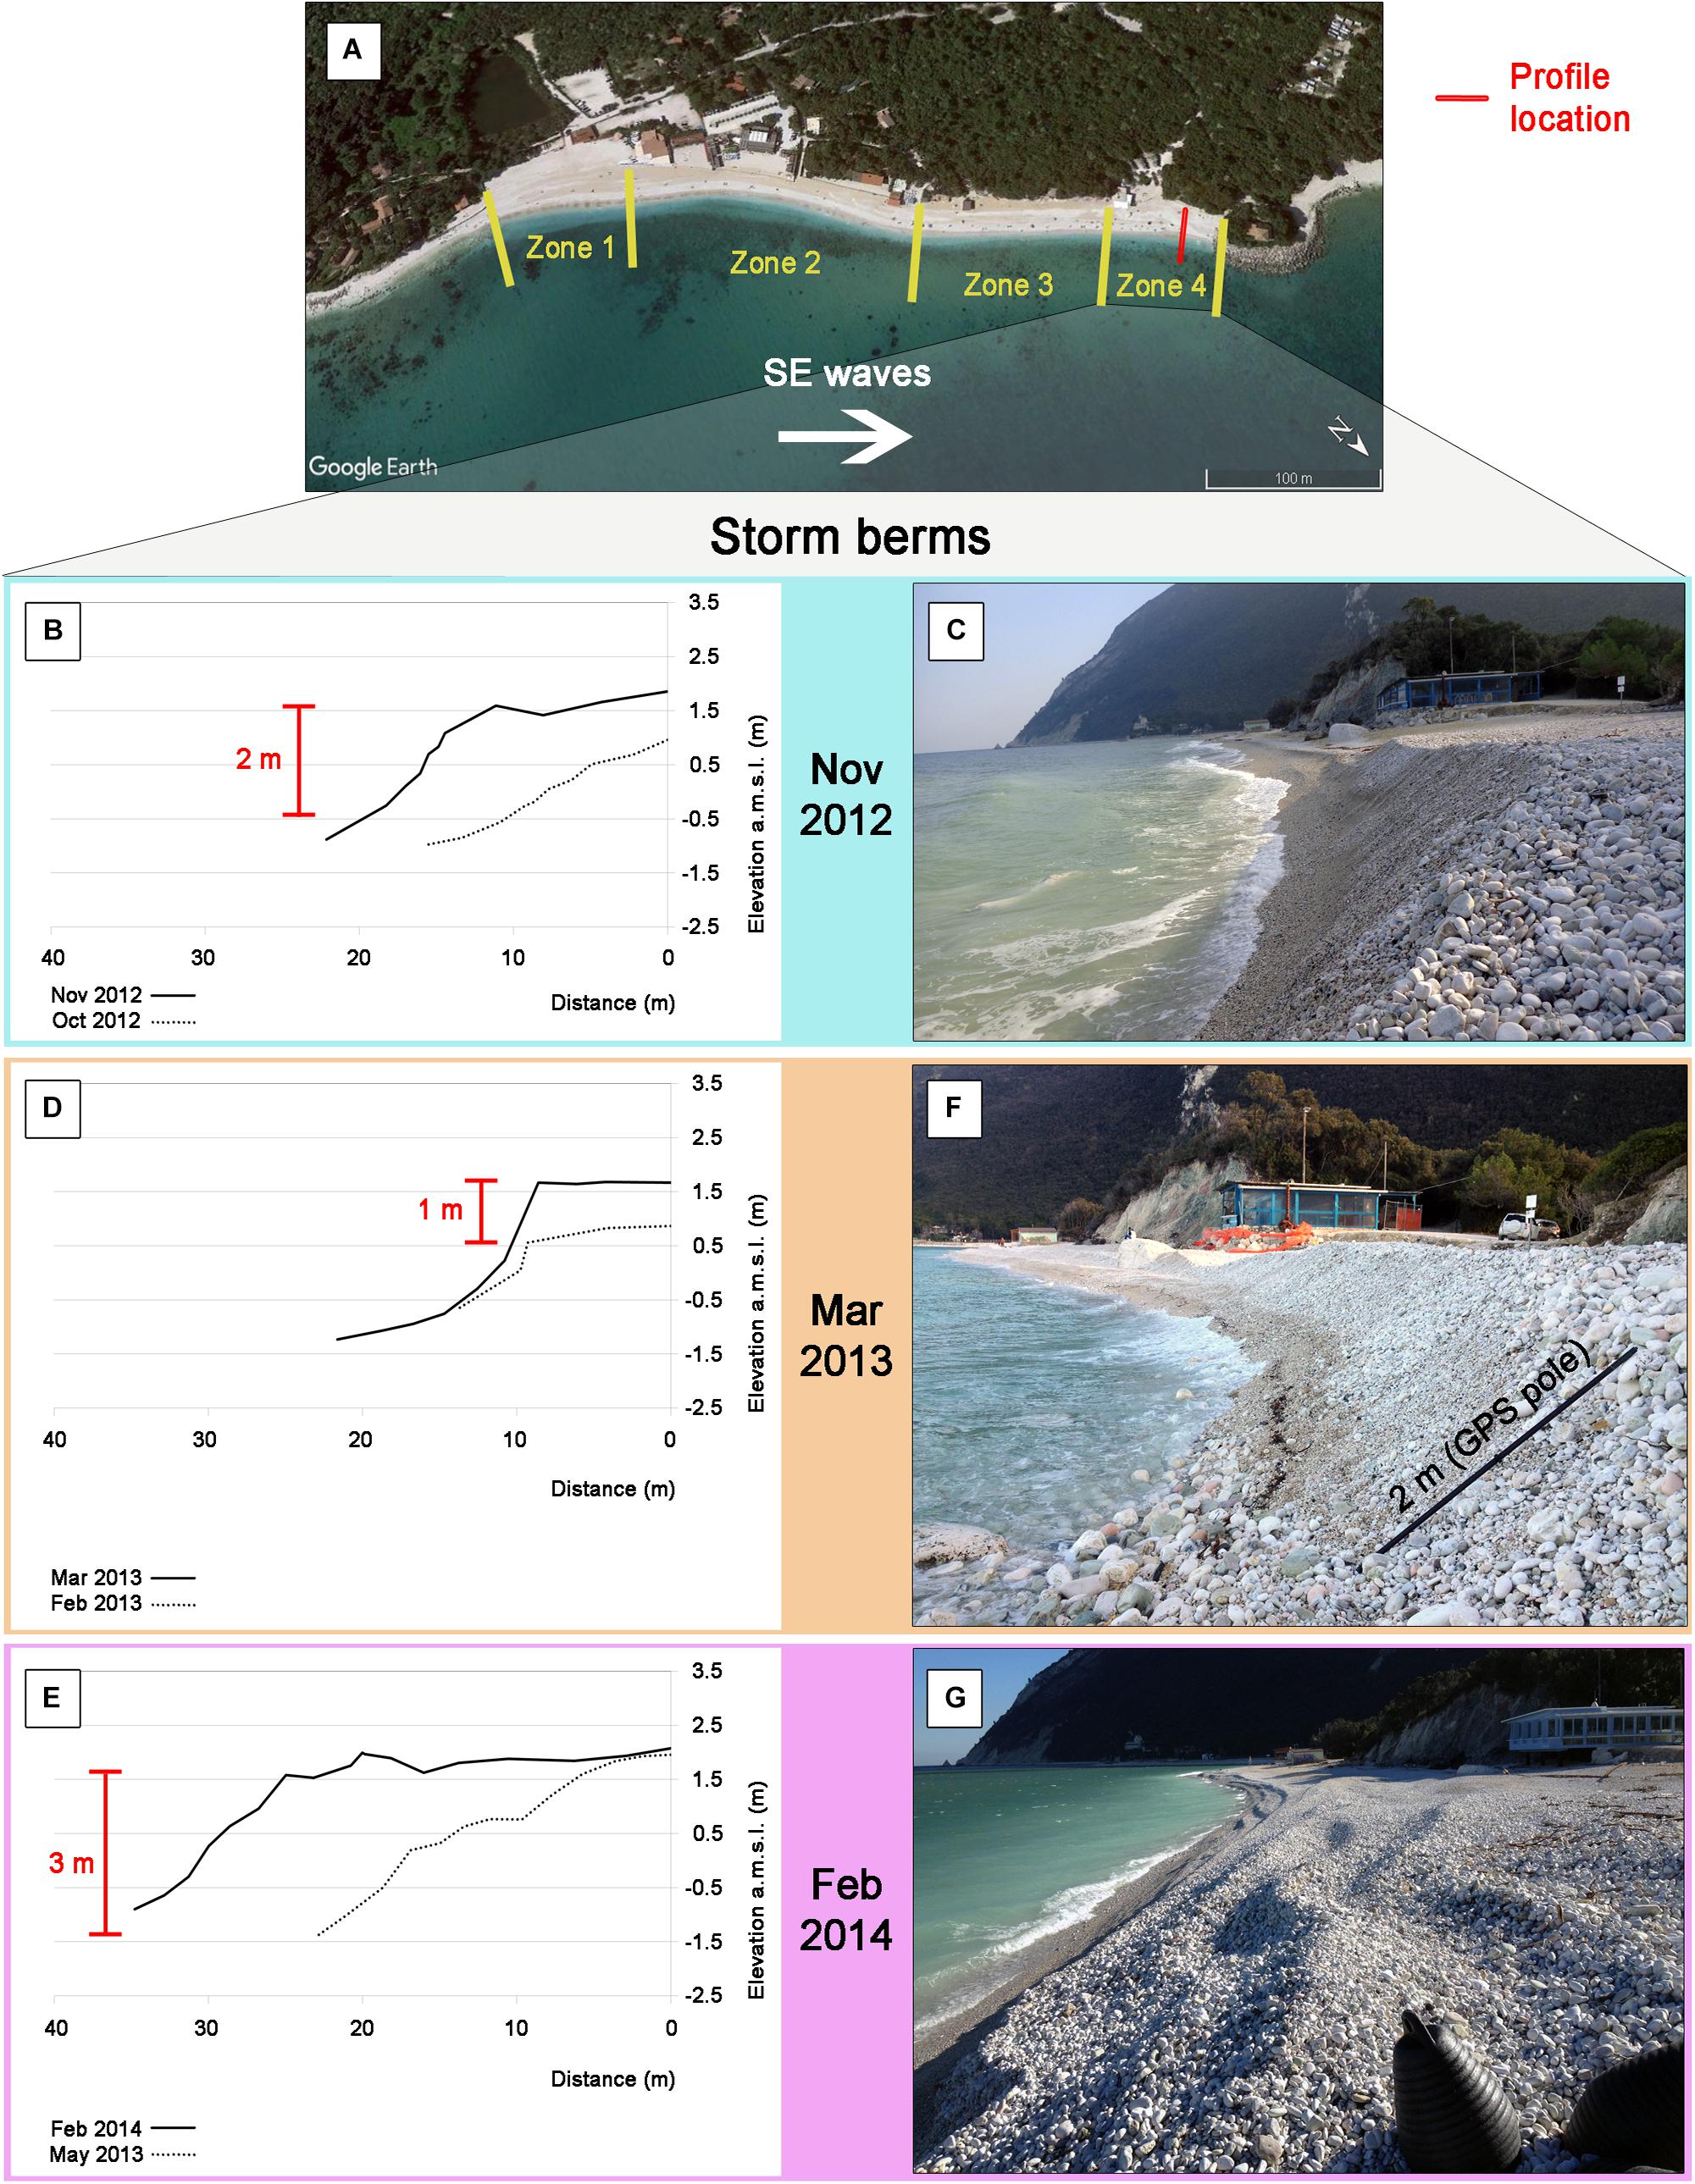
Figure 3. View of the same beach portion of Portonovo (zone 4) after three different storms coming from the SE: (A) zone subdivision and focus on zone 4; (B) beach topography of November 2012 compared to the previous data available and (C) photo of the beach surface of November 2012; (D) beach topography of March 2013 compared to the previous data available and (E) photo of the beach surface of March 2013; (F) beach topography of February 2014 compared to the previous data available and (G) photo of the beach surface of February 2014.
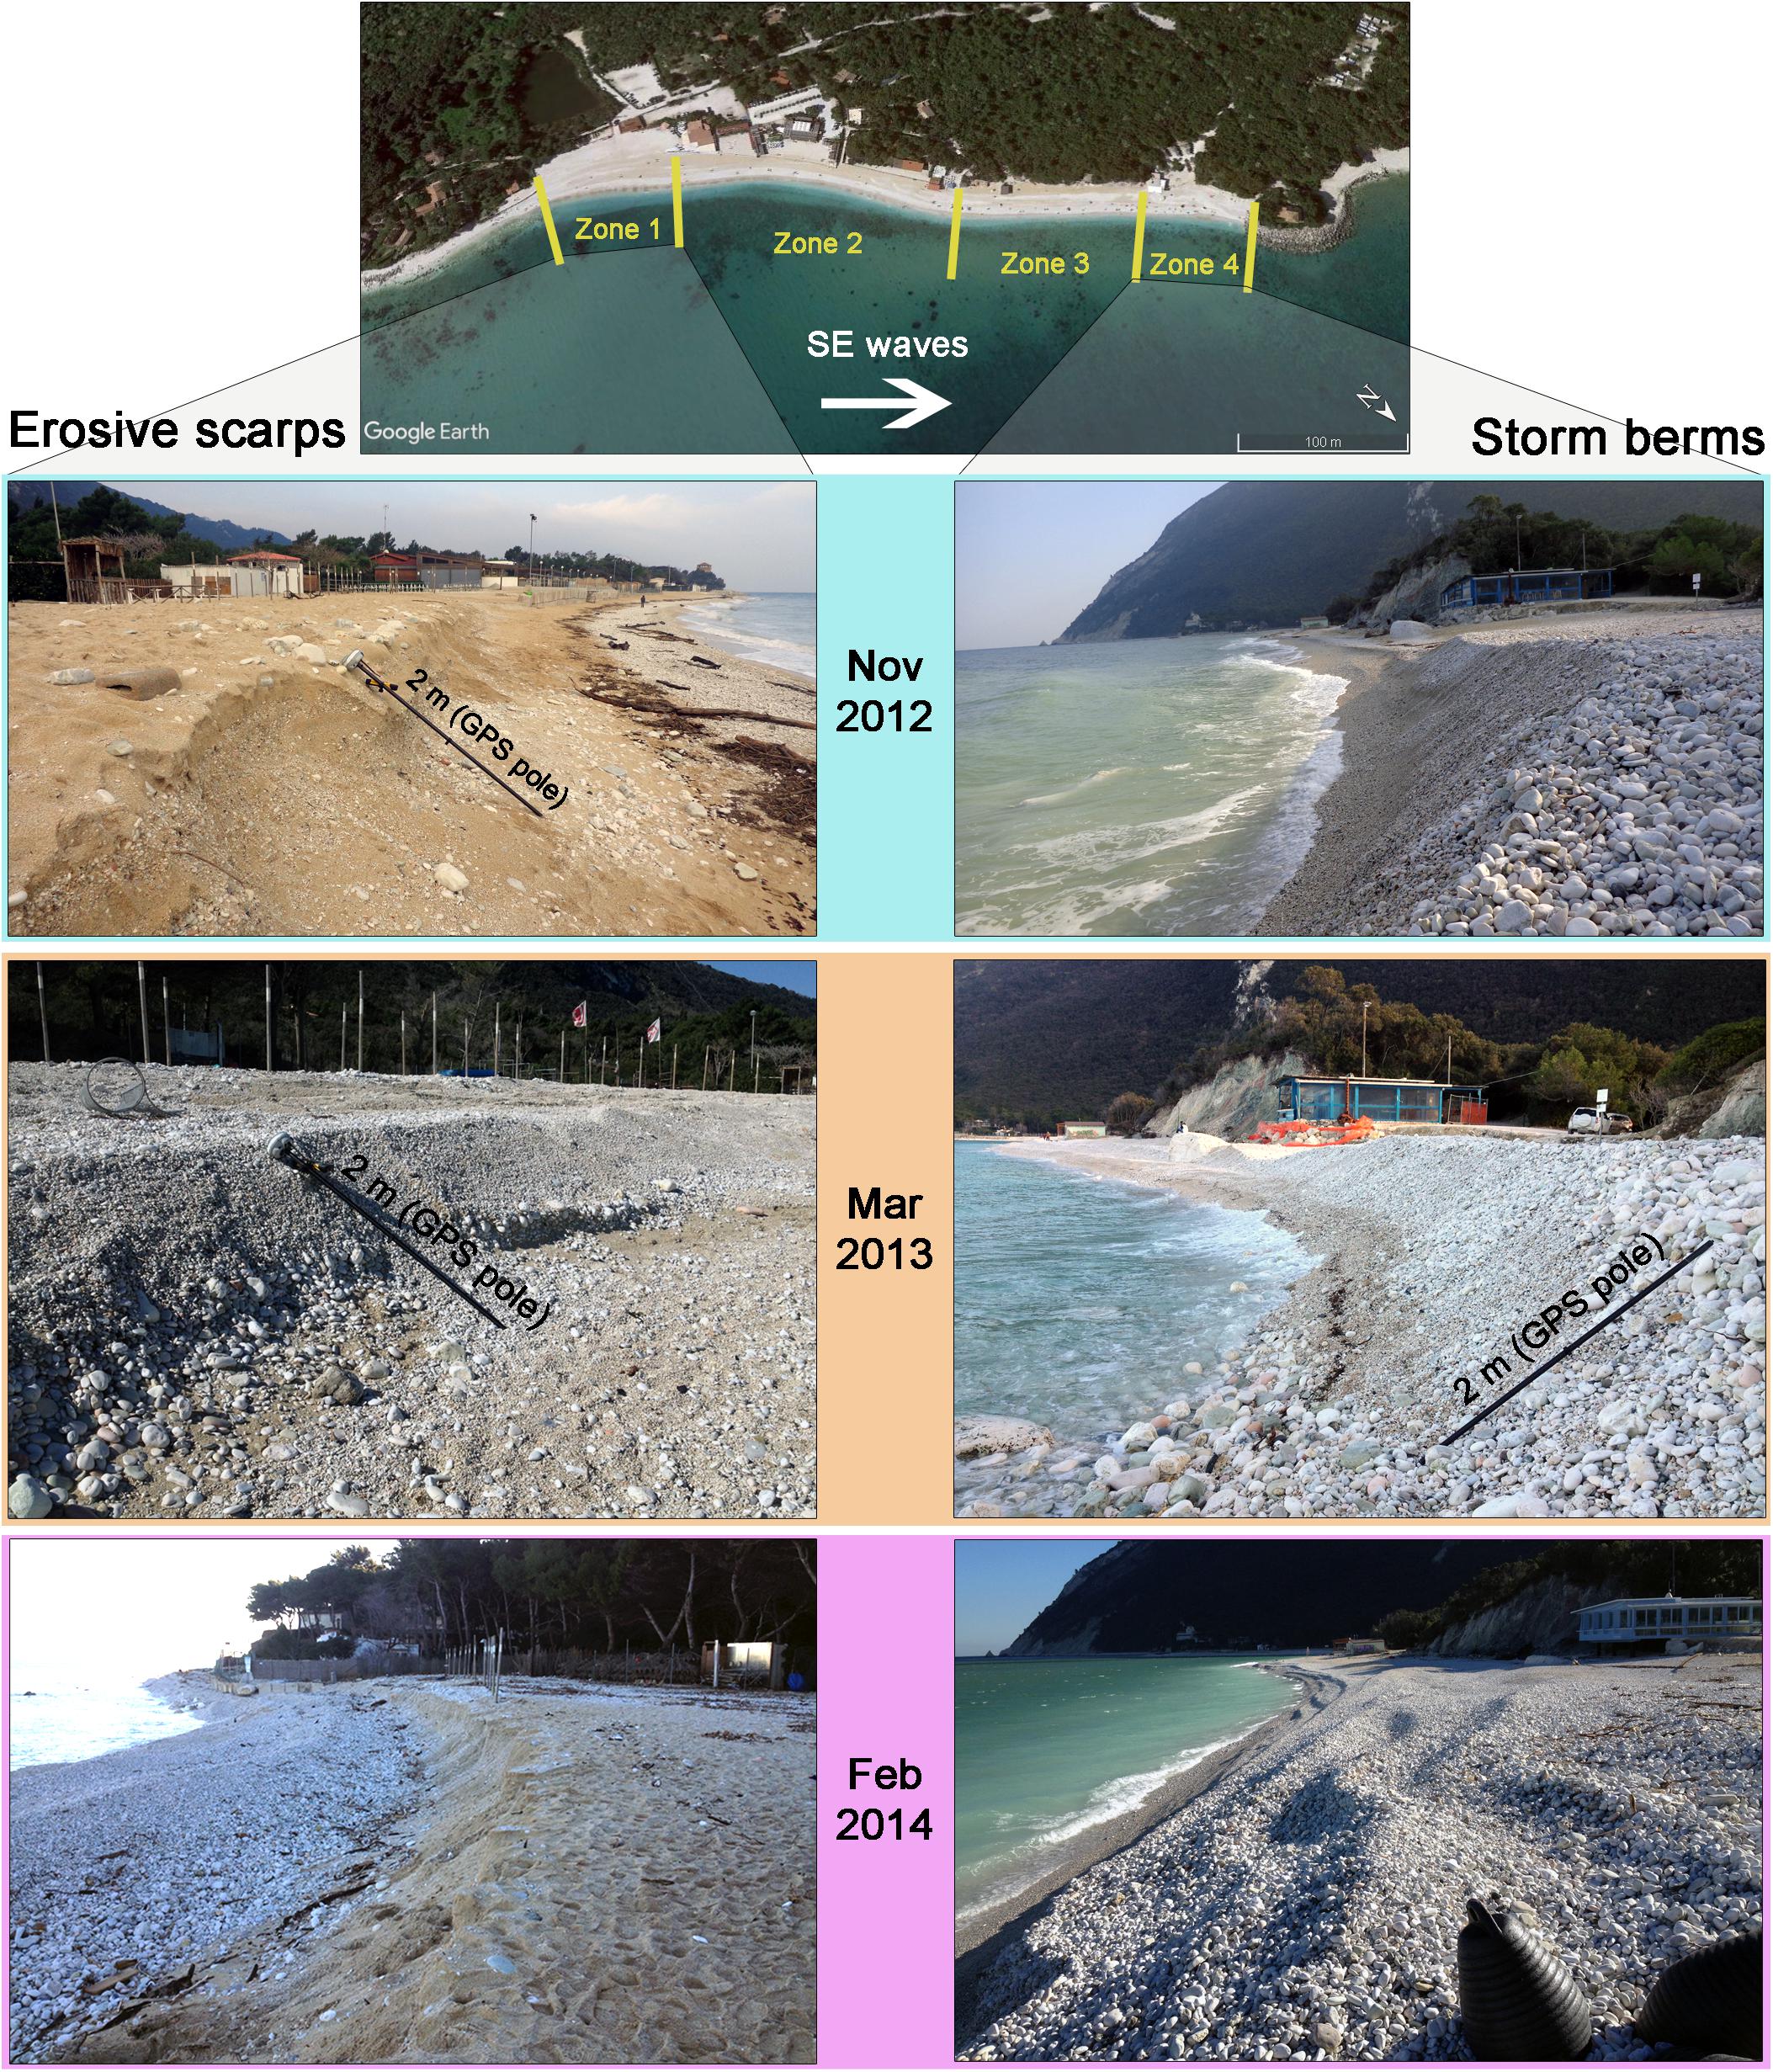
Figure 4. Erosive scarps (on the left) and storm berms (on the right) from the edge zones of Portonovo beach after storm events from SE direction.
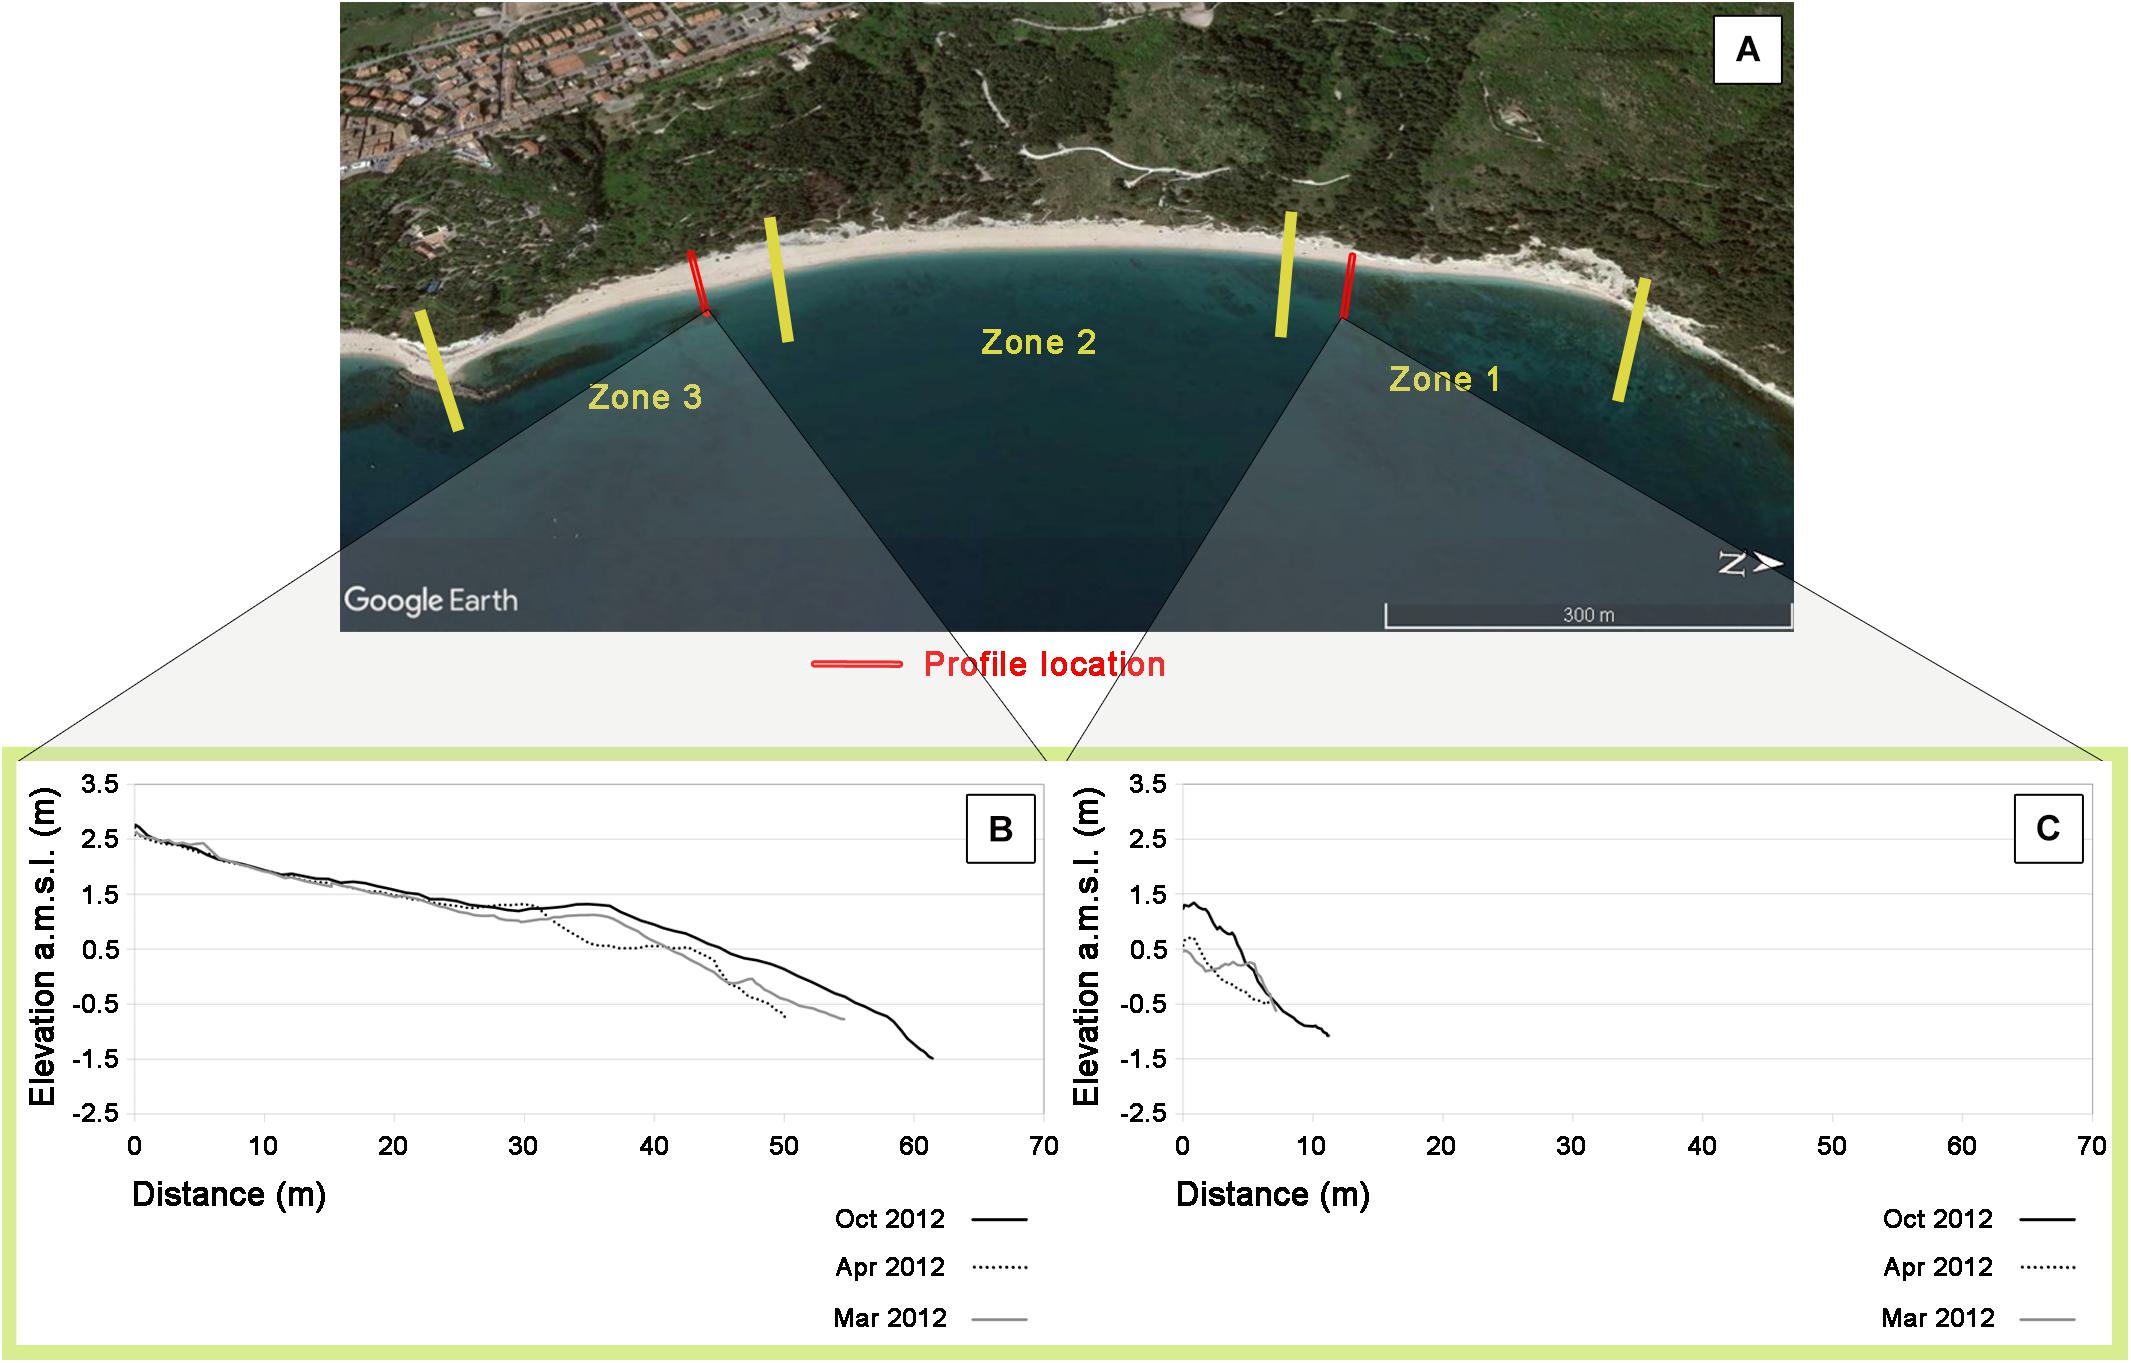
Figure 5. Profile variation at the edge zones of Sirolo beach between March and October 2012: (A) zone subdivision and profile location; (B) profile variation in zone 3; (C) profile variation in zone 1. Profiles have been chosen according to the larger topographic variation visible.
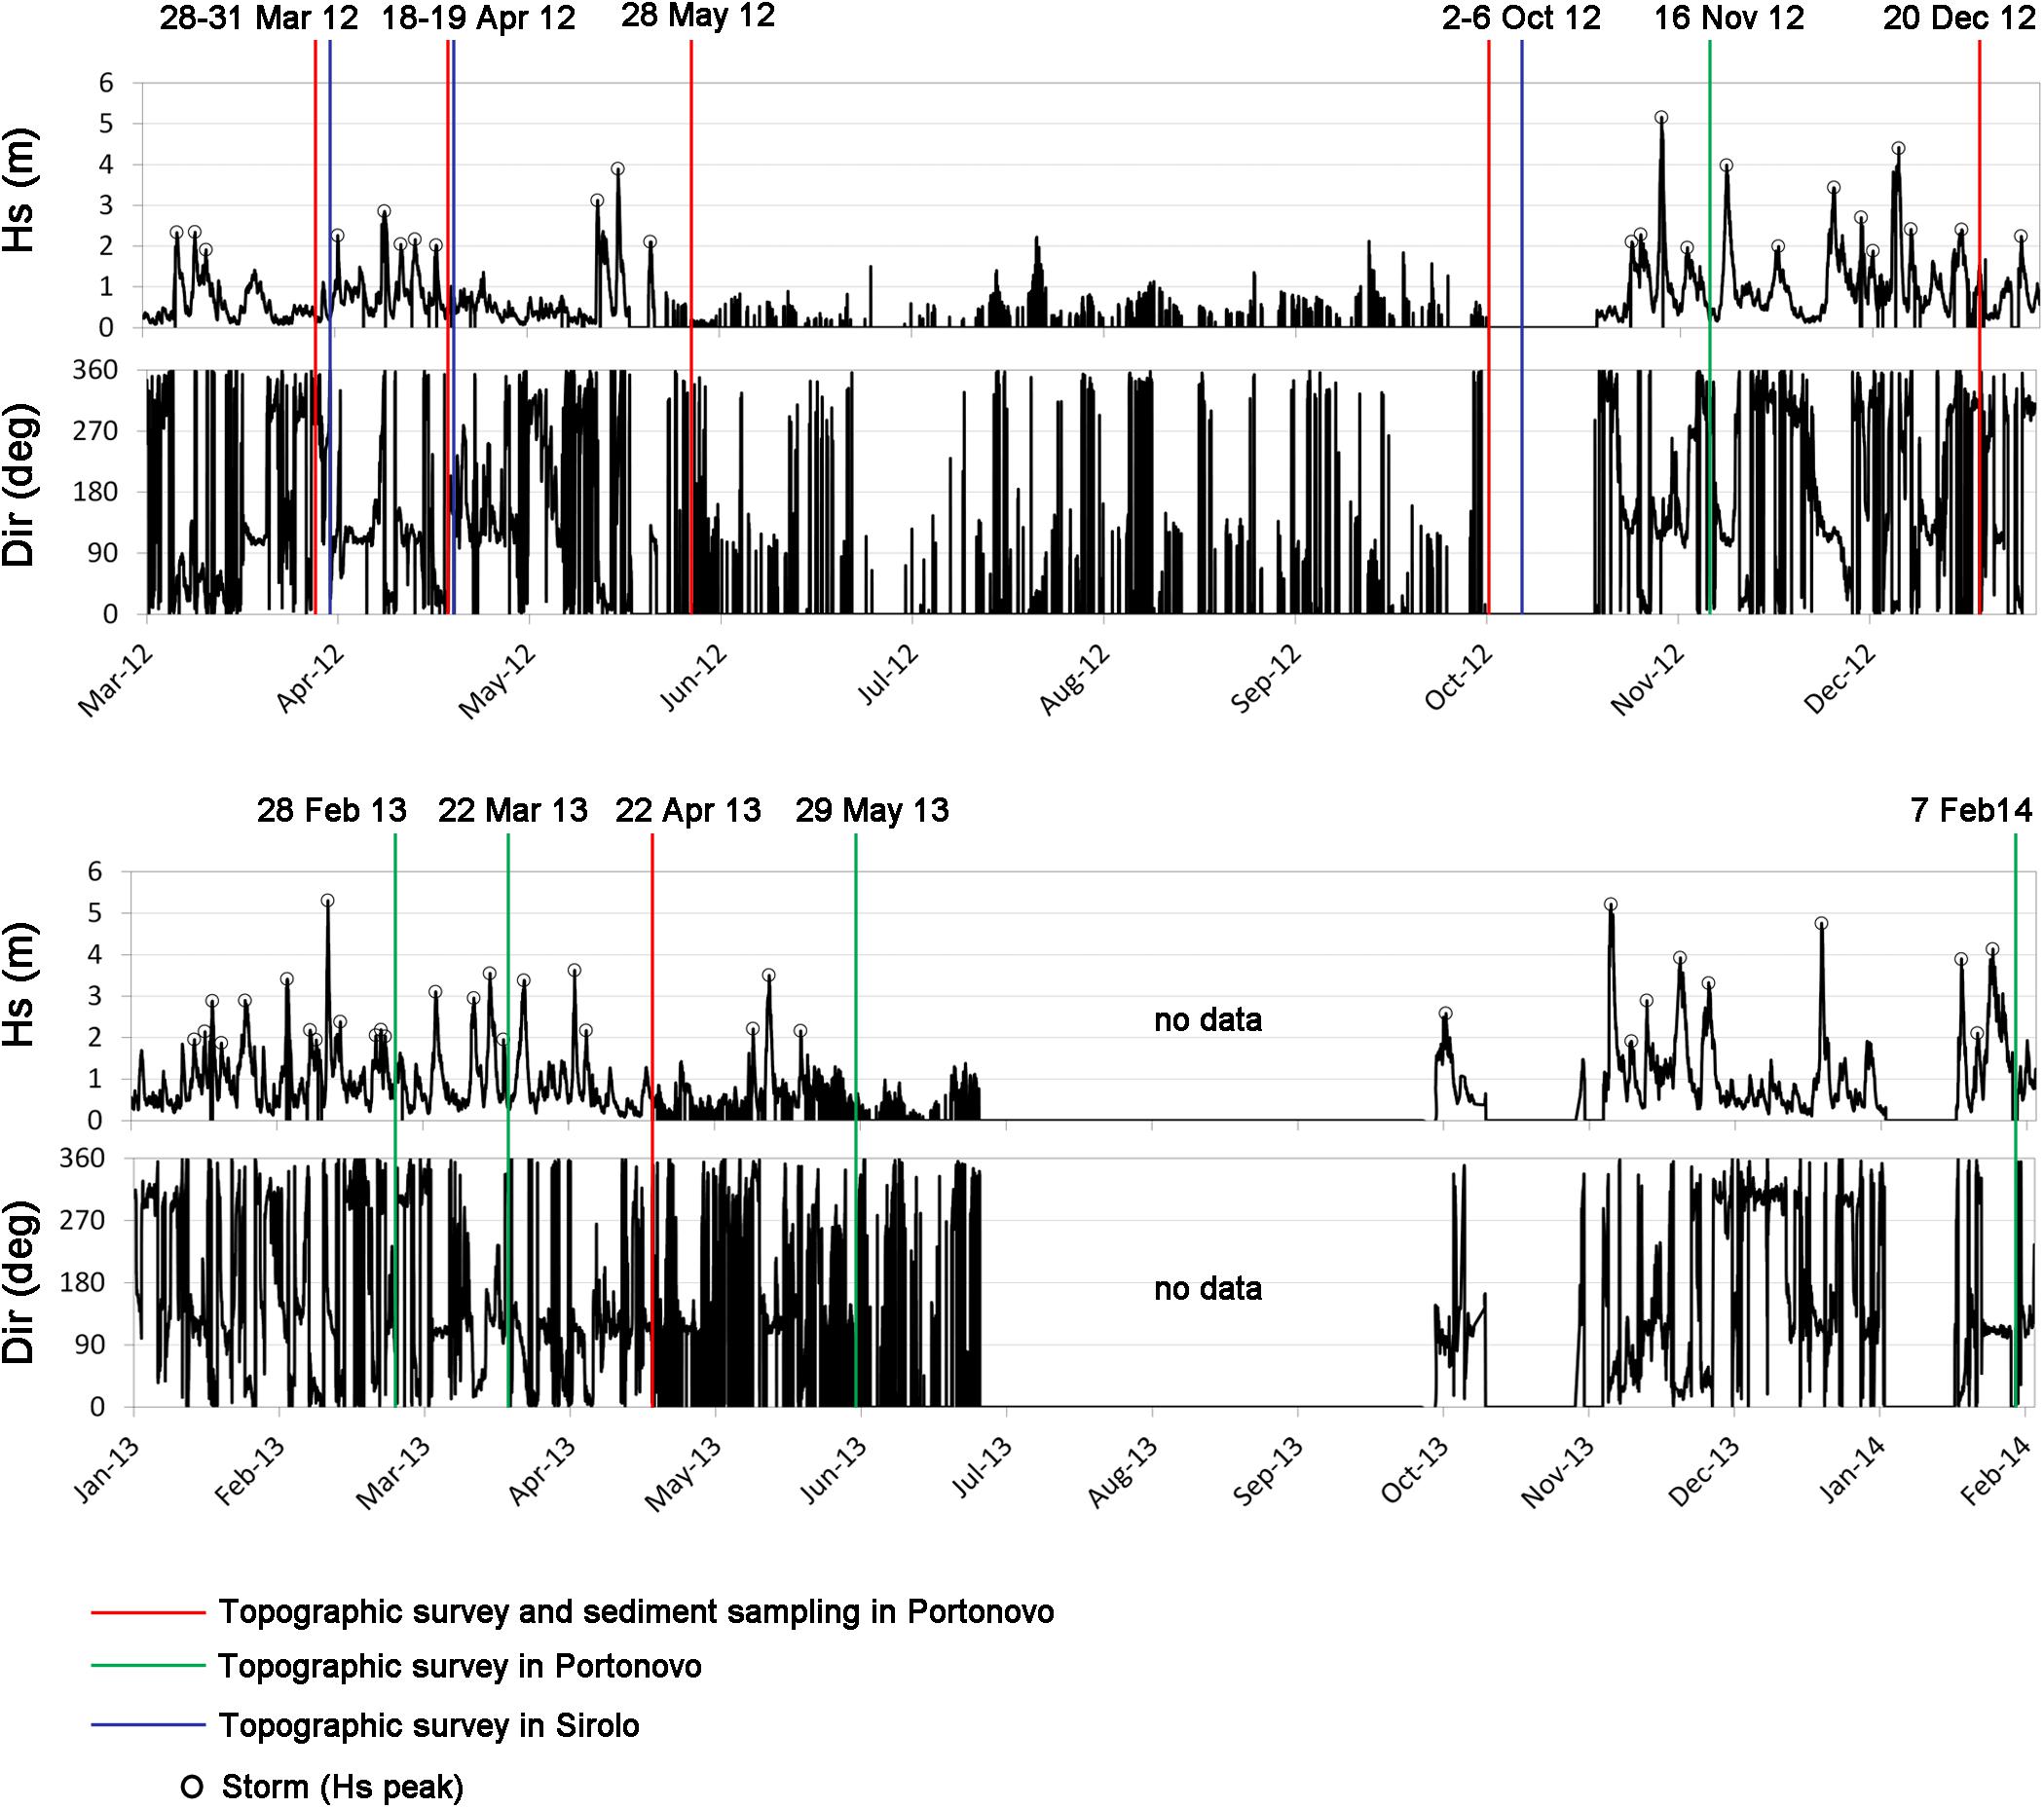
Figure 6. Wave dataset from March 2012 to February 2014. The topographic surveys and sampling are also marked for both beaches.
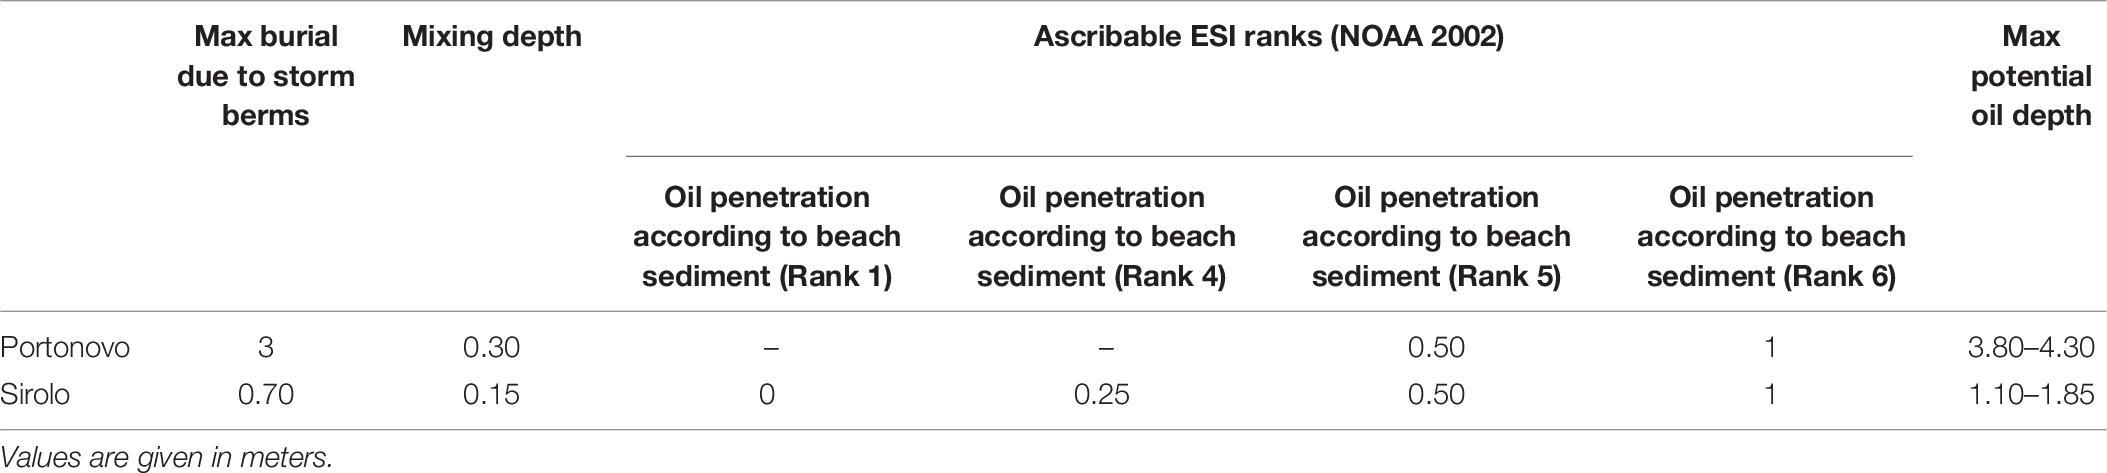
Table 6. Estimation of the max potential depth that oil can reach in the case of an oil spill event in Portonovo and Sirolo.
Hence, in the worst-case scenario, represented by the deposition of oil on the beach immediately before a storm event (or a cluster of storms), the three factors that can increase the maximum depth reachable by the oil are: (i) the maximum burial due to storm berm formation (Figure 3); (ii) the typically large mixing depth, and (iii) the expected oil penetration related to the sediment characteristics of the beach at the oil deposition point (according to National Oceanic and Atmospheric Administration [NOAA], 2002). These three factors can be concomitant if the oil is stranded on the beach immediately before a storm (or a cluster of storms) and if summed, they give a maximum potential depth of 3.80–4.30 m in Portonovo and 1.10–1.85 m in Sirolo (Table 6).
Comparable burial rates were recorded by González et al. (2009) in sandy macro-tidal beaches of Galicia (Spain): oil was found at depths of 2–3 m 2 years after a big oil spill event. Similar burial depths (1.5 m) were also expected in the sandy meso-tidal beaches of New Zealand (de Lange et al., 2016). Prompt cleaning operations after the oil spill led to a complete cleaning after 1 year from the incident with the help of natural oil degradation (de Lange et al., 2016). Oil was buried under storm berms of 1.2 m in the gravel beach of Prince William Sound (Alaska; Hayes et al., 1991). In coarse grained beaches (ESI 5 and 6) oil could persist within the beach body for years (Gundlach and Hayes, 1978; Hanna, 1995; National Oceanic and Atmospheric Administration [NOAA], 2002); therefore, a better understanding of the internal structure and sediment variability under the beach surface is particularly needed. A valid tool is Ground Penetration Radar (GPR), which has already been used to detect oil layers down to a depth of 0.5 m from the beach surface by Lorenzo et al. (2009) in Galicia (Spain). The same oil depth was documented by Michel and Hayes (1993) 3.5 years after the Exxon Valdez oil spill of 1989 in some gravel beaches of Prince William Sound (PWS) in Alaska. Another aspect to better investigate is the actual penetration and persistence of oil: Li and Boufadel (2010) proposed a valid model for tidal gravel beaches based on an internal structure made by two layers, with the lower layer characterized by low permeability and therefore being able to entrap oil for years, as happened to the gravel beach of PWS after the Exxon Valdez oil spill (Hayes and Michel, 1999). According to Nixon and Michel (2018), these oil residues are typically located in finer-grained sand and gravel sediments, often under an armor of cobble- or boulder-sized clasts, in areas with limited groundwater flow and porosity. According to Nixon et al. (2013) the oil persistence, nearly 20 years after the Exxon Valdez oil spill on the intermittently exposed gravel beaches, is due to a complex interaction between small-scale geomorphic features (e.g., armoring) that proved shelter from the local incident wave energy. They documented subsurface oiled layers down to an average burial depth between 13.6 and 18.6 cm.
Mixed sand and gravel beaches in microtidal environments which experience huge variability like Portonovo and Sirolo need more attention since the amount of sediment that can bury the oil is more significant due to the formation of storm berms right behind the narrow intertidal zone. After the Deepwater Horizon spill, which was the largest marine oil spill in United States waters affecting hundreds of kilometers of shorelines (Zengel et al., 2015, 2016), the geomorphic state of the beach was recognized as one of the most important issues during the response operations to the spill (Michel et al., 2013); during the initial heavy oiling many beaches of the Gulf of Mexico were in an erosional state, and this led to oil burial in the following months as the beaches accreted. Michel et al. (2013) documented that the oil was stranded high in the supratidal zone due to high water levels and wave activity generated by storms in 2010 and that the oil stranded in the intertidal zone was buried at a location of more than 1 m due to the effect of the largest storms in the area (i.e., Tropical Storm Lee and Hurricane Isaac, in May 2010 and January 2013). The case of the Deepwater Horizon spill, where the effects of oil persistence were still documented 3 years after the spill (Michel et al., 2014; Zengel et al., 2015, 2016), represents an example where the knowledge of the vertical variation of the beach surface would be crucial in performing the different oil treatment techniques and reducing challenges to its removal. The continued remobilization of oil buried in both intertidal and nearshore zones resulted in the chronic re-oiling of beaches, even though at trace levels, for over 3 years (Michel et al., 2013, 2014). This suggests that beaches showing high dynamicity should be investigated from a geomorphic point of view for a few years consecutively before a representative beach state can be chosen for vulnerability evaluations.
Recommendations on How Incorporate the Dynamic Nature of the Beach Environment in the ESI Assessment
As demonstrated by this paper, impressive vertical variations of the beach surface together with sediment size changes can be experienced on mixed beaches in both limited time and space. This natural process, primarily induced by storms, can largely affect the cleaning operations of an oiled beach and has in the generation of storm berms the most dangerous factor. As already accomplished for the biological aspect of the ESI assessment, where the appendix entitled “Biological resources” lists in detail the monthly occurrence and the period of nesting, eggs, pupping, etc., of each species (National Oceanic and Atmospheric Administration [NOAA], 2007), an extra detailed appendix, entitled “Geomorphic characteristics,” could be added in the ESI map. During the “Ground verification” phase within the field measurements undertaken by geologists for the ESI assessment (National Oceanic and Atmospheric Administration [NOAA], 2002), surface sediment samplings and GPS cross-shore measurements should be included. These data should be gathered seasonally or at least twice per year during the period that lasts until the next scheduled ESI update, which is usually 5–7 years later. After this period, it would be possible to understand how the beach responds to storms and what potential depth could be reached by the oil according to the wave climate and the geomorphic features developed (e.g., storm berms) on the site. As shown in Table 6, an analog table could be created for each ESI map concerning the expected site-specific values of: (i) the maximum burial due to storm berm formation between one survey to another; (ii) the typical mixing depth of the site; and (iii) the oil penetration according to the sediment characteristics of the beach (according to National Oceanic and Atmospheric Administration [NOAA], 2002). These values, if summed, return the maximum potential depth that could be reached by the oil in the worst-case, namely the occurrence of a storm (or a cluster of storms) in the immediate aftermath of the oil deposition. Due to financial and logistic difficulties which may arise in obtaining these data, at least a ground verification survey should be repeated twice per year (at the beginning and at the end of the storm season) and within a single time span between two ESI updates (usually 5–7 years). Considering the huge shoreline extent that needs to be mapped and in order to have a satisfying spatial resolution, a geomorphic assessment every 500 m should be performed, and a zone subdivision of the shoreline could be conceived. After one single assessment period (5–7 years), a good estimation of the maximum potential burial of oil could be obtained for each zone. The assessment does not need to be repeated unless drastic environmental variations occur, such as construction of protection structures or beach replenishments. This detailed geomorphic assessment could be undertaken only on those beaches that are known to be highly dynamic, and it could largely improve the expectations of the authorities in charge of cleaning operations [e.g., the Shoreline Cleanup Assessment Technique (SCAT) Program; Owens and Teal (1990), Owens and Sergy (2000)] on how deep the oil could be found under the beach surface after a storm period. Unfortunately, this information is often site-specific due to a local combination of factors that may affect the oil fate along the shoreline (Michel et al., 2013); therefore, a geomorphic database for each ESI map could represent a relevant benefit as demonstrated by the GIS database built after the Deepwater Horizon for the Gulf of Mexico (Nixon et al., 2016).
Conclusion
Due to their large variety of grain sizes and the high dynamicity of their landforms, the opportunity to better assess the oil spill vulnerability of coastal environments from a geomorphic point of view could only arise from mixed sand and gravel beaches.
Both Portonovo and Sirolo can be classified as ESI 5 (mixed sand and gravel beaches) or 6A (gravel beaches), with Sirolo equally classifiable among the two ESIs for most of the time and Portonovo with a prevalent trend toward ESI 5, thanks to the more exhaustive sediment dataset from previous field measurements. Grain size is the most determinant factor in assessing the oil spill vulnerability according to ESI guidelines when both slope and sediment size are available.
The high geomorphic variability on the two sites is mainly related to storm berms due to the bimodal direction of storms. Storm berms demonstrate that rapid burial processes can occur on both beaches, with a potential maximum burial of 3.80–4.30 m in Portonovo in the northernmost edge of the beach and 1.10–1.85 m in the edges of Sirolo beach. The different burial magnitude of the two sites is mainly ascribable to smaller accommodation space for sediment transport of Portonovo beach because of its landward and cross-shore physical barriers, which increase the vertical accumulation of gravelly sediments in proximity to the shoreline. The maximum potential oil depth, predominantly related to storm berms, is the most alarming factor to be considered in the case of an oil spill event, especially in dynamic microtidal beaches where storm berms are usually very close to the shoreline. A better interpretation of the internal structure of mixed sand and gravel beaches is also needed to understand how sediment variability affects oil penetration and persistence. The National Oceanic and Atmospheric Administration [NOAA] (2002) classification, conceived for oceanic beaches of the United States, could be improved with the addition of a morphodynamics factor that could account for significant short-term and site-specific variations in terms of sediments and geomorphic features. In this sense, a quantification of the vertical variation of the beach surface by means of repeated and consequent field measurements is needed, and this aspect should be included in ESI maps as an appendix as already happens for the biological characteristics.
Data Availability
All datasets generated for this study are included in the manuscript and/or the supplementary files.
Author Contributions
PC and EG conceptualized the work. EG conducted the field work, laboratory analyses, and data curation, and wrote the original manuscript. PC reviewed and supervised the manuscript.
Conflict of Interest Statement
The authors declare that the research was conducted in the absence of any commercial or financial relationships that could be construed as a potential conflict of interest.
Acknowledgments
A previous version of this research work was presented at the Sixth International Symposium Monitoring of Mediterranean Coastal Areas: Problems and Measurements Techniques, Livorno (Italy), September 28–29, 2016, with the title “Vulnerability Assessment of Two Adriatic Mixed Beaches for Potential Oil Spill Events,” by EG, PC, and Michele Molinelli. We are thankful to Michele Molinelli for his help during the data collection in the field and grain size analyses. We are also thankful to Duccio Bertoni, Alessandro Pozzebon, and Giannino Grottoli for their help during the sediment sampling in Portonovo.
Footnotes
References
Aps, R., Tõnisson, H., Anfuso, G., Perales, J. A., Orviku, K., and Suursaar, Ü. (2014). Incorporating dynamic factors to the environmental sensitivity index (ESI) shoreline classification-estonian and Spanish examples. J. Coast. Res. 70, 235–240. doi: 10.2112/SI70-040.1
Aps, R., Tõnisson, H., Suursaar, Ü., and Orviku, K. (2016). Regional environmental sensitivity index (RESI) classification of estonian shoreline (Baltic Sea). J. Coast. Res. 75, 972–976. doi: 10.2112/SI75-195.1
Bello Smith, A., Cerasuolo, G., Perales, J. A., and Anfuso, G. (2011). Environmental sensitivity maps: the northern coast of gibraltar strait example. J. Coast. Res. 64, 875–879.
Bencivenga, M., Nardone, G., Ruggiero, F., and Calore, D. (2012). The italian data buoy network (RON). Proc. Advan. Fluid Mech. 74, 321–332.
Blott, S. J., and Pye, K. (2001). GRADISTAT: a grain size distribution and statistics package for the analysis of unconsolidated sediments. Earth Surf. Process. Landf. 26, 1237–1248. doi: 10.1002/esp.261
Brekke, C., and Solberg, A. H. (2005). Oil spill detection by satellite remote sensing. Remote Sens. Envir. 95, 1–13. doi: 10.1016/j.rse.2004.11.015
British Petroleum [BP] (2018). BP Statistical Review of World Energy, 67th Edn. London: British Petroleum.
Carr, A. P., Gleason, R., and King, A. (1970). Significance of pebble size and shape in sorting by waves. Sed. Geol. 4, 89–101. doi: 10.1016/0037-0738(70)90005-9
Castanedo, S., Juanes, J. A., Medina, R., Puente, A., Fernandez, F., Olabarrieta, M., et al. (2009). Oil spill vulnerability assessment integrating physical, biological and socio-economical aspects: application to the Cantabrian coast (Bay of Biscay, Spain). J. Env. Man. 91, 149–159. doi: 10.1016/j.jenvman.2009.07.013
Ciavola, P., Taborda, R., Ferreira, Ó., and Dias, J. A. (1997). Field observations of sand-mixing depths on steep beaches. Mar. Geol. 141, 147–156. doi: 10.1016/S0025-3227(97)00054-6
Colantoni, P., Mencucci, D., and Baldelli, G. (2003). “Idrologia e idraulica costiere processi litorali attuali e deposizione dei sedimenti,” in Verso La Gestione Integrata Della Costa Del Monte San Bartolo, Risultati Di Un Progetto Pilota, ed. R. Coccioni, (Urbania: Quaderni del Centro di Geobiologia, Univ. Urbino), 15–37.
de Lange, W. P., de Groot, N. P. H. M., and Moon, V. G. (2016). Burial and degradation of Rena oil within coastal sediments of the Bay of Plenty. N. Z. J. Mar. Freshw. Res. 50, 159–172. doi: 10.1080/00288330.2015.1062401
Fattal, P., Maanan, M., Tillier, I., Rollo, N., Robin, M., and Pottier, P. (2010). Coastal vulnerability to oil spill pollution: the case of Noirmoutier island (France). J. Coast. Res. 26, 879–887. doi: 10.2112/08-1159.1
Fernández-Macho, J. (2016). Risk assessment for marine spills along European coastlines. Mar. Pollut. Bull. 113, 200–210. doi: 10.1016/j.marpolbul.2016.09.015
Ferreira, Ó., Ciavola, P., Taborda, R., Bairros, M., and Dias, J. A. (2000). Sediment mixing depth determination for steep and gentle foreshores. J. Coast. Res. 16, 830–839.
Fingas, M., and Brown, C. E. (2018). A review of oil spill remote sensing. Sensors 18: 91. doi: 10.3390/s18010091
Fiscella, B., Giancaspro, A., Nirchio, F., Pavese, P., and Trivero, P. (2000). Oil spill detection using marine SAR images. Int. J. Remote Sens. 21, 3561–3566. doi: 10.1080/014311600750037589
Folk, R. L., and Ward, W. C. (1957). Brazos river bar: a study in the significance of grain size parameters. J. Sed. Petr. 27, 3–26. doi: 10.1306/74D70646-2B21-11D7-8648000102C1865D
Frazão Santos, C., Carvalho, R., and Andrade, F. (2013). Quantitative assessment of the differential coastal vulnerability associated to oil spills. J. Coast. Conserv. 17, 25–36. doi: 10.1007/s11852-012-0215-2
Gambardella, A., Giacinto, G., Migliaccio, M., and Montali, A. (2010). One-class classification for oil spill detection. Pattern Anal. Appl. 13, 349–366. doi: 10.1007/s10044-009-0164-z
González, M., Medina, R., Bernabeu, A. M., and Novoa, X. (2009). Influence of beach morphodynamics in the deep burial of fuel in beaches. J. Coast. Res. 25, 799–818. doi: 10.2112/08-1033.1
Grottoli, E., Bertoni, D., and Ciavola, P. (2017). Short- and medium-term response to storms on three mediterranean coarse-grained beaches. Geomorphology 295, 738–748. doi: 10.1016/j.geomorph.2017.08.007
Grottoli, E., Bertoni, D., Ciavola, P., and Pozzebon, A. (2015). Short term displacements of marked pebbles in the swash zone: focus on particle shape and size. Mar. Geol. 367, 143–158. doi: 10.1016/j.margeo.2015.06.006
Grottoli, E., Bertoni, D., Pozzebon, A., and Ciavola, P. (2019). Influence of particle shape on pebble transport in a mixed sand and gravel beach during low energy conditions: implications for nourishment projects. Ocean Coast. Manag. 169, 171–181. doi: 10.1016/j.ocecoaman.2018.12.014
Gundlach, E. R., and Hayes, M. O. (1978). Vulnerability of coastal environments to oil spill impacts. Mar. Tech. Soc. J. 12, 18–27.
Hanna, R. G. M. (1995). An approach to evaluate the application of the vulnerability index for oil spills in tropical red sea environments. Spill Sci. Tech. Bull. 2, 171–186. doi: 10.1016/S1353-2561(96)00016-3
Harley, M. D., Andriolo, U., Armaroli, C., and Ciavola, P. (2014). Shoreline rotation and response to nourishment of a gravel embayed beach using a low-cost video monitoring technique: san michele-sassi neri, central Italy. J. Coast. Cons. 18, 551–565. doi: 10.1007/s11852-013-0292-x
Hayes, M. O., and Michel, J. (1999). Factors determining the long-term persistence of Exxon Valdez oil in gravel beaches. Mar. Pollut. Bull. 38, 92–101. doi: 10.1016/S0025-326X(99)00099-5
Hayes, M. O., Michel, J., and Noe, D. C. (1991). Factors controlling initial deposition and long-term fate of spilled oil on gravel beaches. Proc. Int. Oil Spill Conf. Am. Petrol. Inst. 1, 453–460. doi: 10.7901/2169-3358-1991-1-453
Jennings, R., and Shulmeister, J. (2002). A field based classification scheme for gravel beaches. Mar. Geol. 186, 211–228. doi: 10.1016/S0025-3227(02)00314-6
Jensen, J. R., Halls, J. N., and Michel, J. (1998). A systems approach to environmental sensitivity lndex (ESI) mapping for oil spill contingency planning and response. Photogramm. Eng. Remote Sens. 64, 1003–1014.
Kirby, M. F., and Law, R. J. (2010). Accidental spills at sea - risk, impact, mitigation and the needfor co-ordinated post-incident monitoring. Mar. Pollut. Bull. 60, 797–803. doi: 10.1016/j.marpolbul.2010.03.015
Kirk, R. M. (1980). Mixed sand and gravel beaches: morphology, processes and sediments. Prog. Phys. Geogr. 4, 189–210. doi: 10.1177/030913338000400203
Li, H., and Boufadel, M. (2010). Long-term persistence of oil from the Exxon Valdez spill in two-layer beaches. Nat. Geosci. 3, 96–99. doi: 10.1038/NGEO749
Lorenzo, H., Rial, F. I., Arias, P., and Armesto, J. (2009). Fighting against coastal oil spill pollution by means of ground-based radar. J. Coast. Res. 56, 846–850.
Mason, T., and Coates, T. T. (2001). Sediment transport processes on mixed beaches: a review for shoreline management. J. Coast. Res. 17, 645–657.
Michel, J., and Hayes, M. O. (1993). “Persistence and weathering of Exxon Valdez oil in the intertidal zone – 3.5 years later,” in Proceedings of the 1993 International Oil Spill Conference, (Washington, DC: American Petroleum Insitute), 279–286. doi: 10.7901/2169-3358-1993-1-279
Michel, J., Hayes, M. O., and Brown, P. J. (1978). Application of an oil spill vulnerability index to the shoreline of lower Cook Inlet. Alaska. Envir. Geol. 2, 107–117. doi: 10.1007/BF02380473
Michel, J., Nixon, Z., Holton, W., and White, M. (2014). “Three years of shoreline cleanup assessment technique (SCAT) for the deepwater horizon oil spill, Gulf of Mexico, USA,” in Proceedings of the 2014 International Oil Spill Conference (Washington, DC: American Petroleum Insitute), 279–286. doi: 10.7901/2169-3358-1993-1-279
Michel, J., Owens, E. H., Zengel, S., Graham, A., Nixon, Z., Allard, T., et al. (2013). Extent and degree of shoreline oiling: deepwater horizon oil spill. Gulf of Mexico, USA. PLoS One 8:e65087. doi: 10.1371/journal.pone.0065087
Montanari, A., Mainiero, M., Coccioni, R., and Pignocchi, G. (2016). Catastrophic landslide of medieval portonovo (Ancona, Italy). GSA Bull. 128, 1660–1678. doi: 10.1130/B31472.1
Nansingh, P., and Jurawan, S. (1999). Environmental sensitivity of a tropical coastline (Trinidad, West Indies) to oil spills. Spill Sc. Tech. Bull. 5, 171–172. doi: 10.1016/S1353-2561(98)00052-8
National Oceanic and Atmospheric Administration [NOAA] (2002). Environmental Sensitivity Index Guidelines, Version 3. NOAA Technical Memorandum Nos OR and R11. Seattle, WA: NOAA Ocean Service.
National Oceanic and Atmospheric Administration [NOAA] (2007). Alabama ESIMAP 21: Bon Secour Bay. Seattle, WA: NOAA Response and Restoration.
Nelson, J. R., and Grubesic, T. H. (2018). Oil spill modeling: risk, spatial vulnerability, and impact assessment. Prog. Phys. Geogr. 42, 1–16. doi: 10.1177/0309133317744737
Nixon, Z., and Michel, J. (2018). A Review of distribution and quantity of lingering subsurface oil from the Exxon Valdez Oil Spill. Deep-Sea Res. Part II 147, 20–26. doi: 10.1016/j.dsr2.2017.07.009
Nixon, Z., Michel, J., Hayes, M. O., Irvine, G. V., and Short, J. (2013). “Geomorphic factors related to the persistence of subsurface oil from the Exxon Valdez oil spill,” in Proceedings of the Symposium in Applied Coastal Geomorphology to Honor Miles O, eds T. Kana, J. Michel, and G. Voulgaris, (Hayes: Journal of Coastal Research), 115–127. doi: 10.2112/si_69_9
Nixon, Z., Zengel, S., Baker, M., Steinhoff, M., Fricano, G., Rouhani, S., et al. (2016). Shoreline oiling from the Deepwater Horizon oil spill. Marine Pollution Bulletin 107, 170–178. doi: 10.1016/j.marpolbul.2016.04.003
Olita, A., Fazioli, L., Tedesco, C., Simeone, S., Cucco, A., Quattrocchi, G., et al. (2019). Marine and coastal hazard assessment for three coastal oilrigs. Front. Mar. Sci. 6:274. doi: 10.3389/fmars.2019.00274
Owens, E. H., and Sergy, G. A. (2000). The SCAT Manual – A Field Guide to the Documentation and Description of Oiled Shorelines, 2nd Edn. Edmonton, AB: Environment Canada, 108.
Owens, E. H., and Teal, A. R. (1990). “Shoreline cleanup following the Exxon Valdez oil spill: field data collection within the S.C.A.T. program,” in Proceedings of the 13th Arctic and Marine Oil Spill Program Tech, (Ottawa, ON: Seminar, Environment Canada), 411–421.
Pincinato, F. L., Riedel, P. S., and Milanelli, J. C. C. (2009). Modelling an expert GIS system based on knowledge to evaluate oil spill environmental sensitivity. Ocean Coast. Manag. 52, 479–486. doi: 10.1016/j.ocecoaman.2009.08.003
Pourvakhshouri, S. Z., and Mansor, S. (2003). Decision support system in oil spill cases (literature review). Disaster Prevent. Manag. 12, 217–221. doi: 10.1108/09653560310480695
Quick, M. C., and Dyksterhuis, P. (1994). “Cross-shore transport for beaches of mixed sand and gravel,” in Proceedings of the International Symposium: Waves-Physical and Numerical Modelling, (Montreal, QC: Canadian Society of Civil Engineers), 1443–1452.
Regione Marche (2005). Studi, indagini, modelli matematici finalizzati alla redazione del piano di difesa della costa. Bollet. Uff. Reg. Marche 21, 4199–4675.
Ribotti, A., Antognarelli, F., Cucco, A., Falcieri, M. C., Fazioli, L., Ferrarin, C., et al. (2019). An operational marine oil spill forecasting tool for the management of emergencies in the italian seas. J. Mar. Sci. Eng. 7:1. doi: 10.3390/jmse7010001
Romero, A. F., Abessa, D. M. S., Fontes, R. F. C., and Silva, G. H. (2013). Integrated assessment for establishing an oil environmental vulnerability map: case study for the Santos Basin region. Brazil Mar. Pollut. Bull. 74, 156–164. doi: 10.1016/j.marpolbul.2013.07.012
Santos, C. F., and Andrade, F. (2009). Environmental sensitivity of the Portuguese coast in the scope of oil spill events-comparing different assessment approaches. J. Coast. Res., Spec. Issue 56, 885–889.
Xu, L., Li, J., and Brenning, A. (2014). A comparative study of different classification techniques for marine oil spill identification using RADARSAT-1 imagery. Remote Sens. Envir. 141, 14–23. doi: 10.1016/j.rse.2013.10.012
Zengel, S., Bernik, B. M., Rutherford, N., Nixon, Z., and Michel, J. (2015). Heavily oiled salt marsh following the deepwater horizon oil spill, ecological comparisons of shoreline cleanup treatments and recovery. PLoS One 10:e0132324. doi: 10.1371/journal.pone.0132324
Keywords: oil spill, mixed beaches, coarse-grained beaches, storm berm, burial, ESI
Citation: Grottoli E and Ciavola P (2019) The Role of Detailed Geomorphic Variability in the Vulnerability Assessment of Potential Oil Spill Events on Mixed Sand and Gravel Beaches: The Cases of Two Adriatic Sites. Front. Earth Sci. 7:242. doi: 10.3389/feart.2019.00242
Received: 03 June 2019; Accepted: 30 August 2019;
Published: 13 September 2019.
Edited by:
Denise Reed, University of New Orleans, United StatesReviewed by:
Jacqui Michel, Research Planning, Inc., United StatesPing Wang, University of South Florida, United States
Mark Kulp, University of New Orleans, United States
Copyright © 2019 Grottoli and Ciavola. This is an open-access article distributed under the terms of the Creative Commons Attribution License (CC BY). The use, distribution or reproduction in other forums is permitted, provided the original author(s) and the copyright owner(s) are credited and that the original publication in this journal is cited, in accordance with accepted academic practice. No use, distribution or reproduction is permitted which does not comply with these terms.
*Correspondence: Edoardo Grottoli, ZS5ncm90dG9saUB1bHN0ZXIuYWMudWs=