 Ery C. Hughes1,2,3*
 Agnes Mazot2
 Geoff Kilgour2
 Cameron Asher2
 Marco Michelini2,4Karen Britten2
 Lauriane Chardot2,5
 Yves Feisel2,6
 Cynthia Werner7
- 1School of Earth Sciences, University of Bristol, Bristol, United Kingdom
- 2Wairakei Research Centre, GNS Science, Taupō, New Zealand
- 3Division of Geological and Planetary Sciences, California Institute of Technology, Pasadena, CA, United States
- 4Space Research Coordination Center, University of Pittsburgh, Pittsburgh, PA, United States
- 5Earth Observatory of Singapore, Nanyang Technological University, Singapore, Singapore
- 6Institute of Geosciences, Johannes Gutenberg-Universität Mainz, Mainz, Germany
- 7Private Contractor, New Plymouth, New Zealand
CO2 flux measurements are often used to monitor volcanic systems, understand the cause of volcanic unrest, and map sub-surface structures. Currently, such measurements are incomplete at Tarawera (New Zealand), which erupted with little warning in 1886 and produced a ∼17 km long fissure. We combine new soil CO2 flux and C isotope measurements of Tarawera with previous data from Rotomahana and Waimangu (regions also along the 1886 fissure) to fingerprint the CO2 source, understand the current pathways for degassing, quantify the CO2 released along the entire fissure, and provide a baseline survey. The total CO2 emissions from the fissure are 1227 t⋅d–1 (742–3398 t⋅d–1 90 % confidence interval), similar to other regions in the Taupō Volcanic Zone. The CO2 flux from Waimangu and Rotomahana is far higher than from Tarawera (>549 vs. ∼4 t⋅d–1 CO2), likely influenced by a shallow silicic body at depth and Okataina caldera rim faults increasing permeability at the southern end of the fissure. Highly localized regions of elevated CO2 flux occur along the fissure and are likely caused by cross-cutting faults that focus the flow. One of these areas occurs on Tarawera, which is emitting ∼1 t⋅d–1 CO2 with a δ13CO2 of −5.5 ± 0.5 ‰, and comparison with previous observations shows that activity is declining over time. This region highlights the spatial and temporal complexity of degassing pathways at volcanoes and that sub-surface structures exert a primary control on the magnitude of CO2 flux in comparison to the surface mechanism (i.e., CO2 released through the soil or lake surface).
Introduction
Carbon dioxide (CO2) is the second most abundant gas emitted from magma and, due to its low solubility, exsolves at relatively high pressures (mid-crust to potentially upper mantle) (e.g., Mysen et al., 1975; Blank and Brooker, 1994; Ni and Keppler, 2013; Edmonds and Wallace, 2017). CO2 emerges at the surface both actively during eruption and passively during quiescent periods, either through advection in volcanic plumes and fumaroles or diffusively through lakes and soils (e.g., Baubron et al., 1990; Allard et al., 1991; Burton et al., 2013). Areas of elevated CO2 flux can be mapped to elucidate the magmatic and hydrothermal system, such as the occurrence of deep-seated structures or other preferential pathways, for instance dikes, faults, or variable geological units (e.g., Hernández et al., 2001; Werner and Cardellini, 2006; Carapezza et al., 2009; Mazot et al., 2011; Hutchison et al., 2015; Cardellini et al., 2017). Moreover, repeat measurements of CO2 degassing in a volcanic area can be integrated over time to monitor changes, allowing for the discernment of potential causes of volcanic unrest (e.g., Baubron et al., 1991; Diliberto et al., 2002; Granieri et al., 2003; Badalamenti et al., 2004; Carapezza et al., 2008; Inguaggiato et al., 2011; Jácome Paz et al., 2016).
Here, we examine the CO2 flux along the ∼17 km long fissure produced by the 10 June 1886 eruption of Tarawera volcano, New Zealand (e.g., Thomas, 1888; Cole, 1970; Nairn, 1979). In this explosive basaltic eruption, a fissure sliced through the pre-existing rhyolite domes (Tarawera Volcanic Complex) in the north-east, whilst in the south-west, the fissure intersected an active hydrothermal system. After The 1886 eruption, the craters from the fissure filled with water forming Lake Rotomahana and the Waimangu Geothermal System became established. Previous work has shown that the Waimangu-Rotomahana portion of the fissure has high CO2 emissions (Hurst et al., 2006; Mazot et al., 2014), but there was no quantification for the Tarawera portion of the fissure. Hence, we present new soil CO2 flux and isotope measurements collected on Tarawera, along the fissure created by the 1886 eruption. These data are combined with measurements of soil CO2 flux at Waimangu (Hurst et al., 2006) and the surface CO2 flux of Lake Rotomahana (Mazot et al., 2014). We use these data to understand the source of CO2, investigate the controls on degassing pathways along the 1886 fissure, and calculate the total CO2 emissions. Further, our baseline survey can now be compared to future measurements, especially during times of volcanic unrest.
Geological and Volcanological Setting
The Tarawera Linear Vent Zone is one of two linear vent zones in the Okataina Volcanic Centre, which is the most recently active rhyolitic centre in the Taupō Volcanic Zone, New Zealand (Figures 1A,B; Healy, 1962; Nairn, 2002). The most recent domes in the Tarawera Volcanic Complex were produced in the ∼1314 Kaharoa eruption, namely: Crater, Wahanga, Ruawahia, and Tarawera (Figure 1C; Nairn et al., 2001). The most recent eruption occurred on 10 June 1886, which was a basaltic Plinian eruption resulting in a ∼17 km long fissure and caused New Zealand’s largest number of fatalities from a volcanic eruption at 108 people (Walker et al., 1984; Keam, 1988). The eruption lasted for 5 h with the fissure extending from Tarawera south-westwards to the area now occupied by Lake Rotomahana and the Waimangu Geothermal System (Figure 1C; Walker et al., 1984; Keam, 1988; Simmons et al., 1993). Pre-eruption, the Rotomahana area contained two smaller lakes (Rotomahana and Rotomakariri) and the sinter deposits of the Pink and White Terraces (Nairn, 1979). Phreatomagmatic eruptions occurred in the Waimangu-Rotomahana region and at the beginning and end of the eruption at Tarawera, whereas magmatic eruptions (Strombolian to Plinian in intensity) occurred on Tarawera itself during the main eruptive phase (Nairn, 1979; Walker et al., 1984; Sable et al., 2006, 2009). There was no thermal activity reported at Tarawera prior to the 1886 eruption and the eruption was preceded by little warning (Nairn, 2002). Since the 1886 eruption, most activity has been concentrated in Waimangu and Rotomahana (Figure 1C). Geothermal activity has been well-studied at Rotomahana, consisting of fumaroles, hot springs and geysers, as well as bubbling areas within the lake (e.g., Walker et al., 2015; Stucker et al., 2016). Waimangu consists of hot springs, crater lakes (such as Frying Pan and Inferno), steaming and altered ground, minor silica deposits, and has had hydrothermal eruptions since 1886 (e.g., Mongillo, 1994; Vandemeulebrouck et al., 2008).
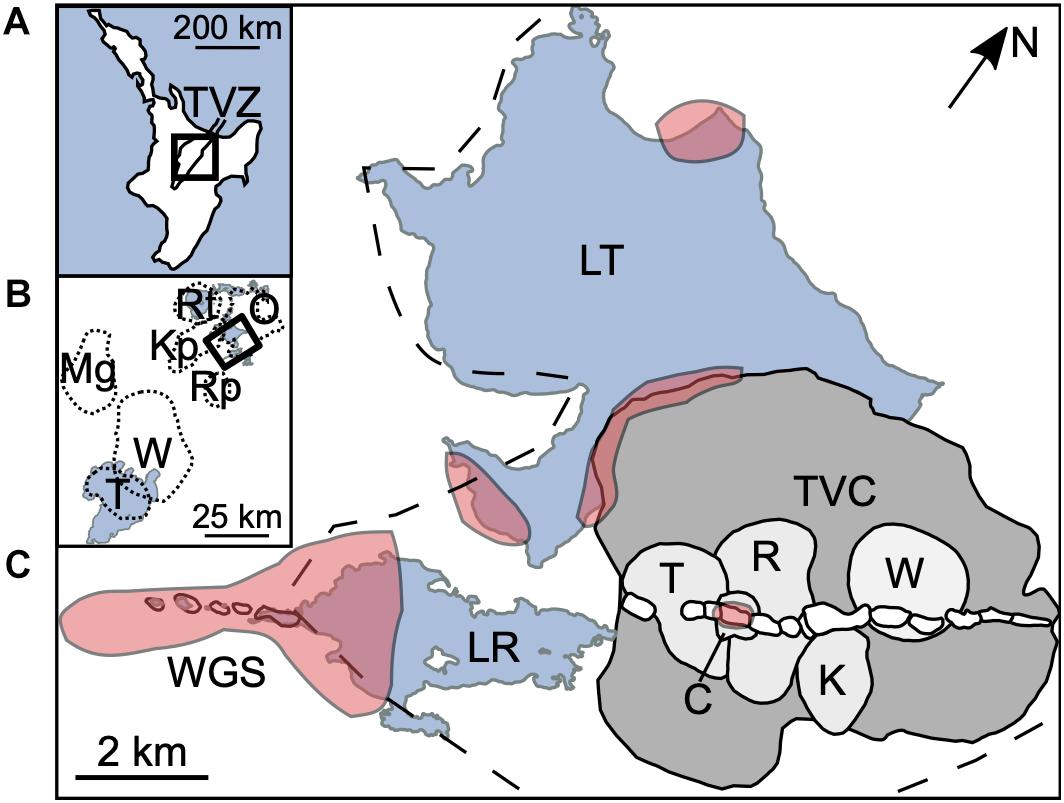
Figure 1. (A) North island of New Zealand with the location of the Taupō Volcanic Zone (TVZ), where the black square shows the area covered in (B) caldera systems (black, dotted lines: Rt = Rotorua, O = Okataina, Kp = Kapenga, Rp = Reporoa, Mg = Mangakino, W = Whakamaru, and T = Taupō) and lakes (blue) within the Taupō Volcanic Zone, where the black square shows the area covered in (C) Waimangu Geothermal System (WGS), Lake Rotomahana (LR), and Tarawera Volcanic Complex (TVC, dark gray with black, solid outline), including the recent domes (light gray with black, solid outline: T = Tarawera, C = Crater, R = Ruawahia, K = Kanakana, and W = Wahanga) and 1886 fissure (white with black, solid outline), where lakes are in blue (LT = Lake Tarawera), red regions are areas of geothermal activity from Nairn (2002), and the black, dashed line indicates the Okataina caldera rim.
For many months after the 1886 eruption, steam continued to be emitted from the fissure walls on Tarawera (Cole, 1970), but in more recent times activity has been relatively minor. Nairn (2002) describes five localities in Crater and Tarawera domes where steam rose from regions of warm ground and two low-pressure fumaroles, with temperatures of 55°C (1973) and 70°C (1980) for the Crater dome fumaroles (Figure 1C). These features are closely associated with outcrops of the 1886 basaltic dike and their location and intensity remained constant over time (Nairn, 2002). In 1985, there were two small active steam vents in the deep crater between Ruawahia and Tarawera domes, although activity was reported to be waning (Nairn, 2002). Giggenbach et al. (1993) reported the temperature and gas compositions for a fumarole (Tarawera forest, 98°C) and spring (Tarawera swamp, 20°C) sampled in 1987/89, but the exact locations of the features are not given. These gas compositions suggest mixing between a MOR-type mantle component [RM/RA = 5.92–6.63, where R is the 3He/4He of the sample (M) and the present-day Earth’s atmosphere (A)] and a CO2-enriched component (CO2 = 970–980 mmol/mol dry gas) from subducted marine sediments, which is consistent with other volcanic features in the Taupō Volcanic Zone (Giggenbach et al., 1993). The GNS Science Geothermal and Groundwater Database1 lists three features in Tarawera consisting of two regions of steaming ground and one weakly steaming fumarole, which are all located in Crater J. There are also hot water seepages on the southern edge of Lake Tarawera consisting of warm springs (25–30 °C), gas bubbles, elevated lake floor temperatures, and a low resistivity region (Figure 1C; Bennie and Stagpoole, 1985; Whiteford et al., 1996; Nairn, 2002). This suggests that there is currently an ongoing heat and gas source beneath Tarawera (Nairn, 2002).
Materials and Methods
Soil CO2 Flux Measurements
Soil CO2 flux measurements at Tarawera were made using the accumulation chamber method with a portable non-dispersive Infra-Red system (WS-LI820-CO2: West Systems © S.r.l., Pontedera (PI), Italy; Chiodini et al., 1998). Soil temperatures (∼15 cm below the surface) were made concurrently at each location. The ambient air pressure and temperature were measured at least at the beginning and end of each day, and linearly interpolated for each measurement. Measurements were conducted at least one day after any rainfall, as rain can influence the porosity and the CO2 degassing to the surface (e.g., Reimer, 1980; Hinkle, 1994).
The 1886 fissure in Tarawera was surveyed during two field campaigns (a total of three days in February–April 2016 and nine days in February–March 2017), where 339 locations were measured (361 measurements in total, including repeats) covering Craters D–K (Figure 2). Crater floors, septa, and rims (apart from the northern rim of Wahanga dome, which is sacred to Ngāti Rangitihi iwi) were measured, whilst some areas were inaccessible (although these areas showed no visual indications of degassing). The ground tended to be covered in small scoria (which sometimes made creating a good seal around the chamber difficult) or thin soils (sufficiently deep to create a good seal around the chamber). The steep crater walls and survey scale prevented GPS from accurately recording measurement locations. Therefore, most localities were recorded by annotating and then digitizing Google Earth Images and high-resolution orthophotos, which were generated from a DEM created using a DJI Phantom 4 and Agisoft photoscan. These were combined with differential GPS to locate the measurements. Copies of the annotated maps are included in the Supplementary Material to show exact measurement locations. Craters A, B, C, and M were not surveyed as they are highly vegetated and outside the domes themselves. Crater J was surveyed in both 2016 and 2017.
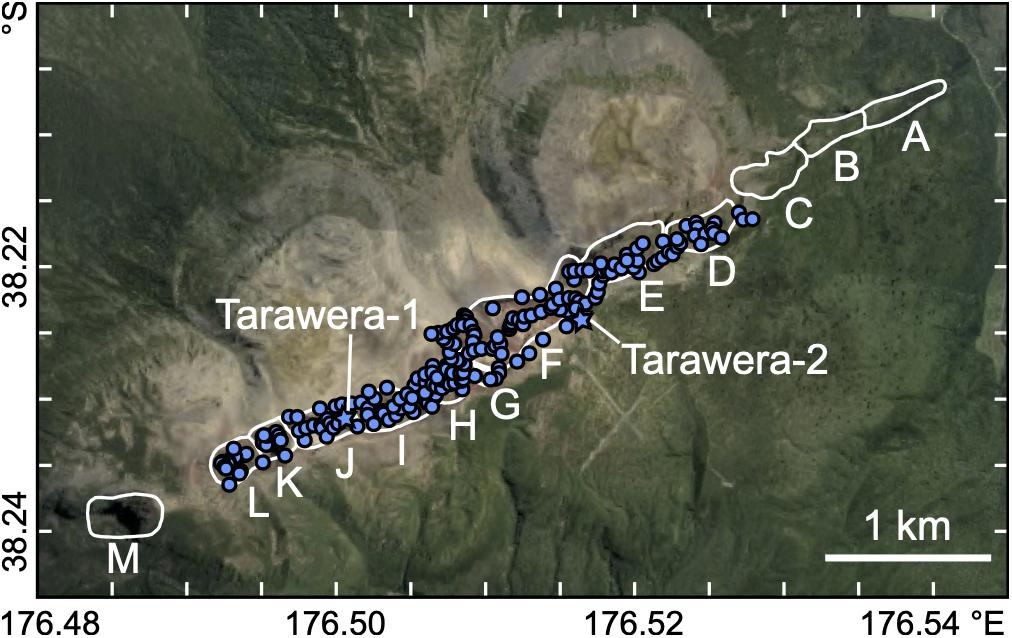
Figure 2. Locations of CO2 flux measurements at Tarawera with craters (white, solid outline) labeled after Sable et al. (2006). Stars indicate location of isotope samples (Tarawera-1 and Tarawera-2). Image from Google Maps.
Soil CO2 flux (φCO_2 in g⋅m–2⋅d–1) was calculated at each location using:
where dc/dt is the change in CO2 concentration over time as CO2 accumulates in the chamber during the measurement (ppm⋅s–1), k is a constant to convert to g⋅m–2⋅d–1 (155.87 g⋅d–1), P is the pressure (kPa), T is the temperature (K), V is the net global volume of the chamber (6.23 × 10⁻³ m3), A is the area of the base of the chamber (3.14 × 10⁻² m2), T0 is 298 K, and P0 is 101.3 kPa. Where repeat measurements were taken, the average for that location was calculated. The detection limit for this system is ∼1 g⋅m–2⋅d–1. All data are available in the Supplementary Material.
Soil Gas δ13CO2 Measurements
Gas samples for δ13CO2 isotope analysis were collected by extracting gas from the accumulation chamber using a syringe at the beginning and end of a CO2 flux measurement (Chiodini et al., 2008). One set of samples was collected where the highest CO2 flux was measured on Tarawera (Tarawera-1), along with samples of ambient air, and one set of samples was collected over vegetation (Tarawera-2) (Figure 2). The samples were introduced into evacuated tubes filled with Helium. A Europa Geo 20-20 dual inlet at the National Isotope Centre, GNS Science, New Zealand, was used to measure the δ13CO2 (reported in ‰ variation relative to VPDB), with a precision of 0.1 ‰.
Additional CO2 Flux Data
We combine the Tarawera CO2 flux data with previous surveys of Rotomahana (Mazot et al., 2014) and Waimangu (Hurst et al., 2006). The survey of Rotomahana consisted of 484 measurements covering the entire lake surface in 2010–2011, including δ13CO2 measurements of the gas in bubble plumes (Mazot et al., 2014). The CO2 flux was measured at the lake surface using the same accumulation chamber method as described in the section “Soil CO2 Flux Measurements”, except the chamber was floating on the lake surface (Mazot, 2005). The survey also measured the chemical and physical properties of the lake water in two vertical profiles and used an echo sounder to locate bubble plumes (Mazot et al., 2014). The survey of Waimangu consisted of 101 locations (102 measurements, including repeats) along two transects using the accumulation chamber method conducted in February 2006 (Hurst et al., 2006). These measurements were collected in conjunction with electrical resistivity measurements and 1 m depth ground temperatures (Hurst et al., 2006).
Data Processing
Graphical statistical analysis was used to separate the CO2 flux data (excluding data below detection limit) into different log-normal distributions for Tarawera (this study) and Waimangu (Hurst et al., 2006) data separately (graphical statistical analysis for Rotomahana was calculated by Mazot et al., 2014) and the fissure as a whole (Fissure = Waimangu + Rotomahana + Tarawera). The proportion (x), arithmetic mean , and 90 % confidence interval (calculated using the Sichel T-test) of each population are estimated using Sinclair (1974; Table 1). The areas of Waimangu and Tarawera were calculated from the minimum bounding rectangle for the measurement locations using the getMinBBox function in the shotGroups package for R (R Core Team, 2018; Wollschlaeger, 2018) and the area of Rotomahana was the lake surface taken from Mazot et al. (2014; Table 2). The total CO2 flux (TjCO_2) was calculated using:
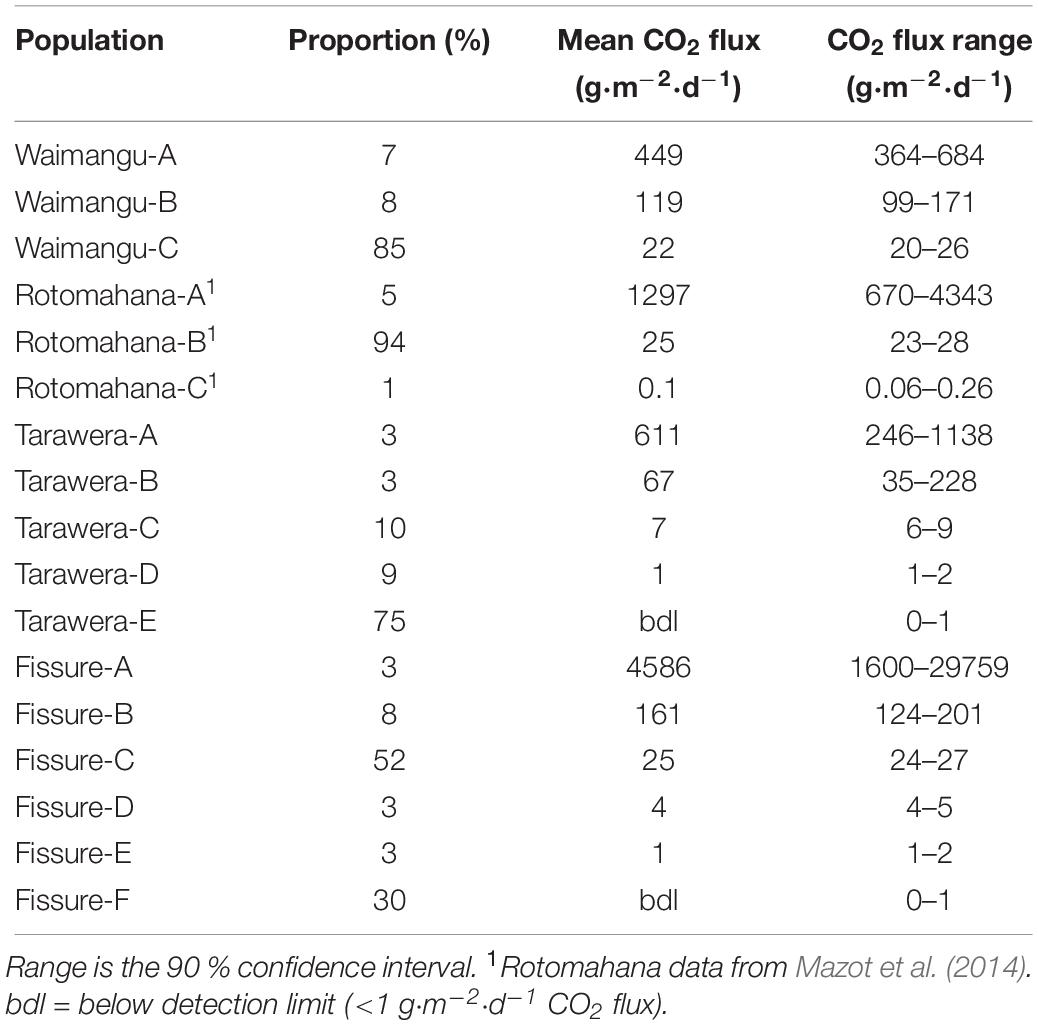
Table 1. Results from graphical statistical analysis.
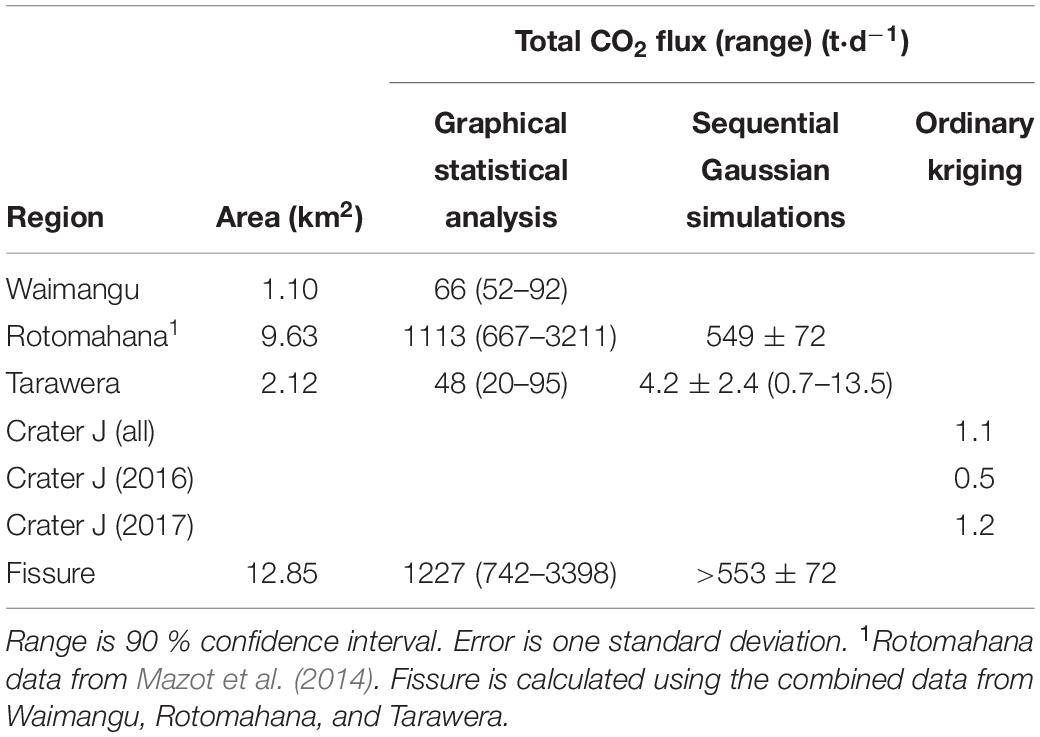
Table 2. Total CO2 flux using graphical statistical analysis, sequential Gaussian simulations, and ordinary kriging.
where j refers to Waimangu or Tarawera with area A, and i is the population with proportion x and mean CO2 flux (Tables 1 and 2). The CO2 flux range is calculated using the lower and upper 90 % confidence interval for CO2 flux instead of the mean. As the Tarawera data contained data below detection limit, the population proportions were recalculated to include data below detection limit. CO2 flux measurements below detection limit were assumed to have 0–1 g⋅m–2⋅d–1 CO2 flux. As the surveys were conducted at different spatial resolutions, and hence each measurement does not represent the same area in each region, the total CO2 flux (and range) for the whole fissure was calculated by summing the individual total (and range) CO2 fluxes.
Two methods were used to estimate the spatial distribution and total CO2 flux for the Tarawera data. WinGslib was used to estimate the CO2 flux for all Tarawera data (Deutsch and Journel, 1998). A variogram quantifies the spatial correlation of the CO2 flux by comparing the CO2 flux value at one location to those at other locations at set distances (defined by the lag spacing, which should be similar to the data spacing) and directions (defined by the azimuth and total azimuth for the range of angles considered) (Figure 3). For the Tarawera data, a variogram was produced using 65 lags, a lag spacing of 12 m, and an azimuth of 30° with a total azimuth of 30° (Figure 3). The variogram was fitted using an azimuth of 30°, a sill of 0.82 (value the variogram plateaus at), nugget of 0.30 (in the ideal case this would be 0 but measurement error elevates this value), and a range of 100 m (value where the data become spatially uncorrelated) (Figure 3). This variogram was used in the sequential Gaussian simulations, which were produced using simple kriging, a grid size of 34 × 34 m, a search radius of 40 m, and by averaging 100 simulations. Total CO2 flux was calculated from the average of the simulations and the error was calculated from the variation between simulations. Only one area at Tarawera was found to be significantly emitting CO2 (Crater J), and the region over which degassing occurred was much smaller than the grid size required to model the entire Tarawera dataset. Therefore, data from Crater J were interpolated using ordinary kriging with a 3 × 3 m grid spacing, to estimate the spatial variation and CO2 flux for all, 2016, and 2017 data. The spatial distribution of the Waimangu data does not make interpolation appropriate (Hurst et al., 2006) and sequential Gaussian simulations were applied to the Rotomahana data by Mazot et al. (2014).
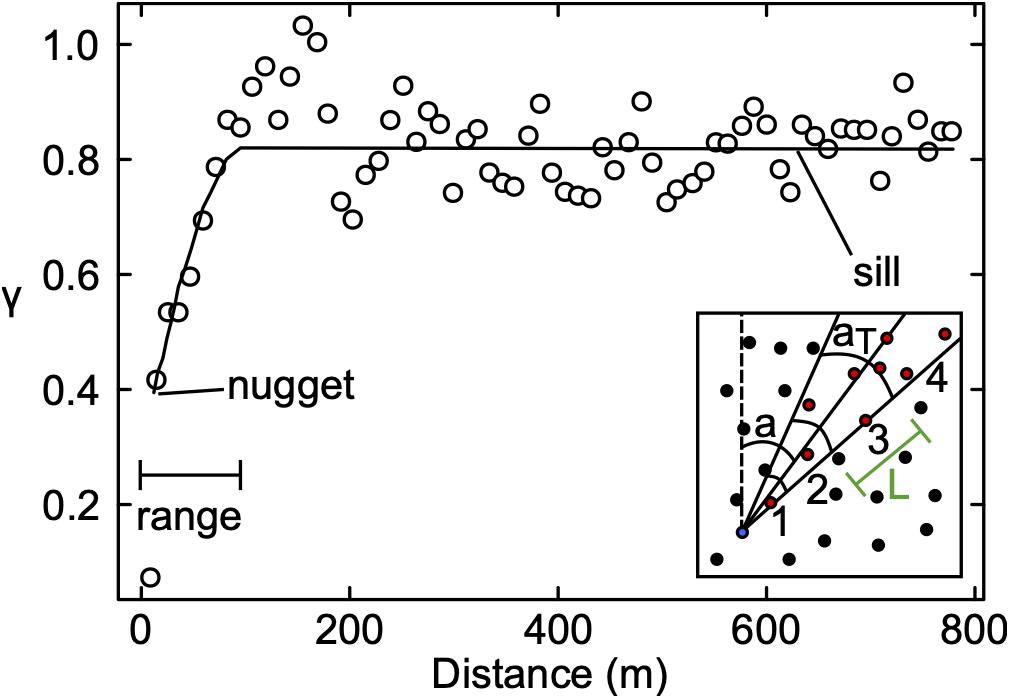
Figure 3. Experimental (65 lags, a lag spacing of 12 m, and an azimuth of 30° with a total azimuth of 30°; white circles) and model (azimuth of 30°, a sill of 0.82, nugget of 0.30, and a range of 100 m; black line) semi-variogram (γ is the variogram value, where higher values indicate the data are more correlated) of Tarawera CO2 flux normal scores used in the sequential Gaussian simulations. The inset illustrates how the variogram is calculated: the circles represent data points at different spatial locations. The spatial correlation of the blue data point to other data points (variogram) can be calculated considering the red data points which are at azimuth a and within total azimuth aT. The lag number (n) is indicated in black (1, 2, 3, 4) and correlates to distances of L⋅n, where L is the lag spacing. This procedure was carried out for all data points to calculate the variogram.
Results
We observed no visual hydrothermal activity, such as fumaroles or steaming ground, at Tarawera. Our survey was in summer/spring when it would be less likely to observe low temperature, steaming ground but others (e.g., tour guides, iwi members) who visit the mountain regularly throughout the year have also not observed steaming ground in recent years. 75 % of Tarawera CO2 flux measurements are below detection limit (bdl, <1 g⋅m–2⋅d–1 CO2 flux) (Table 1). Repeat measurements in Tarawera at the same location have a range in their variability (flux/mean flux) of ±2–146 % (8 locations) when measured on the same day and ±5–100 % (7 locations) when measured in consecutive years. The δ13CO2 from the highest CO2 flux area in Tarawera (within Crater J) is −5.5 ± 0.5 ‰ (Table 3). Soil temperatures range from 10–44°C at Tarawera, and soil temperatures do not correlate with CO2 flux at Waimangu and weakly correlate at Tarawera (Figure 4).
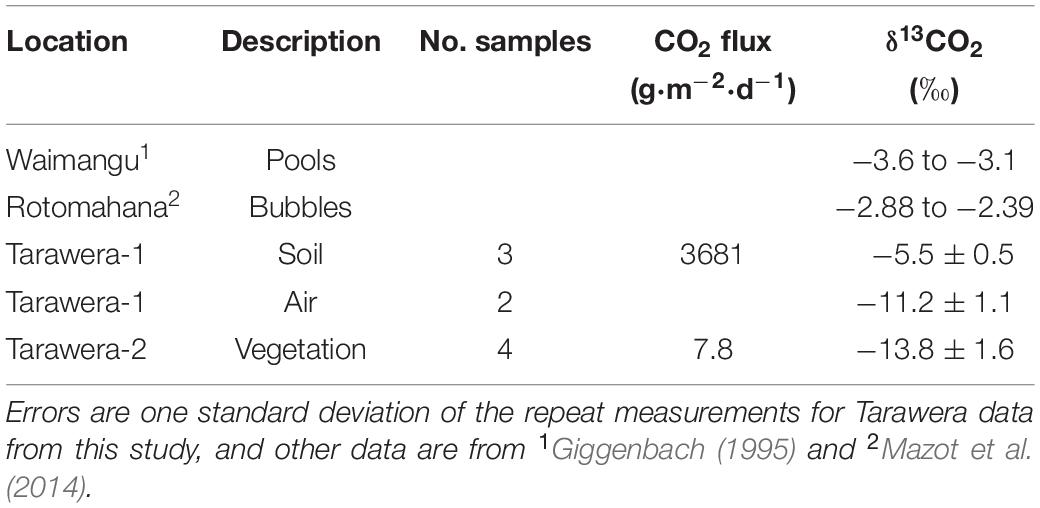
Table 3. δ13CO2 isotopic data.
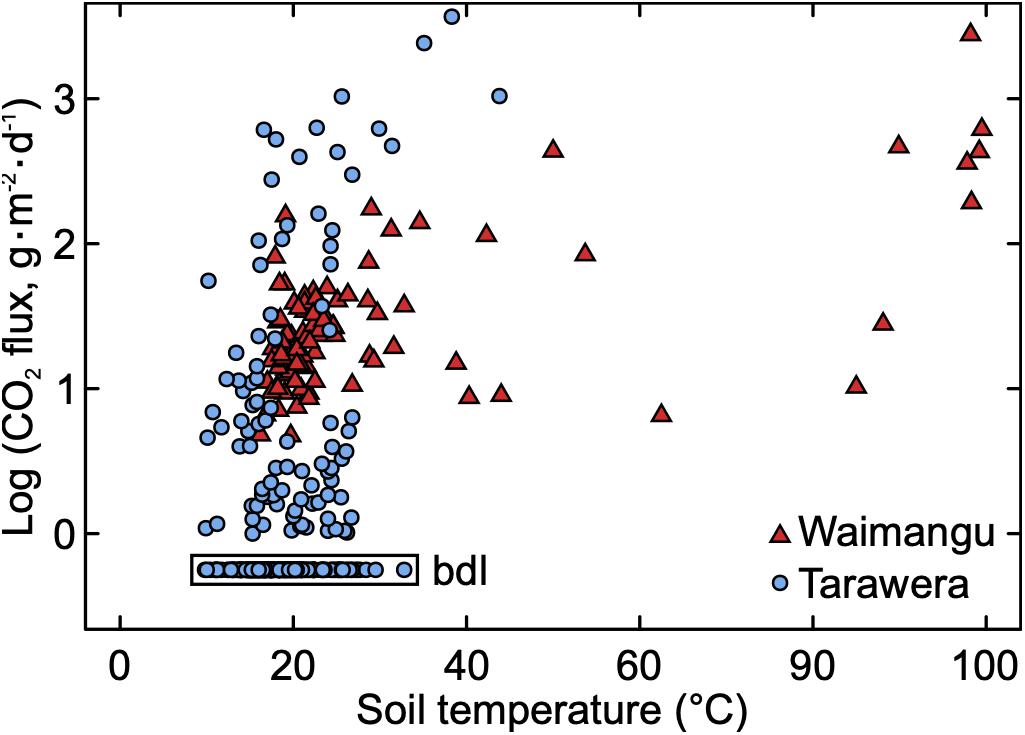
Figure 4. Soil CO2 flux against soil temperature at ∼1 m depth for Waimangu (red triangles) and ∼15 cm depth for Tarawera (blue circles). Data in the box are below detection limit (bdl, < 1 g⋅m–2⋅d–1 CO2 flux).
Tarawera CO2 flux can be described by four log-normal distributions (in order of decreasing mean CO2 flux): Tarawera-A, Tarawera-B, Tarawera-C, and Tarawera-D, with an additional group to include data below detection limit (Tarawera-E) (Table 1 and Figures 5B,E). The total Tarawera CO2 flux using graphical statistical analysis is 48 t⋅d–1 using an area of 2.12 km2 for Craters D–K (20–95 t⋅d–1 90 % confidence interval, Table 2). Waimangu CO2 flux can be described using three log-normal distributions (in order of decreasing mean CO2 flux): Waimangu-A, Waimangu-B, and Waimangu-C (Table 1 and Figures 5A,D). The total Waimangu CO2 flux is 66 t⋅d–1 using an area of 1.10 km2 (52–92 t⋅d–1 90 % confidence interval) (Table 2).
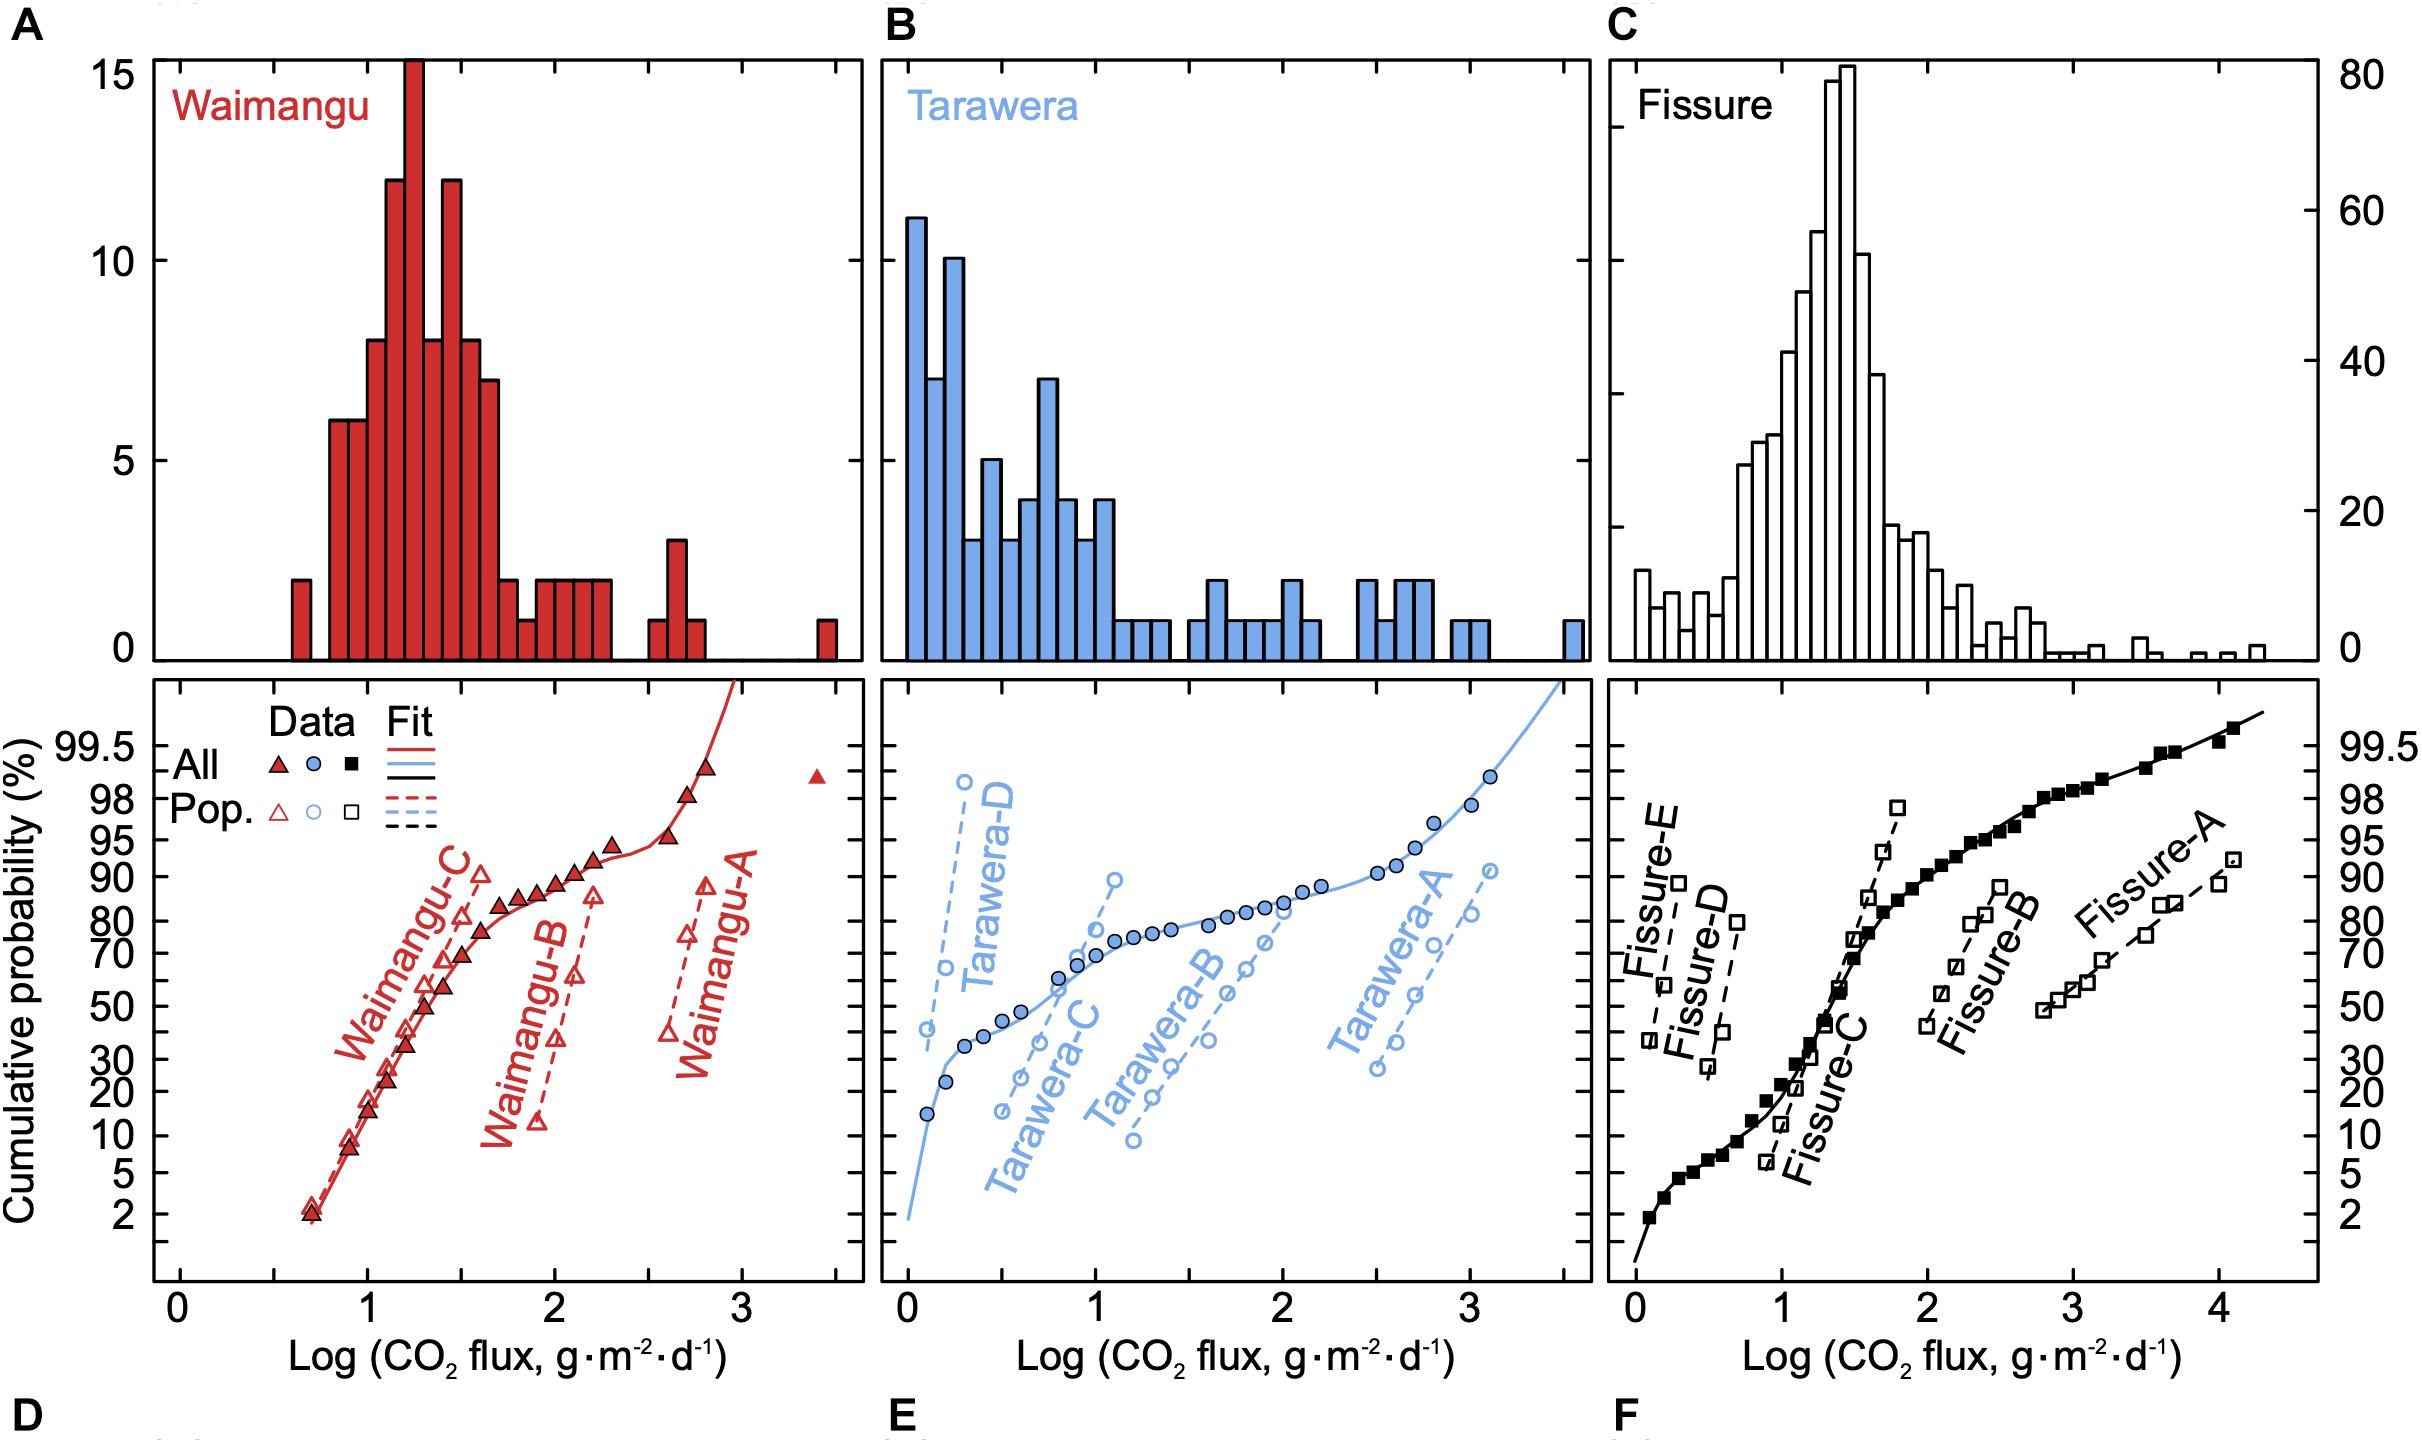
Figure 5. CO2 flux data for the 1886 fissure: histogram for (A) Waimangu, (B) Tarawera, and (C) the whole fissure (Fissure = Waimangu + Rotomahana + Tarawera); and probability plot for (D) Waimangu, (E) Tarawera, and (F) the whole fissure, where raw data are in closed symbols, populations (abbreviated to Pop.) are in open symbols (labeled according to Table 1), and fits are in dashed lines for populations and solid lines for all data. Waimangu data is from Hurst et al. (2006), Rotomahana data from Mazot et al. (2014), and Tarawera data from this study.
Alternatively, we can apply graphical statistical analysis to the entire fissure (Fissure; Figure 5C), including the Rotomahana data from Mazot et al. (2014). As the individual surveys (i.e., for Waimangu, Rotomahana, and Tarawera) have different spatial resolutions, each measurement does not represent the same area and hence the proportions are incorrect. These data are described by six groups (including a group for data below detection limit), compared to 11 required to describe Waimangu, Rotomahana, and Tarawera separately (Table 1 and Figure 5F). By combining all the data, Fissure-A (highest mean CO2 flux) consists of Waimangu-A, Rotomahana-A, and Tarawera-A; and Fissure-B consists of Waimangu-B and Tarawera-B (Table 1 and Figures 5D–F). Fissure-C has similar characteristics to Waimangu-C and Rotomahana-B; whilst Fissure-D is Tarawera-C, Fissure-E is Tarawera-D, and Fissure-F (data below detection limit) includes Rotomahana-C and Tarawera-E (Table 1 and Figures 5D–F). The total CO2 flux from the whole fissure is 1227 t⋅d–1 (742–3398 t⋅d–1 90 % confidence interval) (Table 2).
The CO2 flux distribution generated using sequential Gaussian simulations for Tarawera is shown in Figure 6 and the total Tarawera CO2 flux is 4.2 ± 2.4 t⋅d–1, with a range of 0.7–13.5 t⋅d–1 (Table 2). All high CO2 flux (Tarawera-A and Tarawera-B, Table 1 and Figure 5E) is found in Crater J (Figures 6, 7), where soil temperatures reach 44°C. Within Crater J, CO2 degassing is highly localized reaching a maximum of 3200 g⋅m–2⋅d–1 and decreasing in intensity away from the septum between Craters I and J, where there is an outcrop of basaltic dike from the 1886 eruption (Figures 6, 7). The total CO2 flux from Crater J is 1.1 t⋅d–1 for all data, 0.5 t⋅d–1 for 2016 data, and 1.2 t⋅d–1 for 2017 data (Table 2). Other areas of 1886 dike outcrop do not show elevated CO2 flux (Figure 6). Combining the total CO2 flux estimate for Rotomahana from Mazot et al. (2014) with Tarawera gives a minimum value of 553 ± 72 t⋅d–1 for the north-eastern section of the whole fissure (Table 2). Evaluating the total CO2 emissions from the whole fissure using sequential Gaussian simulations is not possible as the flux from Waimangu is not fully constrained. The diverse range of features emitting CO2, such as Frying Pan and Inferno lakes, make it very difficult to accurately quantify the total CO2 flux in this area.
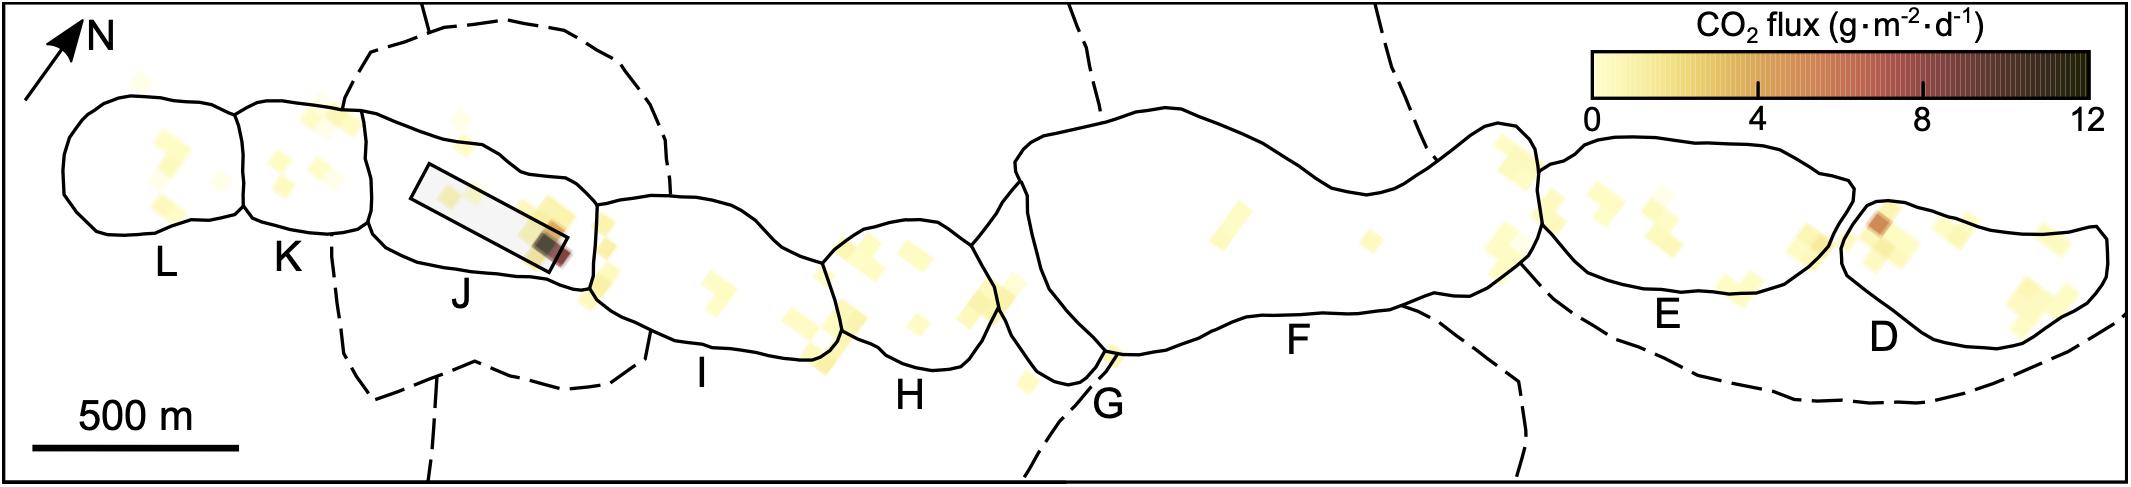
Figure 6. Tarawera CO2 flux distribution from sequential Gaussian simulations, where craters (solid black outline) and domes (dashed black outline) are from Sable et al. (2006). Location of Figure 7 shown by gray box.
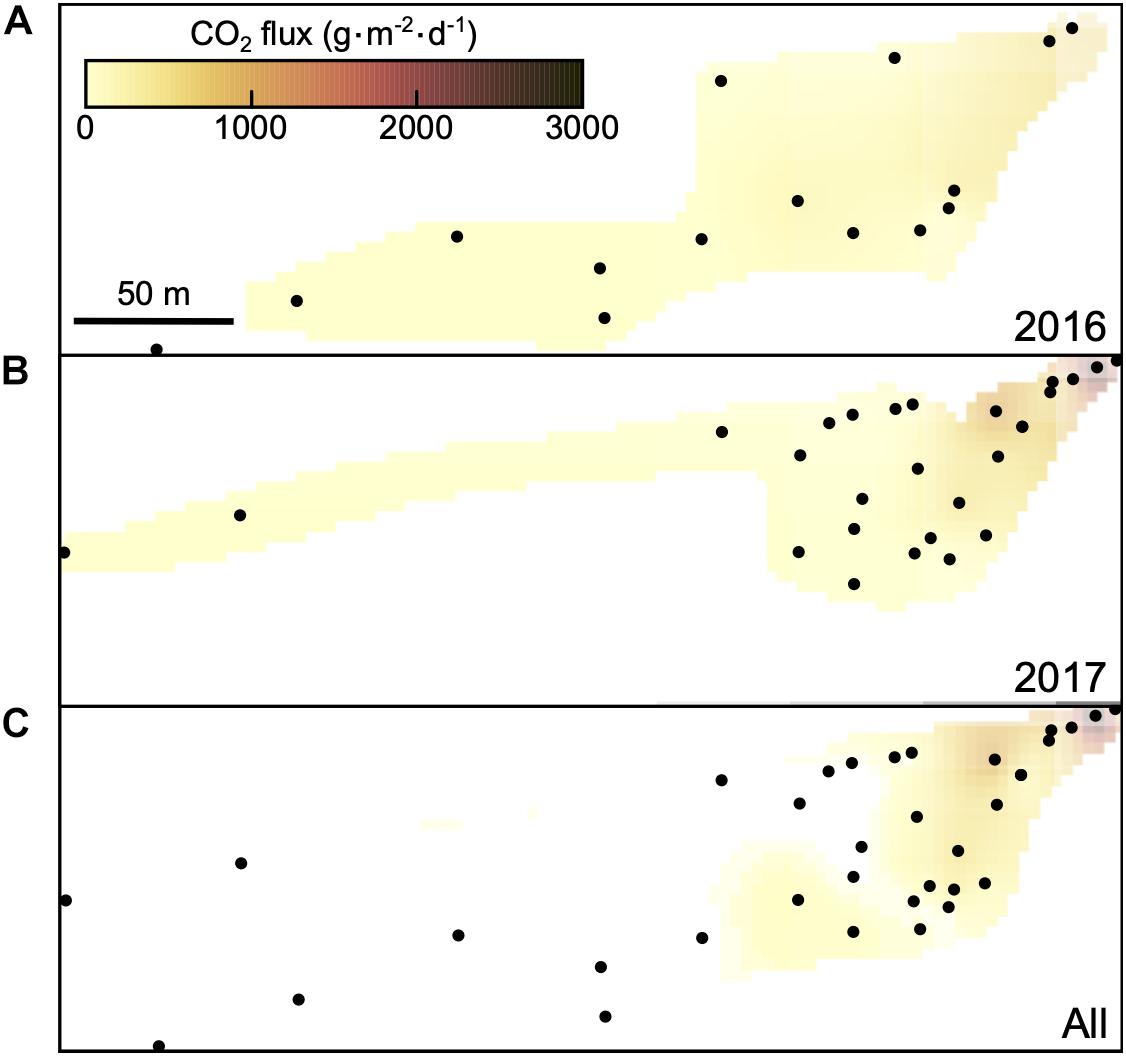
Figure 7. Data from Crater J in Tarawera interpolated using simple kriging for (A) 2016, (B) 2017, and (C) all data, where black circles are the location of CO2 flux measurements. Location within Crater J shown in Figure 6 by gray box.
Discussion
Sources of CO2
The magnitude of CO2 flux and its isotopic composition (and soil temperatures) can be combined to identify the source of CO2 (e.g., Chiodini et al., 2008). In general, background CO2 is typically biogenic with low flux (0.2–21 g⋅m–2⋅d–1 CO2) and light isotopic signature (−35 to −7 ‰ δ13CO2) (Raich and Schlesinger, 1992; Cheng, 1996; Raich and Tufekciogul, 2000; Chiodini et al., 2008). Magmatic CO2 has higher fluxes (>400 g⋅m–2⋅d–1 CO2) and heavier isotopic signatures (>−5 ‰ δ13C) (Chiodini et al., 2008). Also, mixed populations (i.e., background + magmatic) occur.
The number of CO2 flux groups decreases from 11 to 6 when Waimangu, Rotomahana, and Tarawera are combined (Fissure, Table 1 and Figures 5D–F). This demonstrates there is overlap in the population distributions of the CO2 flux between the three regions. Fissure-A and Fissure-B are due to magmatic/hydrothermal processes, as revealed by their high CO2 fluxes (mean CO2 flux 4586 g⋅m–2⋅d–1 and 161 g⋅m–2⋅d–1, respectively) and δ13CO2 isotopic signatures (−5.5 to −2.39 ‰, Table 3). Both populations occur in localized areas, likely focused by highly permeable pathways (e.g., Aiuppa et al., 2004; Hutchison et al., 2015). Fissure-A is the high flux area of Rotomahana, associated with the presence of sublacustrine vents and bubble plumes, and the equivalent sub-aerial process in Waimangu and Tarawera. Fissure B is degassing through the soil and is present in Waimangu and Tarawera. Fissure-C (mean CO2 flux 25 g⋅m–2⋅d–1, found in Waimangu and Rotomahana) is not spatially localized and represents the mixture of the high- and low-flux populations. In Rotomahana this represents CO2 diffusion at the air-water boundary, whilst at Waimangu this is diffuse degassing with a mixed hydrothermal-biogenic component. Fissure-D (mean CO2 flux 4 g⋅m–2⋅d–1) and Fissure-E (mean CO2 flux 1 g⋅m–2⋅d–1) represent the background CO2 flux for Tarawera, which is likely biogenic in origin. The two rates of background CO2 flux may be due to the difficulty in creating and maintaining soils resulting in less biological activity due to the steep crater walls in some areas of Tarawera. Fissure-F (Rotomahana and Tarawera) is below detection limit.
Volcanic eruptions within the Okataina Volcanic Centre have been overwhelming driven by rhyolitic magmas (e.g., Nairn, 2002), with limited volumes of basalt erupted as discrete events (e.g., Matahi Scoria: Pullar and Nairn, 1972) or as part of a potential trigger mechanism (e.g., Kaharoa eruption: Leonard et al., 2002). Previous work on rhyolitic eruptions in the Okataina Volcanic Centre has shown that the storage depths are ∼4–6 km, based on the volatile contents of phenocryst-hosted melt inclusions (Johnson et al., 2011). Additionally, magneto-telluric inversions delineate a highly conductive region >3.5 km depth under Waimangu and the southern end of Rotomahana, which is interpreted as a shallow silicic intrusion, but this conductive region is not present at the northern end of Rotomahana toward Tarawera (Heise et al., 2016). The low solubility of CO2, especially in rhyolites, suggests that CO2 is likely to decouple from magmas at greater depths than these shallow, rhyolitic intrusions (e.g., Mysen et al., 1975; Blank and Brooker, 1994; Ni and Keppler, 2013). This, in combination with the CO2 isotopic signature, suggests that the source of the CO2 across the entire fissure is either the mantle or deep-seated mafic magmas that are degassing in the lower crust (Mazot et al., 2014). For instance, geophysical data suggests zones of interconnected, partial melts occur at >10 km in the Okataina Volcanic Centre (e.g., Bannister et al., 2004; Heise et al., 2007, 2010; Villamor et al., 2011), which at these depths are likely to be basaltic in composition. Clinopyroxene geobarometry for the Tarawera basalt gives depths between 4–12 km (100–300 MPa, assuming a crustal density of 2500 kg⋅m–3), although some pressures were >28 km (>700 MPa), which is within the mantle-crust boundary (15–21 or 25–30 km depth depending on the study) (e.g., Stratford and Stern, 2002; Bannister et al., 2004; Sable et al., 2009). This is supported by gas measurements of other features in the Tarawera Volcanic Complex (and Taupō Volcanic Zone), which point to a carbon-rich, MOR-type mantle source (Giggenbach, 1995) and the CO2 flux from other areas in the Taupō Volcanic Zone (e.g., Rotorua), which are fed by deep seated magmas (Werner and Cardellini, 2006).
Spatial Variation in CO2 Flux
The magmatic/hydrothermal CO2 varies along the whole fissure, in both isotopic signature and magnitude (Tables 1 and 3). The calculated δ13CO2 in equilibrium with the bubble plumes at Rotomahana is −2.88 to −2.39 ‰ (Mazot et al., 2014), consistent with a magmatic origin, but heavier than the values observed at Tarawera of −5.5 ± 0.5 ‰ (Table 3). Also, dissolved gas from Waimangu geothermal features (e.g., lakes and pools) are heavier with −3.6 to −3.1 ‰ δ13CO2 (Giggenbach, 1995; Table 3). This could indicate different sources for the CO2 occurring along the fissure or temporal variations in δ13CO2 as these data were collected at different times (Waimangu in 1978/79, Rotomahana in 2012, and Tarawera in 2017). More likely, however, these variations reflect fractionation during different processes effecting the CO2 as it travels to reach the surface. For instance, CO2 can become kinetically isotopically fractionated as it diffuses through the soil, resulting in CO2 close to the soil-atmosphere interface being isotopically heavier than the true value (Camarda et al., 2007). Also, CO2 undergoes equilibrium isotopic fractionation between free CO2 and dissolved C-bearing species in water, which was corrected for in the Rotomahana data (+4.23 to +4.72 ‰ δ13CTDIC to −2.88 to −2.39 ‰ calculated δ13CO2) but not for the Waimangu data (Mook et al., 1974; Inguaggiato et al., 2000).
The magmatic/hydrothermal CO2 flux is heterogenous along the whole fissure (Figure 8A). Firstly, the total CO2 flux from Waimangu and Rotomahana (1179 t⋅d–1 using graphical statistical analysis and >549 t⋅d–1 using sequential Gaussian simulations) is much higher than from Tarawera (48 t⋅d–1 using graphical statistical analysis and 4.2 t⋅d–1 using sequential Gaussian simulations) (Table 2). This is due to greater proportions of Fissure-A, Fissure-B, and Fissure-C CO2 flux populations (focused and diffuse predominantly hydrothermal/magmatic CO2 fluxes, Table 1) in Waimangu and Rotomahana compared to Tarawera. The discrepancy is likely larger as there is significant uncertainty in the Waimangu CO2 flux, which is likely an underestimate as much of the degassing has not been measured (e.g., only two transects have been measured and fumarolic plumes/bubbles in the pools have not been measured) and the total CO2 flux greatly depends on the area taken for Waimangu. Despite the uncertainty in the CO2 flux from Waimangu, this shows that the fissure is heterogeneously degassing CO2. This is a long-lived feature of the area, as prior to the 1886 eruption what is now Rotomahana contained extensive geothermal activity (e.g., the Pink and White terraces), whilst Tarawera was inactive (e.g., Nairn, 2002).
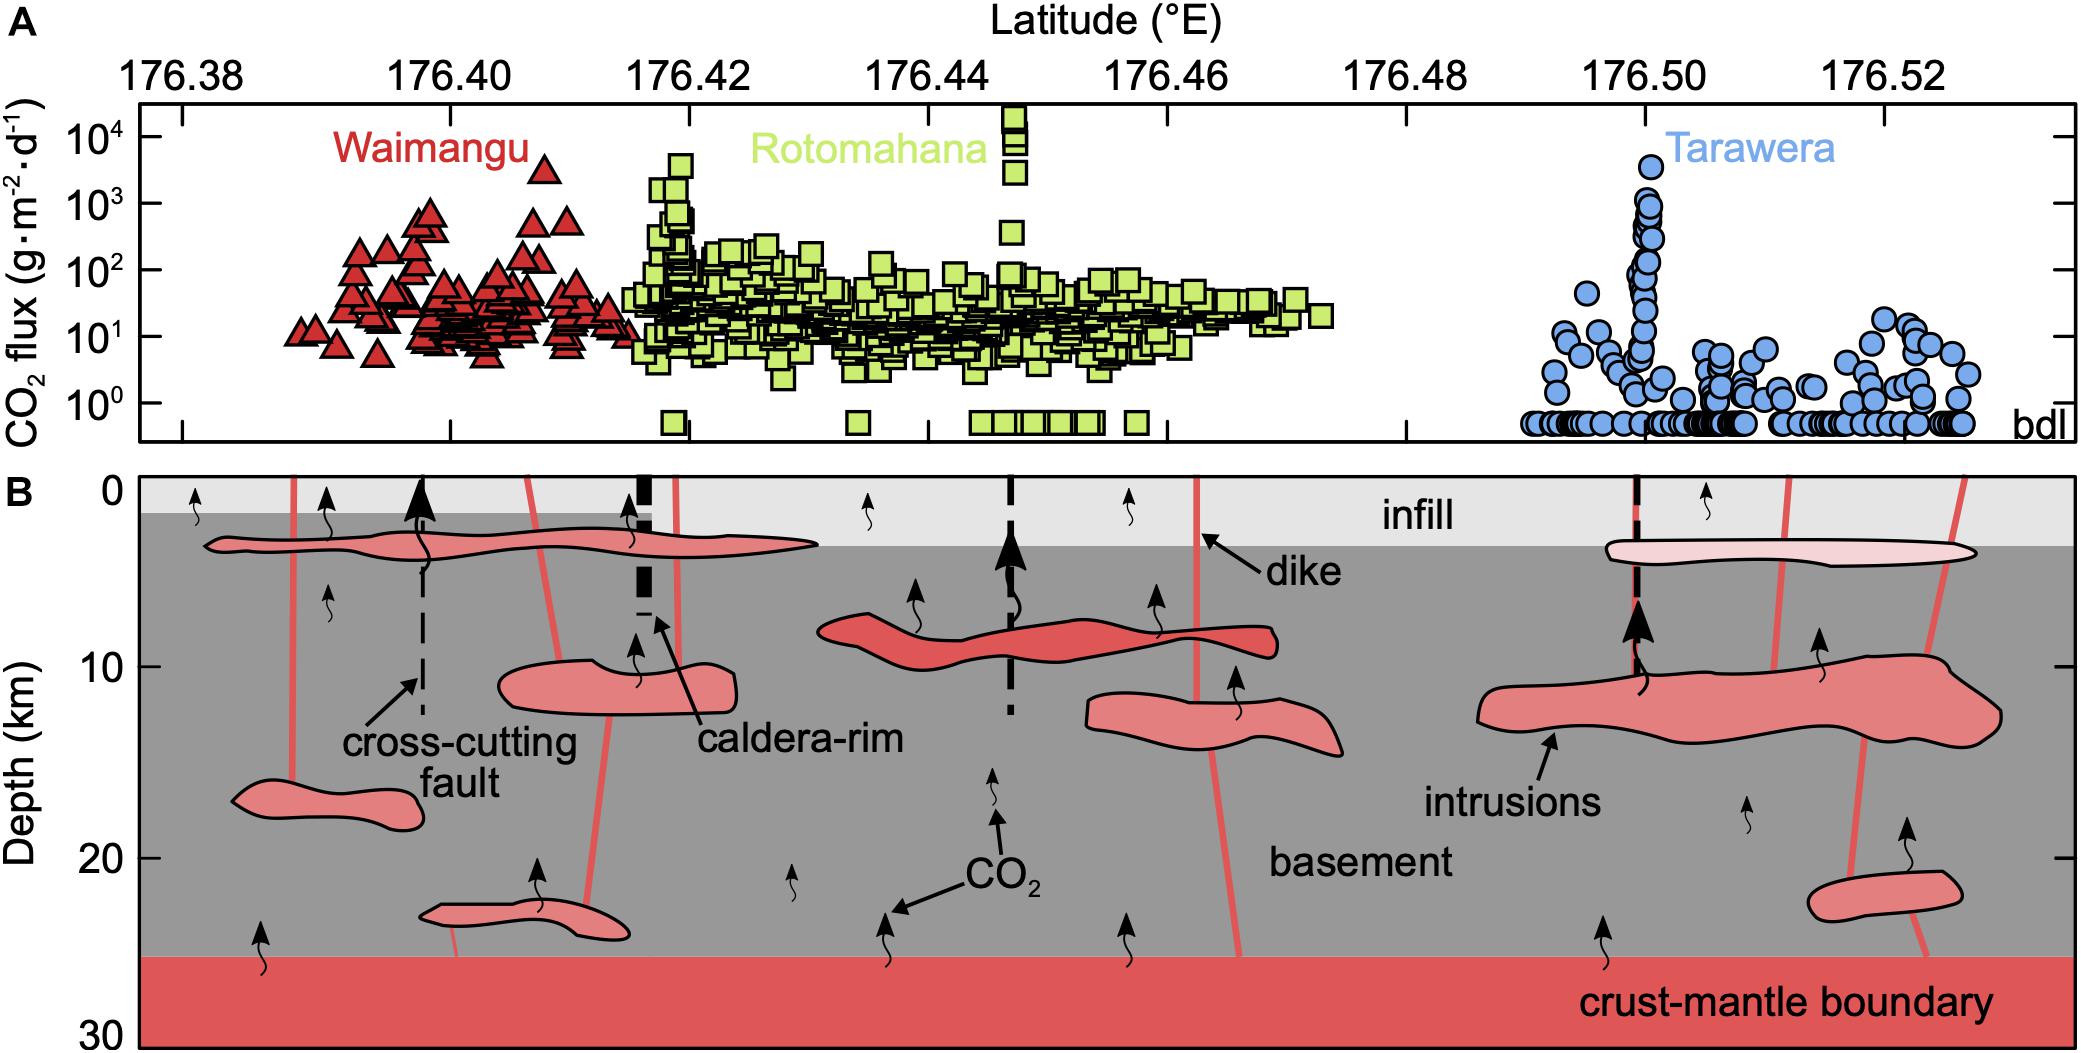
Figure 8. (A) Raw CO2 flux against latitude for Waimangu (red triangles) (Hurst et al., 2006), Rotomahana (green squares) (Mazot et al., 2014), and Tarawera (blue circles) (this study) where bdl is data below detection limit (< 1 g⋅m–2⋅d–1 CO2 flux), and (B) a conceptual model of the sub-surface below the 1886 fissure, showing intrusions (pinks and reds) (approximate depths based on Bannister et al., 2004; Sable et al., 2009; Johnson et al., 2011; Cole et al., 2014; Heise et al., 2016, 2010), volcanic infill (light gray) (depths from Seebeck et al., 2010), basement (dark gray), crust-mantle boundary (red) (depth from Bannister et al., 2004), caldera-rim fault (thick, dashed, black line) (location based on Nairn, 2002), cross-cutting faults (thin, dashed, black lines) (locations based on this study), dikes (thin, pink, solid lines), and CO2 degassing (curly arrows, where size indicates flux).
This could imply a difference in the CO2 source between the Waimangu-Rotomahana and Tarawera areas, where shallow intrusions feed Waimangu-Rotomahana and deep intrusions feed Tarawera, but as discussed in the section “Sources of CO2” this is unlikely due to the low solubility of CO2 in rhyolites (e.g., Mysen et al., 1975; Blank and Brooker, 1994; Ni and Keppler, 2013). Therefore, the source of CO2 in both regions is likely to be deep intrusions, but variations of the CO2 flux at the surface are due to permeability differences in the overlying rock. This could be partly due to Rotomahana occurring on the caldera edge, whilst Tarawera lies within the caldera. The caldera edge contains rim faults, which likely explains the elevated heat and gas flux here, and the dikes and craters formed during the 1886 eruption could have extended this area outside the caldera rim into Waimangu. Additionally, the shallow intrusion may help to maintain the pathways to the surface (e.g., providing additional heat as the intrusion cools) and thus facilitates deep CO2 reaching the surface in Waimangu and Rotomahana compared to Tarawera.
Secondly, the magmatic/hydrothermal CO2 flux has broadly two different magnitudes (Figure 8A). The lower CO2 flux (Fissure-C, Table 1 and Figure 5F) occurs everywhere and is the mixture between the background and magmatic/hydrothermal fluxes. The higher CO2 flux is spatially highly localized (Fissure-A and Fissure-B, Table 1 and Figure 5F), which is degassing through vents and the surrounding soil, and is associated with elevated soil temperatures in Waimangu and Tarawera (maximum of 98 and 44°C, respectively). The difference between Fissure-A/Fissure-B and Fissure-C is likely a permeability control, rather than a change in source, because of the localized nature of Fissure-A/Fissure-B (∼1–10 m in width parallel to the fissure trend) and it is found throughout fissure (two regions in Waimangu, two in Rotomahana, and one in Tarawera). However, more data are needed for Waimangu to fully understand the spatial features in this area.
There are several potential explanations for these spatially localized areas of flux. The basaltic dikes from the 1886 eruption themselves could provide elevated permeable pathways for CO2 (e.g., Nairn, 2002). Fluid pathways have been linked with the structure of domes, with elevated fluid flow along permeability pathways associated with domes, dike margins, conduit shear zones, and eruptive vents in both volcanic and hydrothermal areas (e.g., Werner and Cardellini, 2006; Rissmann et al., 2011; Gaunt et al., 2014). We observed a dike outcrop associated with the elevated CO2 flux in Crater J (Nairn and Cole, 1981), which is also the centre of Crater dome (subsequently overlain by Ruawahia and Tarawera domes). However, there are many dike outcrops and domes in Tarawera which are not associated with elevated CO2 flux, therefore there must be an additional factor influencing the location of increased degassing.
Elevated CO2 fluxes within the fissure could be associated with faults, which provide pathways for fluids to reach the surface (e.g., Aiuppa et al., 2004; Werner and Cardellini, 2006; Hutchison et al., 2015). The 1886 fissure trends at 57°N due to extension of the Taupō Volcanic Zone, whilst dike outcrops within the fissure are aligned more easterly due to near surface stresses (Malahof, 1968; Nairn and Cole, 1981). This feature likely exerts a first order control on the CO2 flux within the Tarawera Linear Vent Zone, although measurements have not been made outside the fissure. The CO2 flux could be focused into the discrete regions at the intersection of faults that cross-cut the fissure and the fissure itself. Regional structures within the Taupō Volcanic Zone (but outside the Okataina Volcanic Centre) are aligned at ∼40°N, and structures outside the Taupō Volcanic Zone in the basement greywacke are typically aligned north-south (Nairn and Cole, 1981; Seebeck et al., 2010). For instance, the craters associated with the Rotokawau eruption are east-west aligned, indicating there are structural features at other orientations to the spreading direction in the Okataina Volcanic Centre (Nairn, 2002). On the other hand, these faults could be associated with Reidel shear, which are a set of faults at a high angle to the main fault (75°), or with steps in the main fault at depth, as the dikes for the 1886 fissure are en echelon. A conceptual model of the sub-surface beneath the 1886 fissure is shown in Figure 8B.
Temporal Variation in CO2 Flux and Baseline Monitoring Data
The entire fissure was surveyed over 11 years; therefore, it is important to address whether these data can be combined. Previous repeat surveys at Rotorua conducted approximately a decade apart produced similar CO2 flux maps, although local-scale changes were observed (Werner and Cardellini, 2006; Hanson et al., 2018). We assess the reproducibility of CO2 flux measurements by comparing repeat measurements at the same location on the same day and approximately a year apart at Tarawera, and the surveying of Crater J in both 2016 and 2017. The variability between measurements at the same location made on the same day and a year apart are similar (±2–146 % and ±5–100 %, respectively). This variation is larger than that measured in a laboratory setting (±10 % for 0.2 to >10000 g⋅m–2⋅d–1 CO2 flux) (Chiodini et al., 1998), but is in the range of those made in the field at the same location on the same day by different groups (±5–167 %) (Lewicki et al., 2005). Such temporal variations are a combination of error and natural changes in the flux (Lewicki et al., 2005). The total flux from Crater J in 2016 was 0.5 t⋅d–1 compared to 1.2 t⋅d–1 in 2017, which is twice the variability observed by Lewicki et al. (2005) (±41 vs. ±22 %, respectively) (Table 2). The same locations were not measured in Crater J both years and spatial variations can exist at the meter-scale (Figure 7). The highest CO2 flux location was only measured in 2017 (622 vs. 3884 g⋅m–2⋅d–1 maximum measured CO2 flux in 2016 and 2017, respectively) and the measurement density was higher in 2017. Hence, although the flux was lower in 2016 it occupied an apparently greater area of the crater floor, resulting in similar overall fluxes. These observations give confidence in combining the CO2 flux data from different surveys.
Combining our data and observations with previous data implies that activity at Tarawera continues to decline over time (Cole, 1970; Nairn, 2002). Between 1973 and 1987 there were fumaroles with temperatures ranging from 50 to 98°C (Giggenbach et al., 1993; Nairn, 2002), whereas in 2016–2017 there was no evidence of any fumaroles. A region of warm ground remains (maximum 44°C soil temperature), but it is not hot enough to produce steam. This either implies that over time there has been a reduction in CO2 and heat from the source (e.g., no new influx of magma for a long time, hence no new CO2 or heat to reach the surface), or the pathways of CO2 and heat are gradually sealing off (e.g., due to precipitation within the fluid pathways). This would be consistent with no thermal activity being visible at Tarawera prior to the 1886 eruption, even though the Kaharoa eruption occurred in ∼1314.
Our compiled baseline survey of the whole fissure is particularly relevant for determining any future unrest in the Okataina Volcanic Centre and understanding its cause, or more specifically along the Tarawera Linear Vent Zone. Sherburn and Nairn (2004) model the potential precursory activity to the next eruption from Tarawera and suggest that seismicity will be the first sign of unrest (∼5 years prior to eruption), with new springs and fumaroles appearing ∼1 year prior to eruption. Soil CO2 emissions were not considered, but changes in gas emissions can reveal activity prior to seismicity (e.g., Poland et al., 2008; Werner et al., 2013). CO2 emissions are invisible; therefore, measurements are typically made after seismic unrest begins or surface deformation is observed, but we now have a further method to monitor unrest using soil CO2 flux and isotopic ratios. Our spatial coverage at Tarawera, combined with that of Waimangu and Rotomahana, show that there is large variability in the CO2 flux across the fissure. Waimangu and Rotomahana CO2 fluxes are more active than Tarawera, but future measurements could be collected across these features and compared to the compiled baseline survey. For instance, the small area of degassing in Tarawera (compared to Waimangu and Rotomahana) coupled with the steady decline of this fumarole field makes any degassing changes relatively straightforward to delineate in Crater J. Future monitoring for increases in CO2 flux, soil temperature, or area over which degassing occurs, as well changes in the isotopic composition of the CO2, in Crater J could indicate changes in the source or depth of magma beneath Tarawera.
Total CO2 Emissions
The total CO2 emissions from the whole fissure are 1227 t⋅d–1 (742–3398 t⋅d–1 90 % confidence interval) from graphical statistical analysis and a minimum of 553 ± 72 t⋅d–1 based on sequential Gaussian simulations estimates from Rotomahana and Tarawera. There is significant uncertainty in this value due to the limited data available from Waimangu. Mazot et al. (2014) estimated the total CO2 emissions from Waimangu-Rotomahana as ∼1000 t⋅d–1 by using the average CO2 flux from Rotomahana over the area of both Rotomahana and Waimangu (assumed to be 4.4 km2). Additional data expanding the area measured at Waimangu, including measurements of the pools and other features, would especially help to constrain the area over which degassing occurs and its magnitude to refine this estimate. Along the 1886 fissure there is a lack of data connecting Rotomahana to Tarawera. As there are significant differences in the quantity of CO2 being released in these two regions, data in this area would help understand where the change occurs. To further improve the estimate of the total CO2 emissions, measurements outside the fissure (e.g., soil CO2 emissions in transects perpendicular to the fissure) would help to constrain the total area degassing.
Despite this significant uncertainty, almost all the CO2 is magmatic/hydrothermal as the other components have orders of magnitude lower CO2 flux. Hence, this provides a minimum estimate of the magmatic/hydrothermal CO2 flux in this area, which is a significant emission rate globally. For comparison, the Rotorua geothermal system produces 620 t⋅d–1 over 8.9 km2, but emissions from the lake were not measured which would extend the area of emissions by one third. Including the emissions from the lake would result in an emission rate of ∼1000 t⋅d–1 (Werner and Cardellini, 2006), a similar value to our results across the fissure. Rotokawa is a non-volcanic, developed high-temperature geothermal field within the Taupō Volcanic Zone that emits 441 ± 84 t⋅d–1 over 2.88 km2 (Bloomberg et al., 2014), which is a similar value if scaled to the same area as the fissure. Our value is also similar to Whakāri/White Island, New Zealand (1249 ± 117 t⋅d–1, 0.61 km2, Werner et al., 2004, 2008; Bloomberg et al., 2014; Christenson et al., 2017), which passively degasses CO2 through a volcanic plume and the soil, but Tarawera is degassing over a much larger area.
Conclusion
We combine soil and lake CO2 flux and δ13CO2 measurements along the fissure created during the 1886 Tarawera eruption. The fissure is emitting 1227 t⋅d–1 (742–3398 t⋅d–1 90 % confidence interval) CO2, which is similar in magnitude to other regions in the Taupō Volcanic Zone The CO2 degassing along the fissure is a combination of magmatic and biogenic CO2, where the magmatic CO2 is sourced from the mantle or deep-seated mafic magmas. There is significant variability in CO2 degassing along the fissure, with elevated magmatic degassing at Waimangu and Rotomahana likely due to enhanced permeability where the fissure and caldera rim intersect and the presence of a shallow silicic body. Additionally, highly localized regions of very high flux are facilitated by faults that cross-cut the fissure. Activity along the fissure has changed over time since its creation, and future CO2 flux and δ13CO2 can be compared to this dataset in case of volcanic unrest.
Data Availability Statement
All datasets generated and analyzed for this study are included in the manuscript/Supplementary Materials.
Author Contributions
EH, AM, and GK contributed the conception and design of this study. CA and EH collected the photogrammetry data. CA processed the orthophotos. EH, AM, GK, CA, MM, KB, LC, and YF collected the Tarawera CO2 flux data. EH processed the CO2 flux data with the help of AM. EH wrote the first draft of the manuscript. All authors contributed to manuscript revision, read, and approved the submitted version.
Funding
EH was funded during an internship by GNS Science, NERC GW4+ DTP, and a GNS Science/NERC GW4+ DTP Ph.D. studentship [NE/L002434/1]. AM and GK are supported by the New Zealand Strategic Science Investment Fund (SSIF) from the New Zealand Ministry of Business, Innovation & Employment (MBIE).
Conflict of Interest
The authors declare that the research was conducted in the absence of any commercial or financial relationships that could be construed as a potential conflict of interest.
Acknowledgments
We would like to thank the Ruawahia 2B trust for welcoming us onto Mount Tarawera and permitting us to collect data on the mountain and especially Ken Raureti, Tīpene Marr, and Paul Warbrick for their support of this work; Andy Phillips (GNS Science) who ran the Tarawera δ13CO2 analyses; and we also thank Colin Wilson, Dmitri Rouwet, and Valerio Acocella for their constructive and helpful comments, and Artur Ionescu for their editorial handling.
Supplementary Material
The Supplementary Material for this article can be found online at: https://www.frontiersin.org/articles/10.3389/feart.2019.00264/full#supplementary-material
Footnotes
References
Aiuppa, A., Allard, P., D’Alessandro, W., Giammanco, S., Parello, F., and Valenza, M. (2004). Magmatic gas leakage at Mount Etna (Sicily, Italy): relationships with the volcano-tectonic structures, the hydrological pattern and the eruptive activity. Geophys. Monogr. Am. Geophys. Union 143, 129–146.
Allard, P., Carbonnelle, J., Dajlevic, D., Bronec, J., Le Morel, P., Robe, M. C., et al. (1991). Eruptive and diffuse emissions of CO2 from Mount Etna. Nature 351, 387–391. doi: 10.1038/351387a0
Badalamenti, B., Bruno, N., Caltabiano, T., Di Gangi, F., Giammanco, S., and Salerno, G. (2004). Continuous soil CO2 and discrete plume SO2 measurements at Mt. Etna (Italy) during 1997–2000: a contribution to volcano monitoring. Bull. Volcanol. 66, 80–89. doi: 10.1007/s00445-003-0305-y
Bannister, S., Bryan, C. J., and Bibby, H. M. (2004). Shear wave velocity variation across the Taupo Volcanic Zone, New Zealand, from receiver function inversion. Geophys. J. Int. 159, 291–310. doi: 10.1111/j.1365-246X.2004.02384.x
Baubron, J.-C., Allard, P., Sabroux, J.-C., Tedesco, D., and Toutaln, J.-P. (1991). Soil gas emanations as precursory indicators of volcanic eruptions. J. Geol. Soc. Lond. 148, 571–576. doi: 10.1144/gsjgs.148.3.0571
Baubron, J. C., Allard, P., and Toutain, J. P. (1990). Diffuse volcanic emissions of carbon dioxide from Vulcano Island, Italy. Nature 344, 51–53. doi: 10.1038/344051a0
Bennie, S. L., and Stagpoole, V. M. (1985). Waterborne Resistivity Measurements in the Rotorua Lakes Area of New Zealand. Wellington: Department of Scientific and Industrial Research.
Blank, J. G., and Brooker, R. A. (1994). Experimental studies of carbon dioxide in silicate melts: solubility, speciation, and stable carbon isotope behaviour. Rev. Mineral. Geochem. 30, 157–186. doi: 10.1515/9781501509674-011
Bloomberg, S., Werner, C. A., Rissmann, C., Mazot, A., Horton, T., Gravley, D. M., et al. (2014). Soil CO2 emissions as a proxy for heat and mass flow assessment, Taupō Volcanic Zone, New Zealand. Geochem. Geophys. Geosystems 15, 4885–4904. doi: 10.1002/2014GC005327
Burton, M. R., Sawyer, G. M., and Granieri, D. (2013). Deep carbon emissions from volcanoes. Rev. Mineral. Geochem. 75, 323–354. doi: 10.2138/rmg.2013.75.11
Camarda, M., De Gregorio, S., Favara, R., and Gurrieri, S. (2007). Evaluation of carbon isotope fractionation of soil CO2 under an advective–diffusive regimen: a tool for computing the isotopic composition of unfractionated deep source. Geochim. Cosmochim. Acta 71, 3016–3027. doi: 10.1016/j.gca.2007.04.002
Carapezza, M. L., Lelli, M., and Tarchini, L. (2008). Geochemistry of the Albano and Nemi crater lakes in the volcanic district of Alban Hills (Rome, Italy). J. Volcanol. Geotherm. Res. 178, 297–304. doi: 10.1016/J.JVOLGEORES.2008.06.031
Carapezza, M. L., Ricci, T., Ranaldi, M., and Tarchini, L. (2009). Active degassing structures of Stromboli and variations in diffuse CO2 output related to the volcanic activity. J. Volcanol. Geotherm. Res. 182, 231–245. doi: 10.1016/j.jvolgeores.2008.08.006
Cardellini, C., Chiodini, G., Frondini, F., Avino, R., Bagnato, E., Caliro, S., et al. (2017). Monitoring diffuse volcanic degassing during volcanic unrests: the case of Campi Flegrei (Italy). Sci. Rep. 7:6757. doi: 10.1038/s41598-017-06941-2
Cheng, W. (1996). Measurement of rhizosphere respiration and organic matter decomposition using natural 13C. Plant Soil 183, 263–268. doi: 10.1007/BF00011441
Chiodini, G., Caliro, S., Cardellini, C., Avino, R., Granieri, D., and Schmidt, A. (2008). Carbon isotopic composition of soil CO2 efflux, a powerful method to discriminate different sources feeding soil CO2 degassing in volcanic-hydrothermal areas. Earth Planet. Sci. Lett. 274, 372–379. doi: 10.1016/J.EPSL.2008.07.051
Chiodini, G., Cioni, R., Guidi, M., Raco, B., and Marini, L. (1998). Soil CO2 flux measurements in volcanic and geothermal areas. Appl. Geochem. 13, 543–552. doi: 10.1016/S0883-2927(97)00076-0
Christenson, B. W., White, S., Britten, K., and Scott, B. J. (2017). Hydrological evolution and chemical structure of a hyper-acidic spring-lake system on Whakaari/White Island, NZ. J. Volcanol. Geotherm. Res. 346, 180–211. doi: 10.1016/J.JVOLGEORES.2017.06.017
Cole, J. W. (1970). Structure and eruptive history of the Tarawera Volcanic Complex. N. Z. J. Geol. Geophys. 13, 879–902. doi: 10.1080/00288306.1970.10418208
Cole, J. W., Deering, C. D., Burt, R. M., Sewell, S., Shane, P. A. R., and Matthews, N. E. (2014). Okataina Volcanic Centre, Taupo Volcanic Zone, New Zealand: a review of volcanism and synchronous pluton development in an active, dominantly silicic caldera system. Earth Sci. Rev. 128, 1–17. doi: 10.1016/j.earscirev.2013.10.008
Deutsch, C. V., and Journel, A. G. (1998). GSLIB: Geostatistical Software Library and User’s Guide. New York, NY: Oxford University Press.
Diliberto, I., Gurrieri, S., and Valenza, M. (2002). Relationships between diffuse CO2 emissions and volcanic activity on the island of Vulcano (Aeolian Islands, Italy) during the period 1984–1994. Bull. Volcanol. 64, 219–228. doi: 10.1007/s00445-001-0198-6
Edmonds, M., and Wallace, P. J. (2017). Volatiles and exsolved vapor in volcanic systems. Elements 13, 29–34. doi: 10.2113/gselements.13.1.29
Gaunt, H. E., Sammonds, P. R., Meredith, P. G., Smith, R., and Pallister, J. S. (2014). Pathways for degassing during the lava dome eruption of Mount St. Helens 2004–2008. Geology 42, 947–950. doi: 10.1130/G35940.1
Giggenbach, W. F. (1995). Variations in the chemical and isotopic composition of fluids discharged from the Taupo Volcanic Zone, New Zealand. J. Volcanol. Geotherm. Res. 68, 89–116. doi: 10.1016/0377-0273(95)00009-J
Giggenbach, W. F., Sano, Y., and Wakita, H. (1993). Isotopic composition of helium, and CO2 and CH4 contents in gases produced along the New Zealand part of a convergent plate boundary. Geochim. Cosmochim. Acta 57, 3427–3455. doi: 10.1016/0016-7037(93)90549-C
Granieri, D., Chiodini, G., Marzocchi, W., and Avino, R. (2003). Continuous monitoring of CO2 soil diffuse degassing at Phlegraean Fields (Italy): influence of environmental and volcanic parameters. Earth Planet. Sci. Lett. 212, 167–179. doi: 10.1016/S0012-821X(03)00232-2
Hanson, M. C., Oze, C., Werner, C. A., and Horton, T. W. (2018). Soil δ13C-CO2 and CO2 flux in the H2S-rich Rotorua hydrothermal system utilizing cavity ring down spectroscopy. J. Volcanol. Geotherm. Res. 358, 252–260. doi: 10.1016/J.JVOLGEORES.2018.05.018
Healy, J. (1962). “Structure and volcanism in the Taupo Volcanic Zone, New Zealand,” in The Crust of the Pacific Basin, Geophysical Monograph Series, eds W. E. Smith, G. A. Macdonald, and H. Kuno, (Washington, D.C: American Geophysical Union), 151–157. doi: 10.1029/GM006p0151
Heise, W., Bibby, H. M., Caldwell, T. G., Bannister, S. C., Ogawa, Y., Takakura, S., et al. (2007). Melt distribution beneath a young continental rift: the Taupo Volcanic Zone, New Zealand. Geophys. Res. Lett. 34:L14313. doi: 10.1029/2007GL029629
Heise, W., Caldwell, T. G., Bertrand, E. A., Hill, G. J., Bennie, S. L., and Palmer, N. G. (2016). Imaging the deep source of the Rotorua and Waimangu geothermal fields, Taupo Volcanic Zone, New Zealand. J. Volcanol. Geotherm. Res. 314, 39–48. doi: 10.1016/j.jvolgeores.2015.10.017
Heise, W., Caldwell, T. G., Bibby, H. M., and Bennie, S. L. (2010). Three-dimensional electrical resistivity image of magma beneath an active continental rift, Taupo Volcanic Zone, New Zealand. Geophys. Res. Lett. 37:L10301. doi: 10.1029/2010GL043110
Hernández, P. A., Salazar, J. M., Shimoike, Y., Mori, T., Notsu, K., and Pérez, N. (2001). Diffuse emission of CO2 from Miyakejima volcano, Japan. Chem. Geol. 177, 175–185. doi: 10.1016/S0009-2541(00)00390-9
Hinkle, M. E. (1994). Environmental conditions affecting concentrations of He, CO2, O2 and N2 in soil gases. Appl. Geochem. 9, 53–63. doi: 10.1016/0883-2927(94)90052-3
Hurst, T., Legaz, A., Revil, A., Vandemeulebrouck, J., and Werner, C. A. (2006). “Multi-electrode resistivity suveys around the hot lakes of the Waimangu geothermal area, New Zealand,” in Proceedings of the 28th New Zealand Geothermal Workshop, Vancouver, WA.
Hutchison, W., Mather, T. A., Pyle, D. M., Biggs, J., and Yirgu, G. (2015). Structural controls on fluid pathways in an active rift system: a case study of the Aluto volcanic complex. Geosphere 11, 542–562. doi: 10.1130/GES01119.1
Inguaggiato, S., Pecoraino, G., and D’Amore, F. (2000). Chemical and isotopical characterisation of fluid manifestations of Ischia Island (Italy). J. Volcanol. Geotherm. Res. 99, 151–178. doi: 10.1016/S0377-0273(00)00158-X
Inguaggiato, S., Vita, F., Rouwet, D., Bobrowski, N., Morici, S., and Sollami, A. (2011). Geochemical evidence of the renewal of volcanic activity inferred from CO2 soil and SO2 plume fluxes: the 2007 Stromboli eruption (Italy). Bull. Volcanol. 73, 443–456. doi: 10.1007/s00445-010-0442-z
Jácome Paz, M. P., Taran, Y., Inguaggiato, S., and Collard, N. (2016). CO2 flux and chemistry of El Chichón crater lake (México) in the period 2013–2015: evidence for the enhanced volcano activity. Geophys. Res. Lett. 43, 127–134. doi: 10.1002/2015GL066354
Johnson, E. R., Kamenetsky, V. S., McPhie, J., and Wallace, P. J. (2011). Degassing of the H2O-rich rhyolites of the Okataina Volcanic Center, Taupo Volcanic Zone, New Zealand. Geology 39, 311–314. doi: 10.1130/G31543.1
Keam, R. F. (1988). Tarawera: The Volcanic Eruption of 10 June 1886 A.D. New Zealand: Physics Department, University of Auckland.
Leonard, G., Cole, J. W., Nairn, I. A., and Self, S. (2002). Basalt triggering of the c. AD 1305 Kaharoa rhyolite eruption, Tarawera Volcanic Complex, New Zealand. J. Volcanol. Geotherm. Res. 115, 461–486. doi: 10.1016/S0377-0273(01)00326-2
Lewicki, J. L., Bergfeld, D., Cardellini, C., Chiodini, G., Granieri, D., Varley, N., et al. (2005). Comparative soil CO2 flux measurements and geostatistical estimation methods on Masaya volcano, Nicaragua. Bull. Volcanol. 68, 76–90. doi: 10.1007/s00445-005-0423-9
Malahof, A. (1968). “Origin of magnetic anomalies over the central volcanic region of New Zealand,” in The Crust and Upper Mantle of the Pacific Area, Geophysical Monograph Series, eds L. Knopoff, C. L. Drake, and P. J. Hart, (Washington, D.C: American Geophysical Union), 218–240. doi: 10.1029/gm012p0218
Mazot, A. (2005). CO2 Degassing and Fluid Geochemistry at Papandayan and Kelud Volcanoes. Brussels: Universite Libre de Bruxelles.
Mazot, A., Rouwet, D., Taran, Y., Inguaggiato, S., and Varley, N. (2011). CO2 and He degassing at El Chichón volcano, Chiapas, Mexico: gas flux, origin and relationship with local and regional tectonics. Bull. Volcanol. 73, 423–441. doi: 10.1007/s00445-010-0443-y
Mazot, A., Schwandner, F. M., Christenson, B., de Ronde, C. E. J., Inguaggiato, S., Scott, B. J., et al. (2014). CO2 discharge from the bottom of volcanic Lake Rotomahana, New Zealand. Geochem. Geophys. Geosyst. 15, 577–588. doi: 10.1002/2013GC004945
Mongillo, M. (1994). Aerial thermal infrared mapping of the Waimangu-Waiotapu geothermal region, New Zealand. Geothermics 23, 511–526. doi: 10.1016/0375-6505(94)90016-7
Mook, W. G., Bommerson, J. C., and Staverman, W. H. (1974). Carbon isotope fractionation between dissolved bicarbonate and gaseous carbon dioxide. Earth Planet. Sci. Lett. 22, 169–176. doi: 10.1016/0012-821X(74)90078-8
Mysen, B. O., Arculus, R. J., and Eggler, D. H. (1975). Solubility of carbon dioxide in melts of andesite, tholeiite, and olivine nephelinite composition to 30 kbar pressure. Contrib. Mineral. Petrol. 53, 227–239. doi: 10.1007/BF00382441
Nairn, I. A. (1979). Rotomahana-Waimangu eruption, 1886: base surge and basalt magma. N. Z. J. Geol. Geophys. 22, 363–378. doi: 10.1080/00288306.1979.10424105
Nairn, I. A. (2002). Geology of the Okataina Volcanic Centre, Scale 1:50000. Lower Hutt: Institute of Geological and Nuclear Sciences Limited.
Nairn, I. A., and Cole, J. W. (1981). Basalt dikes in the 1886 Tarawera Rift. N. Z. J. Geol. Geophys. 24, 585–592. doi: 10.1080/00288306.1981.10421534
Nairn, I. A., Self, S., Cole, J. W., Leonard, G. S., and Scutter, C. (2001). Distribution, stratigraphy, and history of proximal deposits from the c. AD 1305 Kaharoa eruptive episode at Tarawera volcano, New Zealand. N. Z. J. Geol. Geophys. 44, 467–484. doi: 10.1080/00288306.2001.9514950
Poland, M., Miklius, A., Orr, T., Sutton, J., Thornber, C., and Wilson, D. (2008). New episodes of volcanism at Kilauea volcano, Hawaii. EOS 89, 37–48. doi: 10.1029/2001JB000602
Pullar, W. A., and Nairn, I. A. (1972). Matahi basaltic tephra member, Rotoiti breccia formation. N. Z. J. Geol. Geophys. 15, 446–450. doi: 10.1080/00288306.1972.10422342
R Core Team, (2018). R: A Language And Environment for Statistical Computing. Vienna: R Foundation for Statistical Computing.
Raich, J. W., and Schlesinger, W. H. (1992). The global carbon dioxide flux in soil respiration and its relationship to vegetation and climate. Tellus B 44, 81–99. doi: 10.1034/j.1600-0889.1992.t01-1-00001.x
Raich, J. W., and Tufekciogul, A. (2000). Vegetation and soil respiration: correlations and controls. Biogeochemistry 48, 71–90. doi: 10.1023/A:1006112000616
Reimer, G. M. (1980). Use of soil-gas helium concentrations for earthquake prediction: limitations imposed by diurnal variation. J. Geophys. Res. Solid Earth 85, 3107–3114. doi: 10.1029/JB085iB06p03107
Rissmann, C., Nicol, A., Cole, J., Kennedy, B., Fairley, J., Christenson, B., et al. (2011). Fluid flow associated with silicic lava domes and faults, Ohaaki hydrothermal field, New Zealand. J. Volcanol. Geotherm. Res. 204, 12–26. doi: 10.1016/J.JVOLGEORES.2011.05.002
Sable, J. E., Houghton, B. F., Wilson, C. J. N., and Carey, R. J. (2006). Complex proximal sedimentation from Plinian plumes: the example of Tarawera 1886. Bull. Volcanol. 69, 89–103. doi: 10.1007/s00445-006-0057-6
Sable, J. E., Houghton, B. F., Wilson, C. J. N., and Carey, R. J. (2009). “Eruption mechanisms during the climax of the Tarawera 1886 basaltic Plinian eruption inferred from microtextural characteristics of the deposits,” in Studies in Volcanology: The Legacy of John Walker, eds T. Thordarson, S. Self, G. Larsen, S. K. Rowland, and A. Hoskuldsson, (London: The Geological Society of London), 129–154. doi: 10.1144/iavcel002.7
Seebeck, H., Nicol, A., Stern, T. A., Bibby, H. M., and Stagpoole, V. (2010). Fault controls on the geometry and location of the Okataina Caldera, Taupo Volcanic Zone, New Zealand. J. Volcanol. Geotherm. Res. 190, 136–151. doi: 10.1016/J.JVOLGEORES.2009.04.011
Sherburn, S., and Nairn, I. A. (2004). Modelling geophysical precursors to the prehistoric c. AD1305 Kaharoa rhyolite eruption of Tarawera volcano, New Zealand. Nat. Hazards 32, 37–58. doi: 10.1023/B:NHAZ.0000026791.16566.96
Simmons, S. F., Keywood, M., Scott, B. J., and Keam, R. F. (1993). Irreversible change of the Rotomahana-Waimangu hydrothermal system (New Zealand) as a consequence of a volcanic eruption. Geology 21, 643–646.
Sinclair, A. J. (1974). Selection of threshold values in geochemical data using probability graphs. J. Geochemical Explor. 3, 129–149. doi: 10.1016/0375-6742(74)90030-2
Stratford, W. R., and Stern, T. A. (2002). Crust and upper mantle structure in a continental back-arc spreading zone: Central North Island, New Zealand. EOS Trans. Am. Geophys. Union 83, 32B–35B.
Stucker, V. K., de Ronde, C. E. J., Scott, B. J., Wilson, N. J., Walker, S. L., and Lupton, J. E. (2016). Subaerial and sublacustrine hydrothermal activity at Lake Rotomahana. J. Volcanol. Geotherm. Res. 314, 156–168. doi: 10.1016/J.JVOLGEORES.2015.06.017
Thomas, A. P. W. (1888). Report on the Eruption of Tarawera and Rotomahana, NZ. Wellington, NZ: Government Printer.
Vandemeulebrouck, J., Hurst, A. W., and Scott, B. J. (2008). The effects of hydrothermal eruptions and a tectonic earthquake on a cycling crater lake (Inferno Crater Lake, Waimangu, New Zealand). J. Volcanol. Geotherm. Res. 178, 271–275. doi: 10.1016/J.JVOLGEORES.2008.06.021
Villamor, P., Berryman, K. R., Nairn, I. A., Wilson, K., Litchfield, N., and Ries, W. (2011). Associations between volcanic eruptions from Okataina Volcanic Center and surface rupture of nearby active faults, Taupo rift, New Zealand: insights into the nature of volcano-tectonic interactions. Geol. Soc. Am. Bull. 123, 1383–1405. doi: 10.1130/B30184.1
Walker, G. P. L., Self, S., and Wilson, L. (1984). Tarawera 1886, New Zealand – a basaltic Plinian fissure eruption. J. Volcanol. Geotherm. Res. 21, 61–78. doi: 10.1016/0377-0273(84)90016-7
Walker, S. L., de Ronde, C. E. J., Fornari, D. J., Tivey, M. A., and Stucker, V. K. (2015). High-resolution water column survey to identify active sublacustrine hydrothermal discharge zones within Lake Rotomahana, North Island, New Zealand. J. Volcanol. Geotherm. Res. 314, 142–155. doi: 10.1016/j.jvolgeores.2015.07.037
Werner, C., Hurst, T., Scott, B., Sherburn, S., Christenson, B. W., Britten, K., et al. (2008). Variability of passive gas emissions, seismicity, and deformation during crater lake growth at White Island volcano, New Zealand, 2002–2006. J. Geophys. Res. 113:B01204. doi: 10.1029/2007JB005094
Werner, C. A., and Cardellini, C. (2006). Comparison of carbon dioxide emissions with fluid upflow, chemistry, and geologic structures at the Rotorua geothermal system, New Zealand. Geothermics 35, 221–238. doi: 10.1016/j.geothermics.2006.02.006
Werner, C. A., Christenson, B., Scott, B., Britten, K., and Kilgour, G. (2004). “Monitoring CO2 emissions at White Island volcano, New Zealand: evidence for total decrease in magmatic mass and heat output,” in Proceedings of the 11th International Symposium Water–Rock Interaction, Boca Raton, FL.
Werner, C. A., Kelly, P. J., Doukas, M., Lopez, T., Pfeffer, M., McGimsey, R., et al. (2013). Degassing of CO2, SO2, and H2S associated with the 2009 eruption of Redoubt Volcano, Alaska. J. Volcanol. Geotherm. Res. 259, 270–284. doi: 10.1016/J.JVOLGEORES.2012.04.012
Whiteford, P. C., Graham, D. J., and Risk, G. F. (1996). “Thermal activity beneath Lake Tarawera, New Zealand, outlined by temperature measurements,” in Proceedings of the 18th New Zealand Geothermal Workshop, Wellington, NZ.
Keywords: Tarawera, Waimangu, Rotomahana, CO2 flux, carbon isotopes, volcanic degassing, gas permeability
Citation: Hughes EC, Mazot A, Kilgour G, Asher C, Michelini M, Britten K, Chardot L, Feisel Y and Werner C (2019) Understanding Degassing Pathways Along the 1886 Tarawera (New Zealand) Volcanic Fissure by Combining Soil and Lake CO2 Fluxes. Front. Earth Sci. 7:264. doi: 10.3389/feart.2019.00264
Received: 25 May 2019; Accepted: 24 September 2019;
Published: 24 October 2019.
Edited by:
Artur Ionescu, Babeş-Bolyai University, RomaniaReviewed by:
Colin J. N. Wilson, Victoria University of Wellington, New ZealandDmitri Rouwet, National Institute of Geophysics and Volcanology (INGV), Italy
Copyright © 2019 Hughes, Mazot, Kilgour, Asher, Michelini, Britten, Chardot, Feisel and Werner. This is an open-access article distributed under the terms of the Creative Commons Attribution License (CC BY). The use, distribution or reproduction in other forums is permitted, provided the original author(s) and the copyright owner(s) are credited and that the original publication in this journal is cited, in accordance with accepted academic practice. No use, distribution or reproduction is permitted which does not comply with these terms.
*Correspondence: Ery C. Hughes, ZWh1Z2hlc0BjYWx0ZWNoLmVkdQ==