 Arata Kioka1,2*
 Tobias Schwestermann1
 Jasper Moernaut1
 Ken Ikehara3
 Toshiya Kanamatsu4
 Timothy I. Eglinton5
 Michael Strasser1,6
- 1Institute of Geology, University of Innsbruck, Innsbruck, Austria
- 2Department of Earth Resources Engineering, Kyushu University, Fukuoka, Japan
- 3Geological Survey of Japan, National Institute of Advanced Industrial Science and Technology (AIST), Tsukuba, Japan
- 4Research Institute for Marine Geodynamics, Japan Agency for Marine-Earth Science and Technology (JAMSTEC), Yokohama, Japan
- 5Geological Institute, ETH Zürich, Zurich, Switzerland
- 6MARUM – Center for Marine Environmental Sciences, University of Bremen, Bremen, Germany
Hadal trenches are the deepest places on Earth and are important foci for natural carbon sequestration. Much of the sedimentary sequences that accumulate within hadal trenches have been linked to widespread slope sediment remobilization events, triggered by subduction zone earthquakes. Therefore, hadal trench deposits may provide valuable insights into the hazards posed by large earthquakes and their implications for the carbon cycle. Despite this strong societal relevance, no studies to date have provided the necessary coverage to understand the spatial and temporal variations of earthquake-triggered deposition along a hadal trench axis. We address these issues by integrating high-resolution bathymetry and subbottom profiler data, and sediment cores acquired over the entire hadal trench axis of the Japan Trench. We identify around 40 isolated trench-fill basins along the trench axis of the Japan Trench that document 115 sediment remobilization event deposits. We map the spatio-temporal distribution of the acoustically transparent event deposit bodies imaged in subbottom profiler data from the trench-fill basins. Using radiocarbon dating, slope failure deposits identified from subbotom profiles and sediment coring were shown to be co-eval with major historic earthquake (e.g., AD2011 Mw9.0–9.1 Tohoku-oki, AD1454 Mw≥8.4 Kyotoku, and AD869 Mw≥8.6 Jogan events). Furthermore, the lower part of the acoustically imaged stratigraphic succession in isolated basins along the Japan Trench also documents several thick acoustically transparent bodies that relate to older events. These identifications of event deposits allow quantitative constraints of along-strike variation of sediment volumes redistributed by episodic events along the entire trench axis, revealing that the total volumes of event deposits triggered by different historic large earthquakes are highly variable. We conclude that at least 7 Tg (1012 g) of organic carbon remobilized from surficial slope sediments is exported to the hadal axis of Japan Trench in the last 2,000 years by giant earthquakes. These findings highlight the significance of seismo-tectonic events for the long-term carbon cycle in hadal trenches and societal implications.
Introduction
Hadal trenches are formed by the downward bending of oceanic crust in the plate subduction zone at 6–11 km water depths. As a result of the challenges in surveying and sampling in such great water depths, hadal trenches remain largely unexplored, yet they act as terminal sinks for sediment, organic carbon (OC) and even pollutants (Kioka et al., 2019; Peng et al., in press). The study of hadal trenches may allow to (i) unravel the history of subduction zone processes, including the world’s largest earthquakes that occur in such subduction margin settings, and (ii) to investigate the deep-marine carbon cycle. In hadal trenches, the steep slopes and isolated nature of the deep-water basins act as potential depocenters for organic matter (Jamieson et al., 2010). Sediment mass-wasting events and the resulting high supply of organic matter influence the benthic communities in the hadal environments (Danovaro et al., 2003; Glud et al., 2013; Leduc et al., 2016), as the hadal microbial system is distinct relative to shallower water depths and retained by internal recycling of organic matter (Nunoura et al., 2015). Short-term biogeochemistry models predict global decreases in ocean benthic mass particularly at the hadal zone, in response to reduced supply of organic material due to climate change during the 21st century (e.g., Jones et al., 2014). Moreover, on longer geological time scales, the deposition, burial and subduction of OC within marine sediment in plate subduction margins can play a pivotal role in the long-term carbon cycle, influencing atmospheric CO2 amounts over millions of years (Berner, 1982; Burdige, 2007; Clift, 2017). Nevertheless, quantitative studies in hadal trenches have been hindered due to the limited availability of high quality data, in contrast to other continental margins. However, the recent improvement in data acquisition and observation in the hadal trenches has greatly benefited these studies. Therefore, unraveling sedimentary sequences in hadal trenches represents new frontiers in sedimentology, allowing a better understanding of sediment mass and carbon transport and storage from shallow waters to the ultimate deepest sinks of the world’s oceans and their societal implications.
Megathrust earthquakes and associated tsunami have resulted in major societal and economic impacts. Globally, there have been five magnitude-9 class earthquakes instrumentally recorded during the last century, including AD 1952 moment magnitude (Mw) ∼9.0 Severo-Kurilsk earthquake offshore Kamchatka Peninsula (e.g., MacInnes et al., 2010), AD 1960 Mw9.4–9.6 Valdivia earthquake in Chile (e.g., Satake and Atwater, 2007), AD 1964 Mw∼9.2 Alaskan earthquake (e.g., Kanamori, 1977), AD 2004 Mw9.1–9.3 Indian Ocean earthquake offshore Sumatra (Lay et al., 2005; Stein and Okal, 2005), and AD 2011 Mw9.0–9.1 Tohoku-oki earthquake offshore northeast Japan. Four of these megathrust earthquakes occurred near hadal trenches. Notably, the AD 2011 Tohoku-oki earthquake, which occurred along the hadal Japan Trench, generated the largest-ever-recorded coseismic slip (Ide et al., 2011), horizontal displacement and vertical uplift (Fujiwara et al., 2011; Kodaira et al., 2012; Chester et al., 2013), and a powerful tsunami with coastal run-up heights up to 40 m (Mori et al., 2011). Our knowledge of large magnitude earthquakes can be extended prior to the window of instrumental records (around 100 years) using historical documents (Satake and Atwater, 2007). Depositional archives from coasts, lakes, and marine sediments have been used to look further back in time (Goldfinger, 2011; Satake, 2015; Moernaut et al., 2018). Yet, there remain significant uncertainties with respect to the locations, magnitudes, and mechanisms of historical large earthquakes, and their societal impacts. Hence, investigating sedimentary sequences in hadal trenches also helps reconstructing past subduction zone earthquake magnitude-frequency relations, allowing a better assessment of hazard and risk for coastal populations and infrastructure along the active margins.
In the hadal Japan Trench, the AD 2011 Tohoku-oki earthquake remobilized young fine-grained surficial slope sediments enriched in organic matter, which was eventually deposited in the more than 7 km deep trench (Arai et al., 2013; Oguri et al., 2013; Strasser et al., 2013; Ikehara et al., 2016; McHugh et al., 2016; Kanamatsu et al., 2017; Bao et al., 2018; Kioka et al., 2019; Molenaar et al., 2019). Remarkably, the 2011 earthquake delivered >1 Tg (1012 g) of OC to the Japan Trench between 36.0° and 39.5°N through the resedimentation of spatially widespread remobilization of surficial sediment with a total volume of ∼0.2 km3 (Kioka et al., 2019). Moreover, several cores from the central part of the Japan Trench document evidence for event deposits related to surficial sediment remobilization triggered by older large earthquakes in the last few thousands of years, including the well-known AD 1454 Kyotoku and AD 869 Jogan earthquakes (Ikehara et al., 2016, 2018; Usami et al., 2018). Yet, little is understood about (1) the temporal and spatial extent of the earthquake-triggered event deposits along the plate subduction zone, (2) whether older deposits may indicate prehistoric large earthquakes, and (3) the importance of recurrent large earthquakes for the carbon cycle at subduction margins.
Here, we aim to address these issues by integrating high-resolution bathymetry and dm-scale vertical resolution subbottom profiler (SBP) data, and sediment cores acquired by many research cruises during 2012–2018 over 530 km along strike the hadal trench axis of the Japan Trench (36.0°–40.5°N). These data allow a detailed study of event stratigraphy in an entire hadal trench for the first time to our knowledge. First, we identify isolated trench-fill basins along the trench axis of Japan Trench that document sediment remobilization event deposits. Second, at the identified trench-fill basins, we map the event-stratigraphic distribution of the acoustically transparent bodies imaged in SBP data. Third, we correlate the acoustically transparent bodies that represent the event deposits triggered by major historic earthquakes. Fourth, we quantify along-strike variation of sediment volumes and OC contents of the event deposits related to past large earthquakes along the entire trench axis. By integrating and discussing the results, we also examine (i) the submarine paleoseismology approach of linking the spatio-temporal inventory of major sediment remobilization event deposits to the history of giant earthquakes, and (ii) the hypothesis that sediment remobilization induced by recurring giant earthquakes supplies large quantities of OC to the hadal trench over geological time scales.
Japan Trench
Geological Setting
The Japan Trench occurs at the plate boundary where the Pacific Plate is subducting beneath the Okhotsk Plate (Bird, 2003) or its separated microplate (e.g., Seno et al., 1996), extending from the triple junction between the Pacific, Philippine Sea and Okhotsk plates in the south to the intersection with the Kuril Trench in the north. A relatively moderate to rapid convergence rate of 7–9 cm/yr (e.g., Loveless and Meade, 2010) and relatively thin sediment cover at the trench (0.4–1 km: Lallemand et al., 1994; Nakamura et al., 2013) control development of the Japan Trench, which may favor the occurrence of subduction erosion producing tectonic subsidence (von Huene and Lallemand, 1990; Clift and Vannucchi, 2004). Although there is no typical forearc basin, isolated basins occur on the upper slope terrace (Arai et al., 2014; Boston et al., 2017). The lower slope is steeper with an average gradient of ∼5° (Kodaira et al., 2012; Koge et al., 2014). Active faulting along the subduction margin (Tsuru et al., 2002; Tsuji et al., 2013; Boston et al., 2017; Kodaira et al., 2017) forms a narrow mid-slope terrace at water depths of 4,000–6,000 m. The Japan Trench is characterized by the N-S to NNE-SSW trending horst-and-graben structures formed by flexural bending of the subducting Pacific plate, resulting in rough trench-floor morphology with isolated trench-fill and graben-fill basins (Nakamura et al., 2013; Kioka et al., 2019). Our study area of the deep Japan Trench is bounded by the subducting Erimo and Daiichi-Kashima seamounts in the north and south, respectively (Cadet et al., 1987), constraining the trench to around 530 km long (Figure 1). The floor of the trench-axis is relatively shallower at the northern and central trench basins ranging between around 7,400 and 7,700 m, while the southern trench basin north of Daiichi-Kashima Seamount reaches a water depth of 8,030 m (Kioka et al., 2019). While no major canyon system is present along most parts of the Japan Trench, the Ogawara and Nakaminato submarine canyon systems connect the continental margin and trench axis in the northernmost and southernmost Japan Trench (Figure 1). In this study, we divided the Japan Trench into the three segments, southern, central, and northern Japan Trench, based on water depths at the trench axis and structural complexities along the trench.
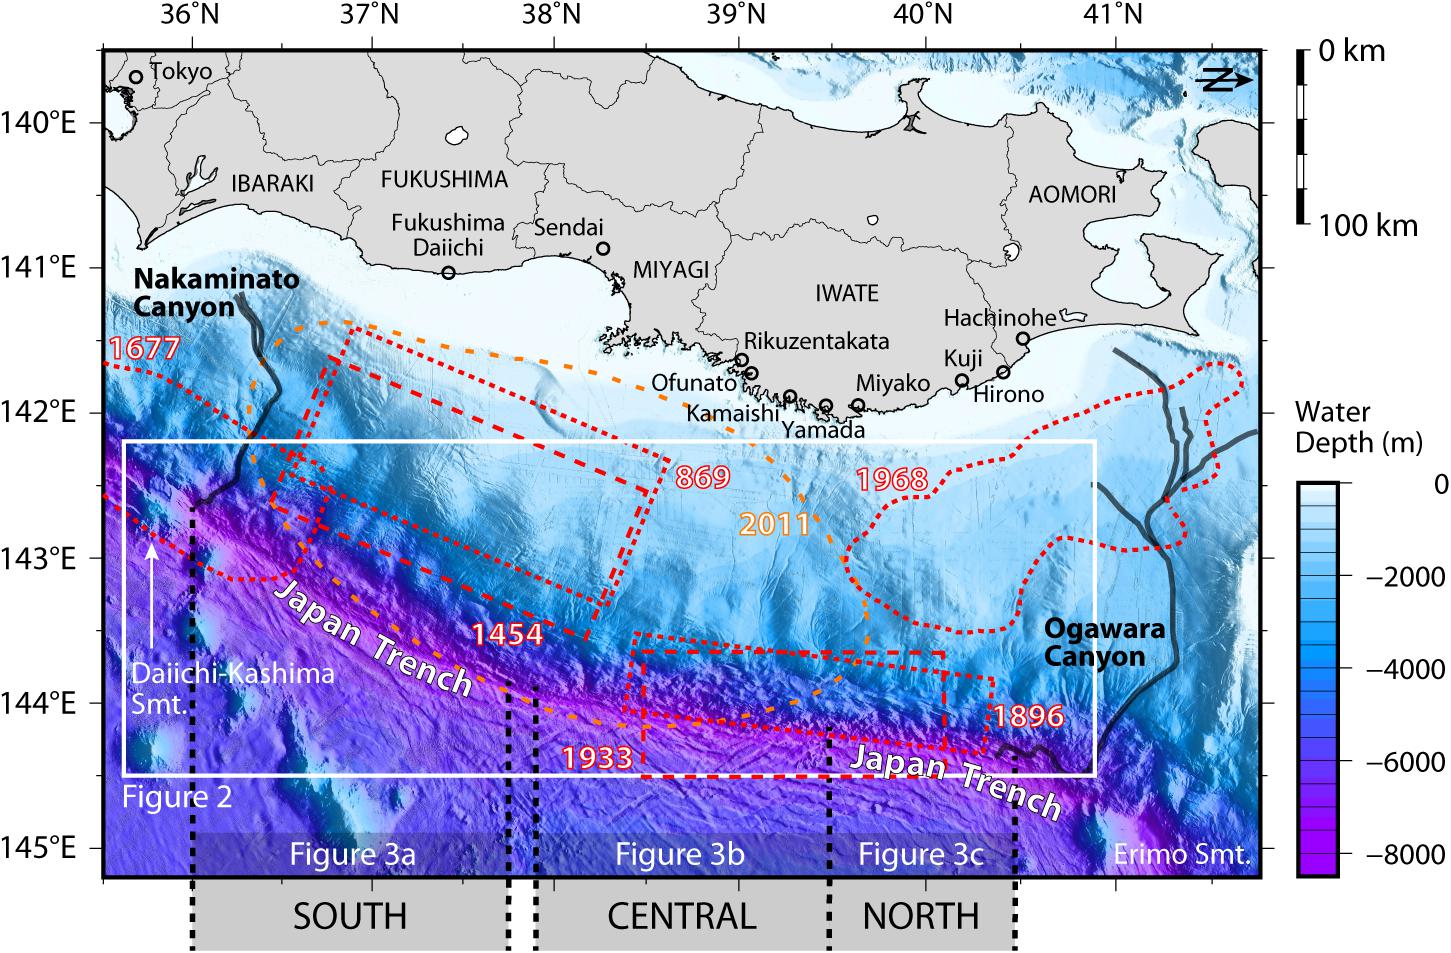
Figure 1. Map of Japan Trench with historically known large earthquakes. Source areas of the earthquakes (red dash lines) are derived from literature: AD 1968 Mw8.2–8.3 Tokachi-oki (Sanriku-oki Hokubu) earthquake (Nagai et al., 2001); AD Mw∼8.4 1933 Showa Sanriku earthquake (Kanamori, 1971); AD 1896 Mw8.0–8.4 Meiji Sanriku earthquake (Tanioka and Satake, 1996); AD 1677 Mw8.3–8.6 Enpo Boso-oki earthquake (Takeuchi et al., 2007; Sawai et al., 2012); AD 1454 Mw>=8.4 Kyotoku earthquake (Sawai et al., 2015); AD 869 Mw>=8.6 Jogan earthquake (Sawai et al., 2012). The orange dashed line represents an interred 2 m-coseismic slip of the 2011 Tohoku-oki mainshock (Sun et al., 2017). A white rectangular is a domain showing the result of flow accumulation (Figure 2). Water depths and SBP images along the trench axis in the southern, central, and northern Japan Trench are shown in Figure 3.
Historically Documented Large Earthquakes
The AD 2011 Mw9.0–9.1 Tohoku-oki earthquake is one of the largest earthquakes instrumentally recorded. Other than the 2011 earthquake, several large earthquakes with magnitude of >8 are historically well known along the Japan Trench that have been identified from tsunami deposits along the coast of Fukushima, Miyagi, Iwate, and Aomori Prefectures (Figure 1). For example, the AD 1968 Mw8.2–8.3 Tokachi-oki (Northern Sanriku-oki) megathrust earthquake (Kanamori, 1971) occurred offshore Aomori and Iwate Prefectures, and AD 1933 Mw∼8.4 Showa-Sanriku (Kanamori, 1977) and AD 1896 Mw8.0–8.4 Sanriku-oki Tsunami earthquakes (e.g., Kanamori, 1972; Tanioka and Satake, 1996) occurred immediately to the west of the trench and the trench-outer rise offshore Iwate Prefecture, respectively. Along the southern Japan Trench, the AD 1677 Empo Boso-oki Tsunami earthquake is thought to have occurred offshore Boso Peninsula (Takeuchi et al., 2007; Sawai et al., 2012) with Mw8.3–8.6 based on a tsunami inversion model (Yanagisawa et al., 2016). The AD 1454 Mw≥8.4 Kyotoku (Sawai et al., 2015) and AD 869 Mw≥8.6 Jogan earthquakes (Sawai et al., 2012; Namegaya and Satake, 2014) are modeled to occur offshore Miyagi Prefecture. Ikehara et al. (2016, 2018) and Bao et al. (2018) reported thick event deposits from sediment cores along the central Japan Trench that are linked to the AD 2011 Tohoku-oki, AD 1454 Kyotoku, and AD 869 Jogan earthquakes. Similarly large earthquakes older than these events have also been documented from widespread tsunami deposits (Satake, 2015) and marine sediments on the mid-slope terrace (Usami et al., 2018).
Another potentially large earthquake, the AD 1611 Keicho event, is discussed in the literature to be of possible similar size as the AD 1454 earthquake, as inferred from tsunami reported along the coast of Iwate and Miyagi Prefectures (Tsuji and Ueda, 1995; Ishimura and Miyauchi, 2015; Goto et al., 2019). However, the inferred seismic source is still debated, because the Keicho tsunami was reported to have reached the coast a few hours after a major earthquake. This historical report is very different from the other known large events like the AD 2011 and AD 869 Tsunamis (Sawai et al., 2015) that hit the coast within far less than 1 h after earthquake shaking. The AD 1611 Keicho Tsunami, therefore, is attributed to either submarine landslide (Tsuji and Ueda, 1995) or a remote rupture along the Kuril Trench (Okamura and Namegaya, 2011), and most likely does not link to a megathrust rupture along the Japan Trench. The occurrence of only one large earthquake that ruptured the Japan Trench megathrust between the mid-14th and early-17th century is also supported by the fact that only one event deposit is identified in the Japan Trench during this time window. While early studies lacked the dating resolution to pin point the specific triggering event (e.g., Ikehara et al., 2016), recent high-resolution radiocarbon dating constrains the age of the event deposit to the 15th century and thus corroborates the correlation to the AD 1454 Kyotoku earthquake (Bao et al., 2018).
Data and Methods
Bathymetry Data
We acquired high-resolution bathymetry data along the entire trench axis during the R/V Sonne SO251-1 cruise in October 2016 (Fujiwara et al., 2017; Strasser et al., 2017; Kioka et al., 2019). The data were acquired by a 12 kHz frequency KONGSBERG EM122 system equipped on R/V Sonne, which has 432 beams with a transducer of 0.5 (transmission) by 1 (receiving) degrees, and a dual swath (multiping) function. Such a small transducer configuration, together with higher beam counts and dual ping system results in high lateral resolution (footprint of 60–70 m along-track by 130–140 m across-track in water depths of 7–8 km) and optimized signal-to-noise ratio of the bathymetric data. The theoretical vertical resolution is a function of the water depth (a few to tens of meters in water depths of 7–8 km). This high spatial resolution results in being uniquely capable of identifying even small depositional basins within the structurally complex and hadal trench-floor system (Kioka et al., 2019).
We combined a modern digital evaluation model (DEM) calculated from bathymetry data at the water depths of <∼6,000 m acquired before 2011 by the Japanese research cruises (Hydrographic and Oceanographic Department Japan Coast Guard and JAMSTEC, 2011) with our post 2011 earthquake data (>5500 m depth) acquired during the R/V Sonne SO251-1 cruise (Fujiwara et al., 2017; Strasser et al., 2017; Kioka et al., 2019). This allows analyzing the flow network of potential sediment pathways across the margin into the trench and estimating relative contribution of sediment volume that can be routed into individual terminal trench basins. The use of the SO251-1 cruise data enables an approximate determination of sediment transport pathways and depocentres using a simple flow network model at the hadal depths of the trench. We approximated the flow path by using the single neighboring algorithm (D8 algorithm) that passes the flow from a given cell to its lowest adjacent cell (e.g., O’Callaghan and Mark, 1984). With the produced flow network, flow accumulation along the Japan Trench was calculated following the method of Schwanghart and Scherler (2014) on the combined DEM of 70 × 70 m cell size. The flow accumulation (m2) was computed as product of the number of upstream cells and the square of the cell size, representing the accumulated weight of each grid cells flowing into the deepest cells of the terminal trench basins. We did not define spatially variable weights and runoff ratios. This approach is originally developed for rivers, and submarine sediment density flows can have much higher runups and may respond very differently to topography than rivers. Despite such a limitation, this relatively simplistic approach provides first-order insights into likely flow pathways given the scale of the study area.
High-Resolution Subbottom Profiler (SBP) Data
In this study, we combine SBP data that were obtained during eight research cruises with two different acquisition systems: SO251-1 (October 2016) and SO219A-2 cruises (March–April 2012) by R/V Sonne equipped with ATLAS PARASOUND P70 echosounder and KS-18-10 (August 2018), KS-17-13 (October 2017), KS-16-14 (September 2016), KS-15-16 (November 2015), KS-15-3 (May 2015), and KS-14-16 cruises (September 2014) by R/V Shinsei-maru with KONGSBERG TOPAS PS18. The PARASOUND echosounder emits two high frequencies of 18 kHz and 22 kHz, and non-linear interference of the high frequencies produces a secondary frequency of about 4 kHz. The TOPAS system uses a primary frequency of 15–21 kHz, and a secondary frequency of 0.5–6.0 kHz. Frequency filtering was done through low-pass bandpass at 6 kHz for PARASOUND data (Strasser et al., 2017) and high- and low-pass filters at 2 and 7 kHz for TOPAS data. Theoretical vertical resolutions is in the order of ∼10–20 cm for bandwidths of 4–7 kHz. The SBP taken by Parasound system records mostly at 30–70 m per shot point (SP), while that taken by Topas system at 5–40 m/SP. All the studied SBP lines were carefully determined in light of high-resolution bathymetry data acquired by the SO251-1 cruise and acquired extensively throughout the entire Japan Trench.
The studied SBP data acquired by both systems often contain noisy traces that are caused by either interference of the ship’s multibeam system or bad weather conditions (i.e., swell). Thus, following supplementary material of Kioka et al. (2019), we post-processed the noisy SBP data by removing bad traces and interpolation of the resultant irregularly populated trace data, to ensure identification of acoustically transparent bodies with ponding geometries and reliable signal analyses for basin-to-basin correlation (see section “Correlation of Acoustically Transparent Bodies Between Neighboring Basins”). Interpolation of the killed traces in a given seismic data was solved as a sparse inverse problem using the projection-onto-convex sets algorithm (Abma and Kabir, 2006; Chen et al., 2015). We used the method of soft thresholding by the iterative shrinkage-thresholding algorithm (Daubechies et al., 2004) with a sufficiently high thresholding level, and applied 1,000–5,000 iterations to assure the convergence (the number of iterations depends on trace samples and number of noisy traces). These processes benefit from preventing losses of spatial information of SBP data because most of data were acquired with a constant ship’s speed.
Sediment Cores and Radiocarbon Dating of Background Sediment
Previous studies reported many sediment cores taken along the trench axis of the Japan Trench. Several of these cores have been used previously to establish detailed understanding of sedimentation processes, including the deposition of thick event deposits correlated to historical earthquakes (Ikehara et al., 2016; Bao et al., 2018). We use the event-stratigraphic information from these studies to validate and constrain age information for our interpretation of SBP data (see section “Identification of the Event Deposits Within Individual Trench-Fill Basins and Areal Extent and Volume of the Identified Event Deposits”). However, available data from cores are mostly from the central Japan Trench with fewer cores located in the southern and northern Japan Trench. To fill the gaps, we acquired and analyzed cores GeoB21804 and GeoB21817 taken during R/V Sonne SO251-1 cruise, KS-15-16 PC01, KS-17-13 PC01, and KS-18-10 PC01 taken during R/V Shinsei-Maru KS-15-16, KS-17-13 and KS-18-10 cruises, respectively (see Supplementary Figure S1 for the core locations). The core locations were carefully determined with the help of bathymetry and onboard initial SBP data interpretation during these cruises. Core processing and analyses followed the same core description and investigation methods (including visual core description, radiograph image analyses, and multi-sensor core logging) to identify thick sedimentary events deposits as used by previous studies (Ikehara et al., 2016, 2018; Strasser et al., 2017; Bao et al., 2018; Kioka et al., 2019).
Following the same concept of age determination and relative dating of event-deposits as applied for cores from the central Japan Trench (Ikehara et al., 2016; Bao et al., 2018), we also made radiocarbon (14C) dating of bulk OC separated from background sediments from the cores GeoB21804 and GeoB21817. The samples were freeze-dried in pre-combusted vials, and aliquots were weighed into Ag capsules for fumigation with ∼30 ml of concentrated HCl (37%, metal-trace purity) for 72 h at 60 °C to remove inorganic carbon. The acidified samples were subsequently neutralized with ∼20 g NaOH under the same conditions (72 h). The bulk organic 14C ages were measured using a coupled EA/IRMS/AMS online system at ETH Zurich (McIntyre et al., 2017). Errors of the 14C measurement were within ± 80 years (one standard deviation) in our samples. As revealed by previous studies by Bao et al. (2018) and Ikehara et al. (2016), bulk organic 14C ages do not represent the actual depositional age of the sediment (age offset in the order of ∼1,600 years), however, background sedimentation at the trench-fill basin of the Japan Trench yields a strong linear relationship between bulk OC 14C age and sediment depth (Bao et al., 2018; see section “RESULTS”). Thus, we can calculate a linear regression for 14C ages of background sediments to obtain a linear sedimentation rate of background sediments through re-sorting sediment depths after removing all the identified turbidite columns. Here, we obtain the linear sedimentation rate using a linear errors-in-variables model (measurement error model) to take into account errors arisen from 14C analyses (Supplementary Figure S2).
Identification of the Event Deposits Within Individual Trench-Fill Basins and Areal Extent and Volume of the Identified Event Deposits
As reported in previous studies, high-resolution SBP data along and across the flat trench basins image distinct bodies with acoustically transparent seismic facies, a basal higher amplitude reflection and ponded geometries. Acoustically transparent bodies in SBP data represent event deposition of thick homogenous, fine-grained relatively young sediments, in part overlying comparably thin basal sand beds (Ikehara et al., 2016, 2018; Kioka et al., 2019). The acoustic facies of these depositional bodies are distinct from chaotic reflection patterns and irregular top morphology in the areas where local deep-seated slumps have transported older sedimentary units to trench basins (Kawamura et al., 2012; Strasser et al., 2013) or where shallow co-seismic slip propagation has deformed trench sediment (Kodaira et al., 2012). Here we systematically analyzed the newly compiled SBP data set of the entire Japan Trench for identification and spatio-temporal mapping of such acoustically transparent bodies with ponded geometries throughout the entire data set. We applied the same methodological principles as Kioka et al. (2019) used for mapping the 2011 Tohoku-oki event deposit to the deeper subsurface data. Following conventional seismic-stratigraphic interpretation methods, we picked the top and bottom horizon of uniquely identifiable acoustically transparent body. We only picked the acoustic bodies that are thicker than 0.4 m (more than twice the vertical resolution of SBP data) at their potential depocentres to reveal clear lateral pinch-out geometries of the acoustically transparent facies against the acoustically laminated facies of “background” strata. We did not map the event deposits where seismic interpretation is non-unique. For the uppermost 5–10 m subsurface depth, the interpretation of the recent deposition of fine-grained remobilized sediment in SBP data is validated by the studied cores that document homogenous diatomaceous mud deposits (see section “RESULTS”). We identified trench-fill basins where we could detect such acoustically transparent bodies in SBP and cores. For convenience, we labeled the identified trench-fill basins from south to north as JTS01, JTS02, …, JTC01, JTC02, …, and JTN01, JTN02, …, in the southern, central, and northern Japan Trench, respectively. In addition, we also labeled acoustically transparent bodies, from shallow to deep, such as U1-S01, U2-S01, U3-S01, … in the identified trench-fill basin JTS01. We then estimated areal extent and volume of identified acoustically transparent bodies (i.e., event deposits) in individual trench-fill basins, as constrained through integrating SBP and bathymetry data following the method of Kioka et al. (2019). Uncertainties in areal extent and volume of given event deposit at a given trench-fill basin are calculated, taking into account lateral resolution of bathymetry (∼100 m), vertical resolution of SBP (±0.1 m), and variable thicknesses of event deposits upon the choice of internal velocity (1,500–1,700 m/s).
Correlation of Acoustically Transparent Bodies Between Neighboring Basins
Only in rare cases can picked horizons be confidently tracked across individual trench-fill basins. Therefore, stratigraphic correlation of acoustically transparent bodies of interest between neighboring trench-fill basins (i.e., testing for the respective deposits in a given trench-basin to correspond to the same event in its neighboring basins), relies on visual correlation and comparative pattern recognition. To objectively validate the visual correlation, we also applied computational signal analysis for SBP data. We performed the automatic correlation for the SBP traces of interest using the conventional dynamic time warping (DTW; Sakoe and Chiba, 1978; Müller, 2007). The DTW is a commonly used algorithm to find an optimal alignment between two given time-dependent signals. Let us consider two different representative traces of SBP data at different trench-fill basins:
where m ∈ ℕ and n ∈ ℕ are the lengths of the two SBP traces, ti (i = 1, 2,…) is the TWT, and ai and bi are the envelope values of the two SBP traces. We obtained an alignment between the two SBP traces a and b having minimal overall cost through computing the Euclidian distances between the ith (i ∈ [1, m]) sample of a and jth (j ∈ [1, n]) sample of b. Event deposits are generally homogenous and thus characterized by low-amplitude wiggles in SBP data. Event deposits from cores are in parts accompanied with basal sand beds (Ikehara et al., 2016), showing high amplitudes of reflection in SBP data. Therefore, the presence of sand beds ensures DTW for correlating acoustically transparent bodies of interest between two basins (e.g., Supplementary Figure S3).
Results
Inferred Flow Pathways and Accumulation Along the Trench
Using a DEM made through combining the bathymetry data shallower than hadal depths and high-resolution bathymetry deeper than >5500 m, we calculated flow accumulation along the Japan Trench (Figure 2). The trench floor of the northernmost Japan Trench, where it connects to the Ogawara canyon, has the largest flow accumulation in the entire Japan Trench (trench-floor basin JTN08: 5.3 × 10¹⁰ m2). Similarly, the southernmost Japan Trench also can experience large flow accumulation as it connects to the Nakaminato canyon (trench-floor basin JTS01: 1.4 × 10¹⁰ m2). It is also fed by a smaller sediment routing system from the north (indicated by gray arrows in Figure 2) connecting trench-floor basins JTS04, JTS03, and JTS02 (see section “Identification, Dating, and Correlation of the Event Deposits Along the Trench” for these identified basins). On the other hand, the trench axis floors between 36.8°N and 36.9°N, 38.1°N and 38.3°N, 39.0°N and 39.3°N, 39.7°N and 40.0°N, and 40.1°N and 40.2°N, are fed by individual smaller sediment routing systems yield low flow accumulation values ranging between 1×10⁷–1×10⁸ m2. This suggests smaller catchment areas for sediment remobilization and/or less along-trench connectivity between these areas. The flow accumulation analysis also reveals that the different lateral sediment transport systems from the upper slope into the trench are funneled and can be reflected to form flow path systems along the trench axis for several tens of kilometers, connecting individual trench-slope basins. These systems are separated by bathymetric highs formed by the interconnection of different structural elements of the flexural-bended Pacific plate entering the subduction zone system.
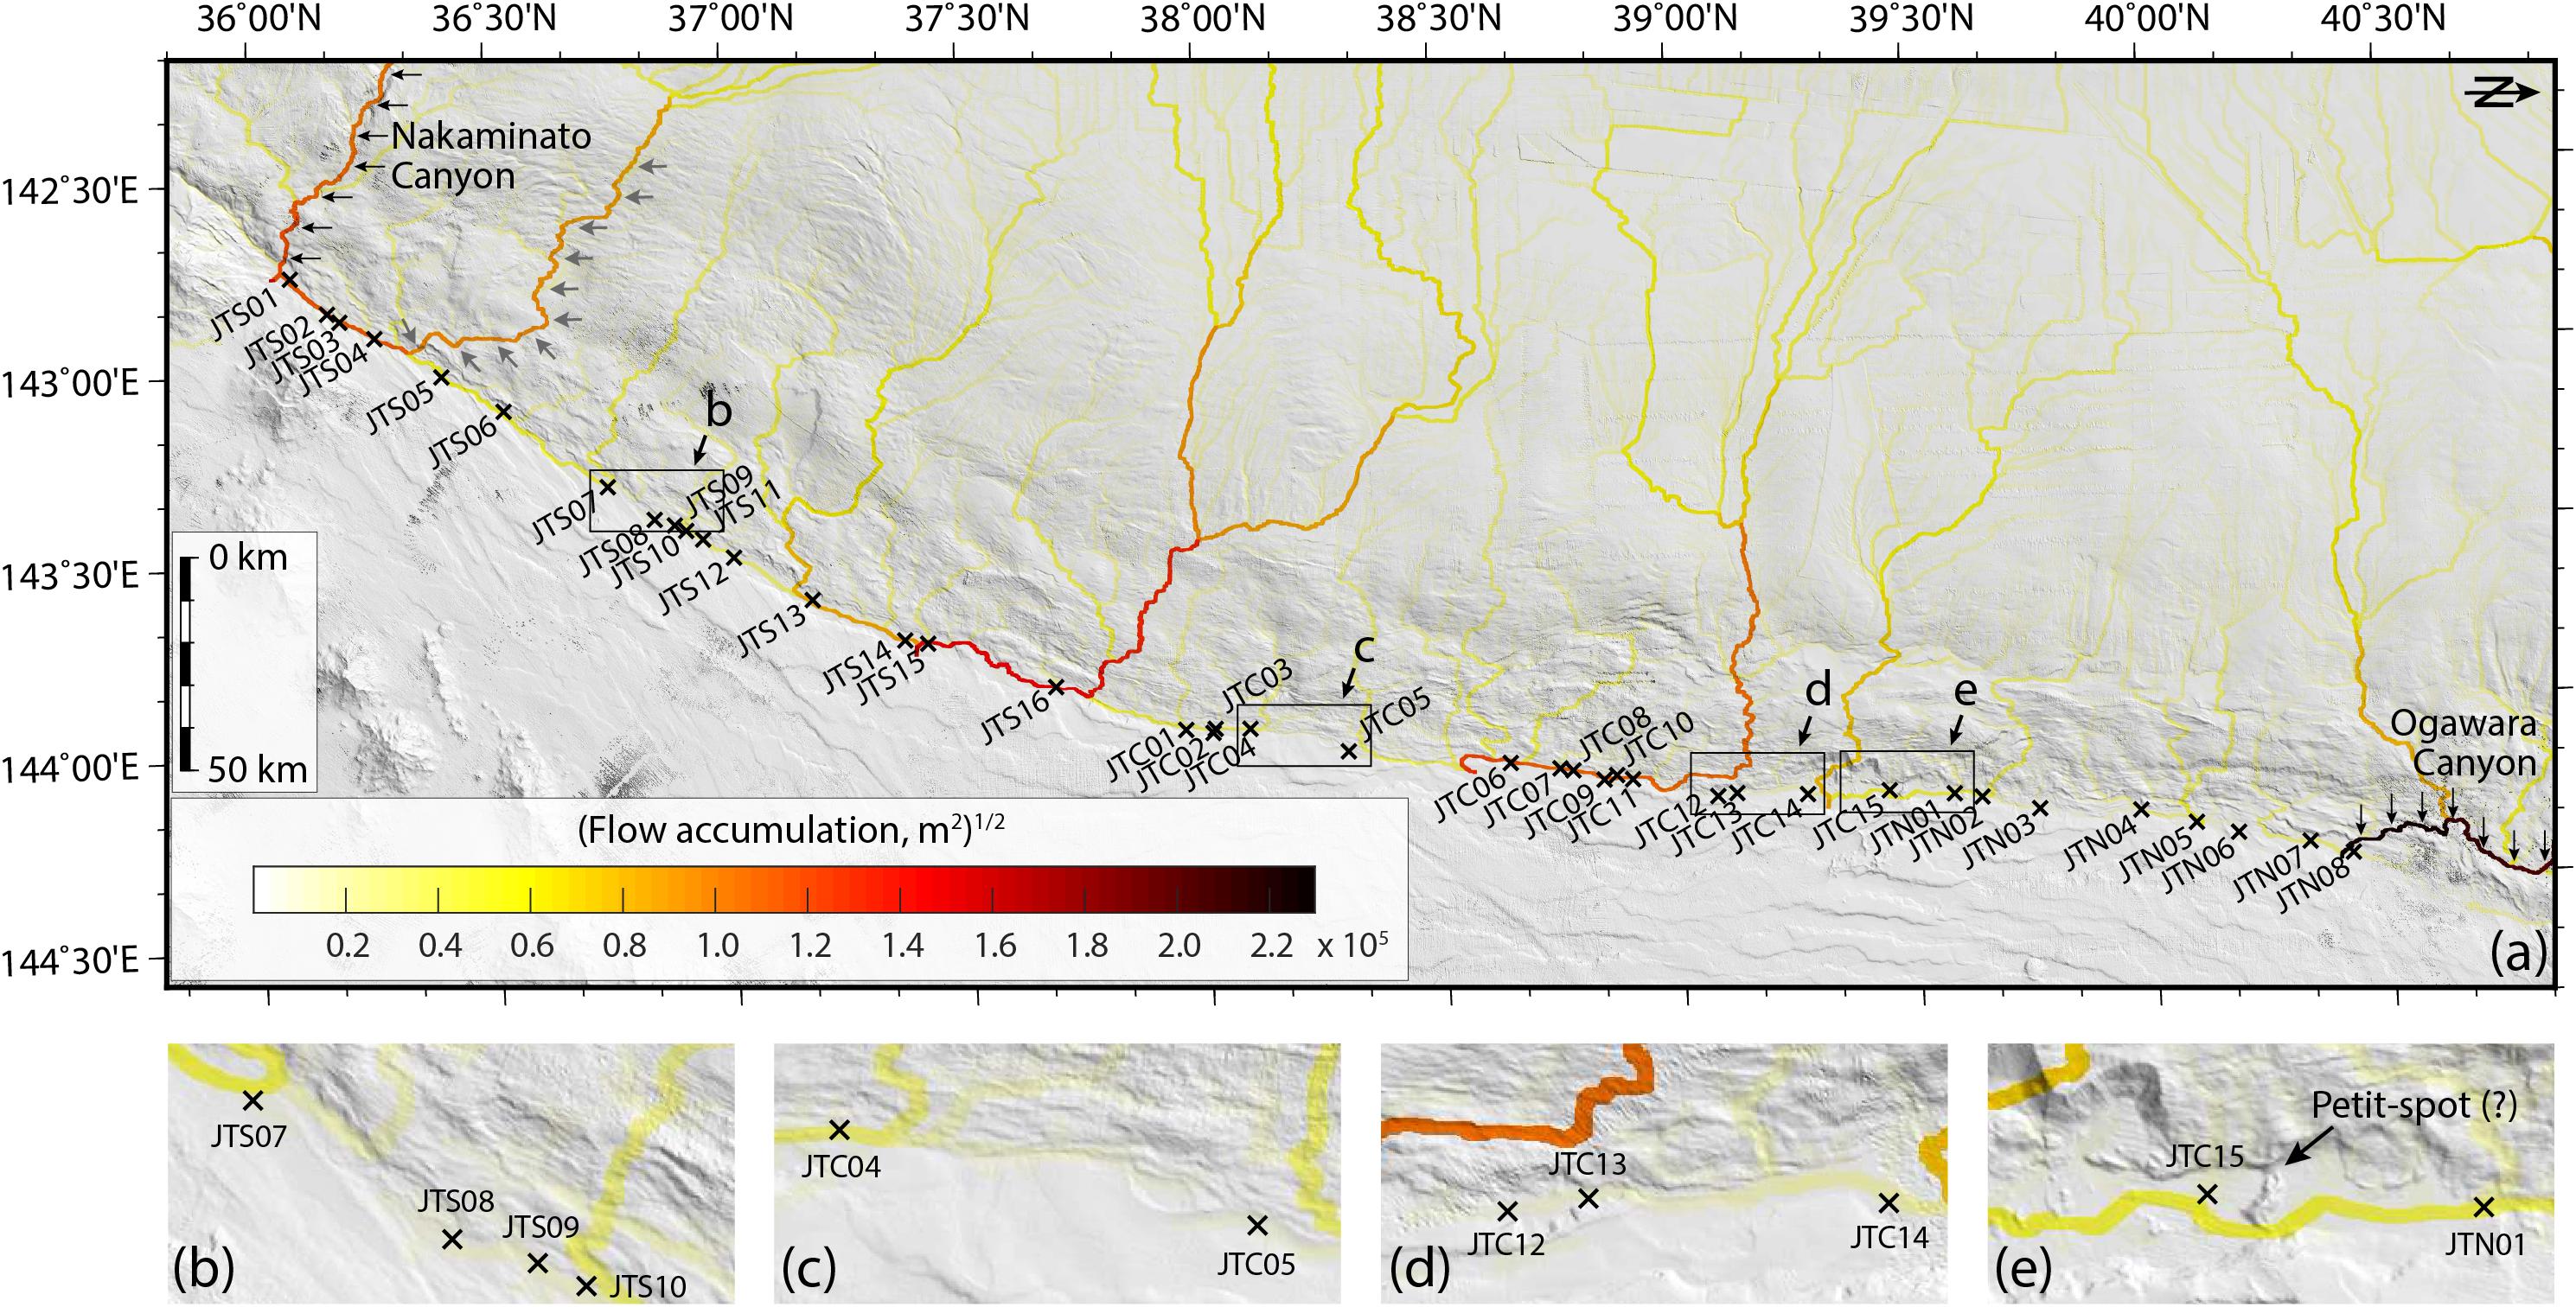
Figure 2. Flow accumulation in (a) the entire Japan Trench, (b) the southern Japan Trench, (c,d) the central Japan Trench, and (e) petit-spot area. The square root of flow accumulation (m2) is shown for the presentation purpose. The identified isolated fill-basins are also shown (see Figure 3).
Identification, Dating, and Correlation of the Event Deposits Along the Trench
Southern Japan Trench
The seafloor of the trench axis in the southern Japan Trench is up to 8,030 m deep in the southernmost segment (36.08°N), while it becomes shallower (7,560 m) in the northernmost segment at 37.7°N (Figure 3A). The overall quality of along-trench SBP data was relatively good even for deep and narrow trench-fill basins. The SBP data imaged laterally continuous reflection signals down to ∼40–100 millisecond two-way travel time (ms TWT) below the seafloor in the trench-fill basins (i.e., ∼30–80 m below the seafloor (mbsf) assuming P-wave velocities of 1,500–1,700 m/s). The SBP data at several basins had less signal penetration, partly due to complex subsurface structures with chaotic acoustic facies that strongly attenuated the acoustic signals. For example, deeper acoustic facies at the basins JTS05 and JTS13 might be interpreted as local mass-transport deposits (Strasser et al., 2013) or trench-sediment deformation structures (Kodaira et al., 2012). These structures are not further considered here for mapping the inferred deposits of fine-grained surficial slope remobilization events. Several acoustically transparent bodies of ∼1 to ∼8 ms TWT in thickness were interbedded in the laterally continuous, parallel reflection pattern within the trench-fill basins (Figure 4). With these data, we identified sixteen isolated trench-fill basins (JTS01–JTS16) in the southern Japan Trench (Table 1 and Figure 3A), that each comprises 1–7 event deposits clearly imaged in SBP data. The uppermost acoustically transparent body in SBP images that is related to recent remobilization events linked to the AD 2011 earthquake (Kioka et al., 2019) was recognized in most of identified basins.
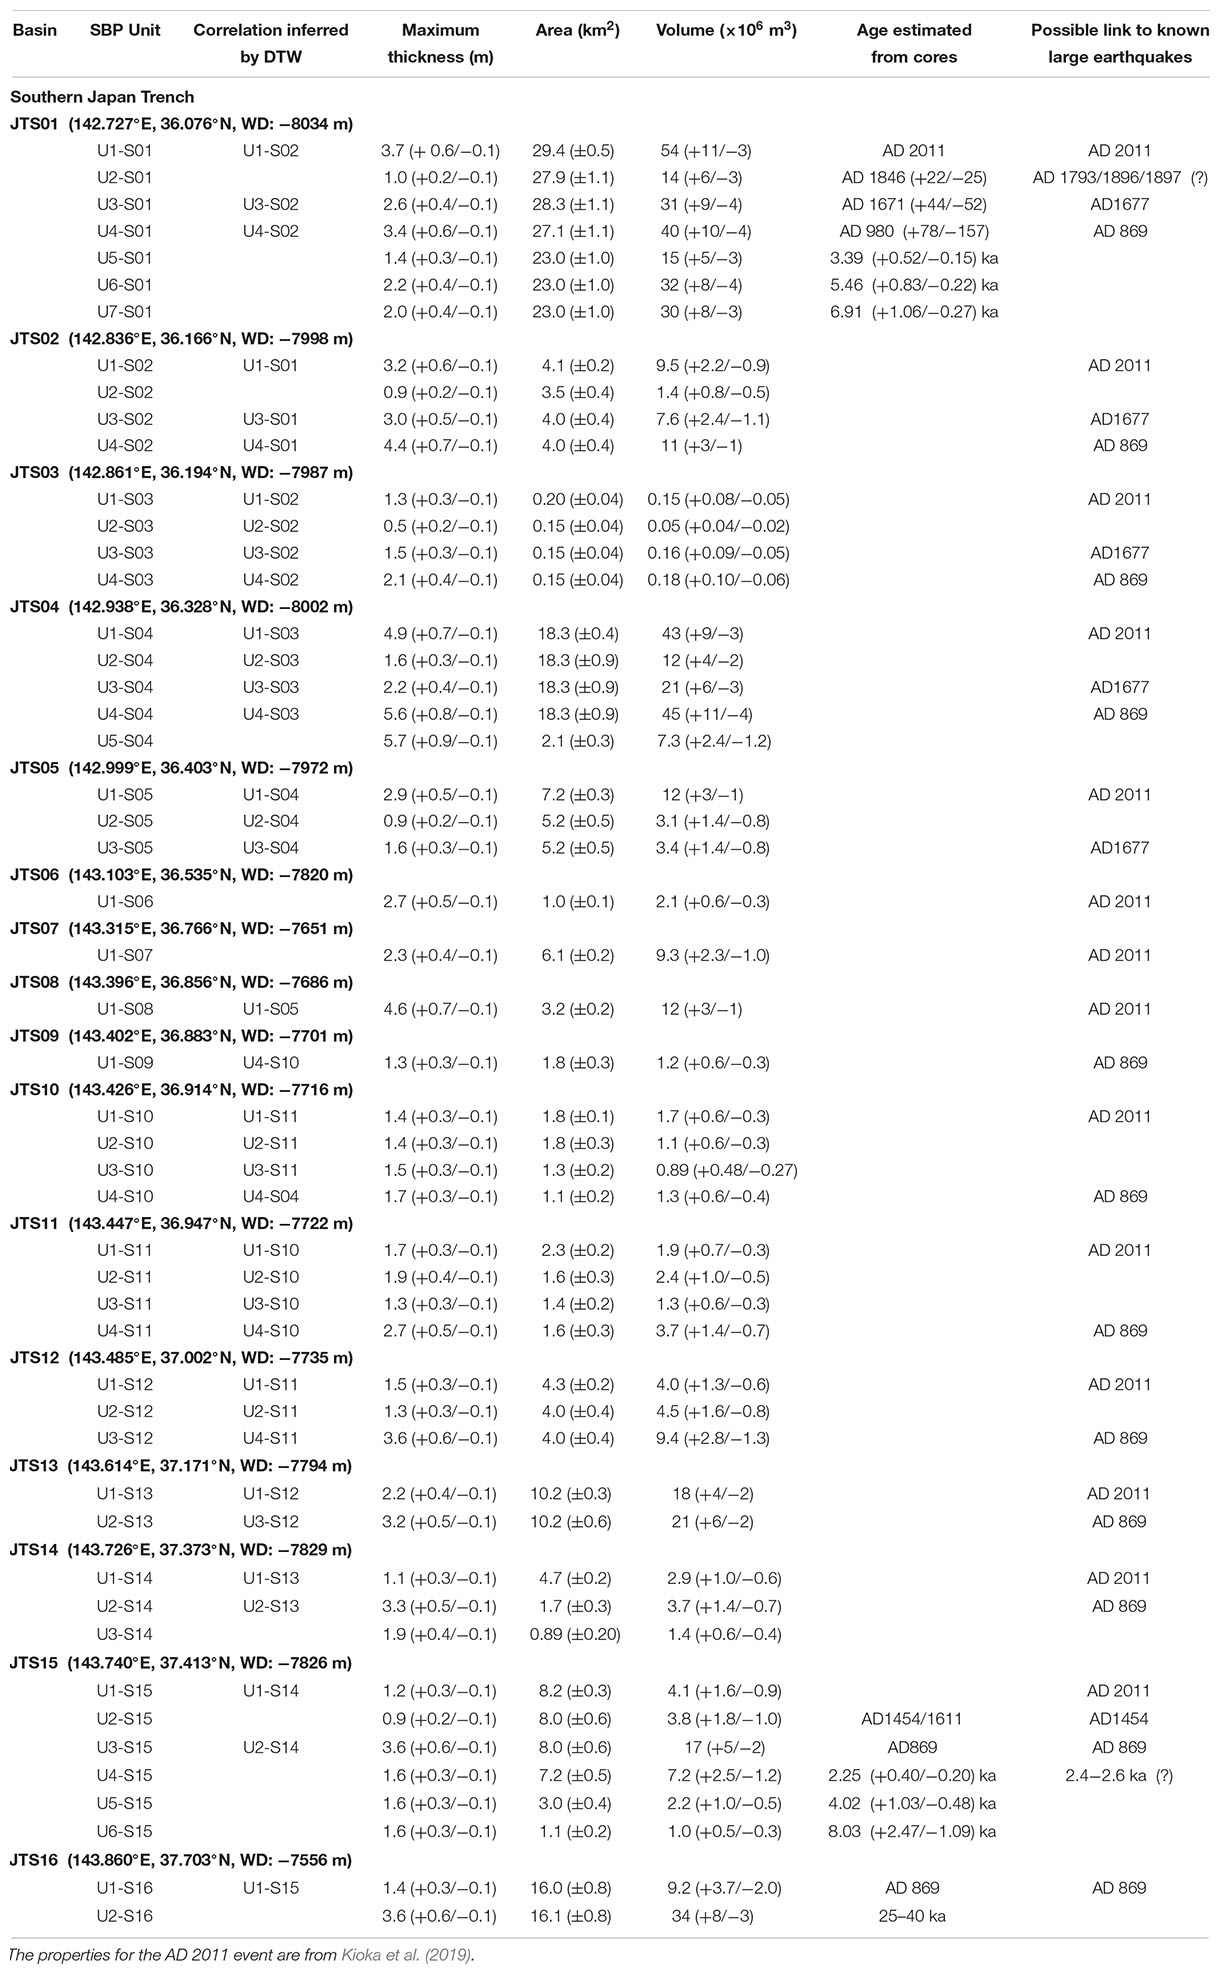
Table 1. Longitude, latitude and water depth (WD) of modern depocenter, acoustically transparent SBP body units, correlation to neighboring SBP units inferred by DTW, maximum thicknesses, areal extents, and volumes of identified event deposits, estimated ages from cores, and possible links to historically known large earthquakes at a given trench fill-basin in the southern Japan Trench.
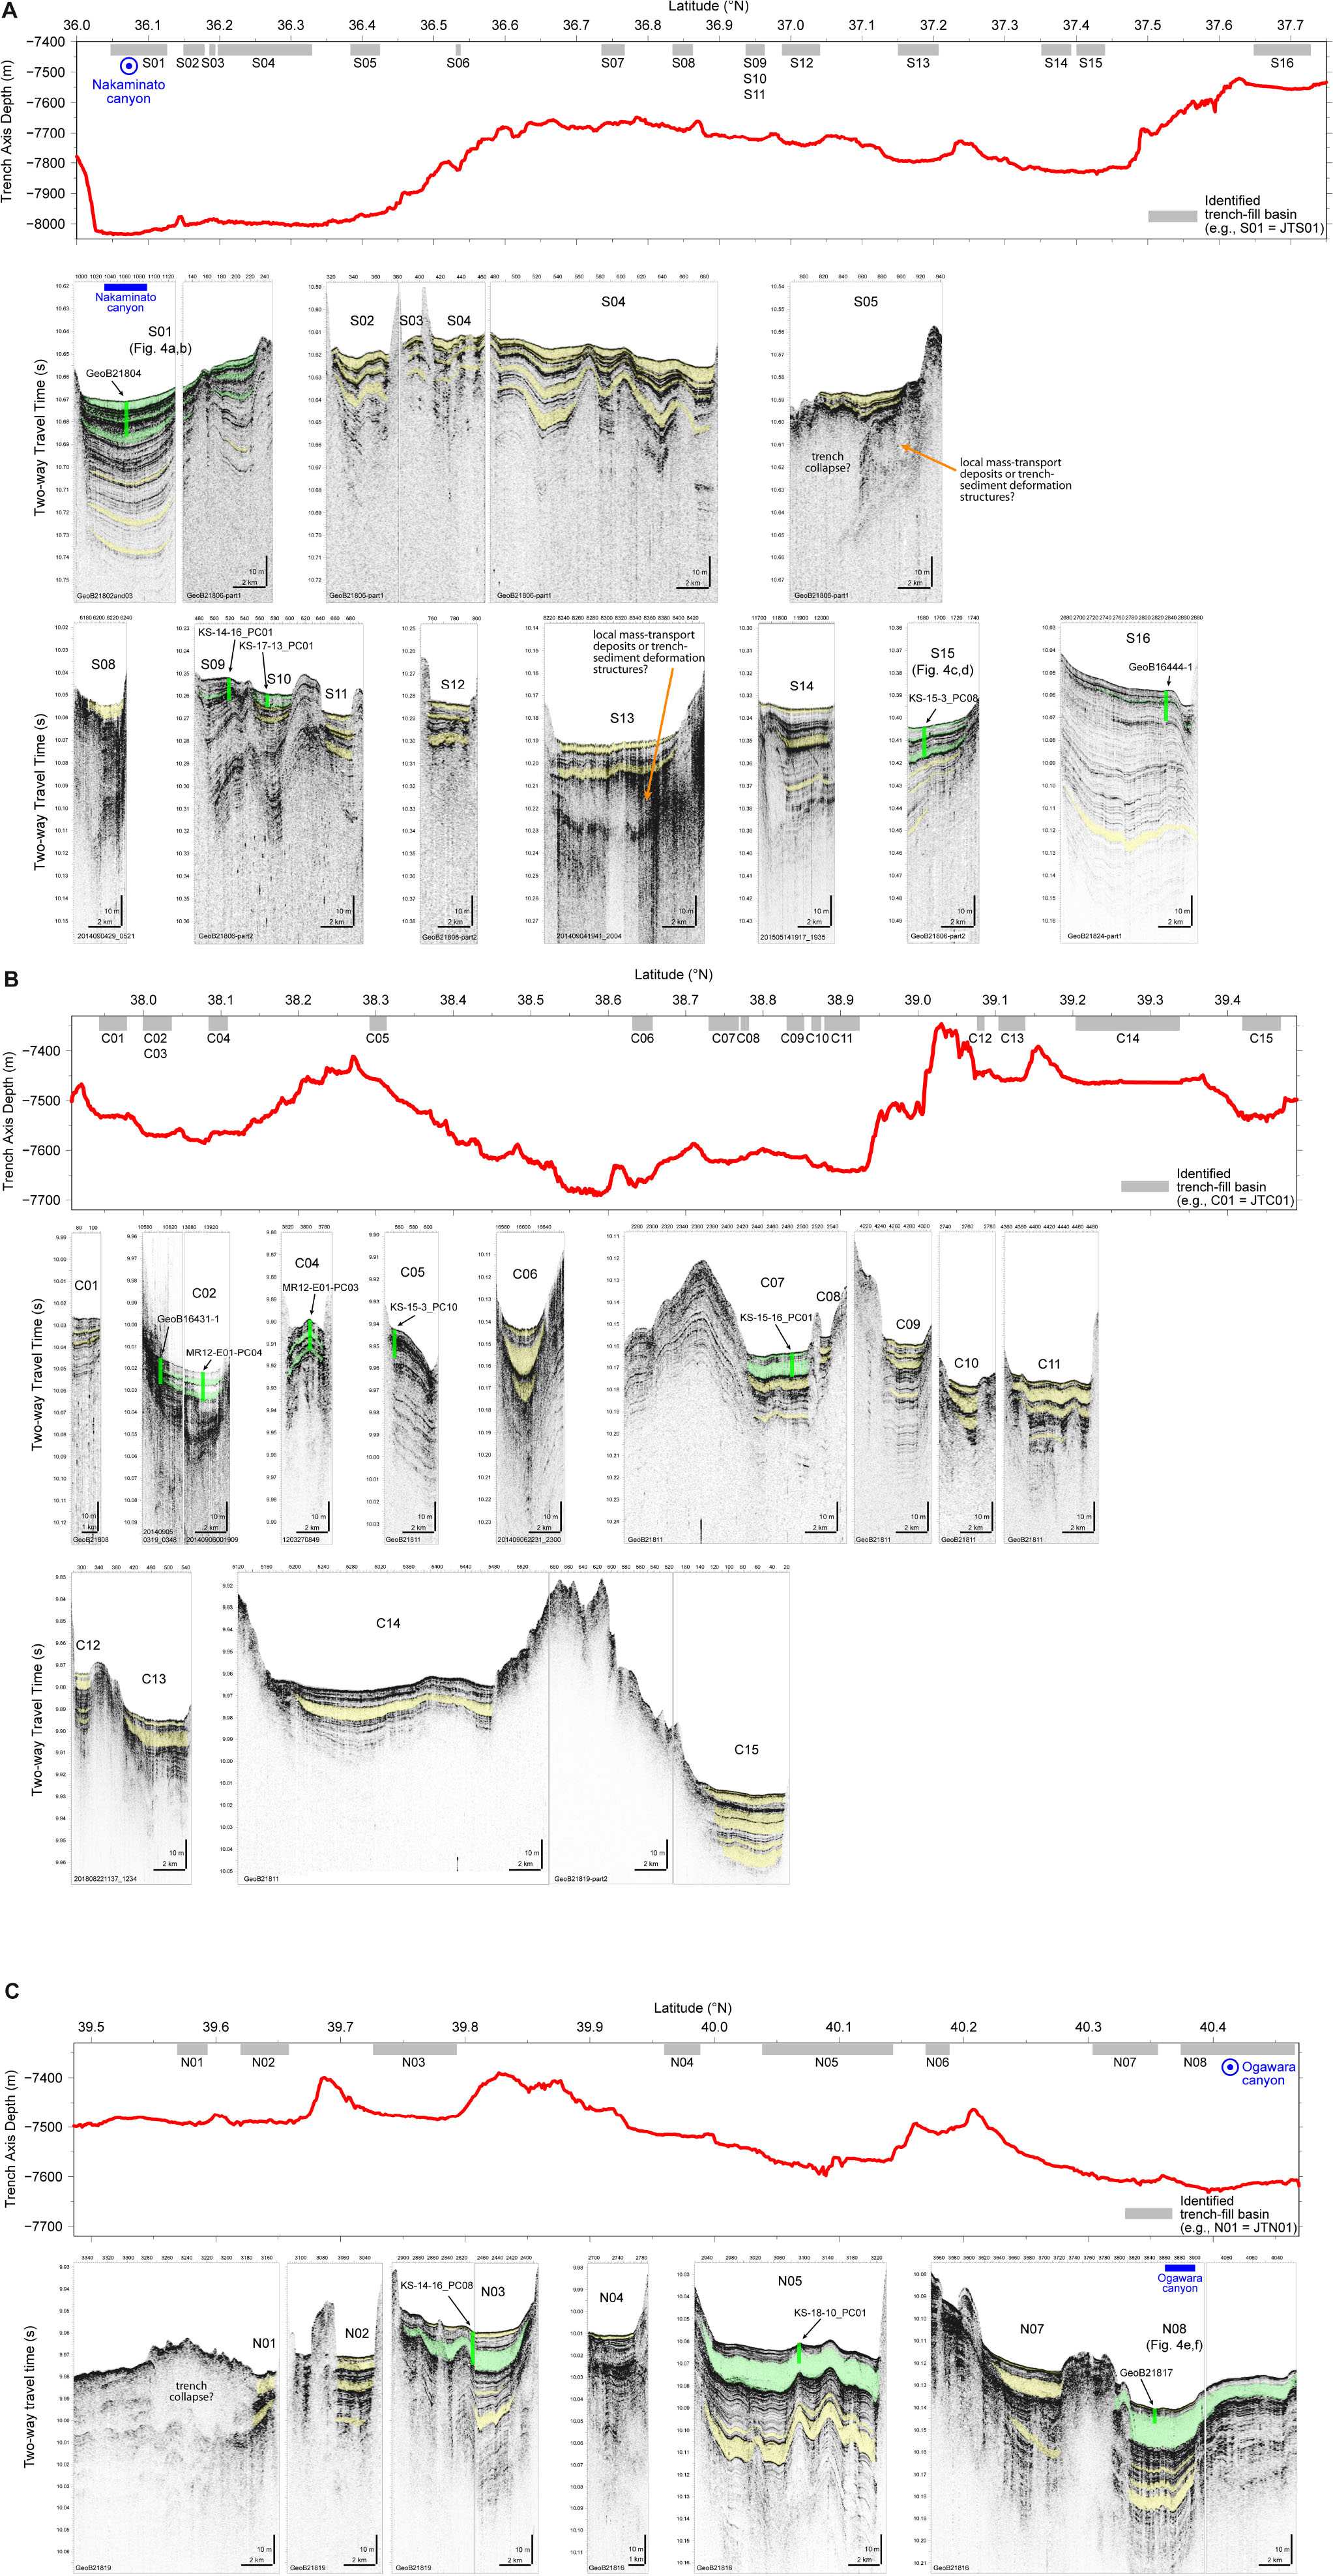
Figure 3. Water depth, identified trench-fill basins, and their SBP images along the trench axis of (A) southernJapan Trench, (B) central Japan Trench, and (C) northern Japan Trench. Yellow fills are identified acoustically transparent event bodies based solely on SBP data, whereas green fills are the acoustically transparent event bodies validated by sediment cores.
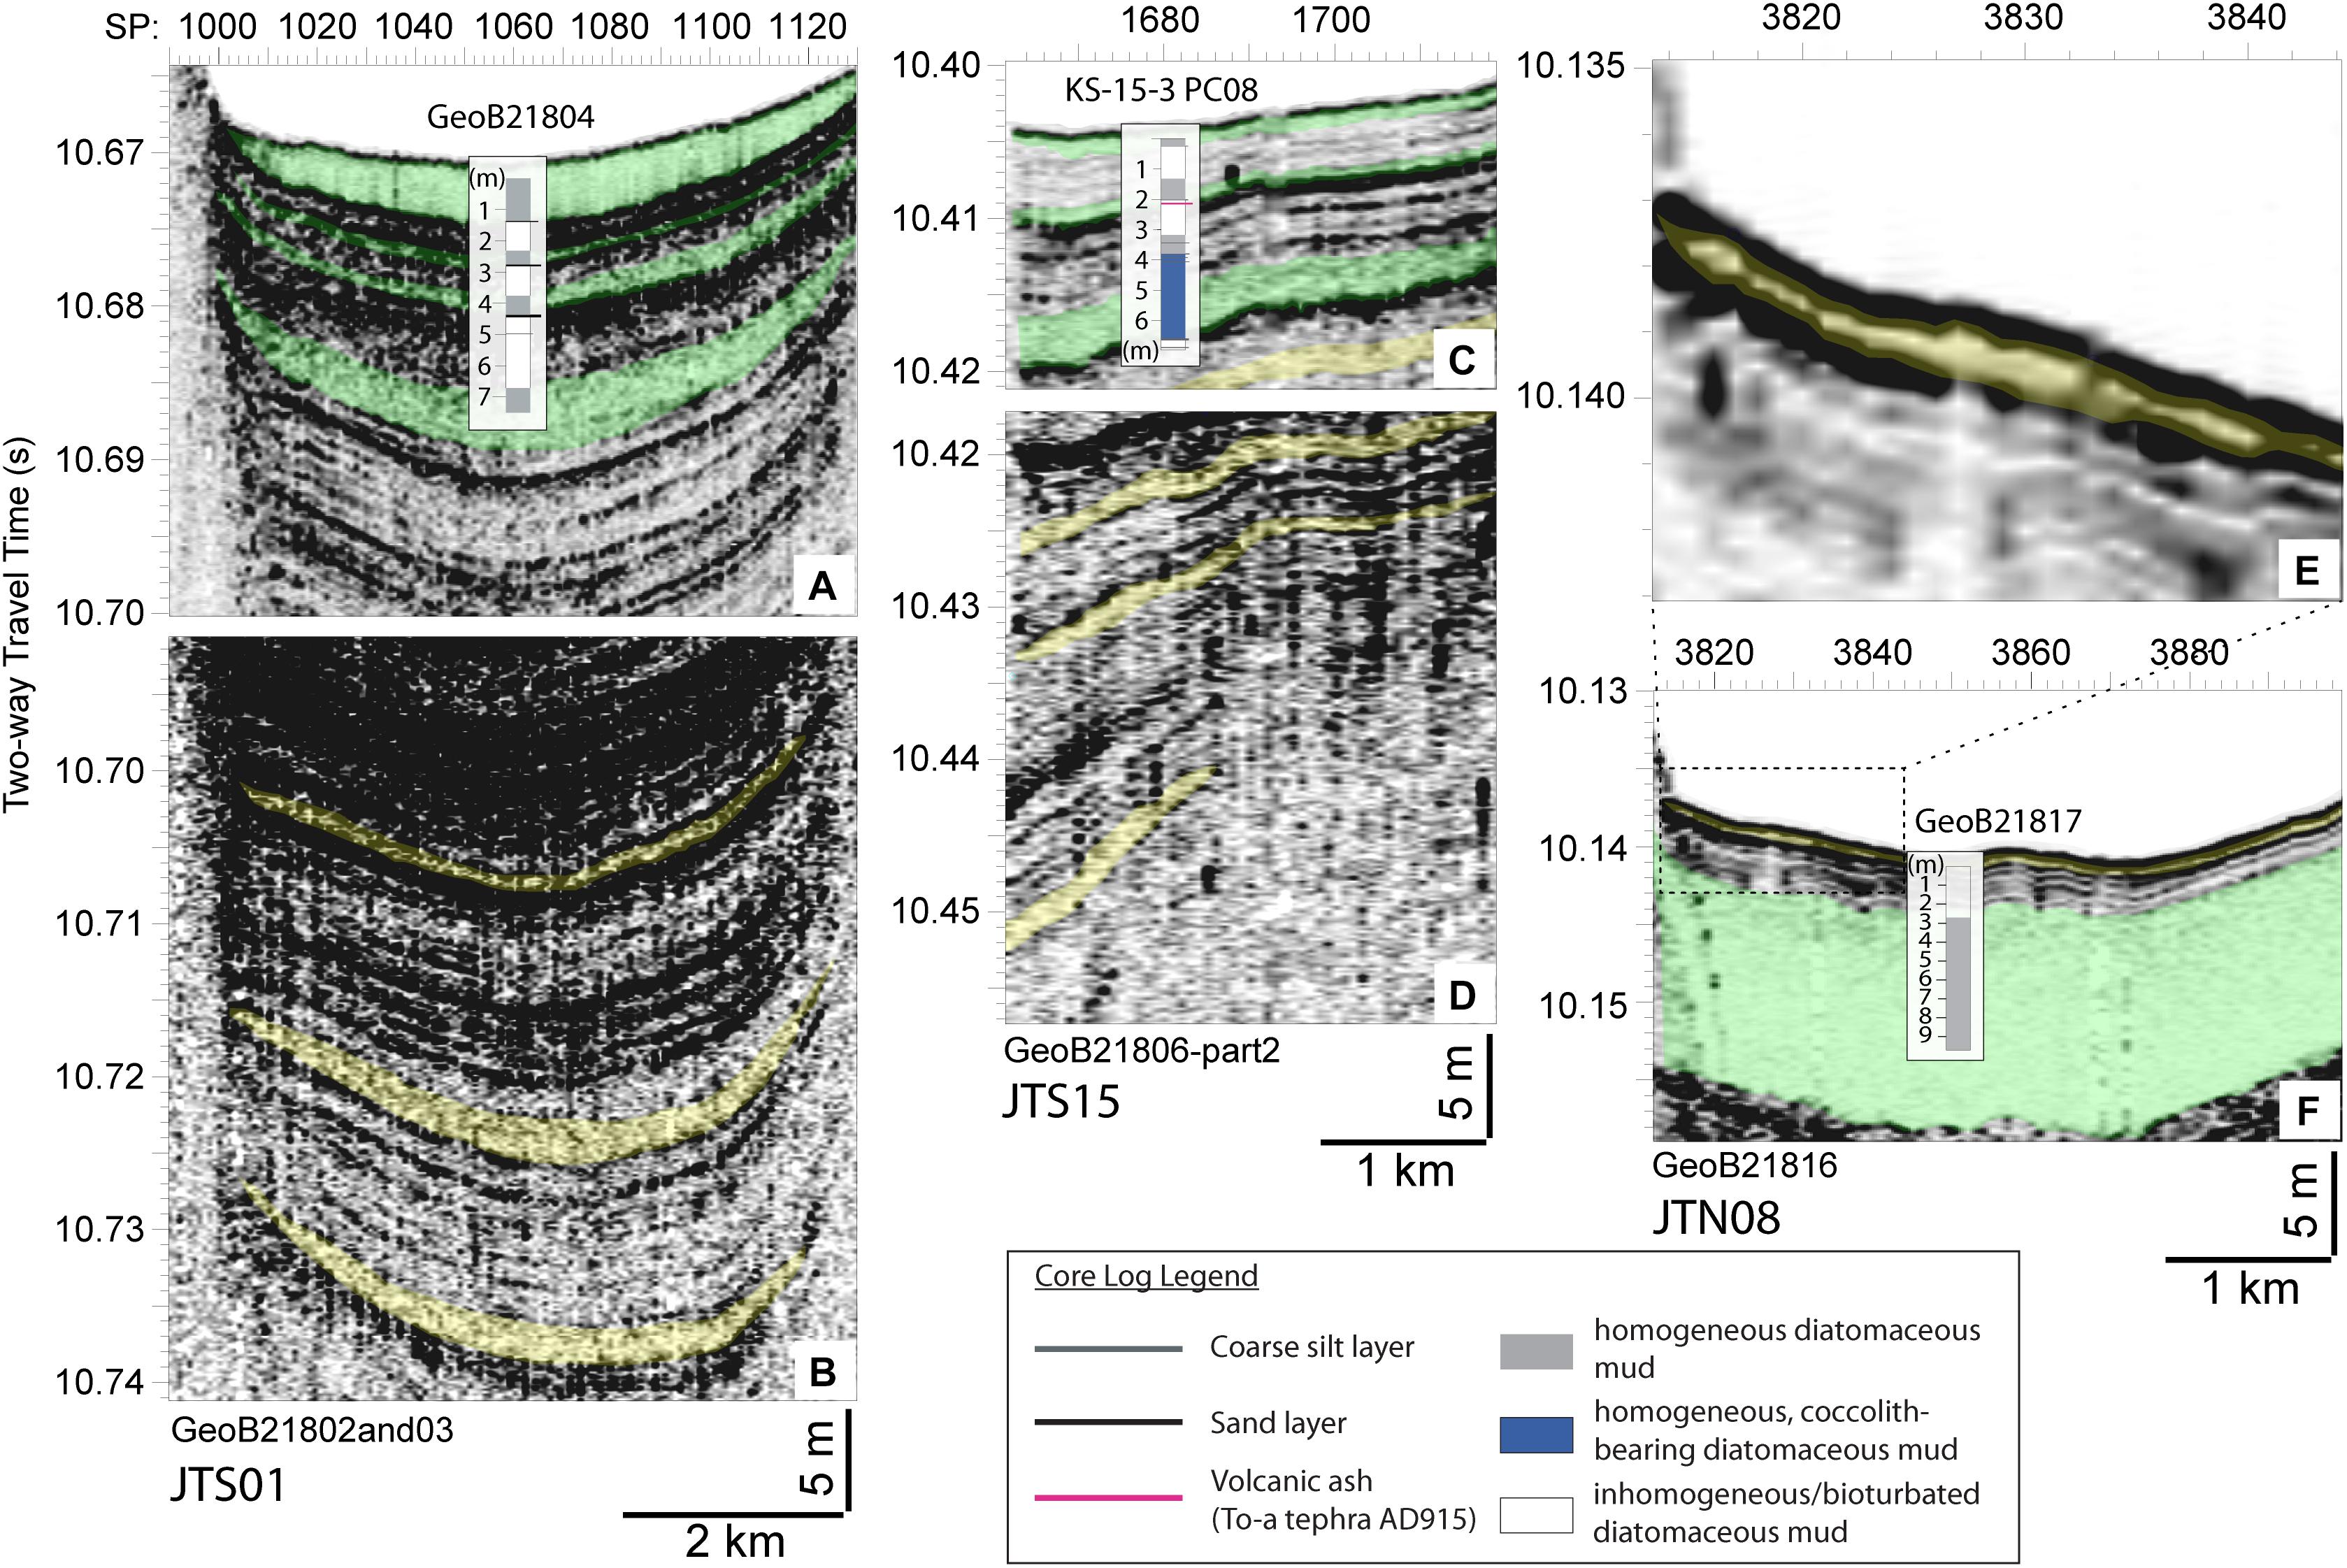
Figure 4. Close-up examples of acoustically transparent bodies and SBP-to-core correlation. Note that the deeper intervals of SBP images (B,D) are gained as compared with the shallower intervals (A,C). The deeper interval of SBP image (F) is presented at a reduced vertical exaggeration as compared with the shallower interval (E).
At the southernmost basin (JTS01), the largest trench-fill basin located at the deepest water depth, seven acoustically transparent bodies (U1-S01, U2-S01, …, U7-S01) were identified in the ∼50 m thick stratigraphic succession imaged by the SBP data (Figures 3A, 4A,B). The core GeoB21804 taken from the depocentre of JTS01 basin exhibits olive-gray diatomaceous mud interbedded with silt laminae, sand beds with sharp upper and lower contacts, and intervals of mixed mud (Figure 5; Strasser et al., 2017). The visual core description, magnetic susceptibility data (Strasser et al., 2017) and detailed analyses of radiograph images (this study; Figure 5) of core GeoB21804 document four stratigraphic levels of (50–140 cm) thick homogenous-to-mixed diatomaceous mud with thin (few cm thick) basal fine-sand bed intercalated within bioturbated diatomaceous mud with silt laminae in the upper 7.5 mbsf (Figures 5, 6). Core-to-SBP correlation (Figures 4, 6) reveals very good correlation between event-deposits inferred from SBP interpretation and the four intervals of thick homogenous-to-mixed sediments, which thus are interpreted as event-deposits representing major sediment-remobilization events. The uppermost acoustically transparent body U1-S01 is the event deposit linked to the 2011 earthquake (Kioka et al., 2019). Bulk OC 14C ages of background sediment interbedded between the event deposits within the core GeoB21804 revealed a linear sedimentation rate of 5.44 (+0.13/-0.09) m/kyr for background sediment in the basin JTS01 (Figure 6 and Supplementary Figure S2). By extrapolating such inter-event linear sedimentation rates to the entire depth range covered by SBP data, the ages of the lower six acoustically transparent bodies (U2-S01, U3-S01, …, U7-S01) were estimated to be AD 1846 (+22/−25), AD 1671 (+44/−52), AD 980 (+78/−157), 3.39 (+0.52/−0.15) ka, 5.46 (+0.83/−0.22) ka, and 6.91 (+1.06/−0.27) ka, respectively. The U4-S01 [AD 980 (+78/−157)] showed the second largest volume of deposit in the basin S01 [0.040 (+0.010/−0.004) km3; Table 1].
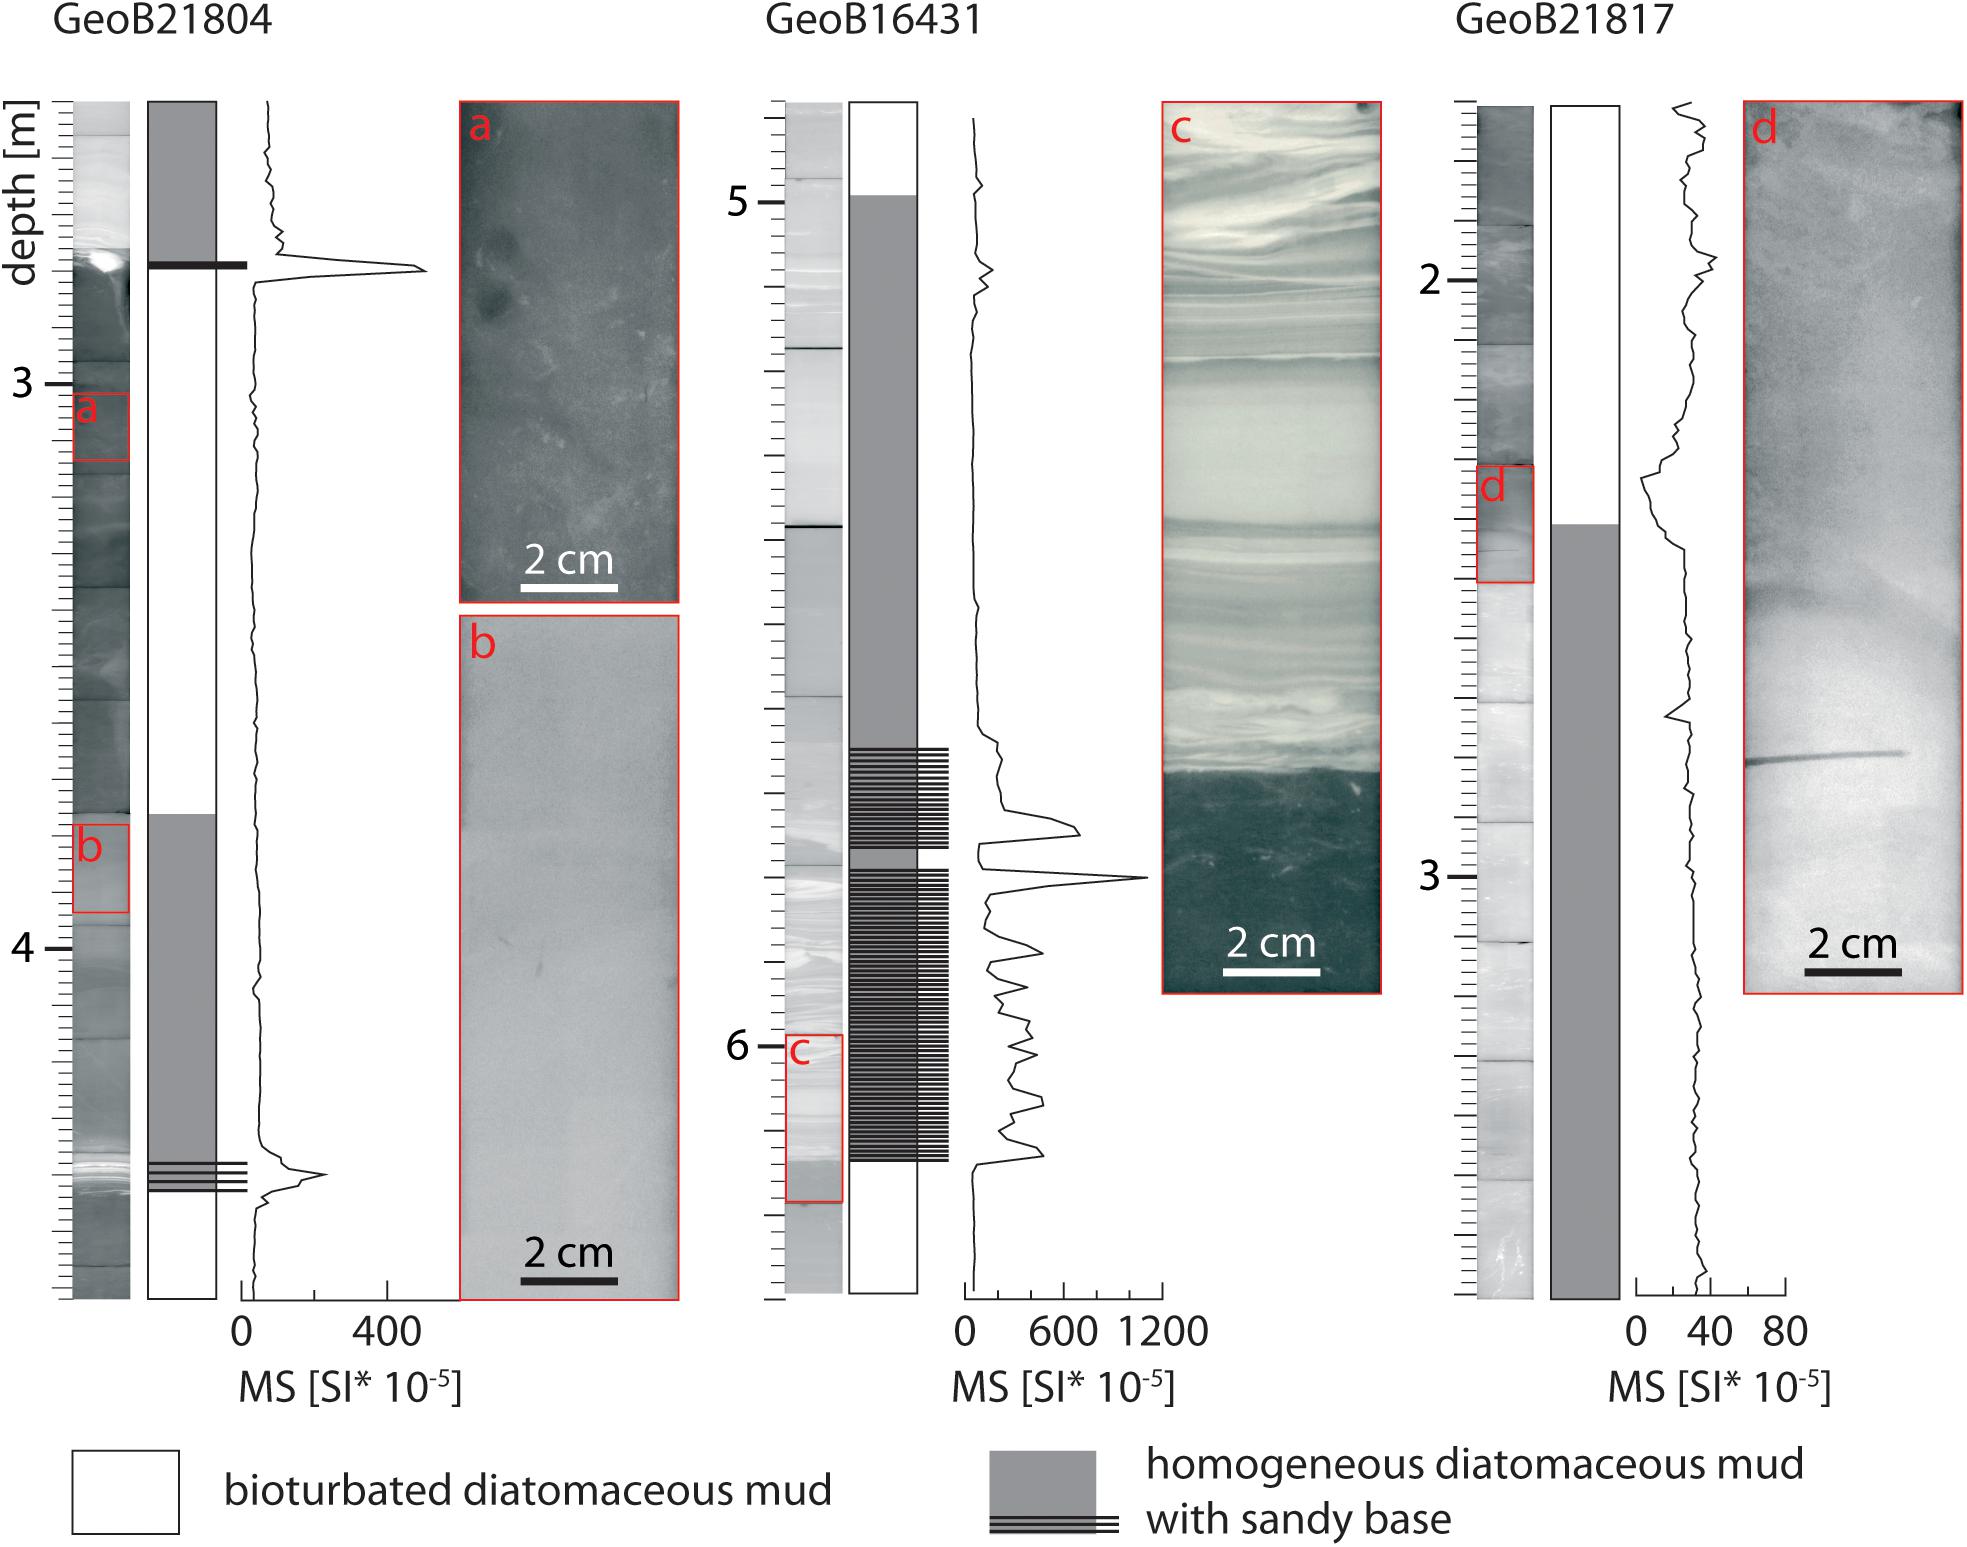
Figure 5. Typical examples of radiographs, photos, and magnetic susceptibility (MS) of sediment cores GeoB21804, GeoB16431, and GeoB21817 in the southern, central, and northern Japan Trench, respectively.
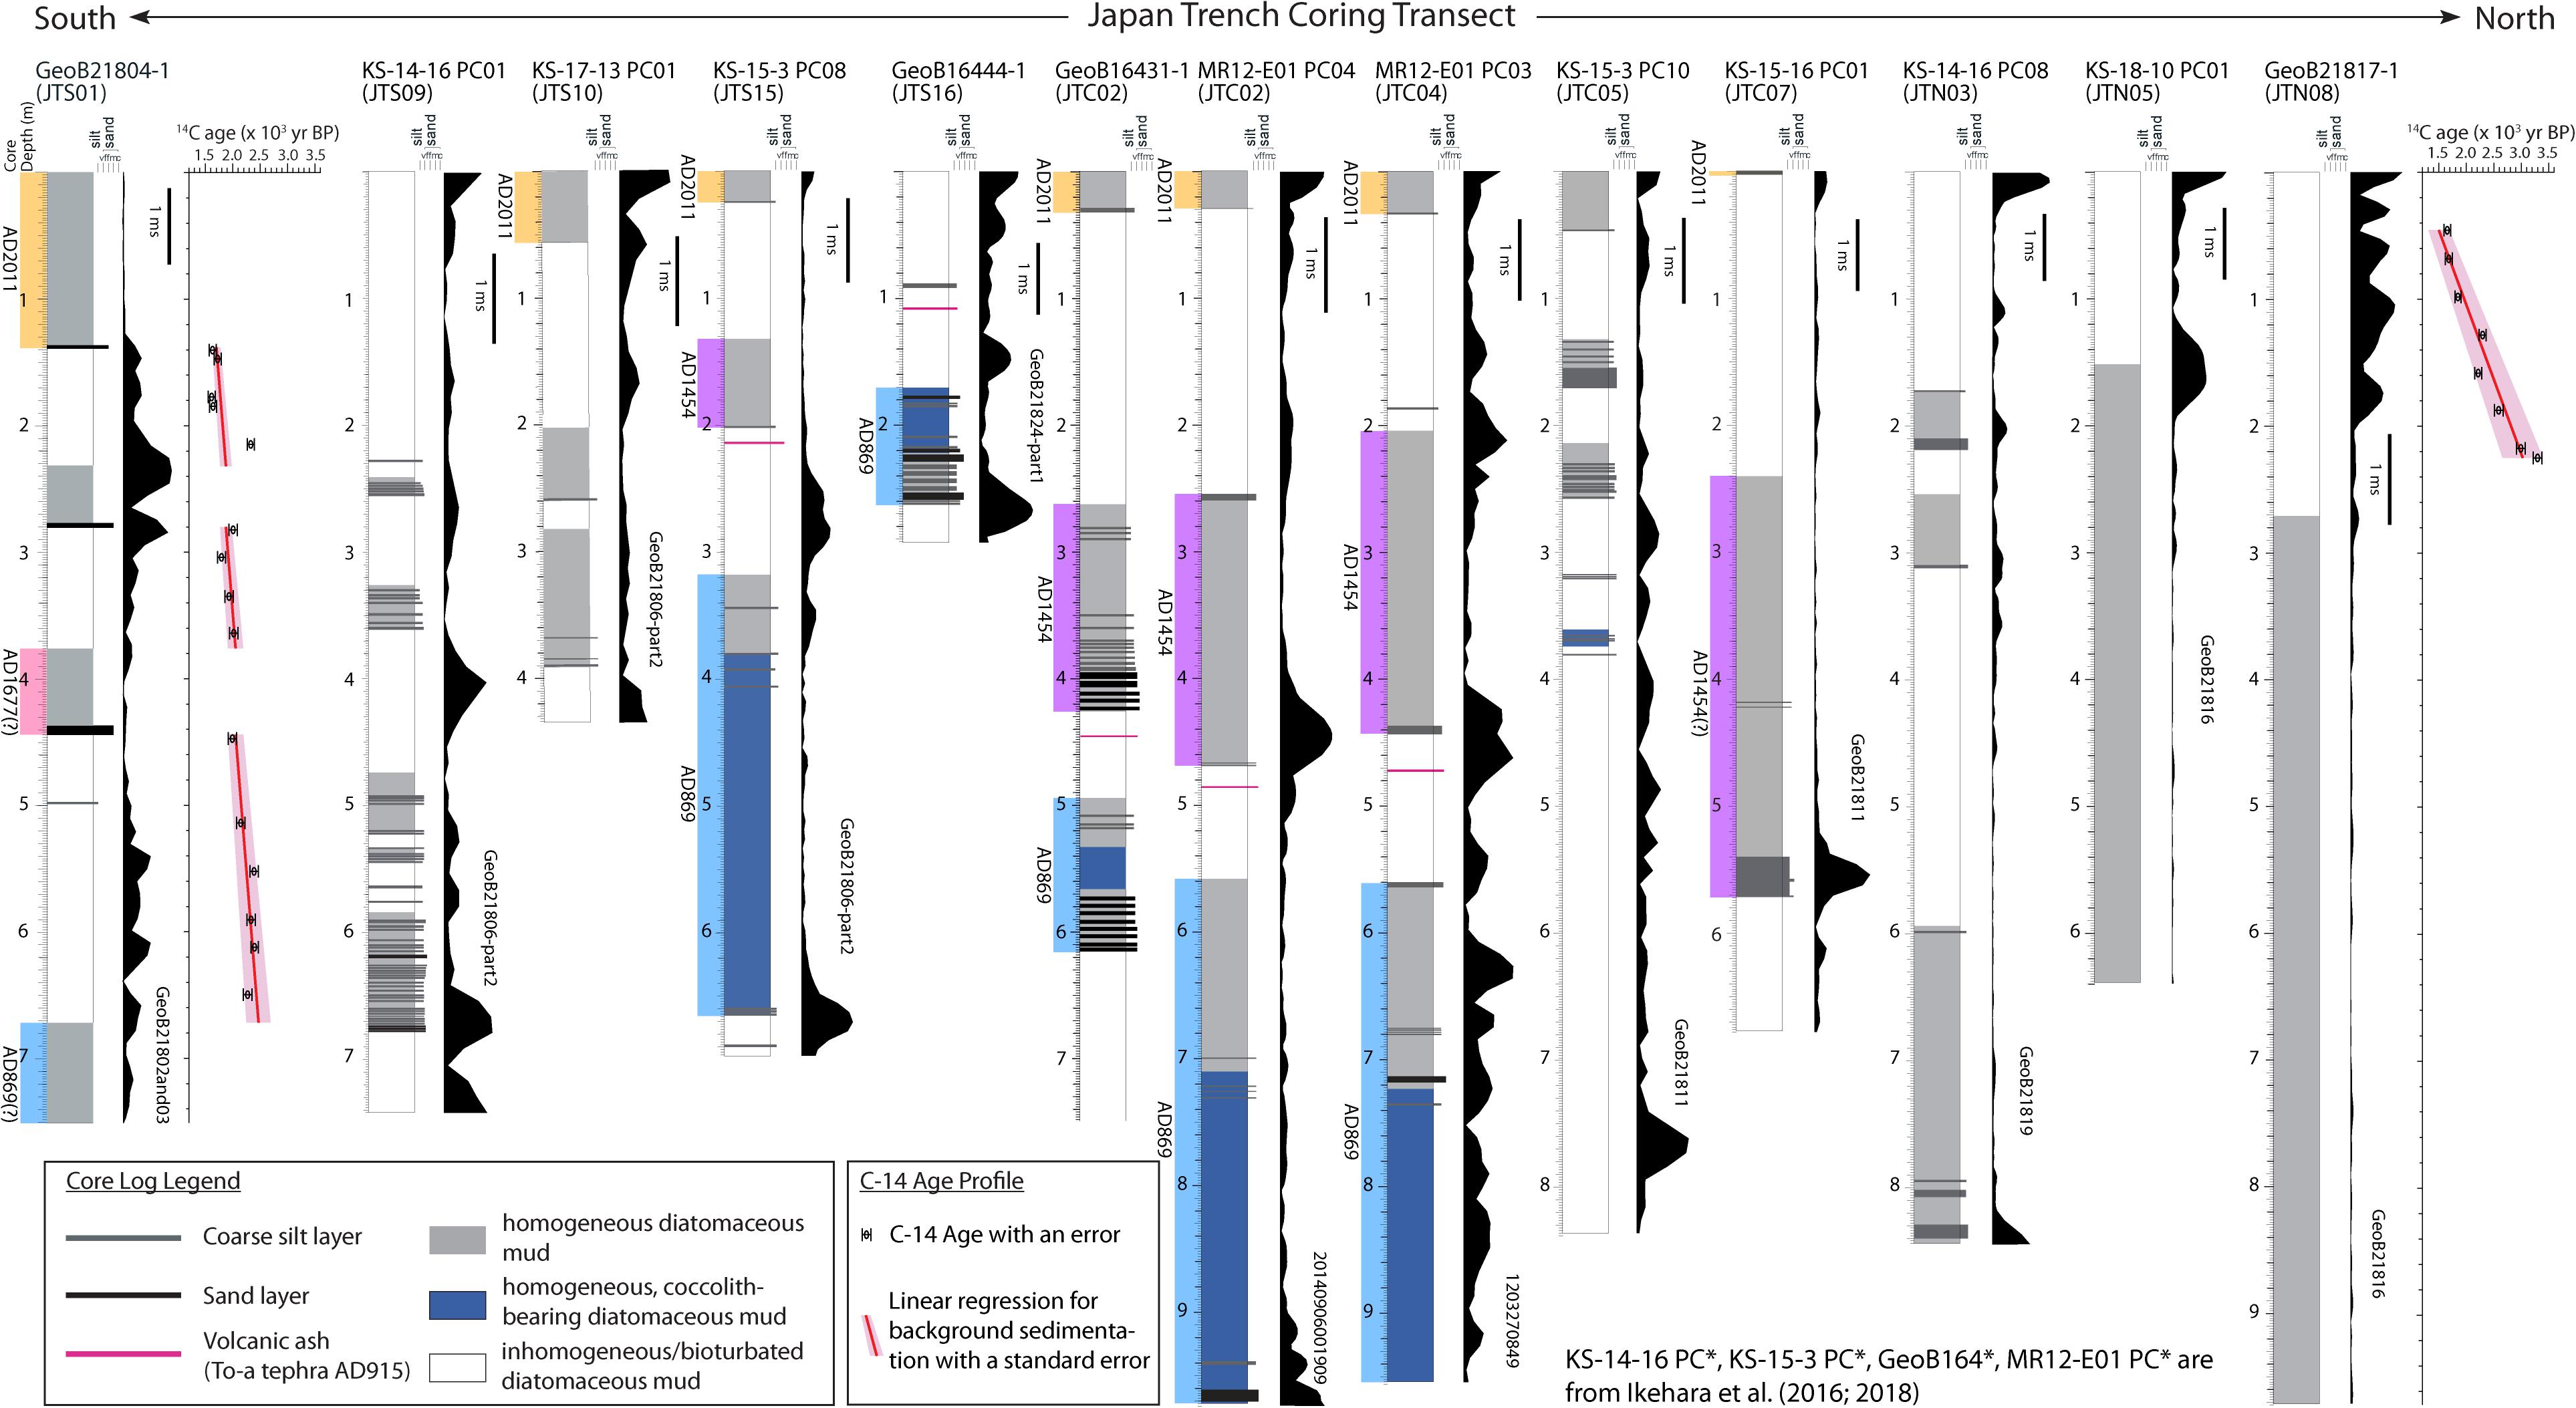
Figure 6. Sediment cores taken at the trench-fill basins of Japan Trench identified in this study, wiggles of SBP data at the core locations, and 14C age profile. The cores GeoB21804, KS-17-13 PC01, KS-15-16 PC01, KS-18-10 PC01, and GeoB21817 are from this study, while the other cores are from previous studies (Ikehara et al., 2016, 2018; Bao et al., 2018). See Figures 2–4 and Supplementary Figure S1 for the locations of cores.
At the basin JTS15, where flow accumulation is highest in the southern Japan Trench (Figure 2), six acoustically transparent bodies (U1-S15, U2-S15, …, U6-S15) were identified in SBP data (Figures 3A, 4). The core KS-15-3 PC08 (Ikehara et al., 2018) taken near the depocenter documented three homogenous deposits in the upper 7 mbsf that indicate that the upper acoustically transparent deposits (U1-S15, U2-S15, and U3-S15) correlate to the AD 2011 Tohoku-oki, AD 1454, and AD 869 Jogan earthquakes (Figures 4, 6). Assuming constant linear sedimentation rate inferred from inter-event background sedimentation, the lower three bodies U4-S15, U5-S15, and U6-S15 date back to 2.3 (+0.4/-0.2) ka, 4.0 (+1.0/-0.5) ka, and 8.0 (+ 2.5/-1.1) ka, respectively.
At the basin JTS16, located at shallowest water depth in the southern Japan Trench, we could identify only one very thin (∼5 ms TWT below the seafloor) and one deep (60–65 ms TWT below the seafloor) acoustically transparent body. Correlation between SBP data and core GeoB16444-1 (Ikehara et al., 2016) indicates that the upper very thin event deposit links to the event deposit of the AD 869 earthquake, and that the younger events (AD 1454 and 2011 earthquakes) positively identified in core data by Ikehara et al. (2016) are below the vertical resolution of the SBP data (and thus not considered in the SBP-data based event-stratigraphy mapping of this study). The deeper stratigraphic succession may also contain several events below SBP data resolution, but only one deeper (larger) SBP-resolved event deposit is clearly identified that dates back to 25–40 ka, when extrapolating a constant sedimentation rate as revealed from inter-event background sedimentation estimated from core GeoB16444-1.
Core-to-SBP data correlation is also relatively good in trench-basins JTS09 and JTS10, where acoustically transparent bodies in SBP data correlate with intervals of homogenous diatomaceous mud in cores KS-14-16 PC01 (Ikehara et al., 2018) and KS-17-13 PC01 (Figure 6). Although no age information on events deposits in these basins is available from core data, basin-to-basin correlation suggests that several acoustically transparent deposits, where imaged in neighboring trench-fill basins, can reliably be correlated across basins throughout the entire southern Japan Trench (Figure 7). Other than the 2011 event deposit (Kioka et al., 2019), for example, the acoustically transparent body U4-S01 [AD 980 (+78/-157)] in the basin JTS01 can be correlated widely to the acoustically transparent bodies at different basins and the 869 event deposit (U3-S15) in the basin JTS15. This indicated that the 869 Jogan event deposit was distributed mostly throughout the southern Japan Trench.
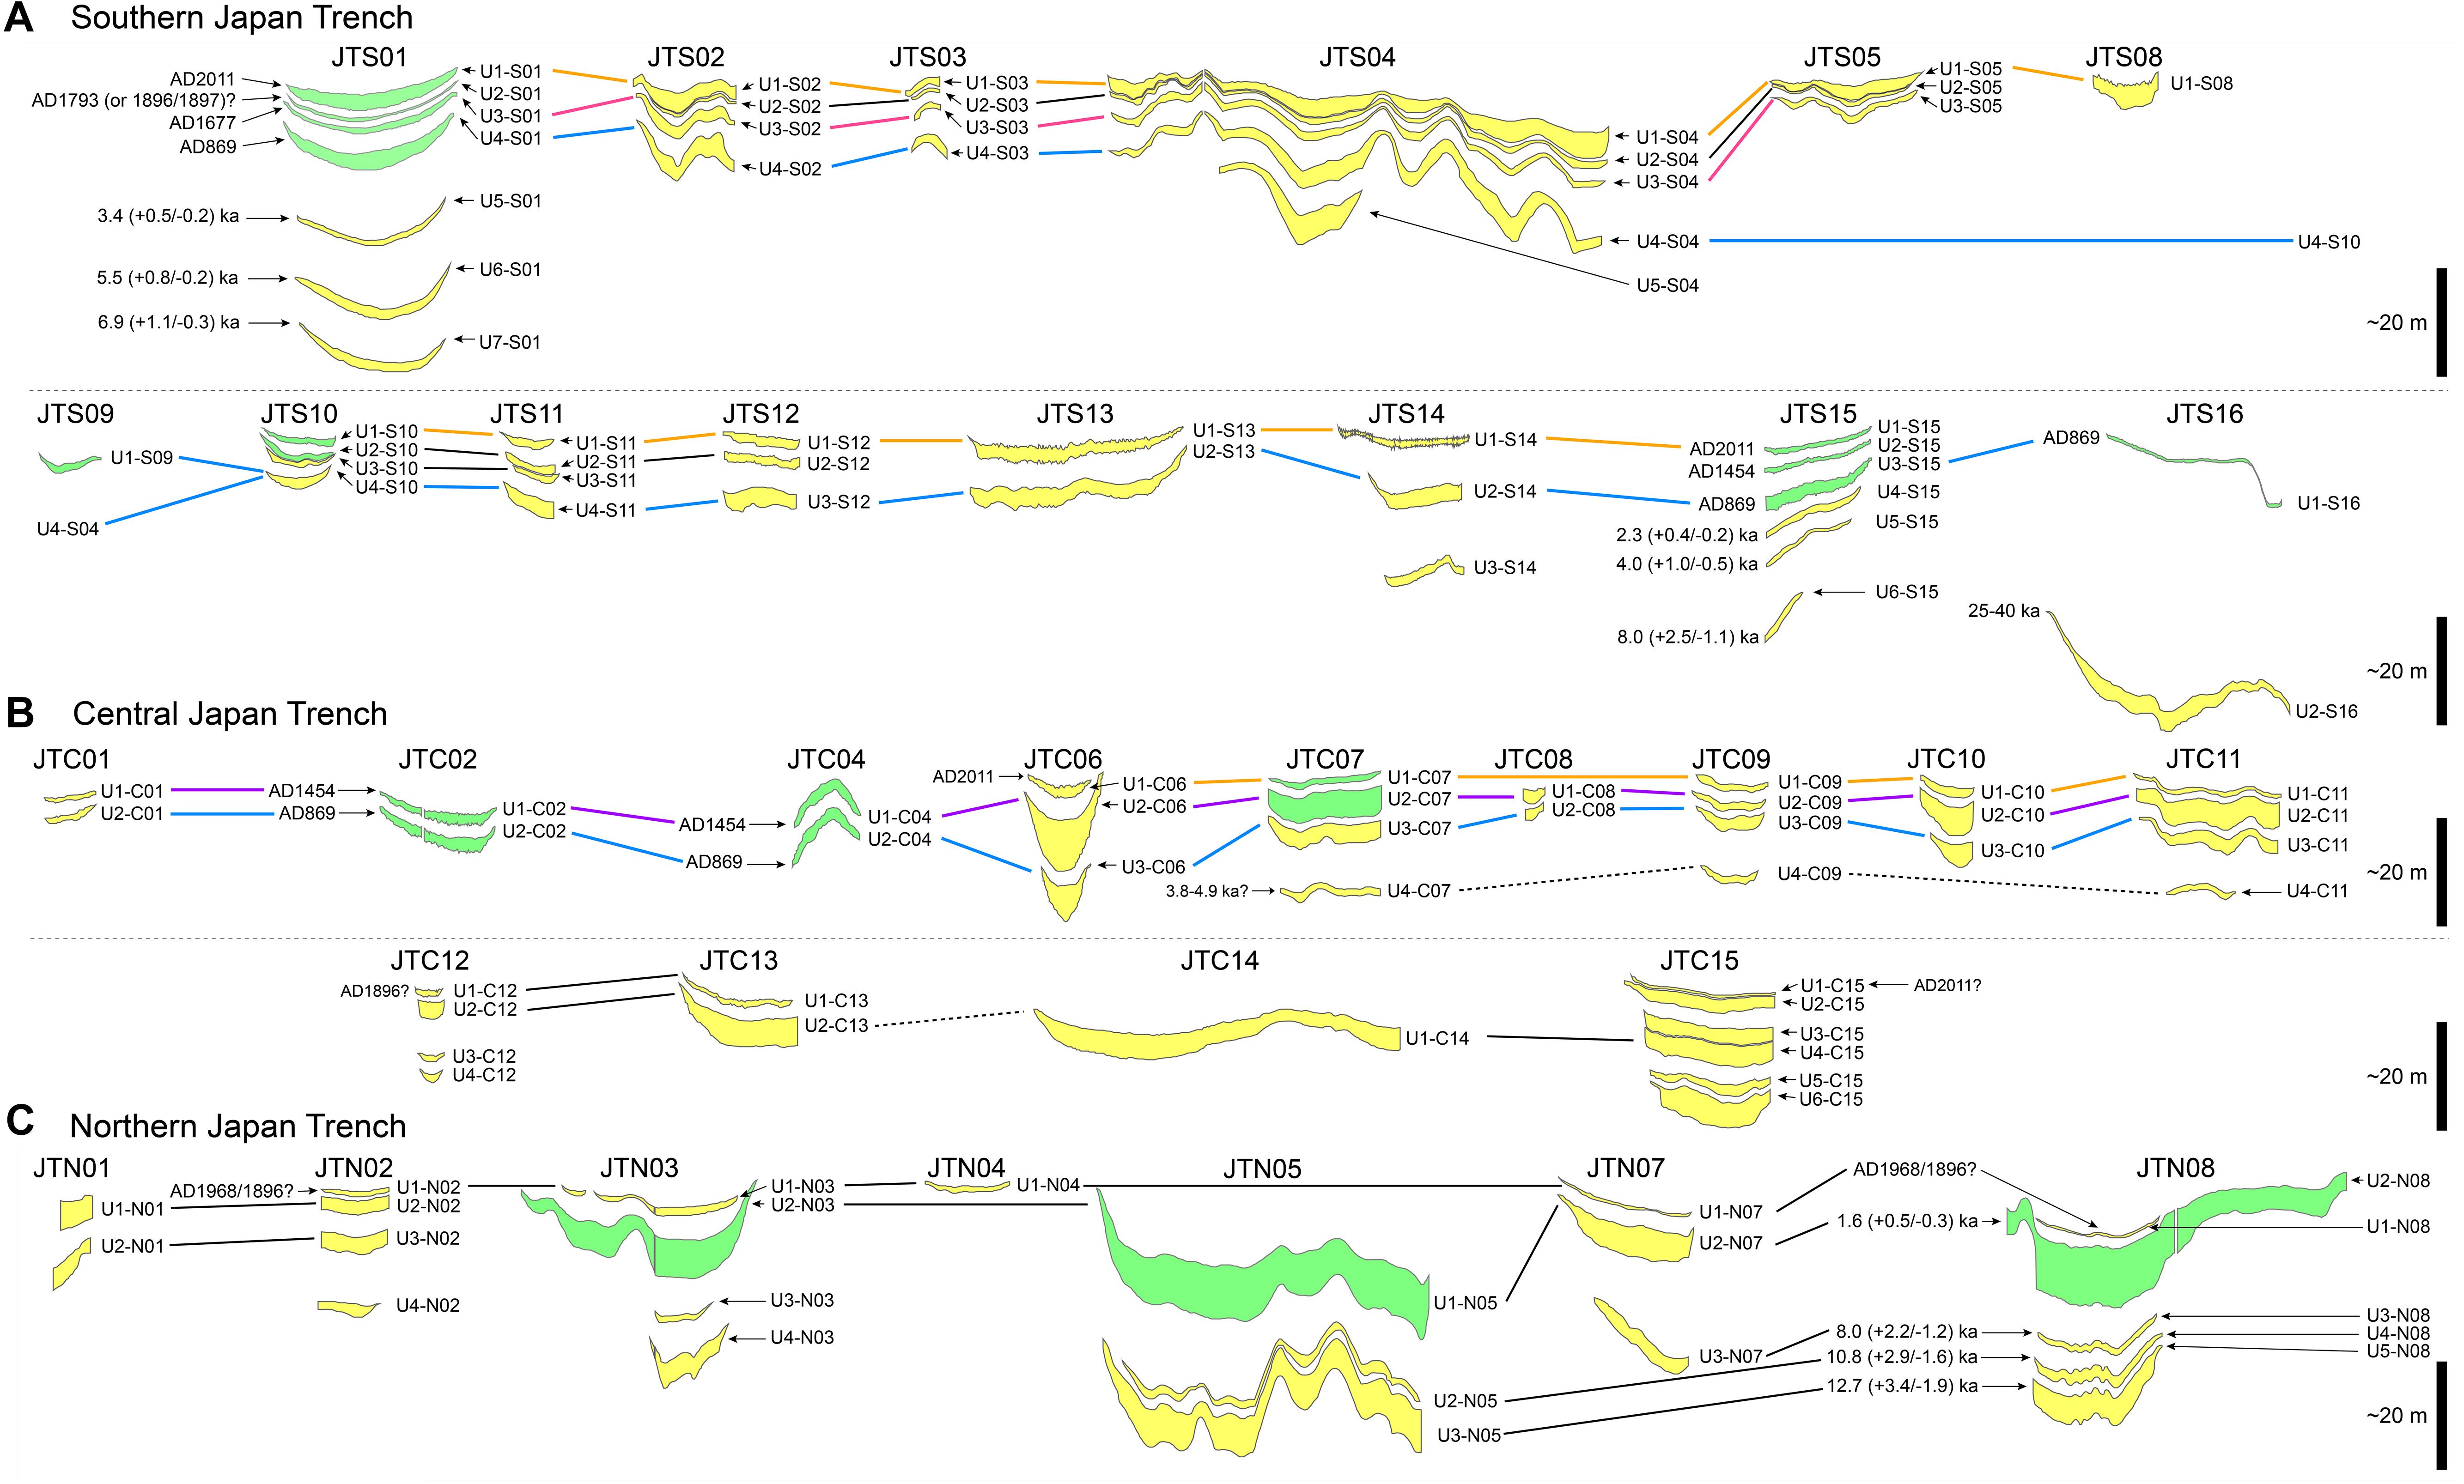
Figure 7. Correlation of identified event deposit bodies between neighboring trench-fill basins in (A) the southern Japan Trench, (B) the central Japan Trench, and (C) the northern Japan Trench. The solid lines connecting individual identified event units between different basins indicate that the correlation is supported either by both image interpretation and DTW or evidence from cores, while the dash lines connecting individual identified event units indicate the correlation is expected from either image interpretation or DTW.
Central Japan Trench
The water depth of the trench floor in the central Japan Trench is generally shallower than the southern Japan Trench, ranging between 7,350 and 7,690 m (Figure 3B). Most of SBP penetration in the central Japan Trench was limited to 35 ms TWT (26–30 m) below the seafloor. Nevertheless, we identified several acoustically transparent bodies of ∼1 to ∼13 ms TWT in thickness within the basins. We consequently identified fifteen isolated trench-fill basins (JTC01–JTC15) in the central Japan Trench (Table 2 and Figure 3B). The basins JTC01–JTC13 identified between 37.9° and 39.1°N are narrow and limited to 5 km long along the trench, because of local slumps and trench-floor deformation by coseismic slip-to-the trench (Kodaira et al., 2012; Strasser et al., 2013). Less connectivity along the trench axis was found between basins JTC04 and JTC05, JTC05 and JTC06, and JTC11 and JTC12.
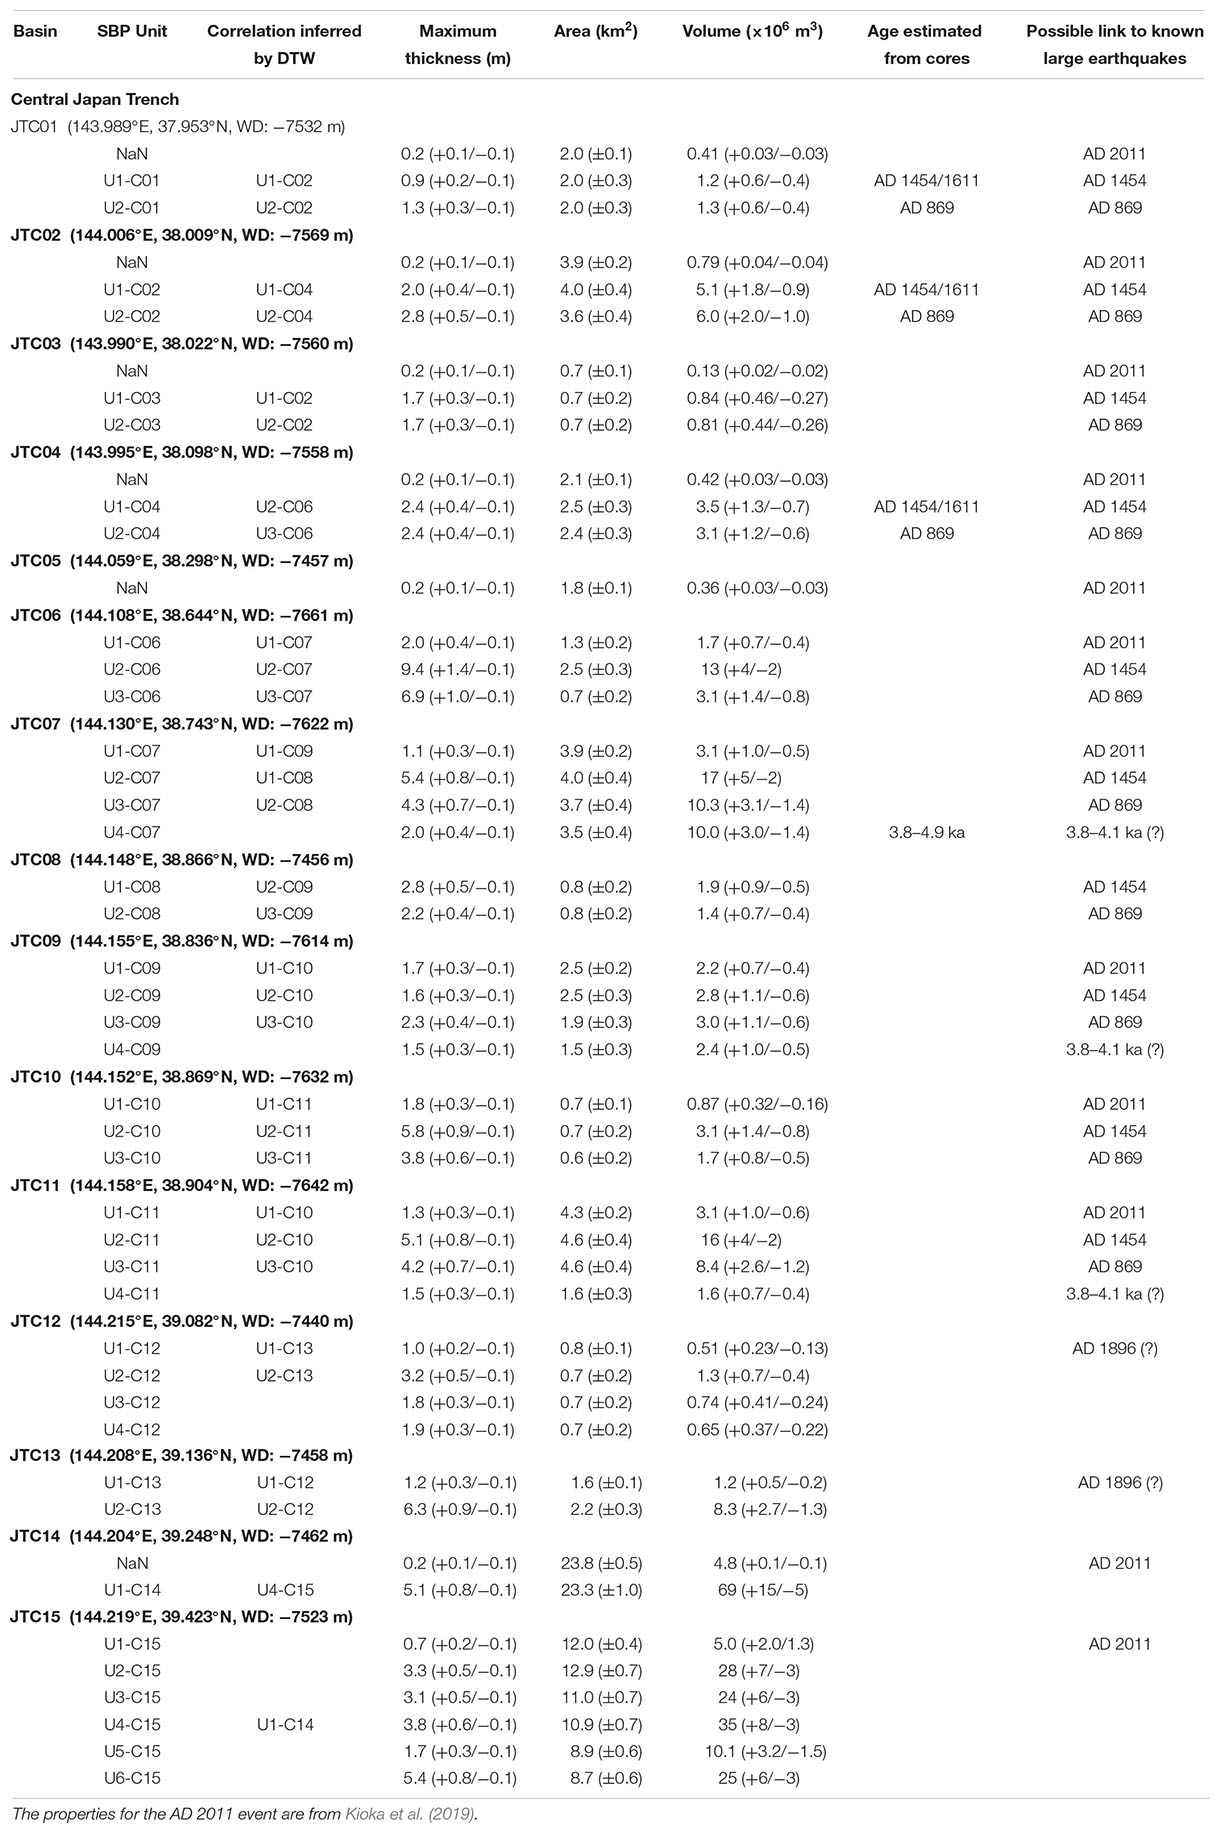
Table 2. Longitude, latitude and water depth (WD) of modern depocenter, acoustically transparent SBP body units, correlation to neighboring SBP units inferred by DTW, maximum thicknesses, areal extents and volumes of identified event deposits, estimated ages from cores, and possible links to historically known large earthquakes at a given trench fill-basin in the central Japan Trench.
At the basins JTC02 and JTC04, two acoustically transparent bodies (U1-C02 and U2-C02; U1-C04 and U2-C04) were identified in SBP data (Figure 3B). The sediment core GeoB16431-1 from the basin JTC02 documents thick (up to 1.5 m) fining-upward turbidite units exhibiting cross- and parallel-laminated sand-to-silt layer and a tephra layer (To-a tephra; AD 915) interbedded within bioturbated diatomaceous mud with a distinct erosional basal contact (Figures 5, 6; Ikehara et al., 2016; Bao et al., 2018). The cores GeoB16431-1 and MR12-E01 PC04 from the basin JTC02 and MR12-E01 PC03 from the basin JTC04 document three homogeneous deposits in the upper 7.5–9.7 mbsf that were identified and dated as sediment remobilization event deposits linked to the AD 2011, AD 1454, and AD 869 earthquakes (Ikehara et al., 2016; Bao et al., 2018). Core-to-SBP correlation links the acoustically transparent bodies in SBP images to the 1454 Kyotoku and 869 Jogan events, while the 2011 event deposit is too thin (<∼30 cm) for distinct imaging in limited vertical resolution of SBP data (Kioka et al., 2019). Similarly, the SBP data in the basin JTC05, which represents a local basin on a relative bathymetric high along the trench axis, did not image any acoustically transparent bodies even though thin event deposits are evidenced from the core KS-15-3 PC10 (Ikehara et al., 2018; Figure 6).
Despite reduced connectivity of basins along the central Japan Trench, our correlation suggests that several of the younger acoustically transparent deposits in a given trench-fill basin correlate well to respective deposits in its neighboring basins (Figure 7). For example, the acoustically transparent bodies U1-C02/U1-C04 and U2-C02/U2-C02 in the basin JTC02/JTC04 were correlated to corresponding acoustically transparent bodies throughout the basins JTC01 and JTC06–JTC11 (e.g., U2-C06/U2-C11 and U3-C06/U3-C11).
The deeper subsurface event stratigraphy in basins JTC01–JTC06 is mostly masked by unresolvable event-deposit thicknesses (e.g., JTC05; see above) or complex subsurface deformation structures (e.g., JTC02 comprising the area with described slump and co-seismic displacement into the trench (Kodaira et al., 2012; Strasser et al., 2013). In contrast, trench basins JTC07, JTC09, and JTC11 also image an older acoustically transparent body (U4), that can tentatively be dated to (3.8–4.9 ka) by extrapolating constant sedimentation rates estimated from inter-event background sedimentation in core KS-15-16 PC01 from basin JTC07. None of the identified acoustically transparent bodies can be correlated across the bathymetric high between basin JTC11 and JTC12, which also manifests a divide between different flow accumulation systems (Figure 2). The correlation of acoustically transparent bodies in the basins JTC12–JTC15 was not unique and cannot be verified by core data, due to absence of cores in this area. However, SBP data from basin JTC15, located south of petit-spot, document six acoustically transparent bodies clearly down to ∼35 ms TWT below the seafloor. Only one acoustically transparent deposit U4-C15 in the basin JTC15 can reliably be correlated by visual and DTW correlation to the deposit U1-C14 (i.e., event deposits with the largest areal extent in the central Japan Trench; Table 2) in JTC14 and perhaps to the deposits U2-C12 and U2-C13 in the basins JTC12 and JTC13, respectively.
Northern Japan Trench
The seafloor of the trench axis in the northern Japan Trench ranges between water depth of 7,400 and 7,620 m (Figure 3C). Most of the SBP data in the northern Japan Trench clearly imaged laterally continuous reflection signals down to 40–90 ms TWT (∼30–75 m) below the seafloor in the trench-fill basins, with the exception of basin JTN01, where the acoustic signal was strongly attenuated by a shallow subsurface body with hummocky surface, possibly linked to a mass-transport complex (Figure 3C). The SBP data imaged several acoustically transparent bodies of <1 to ∼15 ms TWT thick (Figure 4). We identified eight isolated trench-fill basins (JTN01–JTN08) in the northern Japan Trench that comprise 1–5 event deposits clearly imaged in SBP data (Table 3 and Figure 3C). Unlike in the other parts of the trench, the uppermost acoustic unit immediately below seafloor is either absent or not resolved (JTN01 and JTN05), or thin (0.6–1.4 m thickness) throughout all the SBP images in the northern Japan Trench.
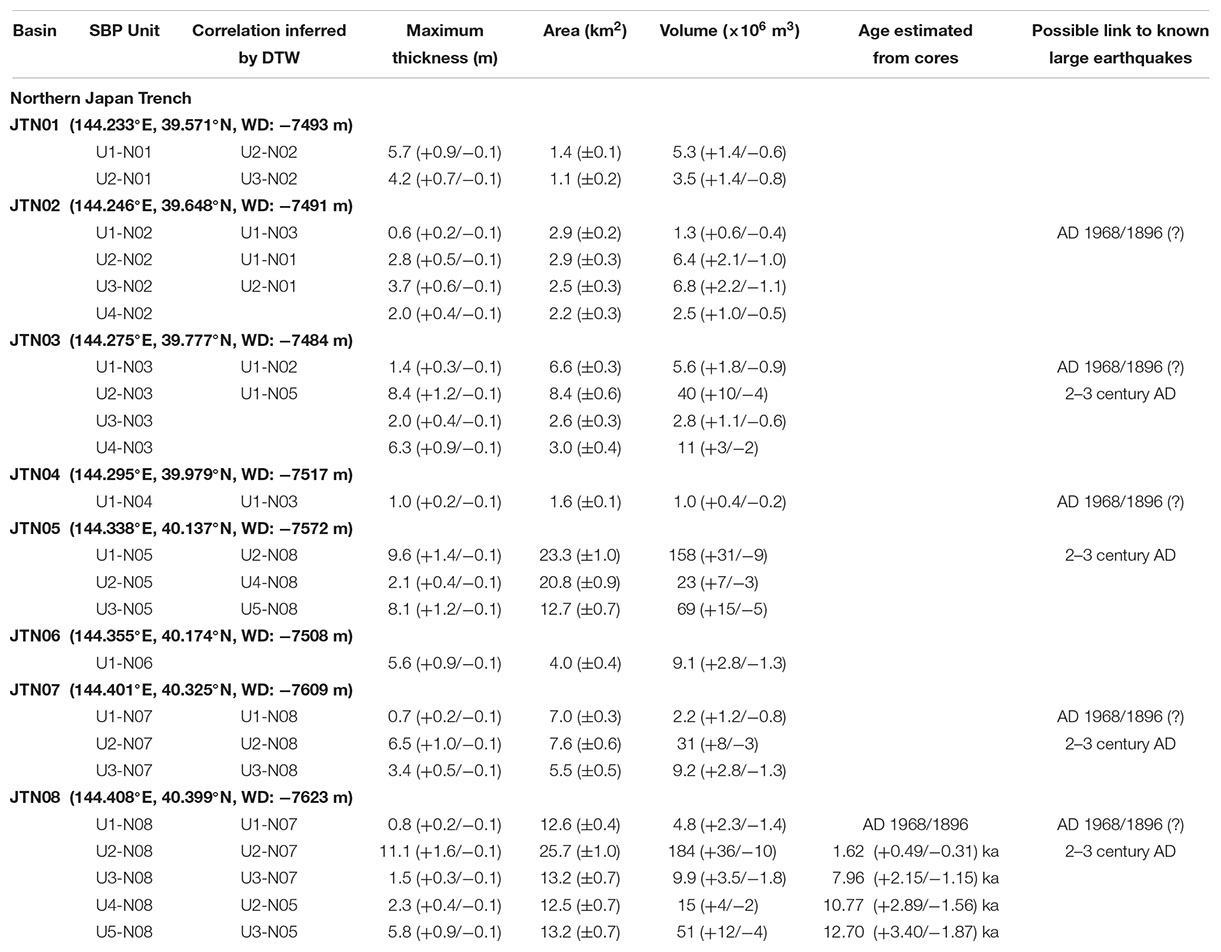
Table 3. Longitude, latitude and water depth (WD) of modern depocenter, acoustically transparent SBP body units, correlation to neighboring SBP units inferred by DTW, maximum thicknesses, areal extents and volumes of identified event deposits, estimated ages from cores, and possible links to historically known large earthquakes at a given trench fill-basin in the northern Japan Trench.
At the northernmost basin JTN08, where flow accumulation is highest in the entire Japan Trench (Figure 2), five acoustically transparent bodies (U1-N08, U2-N08, …, U5-N08) were identified in SBP data (Figures 3C, 4). Visual core description and magnetic susceptibility data (Strasser et al., 2017) and detailed analyses of radiograph images (this study; Figure 5) of core GeoB21817 taken from the depocenter of basin JTN08 documents mottled bioturbated diatomaceous mud (interpreted as background sediments) overlying a thick homogenous diatomaceous mud containing additional minor fine-sand lenses, foraminifera and pyrite framboids (below 2.7 mbsf to the base of core at 9.7 mbsf; interpreted as remobilized sedimentary event deposits; Figures 5, 6). SBP-to-core correlation clearly documents that the thick acoustically transparent body U2-N08 correlates to the event deposit recovered below 2.7 m depth in core GeoB21817 (Figure 4). The very thin uppermost acoustically transparent body identified in SBP data immediately below the seafloor reflector (U1-N08) could not be validated in core data of GeoB21817, possibly due to coring disturbance in the uppermost part of the core or non-recovery of the sediment-waver interface (core overshoot).
Bulk OC 14C data of bioturbated sediments overlying the homogenous diatomaceous mud within the core GeoB21817 indicate a mean sedimentation rate of 1.17 (+0.16/-0.12) m/kyr for background sedimentation in the basin JTN08 (Figure 6 and Supplementary Figure S2), which is lower than that in the southernmost basin JTS01 [5.44 (+0.13/-0.09) m/kyr; this study] and upper 2.5 mbsf of JTC02 in the central Japan Trench (∼2.0 m/kyr; Bao et al., 2018). Extrapolating constant sedimentation rates and assuming no significant sediment loss in the uppermost part of the core, ages of acoustically transparent bodies U2-N08, U3-N08, U4-N08 and U5-N08 were estimated to be 1.62 (+0.49/-0.31) ka, 7.96 (+2.15/-1.15) ka, 10.77 (+2.89/-1.56), and 12.70 (+3.40/-1.87) ka, respectively. The acoustically transparent body U2-N08 [1.62 (+0.49/-0.31) ka] was thickest and had the largest volume [0.184 (+0.036/-0.010) km3; Table 3] in the entire Japan Trench. We found similarly very thick acoustically transparent bodies U2-N03 [max. 8.4 (+1.2/-0.1) m thick] and U1-N05 [max. 9.6 (+1.4/-0.1) m thick], which were validated by sediment cores of KS-14-16 PC08 (Ikehara et al., 2018) and KS-18-10 PC01 in the basins JTN03 and JTN05, respectively (Figure 6). Basin-to-basin correlation suggests that the acoustically transparent body U2-N08 in the northernmost basin JTN08 can reliably be correlated to the acoustically transparent bodies U2-N07, U1-N05, and U2-N03 in the neighboring basins JTN07, JTN05, and JTN03, respectively (Figure 7). This indicates that, at 1.62 (+0.49/-0.31) ka, a large volume [0.412 (+0.084/-0.025) km3; Table 3] of event deposition took place over these basins. We also find positive correlation of deeper acoustically transparent bodies U3-N08, U4-N08, and U5-N08 in the basin JTN08, to U3-N07 in the basin JTN07 and U2-N05 and U3-N05 in the basin JTN05. The uppermost, thin, acoustically transparent body U1 correlates across all the basins in the northern Japan Trench, except for basins JTN01 and JTN05 where it is not resolved or absent. More southward correlation of these event deposit bodies to the neighboring basin JTC15 located in the northernmost part of the central Japan Trench, where the youngest event deposit in SBP data is linked to the AD 2011 Tohoku-oki earthquake (Kioka et al., 2019), is not supported by visual seismic facies correlation and DTW analysis.
Discussion
We have studied, for the first time to our knowledge, the spatio-temporal distribution of thick sediment remobilization event deposits resolved by high-resolution subbottom profiling data of trench basins in the Japan Trench along and across its entire axis from 36.0°N to 40.5°N. In the uppermost 5–10 m subsurface depth of the acoustically imaged sedimentary sequences in the trench basins, SBP data interpretation is validated by sedimentological data and age constraints from several cores retrieved by conventional gravity and piston coring campaigns. SBP-to-core correlation demonstrates that most of the acoustically transparent bodies identified in SBP data represent event deposits composed of homogenous diatomaceous mud resulting from widespread sediment remobilization of unconsolidated surface sediments and link to the occurrence of major historical earthquakes (see green bodies and their stratigraphically correlated event deposits shown in Figure 7). For the deeper subsurface, our event-stratigraphy interpretation is solely based on acoustic facies interpretation, seismic stratigraphic mapping and correlation, and awaits further constraints and validation by deeper coring, that is planned to by conducted by the upcoming International Ocean Discovery Program (IODP) Expedition 386 in 2020 (Strasser et al., 2019) in the Japan Trench.
Spatial and Temporal Distribution of Event Deposits and Links to Past Earthquake Histories
Below, we first discuss the temporal and spatial extent of the earthquake-triggered event deposits found from SBP data with a focus on (i) testing how areal extent of event deposition in the trench links to rupture area and size distributions of historically documented large earthquakes and (ii) discussing possible earthquake scenarios for prehistoric events inferred from the sedimentary record. Our results reveal distinctly different event stratigraphies for the trench segments between north and south of the area characterized by the bathymetric high and the area affected by complicated structures such as petit spot volcanism between 39.0° and 39.5°N (Hirano et al., 2006). The nature of subducting oceanic lithosphere affected by petit-spot volcanism might also act as segment boundary of megathrust earthquakes, perhaps influencing different earthquake rupture mechanism and histories along the plate interface north and south of this structurally controlled divide. We thus separate our discussion between the southern and south-central part of the Japan Trench (starting with basins JTS01 through JTC11) and the northern Japan Trench (starting with basins JTN08 through JTN02).
Southern and South-Central Part of the Japan Trench
At the southernmost basin JTS01 in the southern Japan Trench, our SBP data document event deposits over the past ∼7 kyr. Funneling and focusing of the density flows through the proximal Nakaminato submarine canyon (Figure 1) transports larger amount of sediments into this basin than most other basins, as suggested by very high flow accumulation values (Figure 2) and high background sedimentation rates (Supplementary Figure S3). Based on our new age constraints from radiocarbon-dated background sedimentation rates and event-deposit basin-to-basin correlation, we document an event deposit of AD 1671 (+44/-52), recorded only in the southern-most trench basins JTS01–JTS05, which is interpreted to relate to the AD 1677 Mw8.3–8.6 Empo Boso-oki earthquake. The inferred rupture of this earthquake did not propagate much further north than the area drained by the Nakaminato canyon, suggesting a good fit between the mapped spatial distributions of its event deposits with the inferred rupture area (Figure 1; Takeuchi et al., 2007; Sawai et al., 2012).
Between the AD 2011 and the inferred AD 1677 event deposits, SBP data of the southernmost trench basin JTS01 evidence another sediment remobilization event with very limited spatial extend (only recorded in JTS01) that we date to AD 1846 (+22/-25). No major historical earthquake was reported within this time period. If we were to consider that dating uncertainties from a linearly extrapolating sedimentation rate from bulk organic radiocarbon data might have been underestimated (e.g., deviation of 14C age at 215 cm of GeoB21804 core; Figure 6 and Supplementary Figure S2), this event deposit might be related to either the AD 1793 February M7.6–8.2 Kansei, the AD 1896 January M7.3 Ibaraki-oki, or the AD 1897 August M7.7 Sanriku-oki earthquakes, which are all smaller earthquakes that have affected the source area of the JTS01 basin. However, we trust the age constraints and uncertainty estimates of the event deposit and, alternatively, interpret that such a locally recorded event deposit is not indicative for earthquake trigger. Indeed, the event deposit could also have been triggered by the AD 1856 Edo-Ansei typhoon that is known for the strongest typhoon within this possible time range (Sakazaki et al., 2015).
Remarkably, our results reveal that the thick event deposit (U4-S01) in the southernmost trench basin JTS01, as validated by a core and dated to AD 980 (+78/-157), correlates widely to acoustically transparent bodies within most of the basins in the southern Japan Trench and throughout basins JTC01–JTC11 in the central Japan Trench (Figure 7). Hence, this event deposit is extensively distributed in the trench-fill basins throughout the southern Japan Trench and its spatial extent reaches northward up to the major bathymetric divide in the central Japan Trench at ∼39.0°N. As independently evidenced and dated from cores in the basins JTS15, JTS16, JTC02, JTC04, and JTC07 (Ikehara et al., 2016, 2018; Bao et al., 2018), this spatially extensive large-scale sediment remobilization event links to the AD 869 Mw≥8.6 Jogan earthquake.
Spatio-temporal mapping and basin-to-basin correlation of the other major historical earthquake (i.e., the AD 1454 Mw≥8.4 Kyotoku earthquake), which triggered sediment remobilization and event deposition in the central part of the Japan Trench (Ikehara et al., 2016), hint a constraint for the spatial extents of sediment remobilization. We reveal that this earthquake did not trigger as widespread sediment remobilization as the AD 2011 Tohoku-oki earthquake (Kioka et al., 2019) and AD 869 Jogan earthquake, because the correlative event deposits do not extend further southward than JTS15 (Figure 7). Nevertheless, in the central part of the Japan Trench, the respective event deposits of the AD 1454 earthquake are widely identified throughout basins JTC01 and JTC11 and thus across at least two different separated flow-accumulation systems (Figure 2). The event deposit of AD 1454 earthquake is thus distributed in the trench-fill basins between 37.4° and 38.9°N, which is further to the north than expected from the source area of AD 1454 earthquake (Sawai et al., 2015). The event deposit distribution of the AD 869 Jogan earthquake extends further to both the north and south than inferred from the source area of AD 869 earthquake (Sawai et al., 2012). This may suggest that (i) the AD 869 Mw≥8.6 earthquake remobilized a larger area of surface sediment than the AD 1454 earthquake, which is believed to be of similar magnitude, and/or (ii) the AD 869 earthquake may have actually ruptured a larger area than the AD 1454 earthquake, which agrees with a broad distribution for the AD 869 tsunami deposits as far as 40.5°N, suggesting the earthquake size is rather similar to the AD 2011 earthquake (Sawai et al., 2012; Namegaya and Satake, 2014). Interestingly, the event deposits of the AD 869 earthquake in the central part of the Japan Trench are thicker, comprising a larger total volume than that of the AD 2011 earthquake, as suggested from sediment cores taken between 38.0° and 38.1°N (Ikehara et al., 2016) and our volume estimates (see section “Export of Organic Carbon (OC) to the Hadal Trench by Large Earthquakes”). Given that the magnitude of the AD 2011 Tohoku-oki earthquake was larger than the inferred magnitude of AD 869 earthquake, we expect that the AD 869 earthquake guided different system of sediment routing and source and/or different mechanism of sediment supply from the AD 2011 earthquake for delivering remobilized surface sediment to the proximal trench. Or, event deposit thicknesses and volumes in the central Japan Trench may not be a straightforward indicator of earthquake magnitude, potentially because of complex and small-scale bathymetric differences, which are possibly enhanced by trench-sediment deformation by coseismic slip propagation to the trench (Kodaira et al., 2012) that affects trench-basin accommodation space and resulting deposition of remobilized sediment.
With respect to discussing possible earthquake scenarios for prehistoric earthquakes, our spatio-temporal event stratigraphy for the area south of 39.0°N reveals the most promising data from the deep subsurface of the basins JTS01, JTS15, and JTC07–JTC11. The 2.3 (+0.4/-0.2) ka event deposit identified in the basin JTS15 is probably related to the 2.4–2.6 ka earthquake that has been inferred from a tsunami deposit reported along the coast between the northern Fukushima and southern Miyagi Prefectures (e.g., Kusumoto et al., 2018). Yet, interpretation of an earthquake trigger for this event deposit may not be unique, because the correlation of the event deposit with a wide possible age range cannot be constrained by our basin-to-basin correlation. In contrast, an older event in the basin JTS15 [U5-S15, tentatively dated to 4.0 (+1.0/-0.5) ka], has an overlapping possible age range with the event deposit of 3.8–4.9 ka identified in the basin JTC07 (which further likely correlates across basins JTC09 and JTC11) and possibly U5-S01 (tentatively dated to 3.4 (+0.5/-0.2) ka) in the southernmost basin JTS01. If correlation can be confirmed by future IODP core analyses, this event could have similar spatial extent as the AD 2011 Tohoku-oki and the AD 869 Jogan earthquakes. Such an event is likely to correlate to either a 3.8 ka event found from tsunami deposits along the northern Miyagi coast (Hirakawa, 2012) or a 4.1 ka event reported from sediment cores at mid-slope terrace between 39.1° and 39.3°N (Usami et al., 2018). Alternatively, these reconstructed paleo-earthquake events might also all link to one single large megathrust earthquake, because the age ranges of the respective event deposits can overlap when considering dating uncertainties on the order of a few hundred years in these records.
Northern Japan Trench
North of 39.5°N, as compared to the southern and central Japan Trench, we found distinctly different stratigraphic successions characterized by lower sedimentation rates and fewer but thicker event deposits. We interpret that the uppermost very thin homogenous deposits imaged immediately below the seafloor reflection in the basins JTN02, JTN03, JTN04, JTN07, and JTN08 must relate to a very recent event, possibly either the AD 1968 Mw8.2–8.3 Tokachi-oki (Sanriku-oki Hokubu) earthquake or AD 1896 Mw8.0–8.4 Meiji Sanriku earthquake. These earthquakes were smaller in size than 2011 earthquake, which may explain that the resulting event deposits and total remobilized sediment volume are much smaller than those for the recent 2011 event found in the southern and central Japan Trench (Kioka et al., 2019). Furthermore, at the mid-slope area around 40.25°N, Molenaar et al. (2019) documented surface remobilization of very thin surface sediment associated with AD 1968 and AD 1896 earthquakes. This observation further supports our interpretation that the observed shallow-subsurface event deposits in the northern Japan Trench likely document the deposition of remobilized sediment related to one or the other of these earthquakes. However, this interpretation needs to be tested with high-resolution radionuclide dating on suitable cores not available to date.
The SBP data in the northern Japan Trench document very thick acoustically transparent bodies up to 11.1 (+1.6/-0.1) m. One of the thick event deposits, tentatively dated to 1.62 (+0.49/-0.31) ka in the JTN08 basin, is widely distributed in the basins JTN03, JTN05, JTN07, and JTN08 (Figure 7). Tsunami deposits of a 2nd–3rd Century large earthquake have been widely correlated along the Iwate coast between Yamada and Hirono Towns (Takada et al., 2016; see Figure 1 for locations). This suggests that the 1.6 (+0.5/-0.3) ka event deposits identified in these basins may link to the 2nd–3rd Century AD event. We further identify deeper acoustically transparent bodies of 8.0 (+2.2/-1.2) ka, 10.8 (+2.9/-1.6) ka, and 12.7 (+3.4/-1.5) ka that are older than reported from tsunami deposits and marine sediment cores from slopes. These deposits can also represent event deposits linked to similarly large earthquakes, whereas alternate explanation such as canyon flushing of Ogawara canyon due to extreme flood events associated with rainfall condition change (e.g., Kawahata et al., 2017) and/or sea-level change or gas-rich deposits cannot be rejected as alternative interpretations. Only future coring by IODP expedition 386 will allow for testing these competing hypotheses based on detailed sedimentological and provenance analyses (Strasser et al., 2019).
Export of Organic Carbon (OC) to the Hadal Trench by Large Earthquakes
Having revealed spatial and temporal distribution of event deposits, we can quantify sediment volumes and OC contents of given event deposits linked to large earthquakes throughout the entire Japan Trench. The AD 2011 Tohoku-oki earthquake made spatially widespread remobilization of young surficial seafloor slope sediments and delivered event deposits of at least 0.187 (+0.045/-0.018) km3 to the trench (Kioka et al., 2019). Similar to the 2011 event deposits, the AD 1454 and 869 event deposits also contain relatively young remobilized sediments with high OC content (Bao et al., 2018). From our results, we quantify a sediment volume of 0.064 (+0.019/-0.009) km3 that was transported to the hadal trench after sediment remobilization within or around the area feeding the Nakaminato canyon, initiated by the AD 1677 Mw 8.3–8.6 Empo Boso-oki earthquake. The AD 1454 Mw≥8.4 Kyotoku earthquake remobilized surficial sediment over a widespread area resulting in a total volume of 0.068 (+0.022/-0.011) km3 of event deposits in the hadal trench basins. The basins JTC06 (0.013 [+0.004/-0.002) km3], JTC07 [0.017 (+0.005/-0.002) km3], JTC11 [0.016 (+0.004/-0.002) km3] document largest deposit volumes of the AD 1454 event in identified trench-bill basins, which agree with highest flow accumulation in the central Japan Trench (Figure 8). The AD 869 Mw≥8.6 Jogan earthquake triggered widespread sediment remobilization resulting in a total volume of 0.202 (+0.059/-0.026) km3 of event deposits over more than 340 km along-strike the hadal trench. The basins JTS01 [0.040 (+0.010/-0.004) km3], JTS04 [0.045 (+0.011/-0.004) km3], JTS15 [0.017 (+0.005/-0.002) km3] document largest deposit volumes of the AD 869 event, which can also be explained by highest flow accumulation among the identified basins in the southern and central Japan Trench (Figure 8). Interestingly, our results suggest that the AD 869 earthquake delivered a similarly large volume of remobilized sediment to the trench as did the AD 2011 earthquake. This may hint that, given that the sediment routing system does not change considerably through time, the AD 869 Jogan earthquake has a similar size to the AD 2011 Tohoku-oki earthquake that can generate similarly widespread remobilization of surficial slope sediments. Furthermore, the 2nd–3rd Century AD event delivered the largest volume of deposits in the last 2,000 years, yielding 0.412 (+0.084/-0.025) km3 in the basins of the northern Japan Trench. Larger volumes of this event deposit in the basins JTN05 and JTN08 than JTN03 and JTN07 (Table 3) agree with high flow accumulation in bathymetry (Figure 8). It should be noted that sediment volume of the 2nd–3rd Century event deposit in the basin JTN08 [0.184 (+0.036/-0.010) km3] alone is compatible to the total volume of event deposit of AD2011 Mw9.0–9.1 Tohoku-oki earthquake throughout the Japan Trench. This extremely large volume of deposit in the single basin might be due to funneling and focusing of the triggered muddy density flows through the proximal Ogawara canyon. All these findings indicate that eventual sediment supply to the trench is variable with different large earthquakes, suggesting various long-term rates of sediment flux to and filling of the trench basin along the Japan Trench.
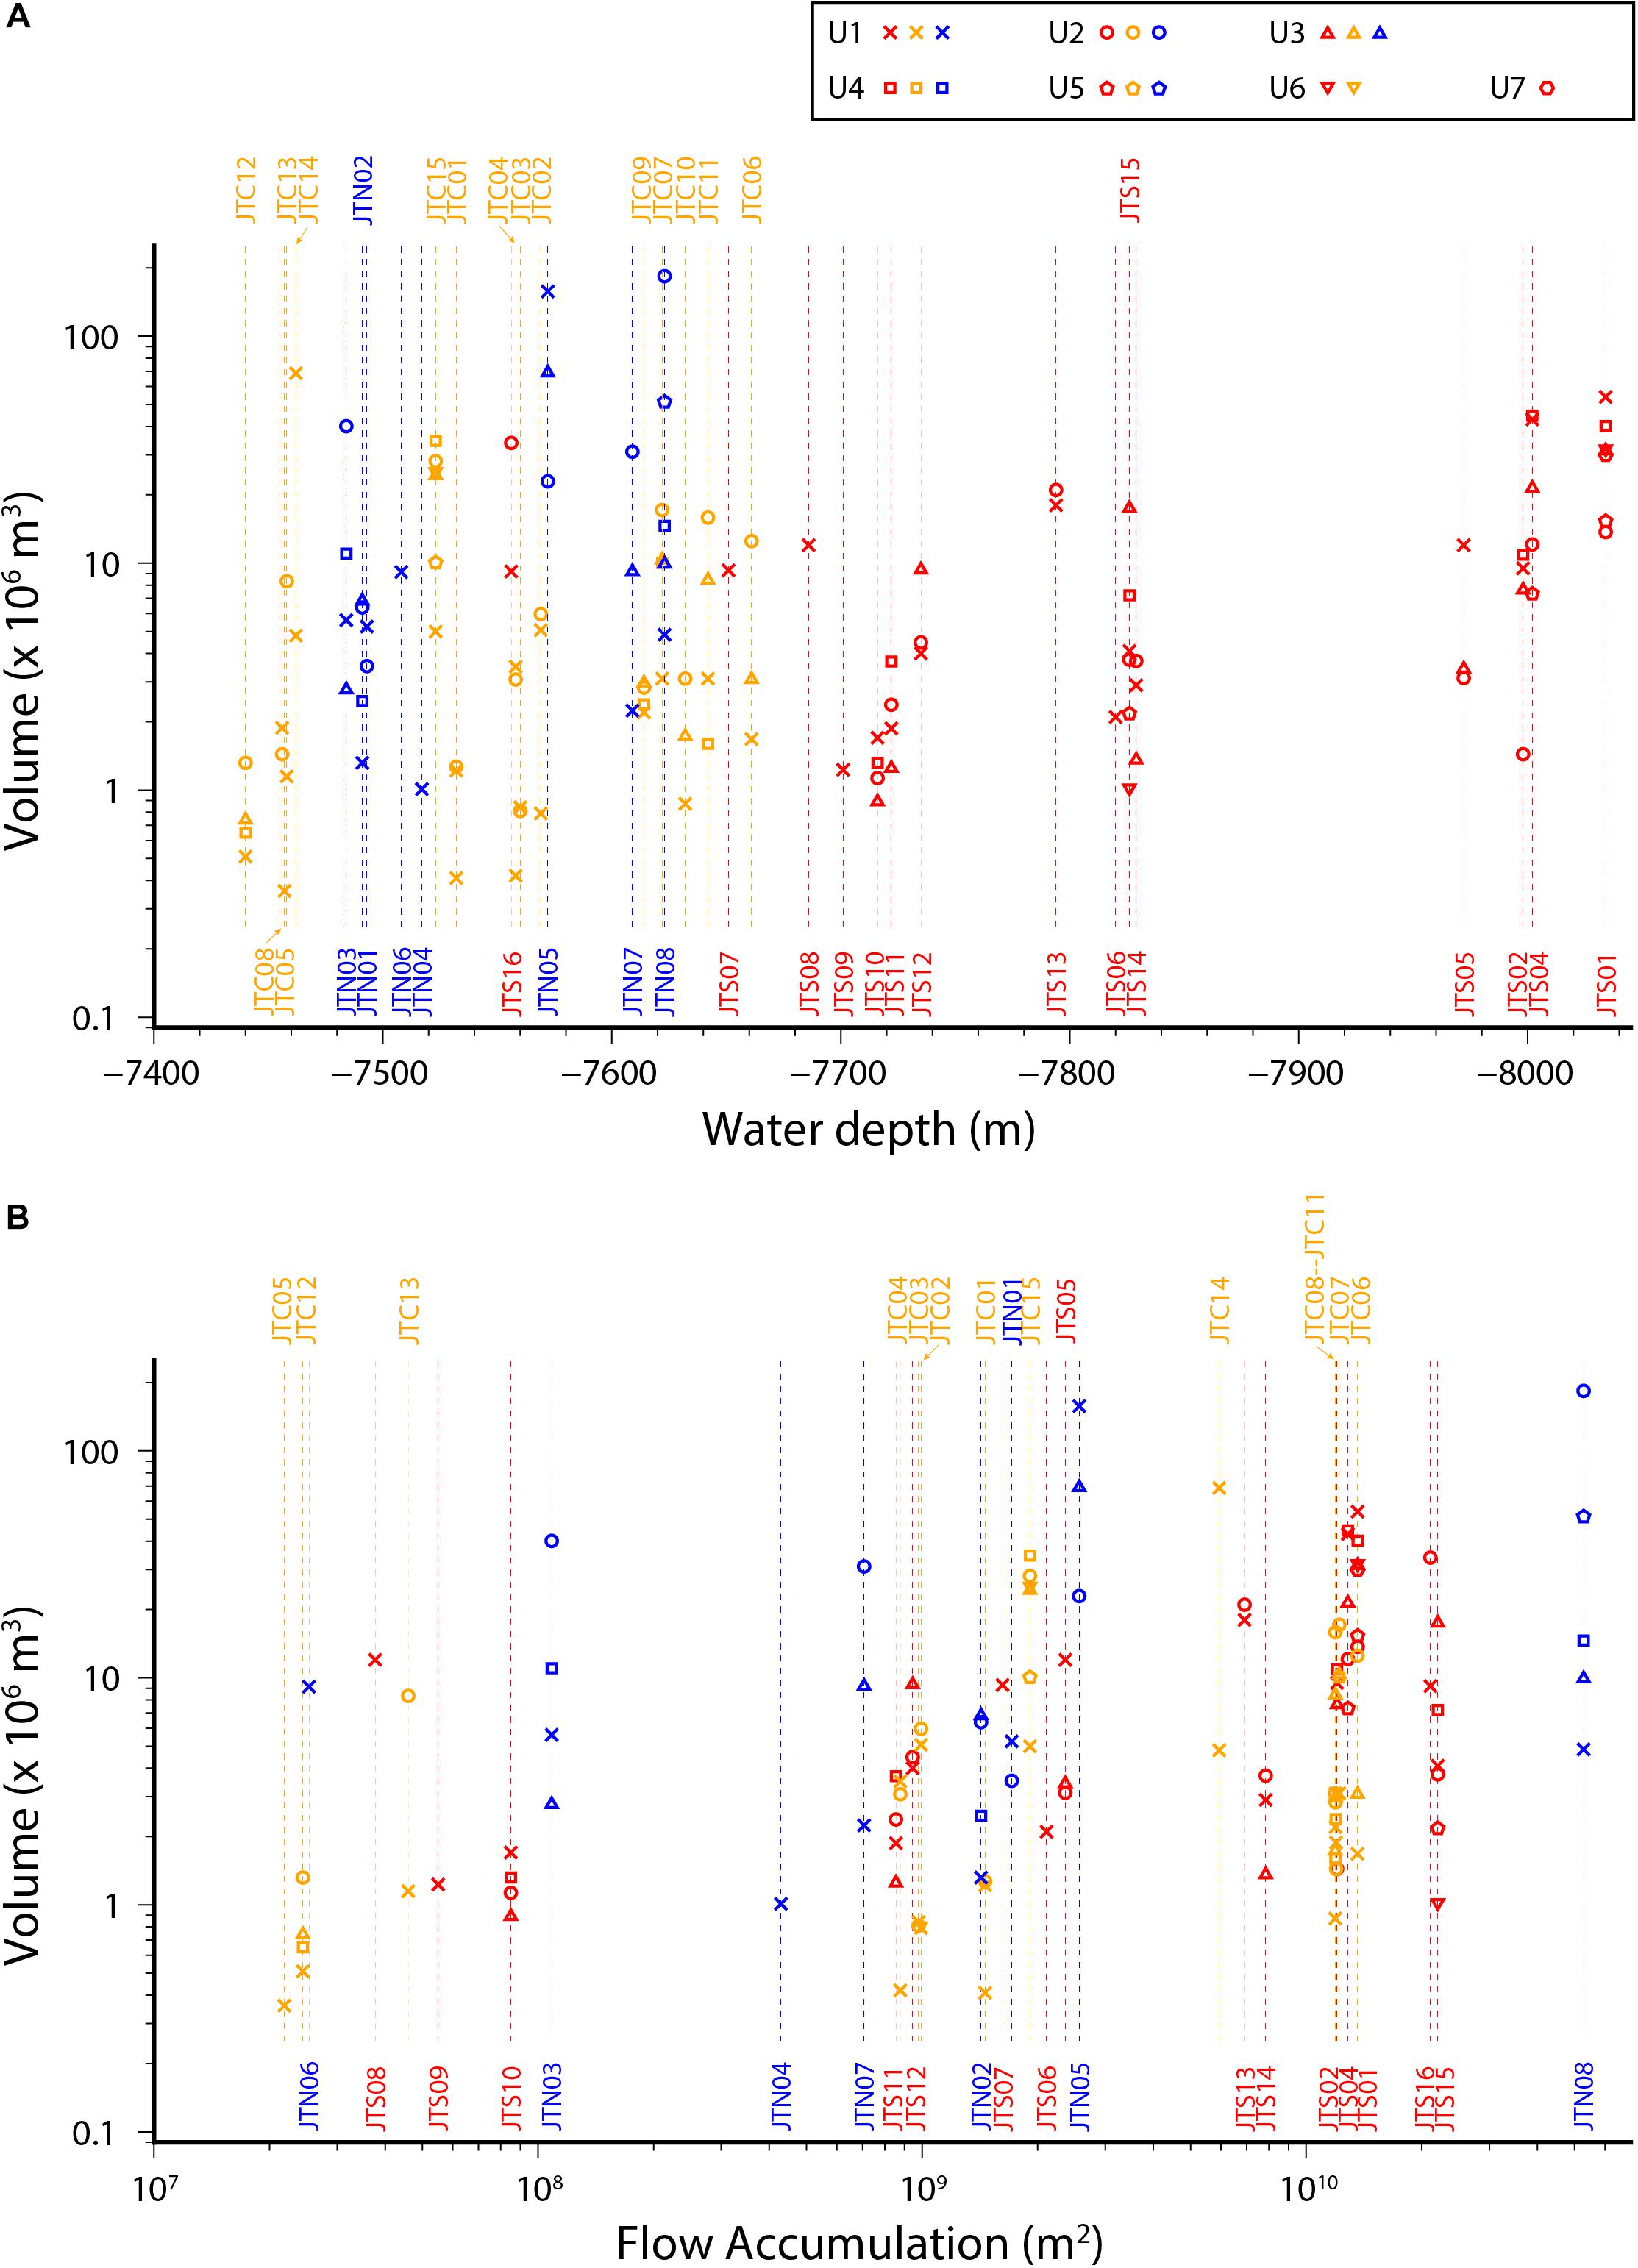
Figure 8. (A) Relationship between volume of event deposit and modern water depth of depocenter at a given trench-fill basin. (B) Relationship between volume of event deposit and modern flow accumulation of modern depocenter at a given trench-fill basin. Red, orange, and blue plots represent the basins in the southern, central, and northern Japan Trench, respectively. Cross, circle, triangle, square, pentagon, inverted triangle, and hexagon plots represent the volumes of SBP units U1 (and uppermost deposits “NaN” in Table 2), U2, U3, U4, U5, U6, and U7, respectively. The data with volumes less than 0.3 × 10⁶ m3 are not shown.
By calculating the AD 2011 event-deposit total sediment volume and measuring OC content within the event deposits, Kioka et al. (2019) estimated that the giant AD 2011 Tohoku-oki earthquake delivered at least 1 Tg of OC to the hadal trench. Given that our results for sediment volume remobilized by older large earthquakes are comparable to or even larger than that for the AD 2011 earthquake, we also expect a large volume of export of OC to the trench associated with these previous earthquakes. Total organic carbon (TOC) contents within AD 1454 and AD 869 event deposits from the core GeoB16431-1 core are 0.99 ± 0.26 wt% and 0.65 ± 0.10 wt%, respectively (Bao et al., 2018). Here, we calculate masses of OC of event deposits using these TOC values, volume of a given event deposit, and a wide likely range of dry densities (800–1,200 kg/m3). Total masses of OC within the AD 1677 Empo Boso-oki, AD 1454 Kyotoku, AD 869 Jogan, and 2–3 century event deposits are calculated to be 0.64 (+0.61/-0.31) Tg (1012 g), 0.68 (+0.68/-0.34) Tg, 1.32 (+1.03/-0.54) Tg, and 2.68 (+1.78/-0.97) Tg, respectively. As suggested by the large estimated volume of deposits, the AD 869 Jogan and 2–3 century earthquakes delivered large quantities of surficial seafloor sediment OC to the trench, which are compatible to or even larger than the carbon transfer to hadal trench triggered by the AD 2011 Tohoku-oki earthquake. These older event deposits contain relatively young remobilized sediments (Bao et al., 2018), indicating the occurrence of comparable remobilization and deposition processes. Therefore, we estimate that, at least 7.04 (+5.07/-2.89) Tg of OC remobilized from surficial slope seafloor sediments was exported to the hadal Japan Trench axis in the last 2,000 years, by the five historically known large earthquakes AD 2011, 1677, 1454, 869, and 2nd–3rd century earthquakes. This suggests that event deposits in the trench basins may play an important role as an OC sink during interseismic periods.
We have also documented event deposits older than those related to the AD 869 and 2nd–3rd century earthquakes in the entire Japan Trench. We would thus expect similarly large quantities of OC supply to the trench by older large earthquakes perhaps throughout the Holocene, which could also influence the benthic communities at the hadal trench through the intensified supply of organic matter, but reserve final judgment for the future when further constraints are available from the upcoming IODP expedition. Nevertheless, the virtually instantaneous supply of OC to the hadal trench driven by large earthquakes brings the majority of OC burial and carbon sequestration via eventual underthrusting on geological time scales. The hadal trench can thus be considered as a sink for global OC, which could account for several of the missing OC in global budget. It yet remains open to understand how much the buried OC accounts for being recycled by anaerobic degradation, being buried deep to be methanized (D’Hondt et al., 2002) or being subducted to contribute to the long-term carbon cycle and eventual CO2 degassing through the proximal volcanic activity (Kerrick, 2001). Anyhow, our findings represent an important contribution of large earthquakes to long-term carbon cycling in the hadal zones that may have a broader span of significance yet to be discovered.
Conclusion
We have studied detailed event stratigraphy in an entire hadal trench for the first time to our knowledge, by integrating high-resolution bathymetry and highly dense dm-scale vertical resolution subbottom profiler (SBP) data, and sediment cores acquired during 2012–2018 over the entire hadal trench axis of the Japan Trench (36.0°–40.5°N). We identify 39 isolated trench-fill basins along the trench axis of the Japan Trench that contain a total of 115 individual SBP-resolvable acoustically transparent event deposits, documenting sediment remobilization of mostly diatomaceous mud. Spatio-temporal mapping and basin-to-basin correlation of the identified event deposits, along with SBP-to-core correlation and dating of cores retrieved from the upper parts of ∼10 m below the seafloor reveals that widely correlatable event deposits link to major historic large earthquakes such as the AD 2011 Tohoku-oki, AD 1454 Kyotoku, and AD 869 Jogan events.
Comparison between the areal extent of event deposits with inferred rupture areas and magnitude of the respective historical earthquakes suggests that our Japan Trench submarine paleoseismological approach can be used to roughly constrain areal extent of past M8+ earthquakes. Our data also suggest that only such large earthquakes trigger spatially extensive sediment remobilization that results in SBP-resolvable, thick event deposits across several trench-basins with different upslope flow network conditions. For these events, we could at least clearly separate smaller events from the event-stratigraphic record (exclusively for the southernmost trench basins) that link to M∼8.5 type earthquakes along the southernmost segment, and repeating spatially extensive large to giant (M8.4–9.1) earthquakes in the linked southern and central part of the Japan. However, detailed comparison between event-deposit distributions and rupture areas reported from literature also reveals that the two do not perfectly match. This highlights that large knowledge gaps remain in reconstructing rupture areas of past earthquakes, in understanding exact areal and subsurface-depth threshold conditions for earthquake induced surficial sediment remobilization, as well as in linking areal distribution and volume of remobilized sediment to earthquake parameters.
The lower part of the SBP data also documents several thick acoustically transparent bodies possibly dating back to the early and middle Holocene. Our results provide quantitative constraints of along-strike variation of sediment volumes redistributed by these episodic events along the entire trench axis. We find that the total volumes of event deposits triggered by the AD 869 Jogan and the prehistoric 2–3 century AD earthquakes are comparative to or even larger than that by the AD 2011 Mw 9.0–9.1 Tohoku-oki earthquake. Finally, we present a first-ever trench-wide quantification of OC translocation driven by these large earthquakes. We conclude that, at least 7 Tg of OC remobilized from surficial slope seafloor sediments was exported to the hadal Japan Trench axis in the last 2,000 years by large earthquakes. This highlights the significance of seismo-tectonic events for the long-term carbon cycle in hadal trenches.
Data Availability Statement
Bathymetric data used in the paper are available at Bundesamt für Seeschifffahrt und Hydrographie (https://www.bsh.de/DE/DATEN/Ozeanographisches_Datenzentrum/Vermessungsdaten/Nordpazifischer_Ozean/nordpazifik_node.html) and JAMSTEC-DARWIN database (http://www.godac.jamstec.go.jp/darwin/e). All the other datasets generated for this study are available on request to the corresponding author.
Author Contributions
MS and AK projected the study. AK analyzed all the data, created the figures, and drafted the manuscript. TS performed radiocarbon dating measurements and prepared Figure 5. KI provided radiographs of cores. All authors contributed to the acquisitions of data, discussion to this study, and provided feedback on the manuscript.
Funding
The R/V Sonne cruises were supported by the German Federal Ministry of Education and Research (BMBF) and German Research Foundation (DFG). The R/V Shinsei-Maru cruises were supported by Japan Agency of Marine-Earth Science and Technology (JAMSTEC) and Joint Usage/Research Center for Atmosphere and Ocean Science at the Atmosphere and Ocean Research Institute, The University of Tokyo. This work was supported by the Austrian Science Fund (FWF-P29678).
Conflict of Interest
The authors declare that the research was conducted in the absence of any commercial or financial relationships that could be construed as a potential conflict of interest.
Acknowledgments
The authors highly appreciate the effort of shipboard scientists and staffs of the R/V Sonne cruises SO251 Leg 1 and SO219A Leg 2, and R/V Shinsei-maru cruises KS-18-10, KS-17-13, KS-16-14, KS-15-16, KS-15-3, and KS-14-16 to acquire the data used in this work. The authors are also immensely grateful to the editor MC and the two reviewers for their valuable comments which significantly improved the quality and clarity of this manuscript. Processing and interpretation of SBP data were done helpfully using IHS Markit Kingdom software (educational grant program), CWP/SU (Cohen and Stockwell, 2015) and Madagascar open-source software (Fomel et al., 2013). Bathymetric data were analyzed using Generic Mapping Tool (GMT) software (Wessel et al., 2013) and TopoToolbox (Schwanghart and Scherler, 2014).
Supplementary Material
The Supplementary Material for this article can be found online at: https://www.frontiersin.org/articles/10.3389/feart.2019.00319/full#supplementary-material
References
Abma, R., and Kabir, N. (2006). 3D interpolation of irregular data with a POCS algorithm. Geophysics 71, E91–E97. doi: 10.1190/1.2356088
Arai, K., Inoue, T., Ikehara, K., and Sasaki, T. (2014). Episodic subsidence and active deformation of the forearc slope along the Japan trench near the epicenter of the 2011 tohoku earthquake. Earth Planet. Sci. Lett. 408, 9–15. doi: 10.1016/j.epsl.2014.09.048
Arai, K., Naruse, H., Miura, R., Kawamura, K., Hino, R., Ito, Y., et al. (2013). Tsunami-generated turbidity current of the 2011 Tohoku-Oki earthquake. Geology 41, 1195–1198. doi: 10.1130/G34777.1
Bao, R., Strasser, M., McNichol, A. P., Haghipour, N., McIntyre, C., Wefer, G., et al. (2018). Tectonically-triggered sediment and carbon export to the Hadal zone. Nat. Commun. 9:121. doi: 10.1038/s41467-017-02504-1
Berner, R. A. (1982). Burial of organic carbon and pyrite sulfur in the modern ocean; its geochemical and environmental significance. Am. J. Sci. 282, 451–473. doi: 10.2475/ajs.282.4.451
Bird, P. (2003). An updated digital model of plate boundaries. Geochem. Geophys. Geosyst. 4:1027. doi: 10.1029/2001GC000252
Boston, B., Moore, G. F., Nakamura, Y., and Kodaira, S. (2017). Forearc slope deformation above the Japan Trench megathrust: implications for subduction erosion. Earth Planet. Sci. Lett. 462, 26–34. doi: 10.1016/j.epsl.2017.01.005
Burdige, D. J. (2007). Preservation of organic matter in marine sediments: controls, mechanisms, and an imbalance in sediment organic carbon budgets? Chem. Rev. 107, 467–485. doi: 10.1021/cr050347q
Cadet, J. P., Kobayashi, K., Lallemand, S., Jolivet, L., Aubouin, J., Boulegue, J., et al. (1987). Deep scientific dives in the Japan and Kuril Trenches. Earth Planet. Sci. Lett. 83, 313–328. doi: 10.1016/0012-821X(87)90074-4
Chen, Y., Zhang, L., and Mo, L.-W. (2015). Seismic data interpolation using nonlinear shaping regularization. J. Seism. Explor. 24, 327–342.
Chester, F. M., Rowe, C., Ujiie, K., Kirkpatrick, J., Regalla, C., Remitti, F., et al. (2013). Structure and composition of the plate-boundary slip zone for the 2011 Tohoku-Oki Earthquake. Science 342, 1208–1211. doi: 10.1126/science.1243719
Clift, P., and Vannucchi, P. (2004). Controls on tectonic accretion versus erosion in subduction zones: implications for the origin and recycling of the continental crust. Rev. Geophys. 42:RG2001. doi: 10.1029/2003RG000127
Clift, P. D. (2017). A revised budget for Cenozoic sedimentary carbon subduction. Rev. Geophys. 55, 97–125. doi: 10.1002/2016RG000531
Cohen, J. K., and Stockwell, J. W. Jr. (2015). CWP/SU: Seismic Un∗x Release No. 44: An Open Source Software Package for Seismic Research and Processing. Golden, CO: Colorado School of Mines.
Danovaro, R., Della Croce, N., Dell’Anno, A., and Pusceddu, A. (2003). A depocenter of organic matter at 7800m depth in the SE Pacific Ocean. Deep Sea Res. Part I Oceanogr. Res. Pap. 50, 1411–1420. doi: 10.1016/j.dsr.2003.07.001
Daubechies, I., Defrise, M., and De Mol, C. (2004). An iterative thresholding algorithm for linear inverse problems with a sparsity constraint. Commun. Pure Appl. Math. 57, 1413–1457. doi: 10.1002/cpa.20042
D’Hondt, S., Rutherford, S., and Spivack, A. J. (2002). Metabolic activity of subsurface life in deep-sea sediments. Science 295, 2067–2070. doi: 10.1126/science.1064878
Fomel, S., Sava, P., Vlad, I., Liu, Y., and Bashkardin, V. (2013). Madagascar: open-source software project for multidimensional data analysis and reproducible computational experiments. J. Open Res. Softw. 1:e8. doi: 10.5334/jors.ag
Fujiwara, T., dos Santos Ferreira, C., Bachmann, A. K., Strasser, M., Wefer, G., Sun, T., et al. (2017). Seafloor displacement after the 2011 Tohoku-oki Earthquake in the Northern Japan trench examined by repeated bathymetric surveys. Geophys. Res. Lett. 44, 833–839. doi: 10.1002/2017GL075839
Fujiwara, T., Kodaira, S., No, T., Kaiho, Y., Takahashi, N., and Kaneda, Y. (2011). The 2011 Tohoku-Oki earthquake: displacement reaching the trench axis. Science 334:1240. doi: 10.1126/science.1211554
Glud, R. N., Wenzhöfer, F., Middelboe, M., Oguri, K., Turnewitsch, R., Canfield, D. E., et al. (2013). High rates of microbial carbon turnover in sediments in the deepest oceanic trench on Earth. Nat. Geosci. 6, 284–288. doi: 10.1038/ngeo1773
Goldfinger, C. (2011). Submarine paleoseismology based on turbidite records. Ann. Rev. Mar. Sci. 3, 35–66. doi: 10.1146/annurev-marine-120709-142852
Goto, T., Satake, K., Sugai, T., Ishibe, T., Harada, T., and Gusman, A. R. (2019). Tsunami history over the past 2000 years on the Sanriku coast, Japan, determined using gravel deposits to estimate tsunami inundation behavior. Sediment. Geol. 382, 85–102. doi: 10.1016/j.sedgeo.2019.01.001
Hirakawa, K. (2012). Outsize tsunami sediments since last years along the Japan- and Kuril-Trench: a tentative idea on source and supercycle. Kagaku 82, 172–181.
Hirano, N., Takahashi, E., Yamamoto, J., Abe, N., Ingle, S. P., Kaneoka, I., et al. (2006). Volcanism in response to plate flexure. Science 313, 1426–1428. doi: 10.1126/science.1128235
Hydrographic and Oceanographic Department Japan Coast Guard, and JAMSTEC, (2011). Compilation of Tohoku-oki bathymetric data before the 2011 Tohoku-oki earthquake. Seismol. Soc. Jpn News Lett. 23, 35–36. doi: 10.1038/ncomms14044
Ide, S., Baltay, A., and Beroza, G. C. (2011). Shallow dynamic overshoot and energetic deep rupture in the 2011 Mw 9.0 Tohoku-Oki Earthquake. Science 332, 1426–1429. doi: 10.1126/science.1207020
Ikehara, K., Kanamatsu, T., Nagahashi, Y., Strasser, M., Fink, H., Usami, K., et al. (2016). Documenting large earthquakes similar to the 2011 Tohoku-oki earthquake from sediments deposited in the Japan Trench over the past 1500 years. Earth Planet. Sci. Lett. 445, 48–56. doi: 10.1016/j.epsl.2016.04.009
Ikehara, K., Usami, K., Kanamatsu, T., Arai, K., Yamaguchi, A., and Fukuchi, R. (2018). Spatial variability in sediment lithology and sedimentary processes along the Japan Trench: use of deep-sea turbidite records to reconstruct past large earthquakes. Geol. Soc. Lond. Spec. Publ. 456, 75–89. doi: 10.1144/SP456.9
Ishimura, D., and Miyauchi, T. (2015). Historical and paleo-tsunami deposits during the last 4000 years and their correlations with historical tsunami events in Koyadori on the Sanriku Coast, northeastern Japan. Prog. Earth Planet. Sci. 2:16. doi: 10.1186/s40645-015-0047-4
Jamieson, A. J., Fujii, T., Mayor, D. J., Solan, M., and Priede, I. G. (2010). Hadal trenches: the ecology of the deepest places on Earth. Trends Ecol. Evol. 25, 190–197. doi: 10.1016/j.tree.2009.09.009
Jones, D. O. B., Yool, A., Wei, C.-L., Henson, S. A., Ruhl, H. A., Watson, R. A., et al. (2014). Global reductions in seafloor biomass in response to climate change. Glob. Chang. Biol. 20, 1861–1872. doi: 10.1111/gcb.12480
Kanamatsu, T., Usami, K., McHugh, C. M. G., and Ikehara, K. (2017). High-resolution chronology of sediment below CCD based on Holocene paleomagnetic secular variations in the Tohoku-oki earthquake rupture zone. Geochem. Geophys. Geosyst. 18, 2990–3002. doi: 10.1002/2017GC006878
Kanamori, H. (1971). Seismological evidence for a lithospheric normal faulting — the Sanriku earthquake of 1933. Phys. Earth Planet. Inter. 4, 289–300. doi: 10.1016/0031-9201(71)90013-6
Kanamori, H. (1972). Mechanism of tsunami earthquakes. Phys. Earth Planet. Inter. 6, 346–359. doi: 10.1016/0031-9201(72)90058-1
Kanamori, H. (1977). The energy release in great earthquakes. J. Geophys. Res. 82, 2981–2987. doi: 10.1029/JB082i020p02981
Kawahata, H., Ishizaki, Y., Kuroyanagi, A., Suzuki, A., and Ohkushi, K. (2017). Quantitative reconstruction of temperature at a Jômon site in the Incipient Jômon Period in northern Japan and its implications for the production of early pottery and stone arrowheads. Quat. Sci. Rev. 157, 66–79. doi: 10.1016/j.quascirev.2016.12.009
Kawamura, K., Sasaki, T., Kanamatsu, T., Sakaguchi, A., and Ogawa, Y. (2012). Large submarine landslides in the Japan Trench: a new scenario for additional tsunami generation. Geophys. Res. Lett. 39:L05308. doi: 10.1029/2011GL050661
Kerrick, D. M. (2001). Present and past nonanthropogenic CO2 degassing from the solid earth. Rev. Geophys. 39, 565–585. doi: 10.1029/2001RG000105
Kioka, A., Schwestermann, T., Moernaut, J., Ikehara, K., Kanamatsu, T., McHugh, C. M., et al. (2019). Megathrust earthquake drives drastic organic carbon supply to the hadal trench. Sci. Rep. 9:1553. doi: 10.1038/s41598-019-38834-x
Kodaira, S., Nakamura, Y., Yamamoto, Y., Obana, K., Fujie, G., No, T., et al. (2017). Depth-varying structural characters in the rupture zone of the 2011 Tohoku-oki earthquake. Geosphere 13, 1408–1424. doi: 10.1130/GES01489.1
Kodaira, S., No, T., Nakamura, Y., Fujiwara, T., Kaiho, Y., Miura, S., et al. (2012). Coseismic fault rupture at the trench axis during the 2011 Tohoku-oki earthquake. Nat. Geosci. 5, 646–650. doi: 10.1038/ngeo1547
Koge, H., Fujiwara, T., Kodaira, S., Sasaki, T., Kameda, J., Kitamura, Y., et al. (2014). Friction properties of the plate boundary megathrust beneath the frontal wedge near the Japan Trench: an inference from topographic variation. Earth Planets Space 66:153. doi: 10.1186/s40623-014-0153-3
Kusumoto, S., Goto, T., Sugai, T., Omori, T., and Satake, K. (2018). Geological evidence of tsunamis in the past 3800 years at a coastal lowland in the Central Fukushima Prefecture, Japan. Mar. Geol. 404, 137–146. doi: 10.1016/j.margeo.2018.07.004
Lallemand, S. E., Schnürle, P., and Malavieille, J. (1994). Coulomb theory applied to accretionary and nonaccretionary wedges: possible causes for tectonic erosion and/or frontal accretion. J. Geophys. Res. Solid Earth 99, 12033–12055. doi: 10.1029/94JB00124
Lay, T., Kanamori, H., Ammon, C. J., Nettles, M., Ward, S. N., Aster, R. C., et al. (2005). The great Sumatra-Andaman Earthquake of 26 December 2004. Science 308, 1127–1133. doi: 10.1126/science.1112250
Leduc, D., Rowden, A. A., Glud, R. N., Wenzhöfer, F., Kitazato, H., and Clark, M. R. (2016). Comparison between infaunal communities of the deep floor and edge of the Tonga Trench: possible effects of differences in organic matter supply. Deep Sea Res. Part I Oceanogr. Res. Pap. 116, 264–275. doi: 10.1016/j.dsr.2015.11.003
Loveless, J. P., and Meade, B. J. (2010). Geodetic imaging of plate motions, slip rates, and partitioning of deformation in Japan. J. Geophys. Res. 115:B02410. doi: 10.1029/2008JB006248
MacInnes, B. T., Weiss, R., Bourgeois, J., and Pinegina, T. K. (2010). Slip distribution of the 1952 Kamchatka Great earthquake based on near-field tsunami deposits and historical records. Bull. Seismol. Soc. Am. 100, 1695–1709. doi: 10.1785/0120090376
McHugh, C. M., Kanamatsu, T., Seeber, L., Bopp, R., Cormier, M.-H., and Usami, K. (2016). Remobilization of surficial slope sediment triggered by the A.D. 2011 Mw 9 Tohoku-Oki earthquake and tsunami along the Japan Trench. Geology 44, 391–394. doi: 10.1130/G37650.1
McIntyre, C. P., Wacker, L., Haghipour, N., Blattmann, T. M., Fahrni, S., Usman, M., et al. (2017). Online 13C and 14C gas measurements by EA-IRMS–AMS at ETH Zürich. Radiocarbon 59, 893–903. doi: 10.1017/RDC.2016.68
Moernaut, J., Van Daele, M., Fontijn, K., Heirman, K., Kempf, P., Pino, M., et al. (2018). Larger earthquakes recur more periodically: new insights in the megathrust earthquake cycle from lacustrine turbidite records in south-central Chile. Earth Planet. Sci. Lett. 481, 9–19. doi: 10.1016/j.epsl.2017.10.016
Molenaar, A., Moernaut, J., Wiemer, G., Dubois, N., and Strasser, M. (2019). Earthquake impact on active margins: tracing surficial remobilization and seismic strengthening in a slope sedimentary sequence. Geophys. Res. Lett. 46, 6015–6023. doi: 10.1029/2019GL082350
Mori, N., Takahashi, T., Yasuda, T., and Yanagisawa, H. (2011). Survey of 2011 Tohoku earthquake tsunami inundation and run-up. Geophys. Res. Lett. 38:L00G14. doi: 10.1029/2011GL049210
Müller, M. (2007). Information Retrieval for Music and Motion. Berlin: Springer. doi: 10.1007/978-3-540-74048-3
Nagai, R., Kikuchi, M., and Yamanaka, Y. (2001). Comparative study on the source processes of recurrent large earthquakes in Sanriku-oki Region: the 1968 Tokachi-oki Earthquake and the 1994 Sanriku-oki Earthquake. Zisin-II 54, 267–280. doi: 10.4294/zisin1948.54.2_267
Nakamura, Y., Kodaira, S., Miura, S., Regalla, C., and Takahashi, N. (2013). High-resolution seismic imaging in the Japan Trench axis area off Miyagi, northeastern Japan. Geophys. Res. Lett. 40, 1713–1718. doi: 10.1002/grl.50364
Namegaya, Y., and Satake, K. (2014). Reexamination of the A.D. 869 Jogan earthquake size from tsunami deposit distribution, simulated flow depth, and velocity. Geophys. Res. Lett. 41, 2297–2303. doi: 10.1002/2013GL058678
Nunoura, T., Takaki, Y., Hirai, M., Shimamura, S., Makabe, A., Koide, O., et al. (2015). Hadal biosphere: insight into the microbial ecosystem in the deepest ocean on Earth. Proc. Natl. Acad. Sci. U.S.A. 112, E1230–E1236. doi: 10.1073/pnas.1421816112
O’Callaghan, J. F., and Mark, D. M. (1984). The extraction of drainage networks from digital elevation data. Comput. Vis. Graph. Image Process. 28, 323–344. doi: 10.1016/S0734-189X(84)80011-0
Oguri, K., Kawamura, K., Sakaguchi, A., Toyofuku, T., Kasaya, T., Murayama, M., et al. (2013). Hadal disturbance in the Japan Trench induced by the 2011 Tohoku–Oki Earthquake. Sci. Rep. 3:1915. doi: 10.1038/srep01915
Okamura, Y., and Namegaya, Y. (2011). Reconstruction of the 17th century Kuril multi-segment earthquake. Annu. Rep. Act. Fault Paleoearthquake Res. 11, 15–20.
Peng, G., Bellerby, R., Zhang, F., Sun, X., and Li, D. (in press). The ocean’s ultimate trashcan: hadal trenches as major depositories for plastic pollution. Water Res. 168:115121. doi: 10.1016/j.watres.2019.115121
Sakazaki, T., Kano, Y., Ohmura, J., and Hattori, K. (2015). On the severe typhoon attacking edo region in 1856. Sustain. Humanosphere 11, 64–70.
Sakoe, H., and Chiba, S. (1978). Dynamic programming algorithm optimization for spoken word recognition. IEEE Trans. Acoust. 26, 43–49. doi: 10.1109/TASSP.1978.1163055
Satake, K. (2015). Geological and historical evidence of irregular recurrent earthquakes in Japan. Philos. Trans. R. Soc. A Math. Phys. Eng. Sci. 373:20140375. doi: 10.1098/rsta.2014.0375
Satake, K., and Atwater, B. F. (2007). Long-term perspectives on giant earthquakes and tsunamis at subduction zones. Annu. Rev. Earth Planet. Sci. 35, 349–374. doi: 10.1146/annurev.earth.35.031306.140302
Sawai, Y., Namegaya, Y., Okamura, Y., Satake, K., and Shishikura, M. (2012). Challenges of anticipating the 2011 Tohoku earthquake and tsunami using coastal geology. Geophys. Res. Lett. 39:L21309. doi: 10.1029/2012GL053692
Sawai, Y., Namegaya, Y., Tamura, T., Nakashima, R., and Tanigawa, K. (2015). Shorter intervals between great earthquakes near Sendai: scour ponds and a sand layer attributable to A.D. 1454 overwash. Geophys. Res. Lett. 42, 4795–4800. doi: 10.1002/2015GL064167
Schwanghart, W., and Scherler, D. (2014). TopoToolbox 2 – MATLAB-based software for topographic analysis and modeling in Earth surface sciences. Earth Surf. Dyn. 2, 1–7. doi: 10.5194/esurf-2-1-2014
Seno, T., Sakurai, T., and Stein, S. (1996). Can the Okhotsk Plate be discriminated from the North American plate? J. Geophys. Res. Solid Earth 101, 11305–11315. doi: 10.1029/96JB00532
Stein, S., and Okal, E. A. (2005). Speed and size of the Sumatra earthquake. Nature 434, 581–582. doi: 10.1038/434581a
Strasser, M., Ikehara, K., and Cotterill, C. (2019). Expedition 386 scientific prospectus: Japan trench paleoseismology. Int. Ocean Disc. Prog. 386, 1–57. doi: 10.14379/iodp.sp.386.2019
Strasser, M., Kolling, M., Ferreira, C., dos, S., Fink, H. G., Fujiwara, T., et al. (2013). A slump in the trench: tracking the impact of the 2011 Tohoku-Oki earthquake. Geology 41, 935–938. doi: 10.1130/G34477.1
Strasser, M., Kopf, A. J., et al. (2017). Report and Preliminary Results of R/V SONNE Cruise SO251, Extreme Events Archived in the GEological Record of Japan’s Subduction Margins (EAGER-Japan), Leg A SO251-1, Yokohama - Yokohama, 04.10.2016 – 15.10.2016, Leg B SO251- 2, Yokohama - Yokohama, 18.10.2016 – 02.11.2016. Berichte: MARUM, 1–217.
Sun, T., Wang, K., Fujiwara, T., Kodaira, S., and He, J. (2017). Large fault slip peaking at trench in the 2011 Tohoku-oki earthquake. Nat. Commun. 8:14044. doi: 10.1038/ncomms14044
Takada, K., Shishikura, M., Imai, K., Ebina, Y., Goto, K., Koshiya, S., et al. (2016). Distribution and ages of tsunami deposits along the Pacific Coast of the Iwate Prefecture. Active Fault Paleoearthq. Res. 16, 1–52.
Takeuchi, H., Fuji, R., Mimura, N., Imamura, F., Satake, K., Tsuji, Y., et al. (2007). Survey of run-up height of Empo Boso-oki earthquake tsunami on the coast from Chiba prefecture to Fukushima prefecture. Hist. Earthq. 22, 53–59.
Tanioka, Y., and Satake, K. (1996). Fault parameters of the 1896 Sanriku Tsunami earthquake estimated from tsunami numerical modeling. Geophys. Res. Lett. 23, 1549–1552. doi: 10.1029/96GL01479
Tsuji, T., Kawamura, K., Kanamatsu, T., Kasaya, T., Fujikura, K., Ito, Y., et al. (2013). Extension of continental crust by anelastic deformation during the 2011 Tohoku-oki earthquake: the role of extensional faulting in the generation of a great tsunami. Earth Planet. Sci. Lett. 364, 44–58. doi: 10.1016/j.epsl.2012.12.038
Tsuji, Y., and Ueda, K. (1995). Evaluation of A.D. 1611 Keicho, A.D. 1677 Enpou, A.D. 1763 Houreki, A.D. 1793 Kansei, and A.D. 1856 Ansei Sanriku tsunamis. Hist. Earthq. 11, 75–106.
Tsuru, T., Park, J.-O., Miura, S., Kodaira, S., Kido, Y., and Hayashi, T. (2002). Along-arc structural variation of the plate boundary at the Japan Trench margin: implication of interplate coupling. J. Geophys. Res. Solid Earth 107:2357. doi: 10.1029/2001JB001664
Usami, K., Ikehara, K., Kanamatsu, T., and McHugh, C. M. (2018). Supercycle in great earthquake recurrence along the Japan Trench over the last 4000 years. Geosci. Lett. 5:11. doi: 10.1186/s40562-018-0110-2
von Huene, R., and Lallemand, S. (1990). Tectonic erosion along the Japan and Peru convergent margins. Geol. Soc. Am. Bull. 102, 704–720. doi: 10.1130/0016-76061990102<0704:TEATJA<2.3.CO;2
Wessel, P., Smith, W. H. F., Scharroo, R., Luis, J., and Wobbe, F. (2013). Generic mapping tools: improved version released. Eos Trans. Am. Geophys. Union 94, 409–410. doi: 10.1002/2013EO450001
Keywords: hadal zone, event deposit, organic carbon, paleoseismology, Japan Trench
Citation: Kioka A, Schwestermann T, Moernaut J, Ikehara K, Kanamatsu T, Eglinton TI and Strasser M (2019) Event Stratigraphy in a Hadal Oceanic Trench: The Japan Trench as Sedimentary Archive Recording Recurrent Giant Subduction Zone Earthquakes and Their Role in Organic Carbon Export to the Deep Sea. Front. Earth Sci. 7:319. doi: 10.3389/feart.2019.00319
Received: 15 June 2019; Accepted: 18 November 2019;
Published: 05 December 2019.
Edited by:
Michael Andrew Clare, University of Southampton, United KingdomReviewed by:
Patrick Lajeunesse, Laval University, CanadaYvonne Therese Spychala, Utrecht University, Netherlands
Copyright © 2019 Kioka, Schwestermann, Moernaut, Ikehara, Kanamatsu, Eglinton and Strasser. This is an open-access article distributed under the terms of the Creative Commons Attribution License (CC BY). The use, distribution or reproduction in other forums is permitted, provided the original author(s) and the copyright owner(s) are credited and that the original publication in this journal is cited, in accordance with accepted academic practice. No use, distribution or reproduction is permitted which does not comply with these terms.
*Correspondence: Arata Kioka, a2lva2FAbWluZS5reXVzaHUtdS5hYy5qcA==