 M. H. Masiokas1*
 A. Rabatel2
 A. Rivera3,4
 L. Ruiz1
 P. Pitte1
 J. L. Ceballos5G. Barcaza6A. Soruco7
 F. Bown8
 E. Berthier9
 I. Dussaillant9
 S. MacDonell10
- 1Instituto Argentino de Nivología, Glaciología y Ciencias Ambientales (IANIGLA), CCT CONICET Mendoza, Mendoza, Argentina
- 2Univ. Grenoble Alpes, CNRS, IRD, Grenoble-INP, Institut des Géosciences de l’Environnement, Grenoble, France
- 3Departamento de Geografía, Universidad de Chile, Santiago, Chile
- 4Instituto de Conservación, Biodiversidad y Territorio, Universidad Austral de Chile, Valdivia, Chile
- 5Instituto de Hidrología, Meteorología y Estudios Ambientales (IDEAM), Bogotá, Colombia
- 6Instituto de Geografía, Pontificia Universidad Católica de Chile, Santiago, Chile
- 7Facultad de Ciencias Geológicas, Universidad Mayor de San Andrés, La Paz, Bolivia
- 8Tambo Austral Geoscience Consultants, Valdivia, Chile
- 9LEGOS, Université de Toulouse, CNES, CNRS, IRD, UPS, Toulouse, France
- 10Centro de Estudios Avanzados en Zonas Áridas (CEAZA), La Serena, Chile
The Andes Cordillera contains the most diverse cryosphere on Earth, including extensive areas covered by seasonal snow, numerous tropical and extratropical glaciers, and many mountain permafrost landforms. Here, we review some recent advances in the study of the main components of the cryosphere in the Andes, and discuss the changes observed in the seasonal snow and permanent ice masses of this region over the past decades. The open access and increasing availability of remote sensing products has produced a substantial improvement in our understanding of the current state and recent changes of the Andean cryosphere, allowing an unprecedented detail in their identification and monitoring at local and regional scales. Analyses of snow cover maps has allowed the identification of seasonal patterns and long term trends in snow accumulation for most of the Andes, with some sectors in central Chile and central-western Argentina showing a clear decline in snowfall and snow persistence since 2010. This recent shortage of mountain snow has caused an extended, severe drought that is unprecedented in the hydrological and climatological records from this region. Together with data from global glacier inventories, detailed inventories at local/regional scales are now also freely available, providing important new information for glaciological, hydrological, and climatological assessments in different sectors of the Andes. Numerous studies largely based on field measurements and/or remote sensing techniques have documented the recent glacier shrinkage throughout the Andes. This observed ice mass loss has put Andean glaciers among the highest contributors to sea level rise per unit area. Other recent studies have focused on rock glaciers, showing that in extensive semi-arid sectors of the Andes these mountain permafrost features contain large reserves of freshwater and may play a crucial role as future climate becomes warmer and drier in this region. Many relevant issues remain to be investigated, however, including an improved estimation of ice volumes at local scales, and detailed assessments of the hydrological significance of the different components of the cryosphere in Andean river basins. The impacts of future climate changes on the Andean cryosphere also need to be studied in more detail, considering the contrasting climatic scenarios projected for each region. The sustained work of various monitoring programs in the different Andean countries is promising and will provide much needed field observations to validate and improve the analyses made from remote sensors and modeling techniques. In this sense, the development of a well-coordinated network of high-elevation hydro-meteorological stations appears as a much needed priority to complement and improve the many glaciological and hydro-climatological assessments that are being conducted across the Andes.
Introduction
The Andes Cordillera extends for almost 8,000 km along the western portion of South America, from ca. 11°N in northern Colombia and Venezuela to ca. 55°S in southern Chile and Argentina. Over this extensive latitudinal range, the Andes portray an impressive variety of topographic and climatic conditions that result in a vast and diverse cryosphere. In fact, no other mountainous region on Earth contains such a diversity of cryospheric features. The Andes contain the largest extension of tropical glaciers on Earth (many located above 5,000 m a.s.l.; Kaser and Osmaston, 2002). In the semi-arid subtropical Andes of Chile and Argentina one of the greatest areas of rock glaciers exists (Zalazar et al., 2017). In south-western Patagonia and Tierra del Fuego, extensive temperate glaciers and icefields terminate into terrestrial, lacustrine and marine environments. The Andes also include the largest glacierized area in the Southern Hemisphere outside Antarctica (the South Patagonian Icefield alone covers ca. 12,200 km2), and they have the greatest extension of seasonal snow and mountain permafrost in this part of the globe (RGI Consortium, 2017; Hammond et al., 2018; Jones et al., 2018).
Recent global estimates suggest that Andean glaciers are probably one of the highest contributors per unit area to sea level rise (e.g., Braun et al., 2019; Dussaillant et al., 2019; Wouters et al., 2019; Zemp et al., 2019), and many scientific assessments have used the Andean ice mass loss as a clear indicator of climate change. Furthermore, in vast semi-arid regions from Peru-Bolivia to central Chile and Argentina, the meltwater originating from different components of the Andean cryosphere represents a crucial water resource for sustaining human consumption, agriculture, mountain ecosystems, hydro-electric generation, and numerous industrial activities in the adjacent lowlands (e.g., Masiokas et al., 2013; Soruco et al., 2015; Dangles et al., 2017; Schoolmeester et al., 2018; Vuille et al., 2018; Zimmer et al., 2018). It is noteworthy that in the tropical regions, perennial and seasonal snow covers are limited or absent, strengthening the importance of glaciers to maintain water availability in the dry periods of the year (Kaser et al., 2010). Andean glaciers are also considered valuable natural elements of the landscape that attract hundreds of thousands of tourists each year and generate significant revenues for the local and regional economies (e.g., Schoolmeester et al., 2018; Vuille et al., 2018). On the other hand, the recent ice mass loss and the associated destabilization of slopes in the vicinity of newly formed proglacial lakes can also pose potential hazards and threaten the human populations and infrastructure located downvalley in the Andes (e.g., Worni et al., 2012; Cook et al., 2016; Wilson et al., 2018).
The diversity of glaciological and geocryological features and conditions briefly mentioned above demonstrate the enormous potential for cryospheric studies of the Andes Cordillera. In this paper we provide an overview of the Andean cryosphere by describing the current understanding and recent advances in the study of seasonal snow, glaciers and mountain permafrost (with a focus on rock glaciers) in this region. We also discuss recent trends observed in these main components of the Andean cryosphere in an attempt to put the more recent results in a longer term perspective. This review concludes with the discussion of some pending issues regarding the current understanding and potential future directions in the study of the major elements of the Andean cryosphere, hoping they can motivate and promote additional new scientific research in this mountain range.
Seasonal Snow
One of the typical characteristics of the Andes is the accumulation of variable amounts of snow on the ground in different periods of the year (Figure 1). This seasonal natural process constitutes a major feature in the Andean hydro-climatic system and is crucial for the distribution and preservation of other components of the cryosphere. For many Andean river basins, and in particular those in semi-arid climates in Chile and Argentina, this seasonal accumulation and subsequent melting of snow during warmer months provides a significant portion of the surface runoff (e.g., Masiokas et al., 2006; Favier et al., 2009) and is one of the most important sources of water for the maintenance of mountain ecosystems, for the recharge of aquifers, and for numerous human populations that rely on Andean waters for human consumption, irrigation, industries, and hydro-power generation. According to Masiokas et al. (2006), over 85% of the interannual variability in Andean streamflows between 30° and 37°S can be explained by variations in winter snow accumulation alone.
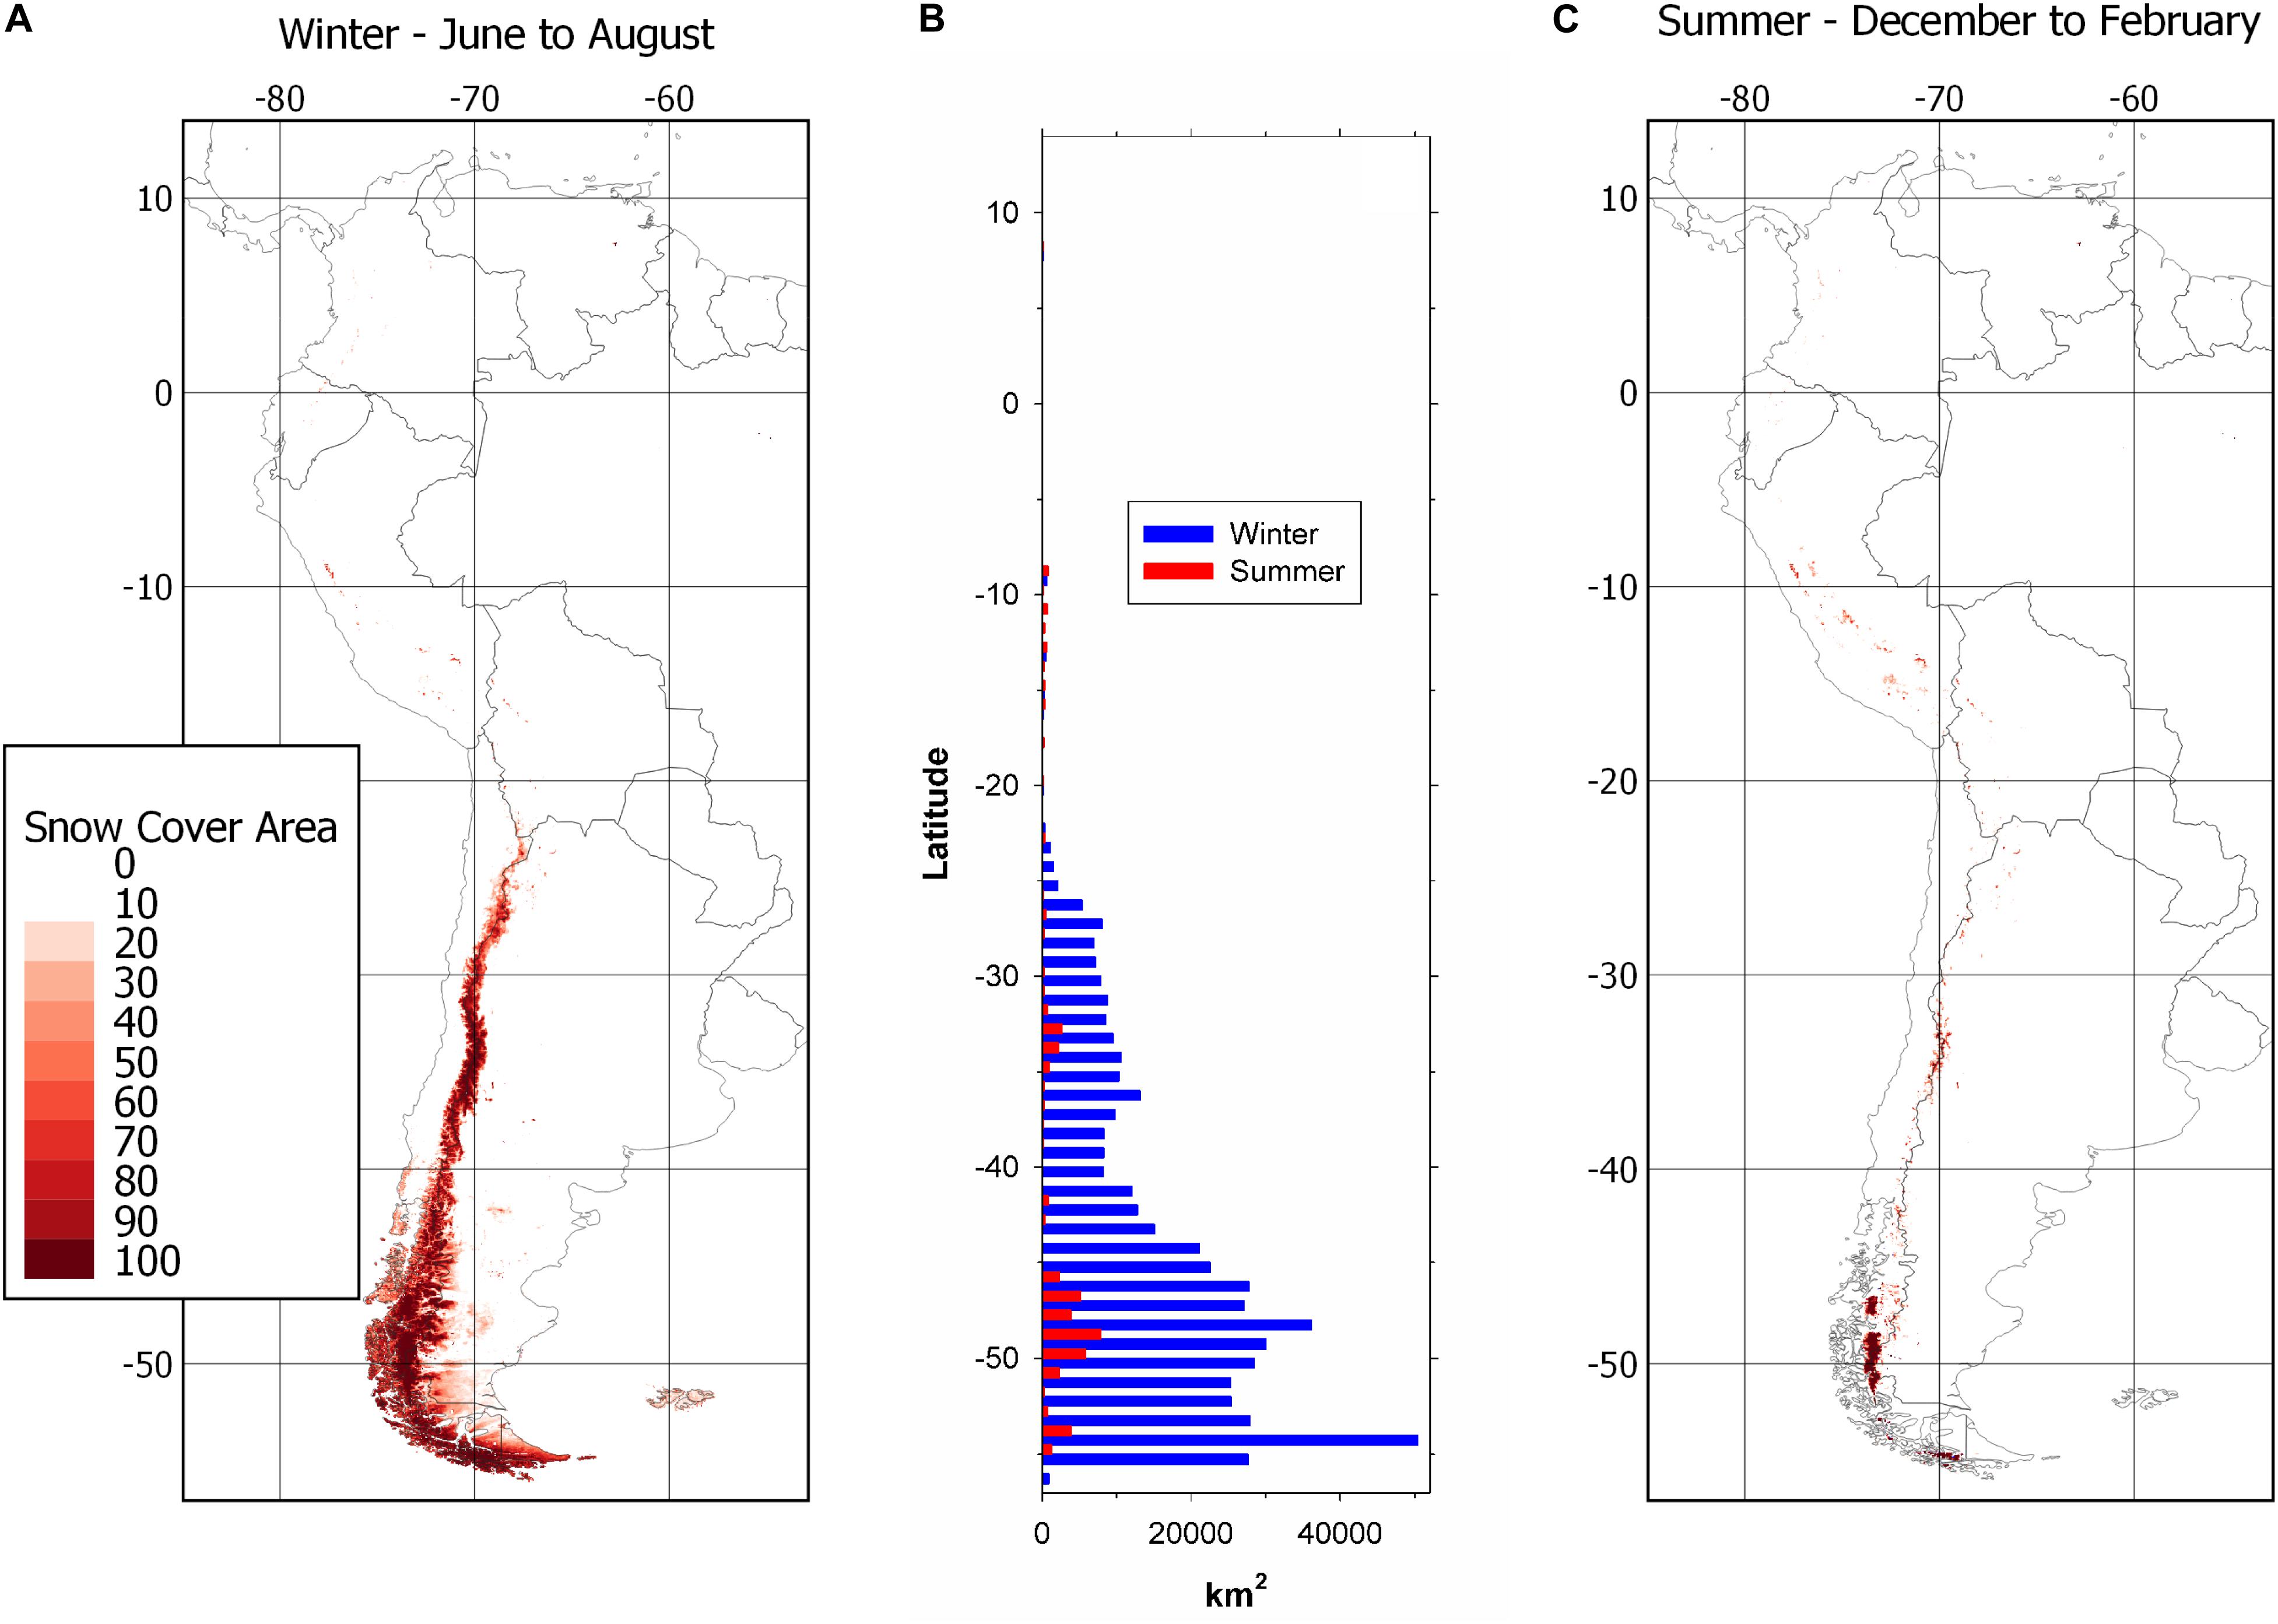
Figure 1. (A,C) Percentage of snow covered area in the Andes, averaged for the winter (June to August) and summer (December to February) seasons, respectively, and derived from MODIS sensors over the period 2000–2019. (B) Surface area covered with snow (NDSI > 0.4) during the two seasons mentioned above. Note the substantial differences in snow covered area at different times of the year. Source: NASA NSDIC DAAC (https://doi.org/10.5067/MODIS/MOD10CM.006).
The interaction between the main atmospheric circulation patterns and the orographic barrier of the Andes modulates the spatial and temporal distribution of solid precipitation across western South America, creating specific hydro-climatic regimes at different latitudes (Garreaud, 2009; Viale et al., 2019; Espinoza et al., 2020). In the tropical Andes most of the moisture has an Atlantic origin and is transported to the mountains by the dominant easterly circulation in a series of convection-driven precipitation events. This general pattern is in turn governed by the seasonal latitudinal changes of the Inter-Tropical Convergence Zone (ITCZ), which moves the zone of highest convective activity southward in late spring - summer (December-February), and equatorward during the winter (May-August). Thus in the inner tropical Andes of Ecuador, Colombia and Venezuela, humidity remains high throughout the year but two wetter seasons can be discerned in spring (October to November) during the southward passage of the ITCZ, and in autumn (April to May) when the belt of convective activity moves northward. In contrast, further south in the outer tropical Andes of Bolivia and Peru, most of the solid and liquid precipitation occurs when the ITCZ reaches these latitudes during the summer months (for more details see Espinoza et al., 2020). It is important to note, however, that the snow that falls outside of the glacier limits typically lasts for only a few days due to the high solar radiation which exists throughout the year, and thus the seasonal snow cover is almost entirely limited to the glacierized areas (Lejeune et al., 2007; Wagnon et al., 2009; Vuille et al., 2018).
Precipitation in the subtropical Andes (i.e., ca. 18°–29°S) is also of predominantly Atlantic origin and occurs during the austral summer months, but is driven primarily by the tropical easterlies associated with the South American summer monsoon (Garreaud, 2009). At the southernmost reaches of the subtropical region some precipitation can have a Pacific origin, but overall the precipitation amounts are comparatively much lower than those observed further north in the tropical Andes. In northernmost Chile (ca. 18–18.5°S), precipitation totals for upper Andean river basins range between ca. 150 and 400 mm a–1, but further south at 27–28°S these values can decrease to 40 mm a–1 (Alvarez-Garreton et al., 2018). These small precipitation amounts are clearly evidenced by the arid conditions of the region and the very limited number and extent of glaciers and snow patches in southwestern Bolivia, northern Chile and northwestern Argentina, despite the high elevation of the Andes at these latitudes.
South of ca. 29°S most of the precipitation reaching the Andes has a predominantly Pacific origin and is modulated by a series of frontal systems embedded in the dominant westerly circulation. At these latitudes the location of the subtropical Pacific anticyclone plays a major role in the intensity of the westerlies and precipitation seasonality. The equatorward displacement of this high pressure center allows the westerly storm tracks to move northward and result in a peak in precipitation in winter in the central Andes of Chile and Argentina and also in the north Patagonian Andes. At high elevations this peak in precipitation usually falls as snow and remains frozen until the onset of the melting season in the spring (September to October). Typical annual precipitation totals for upper Andean river basins in Chile (Alvarez-Garreton et al., 2018) increase from 150 to 200 mm a–1 around 30°S to 1600–2200 mm a–1 at 35°S. Further south, the Andes are exposed to the westerlies throughout the year and thus precipitation is more uniformly distributed in the different seasons, with a more mixed pattern of rain and snow that depends on the annual cycle of temperatures and the overall conditions during each specific precipitation event (Garreaud et al., 2009; Saavedra et al., 2017).
The extensive and persistent cloud cover associated with large precipitation amounts that are common in the latitudinal extremes of the Andes (i.e., in the inner Tropics and in southern Patagonia and Tierra del Fuego) have limited the use of optical satellite images to derive large-scale snow cover assessments in these regions. Saavedra et al. (2017) developed a detailed Andean snow climatology based on daily moderate resolution imaging spectroradiometer (MODIS) satellite images for the 8°–39°S latitude range. They found, for example, that in the tropics until ca. 23°S the snow cover is largely constrained to elevations above 5,000 m. Their analyses also showed that between 8° and 14°S snow cover has minimal seasonal variability but further south (14°–23°S) it peaks in late summer-early fall at the end of the wet season. At higher latitudes (south of 23°S) the highest snow coverage coincides with the austral winter months. The high elevation of the Andes and the relatively high precipitation that occurs between 28° and 37°S determine the greatest concentration of seasonal and permanent snow covered areas in this region (Saavedra et al., 2017; Figure 1). At higher latitudes, the southward decrease in elevation of the Andes also determines a concomitant gradual lowering of the regional snow line (Nogami, 1972; Rabassa, 1981; Saavedra et al., 2017). These regional patterns explain, to a large extent, the limited glacierization of the high arid Andes of northern Chile and Argentina, and the extensive glaciers and icefields in southern Patagonia, where greater and more frequent snow accumulation can be observed all year long (Aniya et al., 1997; Lliboutry, 1998; Garreaud, 2009; Bravo et al., 2019a; Durand et al., 2019).
ENSO and Seasonal Snow
The El Niño – Southern Oscillation phenomenon, and the associated ocean-atmosphere conditions in the tropical Pacific, constitute major factors modulating the interannual variability of the solid and liquid precipitation that reaches the Andes. The impacts of ENSO on Andean glaciers and snowfall records are well known in western South America and have been described using a variety of indicators, including in situ measurements (e.g., Masiokas et al., 2006; Maussion et al., 2015), and more recently data derived from remote sensing (e.g., Cortés and Margulis, 2017; Saavedra et al., 2017; Cordero et al., 2019) and snow mass balance models (Réveillet et al., 2020).
In the tropical Andes, El Niño events associated with warm conditions in the tropical Pacific usually result in reduced and delayed snow accumulation and higher temperatures in the mountains, which ultimately produce significant ice mass loss in glaciers during these years (e.g., Wagnon et al., 2001; Francou et al., 2003, 2004; Maussion et al., 2015; Vuille et al., 2018). In contrast, La Niña events are often associated with higher snow accumulation and colder temperatures that tend to lead to less negative or even slightly positive glacier mass balances across this region. In the southern Andes, numerous studies have reported a significant association between ENSO and winter snow accumulation. However, the impacts of ENSO have an opposite effect than that observed in the tropical Andes. In the central Andes of Chile and Argentina between ca. 29° and 37°S, above-average snowfall anomalies tend to occur during the warm phases of ENSO (El Niño years), and below-average snow conditions during the cold ENSO phases (La Niña events; Masiokas et al., 2006; Rivera et al., 2017). This relationship is nonetheless not straightforward and does not necessarily apply in all warm or cold ENSO years (Masiokas et al., 2006). This non-linear relationship was also observed by Saavedra et al. (2017) using snow cover data derived from MODIS imagery, and by Garreaud et al. (2017) based on precipitation series from central Chile. They showed that although ENSO appears as a main climate driver in the region, not all El Niño (La Niña) years result in above-average (below-average) precipitation anomalies in the Andes at these latitudes. Cordero et al. (2019) found a discernible influence of ENSO in dry season snow patterns.
Recent Snow Trends
The magnitude and spatial patterns of the snow accumulated each year in many tropical, subtropical and extratropical Andean basins have remained largely unknown until very recently. This limited knowledge is likely due to the sheer magnitude of the Andes Cordillera as a whole, the systematic lack of snowpack measurements at high elevations, and the great diversity in topographic and climatic conditions that exist over this mountain range. In this regard, the freely available data from the MODIS sensors have become useful for the study and characterization of snow cover variations across large areas, providing new important information for many previously unstudied regions throughout the Andes. Several recent studies (e.g., Cara et al., 2016; Cortés et al., 2016; Cortés and Margulis, 2017; Saavedra et al., 2018) have used the MODIS dataset, other remote sensing sources (such as Landsat imagery), in situ snowpack measurements and/or modeling approaches to assess recent changes in snow cover across the Andes. Saavedra et al. (2018), for example, assessed snow cover patterns using 2000–2016 daily MODIS data from the region between 8° and 36°S (further north and south, the high frequency of clouds precluded detailed assessments). One prominent finding of their analyses is the identification of an extensive area in the Andes between 29° and 36°S where snow cover has decreased at an average rate of 2–5 fewer days per year, and where the snowline elevation increased at an annual rate of 10–30 m a–1. Cordero et al. (2019) used Landsat images from the Andes between 18° and 40°S, and found that despite significant interannual variability, dry-season snow cover in this extensive region has declined at an average annual rate of −12% decade–1 between 1968 and 2018.
Given that snowfall is a major component of the glacier mass balance in the tropical Andes, the recent decline in tropical glacier mass could be associated, at least partly, with a decreasing trend in snow accumulation at high elevations. However, as stressed by Vuille et al. (2018), snowfall measurements at these sites are quite scarce and the spatio-temporal patterns of this climatic variable are virtually unknown, highlighting the need to improve the measurements and characterization of this crucial climatic process in this region. In contrast, further south in the central Andes of Chile and Argentina, the recent decline in winter snow accumulation is relatively well known and is being monitored with concern on both sides of the international divide. Particularly because since 2010, this region has been experiencing the most extreme dry period since at least the beginning of the 20th century. Due to its severity and duration, this sustained dry period has been termed the “Megadrought” (Garreaud et al., 2017; Rivera et al., 2017). This drought (which still persists in 2020) is apparently unprecedented even in a tree-ring based precipitation reconstruction that spans the last millennium (Garreaud et al., 2017), and is readily observable not only on the snowpack records, but also on streamflow series and glacier mass balance records (Masiokas et al., 2016; Rivera et al., 2017; Dussaillant et al., 2019).
The widespread retreat reported for most Patagonian glaciers (see section “Glaciers” below) could also be partly associated with a decrease in winter snow accumulation. However, although this is probably true for the north Patagonian region (Masiokas et al., 2008; Garreaud et al., 2009), the assessment is much more uncertain further south where there is a serious lack of direct in situ snowfall measurements. A recent study by Falaschi et al. (2019) showed a clear atmospheric warming and a reduction in precipitation in the eastern side of the North Patagonian Icefield (hereafter NPI) in the last 5–6 decades. Other studies have used modeling approaches combined with reanalysis data to derive spatially resolved precipitation maps (e.g., Lenaerts et al., 2014; Schaefer et al., 2015). Bravo et al. (2019a) assessed spatial and temporal patterns in snow accumulation in the NPI and the South Patagonian Icefield (hereafter SPI) using a regional climate model, four phase partitioning methods, and few short-term snow accumulation observations. They found a marked contrast between the wetter western side vs. the drier eastern side at both icefields, and no significant trend during the 1980–2015 period for all seasons except in the austral autum. In this season they found a positive (negative) trend in snow accumulation in the western (eastern) side of the SPI. Further south, Aguirre et al. (2018) used MODIS snow cover products and historical climate data to reconstruct snow cover changes in the Brunswick Peninsula around the city of Punta Arenas in southwestern Patagonia (ca. 53°S, 71°W). Their analyses showed that snow extent in this region has decreased ca. 20% between 1972 and 2016, and that this pattern could be related to the long-term warming observed at Punta Arenas during the cold season.
Glaciers
Tropical Andes (11°N – 17.5°S)
The tropical Andes can be divided into two zones with different climate characteristics (Troll, 1941). The inner tropics with more or less continuous precipitation throughout the year, and the outer tropics characterized by a dry, a wet and a transition season. From a glaciological point of view, one can consider that glaciers from 11°N in Colombia and Venezuela to about 5°S in the northern part of Peru belong to the inner tropics, whereas glaciers located south of 5°S in Peru to 17.5°S in Bolivia belong to the outer tropics. Homogeneous air temperature conditions in average prevail throughout the year but with a slight seasonality in the outer tropics (1 to 2°C higher temperatures during the austral summer). The incident solar radiation is also more or less constant throughout the year (∼200 W m–2), as the seasonality of the extraterrestrial irradiance in the outer tropics is attenuated by pronounced cloud seasonality (Sicart et al., 2005). In the inner tropics, humidity remains almost unchanged throughout the year (e.g., ∼80 ± 10% at Antisana glacier in Ecuador), whereas the outer tropics are characterized by notable seasonal differences in humidity and increased precipitation during the wet season. These climate features lead to specificities in the glacier surface mass and energy balance regimes (e.g., Rabatel et al., 2012, 2013; Vuille et al., 2018).
Tropical glaciers are characterized by large vertical mass balance gradients in the ablation area (e.g., Kaser et al., 1996; Favier et al., 2004; Soruco et al., 2009; Vincent et al., 2018), implying a significant contribution of the lowest areas of the glacier to total ablation. For example, for the Zongo glacier in Bolivia, the ablation area (one third of the glacier surface at the low elevation ranges) contributes with 80% to the yearly specific mass balance of the glacier (Soruco et al., 2009). Distributed simulation of the energy fluxes at the glacier scale showed that the frequent changes in snow cover throughout the ablation season are the main explanation for the marked vertical mass balance gradients of tropical glaciers (Sicart et al., 2011). In addition, tropical glaciers have year-round ablation conditions close to the glacier snout. Indeed, the ablation is almost constant in Ecuador (around 25 to 30 cm on average per month at about 4950 m a.s.l., Francou et al., 2004) but toward the outer tropics the melt rate seasonality is more evident. In the inner tropics, the sensitivity of Ecuadorian and Colombian glaciers to climate is closely linked to the absence of temperature seasonality. The 0°C isotherm constantly oscillates through the ablation zone of the glaciers, and a minor variation in air temperature can influence the melt processes by determining the phase of precipitation and consequently affect the surface albedo in the ablation zone. The frequency and intensity of snowfall, which can occur all year long, play a major role in attenuating the melt processes. The interannual variability of ablation is mainly controlled by year-to-year variations in air temperature (Francou et al., 2004), which determine the snowline altitude.
In the outer tropics, where liquid precipitation is rare on glaciers, the surface mass balance is closely related to the total amount and the seasonal distribution of precipitation (Wagnon et al., 2001; Francou et al., 2003; Sicart et al., 2005). Concerning the evolution of melt at the glacier surface throughout the year, three seasons can be distinguished for outer tropical glaciers (Sicart et al., 2011; Rabatel et al., 2012): (1) the transition season from September to December, when accumulation is still limited and the ablation of ice gradually increases to reach its maximum in November; (2) the rainy season from January to April, which corresponds to the period of accumulation, where in the lower part of the glacier, snow ablation predominates; and (3) the dry season from May to August, where ablation, although reduced, is largely present by sublimation over the entire surface of the glacier. Finally, the annual surface mass balance depends largely on the beginning of the wet season, which interrupts the period of high melt caused by solar radiation (Sicart et al., 2011). Any delay in the onset of the wet season and the concurrent accumulation of snow causes a very negative surface mass balance due to the existence of exposed ice and high ablation rates in the lower portion of the glaciers.
Recent Glacier Changes in the Tropical Andes
Rabatel et al. (2013) made an extensive review of the glacier changes in the tropical Andes over recent decades. The information between the early 1940s and the early 1960s is scarce but the available evidence from Peru, Bolivia and Colombia indicates a moderate retreat, followed by a relatively stable period from the mid-1960s to the second half of the 1970s (and even with some glacier snouts advancing during this interval; e.g., Zongo glacier; Soruco et al., 2009). In the late 1970s a clear shift toward increased ice mass wastage occurred and glacier volumes, lengths and surface areas started to decrease substantially. The glacier shrinkage in the three last decades appears to be unprecedented at a multi-secular scale (Rabatel et al., 2013).
Rabatel et al. (2013) and more recent works have shown that glaciers in Venezuela have almost completely disappeared. Morris et al. (2006) reported that glacier surface area decreased from 2.03 km2 in 1952 to 0.3 km2 in 2003, representing a total loss of 87%. In Colombia, Rabatel et al. (2018a) reported an overall glacier extent of about 42.4 ± 0.71 km2 in 2016 distributed in four glacierized mountain ranges. This is 36% less than in the mid-1990s, 62% less than in the mid-twentieth century and almost 90% less than the Little Ice Age (LIA) maximum extent. Considering the strong imbalance with the current climate conditions, the limited altitudinal extent of these glaciers and their reduced accumulation areas, most of the Colombian glaciers will likely disappear in the coming decades whatever the considered climate scenario. Only the largest ones located on the highest summits will probably persist, covering a reduced area, until the second half of the twenty-first century.
In Ecuador, results obtained by Jordan et al. (2005) using photogrammetry on the Cotopaxi Volcano (5897 m a.s.l.) showed that Cotopaxi glacier area remained stable between 1956 and 1976 and then decreased by approximately 30% between 1976 and 1997. Recent updates are mostly based on satellite imagery (LANDSAT, ASTER, and ALOS), and show that over the 1962–1997 period, the surface area of the glaciers on Chimborazo (6268 m a.s.l.) decreased 57% from 27.7 to 11.8 km2 (Caceres, 2010). For Cotopaxi and Antisana (5753 m a.s.l.) volcanoes, the loss in surface area was 37% and 33% for the period 1979–2007, respectively (Caceres, 2010). Intermediate data indicate that the retreat increased since the early 1990s (Basantes, 2010; Collet, 2010).
In Peru, four national inventories were produced since the 1960s. The first one used aerial photographs from 1962 and presented a total glacierized area of 2042 km2, but in many sectors of the Andes the glacier data were incomplete. These data were reanalyzed and completed recently with Landsat images from 1975, and the glacier area for 1962/1975 estimated to 2399 km2 (INAIGEM, 2018). The second inventory was performed in 1997 using Landsat satellite images, resulting in a total area of 1595 km2 (CONAM, 2001). The third inventory (using Landsat, ASTER and SPOT satellite images from 2003 to 2010) showed a further decrease in the total glacierized area to 1298 km2 (ANA, 2014). Finally, the fourth inventory showed that by 2016 the glacierized area of Peru had reduced to 1114 km2 (INAIGEM, 2018). The INAIGEM report (2018) indicates that the northern, central and southern cordilleras lost 1285 km2 (54%) of ice cover between 1962 and 2016. The northern cordilleras (Blanca, Huallanca, Huayhuash, and Raura) lost 40% during this period, whereas the central cordilleras (Huagoruncho, La Viuda, Central, Huaytapallana and Chonta) showed much larger glacier shrinkages reaching up to 70% of areal loss. Finally, in the southern cordilleras (Ampato, Vilcabamba, Urubamba, Huanzo, Chila, La Raya, Vilcanota, Carabaya and Apolobamba) the glacier areal loss was ca. 60% (INAIGEM, 2018).
Other studies have shown a similar pattern of glacier recession in Peru: in the Cordillera Blanca areal changes were relatively low from the 1950s to the 1970s, but were followed by a sharp glacier retreat (e.g., Hastenrath and Ames, 1995; Salzmann et al., 2013). A twenty-seven percent areal loss was reported for the entire Cordillera Blanca between the 1960s and the 2000s (UGRH, 2010), with a glacier surface area shrinking from 723 to 527 km2. For the second largest glacierized mountain range in Peru (the Cordillera Vilcanota), Salzmann et al. (2013) reported a 32% glacier area loss between 1962 and 2006 (from 440 to 297 km2), with changes concentrated mostly after 1985. More recently, Drenkhan et al. (2018) estimated for this region a rate of glacier area loss of about 1% a–1 between 2010 and 2016.
In Bolivia, Jordan (1991) published the first and almost complete (excluding the Cordillera Occidental) glacier inventory using aerial photographs from 1975. The total glacierized area was estimated to about 560 km2. Many additional studies have been presented in the following decades, all showing alarming degrees of deglaciation in different sectors of the Bolivian Andes (Table 1). The most recent estimate indicates that in Bolivia the total glacierized area is ca. 266 km2 (Veettil et al., 2018).
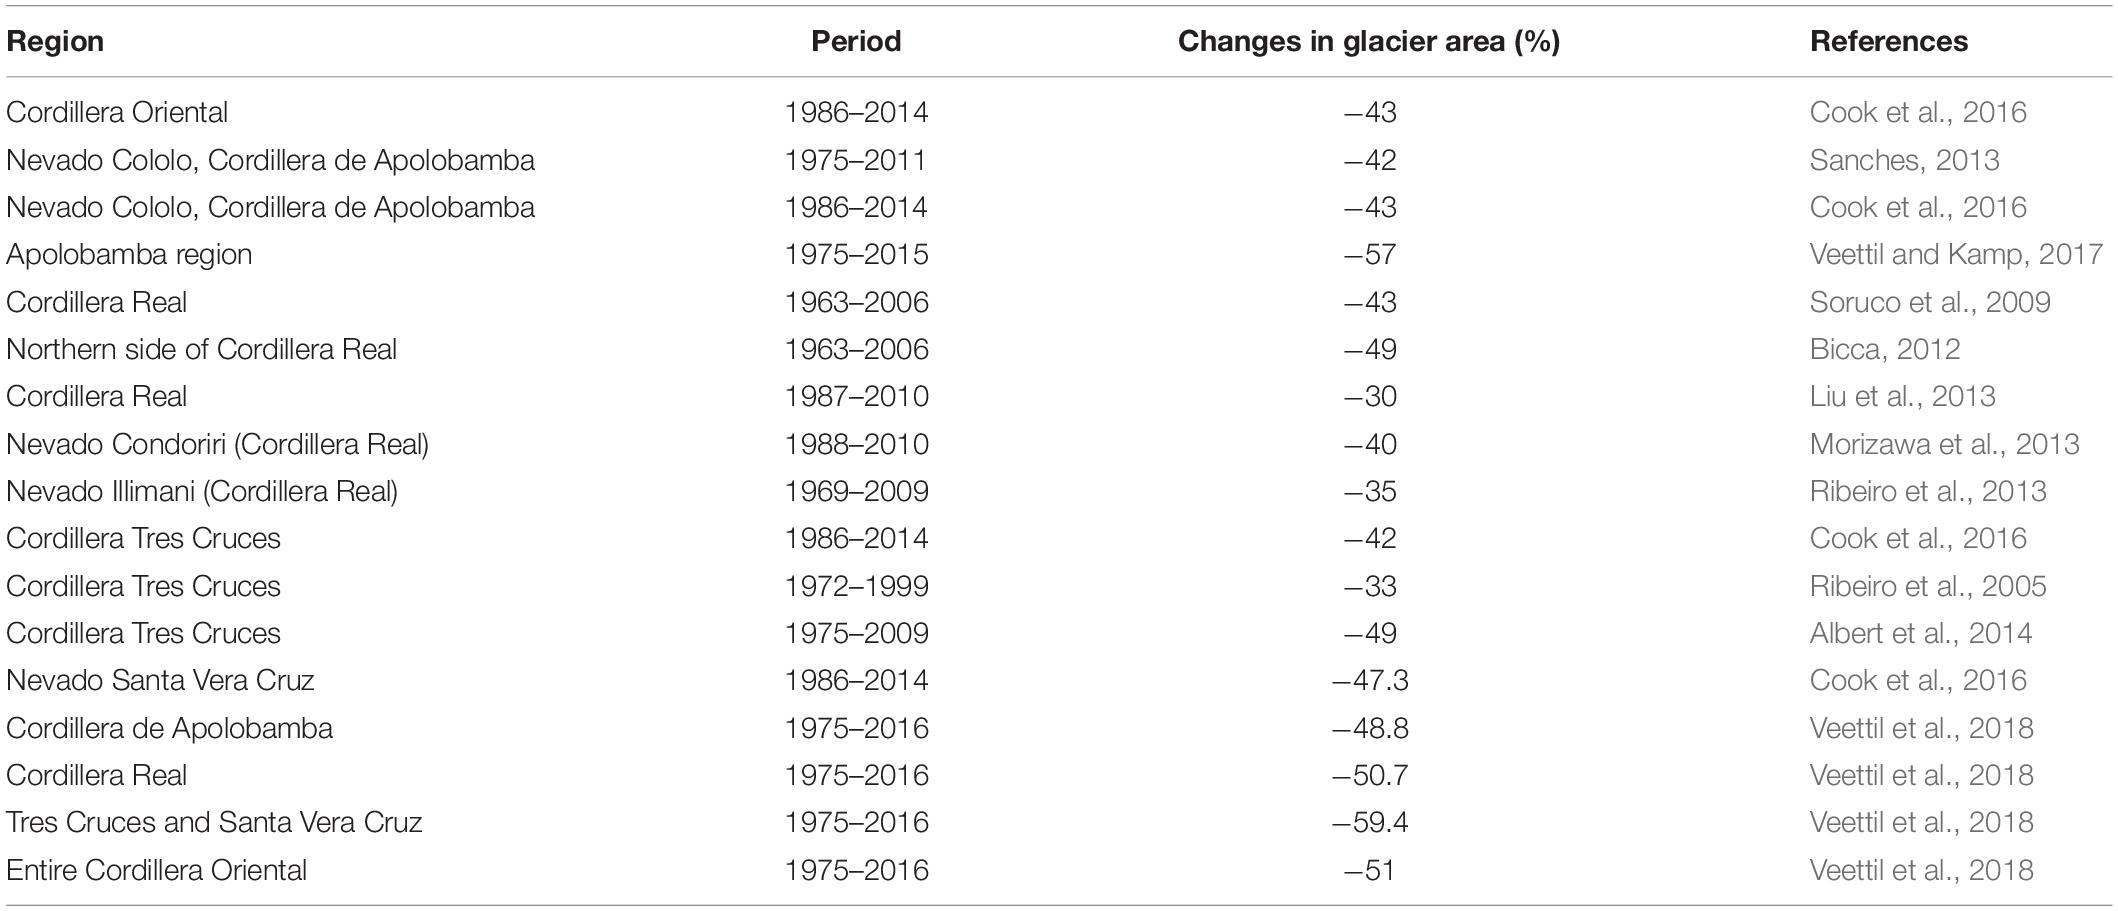
Table 1. Compilation of studies based on aerial photographs and/or satellite imagery showing the recent glacier changes in Bolivia.
Multi-decadal time series of surface mass balance in the Tropical Andes are scarce (Figure 2) and have been complemented with the geodetic method that uses the differences in surface elevation derived from digital elevation models (DEMs) from different dates. The available information clearly indicates a predominant pattern of glacier mass loss over the past 50 years. As reported in Rabatel et al. (2013), this information would also suggest that in the last decades of the 20th century, glaciers in the tropical Andes experienced highly negative mass balances, particularly from the late 1970s to the early 2000s. A break point in the late 1970s is clearly discernible in the series of mean annual mass balances, which decreased from −0.2 m w.e. yr–1 during 1964–1975 to −0.76 m w.e. yr–1 during 1976–2010. Rabatel et al. (2013) compared mass balance records from glaciers at different elevations and showed that glaciers with a maximum elevation located above 5400 m a.s.l (i.e., approximately the uppermost altitude reached by the equilibrium line during very negative mass balance years) showed an average trend of −0.6 m w.e. yr–1 from the mid-1970s to the late 2000s. In contrast, glaciers with a maximum elevation lower than 5400 m a.s.l. showed much stronger negative trends with an average of −1.2 m w.e. yr–1. The negative trend in the observed mass balances has continued until recent times (Figure 2).
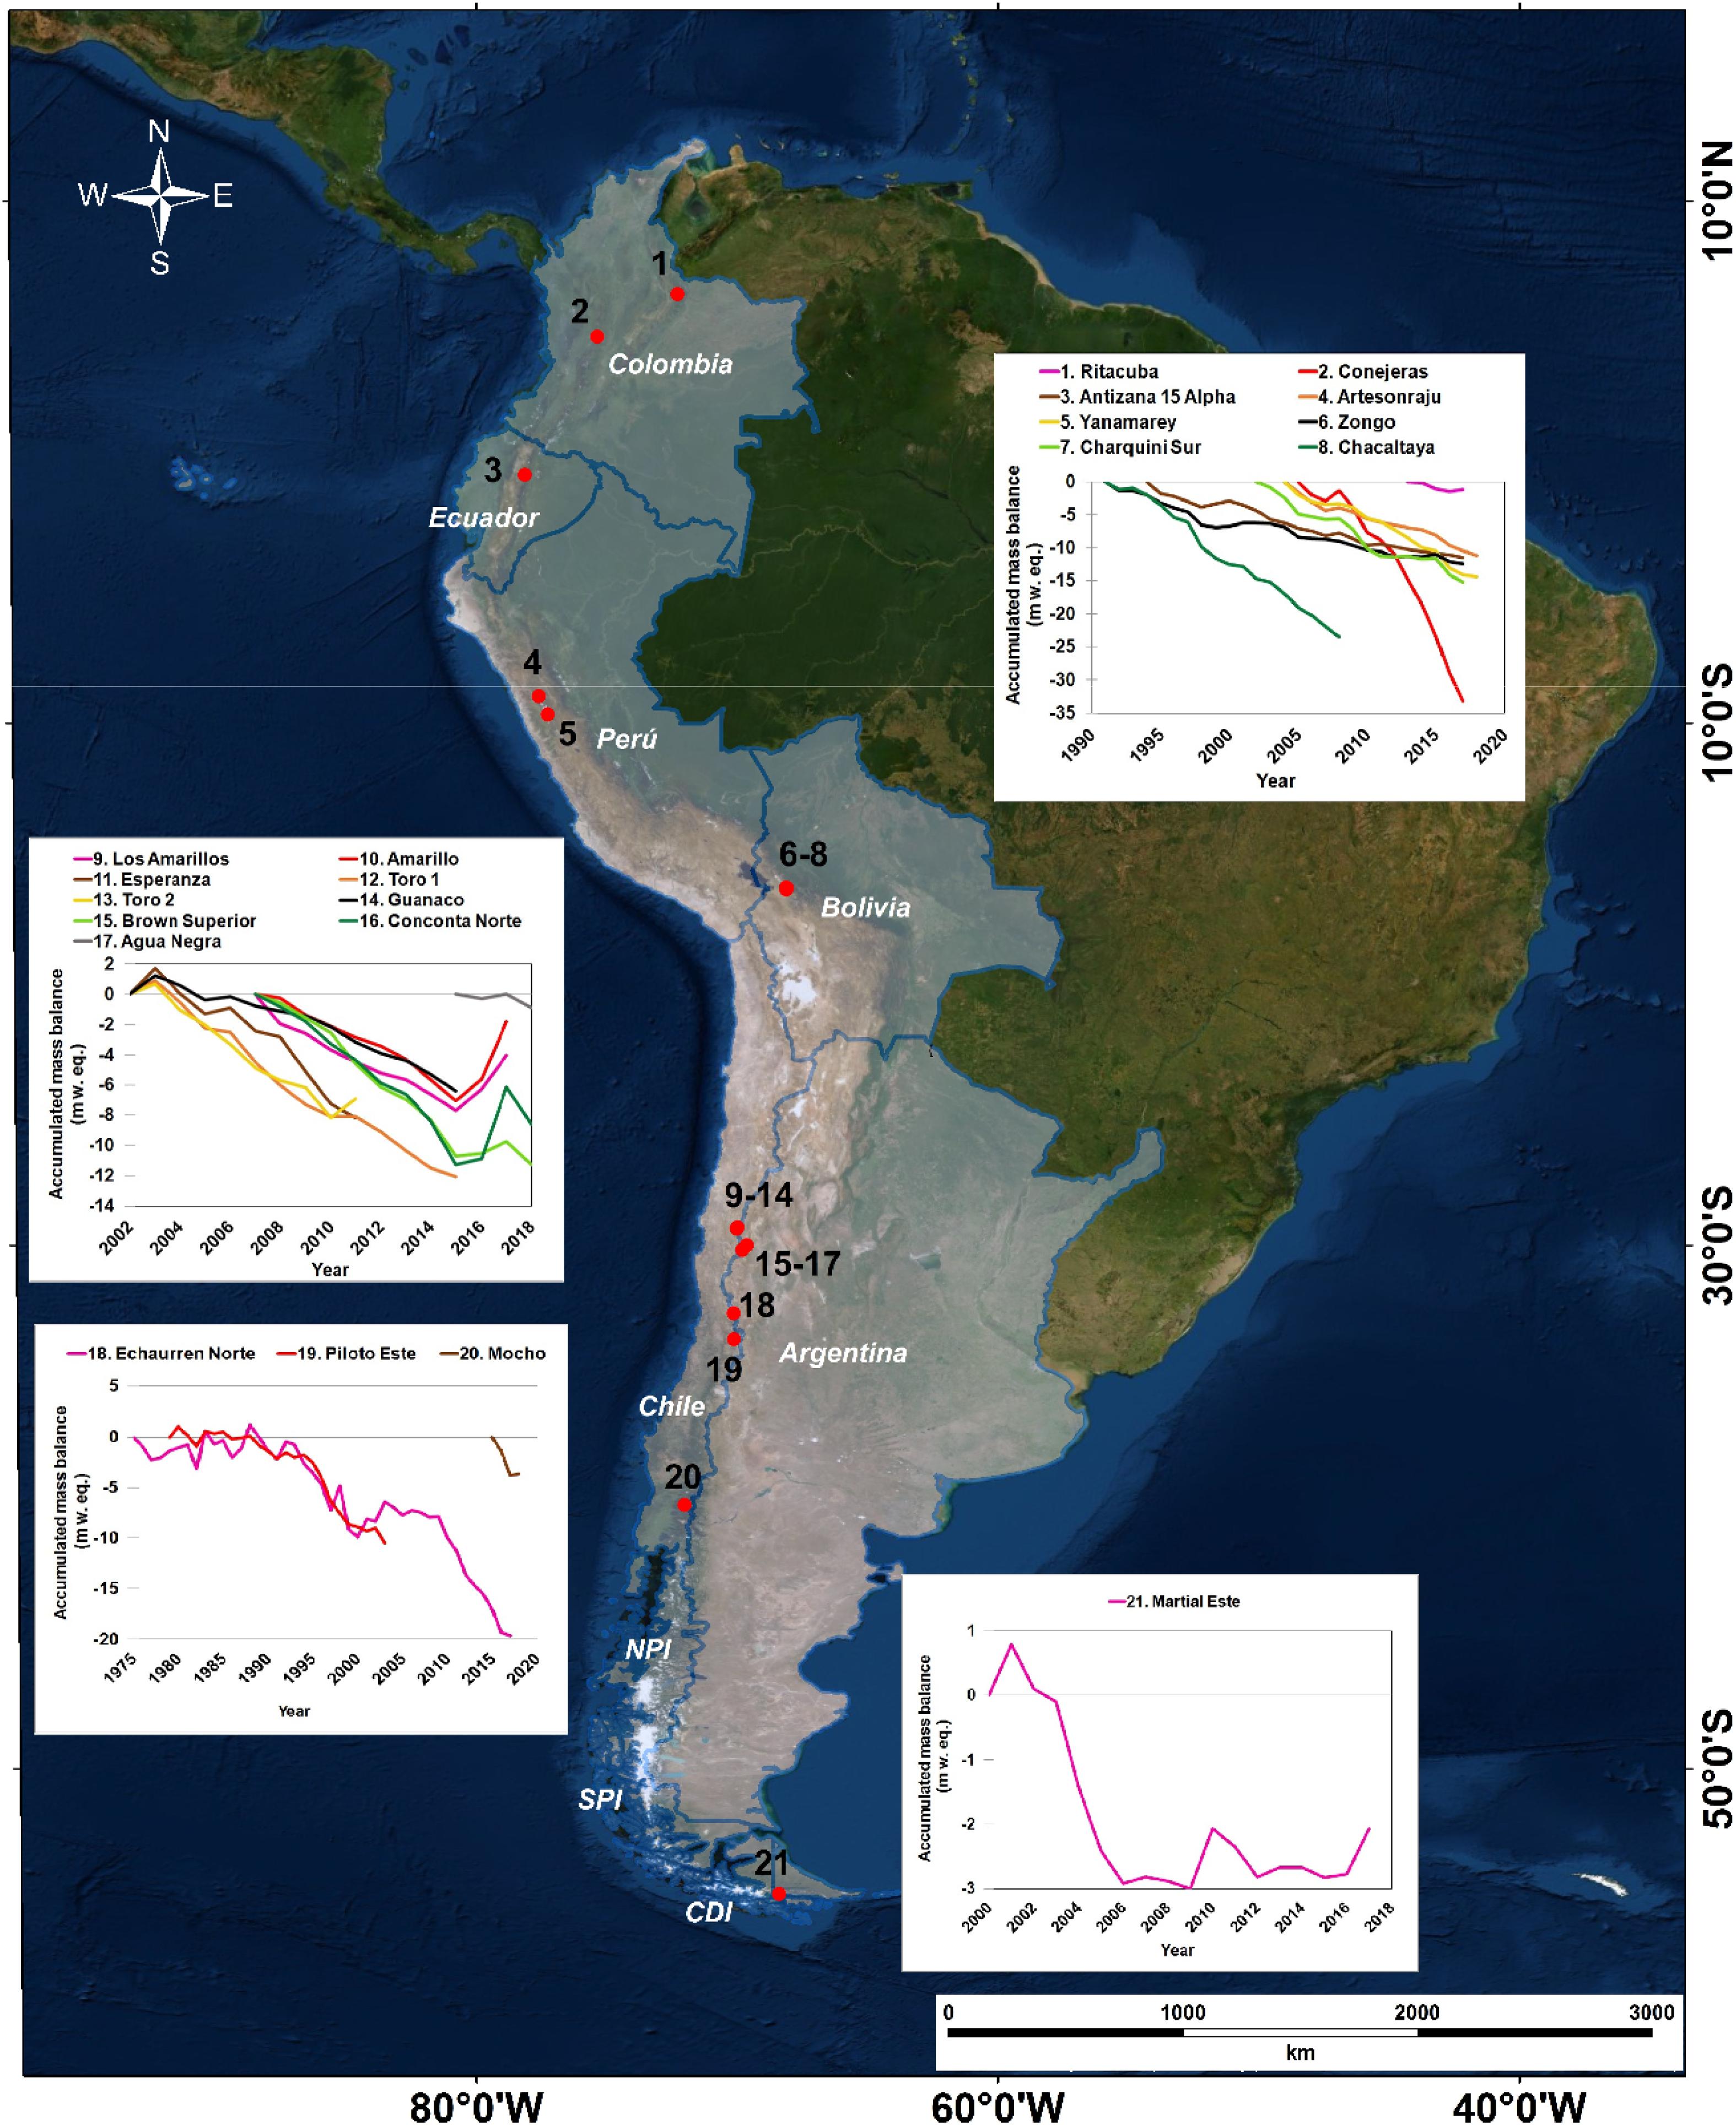
Figure 2. Location of the glaciers with long (>5 years) series of mass balance measurements in the Andes. Note that only the Echaurren Norte series is longer than 30 years. Source: Official glacier mass balance data provided by the national correspondents and published by the World Glacier Monitoring Service (https://wgms.ch/).
A recent study by Dussaillant et al. (2019) used multi-temporal DEMs based on stereo-pairs of ASTER satellite optical images (Raup et al., 2000) to quantify the overall ice mass changes along the Andes over the 2000–2018 period. The authors showed that glaciers of the Tropical Andes have lost ice at an almost constant rate of -1.0 ± 0.5 Gt yr–1 between 2000 and 2018 (corresponding to a mass balance of −0.42 m w.e. yr–1). Braun et al. (2019) estimated roughly half of this value using satellite radar data, a discrepancy that can be partly explained by a lower spatial coverage in the latter study (56% vs. 90% of glacierized area considered in Dussaillant et al., 2019). Differences between the two estimates might also be related to the respective uncertainties of the methods that used different satellite data (optical for Dussaillant et al., vs. radar for Braun et al.) and to the data processing (e.g., filtering of outliers, gap-filling). Please refer to Dussaillant et al. (2019) for an in-depth analysis of these issues.
Southern Andes (17.5° – 55°S)
The southern Andes cover more than 4500 km from northernmost Chile to the southern tip of South America in Tierra del Fuego. According to the glacio-climatological regions proposed by Lliboutry (1998), this region can be divided into the Dry Andes (17.5° – 35°S) and the Wet Andes (35° – 55°S). The Dry Andes include the Desert (17.5° – 31°S) and the Central Andes (31° – 35°S) regions, whereas the Wet Andes are divided here into the North Patagonian (35° – 45.5°S) and the South Patagonian Andes (45.5° – 55°S). Over this extensive range the Andes contain a wide variety of glaciers including permanent snowfields or glacierets, mountain glaciers, valley glaciers, outlet glaciers, piedmont glaciers, icecaps, and extensive icefields (Figure 3).
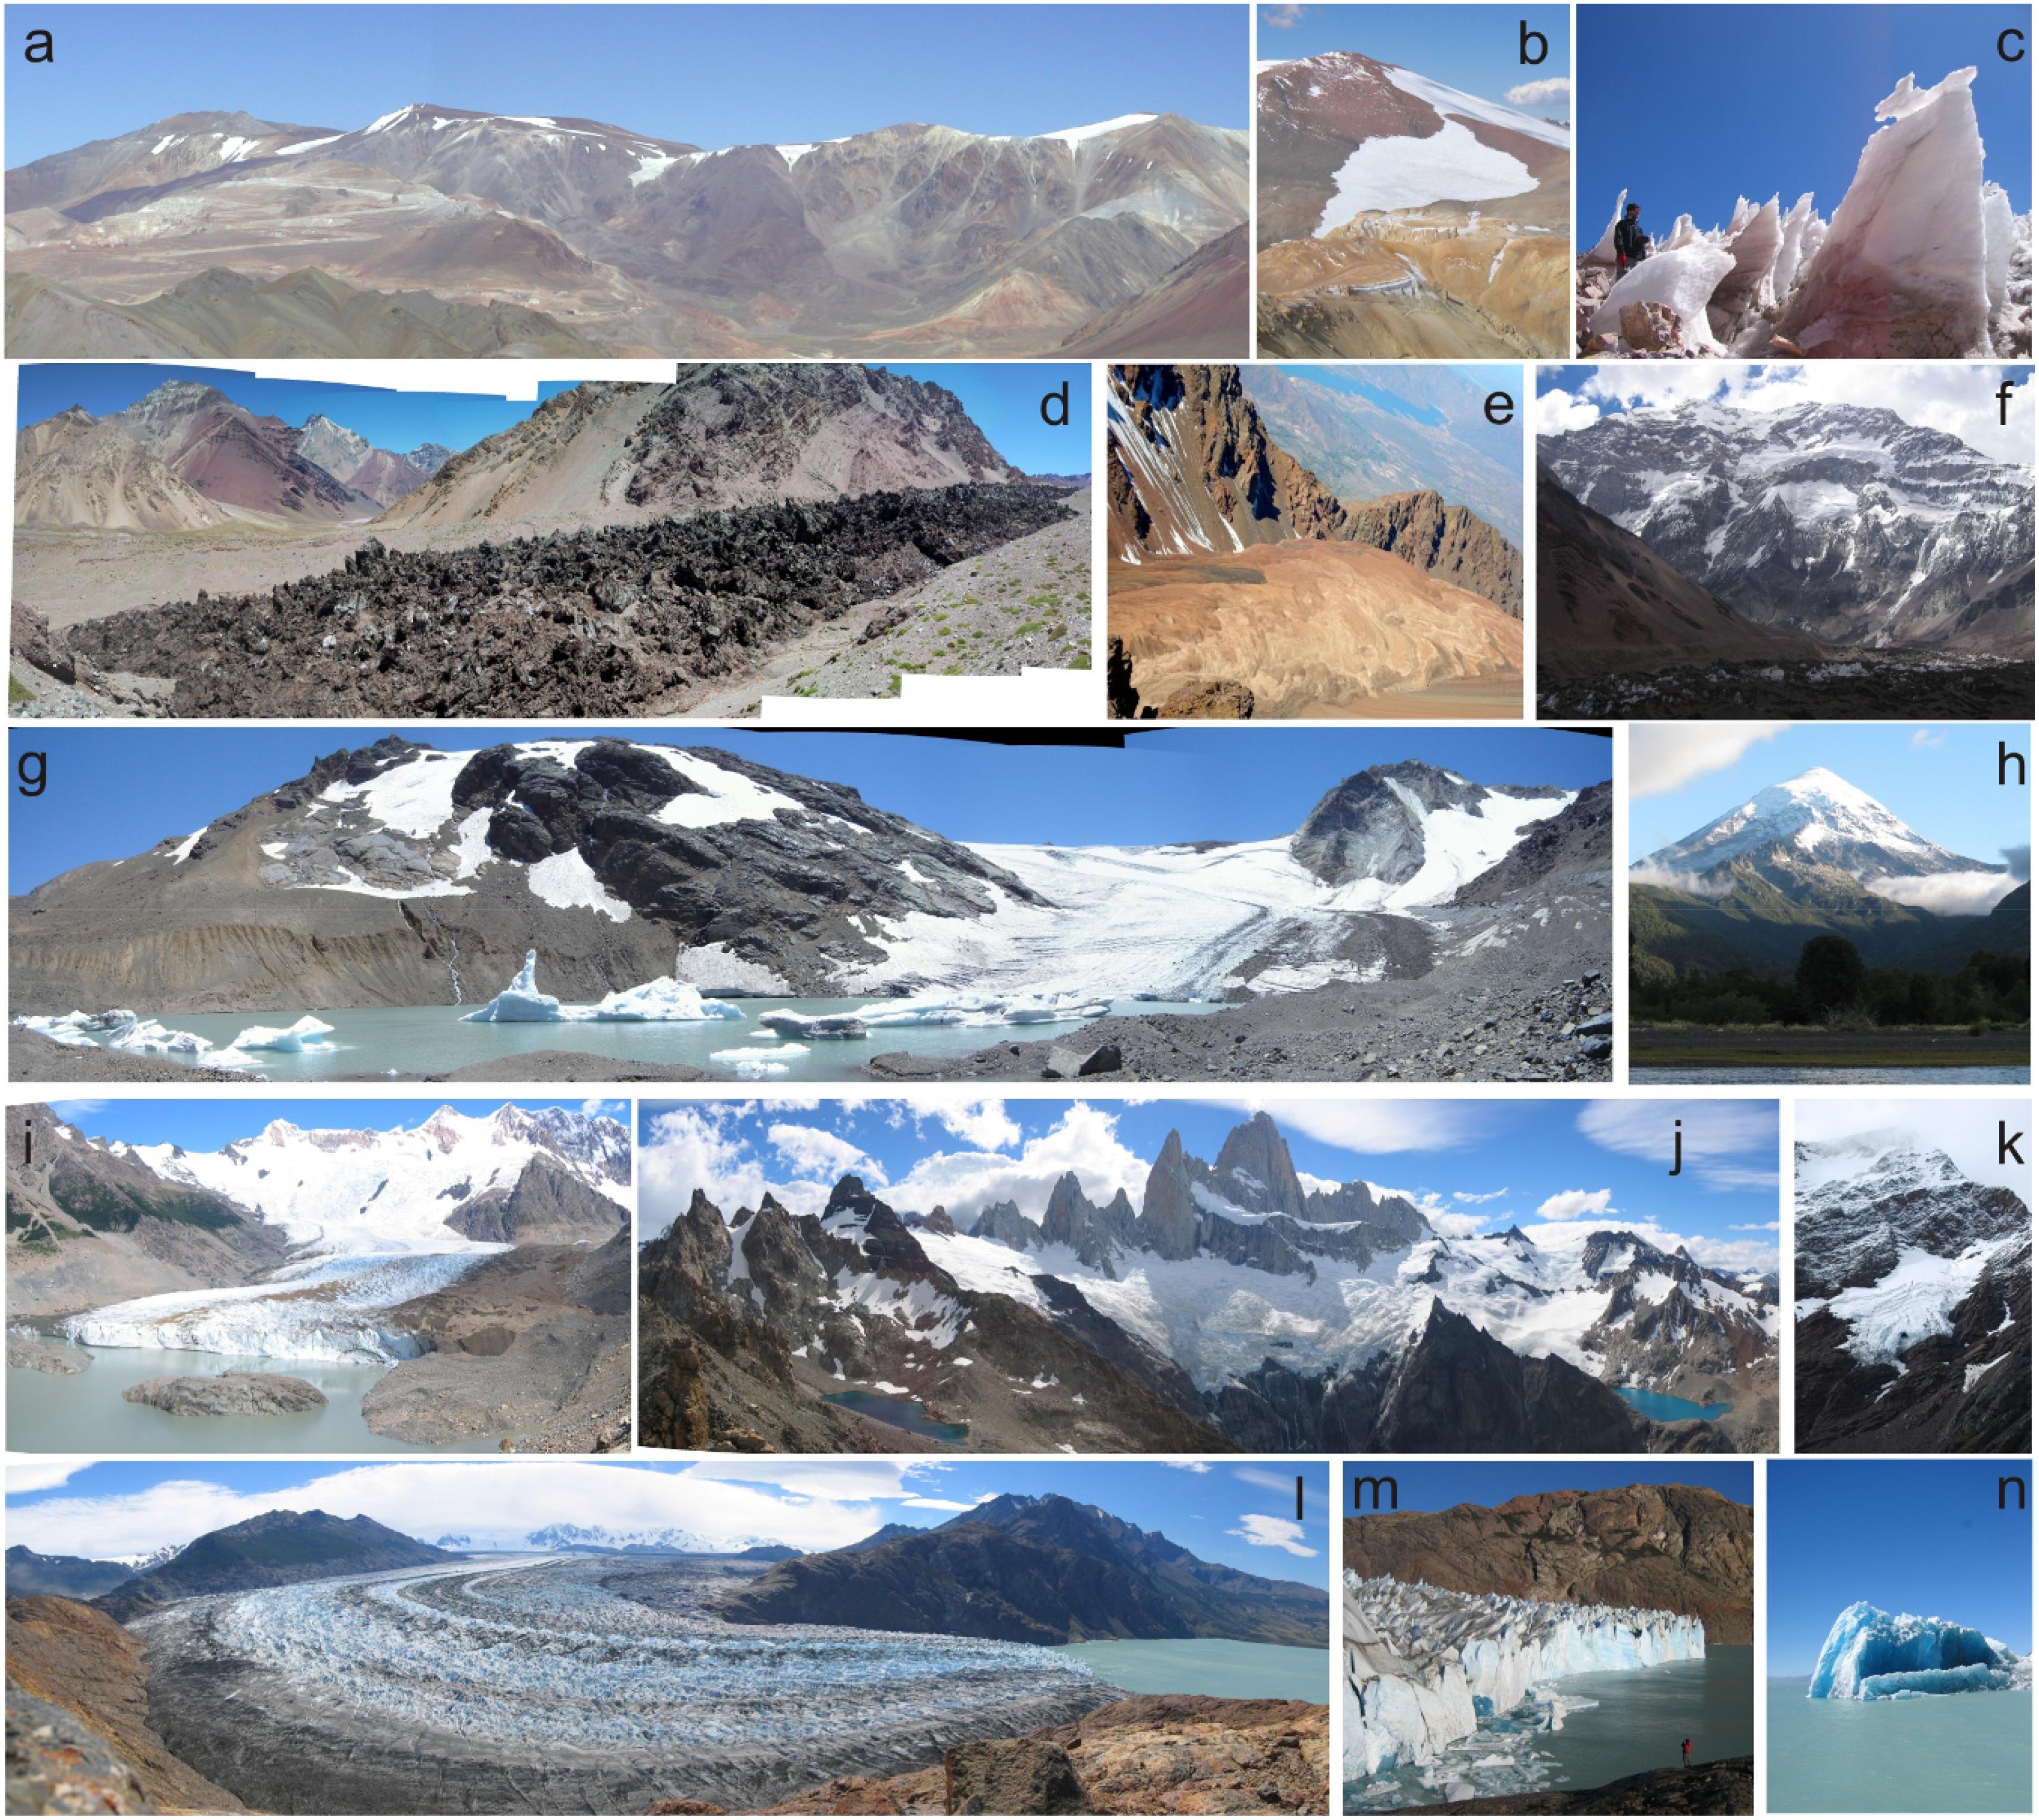
Figure 3. Different types of ice masses that can be found in the Southern Andes. (a,b) snowfields/glacierets and mountain glaciers, Desert Andes, (c) ice penitent on mountain glacier, Desert Andes, (d) debris-covered, surging glacier, Central Andes, (e) rock glacier, Central Andes, (f) hanging and debris-covered glaciers, Central Andes, (g) calving valley glacier, Central Andes, (h) dome-shaped glacier, North Patagonian Andes, (i,j) valley and mountain glaciers, South Patagonian Andes, (k) hanging glacier, South Patagonian Andes, (l,m) outlet glacier and calving front, South Patagonian Andes, (n) iceberg from calving glacier front, South Patagonian Andes. Photos provided by IANIGLA-CONICET.
Dry Andes (17.5° – 35°S)
The Dry Andes constitute a high elevation semi-arid region where the high inter-annual variability in seasonal snow accumulation (e.g., Masiokas et al., 2006; Garreaud, 2009) is likely the main driver of the inter-annual variability in glacier mass balance (Masiokas et al., 2016; Farías-Barahona et al., 2019). Indeed, in dry years, the regional snowline is usually above the upper limits of many glaciers, exposing their entire surface to ablation and ice mass loss. In contrast, during snowier years, the regional snowline descends below the glacier fronts and thus many of these glaciers accumulate mass over their entire surface. This particular phenomenon lead Lliboutry (1965) to term these ice masses as “reservoir glaciers” and complicates their study using classical techniques as it is usually difficult to define the ablation and accumulation areas and the equilibrium-line altitude (ELA) of these glaciers. The large year-to-year variability of precipitation and the wind drifting of snow (Gascoin et al., 2013) also result in weak altitudinal gradients of snow accumulation and glacier mass balance in this region (Rabatel et al., 2011; Pitte, 2014).
Other characteristic features of this region are the so-called “penitentes” (Lliboutry, 1954; Corripio and Purves, 2005; Cathles et al., 2014; Figure 3c). Penitentes are irregular blades of snow and/or glacier ice, oriented east-west and leaning toward the sun (north in the Southern Hemisphere). They are created as the result of long periods of high shortwave radiation acting on a snow or ice surface exposed to a cold and dry atmosphere (Lhermitte et al., 2014). Differential sublimation and melting rates gradually increase the size of the penitentes, which can reach up to a few meters in height (Figure 3c) and be observed throughout the austral summer across the Dry Andes (Nicholson et al., 2016; Sinclair and MacDonell, 2016). In fact, the lower latitudinal limit of generalized distribution of penitentes (ca. 35°S) marks the southern limit of the Dry Andes. These features also show that in this region, sublimation is often a non-negligible factor: ice mass loss by sublimation has been estimated to represent more than 50% of the total ablation at some sites (Ginot et al., 2006; MacDonell et al., 2013; Ayala et al., 2017; Réveillet et al., 2020).
The glaciers in the Dry Andes constitute a crucial water reserve and can play a significant hydrological role during extended dry periods or at the end of the warm season when most of the seasonal snow has disappeared from the mountains (Gascoin et al., 2011; Radić and Hock, 2014; Huss and Hock, 2018). Although it is well known that in normal or snowy years the seasonal snow provides the largest proportion of surface runoff in this region (e.g., Masiokas et al., 2006, 2013; Favier et al., 2009), the current lack of snow due to the “megadrought” that started in 2010 has put additional pressure on the limited water resources and on the permanent ice masses of this region. A recent study by Dussaillant et al. (2019) reported that, after 2009, surface runoff in four of the main river basins of the Dry Andes decreased between 28 and 46%, and was accompanied by a substantial increase in glacier mass loss. Their calculations also showed that the ice mass loss partly helped to mitigate the impacts of the widespread drought by contributing with 3 to 8% of the total discharge in these four rivers (Dussaillant et al., 2019). These glacial contribution values, which represent quasi-decadal estimates, would very likely be larger if considered seasonally at the end of the summer (Gascoin et al., 2011; Radić and Hock, 2014; Ayala et al., 2016, 2017).
Debris covered glaciers are prevalent throughout the central parts of the Dry Andes (Janke et al., 2015), but are largely underrepresented in glaciological studies. Ayala et al. (2016) presented the first modeling comparison of debris-covered and debris-free glaciers for the Dry Andes, and found that the spatial mass balance patterns were vastly different. In their study debris-free glaciers followed a classical positive altitudinal mass balance gradient, whilst the debris-covered glacier displayed no obvious gradient. However, the two glacier types showed similar contributions to streamflow in the studied catchment, although discharge from the debris-covered glacier began earlier in the season, possibly due to the fact that debris-covered surfaces are located at lower elevations.
In the Desert Andes, the predominantly cold and dry conditions produce an ELA that is usually several hundred meters above the 0°C isotherm (ca. 4500 m a.s.l. in the northern sectors of the Desert Andes; Figure 4). This determines that ice and snow only persists on the highest peaks or in protected high elevation sites, ultimately resulting in a low glacier coverage and an extended distribution of mountain permafrost with numerous rock glaciers and other periglacial features (Nicholson et al., 2009). The climatic contrasts that exist between both sides of the Andes at these latitudes are also reflected in glacier distribution: on the western drier flanks, mountain glaciers, glacierets and permanent snowfield were mapped with a total area of 71 km2 (Barcaza et al., 2017). In contrast, on the eastern more humid slopes, the analyses identified three times the total surface covered with ice (217 km2; Ianigla-Conicet and Mayds, 2018). In general, glaciers in this region (and throughout the Southern Andes) have a dominant southeastern orientation that reflects the differential insolation patterns of mountain regions in the Southern Hemisphere.
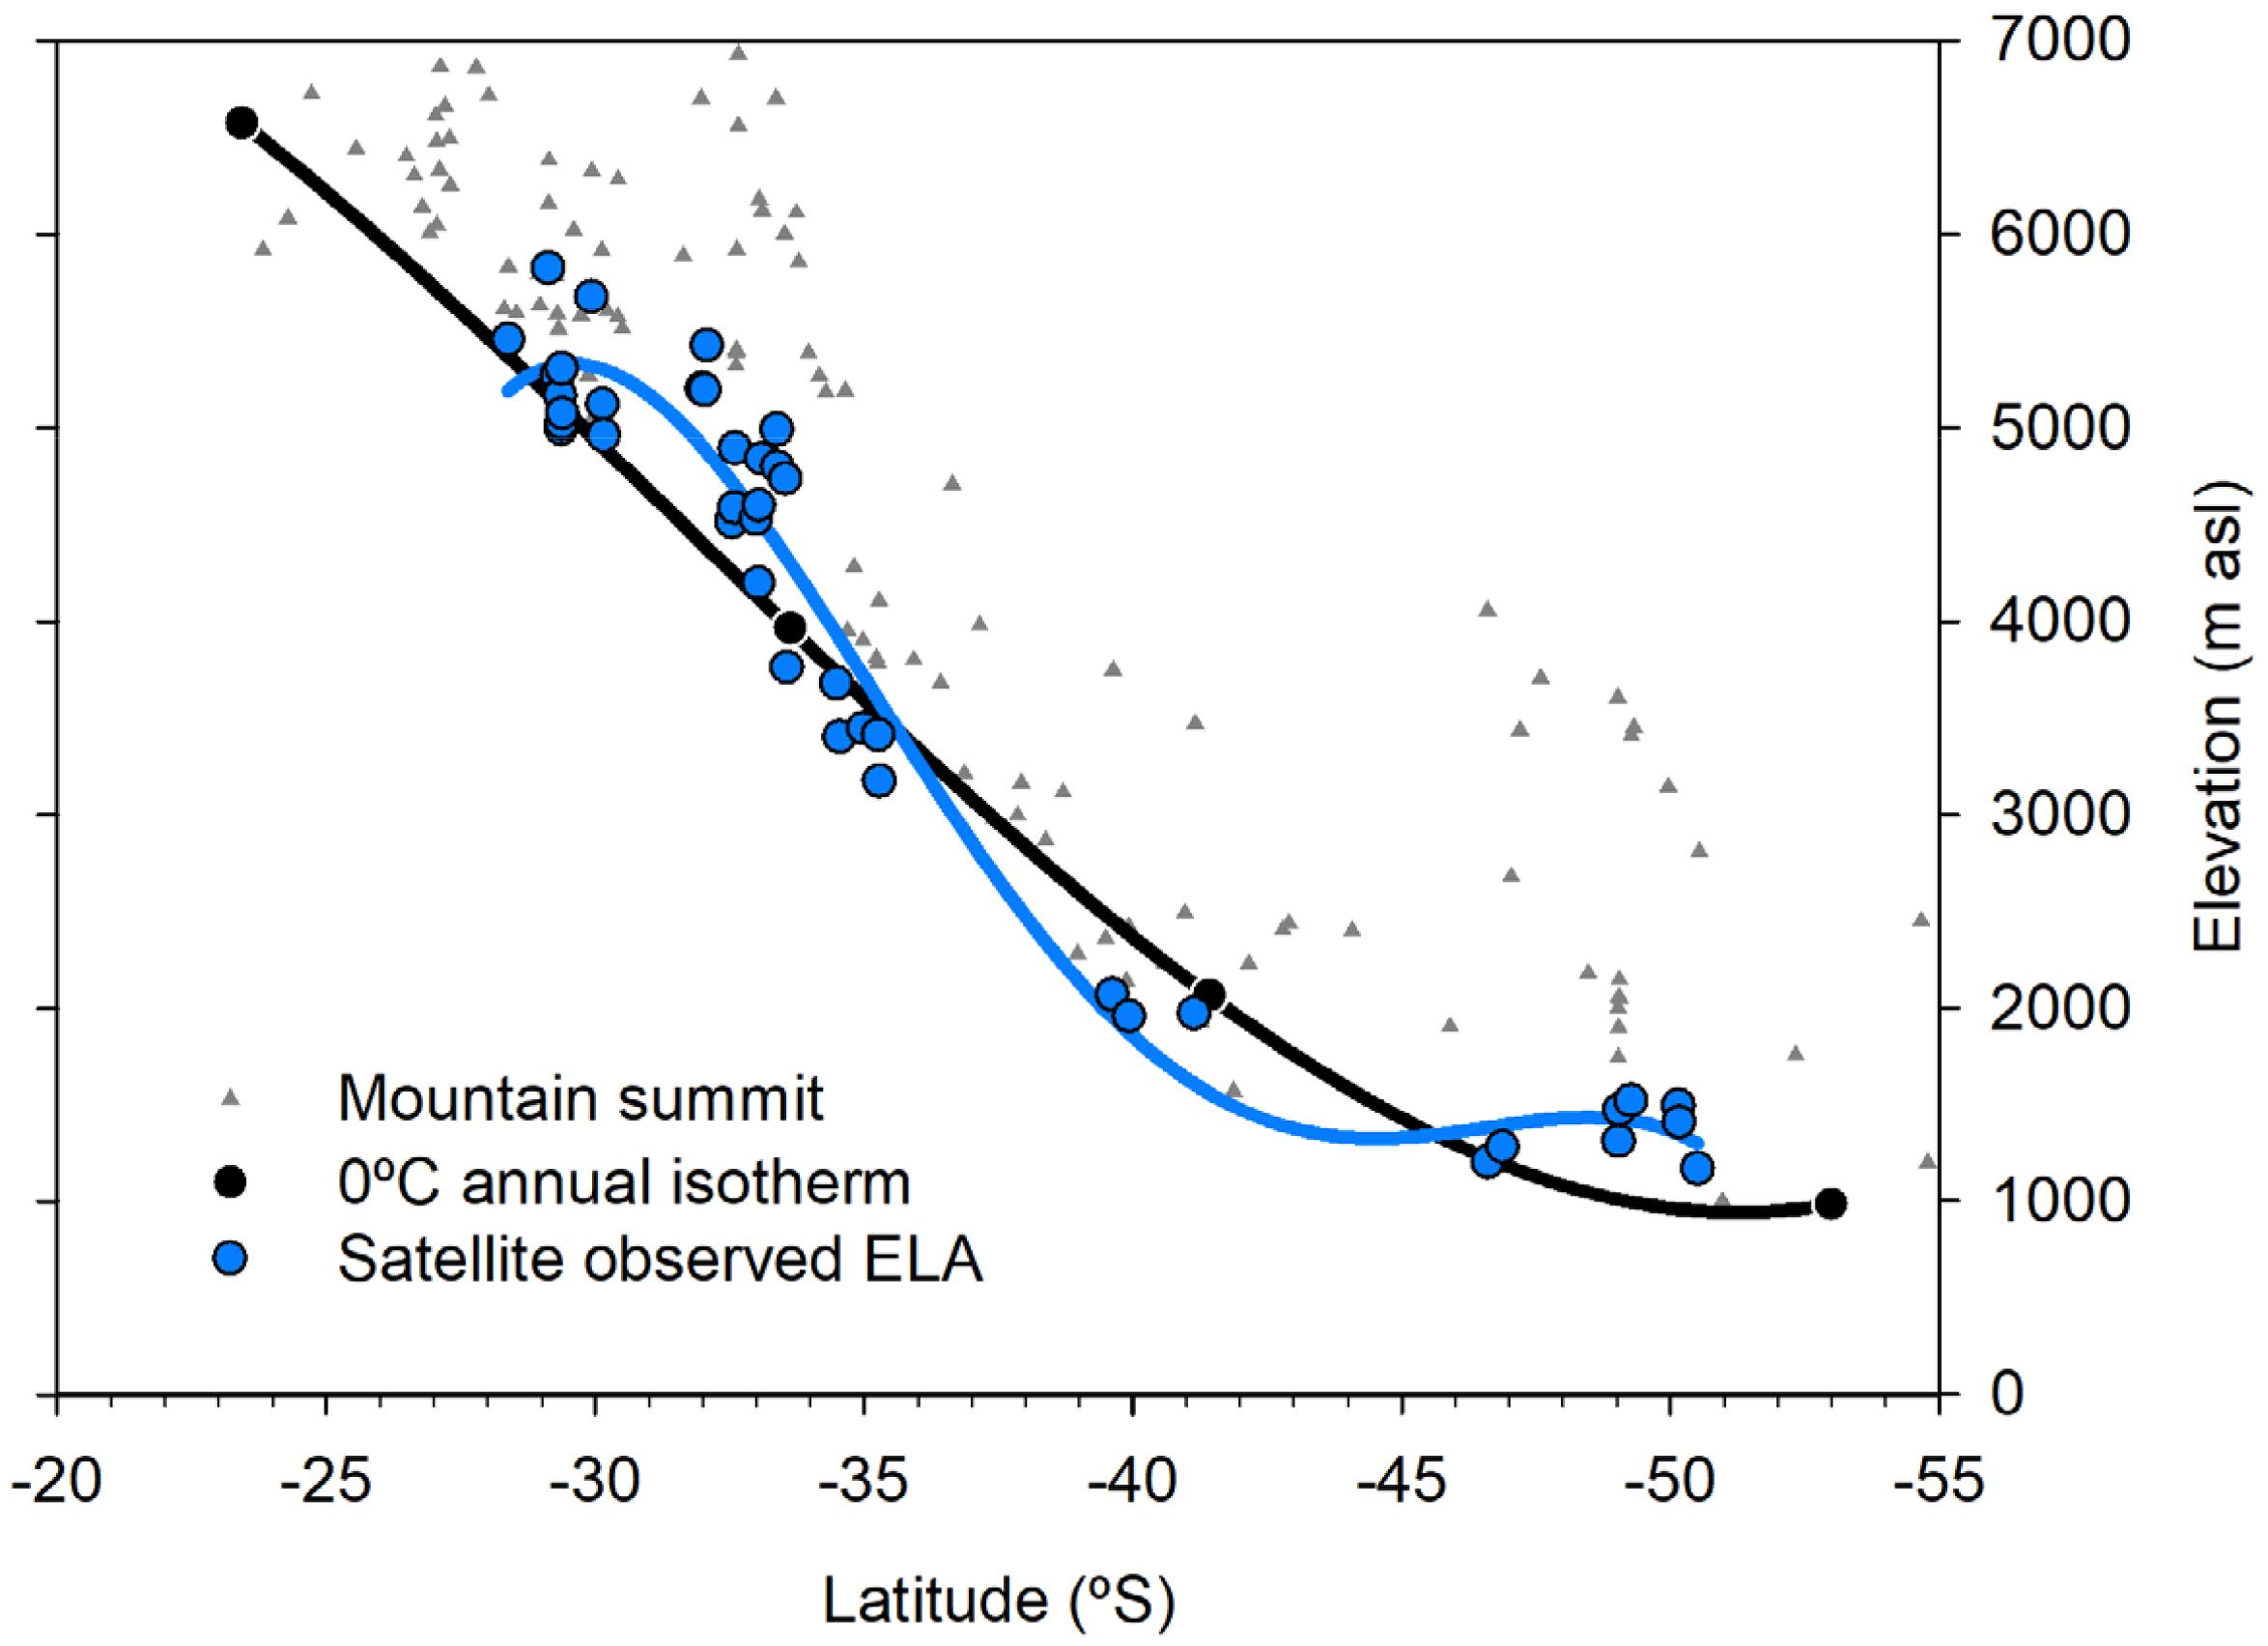
Figure 4. Gradient along the southern Andes of the 0°C isotherm and the equilibrium-line altitude (ELA) of glaciers estimated from climatic variables. Individual summits are shown in triangles. Adapted from Carrasco et al. (2008).
The high, semi-arid plateau known as “Altiplano” extends from southern Peru and southwestern Bolivia to Chile and Argentina until ca. 28°S. This plateau has a mean elevation of ca. 4,000 m a.s.l. and on the western margin it contains some very high (over 6,000 m a.s.l.) isolated volcanoes with permanent snow patches or glacierets on their summits. To the east, the Cordillera Oriental forms a more continuous mountain range where rock glaciers are relatively common and only few debris-free ice surfaces can be observed. Glaciers in this region are usually located above 5900 m a.s.l. in the northern sectors but descend to 4600–4800 m a.s.l. in the south, where the Andes become a set of parallel, generally north-south oriented ranges and small to mid-size (1–10 km2) glaciers start to become more common. Here most ice masses can be considered to be cold based, with ice temperatures several degrees below 0 °C and almost no liquid water at the base (Figure 5; Bolius et al., 2006; Ginot et al., 2006).
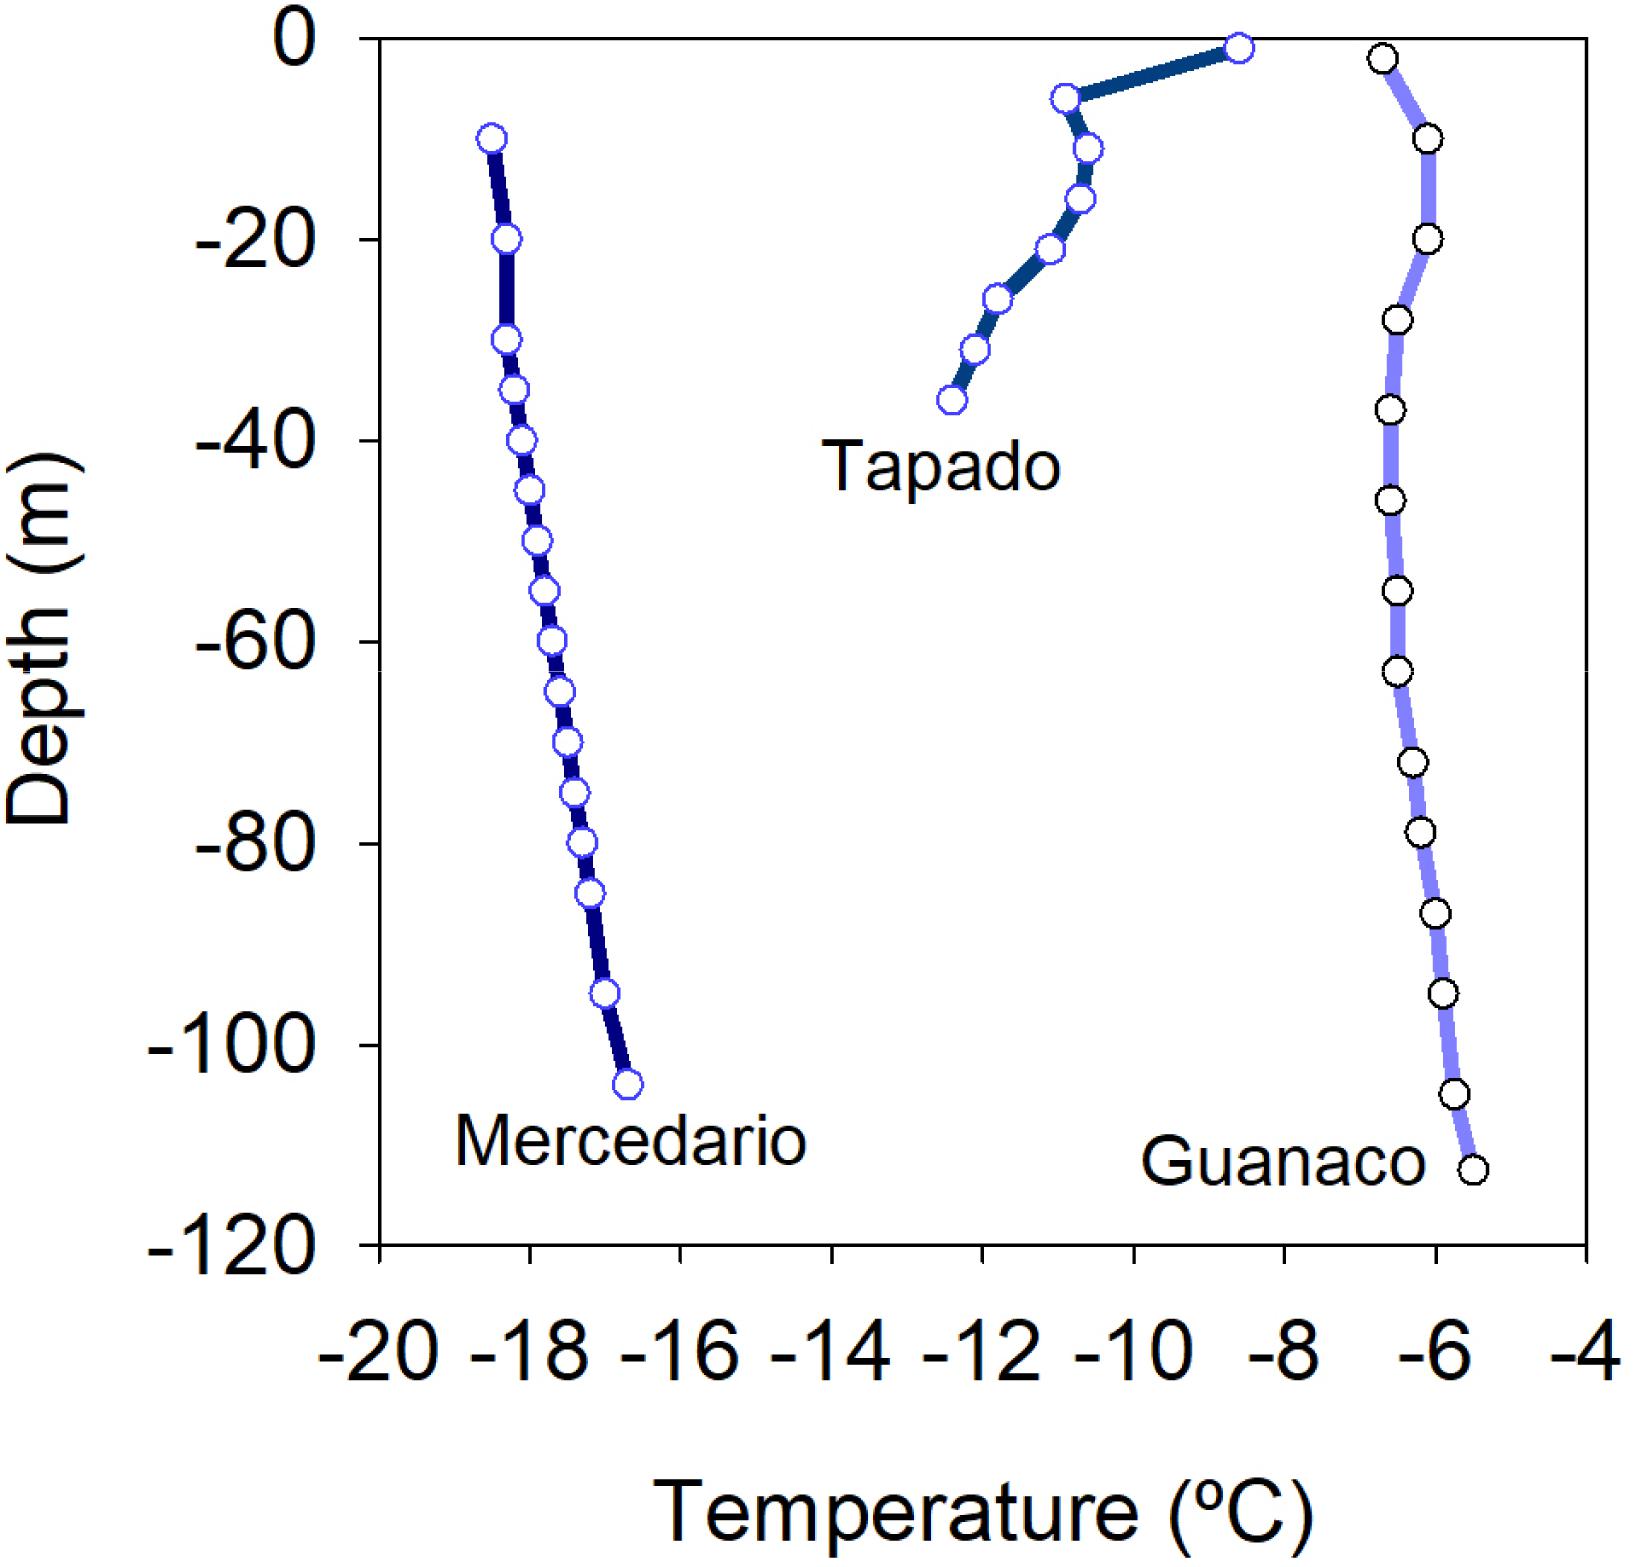
Figure 5. Temperatures measured in glacier boreholes in the Desert Andes. The Mercedario glacier is located at ca. 32°S, Tapado at ca. 30°S, and Guanaco at 29.3°S (adapted from Pitte, 2014).
In the Central Andes the combination of the overall high elevation of the mountains with increasing precipitation levels from the Pacific produces one of the largest concentrations of glaciers in South America (Rivera et al., 2016; Barcaza et al., 2017; Zalazar et al., 2017). Many peaks in this region are above 6,000 m a.s.l., and together with other lower elevation massifs they host a large variety of glaciers that includes snowfields/glacierets, mountain glaciers, hanging glaciers, and large debris-covered and clean-ice glaciers. This region also contains the largest concentration of rock glaciers in the Andes (Barcaza et al., 2017), and includes many complex units that start as clean-ice glaciers at high elevations, gradually turn into debris-covered glaciers further down, and finally end as rock glaciers at the lowest sectors (Monnier and Kinnard, 2015, 2017; Zalazar et al., 2017). Recent inventories in this region (Barcaza et al., 2017; Ianigla-Conicet and Mayds, 2018) identified ca. 1700 km2 of glacier surface area, with large valley glaciers descending to ca. 3,000 m a.s.l. in the west but only reaching 3500 m a.s.l. on the eastern drier side of the Andes. These recent inventories also indicate that most of the glacier area in this region is concentrated between 3,600 and 4,000 m a.s.l. and with a predominant southeastern orientation.
Recent Glacier Variations in the Dry Andes
Glaciers in the Dry Andes have shown an overall thinning and areal reduction in the last century. The longest available series of glacier length fluctuations show retreating trends at both sides of the Andes with some minor advances (Masiokas et al., 2009; Rivera, 2019). The reconstruction of mean annual mass balance records from this region (Masiokas et al., 2016) also show some periods with positive mass balances and minor glacier advances around the 1920s–1930s, the 1980s, and in the first decade of the 21st century. Several mass balance monitoring sites are maintained in the north-central Andes of Chile and Argentina (Figure 2). The record from the Echaurren Norte glacier in Central Chile (33°S) is the longest series in the region and in the entire Andes, and constitutes the only Andean reference series in the World Glacier Monitoring Service (WGMS) dataset. Since 1975/76 this glacier has lost ca. 20 m w.e., a critical amount that puts this small glacier at the risk of disappearing in the next decades (Farías-Barahona et al., 2019). The overall glacier mass loss pattern described above appears to be related to the recent decreasing trend in precipitation observed in the subtropical region, which has clearly intensified since 2010 (e.g., Rabatel et al., 2011; Garreaud et al., 2017). Indeed, modeling exercises of mass balance observations at Glacier Echaurren Norte suggest that precipitation variability is the dominant forcing at this site, with temperature variations likely playing a secondary role (Masiokas et al., 2016). Interestingly, some of the glaciers in the Desert Andes have shown positive mass balances in recent years and a marked increase in their cumulative record (Figure 2). We hypothesize that this pattern is probably associated with slightly positive snow accumulation anomalies observed in this region in 2015 and 2016.
Dussaillant et al. (2019) showed that over the period 2000/2001–2017 the glaciers in the Desert and Central Andes have experienced moderate thinning rates of −0.12 ± 0.17 and −0.31 ± 0.19 m w.e. yr–1, respectively. When this interval is split and assessed for changes before and after 2009, the Desert Andes maintain these relatively stable annual rates during both periods (0.00 ± 0.22 m w.e. yr–1 for 2000–2008, and −0.11 ± 0.20 m w.e. yr–1 for 2009–2017). In contrast, the glaciers in the Central Andes show stable to positive ice mass change rates (0.17 ± 0.23 m w.e. yr–1) between 2001 and 2008, but much more negative values between 2009 and 2017 (−0.40 ± 0.21 m w.e. yr–1; Dussaillant et al., 2019). It is important to note, however, that these values represent regional estimates and that specific cases will likely differ from these estimates. This is clearly demonstrated in recent detailed studies (Pitte et al., 2016; Falaschi et al., 2018), which identified up to 21 cases of surge-type glaciers with well documented advancing fronts embedded within the recent regional pattern of glacier thinning in the Central Andes. Burger et al. (2019) also found that, in the Central Andes, debris-covered glaciers have been more heavily impacted by the recent drought than debris-free glaciers, noting that the differential response of these glacier types to climate forcings has a direct impact on the hydrological role these features play in their catchments.
Wet Andes
The Wet Andes are located south of 35°S, where the elevation of most peaks and massifs usually does not exceed 4,000 m a.s.l. This lower elevation of the mountain range, together with the more intense influence of the westerly circulation from the Pacific, result in markedly higher precipitation amounts. Some high peaks in the north Patagonian Andes can receive 3–5 m w.e. of precipitation per year (Schaeffer et al., 2017), and further south these values increase to 4–7 m w.e. yr–1 on the Patagonian icefields (Schaefer et al., 2015). Seasonality is gradually reduced southward, with higher amounts concentrated during the winter months in the north, but a more regular precipitation regime throughout the year in Tierra del Fuego (Sagredo and Lowell, 2012). The Wet Andes are also characterized by strong precipitation gradients, with clear contrasts between the wetter western slopes and the much drier conditions only a few tens of km to the east of the mountains in Argentina (Viale et al., 2018). The presence of numerous rivers, lakes, and an extensive forest cover is also characteristic of the Wet Andes, where some 4800 km2 of the former extent of large glaciers are now occupied by more than 4,000 lakes (Wilson et al., 2018). In this region the mean annual 0°C isotherm decreases in elevation from about 3,000 in the north to less than 1,000 m a.s.l. in Tierra del Fuego (Condom et al., 2007; Carrasco et al., 2008). The topographic and climatological conditions mentioned above allow the development of numerous and extensive glacierized areas, which are mostly concentrated in the South Patagonian Andes and constitute the largest glacierized surface in South America. Most glaciers in the Wet Andes have their ELA below the mean annual 0°C isotherm (Figure 4).
The hydrological significance of glaciers in the Wet Andes is comparatively lower than that in the Dry Andes. This is largely due to the much higher precipitation amounts in the Wet Andes, making most rivers dependent on rainfall and snowmelt patterns (Masiokas et al., 2019). However, the very large size of some of the glacierized areas in the South Patagonian Andes does have a noticeable hydrological signature on some of the most important rivers of the region. This is the case of the Baker and Santa Cruz rivers, which drain large portions of the NPI and SPI, respectively, and are sporadically affected by huge amounts of meltwater draining after the rapid collapse of ice-dammed lakes in the icefields (Pasquini and Depetris, 2011; Dussaillant et al., 2012).
In the North Patagonian Andes, glaciers are comparatively smaller than those located further south (i.e., from a few km2 to tens of km2, compared to glaciers that can cover tens to hundreds of km2 in the south). The north Patagonian glaciers are usually found on isolated volcanoes and high peaks (Reinthaler et al., 2019), forming small ice caps with a dominant radial flow (Figure 3h). The elevated precipitation levels of the region (up to a few meters per year), the relatively mild temperatures (annual means ranging between 0° and 10°C; Alvarez-Garreton et al., 2018), and the steep average slopes of most glaciers in the region result in high ice mass turnover rates and fast ice velocities, which can reach several hundred meters per year for some of these temperate glaciers (Ruiz et al., 2015). The total glacierized area in the North Patagonian Andes is ca. 1800 km2. At 35°S the glaciers do not descend below 3,000 m a.s.l., but their fronts can reach 700 m a.s.l. at 45°S (Barcaza et al., 2017; Zalazar et al., 2017).
The glaciers in the South Patagonian Andes have historically received a great deal of attention from scientists and explorers, and many reviews are already available in the literature (Warren and Sugden, 1993; Glasser et al., 2008, 2011; Aniya, 2013). This region contains a very large number of mountain glaciers, outlet glaciers, and icefields, including the NPI, the SPI, and the icefield of Cordillera Darwin (hereafter CDI) in the southwestern corner of Tierra del Fuego (Figure 3). The SPI alone is formed by 139 glaciers larger than 5 km2, and in total this ice mass currently covers an area of ca. 12200 km2 (De Angelis, 2014; Meier et al., 2018). The NPI is ca. 3700 km2 (Dussaillant et al., 2018), and the icefield at Cordillera Darwin is ca. 2300 km2 (Bown et al., 2014). Other minor ice caps can be found at Mount San Lorenzo (ca. 140 km2; Falaschi et al., 2013) and Gran Campo Nevado (ca. 200 km2; Schneider et al., 2007; Weidemann et al., 2013).
Recent Glacier Changes and Ice Dynamics in the Wet Andes
The assessment of areal glacier changes during the last decades in the Wet Andes has been discussed by many studies. These studies have focused on different study areas and periods of time, and have sometimes used different methodologies, but in most cases they have relied on early historical records, aerial photographs, and/or satellite imagery to assess recent glacier variations (see e.g., Masiokas et al., 2009; Lopez et al., 2010; Davies and Glasser, 2012; Paul and Moelg, 2014; Meier et al., 2018; and references therein). Despite their inherent differences, the results from these studies largely point to a widespread pattern of recent glacier recession that is consistent with what has been observed in the Andes further north (Figures 6, 7). This inequivocal recent trend toward increasingly smaller glaciers started sometime after the occurrence of the LIA, which was an extended period of generalized glacier growth and frontal advances that culminated between the 17th and 19th centuries (see e.g., Masiokas et al., 2009; Davies and Glasser, 2012; and references therein). Most LIA glacier advances in the Wet Andes can be associated with vegetation trimlines and/or lateral and frontal moraines with varying degrees of forest recolonization that provide valuable evidence for assessing glacier recession patterns over the past centuries (e.g., Villalba et al., 1990; Masiokas et al., 2009; Ruiz et al., 2012). Davies and Glasser, 2012 used this geomorphological evidence and Landsat imagery to map the LIA glacier extent in the Andes south of 41°S, estimating that by the year 2011, the glaciated area had decreased by ca. 15%. Meier et al. (2018) used a similar approach to estimate glacier changes south of 45.5°S, and found that the overall area covered by glaciers during the LIA (ca. 28100 km2) had shrank almost 20% by the year 2016. According to their results, the SPI alone lost ca. 13% during the same period, reducing its area from ca. 14200 km2 during the LIA to ca. 12230 km2 in present times (Figure 8).
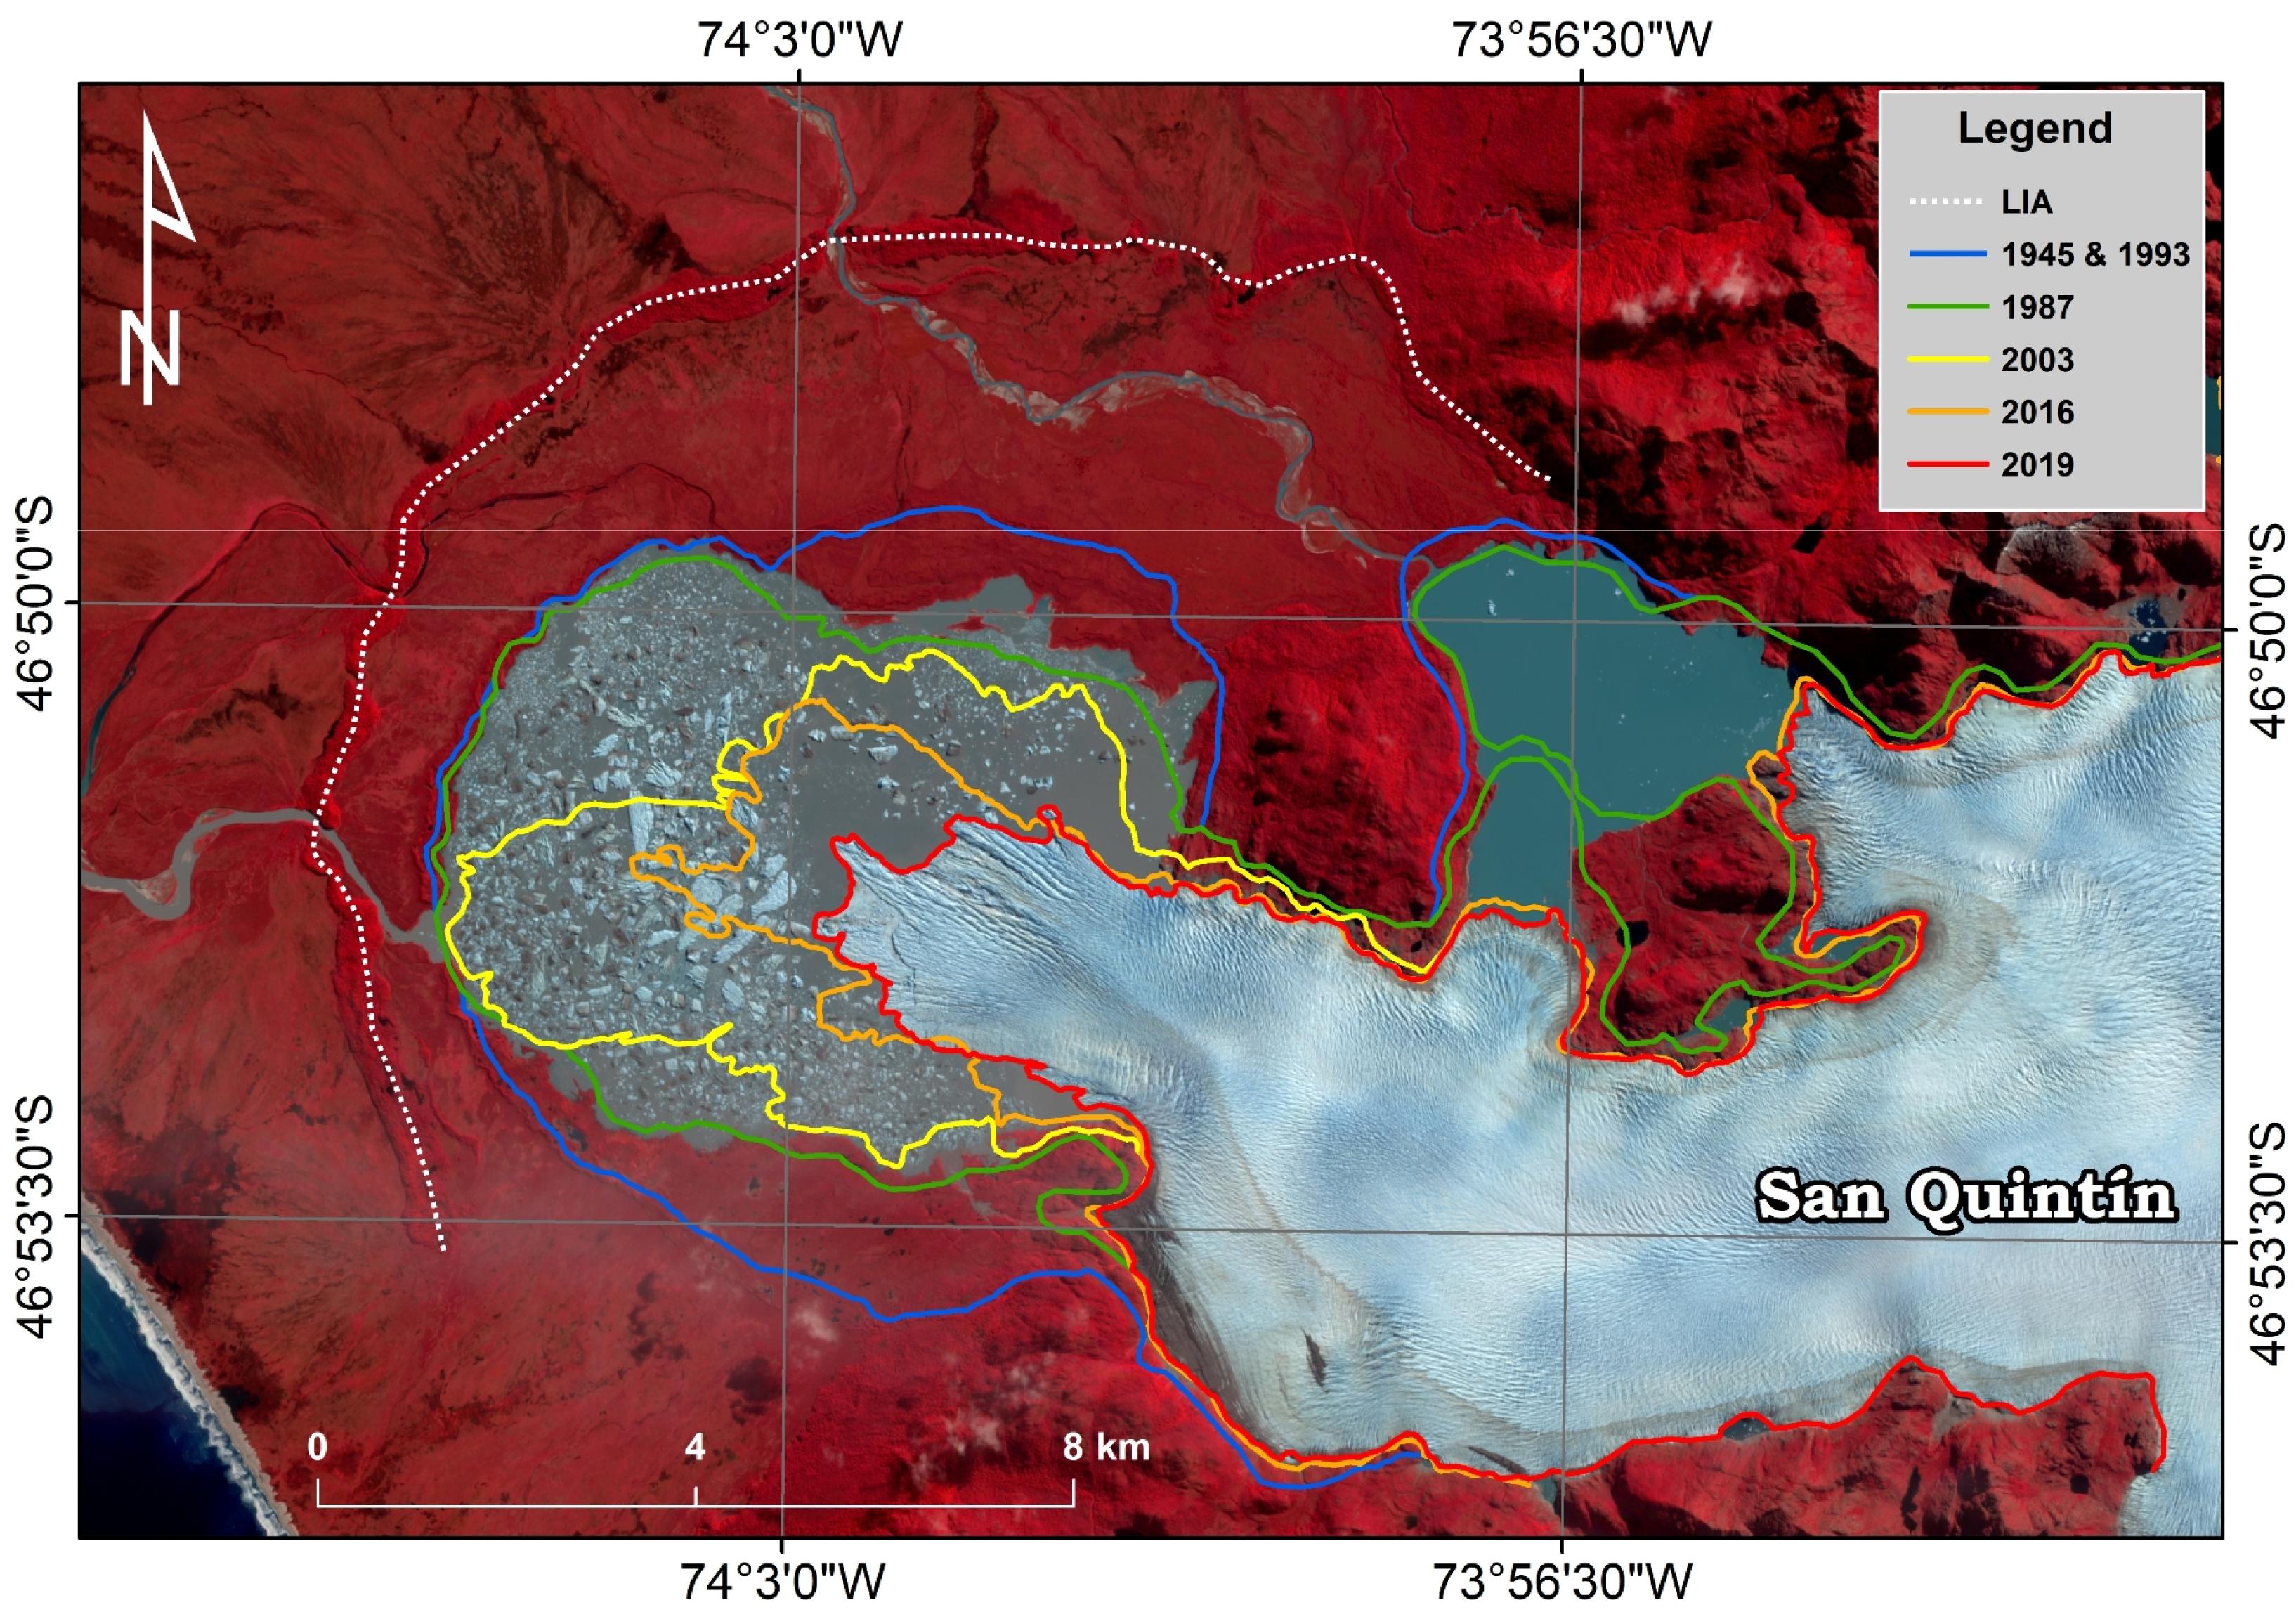
Figure 6. Areal changes of San Quintín glacier between the LIA and 2019. San Quintín is the largest outlet glacier of the North Patagonian Icefield. Sources of data: Geomorphological reconstructions and available aerial photographs and satellite imagery.
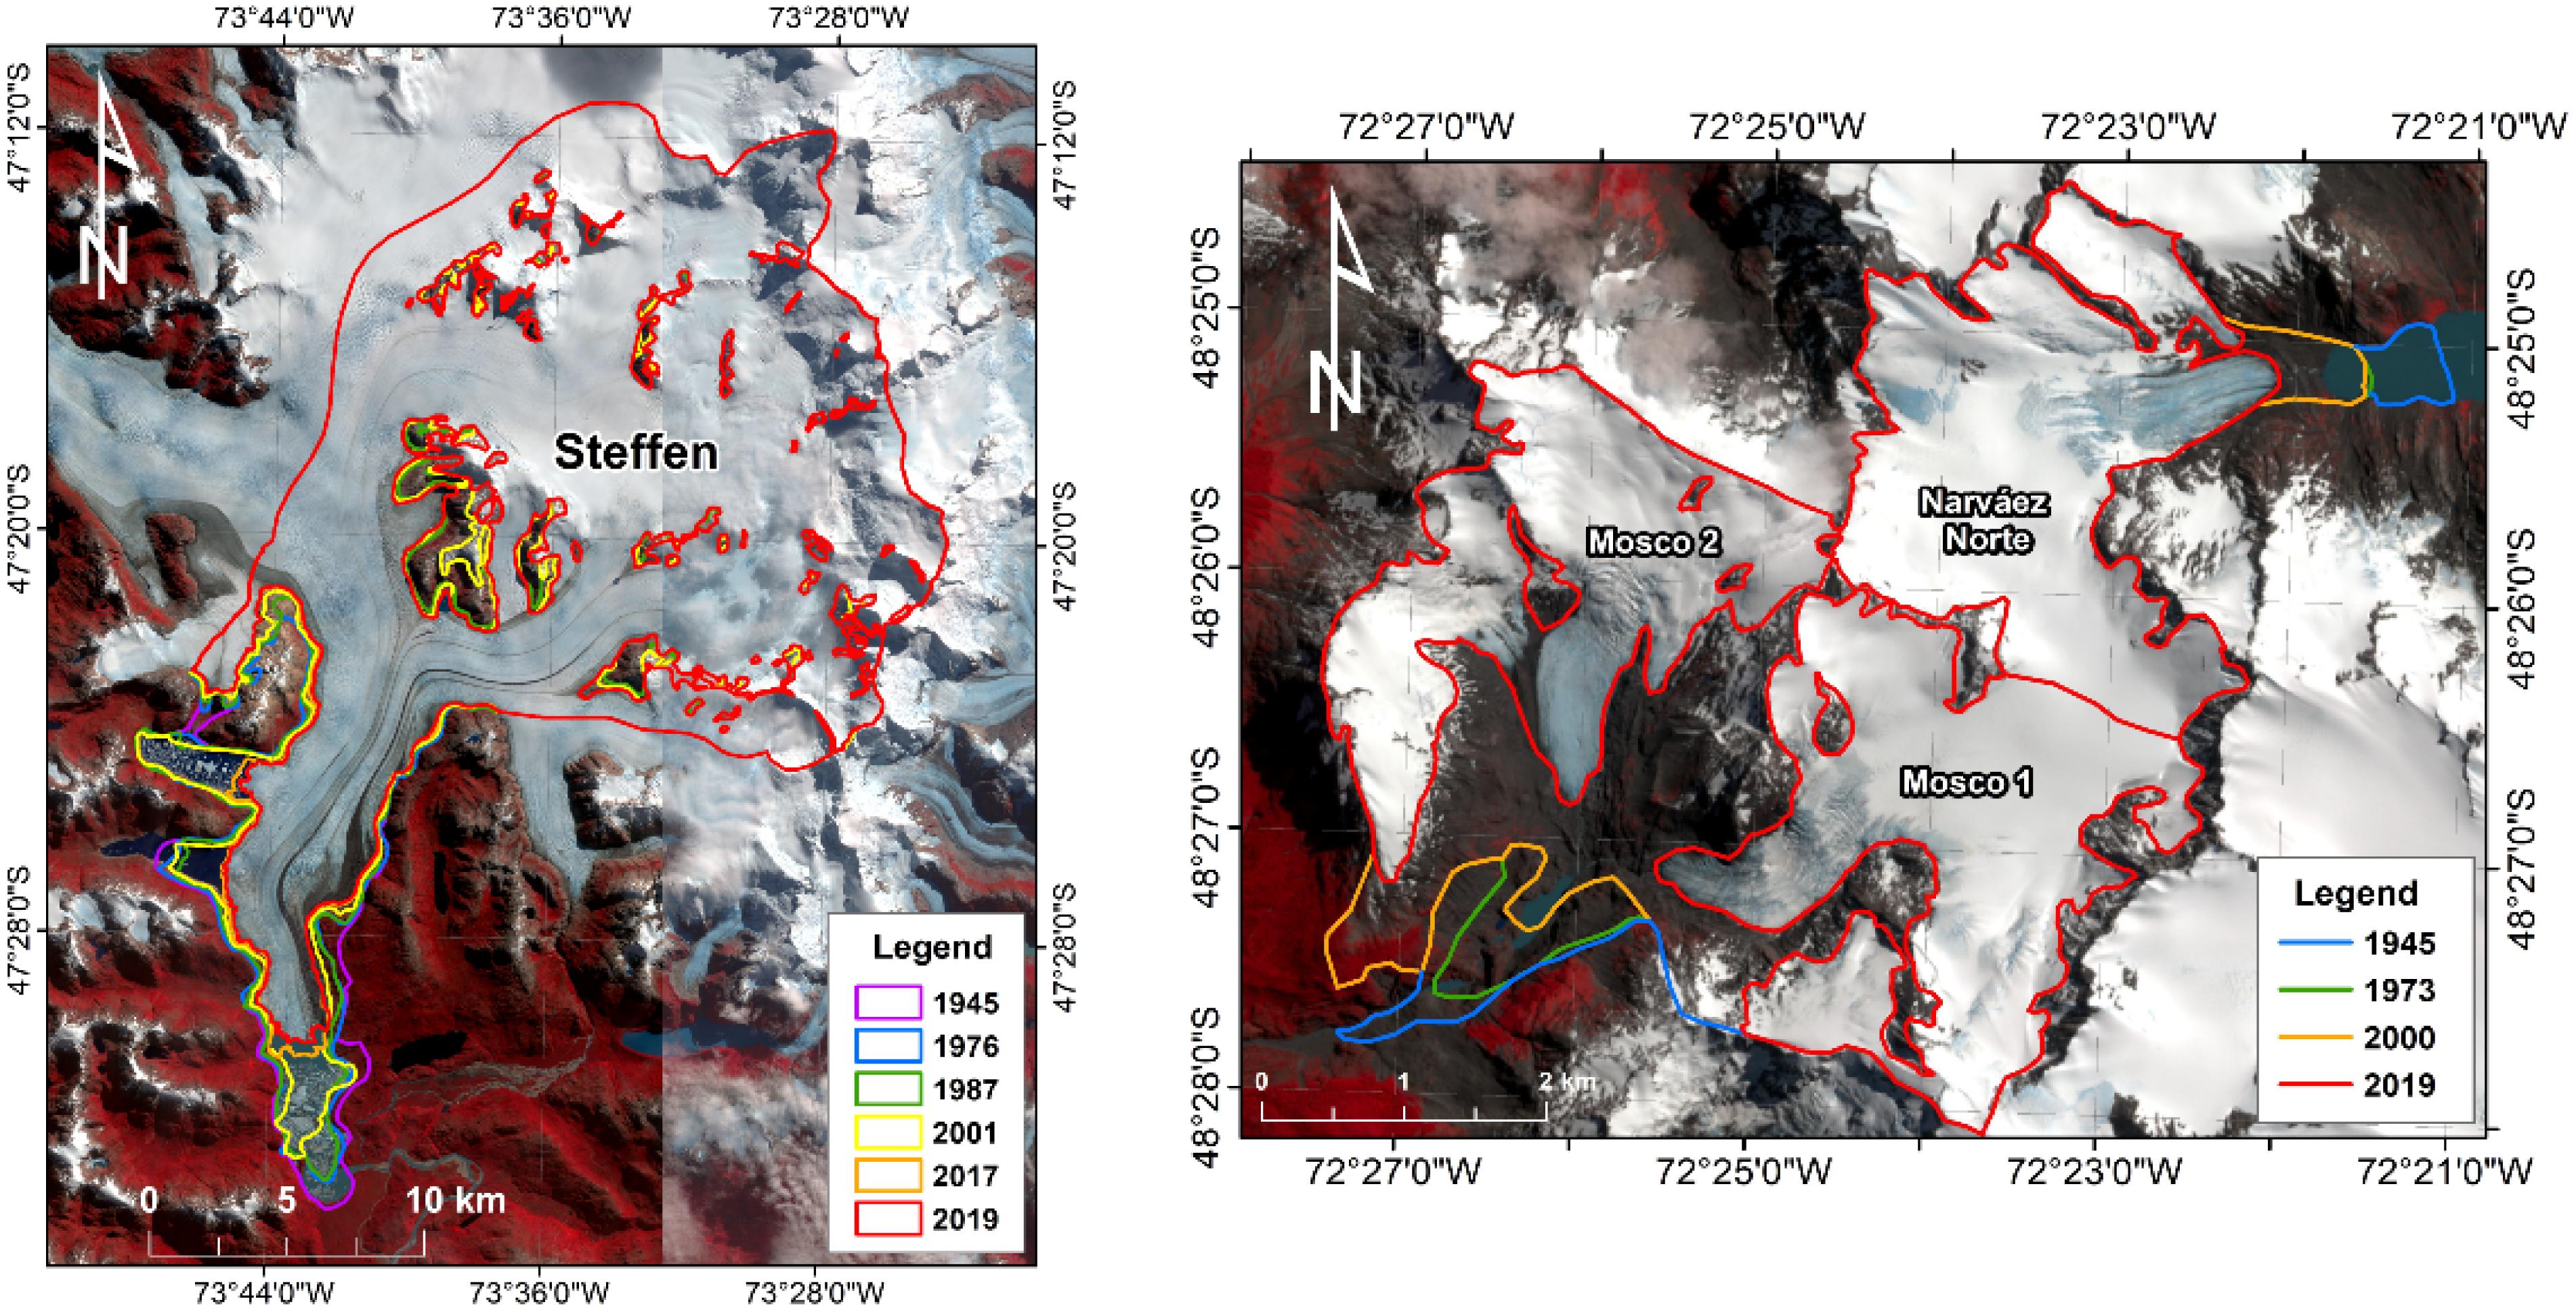
Figure 7. Areal recession of south Patagonian glaciers between 1945 and 2019. Sources: Available aerial photographs and satellite imagery.
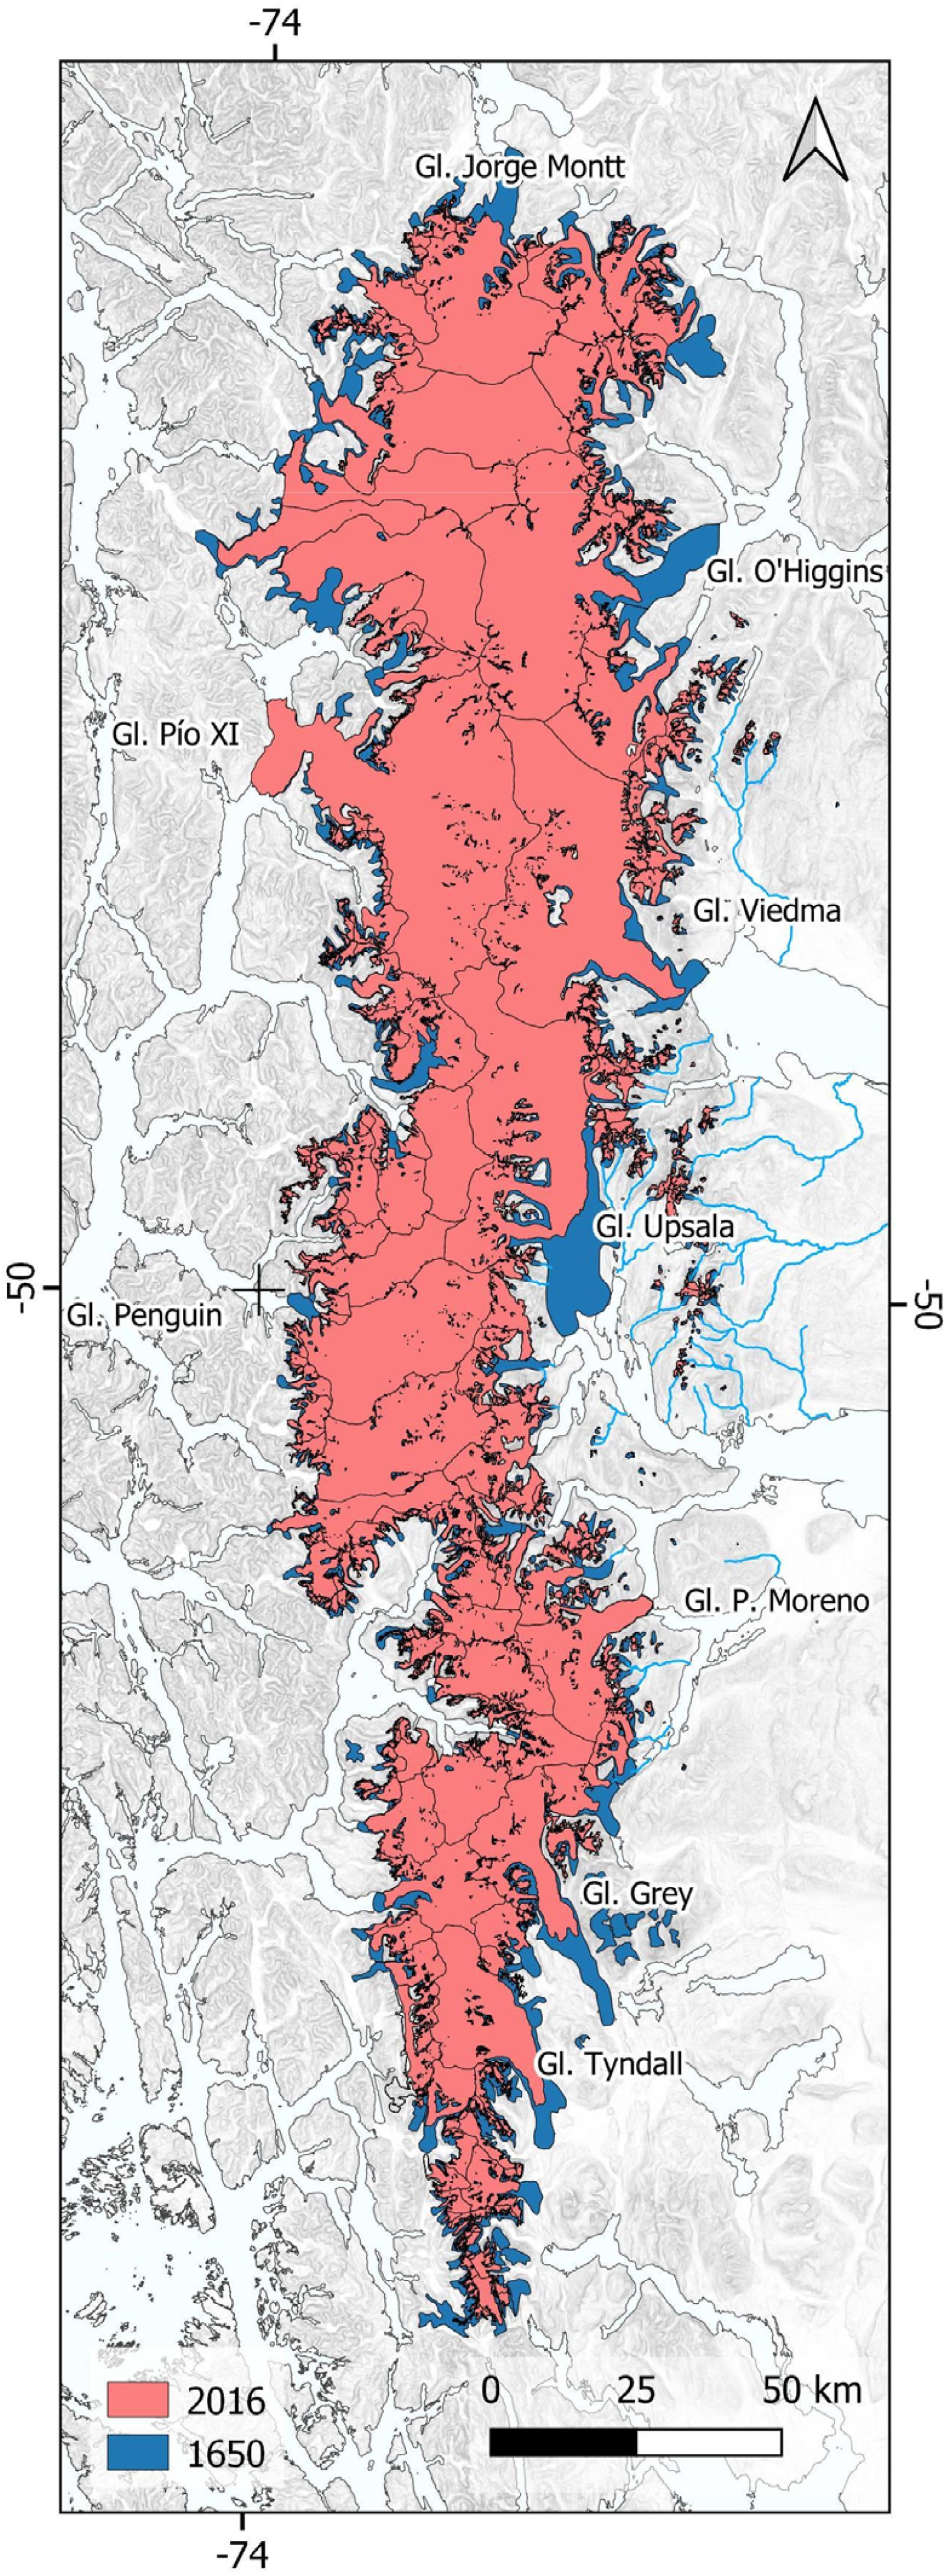
Figure 8. Areal fluctuations of the SPI between the LIA and 2016 derived from reconstructions based on geomorphology and recent optical remote sensing data (Davies and Glasser, 2012; Meier et al., 2018).
Ruiz et al. (2012) presented a detailed dendro-geomorphological record of LIA and post-LIA fluctuations for Esperanza Norte glacier in the North Patagonian Andes (ca. 42°S), and compared these fluctuations with those reported for Frías glacier (Villalba et al., 1990; Leclercq et al., 2012) ca. 110 km to the north. They conclude that both glaciers probably reached a peak LIA position during the early-mid 17th century and since then have had roughly similar patterns of recession, with changes during the 20th century occurring much more rapidly than in the previous interval. In a larger-scale study of 1985–2011 glacier changes in the North Patagonian Andes (40.5°–44.5°S), Paul and Moelg (2014) found a total glacier area reduction of ca. 25% and a concomitant marked increase in the number and surface area of proglacial lakes. Further south, Lopez et al. (2010) studied the length fluctuations of 72 glaciers of the NPI, SPI, and CDI between 1945 and 2005 using historical maps, aerial photographs and satellite images. They found a considerable frontal retreat for most glaciers during this 60-yr period, with the highest retractions for each icefield recorded at San Rafael Glacier in the NPI (5.7 km frontal retreat), O’Higgins glacier in the SPI (11.6 km retreat), and Marinelli glacier in the CDI (12.2 km retreat). White and Copland (2015) used ASTER and Landsat images from the mid-1970s to the early 2000s to compile glacier changes of 130 SPI glaciers concluding that nearly 4% (542 km2) of the original area was lost with some indications of acceleration in the ice mass loss rates in recent years. This acceleration was also reported recently by the large-scale study of Meier et al. (2018): since the LIA and until 1986, the annual glacier areal loss for the Andes south of 45.5°S was −0.10 ± 0.04% a–1, increasing to −0.33 ± 0.28% a–1 between 1986 and 2005, and to −0.25 ± 0.50% a–1 for the period 2005–2016.
It is interesting to note, however, that there are few exceptions to this century-long trend of ice mass loss in the Wet Andes. The most remarkable case is probably Pío XI glacier (the largest outlet of the SPI), which has shown a net advance of 11 km since 1945 (Wilson et al., 2016; Rivera, 2018; Figure 9). In this period this glacier formed a prominent moraine overridding 400 yr-old trees located in the glacier forefield. Another anomalous case is Perito Moreno glacier on the eastern side of the SPI, which has shown a relatively stable frontal position with several re-advances during the last century (Guerrido et al., 2014; Minowa et al., 2015). Contrasting glacier behavior has also been observed at Cordillera Darwin in Tierra del Fuego, where some glaciers like Marinelli have retreated markedly but others like Garibaldi have shown clear frontal advances in recent times (Melkonian et al., 2013).
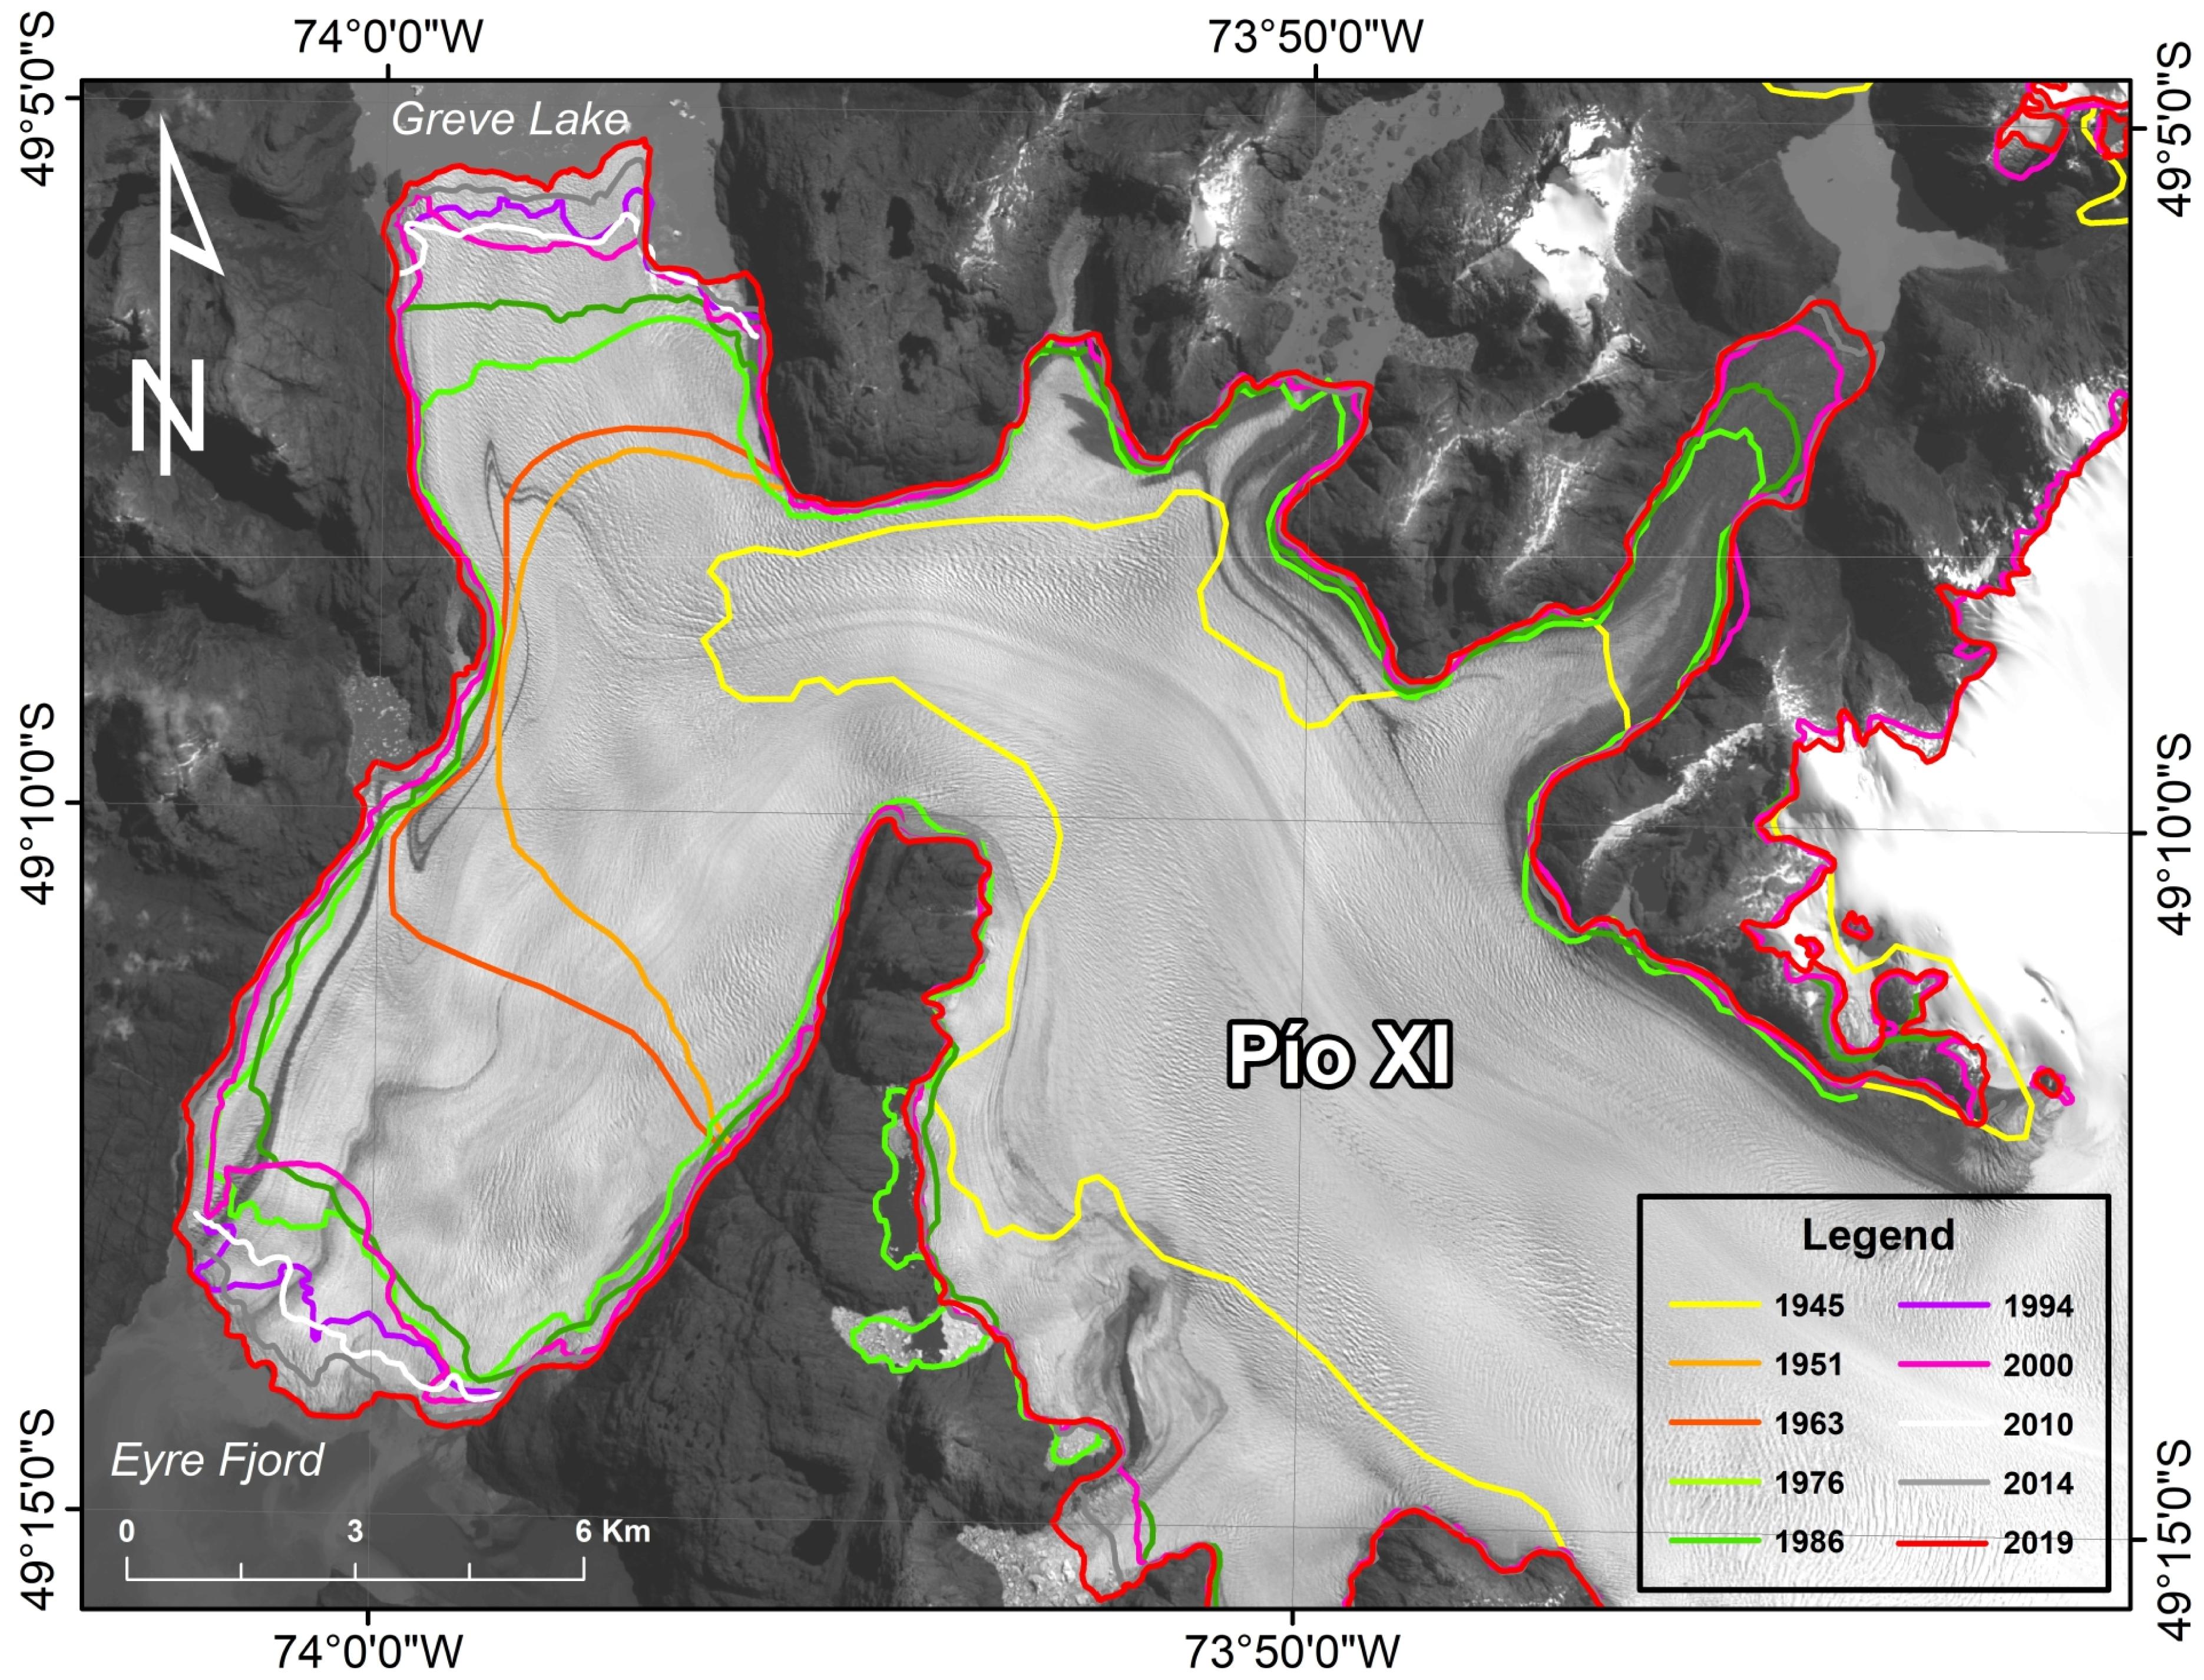
Figure 9. Changes in surface area of Pío XI glacier between 1945 and 2019. This glacier is the largest outlet glacier of the SPI and unlike most of the glaciers in the region, it has shown an anomalous behavior with an advancing front over most of the last century. Sources: Available aerial photographs and satellite imagery.
Due to logistic and meteorological constraints for conducting the direct surface mass balance measurements (Rivera et al., 2016), many studies have also applied the geodetic method to investigate recent ice mass changes in the Wet Andes. The existence of the freely available Shuttle Radar Topography Mission (SRTM; 90 m horizontal resolution) DEM for the year 2000 has provided a very valuable and reliable reference that has been compared to other DEMs, such as the ASTER-GDEM (30 m horizontal resolution). Melkonian et al. (2013) used this approach in Cordillera Darwin, southernmost Chile, and Willis et al. (2012a,b; Figure 10) in the SPI and the NPI, respectively. More recently, Dussaillant et al. (2019) applied this methodology for the whole Andes Cordillera including the large glaciated areas in Patagonia (Figure 10). The SRTM has also been compared to SPOT5 DEMs (40 m horizontal resolution; Korona et al., 2009), Dussaillant et al. (2018) in the NPI, and Falaschi et al. (2017) in Monte San Lorenzo glaciers to the east of the Patagonian icefields.
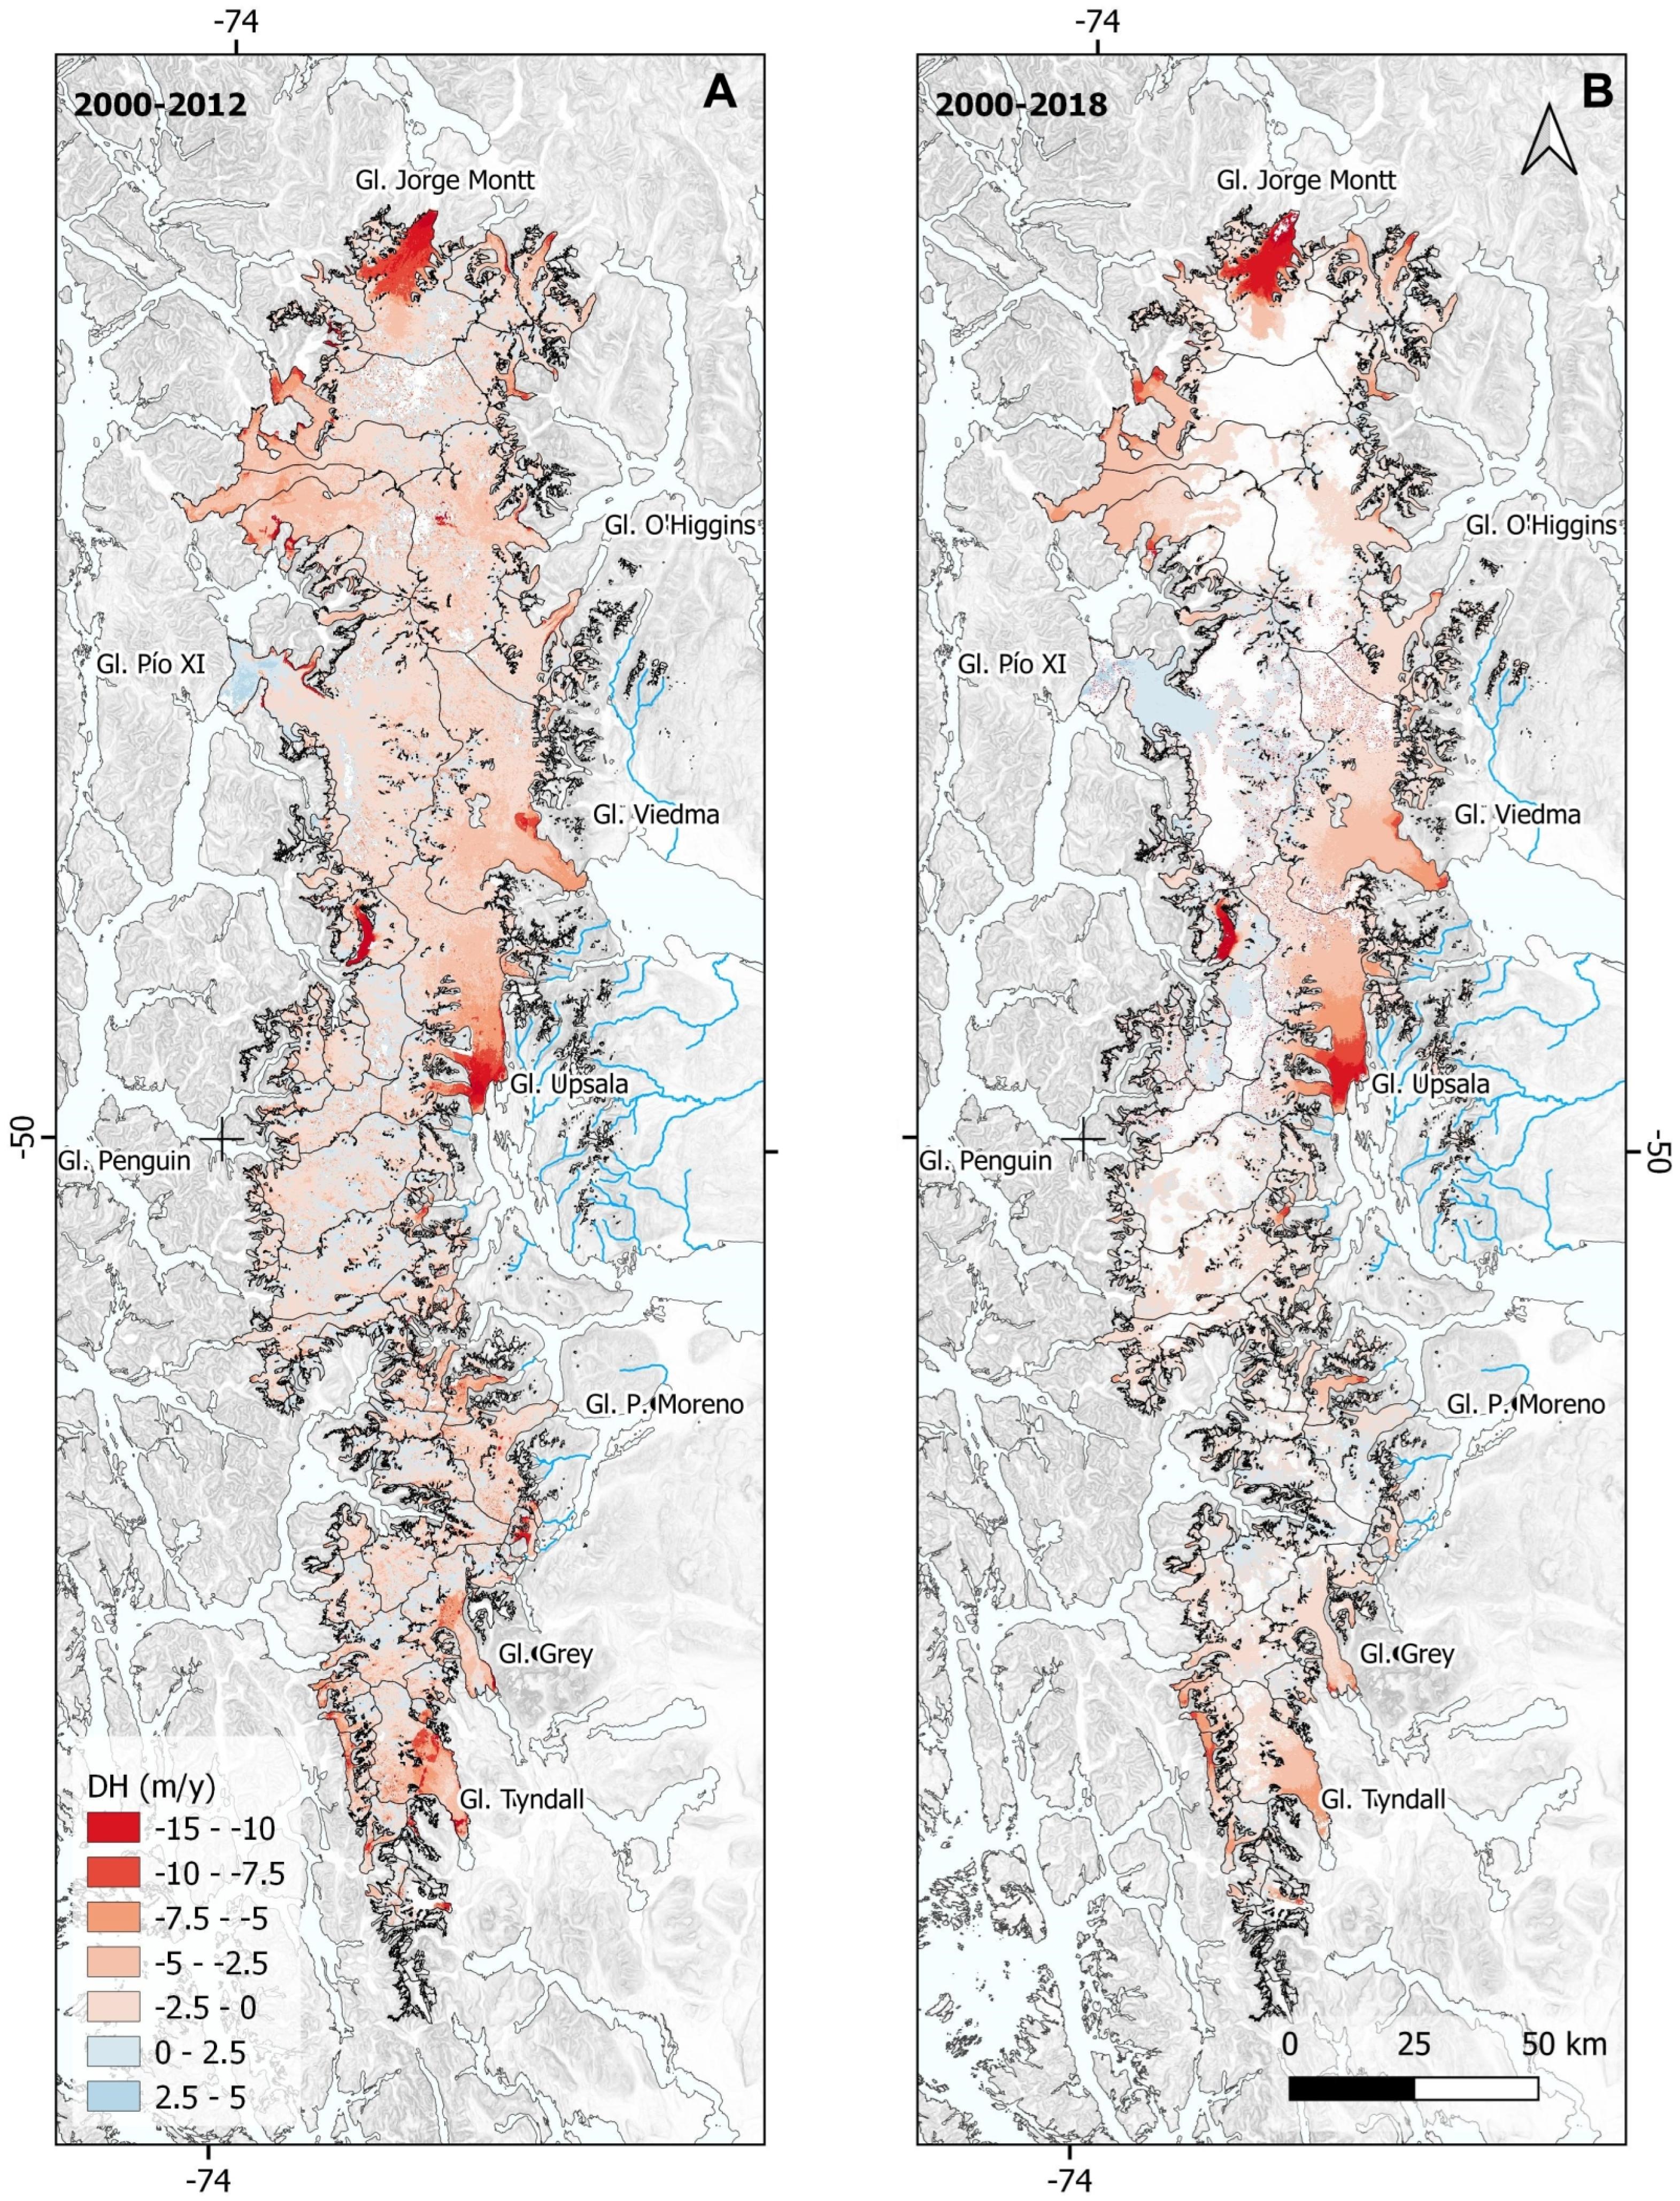
Figure 10. (A) Mean annual ice thickness changes for the SPI between 2000 and 2012, derived from the SRTM and ASTER DEMs (Willis et al., 2012a). Note that the ice loss is larger in the tongues of the large outlet glaciers and, in many cases it extends toward the higher sectors near the ice divides. (B) Same as A, but for the period 2000–2018 (Dussaillant et al., 2019). The anomalous behavior of Pío XI glacier is also evident in these maps.
In contrast, studies using topographic data prior to SRTM are very scarce in the southern Andes (e.g., Rignot et al., 2003, who used 1975 regular cartography in the SPI). Falaschi et al. (2019) used historical vertical and oblique aerial photographs to generate topographic information for Monte San Lorenzo glaciers for the years 1958 and 1981, and subsequently compared these early DEMs with those derived from the SRTM mission and recent Pléiades (Berthier et al., 2014) and Spot 5 (Korona et al., 2009) imagery. Their analyses show strong negative glacier mass balances (between −0.78 and −1.65 m w.e. a–1) in this region during the last six decades. The SRTM DEM was also compared to the TanDEM-X mission, for example by Malz et al. (2018) for the whole SPI, or by Abdel Jaber et al. (2019) for both the NPI and SPI. Foresta et al. (2018) used Cryosat-2 to study the 2011–2017 elevation changes of the Patagonian icefields. In this case the results have a coarse spatial definition but high temporal resolution, allowing the retrieval of elevation changes at seasonal scales.
The increasing availability of satellite images and the application of automatized methods has also resulted in marked improvements in our knowledge of the ice velocity and dynamics of many Patagonian glaciers (e.g., Rivera et al., 2012b; Muto and Furuya, 2013; Sakakibara and Sugiyama, 2014; Mouginot and Rignot, 2015; Ruiz et al., 2015; Euillades et al., 2016; Lenzano et al., 2018; Lo Vecchio et al., 2018; Moragues et al., 2018). Cross-correlation of radar remote sensing data (SAR) has revealed that surface velocities of some SPI glaciers can reach several hundred meters per year, placing these glaciers among the fastest on Earth (only exceeded by some glaciers in Greenland, Alaska and Antarctica; Howat et al., 2007; Moon et al., 2012; Gardner et al., 2018). Indeed, in some sectors of the Pío XI, Upsala and O’Higgins glaciers, ice can move a few km per year (Figure 11), suggesting a dominant role of basal sliding in the dynamics of these large SPI outlet glaciers (Sugiyama et al., 2011; Bown et al., 2019). These remote sensing data also show that the longitudinal velocity profiles of these outlet glaciers are typical of calving glaciers, with low speeds at the ice divides and increasing values toward their snout (e.g., Euillades et al., 2016). This pattern is very different from that of mountain glaciers, which show low velocities at the ice divides and the glacier front but maximum speeds at the ELA due to the maximum glacier thickness in this area. Other analyses (Sakakibara et al., 2013; Sakakibara and Sugiyama, 2014; Mouginot and Rignot, 2015) indicate a recent acceleration of some calving glaciers, which may suggest a possible destabilization of these ice masses. These glaciers show an acceleration and recession of the ice front, and accelerating patterns that extend to the upper central plateaus and along the ice divides of the SPI.
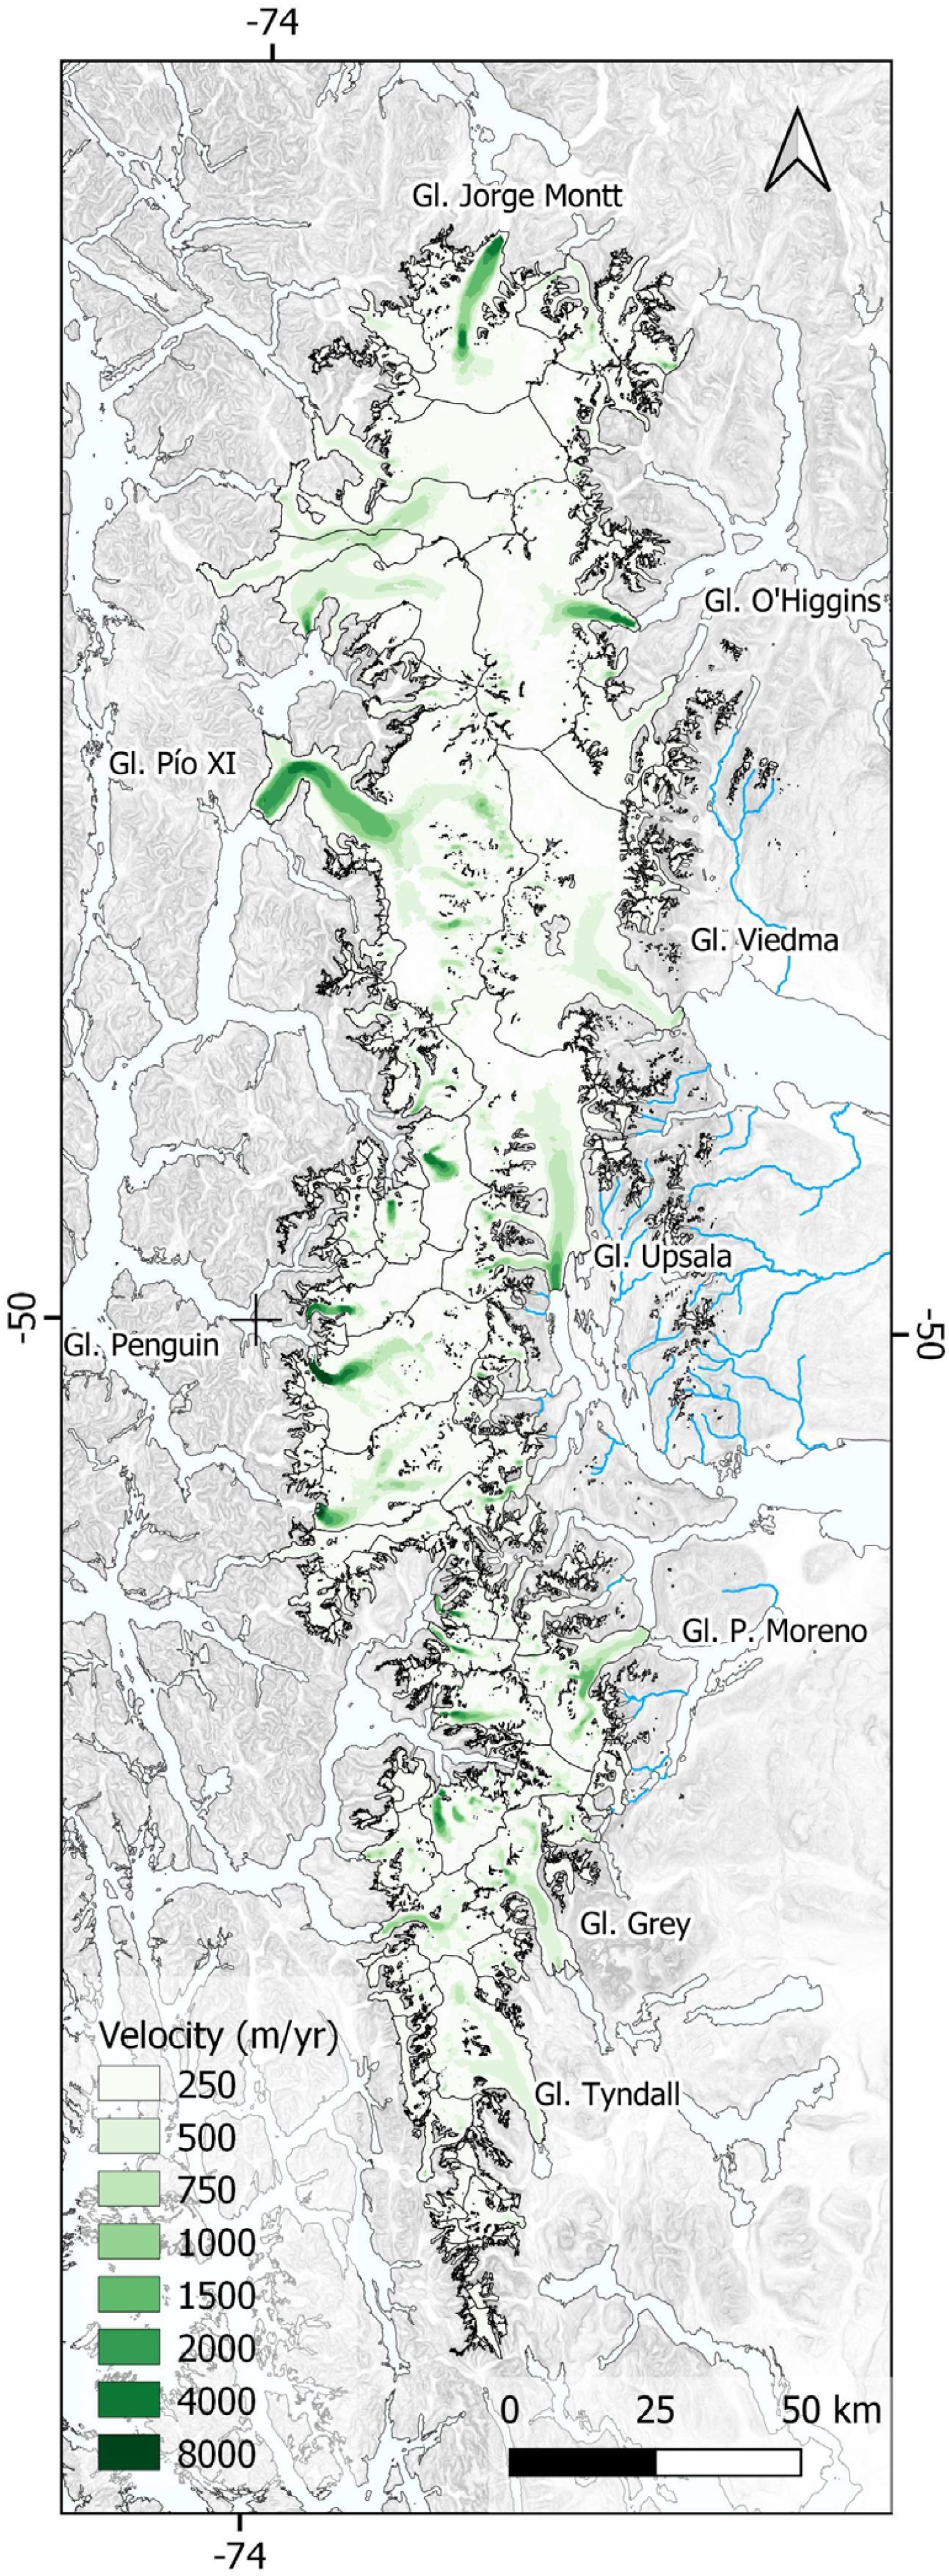
Figure 11. Mean annual surface ice velocity of SPI glaciers between 2000 and 2012, derived from synthetic aperture radar (SAR; Mouginot and Rignot, 2015). High velocities can be observed along the central flowline of some of the largest outlet glaciers.
Calving has been frequently addressed in the region since many of the largest glaciers in southern Patagonia terminate in fjords or lakes (Warren and Sugden, 1993). According to Rivera et al. (2012c), many of these calving glaciers follow the so-called Tidewater Glacier Calving Cycle, that in general is controlled by mass balance and water depth at the glacier front. An example of a glacier in the advancing phase of this cycle is Pío XI glacier (Wilson et al., 2016), whereas an example of a glacier reaching new equilibrium after fast retreat is the Upsala glacier (Sakakibara et al., 2013). Other calving glaciers, such as Jorge Montt, are currently in the retreating or collapsing phase of the cycle due to near buoyant conditions when the ice front ends in deep waters (Bown et al., 2019).
Recently published global models of ice thickness and volumes (Huss and Farinotti, 2012; Carrivick et al., 2016; Farinotti et al., 2019) provide valuable information in this region and can work relatively well in mountain glaciers with well-defined tongues. However, these models have some limitations when dealing with large icefields such as the NPI and SPI, because the modeled subglacial topographies are often unrealistic and may contain many artifacts. Patagonian glaciers have been occasionally surveyed with radar methods that are able to reach up to 700 m of ice thickness, with penetration ranges restrained by the temperate conditions of the ice and the presence of crevasses and water (Zamora et al., 2017). Gravity methods (e.g., Gourlet et al., 2016) offer one option to overcome this limitation as they have no limits in ice thickness determinations, but they need to be validated and controlled by more accurate methods, such as radar. This combined approach has been applied in Patagonia (Millan et al., 2019), resulting in an improved ice thickness distribution coverage and the first comprehensive subglacial topography of the whole NPI and the northern part of the SPI.
Information on ice thickness, subglacial topography, and ice flux, among others, are critical parameters for a proper modeling and understanding of the observed glacier changes and their contrasting behaviors between adjacent basins, and for forecasting future responses to climate change. Collao-Barrios et al. (2018) applied a physically based model that relies on surface climatic data plus ice fluxes from ice thickness and surface velocities to estimate the surface mass balance of San Rafael glacier in the NPI. This analysis showed that the mass balance is slightly positive (0.08 ± 0.06 Gt a–1) between 2000 and 2012, with an ice discharge of ca. −0.83 Gt a–1. These numbers seems to contradict previous surface mass balance models for San Rafael based mainly on climatic data (mainly reanalysis since automatic weather stations are very scarce) and calving fluxes based on geodetic measurements, that obtained a much higher surface mass balance of 1.19 Gt a–1 between 1979 and 2011 (Schaefer et al., 2013) and 0.72 ± 0.37 Gt a–1 (Koppes et al., 2011), and also higher ice discharges of −1.68 and −1.04 Gt a–1 by Schaefer et al. (2013) and Koppes et al. (2011), respectively. Using a coupled snow and ice energy and mass balance model, Weidemann et al. (2018a) concluded that the Tyndall and Gray glaciers, located at the southern tip of the SPI, experienced a 2000–2014 climatic mass balance +1.02 ± 0.52 m w.e. a–1 and +0.68 ± 0.54 m w.e. a–1, respectively. These positive numbers are, however, counterbalanced by strong ablation at the calving ice fronts, yielding an overall mass balance of −1.05 ± 0.18 m w.e. a–1 and 2.58 ± 0.28 m w.e. a–1 for Gray and Tyndall glaciers, respectively. Schaefer et al. (2015) modeled the surface mass balance for the entire SPI during the period 1975–2011. They estimated an average annual acumulation on the SPI of ca. 67.7 km3, an average ice surface melt of ca. 36.5 km3, and a strong increase in annual ice mass losses due to calving between 1975–2000 and 2000–2011 (changing from 44.4 to 61.3 km3 of ice).
Important limitations still remain, however, due to the serious lack of in situ validation data, especially of precipitation/accumulation in the upper plateaus, temperature/melt patterns on the ice, and calving fluxes and dynamics at many more sites throughout the region. To partly overcome the lack of basic climatic information, many modeling studies have used data from the ERA or NCEP/NCAR climate reanalyses (Lenaerts et al., 2014; Weidemann et al., 2018b), and more recently the WRF simulations (e.g., Villarroel et al., 2013; Schaefer et al., 2015). Meteorological stations from lowlands away from glaciers have also been used, but the scarcity and lack of continuity remains a serious problem in this region (Masiokas et al., 2015; Bravo et al., 2019b).
One of the consequences of the ongoing shrinkage of Patagonian glaciers (Figures 7–9) is the formation and expansion of lakes in lands recently abandoned by ice. For example, at the NPI, Loriaux and Casassa (2013) detected an increase in glacial lake area of 66 km2 between 1945 and 2011. At Monte San Lorenzo, south-east of the NPI, Falaschi et al. (2019) measured a three-fold increase in the number of lakes and 5 km2 of new lake area formed between 1958 and 2018. The retreating glaciers are also uncovering rock outcrops and nunataks with unknown geological information. The regional geological maps show little information about these areas but recent works revealed tectonic features that extend under the ice and are controlling present glacier location and flow (Georgieva et al., 2016).
Mountain Permafrost
Mountain permafrost, i.e., ground which remains at or below 0°C for at least two consecutive years (Harris et al., 1998), is widespread in the high Andes mountains where the air temperature is at freezing temperatures most of the year. However, as only a few instrumented permafrost boreholes have been published in the Andes, our ability to analyze the current state of Andean permafrost is limited (e.g., Trombotto, 2014). The local variations in topography, solar radiation, snow cover, ground surface type, subsurface hydrology and geology, and their differential influences on smaller scale ground temperature patterns, determine a predominant discontinuous mountain permafrost distribution in the Andes (Haeberli and Gruber, 2009). However, given the practical and technical difficulties in the identification and mapping of permafrost (defined, as indicated above, by the thermal condition of the ground), most of the efforts to assess the extent of permafrost along the Andes have been based on modeling approaches (Arenson and Jakob, 2010a; Gruber, 2012; Ruiz and Trombotto, 2012; Azócar et al., 2017; Esper Angillieri, 2017) and/or the recognition and mapping of ice-rich permafrost landforms such as rock glaciers (Barcaza et al., 2017; Zalazar et al., 2017). In this sense, the publication of local and regional inventories of perennial ice masses that includes rock glaciers represents a substantial improvement in our efforts to characterize and understand the distribution of permafrost in the Andes. Rock glaciers are formed by permanently frozen ground which is supersaturated in ice, favoring the movement and creeping of the permafrost in specific mountain slopes (Haeberli, 1985; Barsch, 1996). This movement and creeping generates the characteristic transverse and longitudinal ridges and furrows on the surface of rock glaciers, which resemble viscous lava flows and allow the identification of these cryoforms in aerial photographs and satellite images (Haeberli, 1985; Trombotto Liaudat et al., 2014; Jones et al., 2019).
The first estimation of mountain permafrost distribution in the Andes was conducted by Trombotto Liaudat (2000), who identified the areas of seasonally frozen, discontinuous and continuous permafrost surfaces using the elevation of 5°C, 0°C and −5°C isotherms, respectively. Although no areal extents were presented, this simple approach showed that it is possible to find permafrost conditions from Venezuela to Tierra del Fuego. Gruber (2012) presented the first global model of permafrost extent using DEMs and gridded air temperatures. The study provided a Permafrost Zonation Index (PZI) map which indicated the possibility of finding permafrost (from very low to high possibilities) and showed that, in the Andes, it is much more likely to find permafrost conditions south of 18°S with most of the area (∼70%) concentrated between 23° and 36°S. Arenson and Jakob (2010a) developed a mountain permafrost distribution model primarily based on physical evidence (elevation, slope aspect and angles, and potential solar radiation) and field observations, and showed promising results in local tests in the Dry Andes at ca. 31.6°S. Other local efforts have used statistical permafrost distribution models such as the Bottom Temperature of the Snow Cover (BTS) model (Ruiz and Trombotto, 2012) to identify the presence of permafrost conditions in the eastern margin of the North Patagonian Andes at 42°S. Azócar et al. (2017) presented an empirical model of mountain permafrost favorability, with a spatial resolution of 30 m, for the semi-arid Andes of central Chile (29°–32°S). The model is based on rock glacier activity and temperature data, and similarly to Gruber (2012), their results provide a permafrost favorability index. They found conditions highly favorable for permafrost presence over 1051 km2 (2.7% of the total investigated area) and favorable conditions for 2636 km2 (6.8% of the total area). Esper Angillieri (2017) presented a high resolution (30 m pixel size) permafrost probability model for the Andes of the San Juan province in central-western Argentina based on the presence and activity of rock glaciers and their relationship with topoclimatic variables such as altitude, aspect, mean annual air temperature, mean annual precipitation and potential incoming solar radiation. Based on this model and using the 70% threshold for the probability of rock glacier occurrence, they estimated an extent of permafrost of ca. 10772 km2 in this province.
In the inner Tropical Andes, Trombotto Liaudat (2000) reported evidence of patterned ground and other periglacial environments in the Páramo ecosystem and in the highest volcanoes of Ecuador. Rangecroft et al. (2014) presented the first rock glacier inventory for the Bolivian Andes (15–22°S) based on remote sensing and field validation data. They found 94 rock glaciers (57% classified as active and the remaining as relict) which cover a total area of 11 km2 with a mean size of 0.12 km2. Based on the mean minimum altitude of rock glacier fronts, they approximate the lower limit of permafrost at 4700 m a.s.l. in the Bolivian Andes. Barcaza et al. (2017) presented the first glacier inventory of the Chilean Andes based on remote sensing data. They found a total of 2831 rock glaciers covering a total area of 369 km2 and spanning from 17°S to 37°S. The mean area of the Chilean rock glaciers is 0.13 km2, and their mean minimum elevation decreases from ca. 4800 m a.s.l. at around 18°–23°S, to a minimum of ca. 2500 m a.s.l. at 37°S. Zalazar et al. (2017) presented the first glacier inventory of Argentina, including a detailed description of rock glaciers, expanding the classification to include their genesis (permafrost-related or glacial related), form, activity, and other characteristics. In the Andes of Argentina there are almost 7600 rock glaciers (almost 75% classified as active) that cover an area of ca. 673 km2 between 21° and 55°S. These rock glaciers have a mean surface area of 0.08 km2, and their mean minimum elevation decreases from 4800 to 4500 m a.s.l. between 22° and 28°S, to less than 1,000 m a.s.l. in the south of Tierra del Fuego (55°S). Interestingly, these new regional-scale rock glacier inventories from Chile and Argentina show that the region from ca. 28° to 36°S concentrates almost 90% of the total area covered by rock glaciers in South America.
Falaschi et al. (2014, 2015, 2016) and Perucca and Esper Angillieri (2008), among others, also provide inventories and detailed descriptions of rock glaciers in the northern, central and southern sectors of the Andes of Argentina. The existence of rock glaciers in southern Patagonia and even in Tierra del Fuego has been confirmed in recent studies (e.g., Falaschi et al., 2015; Masiokas et al., 2015; Zalazar et al., 2017) and is an interesting characteristic of these regions, which are usually appreciated by their numerous and extensive glaciers and a persistent cloud cover throughout the year. In these southern regions these periglacial features are usually concentrated toward the eastern drier margin sectors of the mountain ranges (Ruiz and Trombotto, 2012; Falaschi et al., 2015, 2016; Masiokas et al., 2015; Zalazar et al., 2017). This new evidence provides solid information of these southernmost rock glaciers that contributes to a more comprehensive understanding of the cryosphere and the mountain climatology in these regions.
The role of rock glaciers as long-term water reserves and short-term sources of freshwater in many semi-arid sectors across the southern Andes has also received an increasing attention in recent years (Azócar and Brenning, 2010; e.g., Arenson and Jakob, 2010b; Jones et al., 2018, 2019; Schaffer et al., 2019). These permanent ice masses are inherently more resilient to changes in climate than clean-ice glaciers, and can provide a relatively steady amount of freshwater in many catchments where glacier ice is absent or very scarce, especially during extended dry periods when precipitation is also reduced to a minimum (Schaffer et al., 2019). Recently, Jones et al. (2018, 2019) estimated that the water volume equivalent stored within rock glaciers on a near-global scale is around 83.7 ± 16.7 Gt (ca. 68–102 trillion litres), with rock glaciers in the Andes contributing with almost 40% (i.e., 32.84 ± 6.57 Gt; the highest percentage of all individual regions). At a local scale, studies using empirical methods have estimated that, in total, rock glaciers may account for more stored ice than glaciers in the Central Andes (Azócar and Brenning, 2010; Janke et al., 2017), but more measurements are required to confirm these results (Arenson and Jakob, 2010b). Also, as rock glacier formation processes are still up for debate (Monnier and Kinnard, 2015, 2016, 2017), determining ice content of glaciogenic vs. cryogenic, or active vs. inactive rock glaciers is still contentious.
Besides the global estimates discussed above, determining the specific hydrological role of rock glaciers has been even more elusive, as few methods have been validated in the scientific literature to quantify the hydrological contribution of rock glaciers or to understand their wider impact on drainage system processes. Using seasonal discharge measurements in the La Laguna catchment (30°S), Schaffer et al. (2019) estimated that rock glaciers are likely to contribute around 10% of streamflow for this basin. Due to the paucity of published cores from rock glaciers (Monnier and Kinnard, 2013) and discharge measurements in headwater catchments, such estimations should be treated with caution.
Discussion and Conclusion
The information discussed above highlights the impressive richness and diversity of cryospheric features and conditions that can be found along the Andes from Venezuela and Colombia to Tierra del Fuego. Along this vast region, the cryosphere plays an important hydrological, climatological and socio-economic role providing, for example, a large proportion of the water that is consumed by the numerous human populations living near the Andes (Schoolmeester et al., 2018). This combination puts the Andes Cordillera in a very prominent position as a relatively pristine natural laboratory where many glaciological, geocryological, hydrological, climatological, ecological and socio-economic processes and phenomena can be assessed from different points of view. In this last section we discuss some pending issues that could improve the current knowledge of the Andean cryosphere and the potential application in related disciplines and studies.
Accurate Quantification of Glacier Ice Thickness
One of the main issues to better quantify the future changes of Andean glaciers, their contribution to sea level rise, and their hydrological contribution to glacierized watersheds is the complexity to quantify the ice thicknesses and glacier volumes. Unfortunately, accurate ice thickness quantifications are limited to very few glaciers (less than 1% at global scale) where in situ thickness measurements have been realized (Welty et al., 2020). To overcome this limitation, several methods have taken advantage of the increasing availability of morpho-topographic glaciological data from repeated glacier inventories, digital elevation models of the glacier surface, surface mass balance data, and more recently surface flow velocity data. The Working Group of the International Association of Cryospheric Sciences (IACS)1 conducted the Ice Thickness Models Intercomparison eXperiment (ITMIX). Farinotti et al. (2017, 2019) presented a review of existing methods together with the first results of the intercomparison experiment. One interesting finding was the possibility of using glacier surface flow velocities to faithfully represent the thickness distribution at the glacier scale. In contrast, approaches based on the shear stress (i.e., using the surface slope) provided less accurate results. Indeed, Rabatel et al. (2018b) strongly encouraged the use of glacier surface flow velocities to improve the quantification of glacier ice thickness distribution and underlined the need of at least a few in situ measured thickness data. The methods using the glacier surface slope as input data (e.g., Huss and Farinotti, 2012; Linsbauer et al., 2012) should be used with caution because of the strong uncertainties associated with this variable. Certain particular considerations are probably also needed if these methods are applied in regions such as the Desert Andes where cold-based glaciers are common.
Updated Simulations of Future Glacier Changes
Studies of projections of potential future changes of glaciers in the Andes have been regional/global in scale (e.g., Marzeion et al., 2012; Radić and Hock, 2014; Huss and Hock, 2015; Huss et al., 2017), or site-specific (e.g., Frans et al., 2015; Réveillet et al., 2015; Yarleque et al., 2018). The different approaches range from simple extrapolations of past surface or length changes, to complex modeling of glacier mass balance and ice flow dynamics. All studies indicate an important reduction of glacier ice volume in the Andes by the end of the 21st century, and even the disappearance of many glaciers. Small glaciers are likely to completely disappear in the coming decades (e.g., Rabatel et al., 2018a for Colombia), and even the largest tropical ice cap (the Quelccaya ice cap in the Cordillera de Vilcanota, Peru; Yarleque et al., 2018). Given the limited altitudinal extent of many glaciers, even if air temperature is assumed to stabilize by the second half of this century according to the most optimistic climate scenario, such glaciers will not reach a new equilibrium with climate and will likely disappear or shrink substantially.
For improved estimations of future glacier evolution, ice dynamics models will need to be coupled to adequate representations of glacier surface mass balance. Application of models able to resolve the full energy balance is thus required (e.g., Bravo et al., 2017). However, such models need accurate projections of atmospheric variables, and thus decreasing the uncertainties in future projections of atmospheric variables and improving their downscaling at the glacier scale are two other important issues. Finally, a better quantification of the impact of supraglacial debris and related feedbacks will also be required as many glacier tongues are covered by debris especially in the southern Andes.
Development of a Coordinated Network of High Elevation Hydro-Meteorological Stations
The current lack of an extended, well-coordinated network of permanent, complete and reliable meteorological stations at high elevations in the Andes constitutes a very important limitation to properly understand the atmospheric processes and phenomena that affect the cryosphere and many other natural systems in this mountain range. Very few automatic weather stations (AWS) that measure the whole range of relevant variables including snow accumulation are located near glacierized areas, and thus many studies have relied on remote stations and/or gridded datasets that do not necessarily capture the local processes in a proper manner. In many cases the different research groups have installed and maintain AWS at their study sites, but currently there is no coordinated effort to integrate this dispersed information for improved analyses of glacier-climate relationships and climate change related studies. Additionally, very few discharge gauging stations exist in glacierized zones, which greatly limits our ability to validate runoff models, as well as accurately estimate the cryospheric contribution to streamflow.
Geological Impacts of Deglaciation
The deglaciation that is widespread across the Andes (Braun et al., 2019; Dussaillant et al., 2019; Reinthaler et al., 2019) has important associated impacts that include the increase in frequency of landslides due to slope instabilities, possible moraine dam failures, various effects on volcanic activity, and glacio-isostatic rebounds. In view of the observed increases in proglacial lake areas due to glacier shrinkage (Wilson et al., 2018), the occurrence of glacial lake outburst floods (GLOFs) due to the sudden release of glacier- or moraine-dammed lakes poses a real and growing threat in some sectors of the Andes. In many cases these lakes have experienced GLOF events with strong impacts in downstream valleys and in the runoff of the outlet rivers (Dussaillant et al., 2012). According to Harrison et al. (2018), these processes are expected to increase in the future as the glacier retreat continues along the Andes. Thus the monitoring of this phenomenon should be established as a precautionary measure in places where human populations and infrastructure are located downstream from potentially dangerous sites. In steep terrains, thawing of mountain permafrost can also influence the frequency and magnitude of gravitational natural hazards with consequences for local communities and infrastructure (Arenson and Jakob, 2015; Deline et al., 2015). To date, only few studies have focused on the issue of volcanic activity and ice-volcano interactions (Rivera et al., 2012a; Rivera and Bown, 2013). This is particularly relevant in the region south of 46°S, where there are three active volcanoes (Lautaro, Reclus and Burney) that contain glaciers but with very little direct information on their impacts and interactions (Martinic, 2016).
Hydrological Significance of Rock Glaciers
As discussed above, the recent publication of up-to-date inventories of glaciers and rock glaciers has improved substantially the knowledge about their current state and distribution in the Andes. An increasing number of studies has focused on quantifying the amount of ice present in rock glaciers (Monnier and Kinnard, 2013; Janke et al., 2017; Jones et al., 2018), and on the possible impacts of climate change on rock glacier dynamics (Deline et al., 2015; Iribarren et al., 2015). Increasingly, both regionally (Rangecroft et al., 2015; Schaffer et al., 2019), and globally (Jones et al., 2018, 2019), the importance of rock glaciers as water reserves is being recognized in semi-arid areas (Rangecroft et al., 2013; Jones et al., 2019). However, as very few studies are available that provide rock glacier depths, the estimations of the ice volume contained in rock glaciers must be considered preliminary.
Long-term monitoring sites are showing that permafrost temperatures appear to be increasing (Trombotto, 2014), and modeling exercises indicate that temperatures will likely continue to increase in the coming decades. This permafrost warming may become a relevant issue especially in arid and semi-arid areas of the Andes as this could promote the degradation of permafrost and affect the rock glacier contribution to the water supply in these areas. A coordinated effort is urgently needed to determine the ice content in rock glaciers, how this ice is changing through time, and the implications for catchment hydrology.
More ground temperature and active layer thickness measurements along the Andes are also needed to have a better understanding of the role of ground fabric, air temperature, radiative fluxes, snow cover, and turbulent heat fluxes on the surface energy balance and on the current presence and the future extent of mountain permafrost. Most of the data from ground temperature and active layer thicknesses are restricted to the Central Andes of Argentina and Chile, in many cases collected by mining companies, but a substantially larger network is needed to better understand the ground temperature patterns in permafrost sites across the Andes.
Final Thoughts
The wide range of studies and analyses discussed above clearly shows that our knowledge about the different components of the Andean cryosphere has improved substantially in the last 1–2 decades. In this relatively short period of time, an astounding number of assessments have become available tackling increasingly complex patterns and phenomenons pertaining to the snow, glaciers and/or mountain permafrost in specific sectors of the Andes, or involving the Andes Cordillera as a whole. Certainly, the increasing availability of medium to high resolution data from remote sensors has played a critical role in this process. These remote sensing data have been particularly useful, for example, for developing local and regional-scale glacier inventories and for assessing glacier changes with greater temporal and spatial detail. Combined with the increasing capabilities of numerical models, this detailed information has allowed in many cases the faithful simulation of specific cryospheric processes that were previously unknown or extremely difficult to estimate using the very limited set of in situ measurements that are usually available for most sectors of the Andes. These combined approaches are most certainly welcome and needed in many regions, but we nonetheless would like to stress the overarching need for continued and renewed efforts to expand the sets of direct cryospheric measurements across the Andes. It is only through the careful comparison with direct in situ measurements that many of the remote sensing analyses and modeling exercises can reliably validate their results and provide solid evidence to further our understanding of many of the complex snow and ice processes that occur in the Andes.
Author Contributions
MM, ARa, ARi, LR, and PP wrote most sections of the manuscript. All authors contributed with material and suggestions on different revisions the text.
Conflict of Interest
The authors declare that the research was conducted in the absence of any commercial or financial relationships that could be construed as a potential conflict of interest.
Funding
MM, PP, and LR acknowledge the support from IANIGLA-CONICET. ARa acknowledges the support of the Service National d’Observation GLACIOCLIM (https://glacioclim.osug.fr) (UGA, CNRS, IRD, INRAE, IPEV), the LMI GREAT ICE (IRD), and the LabEx OSUG@2020 (Investissements d’avenir, Grant Number ANR-10-LABX56). ARi acknowledges the support of FONDECYT 1171832. EB and ID acknowledge the France Space Agency (CNES), and the Région Occitanie for the Ph.D. fellowship of ID. SM acknowledges the support from ANID-Programa Regional R16a10003.
Acknowledgments
This review manuscript has been achieved as part of the ANDEX program (www.gewex.org/project/andex/), which is a prospective Regional Hydroclimate Project (RHP) of the GEWEX Hydroclimatology Panel (GHP). We thank the National Correspondents of the WGMS and the Snow and Ice Working Group (GTNH) of Latinamerica and Caribe/IHP UNESCO for the updated glacier mass balance data. L. Cara from IANIGLA-CONICET helped with the analyses shown in Figure 1. The numerous and constructive comments and suggestions provided by the two reviewers helped to improve the final version of the manuscript and are greatly appreciated.
Footnotes
References
Abdel Jaber, W., Rott, H., Floricioiu, D., Wuite, J., and Miranda, N. (2019). Heterogeneous spatial and temporal pattern of surface elevation change and mass balance of the Patagonian ice fields between 2000 and 2016. The Cryosphere 13, 2511–2535. doi: 10.5194/tc-13-2511-2019
Aguirre, F., Carrasco, J., Sauter, T., Schneider, C., Gaete, K., Garín, E., et al. (2018). Snow cover change as a climate indicator in Brunswick Peninsula. Patagonia. Front. Earth Sci. 6:130. doi: 10.3389/feart.2018.00130
Albert, T., Klein, A., Kincaid, J. L., Huggel, C., Racoviteanu, A. E., Arnaud, Y., et al. (2014). “Remote sensing of rapidly diminishing tropical glaciers in the northern Andes,” in Global Land Ice Measurements from Space, eds M. P. Bishop, G. J. Leonard, and B. H. Raup (Berlin: Springer), 609–638. doi: 10.1007/978-3-540-79818-7_26
Alvarez-Garreton, C., Mendoza, P. A., Boisier, J. P., Addor, N., Galleguillos, M., and Zambrano-Bigiarini, M. (2018). The CAMELS-CL dataset: catchment attributes and meteorology for large sample studies – Chile dataset. Hydrol. Earth Syst. Sci. 22, 5817–5846. doi: 10.5194/hess-22-5817-2018
ANA (2014). Inventario Nacional de Glaciares y lagunas (in Spanish). Autoridad Nacional del Agua, Dirección de Conservación y Planeamiento de Recursos Hídricos. Peru: Unidad de Glaciología y Recursos Hídricos.
Aniya, M. (2013). Holocene glaciations of Hielo Patagónico (Patagonia Icefield), South America: a brief review. Geochem. J. 47, 97–105. doi: 10.2343/geochemj.1.0171
Aniya, M., Sato, H., Naruse, R., Skvarca, P., and Casassa, G. (1997). Recent Variations in the Southern Patagonia Icefield, South America. Arctic Alpine Res. 29, 1–12.
Arenson, L. U., and Jakob, M. (2010a). “A New GIS based mountain permafrost distribution model,” in Proceedings of the 62nd Canadian Geotechnical Conference, Calgary, AB, 452–458.
Arenson, L. U., and Jakob, M. (2010b). The significance of rock glaciers in the dry Andes - A discussion of Azócar and Brenning (2010) and Brenning and Azócar (2010). Permafrost Periglacial Process. 21, 286–288. doi: 10.1002/ppp.693
Arenson, L. U., and Jakob, M. (2015). “Periglacial Geohazard Risks and Ground Temperature Increases,” in Engineering Geology for Society and Territory – Volume 1: Climate Change and Engineering Geology, Vol. 1, eds G. Lollino, A. Manconi, J. Clague, W. Shan, and M. Chiarle (Cham: Springer International Publishing), 233–237. doi: 10.1007/978-3-319-09300-0
Aster Gdem Validation Team (2009). ASTER global DEM Validation Summary Report. Tokyo: METI & NASA, 28.
Ayala, A., Pellicciotti, F., MacDonell, S., McPhee, J., and Burlando, P. (2017). Patterns of glacier ablation across North-Central Chile: identifying the limits of empirical melt models under sublimation-favorable conditions. Water Resour. Res. 53, 5601–5625. doi: 10.1002/2016WR020126
Ayala, A., Pellicciotti, F., MacDonell, S., McPhee, J., Vivero, S., Campos, C., et al. (2016). Modelling the hydrological response of debris-free and debris-covered glaciers to present climatic conditions in the semiarid Andes of central Chile. Hydrol. Process. 30, 4036–4058. doi: 10.1002/hyp.10971
Azócar, G. F., and Brenning, A. (2010). Hydrological and geomorphological significance of rock glaciers in the dry Andes, Chile (27°-33°S). Permafrost Perigl. Process. 21, 42–53. doi: 10.1002/ppp.669
Azócar, G. F., Brenning, A., and Bodin, X. (2017). Permafrost distribution modelling in the semi-arid Chilean Andes. Cryosphere 11, 877–890. doi: 10.5194/tc-11-877-2017
Barcaza, G., Nussbaumer, S. U., Tapia, G., Valdés, J., García, J.-L., Videla, Y., et al. (2017). Glacier inventory and recent glacier variations in the Andes of Chile, South America. Ann. Glaciol. 58, 166–180. doi: 10.1017/aog.2017.28
Barsch, D. (1996). Rock-glaciers. Indicators for the Present and Former Geoecology in High Mountain Environments. Berlin: Springer.
Basantes, R. (2010). Análisis Espacio-Temporal de Comportamiento Geométrico de los glaciares del Volcán Antisana y su Relación con la Variabilidad Climática. Master Thesis, University of Nice, France.
Berthier, E., Vincent, C., Magnússon, E., Gunnlaugsson, Áþ, Pitte, P., Le Meur, E., et al. (2014). Glacier topography and elevation changes derived from Pléiades sub-meter stereo images. Cryosphere 8, 2275–2291. doi: 10.5194/tc-8-2275-2014
Bicca, C. E. (2012). Variações nas geleiras da porção norte da Cordilheira Real durante o período de 1984 a 2010 através do Sensoriamento Remoto (in Portuguese). Master dissertation, Federal University of Rio Grande do Sul, Porto Alegre.
Bolius, D., Schwikowski, M., Jenk, T., Gaggeler, H. W., Casassa, G., and Rivera, A. (2006). A first shallow firn core record from Glaciar La Ollada on Cerro Mercedario in the Central Argentinean Andes. Ann. Glaciol. 43, 14–22. doi: 10.3189/172756406781812474
Bown, F., Rivera, A., Pêtlicki, M., Bravo, C., Oberreuter, J., and Moffat, C. (2019). Recent ice dynamics and mass balance of Jorge Montt Glacier, Southern Patagonia Icefield. J. Glaciol. 65, 732–744. doi: 10.1017/jog.2019.47
Bown, F., Rivera, A., Zenteno, P., Bravo, C., and Cawkwell, F. (2014). “First glacier inventory and recent glacier variation on Isla Grande de Tierra del Fuego and adjacent islands in Southern Chile,” in Global Land Ice Measurements from Space, eds M. P. Bishop, G. J. Leonard, and B. H. Raup (Berlin: Springer-Praxis), 661–674. doi: 10.1007/978-3-540-79818-7_28
Braun, M. H., Malz, P. H., Sommer, C. H., Farías-Barahona, D., Sauter, T., Casassa, G., et al. (2019). Constraining glacier elevation and mass changes in South America. Nat. Clim. Change 9, 130–136. doi: 10.1038/s41558-018-0375-7
Bravo, C., Bozkurt, D., Gonzalez-Reyes, Á, Quincey, D. J., Ross, A. N., Farías-Barahona, D., et al. (2019a). Assessing snow accumulation patterns and changes on the patagonian icefields. Front. Environ. Sci. 7:30. doi: 10.3389/fenvs.2019.00030
Bravo, C., Quincey, A., Ross, A., Rivera, B., Brock, E., and Silva, M. A. (2019b). Air temperature characteristics, distribution and impact on modeled ablation for the South Patagonia Icefield. J. Geophys. Res. 124, 907–925. doi: 10.1029/2018JD028857
Bravo, C., Loriaux, T., Rivera, A., and Brock, B. (2017). Assessing glacier melt contribution to streamflow at Universidad Glacier, central Andes of Chile. Hydrol. Earth Syst. Sci. 21, 3249–3266. doi: 10.5194/hess-21-3249-2017
Burger, F., Ayala, A., Farias, D., MacDonell, S., Shaw, T., Brock, B., et al. (2019). Interannual variability in glacier contribution to runoff from high-elevation Andean catchments: understanding the role of debris cover in glacier hydrology. Hydrol. Process. 33, 214–229. doi: 10.1002/hyp.13354
Caceres, B. (2010). Actualización del Inventario de Tres Casquetes Glaciares del Ecuador. Master Thesis, University of Nice, France.
Cara, L., Masiokas, M. H., Viale, M., and Villalba, R. (2016). Análisis de la cobertura nival de la cuenca superior del río Mendoza a partir de imágenes MODIS. Rev. Meteorol. 41, 21–36.
Carrasco, J., Osorio, R., and Casassa, G. (2008). Secular trend of the equilibrium-line altitude on the western side of the southern andes, derived from radiosonde and surface observations. J. Glaciol. 54, 538–550. doi: 10.3189/002214308785837002
Carrivick, J. L., Davies, B. J., James, W. H. L., Quincey, D. J., and Glasser, N. F. (2016). Distributed ice thickness and glacier volume in southern South America. Glob. Planet. Change 146, 122–132. doi: 10.1016/j.gloplacha.2016.09.010
Cathles, L. M., Abbot, D. S., and MacAyeal, D. R. (2014). Intra-surface radiative transfer limits the geographic extent of snow penitents on horizontal snowfields. J. Glaciol. 60, 147–154. doi: 10.3189/2014jog13j124
Collao-Barrios, G., Gilliet-Chaulet, F., Favier, V., Casassa, G., and Berthier, E. (2018). Ice flow modelling to constrain the surface mass balance and ice discharge of San Rafael Glacier, Northern Patagonia Icefield. J. Glaciol. 64, 568–582. doi: 10.1017/jog.2018.46
Collet, M. (2010). Suivi Spatio-Temporel des Calottes Glaciaires de l’Antisana et du Cotopaxi (Equateur). Analyse par télédétection dans un Contexte de Changement Climatique. Master Thesis, University of Rennes, France.
CONAM (2001). National communication of Peru to the United Nations Framework Convention on Climate change (UNFCCC). Lima: National Council on the Environment.
Condom, T., Coudrain, A., Sicart, J.-E., and Théry, S. (2007). Computation of the space and time evolution of equilibrium-line altitudes on Andean glaciers (10°N-55°S). Glob. Planet. Change 59, 189–202. doi: 10.1016/j.gloplacha.2006.11.021
Cook, S. J., Kougkoulos, I., Edwards, L. A., Dortch, J., and Hoffmann, D. (2016). Glacier change and glacial lake outburst flood risk in the Bolivian Andes. Cryosphere, 10:239.
Cordero, R. R., Asencio, V., Feron, S., et al. (2019). Dry-season snow cover losses in the andes (18°–40°S) driven by changes in large-scale climate modes. Sci. Rep. 9:16945. doi: 10.1038/s41598-019-53486-7
Corripio, J. G., and Purves, R. S. (2005). “Surface energy balance of high altitude glaciers in the Central Andes: the effect of snow penitentes,” in Climate and Hydrology in Mountain Areas, ed. C. de Jong (London: Wiley & Sons), 15–27. doi: 10.1002/0470858249.ch3
Cortés, G., Girotto, M., and Margulis, S. (2016). Snow process estimation over the extratropical Andes using a data assimilation framework integrating MERRA data and Landsat imagery. Water Resour. Res. 52, 2582–2600. doi: 10.1002/2015wr018376
Cortés, G., and Margulis, S. (2017). Impacts of El Niño and La Niña on interannual snow accumulation in the Andes: Results from a high-resolution 31 year reanalysis. Geophys. Res. Lett. 44, 6859–6867. doi: 10.1002/2017gl073826
Dangles, O., Rabatel, A., Kraemer, M., Zeballos, G., Soruco, A., Jacobsen, D., et al. (2017). Ecosystem sentinels for climate change? Evidence of wetland cover changes over the last 30 years in the high Bolivian Andes. PLoS One 12:e0175814. doi: 10.1371/journal.pone.0175814
Davies, B. J., and Glasser, N. F. (2012). Accelerating shrinkage of Patagonian glaciers from the “Little Ice Age” (c. AD 1870) to 2011). J. Glaciol. 58, 1063–1084. doi: 10.3189/2012JoG12J026
De Angelis, H. (2014). Hypsometry and sensitivity of the mass balance to changes in equilibrium-line altitude: the case of the Southern Patagonia Icefield. J. Glaciol. 60, 14–28. doi: 10.3189/2014JoG13J127
Deline, P., Gruber, S., Delaloye, R., Fischer, L., Hasler, A., Kirkbride, M., et al. (2015). “Ice loss and slope stability in high-mountain regions,” in Snow and Ice-Related Hazards, Risks and Disasters, eds W. Haeberli, C. Whiteman, and J. F. Shroder (Amsterdam: Elsevier), 521–561. doi: 10.1016/B978-0-12-394849-6.00015-9
Drenkhan, F., Guardamino, L., Huggel, C., and Frey, H. (2018). Current and future glacier and lake assessment in the deglaciating Vilcanota-Urubamba basin, Peruvian Andes. Glob. Planet. Change 169, 105–118. doi: 10.1016/j.gloplacha.2018.07.005
Durand, M., Rivera, A., Geremia-Nievinski, F., Lenzano, M. G., Galera, J. F., Paredes, P., et al. (2019). GPS reflectometry study detecting snow height changes in the Southern Patagonia Icefield. Cold Reg. Sci. Technol. 166:102840. doi: 10.1016/j.coldregions.2019.102840
Dussaillant, A., Wouter, B., Claudio, M., and Fabián, E. (2012). Hydrological regime of remote catchments with extreme gradients under accelerated change: the Baker basin in Patagonia. Hydrol. Sci. J. 57, 1530–1542. doi: 10.1080/02626667.2012.726993
Dussaillant, I., Berthier, E., and Brun, F. (2018). Geodetic Mass Balance of the Northern Patagonian Icefield from 2000 to 2012 using two independent methods. Front. Earth Sci. 6:8. doi: 10.3389/feart.2018.00008
Dussaillant, I., Berthier, E., Brun, F., Masiokas, M., Hugonnet, R., and Favier, V. (2019). Two decades of glacier mass loss along the Andes. Nat. Geosci. 12, 802–808. doi: 10.1038/s41561-019-0432-5
Esper Angillieri, M. Y. (2017). Permafrost distribution map of San Juan Dry Andes (Argentina) based on rock glacier sites. J. S. Am. Earth Sci. 73, 42–49. doi: 10.1016/j.jsames.2016.12.002
Euillades, L., Euillades, P., Riveros, N., Masiokas, M., Ruiz, L., Pitte, P., et al. (2016). Detection of glaciers displacement time-series using SAR. Remote Sens. Environ. 184, 188–198. doi: 10.1016/j.rse.2016.07.003
Espinoza, J. C., Garreaud, R., Poveda, G., Arias, P. A., Molina-Carpio, J., Masiokas, M., et al. (2020). Hydroclimate of the andes part I: main climatic features. Front. Earth Sci. 8:64. doi: 10.3389/feart.2020.00064
Falaschi, D., Bolch, T., Lenzano, M. G., Tadono, T., Lo Vecchio, A., and Lenzano, L. (2018). New evidence of glaciar surges in the Central Andes of Argentina and Chile. Prog. Phys. Geog. 42, 792–825. doi: 10.1177/0309133318803014
Falaschi, D., Bolch, T., Rastner, P., Lenzano, M. G., Lenzano, L., Lo Vecchio, A., et al. (2017). Mass changes of Alpine Glaciers at the Eastern Margin of the Northern and Southern Patagonian Icefields between 2000 and 2012. J. Glaciol. 63, 258–272. doi: 10.1017/jog.2016.136
Falaschi, D., Bravo, C., Masiokas, M. H., Villalba, R., and Rivera, A. (2013). First glacier inventory and recent changes in glacier area in the Monte San Lorenzo region (47°S), southern Patagonian Andes, South America. Arctic Antarctic Alpine Res. 45, 19–28. doi: 10.1657/1938-4246-45.1.19
Falaschi, D., Castro, M., Masiokas, M. H., Tadono, T., and Ahumada, A. L. (2014). Rock glacier inventory of the Valles Calchaquíes region (∼25° S), Salta, Argentina, derived from ALOS data. Permafrost Periglacial Process. 25, 69–75. doi: 10.1002/ppp.1801
Falaschi, D., Lenzano, M. G., Villalba, R., Bolch, T., Rivera, A., and Lo Vecchio, A. (2019). Six Decades (1958–2018) of Geodetic Glacier Mass Balance in Monte San Lorenzo, Patagonian Andes. Front. Earth Sci. 7:326. doi: 10.3389/feart.2019.00326
Falaschi, D., Masiokas, M. H., and Tadono, T. (2016). ALOS-derived glacier and rock glacier inventory of the Volcán Domuyo region (∼36°S), southernmost Central Andes, Argentina. Zeitschrift Geomorphol. 60, 195–208. doi: 10.1127/zfg/2016/0319
Falaschi, D., Tadono, T., and Masiokas, M. H. (2015). Rock glaciers in the Patagonian Andes: an inventory for the Monte San Lorenzo (Cerro Cochrane) massif, 47°S. Geogr. Ann. 97, 769–777. doi: 10.1111/geoa.12113
Farías-Barahona, D., Vivero, S., Casassa, G., Schaefer, M., Burger, F., Seehus, T., et al. (2019). Geodetic Mass Balances and Area Changes of Echaurren Norte Glacier (Central Andes, Chile) between 1955 and 2015. Remote Sens. 11:260. doi: 10.3390/rs11030260
Farinotti, D., Brinkerhoff, D. J., Clarke, G. K., Fürst, J., Frey, H., Gantayat, P., et al. (2017). How accurate are estimates of glacier ice thickness? Results from ITMIX, the Ice Thickness Models Intercomparison eXperiment. Cryosphere 11, 949–970.
Farinotti, D., Huss, M., Fürst, J. J., Landmann, J., Machguth, H., Maussion, F., et al. (2019). A consensus estimate for the ice thickness distribution of all glaciers on Earth. Nat. Geosci. 12:168. doi: 10.1038/s41561-019-0300-3
Favier, V., Falvey, M., Rabatel, A., Praderio, E., and Lopez, D. (2009). Interpreting discrepancies between discharge and precipitation in high altitude area of Chile’s Norte Chico region (26°S-32°S). Water Resour. Res. 45:W02424. doi: 10.1029/2008WR006802
Favier, V., Wagnon, P., Chazarin, J.-P., Maisincho, L., and Coudrain, A. (2004). One-year measurements of surface heat budget on the ablation zone of Antizana glacier 15, Ecuadorian Andes. J. Geophys. Res 109:18105. doi: 10.1029/2003JD004359
Foresta, L., Gourmelen, N., Weissgerber, F., Nienow, P., Williams, J. J., Shepherd, A., et al. (2018). Heterogeneous and rapid ice loss over the patagonian ice fields revealed by Cryosat-2 Swath Radar altimetry. Remote Sens. Environ. 211, 441–455. doi: 10.1016/j.rse.2018.03.041
Francou, B., Vuille, M., Favier, V., and Cáceres, B. (2004). New evidence for an ENSO impact on low-latitude glaciers: Antizana 15, Andes of Ecuador, 0°28′ S. J. Geophys. Res. 109:D18106. doi: 10.1029/2003JD004484
Francou, B., Vuille, M., Wagnon, P., Mendoza, J., and Sicart, J. E. (2003). Tropical climate change recorded by a glacier in the central Andes during the last decades of the twentieth century: Chacaltaya. Bolivia, 16°S. J. Geophys. Res. 108:4154. doi: 10.1029/2002JD002959
Frans, C., Istanbulluoglu, E., Lettenmaier, D. P., Naz, B., Clarke, G., Condom, T., et al. (2015). Predicting glacio-hydrologic change in the headwaters of the Zongo River, Cordillera Real, Bolivia. Water Resour. Res. 51, 9029–9052. doi: 10.1002/2014WR016728
Gardner, A. S., Moholdt, G., Scambos, T., Fahnstock, M., Ligtenberg, S., van den Broeke, M., et al. (2018). Increased West Antarctic and unchanged East Antarctic ice discharge over the last 7 years. Cryosphere 12, 521–547. doi: 10.5194/tc-12-521-2018
Garreaud, R. D. (2009). The Andes climate and weather. Adv. Geosci. 22, 3–11. doi: 10.5194/adgeo-22-3-2009
Garreaud, R. D., Camila, A. G., Jonathan, B., Juan, P. B., Duncan, C., Carlos, L., et al. (2017). The 2010–2015 megadrought in central Chile: impacts on regional hydroclimate and vegetation. Hydrol. Earth Syst. Sci. 21, 6307–6327. doi: 10.5194/hess-21-6307-2017
Garreaud, R. D., Vuille, M., Compagnucci, R., and Marengo, J. (2009). Present-day South American climate. Palaeogeogr. Palaeoclimatol. Palaeoecol. 281, 180–195. doi: 10.1016/j.palaeo.2007.10.032
Gascoin, S., Kinnard, C., Ponce, R., Rabatel, A., Lhermitte, S., et al. (2011). Glacier contribution to streamflow in two headwaters of the Huasco River, Dry Andes of Chile. Cryosphere 5, 1099–1113. doi: 10.5194/tc-5-1099-2011
Gascoin, S., Lhermitte, S., Kinnard, C., Borstel, K., and Liston, G. E. (2013). Wind effects on snow cover in Pascua-Lama, Dry Andes of Chile. Adv. Water Resour. 55, 25–39. doi: 10.1016/j.advwatres.2012.11.013
Georgieva, V., Melnick, D., Schildgen, T. F., Ehlers, T. A., Lagabrielle, Y., Enkelmann, E., et al. (2016). Tectonic control on rock uplift, exhumation, and topography above an oceanic ridge collision: Southern Patagonian Andes (47°S). Chile. Tecton. 35, 1317–1341. doi: 10.1002/2016tc004120
Ginot, P., Kull, C., Schotterer, U., Schwikowski, M., and Gaggeler, H. W. (2006). Glacier mass balance reconstruction by sublimation induced enrichment of chemical species on Cerro Tapado (Chilean Andes). Clim. Past 2, 21–30. doi: 10.5194/cp-2-21-2006
Glasser, N. F., Harrison, S., Jansson, K. N., Anderson, K., and Cowley, A. (2011). Global sea-level contribution from the Patagonian Icefields since the Little Ice Age maximum. Nat. Geosci. 4, 303–307. doi: 10.1038/ngeo1122
Glasser, N. F., Jansson, K. N., Harrison, S., and Kleman, J. (2008). The glacial geomorphology and Pleistocene history of South America between 38°S and 56°S. Q. Sci. Rev. 27, 365–390. doi: 10.1016/j.quascirev.2007.11.011
Gourlet, P., Rignot, E., Rivera, A., and Casassa, G. (2016). Ice thickness of the northern half of the Patagonia Icefields of South America from high-resolution airborne gravity surveys. Geophys. Res. Lett. 43, 241–249. doi: 10.1002/2015GL066728
Gruber, S. (2012). Derivation and analysis of a high-resolution estimate of global permafrost zonation. Cryosphere 6, 221–233. doi: 10.5194/tc-6-221-2012
Guerrido, C. M., Villalba, R., and Rojas, F. (2014). Documentary and tree-ring evidence for a long-term interval without ice impoundments from Glaciar Perito Moreno, Patagonia, Argentina. Holocene 24, 1686–1693. doi: 10.1177/0959683614551215
Haeberli, W. (1985). Creep of Muntain Permafrost: Internal Structure and Flow of Alpine Rock Glaciers. Mitteilungen der Versuchsanstalt für Wasserbau. Zürich: ETH Zürich.
Haeberli, W., and Gruber, S. (2009). “Global warming and mountain Permafrost,” in Permafrost soils. Soil Biology, Ed. M. Rosa (Berlin: Springer Berlin Heidelberg), 205–218. doi: 10.1007/978-3-540-69371-0_14
Hammond, J. C., Saavedra, F. A., and Kampf, S. K. (2018). Global snow zone maps and trends in snow persistence 2001–2016. Int. J. Climatol. 38, 4369–4383. doi: 10.1002/joc.5674
Harris, S. A., French, H. M., Heginbottom, J. A., Johnston, G. H., Ladanyi, B., Sego, D. C., et al. (1998). Glossary of Permafrost and Related Ground Ice Terms. Ottawa, ON: National Research Council of Canada.
Harrison, S., Kargel, J. S., Huggel, C., Reynolds, J., Shugar, D. H., Betts, R. A., et al. (2018). Climate change and the global pattern of moraine-dammed glacial lake outburst floods. Cryosphere 12, 1195–1209. doi: 10.5194/tc-12-1195-2018
Hastenrath, S., and Ames, A. (1995). Recession of Yanamarey Glacier in Cordillera Blanca, Peru, during the 20th century. J. Glaciol. 41, 191–196. doi: 10.1017/s0022143000017883
Howat, I. M., Joughin, I., and Scambos, T. A. (2007). Rapid changes in ice discharge from Greenland outlet glaciers. Science 315, 1559–1561. doi: 10.1126/science.1138478
Huss, M., and Farinotti, D. (2012). Distributed ice thickness and volume of all glaciers around the globe. J. Geophys. Res. 117:F04010. doi: 10.1029/2012JF002523
Huss, M., and Hock, R. (2015). A new model for global glacier change and sea-level rise. Front. Earth Sci. 3:54. doi: 10.3389/feart.2015.00054
Huss, M., and Hock, R. (2018). Global-scale hydrological response to future glacier mass loss. Nat. Clim. Change 8, 135–140. doi: 10.1038/s41558-017-0049-x
Huss, M., Huggel, C., Jacobsen, D., Bradley, R. S., Clague, J. J., Vuille, M., et al. (2017). Toward mountains without permanent snow and ice. Earth’s Future 5, 418–435. doi: 10.1002/2016ef000514
Ianigla-Conicet, and Mayds (2018). Resumen ejecutivo de los resultados del Inventario Nacional de Glaciares. Mendoza: IANIGLA-CONICET, 27.
Iribarren, A. P., Mackintosh, A., and Norton, K. P. (2015). Hazardous processes and events from glacier and permafrost areas: lessons from the Chilean and Argentinean Andes. Earth Surf. Process. Landf. 40, 2–21. doi: 10.1002/esp.3524
Janke, J. R., Bellisario, A. C., and Ferrando, F. A. (2015). Classification of debris-covered glaciers and rock glaciers in the Andes of central Chile. Geomorphology 241, 98–121. doi: 10.1016/j.geomorph.2015.03.034
Janke, J. R., Ng, S., and Bellisario, A. (2017). An inventory and estimate of water stored in firn fields, glaciers, debris-covered glaciers, and rock glaciers in the Aconcagua River Basin, Chile. Geomorphology 296, 142–152. doi: 10.1016/j.geomorph.2017.09.002
Jones, D. B., Harrison, S., Anderson, K., and Betts, R. A. (2018). Mountain rock glaciers contain globally significant water stores. Sci. Rep. 8:2834.
Jones, D. B., Harrison, S., Anderson, K., and Whalley, W. B. (2019). Rock glaciers and mountain hydrology: a review. Earth Sci. Rev. 193, 66–90. doi: 10.1016/j.earscirev.2019.04.001
Jordan, E. (1991). Die Gletscher der Bolivianischen Anden: eine photogrammetrisch-kartographische Bestandsaufnahme der Gletscher Boliviens als Grundlage für klimatische Deutungen und Potential für die wirtschaftliche Nutzung. Stuttgart: Franz Steiner Verlag.
Jordan, E., Ungerechts, L., Caceres, B., Penafiel, A., and Francou, B. (2005). Estimation by photogrammetry of the glacier recession on the Cotopaxi Volcano (Ecuador) between 1956 and 1997. Hydrol. Sci. J. 50:94.
Kaser, G., Großhauser, M., and Marzeion, B. (2010). Contribution potential of glaciers to water availability in different climate regimes. PNAS 107, 20223–20227. doi: 10.1073/pnas.1008162107
Kaser, G., Hastenrath, S., and Ames, A. (1996). Mass balance profiles on tropical glaciers. Z. Gletscherkd. Glazialgeol. 32, 75–81.
Kaser, G., and Osmaston, H. (2002). Tropical Glaciers. New York, NY: Cambridge University Press, 207.
Koppes, M., Conway, H., Rasmussen, L., and Chernos, M. (2011). Deriving calving variations from reanalysis data and sparse observations, Glaciar San Rafael, northern Patagonia, 1950–2005. Cryosphere 5, 791–808. doi: 10.5194/tc-5-791-2011
Korona, J., Berthier, E., Bernard, M., Remy, F., and Thouvenot, E. (2009). SPIRIT. SPOT 5 stereoscopic survey of Polar Ice: reference Images and Topographies during the fourth International Polar Year (2007-2009). ISPRS J. Photogramm. 64, 204–212. doi: 10.1016/j.isprsjprs.2008.10.005
Leclercq, P. W., Pitte, P., Giesen, R. H., Masiokas, M. H., and Oerlemans, J. (2012). Modelling and climatic interpretation of the length fluctuations of Glaciar Frías (north Patagonian Andes, Argentina) 1639-2009 AD. Clim. Past 8, 1385–1402. doi: 10.5194/cp-8-1385-2012
Lejeune, Y., Bouilloud, L., Etchevers, P., Wagnon, P., Chevallier, P., Sicart, J. E., et al. (2007). Melting of snow cover in a tropical mountain environment in Bolivia: processes and modeling. J. Hydrometeorol. 8, 922–937. doi: 10.1175/jhm590.1
Lenaerts, J. T. M., Van den Broeke, M. R., Van Wessem, J. M., and Van de Berg, W. J. (2014). Extreme precipitation and climate gradients in Patagonia revealed by high-resolution regional atmospheric climate modeling. J. Clim. 27, 4607–4621. doi: 10.1175/JCLI-D-13-00579.1
Lenzano, M. G., Lannutti, E., Toth, C., Rivera, A., and Lenzano, L. (2018). Detecting glacier surface motion by optical flow. Photogrammetr. Eng. Remote Sens. 84, 33–42. doi: 10.14358/PERS.84.1.33
Lhermitte, S., Abermann, J., and Kinnard, C. (2014). Albedo over rough snow and ice surfaces. Cryosphere 8, 1069–1086. doi: 10.5194/tc-8-1069-2014
Linsbauer, A., Paul, F., and Haeberli, W. (2012). Modeling glacier thickness distribution and bed topography over entire mountain ranges with GlabTop: application of a fast and robust approach. J. Geophys. Res. 117:F03007. doi: 10.1029/2011JF002313
Liu, T., Kinouchi, T., and Ledezma, F. (2013). Characterization of recent glacier decline in the Cordillera Real by LANDSAT, ALOS, and ASTER data. Remote Sens. Environ. 137, 158–172. doi: 10.1016/j.rse.2013.06.010
Lliboutry, L. (1954). The origin of penitents. J. Glaciol. 2, 331–338. doi: 10.3189/s0022143000025181
Lliboutry, L. (1965). Traité de glaciologie, tome 2: Glaciers, variations du climat, sols gelés [Treatise of Glaciology, v. 2: Glaciers, Climatic Variations, Frozen Ground]. Paris: Masson et Cie, 612.
Lliboutry, L. (1998). “Glaciers of chile and Argentina,” in Satellite Image Atlas of Glaciers of the World, Geological Survey Professional Paper 1386-I-6, eds R. Williams and J. Ferrigno (Reston, VA: USGS)Google Scholar
Lo Vecchio, A., Lenzano, M. G., Durand, M., Lanutti, E., Bruce, R., and Lenzano, L. (2018). Estimation of surface flow speed and ice surface temperature from optical satellite imagery at Viedma glacier. Argentina. Glob. Planet. Change 169, 202–213. doi: 10.1016/j.gloplacha.2018.08.001
Lopez, P., Chevallier, P., Favier, V., Pouyaud, B., Ordenes, F., and Oerlemans, J. (2010). A regional view of fluctuations in glacier length in southern South America. Glob. Planet. Change 71, 85–108. doi: 10.1016/J.GLOPLACHA.2009.12.009
Loriaux, T., and Casassa, G. (2013). Evolution of Glacial Lakes from the Northern Patagonia Icefield and Terrestrial Water Storage in a Sea-Level Rise Context. Glob. Planet. Change 102, 33–40. doi: 10.1016/j.gloplacha.2012.12.012
MacDonell, S., Kinnard, C., Mölg, T., Nicholson, L., and Abermann, J. (2013). Meteorological drivers of sublimation and melt on a cold glacier in the semi-arid Andes of Chile. Cryosphere 7, 1513–1526. doi: 10.5194/tc-7-1513-2013
Malz, P., Meier, W., Casassa, G., Jaña, R., Skvarca, P., and Braun, M. H. (2018). Elevation and mass changes of the Southern Patagonia icefield derived from TanDEM-X and SRTM data. Remote Sens. 10:188. doi: 10.3390/rs10020188
Martinic, M. (2016). La erupción del volcán de los Gigantes (Lautaro) en 1883. Algunas consideraciones. Magallania 44, 65–68. doi: 10.4067/s0718-22442016000200003
Marzeion, B., Jarosch, A. H., and Hofer, M. (2012). Past and future sea-level change from the surface mass balance of glaciers. Cryosphere 6, 1295–1322. doi: 10.5194/tc-6-1295-2012
Masiokas, M. H., Cara, L., Villalba, R., Pitte, P., Christie, D. A., Le Quesne, C., et al. (2019). Streamflow variations across the Andes (18°-55°S) during the instrumental era. Sci. Rep. 9:17879.
Masiokas, M. H., Christie, D. A., Le Quesne, C., Pitte, P., Ruiz, L., Villalba, R., et al. (2016). Reconstructing the annual mass balance of the Echaurren Norte glacier (Central Andes, 33.5° S) using local and regional hydroclimatic data. Cryosphere 10, 927–940. doi: 10.5194/tc-10-927-2016
Masiokas, M. H., Delgado, S., Pitte, P., Berthier, E., Villalba, R., Skvarca, P., et al. (2015). Inventory and recent changes of small glaciers on the northeast margin of the South Patagonian Icefield, Argentina. J. Glaciol. 61, 511–523. doi: 10.3189/2015jog14j094
Masiokas, M. H., Rivera, A., Espizua, L. E., Villalba, R., Delgado, S., and Aravena, J. C. (2009). Glacier fluctuations in extratropical South America during the past 1000 years. Palaeogeogr. Palaeoclimatol. Palaeoecol. 281, 242–268. doi: 10.1016/j.palaeo.2009.08.006
Masiokas, M. H., Villalba, R., Luckman, B., Delgado, S., Lascano, M., and Stepanek, P. (2008). 20th century glacier recession and regional hydroclimatic changes in northwestern Patagonia. Glob. Planet. Change 60, 85–100. doi: 10.1016/j.gloplacha.2006.07.031
Masiokas, M. H., Villalba, R., Luckman, B., LeQuesne, C., and Aravena, J. C. (2006). Snowpack variations in the central Andes of Argentina and Chile, 1951-2005: large-scale atmospheric influences and implications for water resources in the region. J. Clim. 19, 6334–6352. doi: 10.1175/jcli3969.1
Masiokas, M. H., Villalba, R., Luckman, B. H., Montaña, E., Betman, E., Christie, D., et al. (2013). “Recent and historic Andean snowpack and streamflow variations and vulnerability to water shortages in central-western Argentina,” in Climate Vulnerability: Understanding and Addressing Threats to Essential Resources, Vol. 5, eds R. A. Pielke, J. Adegoke, D. Niyogi, G. Kallos, T. R. Seastedt, and F. Hossain (Amsterdam: Elsevier Inc), 213–227. doi: 10.1016/b978-0-12-384703-4.00522-0
Maussion, F., Gurgiser, W., Großhauser, M., Kaser, G., and Marzeion, B. (2015). ENSO influence on surface energy and mass balance at Shallap Glacier, Cordillera Blanca, Peru. Cryosphere 9, 1663–1683. doi: 10.5194/tc-9-1663-2015
Meier, W. J. H., Grießinger, J., Hochreuther, P., and Braun, M. H. (2018). An updated multi-temporal glacier inventory for the Patagonian Andes with changes between the Little Ice Age and 2016. Front. Earth Sci. 6:62. doi: 10.3389/feart.2018.00062
Melkonian, A. K., Willis, M. J., Pritchard, M. E., Rivera, A., Bown, F., and Bernstein, S. A. (2013). Satellite-derived volume loss rates and glacier speeds for the Cordillera Darwin Icefield, Chile. Cryosphere 7, 823–839. doi: 10.5194/tc-7-823-2013
Millan, R., Rignot, E., Rivera, A., Martineau, V., Mouginot, J., Zamora, R., et al. (2019). Ice thickness and bed elevation of the Northern and Southern Patagonian Icefields. Geophys. Res. Lett. 46, 6626–6635. doi: 10.1029/2019GL082485
Minowa, M., Sugiyama, S., Sakakibara, D., and Sawagaki, T. (2015). Contrasting glacier variations of Glaciar Perito Moreno and Glaciar Ameghino, Southern Patagonia Icefield. Ann. Glaciol. 56, 26–32. doi: 10.3189/2015AoG70A020
Monnier, S., and Kinnard, C. (2013). Internal structure and composition of a rock glacier in the Andes (upper Choapa valley, Chile) using borehole information and ground-penetrating radar. Ann. Glaciol. 54, 61–72. doi: 10.3189/2013AoG64A107
Monnier, S., and Kinnard, C. (2015). Reconsidering the glacier to rock glacier transformation problem: new insights from the central Andes of Chile. Geomorphology 238, 47–55. doi: 10.1016/j.geomorph.2015.02.025
Monnier, S., and Kinnard, C. (2016). Interrogating the time and processes of development of the Las Liebres rock glacier, central Chilean Andes, using a numerical flow model. Earth Surf. Process. Landf. 41, 1884–1893. doi: 10.1002/esp.3956
Monnier, S., and Kinnard, C. (2017). Pluri-decadal (1955–2014) evolution of glacier–rock glacier transitional landforms in the central Andes of Chile (30–33° S). Earth Surf. Dyn. 5, 493–509. doi: 10.5194/esurf-5-493-2017
Moon, T., Joughin, I., Smith, B., and Howat, I. (2012). 21st-century evolution of Greenland outlet glacier velocities. Science 336, 576–578. doi: 10.1126/science.1219985
Moragues, S. M., Lenzano, M. G., Lo Vecchio, A., Falaschi, D., and Lenzano, L. (2018). Surface velocities of Upsala Glacier, Southern Patagonian Andes using cross correlation satellite imagery: 2013-2014 Period. Andean Geol. 45, 87–103.
Morizawa, K., Asaoka, Y., Kazama, S., and Gunawardhana, L. N. (2013). Temporal glacier area changes correlated with the El Niño/La Niña Southern Oscillation using satellite imagery. Hydrol. Res. Lett. 7, 18–22. doi: 10.3178/hrl.7.18
Morris, J. N., Poole, A. J., and Klein, A. G. (2006). “Retreat of tropical glaciers in Colombia and Venezuela from 1984 to 2004 as measured from ASTER and Landsat images,” in Proceeding of the 63rd Eastern Snow Conference, Newark, 181–191.
Mouginot, J., and Rignot, E. (2015). Ice motion of the Patagonian Icefields of South America: 1984–2014. Geophys. Res. Lett. 42, 1441–1449. doi: 10.1002/2014GL062661
Muto, M., and Furuya, M. (2013). Surface velocities and ice-front positions of eight major glaciers in the southern Patagonian Ice Field, South America, from 2002 to 2011. Remote Sens. Environ. 139, 50–59. doi: 10.1016/j.rse.2013.07.034
Nicholson, L., Marín, J., Lopez, D., Rabatel, A., Bown, F., and Rivera, A. (2009). Glacier inventory of the upper Huasco valley, Norte Chico, Chile: glacier characteristics, glacier change and comparison to central Chile. Ann. Glaciol. 50, 111–118. doi: 10.3189/172756410790595787
Nicholson, L., Petlicki, M., Partan, B., and MacDonell, S. (2016). 3-D surface properties of glacier penitentes over an ablation season, measured using a Microsoft Xbox Kinect. Cryosphere 10, 1897–1913. doi: 10.5194/tc-10-1897-2016
Nogami, M. (1972). The snow line and climate during the last glacial period in the Andes mountains. Q. Res. 11, 71–80. doi: 10.4116/jaqua.11.71
Pasquini, A. I., and Depetris, P. J. (2011). Southern Patagonia’s Perito Moreno Glacier, Lake Argentino, and Santa Cruz River hydrological system: An overview. J. Hydrol. 405, 48–56. doi: 10.1016/j.jhydrol.2011.05.009
Paul, F., and Moelg, N. (2014). Hasty retreat of glaciers in northern Patagonia from 1985 to 2011. J. Glaciol. 60, 1033–1043. doi: 10.3189/2014JoG14J104
Perucca, L. P., and Esper Angillieri, M. Y. (2008). A preliminary inventory of periglacial landforms in the Andes of La Rioja and San Juan, Argentina, at about 28°S. Q. Int. 190, 171–179. doi: 10.1016/j.quaint.2007.10.007
Pitte, P. (2014). Fluctuaciones de Los Glaciares, en Los Últimos 50 años, en las Cuencas Amarillo, Turbio, Canito y Potrerillos, San Juan, Argentina (in Spanish). PhD Thesis, Universidad Nacional de Córdoba, Argentina.
Pitte, P., Berthier, E., Masiokas, M. H., Cabot, V., Ruiz, L., Ferri Hidalgo, L., et al. (2016). Geometric evolution of the Horcones Inferior Glacier (Mount Aconcagua, Central Andes) during the 2002-2006 surge. J. Geophys. Res. Earth Surf. 121, 111–127. doi: 10.1002/2015JF003522
Rabassa, J. (1981). Inventario de glaciares y cuerpos de nieve permanentes en los Andes Patagónicos Septentrionales, Argentina (in Spanish). Actas VIII Congr. Geol. Argentino Actas 4, 109–122.
Rabatel, A., Bermejo, A., Loarte, E., Soruco, A., Gomez, J., Leonardini, G., et al. (2012). Can the snowline be used as an indicator of the equilibrium line and mass balance for glaciers in the outer tropics? J. Glaciol. 58, 1027–1036. doi: 10.3189/2012JoG12J027
Rabatel, A., Castebrunet, H., Favier, V., Nicholson, L., and Kinnard, C. (2011). Glacier changes in the Pascua-Lama region, Chilean Andes (29° S): recent mass balance and 50 yr surface area variations. Cryosphere 5, 1029–1041. doi: 10.5194/tc-5-1029-2011
Rabatel, A., Ceballos, J. L., Micheletti, N., Jordan, E., Braitmeier, M., Gonzalez, J., et al. (2018a). Toward an imminent extinction of Colombian glaciers? Geografiska Annaler: Series A. Phys. Geogr. 100, 75–95. doi: 10.1080/04353676.2017.1383015
Rabatel, A., Sanchez, O., Vincent, C., and Six, D. (2018b). Estimation of glacier thickness from surface mass balance and ice flow velocities: a case study on Argentière Glacier, France. Front. Earth Sci. 6:112. doi: 10.3389/feart.2018.00112
Rabatel, A., Francou, B., Soruco, A., Gomez, B., Caceres, J. L., Ceballos, R., et al. (2013). Current state of glaciers in the tropical Andes: a multi-century perspective on glacier evolution and climate change. Cryosphere 7, 81–102. doi: 10.5194/tc-7-81-2013
Radić, V., and Hock, R. (2014). Glaciers in the Earth’s hydrological cycle. Assessments of glacier mass and runoff changes on global and regional scales. Surv. Geophys. 35, 813–837. doi: 10.1007/s10712-013-9262-y
Rangecroft, S., Harrison, S., and Anderson, K. (2015). Rock glaciers as water stores in the Bolivian Andes: an assessment of their hydrological importance. Arctic Antarctic Alpine Res. 47, 89–98. doi: 10.1657/AAAR0014-029
Rangecroft, S., Harrison, S., Anderson, K., Magrath, J., Castel, A. P., and Pacheco, P. (2013). Climate change and water resources in arid mountains: an example from the Bolivian Andes. AMBIO 42, 852–863. doi: 10.1007/s13280-013-0430-6
Rangecroft, S., Harrison, S., Anderson, K., Magrath, J., Castel, A. P., and Pacheco, P. (2014). A first rock glacier inventory for the Bolivian Andes. Permafrost Periglacial Process. 25, 333–343. doi: 10.1002/ppp.1816
Raup, B. H., Kieffer, H. H., Hare, T. M., and Kargel, J. S. (2000). Generation of data acquisition requests for the ASTER satellite instrument for monitoring a globally distributed target: glaciers. IEEE Trans. Geosci. Remote Sens. 38, 1105–1112.
Reinthaler, J., Paul, F., Granados, H., Rivera, A., and Huggel, C. (2019). Area changes of glaciers on active volcanoes in Latin America between 1986 and 2015 observed from multi-temporal satellite imagery. J. Glaciol. 65, 542–556. doi: 10.1017/jog.2019.30
Réveillet, M., MacDonell, S., Gascoin, S., Kinnard, C., Lhermitte, S., and Schaffer, N. (2020). Impact of forcing on sublimation simulations for a high mountain catchment in the semiarid Andes. Cryosphere 14, 147–163. doi: 10.5194/tc-14-147-2020
Réveillet, M., Rabatel, A., Gillet-Chaulet, F., and Soruco, A. (2015). Simulations of changes to Glacier Zongo, Bolivia (16S), over the 21st century using a 3-D full-Stokes model and CMIP5 climate projections. Ann. Glaciol. 56, 89–97. doi: 10.3189/2015aog70a113
RGI Consortium (2017). Randolph Glacier Inventory – A Dataset of Global Glacier Outlines: Version 6.0. Technical Report, Global Land Ice Measurements from Space, Colorado, doi: 10.7265/N5-RGI-60
Ribeiro, R., Simões, J. C., and Bremer, U. F. (2005). “Application of remote sensing in the estimate of the retraction of the Bolivian glaciers,” in Proceedings of XIIth Brazilian Remote Sensing Symposium, Goiânia, 669–671.
Ribeiro, R. D. R., Ramirez, E., Simões, J. C., and Machaca, A. (2013). 46 years of environmental records from the Nevado Illimani glacier group, Bolivia, using digital photogrammetry. Ann. Glaciol. 54, 272–278. doi: 10.3189/2013aog63a494
Rignot, E., Rivera, A., and Casassa, G. (2003). Contribution of the Patagonia Icefields of South America to Sea Level Rise. Science 302, 434–437. doi: 10.1126/science.1087393
Rivera, A. (2018). Glaciar Pío XI: La excepción a la tendencia de desglaciación en Patagonia. Rev. Geogr. Chile Terra Aust. 54, 1–12. doi: 10.23854/07199562.2018541rivera1
Rivera, A. (2019). “Los glaciares de Chile central a seis décadas de los trabajos de Louis Lliboutry,” in El Hombre Que Descifró los Glaciares Louis Lliboutry, ed. M. Turrel (Santiago: Aguas Andinas), 250–255.
Rivera, A., and Bown, F. (2013). Recent glacier variations on active ice capped volcanoes in the Southern Volcanic Zone (37° 46°S), Chilean Andes. J. South Am. Earth Sci. 45, 345–356. doi: 10.1016/j.jsames.2013.02.004
Rivera, A., Bown, F., Napoleoni, F., Muñoz, C., and Vuille, M. (2016). Balance de Masa Glaciar. Valdivia: Ediciones CECs, 203.
Rivera, A., Bown, F., Carrión, D., and Zenteno, P. (2012a). Glacier responses to recent volcanic activity in Southern Chile. Environ. Res. Lett. 7:014036. doi: 10.1088/1748-9326/7/014036
Rivera, A., Corripio, J., Bravo, C., and Cisternas, S. (2012b). Glaciar Jorge Montt dynamics derived from photos obtained by fixed cameras and satellite image feature tracking. Ann. Glaciol. 53, 147–155. doi: 10.3189/2012aog60a152
Rivera, A., Koppes, M., Bravo, C., and Aravena, J. (2012c). Little Ice Age advance and retreat of Glaciar Jorge Montt, Chilean Patagonia. Clim. Past 8, 403–414. doi: 10.5194/cp-8-403-2012
Rivera, J. A., Penalba, O. C., Villalba, R., and Araneo, D. C. (2017). Spatio-temporal patterns of the 2010–2015 extreme hydrological drought across the Central Andes, Argentina. Water 9:652. doi: 10.3390/w9090652
Ruiz, L., Berthier, E., Masiokas, M., Pitte, P., and Villalba, R. (2015). First surface velocity maps for glaciers of Monte Tronador, North Patagonian Andes, derived from sequential Pléiades satellite images. J. Glaciol.gy 61, 908–922. doi: 10.3189/2015JoG14J134
Ruiz, L., Masiokas, M. H., and Villalba, R. (2012). Fluctuations of Glaciar Esperanza Norte in the north Patagonian Andes of Argentina during the past 400 yr. Clim. Past 8, 1079–1090. doi: 10.5194/cp-8-1079-2012
Ruiz, L., and Trombotto, D. (2012). “Mountain permafrost distribution in the Andes of Chubut (Argentina) based on a statistical model,” in Proceedings of the 10th International Permafrost Conference, Salekhard, 365–370.
Saavedra, F. A., Kampf, S. K., Fassnacht, S. R., and Sibold, J. S. (2017). A snow climatology of the Andes Mountains from MODIS snow cover data. Int. J. Climatol. 37, 1526–1539. doi: 10.1002/joc.4795
Saavedra, F. A., Kampf, S. K., Fassnacht, S. R., and Sibold, J. S. (2018). Changes in Andes snow cover from MODIS data, 2000–2016. Cryosphere 12, 1027–1046. doi: 10.5194/tc-12-1027-2018
Sagredo, E. A., and Lowell, T. V. (2012). Climatology of Andean glaciers: a framework to understand glacier response to climate change. Glob. Planet. Change 8, 101–109. doi: 10.1016/j.gloplacha.2012.02.010
Sakakibara, D., and Sugiyama, S. (2014). Ice-front variations and speed changes of calving glaciers in the southern patagonia icefield from 1984 to 2011. J. Geophys. Res. Earth Surf. 119, 2541–2554. doi: 10.1002/2014JF003148
Sakakibara, D., Sugiyama, S., Sawagaki, T., Marinsek, S., and Skvarca, P. (2013). Rapid retreat, acceleration, and thinning of Glaciar Upsala in the Southern Patagonia Icefield, initiated in 2008. Ann. Glaciol. 54, 131–138. doi: 10.3189/2013aog63a236
Salzmann, N., Huggel, C., Rohrer, M., Silverio, W., Mark, B. G., Burns, P., et al. (2013). Glacier changes and climate trends derived from multiple sources in the data scarce Cordillera Vilcanota region, southern Peruvian Andes. Cryosphere 7, 103–118. doi: 10.5194/tc-7-103-2013
Sanches, A. M. (2013). Variações na extensão da cobertura de gelo do Nevado Cololo, Bolívia. Doctoral dissertation, Federal University of Rio Grande do Sul, Porto Alegre.
Schaefer, M., MacHguth, H., Falvey, M., and Casassa, G. (2013). Modeling past and future surface mass balance of the Northern Patagonia icefield. J. Geophys. Res. Earth Surf. 118, 571–588. doi: 10.1002/jgrf.20038
Schaefer, M., MacHguth, H., Falvey, M., Casassa, G., and Rignot, E. (2015). Quantifying mass balance processes on the Southern Patagonia icefield. Cryosphere 9, 25–35. doi: 10.5194/tc-9-25-2015
Schaeffer, M., Rodriguez, J., Scheiter, M., and Casassa, G. (2017). Climate and surface mass balance of Mocho Glacier, Chilean Lake District, 40°S. J. Glaciol. 63, 218–228. doi: 10.1017/jog.2016.129
Schaffer, N., MacDonell, S., Réveillet, M., Yáñez, E., and Valois, R. (2019). Rock glaciers as a water resource in the semiarid Chilean Andes in a changing climate. Reg. Environ. Change 19, 1263–1279. doi: 10.1007/s10113-018-01459-1453
Schoolmeester, T., Johansen, K. S., Alfthan, B., Baker, E.\, Hesping, M., and Verbist, K. (2018). The Andean Glacier and Water Atlas – The Impact of Glacier Retreat on Water Resources. Arendal: UNESCO and GRID-Arendal. Available online at: https://unesdoc.unesco.org/ark:/48223/pf0000265810
Schneider, C., Schnirch, M., Acuña, C., Casassa, G., and Kilian, R. (2007). Glacier inventory of the Gran Campo Nevado Ice Cap in the Southern Andes and glacier changes observed during recent decades. Glob. Planet. Change 59, 87–100. doi: 10.1016/j.gloplacha.2006.11.023
Sicart, J. E., Hock, R., Ribstein, P., Litt, M., and Ramirez, E. (2011). Analysis of seasonal variations in mass balance and meltwater discharge of the Tropical Zongo Glacier by application of a distributed energy balance model. J. Geophys. Res. 116:D13105. doi: 10.1029/2010JD015105
Sicart, J. E., Wagnon, P., and Ribstein, P. (2005). Atmospheric controls of heat balance of Zongo Glacier (16°S. Bolivia). J. Geophys. Res. 110:D12106. doi: 10.1029/2004JD005732
Sinclair, K., and MacDonell, S. (2016). Seasonal evolution of penitente geochemistry at Tapado Glacier, northern Chile. Hydrol. Process. 30, 176–186. doi: 10.1002/hyp.10531
Soruco, A., Vincent, C., Francou, B., Ribstein, P., Berger, T., Sicart, J. E., et al. (2009). Mass balance of Glaciar Zongo, Bolivia, between 1956 and 2006, using glaciological, hydrological and geodetic methods. Ann. Glaciol. 50:2009.
Soruco, A., Vincent, C., Rabatel, A., Francou, B., Thibert, E., Sicart, J. E., et al. (2015). Impacts of glacier shrinkage on water resources of La Paz city, Bolivia (16°S). Ann. Glaciol. 56, 147–154. doi: 10.3189/2015AoG70A001
Sugiyama, S., Skvarca, P., Naito, N., Enomoto, H., Tsutaki, S., Tone, K., et al. (2011). Ice speed of a calving glacier modulated by small fluctuations in basal water pressure. Nature Geosci. 4, 597–600. doi: 10.1038/ngeo1218
Troll, C. (1941). Studien zur Vergleichenden Geographie der Hochgebirge der Erde. Bonn: Bonner Mitteilungen, 1941.
Trombotto, L. (2014). Environmental Status of the Cryogenic Permafrost Conditions in the Last Decade in the Central Andes, one Example. Mendoza: IANIGLA – CCT CONICET, 27–29.
Trombotto Liaudat, D. (2000). Survey of cryogenic processes, periglacial forms and permafrost conditions in South America. Rev. Inst. Geol. 21, 33–55. doi: 10.5935/0100-929X.20000004
Trombotto Liaudat, D., Wainstein, P., and Arenson, L. (2014). Guía Terminológica de la Geocriología Sudamericana. Buenos Aires: Vazquez Mazzini.
UGRH (2010). Unidad de Glaciología y Recursos Hídricos [UGRH]: Inventario de glaciares, Cordillera Blanca, Perú. Huaraz: Autoridad Nacional del Agua, 81.
Veettil, B. K., and Kamp, U. (2017). Remote sensing of glaciers in the tropical Andes: a review. Int. J. Remote Sens. 38, 7101–7137. doi: 10.1080/01431161.2017.1371868
Veettil, B. K., Wang, S., Simões, J. C., and Pereira, S. F. R. (2018). Glacier monitoring in the eastern mountain ranges of Bolivia from 1975 to 2016 using Landsat and Sentinel-2 data. Environ. Earth Sci. 77:452.
Viale, M., Bianchi, E., Cara, L., Ruiz, L. E., Villalba, R., Pitte, P., et al. (2019). Contrasting climates at both sides of the Andes in Argentina and Chile. Front. Environ. Sci. 7:69. doi: 10.3389/fenvs.2019.00069
Villalba, R., Leiva, J., Rubulls, S., Suarez, J., and Lenzano, L. (1990). Climate, Tree-Ring, and Glacial Fluctuations in the Rio Frias Valley, Rio Negro, Argentina. Arctic Alpine Res. 22, 215–232. doi: 10.2307/1551585
Villarroel, C., Carrasco, J., Casassa, G., and Falvey, M. (2013). Modeling near-surface air temperature and precipitation using WRF with 5-km resolution in the Northern Patagonia Icefield: a pilot simulation. Int. J. Geosci. 4, 1193–1199. doi: 10.4236/ijg.2013.48113
Vincent, C., Soruco, A., Azam, F., Basantes-Serrano, R., Jackson, M., Kjollmoen, B., et al. (2018). A non-linear statistical model for extracting a climatic signal from glacier mass-balance measurements. J. Geosphys. Res. Earth Surf. 123, 2228–2242. doi: 10.1029/2018JF004702
Vuille, M., Carey, M., Huggel, C., Buytaert, W., Rabatel, A., Jacobsen, D., et al. (2018). Rapid decline of snow and ice in the tropical Andes–Impacts, uncertainties and challenges ahead. Earth Sci. Rev. 176, 195–213. doi: 10.1016/j.earscirev.2017.09.019
Wagnon, P., Lafaysse, M., Lejeune, Y., Maisincho, L., Rojas, M., and Chazarin, J. P. (2009). Understanding and modeling the physical processes that govern the melting of snow cover in a tropical mountain environment in Ecuador. J. Geophys. Res. 114:D19113. doi: 10.1029/2009JD012292
Wagnon, P., Ribstein, P., Francou, B., and Sicart, J. E. (2001). Anomalous heat and mass balance budget of Glaciar Zongo, Bolivia, during the 1997/98, El Nino year. J. Glaciol. 47, 21–28. doi: 10.3189/172756501781832593
Warren, C., and Sugden, D. (1993). The Patagonian icefields: a glaciological review. Arctic Alpine Res. 25, 316–331.
Weidemann, S., Sauter, T., Schneider, L., and Schneider, C. (2013). Impact of two conceptual precipitation downscaling schemes on mass-balance modeling of Gran Campo Nevado ice cap, Patagonia. J. Glaciol. 59, 1106–1116. doi: 10.3189/2013JoG13J046
Weidemann, S. S., Sauter, T., Kilian, R., Steger, D., Butorovic, N., and Schneider, C. (2018b). A 17-year Record of Meteorological Observations Across the Gran Campo Nevado Ice Cap in Southern Patagonia, Chile, Related to Synoptic Weather Types and Climate Modes. Front. Earth Sci. 6:53. doi: 10.3389/feart.2018.00053
Weidemann, S. S., Sauter, T., Malz, P., Jaña, R., Arigony-Neto, J., Casassa, G., et al. (2018a). Glacier mass changes of lake-terminating grey and tyndall glaciers at the southern patagonia icefield derived from geodetic observations and energy and mass balance modeling. Front. Earth Sci. 6:81. doi: 10.3389/feart.2018.00081
Welty, E., Zemp, M., Navarro, F., Huss, M., Fürst, J. J., Gärtner-Roer, I., et al. (2020). Worldwide version-controlled database of glacier thickness observations. Earth Syst. Sci. Data Discuss. (in press). doi: 10.5194/essd-2020-87
White, A., and Copland, L. (2015). Decadal-Scale Variations in Glacier Area Changes Across the Southern Patagonian Icefield Since the 1970s. Arctic Antarctic Alpine Res. 47, 147–167. doi: 10.1657/AAAR0013-102
Willis, M., Melkonian, A., Pritchard, M., and Rivera, A. (2012a). Ice loss from the Southern Patagonian Ice Field, South America, between 2000 and 2012. Geophys. Res. Lett. 39, L17501. doi: 10.1029/2012GL053136
Willis, M. J., Melkonian, A. K., Pritchard, M. E., and Ramage, J. M. (2012b). Ice loss rates at the Northern Patagonian Ice Field derived using a decade of satellite remote sensing. Remote Sens. Environ. 117, 184–198. doi: 10.1016/j.rse.2011.09.017
Wilson, R., Carrión, D., and Rivera, A. (2016). Detailed dynamic, geometric and supraglacial moraine data for Glaciar Pio XI, the only surge-type glacier of the Southern Patagonia Icefield. Ann. Glaciol. 57, 119–130. doi: 10.1017/aog.2016.32
Wilson, R., Glasser, N. F., Reynolds, J. M., Harrison, S., Iribarren Anacona, P., Schaefer, M., et al. (2018). Glacial lakes of the Central and Patagonian Andes. Glob. Planet. Change 162, 275–291. doi: 10.1016/j.gloplacha.2018.01.004
Worni, R., Stoffel, M., Huggel, C., Volz, C., Casteller, A., and Luckman, B. (2012). Analysis and dynamic modeling of a moraine failure and glacier lake outburst flood at Ventisquero Negro, Patagonian Andes (Argentina). J. Hydrol. 444–445, 134–145. doi: 10.1016/j.jhydrol.2012.04.013
Wouters, B., Gardner, A. S., and Moholdt, G. (2019). Global Glacier Mass Loss During the GRACE Satellite Mission (2002-2016). Front. Earth Sci. 7:96. doi: 10.3389/feart.2019.00096
Yarleque, C., Vuille, M., Hardy, D. R., Timm, O. E., De la Cruz, J., Ramos, H., et al. (2018). Projections of future disappearance of the Quelccaya, the largest tropical ice cap on Earth. Nat. Sci. Rep. 8:15564.
Zalazar, L., Ferri Hidalgo, L., Castro, M., Gargantini, H., Giménez, M., Pitte, P., et al. (2017). Glaciares de Argentina: Resultados Preliminares del Inventario Nacional de Glaciares. Rev. Glac. Ecosist. Montaña 2, 13–22.
Zamora, R. J., Uribe, J., and Rivera, O. A. (2017). “Ice thickness surveys of the Southern Patagonian Ice Field using a low frequency ice penetrating radar system,” in Proceedings of the First IEEE International Symposium of Geoscience and Remote Sensing (GRSS-CHILE), Valdivia, doi: 10.1109/GRSS-CHILE.2017.7996003
Zemp, M., Huss, M., Thibbert, E., and Cogley, J. G. (2019). Global glacier mass changes and their contributions to sea-level rise from 1961 to 2016. Nature 568:E9. doi: 10.1038/s41586-019-
Keywords: glaciers, mountain permafrost, seasonal snow, Andes Cordillera, tropical Andes, southern Andes
Citation: Masiokas MH, Rabatel A, Rivera A, Ruiz L, Pitte P, Ceballos JL, Barcaza G, Soruco A, Bown F, Berthier E, Dussaillant I and MacDonell S (2020) A Review of the Current State and Recent Changes of the Andean Cryosphere. Front. Earth Sci. 8:99. doi: 10.3389/feart.2020.00099
Received: 09 October 2019; Accepted: 20 March 2020;
Published: 23 June 2020.
Edited by:
Bryan G. Mark, The Ohio State University, United StatesReviewed by:
Tom Holt, Aberystwyth University, United KingdomLukas Arenson, BGC Engineering, Canada
Copyright © 2020 Masiokas, Rabatel, Rivera, Ruiz, Pitte, Ceballos, Barcaza, Soruco, Bown, Berthier, Dussaillant and MacDonell. This is an open-access article distributed under the terms of the Creative Commons Attribution License (CC BY). The use, distribution or reproduction in other forums is permitted, provided the original author(s) and the copyright owner(s) are credited and that the original publication in this journal is cited, in accordance with accepted academic practice. No use, distribution or reproduction is permitted which does not comply with these terms.
*Correspondence: M. H. Masiokas, bW1hc2lva2FzQG1lbmRvemEtY29uaWNldC5nb2IuYXI=