 Ekaterina Kazachkina1*
 Vladimir Kostoglodov1
 Nathalie Cotte2
 Andrea Walpersdorf2
 Maria Teresa Ramirez-Herrera3
 Krzysztof Gaidzik3,4
 Allen Husker1Jose Antonio Santiago1
- 1Instituto de Geofísica, Departmento de Sismología, Universidad Nacional Autónoma de México, Ciudad Universitaria, Mexico City, Mexico
- 2Université Grenoble Alpes, Université Savoie Mont Blanc, Centre National de Recherche Scientifique, Institut de Recherche pour le Développement, Institut Français des Sciences et Technologies des Transports, de l’Aménagement et des Réseaux, Institut de Sciences de la Terre, Grenoble, France
- 3Laboratorio de Tsunami y Paleosismología, Instituto de Geografía, Universidad Nacional Autónoma de México, Ciudad Universitaria, Mexico City, Mexico
- 4Institute of Earth Sciences, University of Silesia, Sosnowiec, Poland
New estimates of long-term velocities of permanent GPS stations in Southern Mexico reveal that the geologically discernible ∼650-km long shear zone, which strikes parallel to the Middle America trench, is active. This left-lateral strike-slip, La Venta–Chacalapa (LVC) fault system, is apparently associated with a motion of the Xolapa terrain and at the present time is the northern boundary of a ∼110–160-km wide forearc sliver with a sinistral motion of 3–6 mm/year with respect to the North America plate. This sliver is the major tectonic feature in the Guerrero and Oaxaca regions, which accommodates most of the oblique component of the convergence between the Cocos and North America plates. Previous studies based purely on the moment tensor coseismic slips exceedingly overestimated the sliver inland extent and allocated its northern margin on or to the north of the Trans-Mexican Volcanic Belt. While the LVC fault system probably slips slowly over geologic scale time and there is not any historic evidence of large earthquakes on the fault so far, its seismic potential could be very high, assuming a feasible order of ∼103 years recurrence cycle. A detailed analysis of long-term position time series of permanent GPS stations in the Guerrero and Oaxaca states, Southern Mexico discards previous models and provides clear evidence of an active LVC fault zone bounding the Xolapa forearc sliver. The southeastward motion of this sliver may have persisted for the last ∼8–10 Million year and played an important role in the tectonic evolution of the region.
Introduction
The existence of a forearc sliver with contemporary sinistral motion with respect to the stable North America plate (wrt NA) should be expected as a result of the strain partitioning produced by oblique subduction of the Cocos plate (CO). Geological studies indicate the sinistral transpression during Late Cretaceous to Early Tertiary in the coastal area of the present-day southern Mexico (Cerca et al., 2007). Significant left-lateral strike-slip motion characterized by the mylonitization of the Xolapa metamorphic complex (Campa and Coney, 1983) was dated as Early Eocene in the La Venta (Solari et al., 2007) and as Oligocene in the Chacalapa shear zones (Tolson, 2005). Nonetheless, there was not any evidence of the ongoing tectonic activity on the La Venta–Chacalapa (LVC) fault system (Ramírez-Herrera et al., 2018) or on other trench-parallel faults in the central Mexico, except the Central Trans-Mexican Volcanic Belt (TNVB; Suter et al., 1992).
Sliver models (e.g., McCaffrey, 1992) provide simple methods to appraise the forearc deformation and relative sliver velocity using slip vectors of shallow subduction thrust earthquakes. Nevertheless, these models are unable to restrict the geometry and location of strike-slip fault zones bordering slivers. One attempt to use this technique for the subduction zone in central Mexico was the study of Ego and Ansan (2002). Using focal mechanisms of thrust earthquakes corresponding to the seismogenic segment of the plate interface they considered the left-lateral slip rate of the forearc to be less than 8 mm/year. As the only known active E–W fault zone with left-lateral transtensive deformation was in the Central TNVB, the northern limit of the forearc sliver has been assigned to this fault zone, which is located as far as ∼350–380 km from the Middle America trench (MAT). A further study by Andreani et al. (2008), proposed that this sliver, the so-called “Southern Mexico Block,” undergoes a counterclockwise rotation wrt NA and may be not related to oblique subduction.
To ascertain that the LVC fault system is tectonically active and represents the northern boundary of the forearc Xolapa sliver in Southern Mexico we analyzed continuous GPS data collected since 1997 at permanent GNSS networks in the Guerrero and Oaxaca areas. Long-term GPS velocities definitely indicate a left-lateral strike-slip motion across the fault zone with the rate of 3–6 mm/year. This result agrees with revised estimates of the sliver speed obtained from slip vectors of the subduction thrust earthquakes. An overall stretching of the forearc of ∼40 km between the Michoacan and Guerrero regions may be produced by a relative to the Michoacan sinistral retreat of the Xolapa sliver. Supposing that the Cocos–North America convergence conditions have not radically changed since the Late Miocene time, the reactivation of the LVC fault system could have occurred some ∼8–10 Ma ago.
Data and Analysis
GPS Observations
The data used in this study (Figure 1) are 5–16 years of continuous measurements on the permanent GPS stations operated by the Instituto de Geofísica, UNAM, and one station, TOL2, of the Instituto Nacional de Estadística y Geografía, INEGI. To establish the reference frame ITRF2008 (Altamimi et al., 2011) we added also the data from several global IGS (International GNSS Service) GPS stations. The total GPS dataset was processed with the GAMIT-GLOBK software (version 10.60, Herring et al., 2015). Modeling of environmental effects on the GPS measurements (see Vergnolle et al., 2010) decreased notably the noise in the position time series. Years-lasting GPS observations are essential in the presence of periodic signals (e.g., Blewitt and Lavallée, 2002) to estimate secular tectonic deformations and velocities. This is of particular importance in the Guerrero and Oaxaca areas, where large subduction slow slip events (SSE) are happening regularly, about every 4 and 1 year, respectively (e.g., Cotte et al., 2009; Graham et al., 2016).
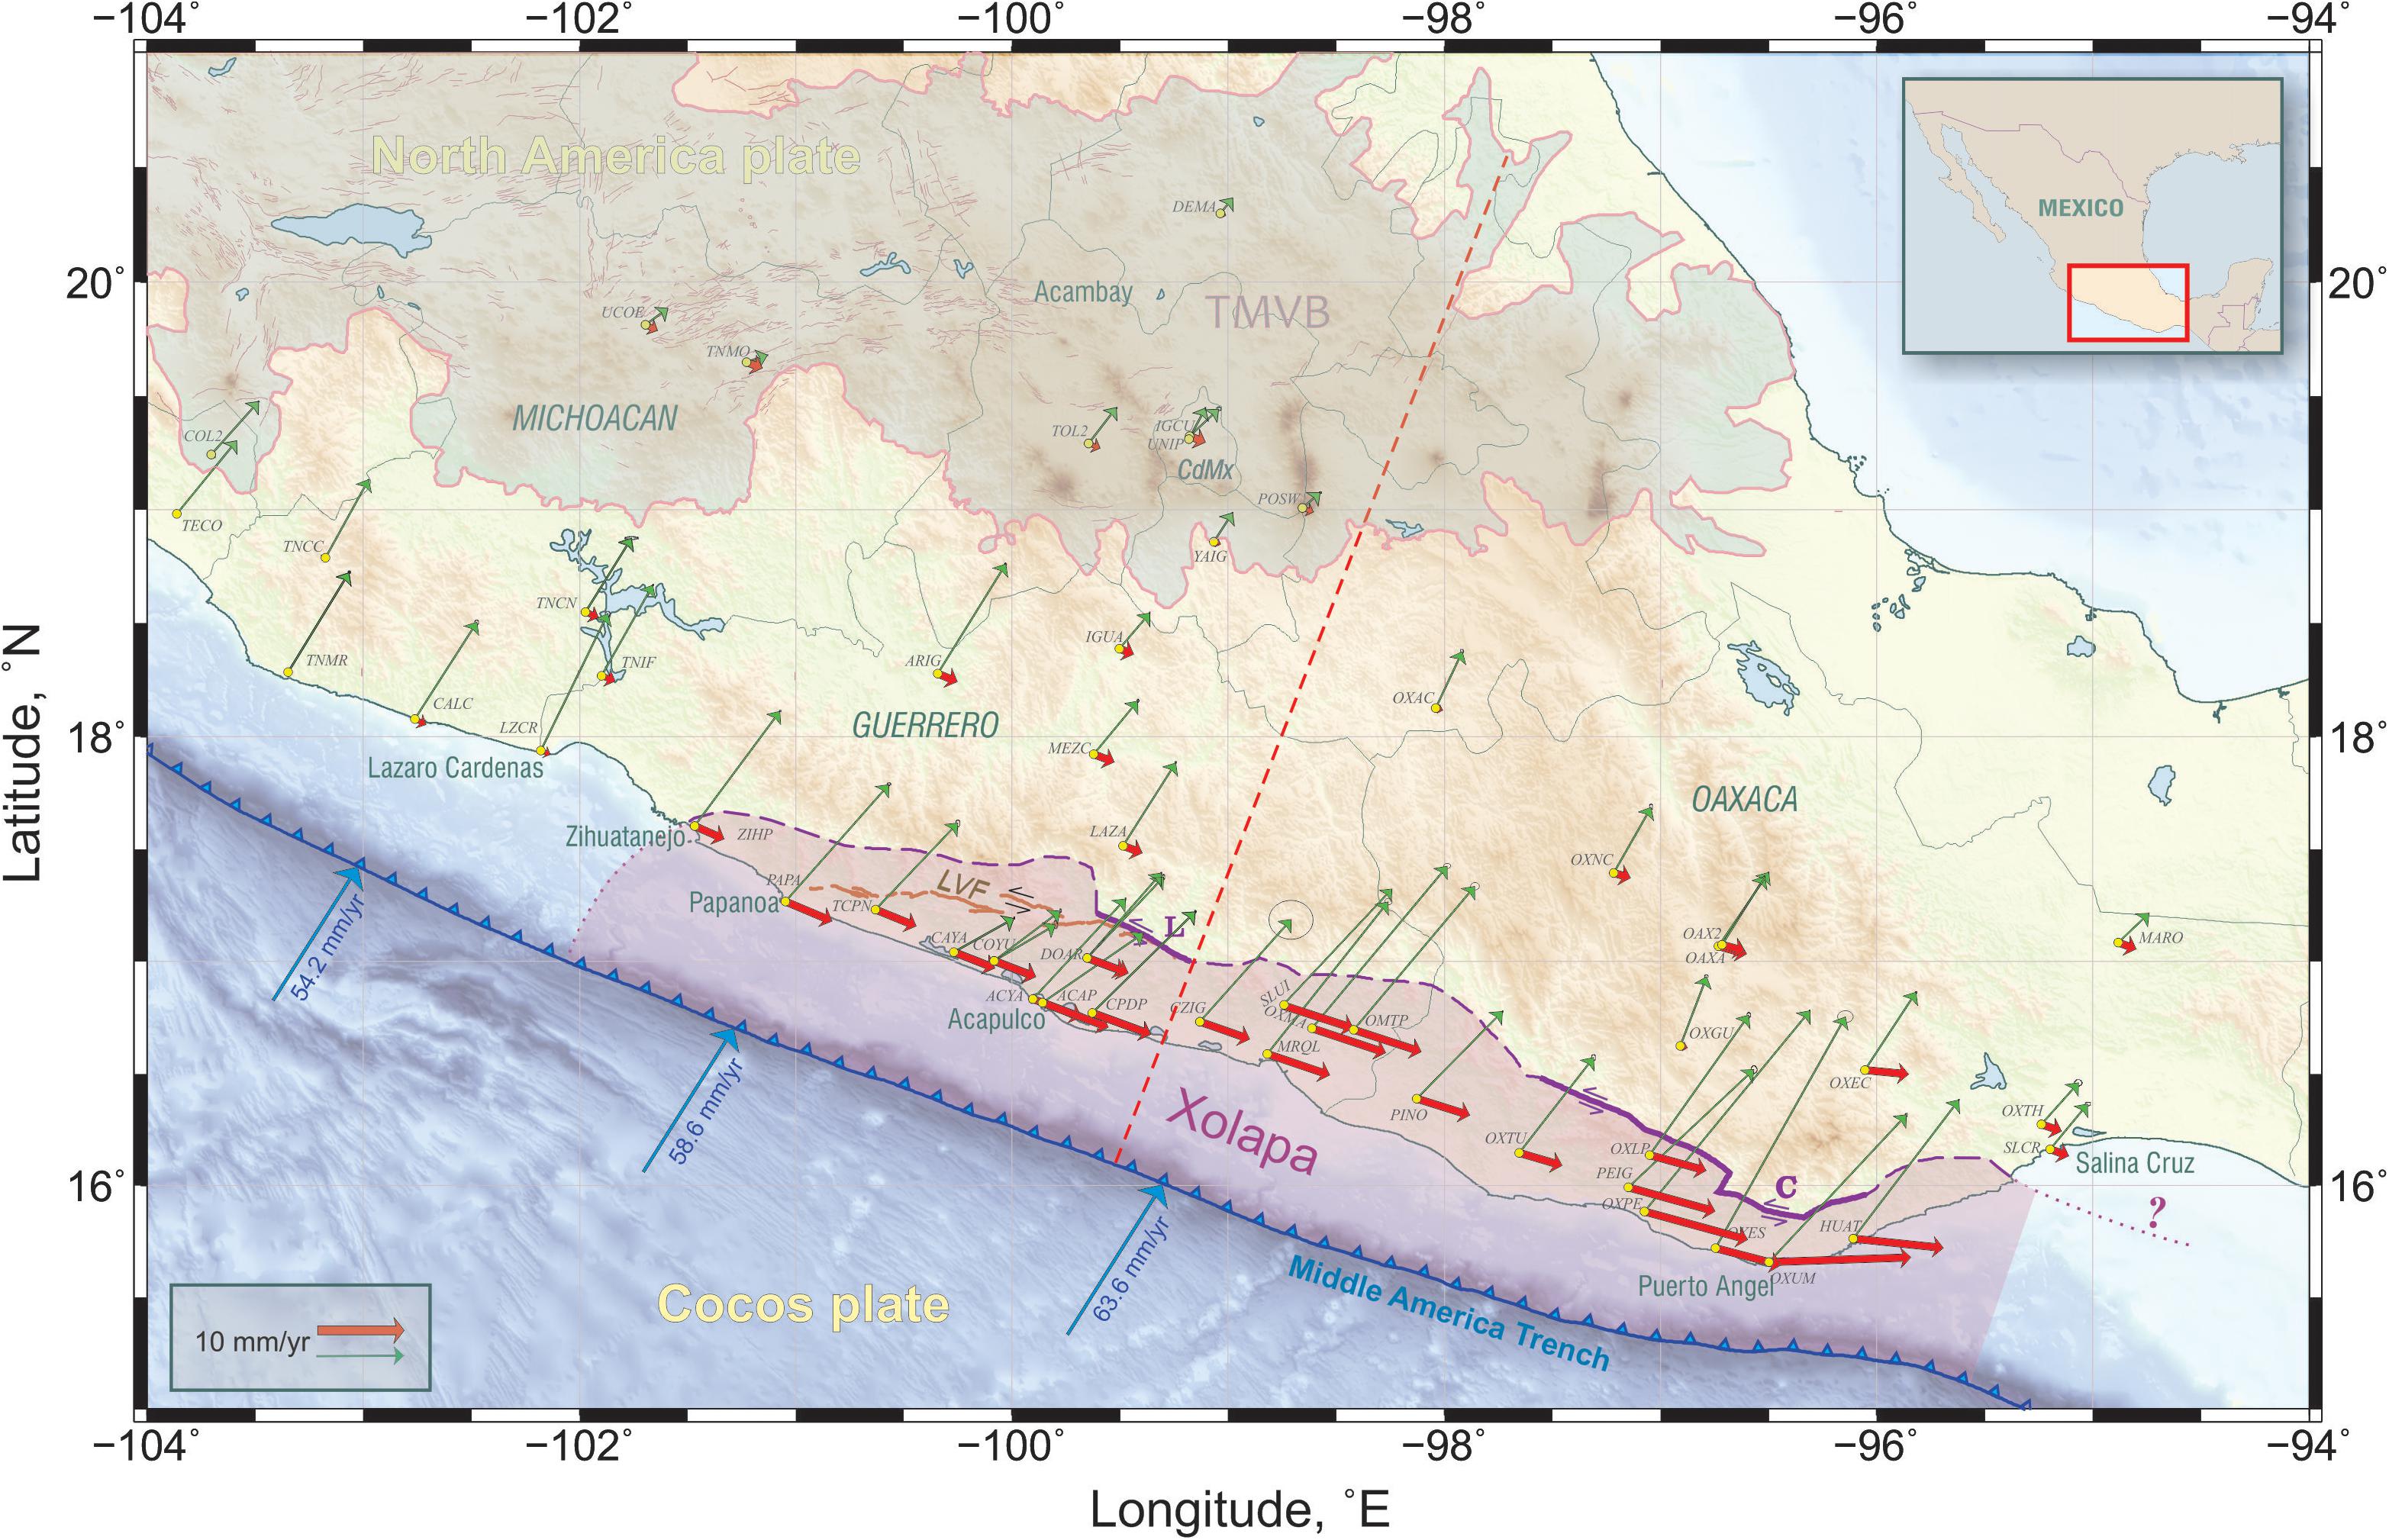
Figure 1. The study area (Inset) and location of permanent GPS stations (small yellow circles). Secular GPS velocities (wrt North America plate, mm/year) are shown as green vectors, and red vectors are their oblique components (parallel to the MAT). The solid-dashed purple line delineates the La Venta–Chacalapa (LVC) fault zone according to Tolson (2005). L, La Venta segment (Solari et al., 2007). C, Chacalapa segment (Tolson, 2005). The segmented dark brown line is a trace of the LVF according to Gaidzik et al. (2016). An abrupt decrease of the secular oblique velocity is noticeable across the LVC fault zone (Ramírez-Herrera et al., 2018), which is roughly the northern border of the Xolapa allochthonous terraine (XOLAPA, shaded area located between the MAT and the LVC). Blue vectors are the Cocos–North America PVEL convergence velocities (DeMets et al., 2010) at the MAT. The red dashed line normal to the MAT specifies the horizontal axis of a cross-section shown in Figures 2, 3. The gray shaded region to the north of 19°N shows the Trans Mexican Volcanic Belt (TMVB) with a dense E–W extended fault cluster [adapted from Ferrari et al. (2012)]. The fault sequence mapped close to the Acambay area is the northern margin of the sliver proposed by Ego and Ansan (2002).
For several GPS stations in the Michoacan state we used already processed position time series from the Tlalocnet network, downloaded from the UNAVCO1.
Secular GPS velocities, VS, were calculated by weighted least-square linear fit to the time series at each station. To avoid the effect of recent large subduction thrust earthquakes, we subtracted beforehand corresponding coseismic displacements of the 2014 Papanoa, Mw 7.3 event (Unam_Seismology_Group, 2015) from the time series in Guerrero and truncated the Oaxaca time series by the date of the 2012 Ometepec, Mw 7.5 earthquake (Unam_Seismology_Group, 2013). Figure 2 demonstrates an example of linear fits to the CAYA northern time series affected by several large quasiperiodic SSEs. Of course, in this extreme case the SSEs produce very large displacements and resulting VSN value varies within some ∼10% depending on the end bound of the fitting window. For the Oaxaca time series, an effect of the SSE on the VS is relatively smaller because of slow events smaller displacement and their shorter recurrence period.
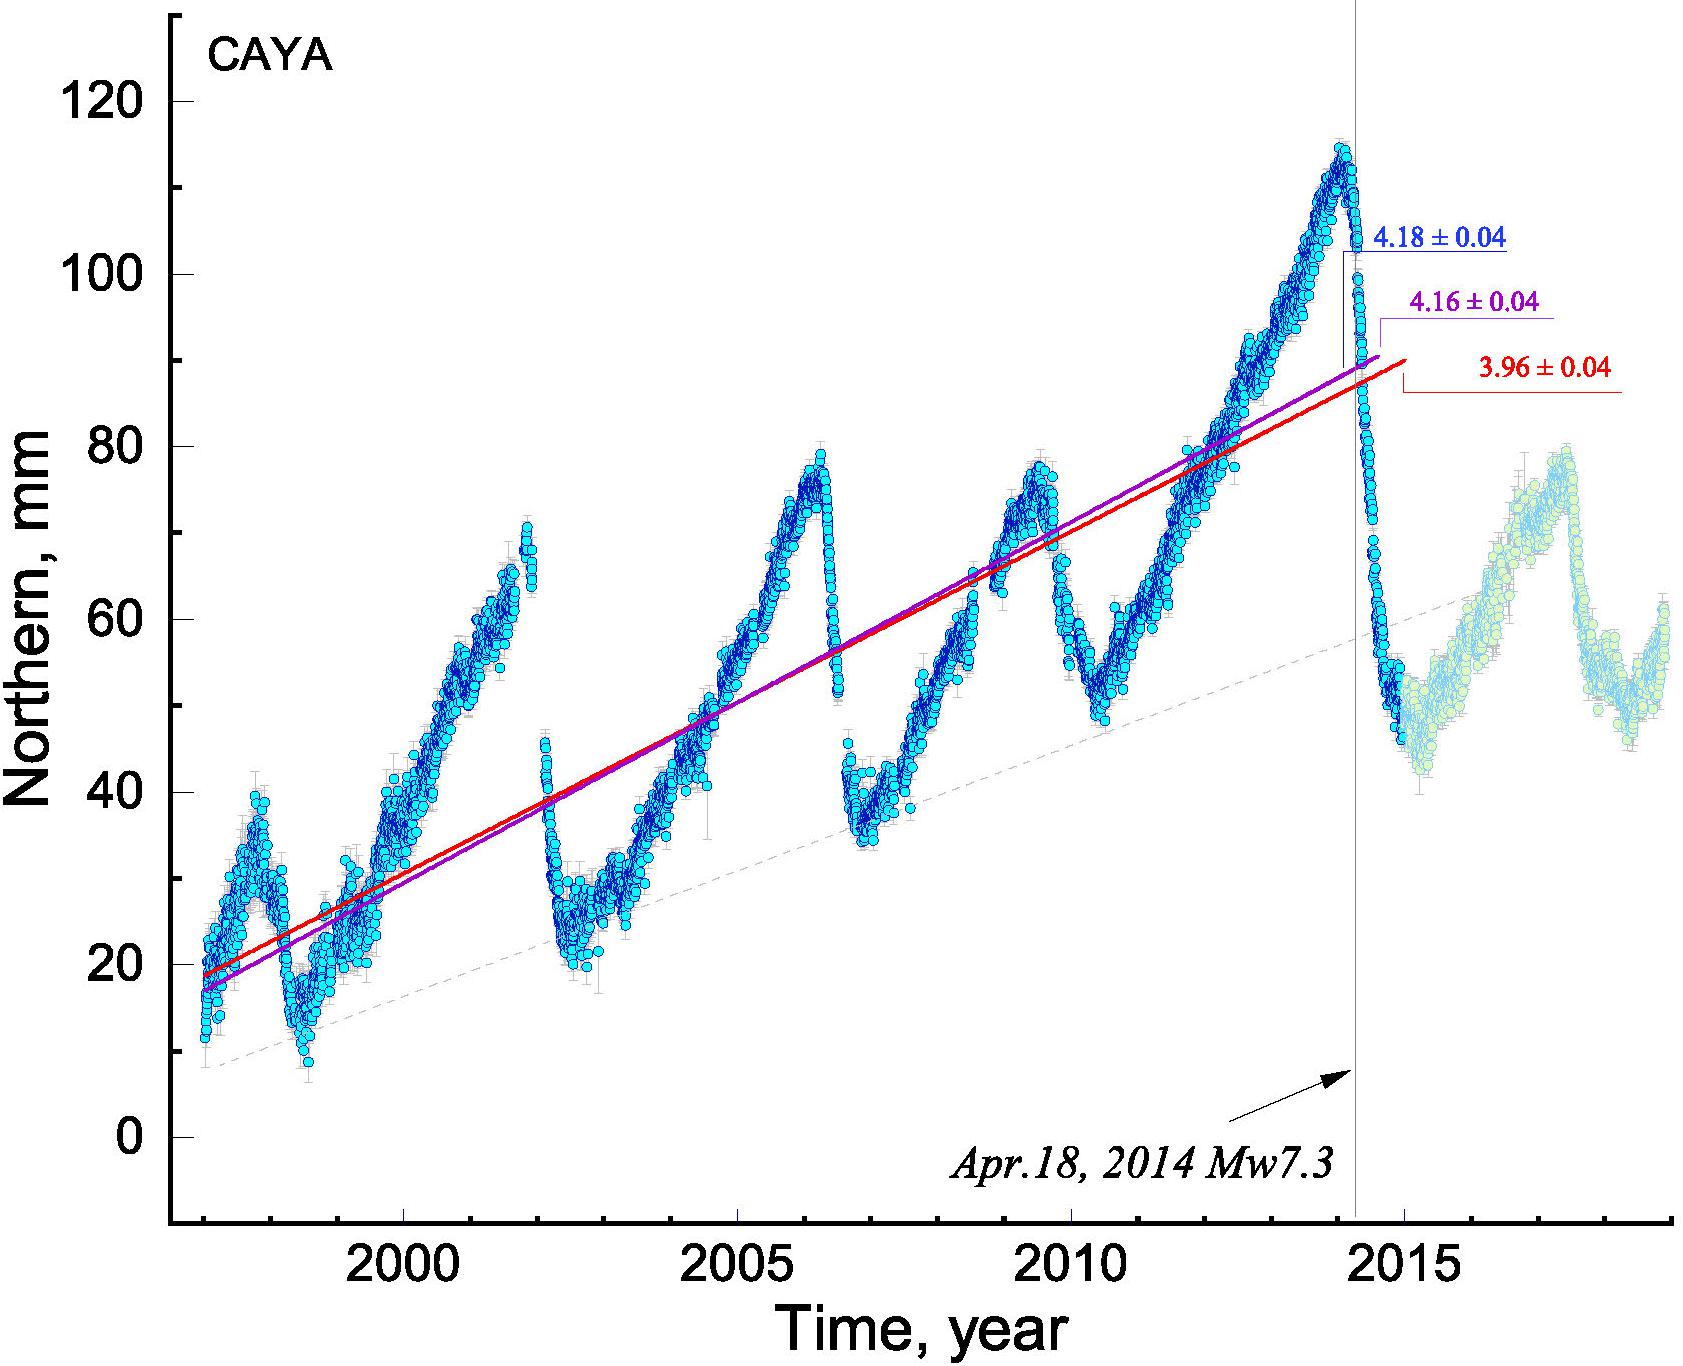
Figure 2. Example of few linear fits to the CAYA northern time series. The resulting estimate of VSN value depends on the selected time interval. To eliminate the impact of the Papanoa Mw 7.3 earthquake the fitting window closes just before the earthquakes starts.
The trench-parallel component of secular velocity, VSS, rests on an assessment of the trench normal azimuth, Tn, at each location of GPS station. The shape of the MAT is arc-curved and may be approximated by a few segments of small circles on a spherical Earth (Guzman-Speziale, 1995). Using this approach, we selected four successive sections of the MAT with approximately consistent curvatures and fitted each of those to a small circle (Supplementary Figure A1). Thus, the pole of best fitting small circle is the center of curvature of the trench section (Supplementary Table A1). The azimuth of big circle passing through this pole and a location point of GPS station corresponds to the Tn. The trench normal at each station is calculated according its location in a sector of corresponding small circle (see Table 1 and Supplementary Figure A1). By applying the same method, it is possible to define the obliquity angle variation along the MAT as the angle between plate convergence direction (we used PVEL Cocos-North America plates model, DeMets et al., 2010) and trench normal (Figure 3). The obliquity in Guerrero and Oaxaca segment of the MAT is relatively higher (10°–15°) than in Michoacan and Chiapas, where it is close to ∼0° in average.
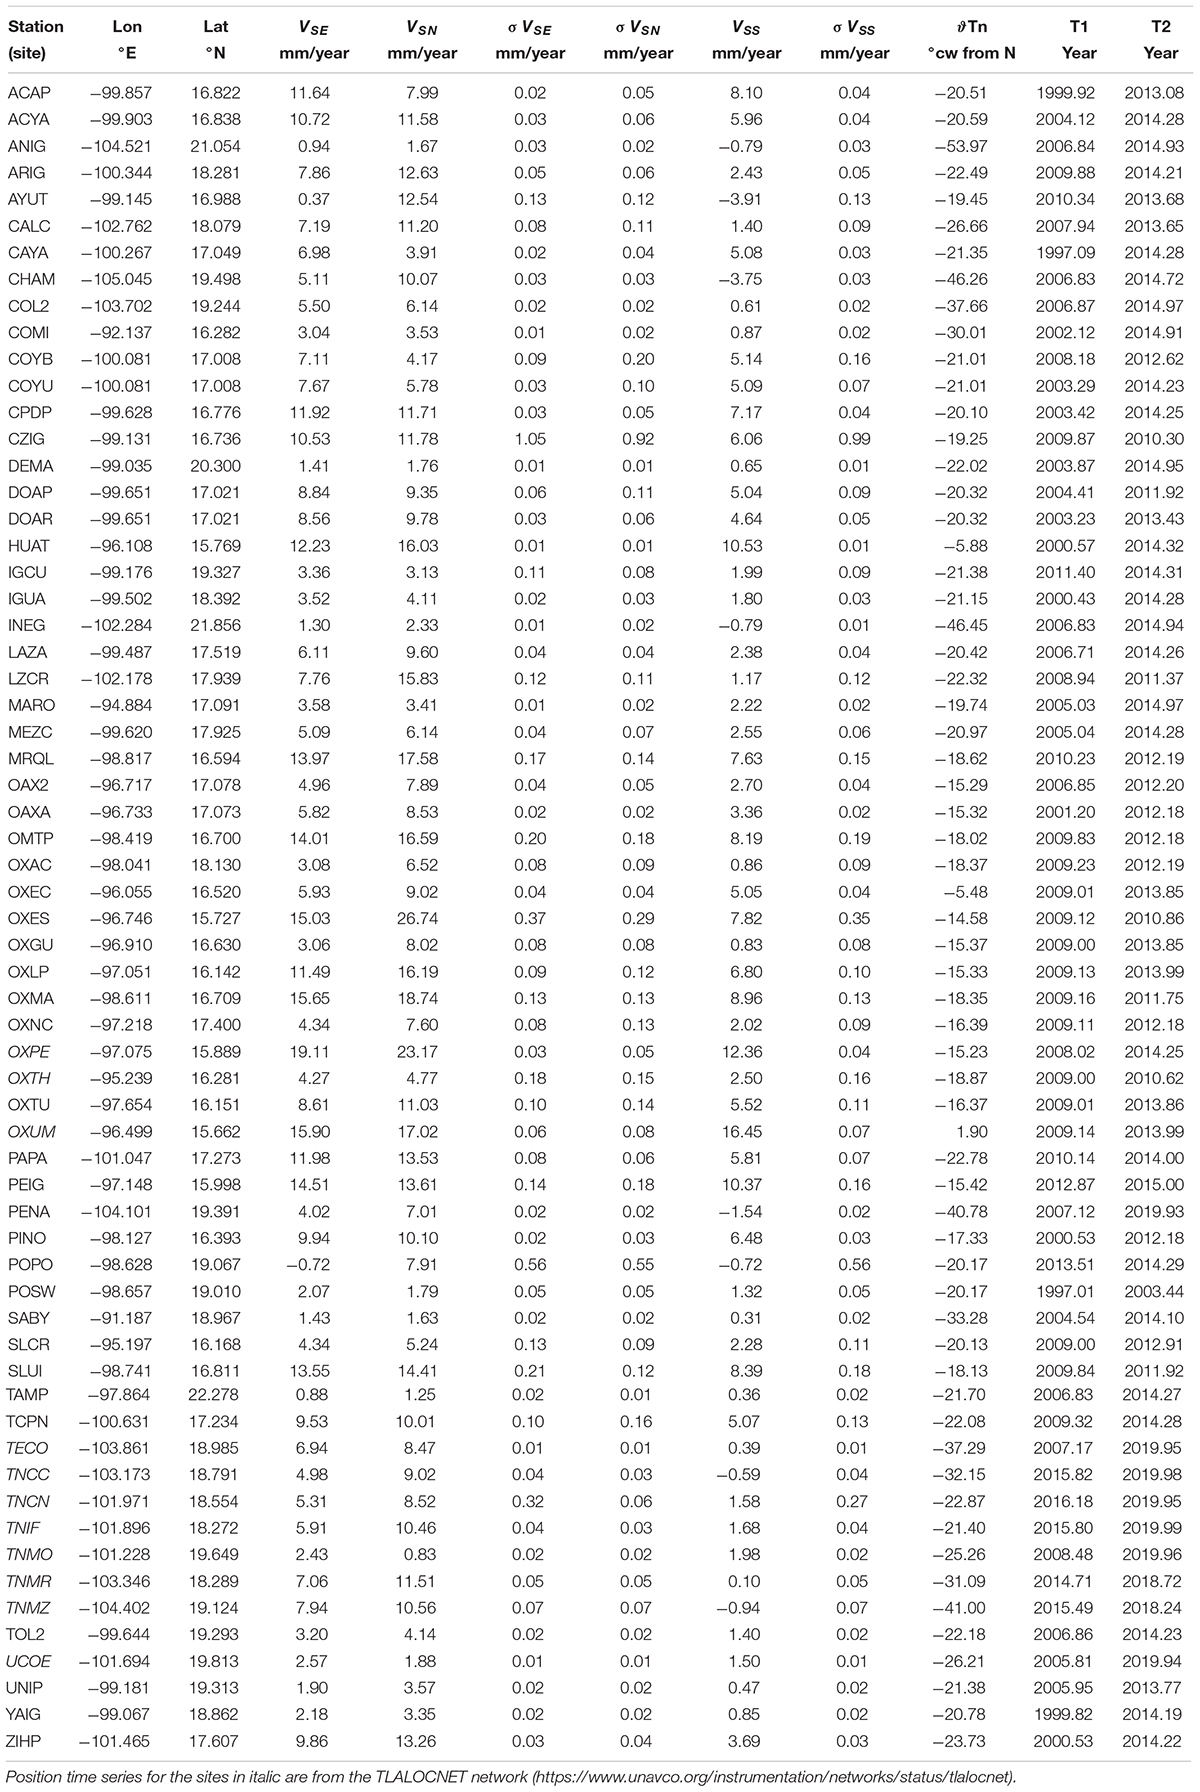
Table 1. Secular velocities of the GPS stations (VSE, VSN, east and north components accordingly, referenced to the fixed North America plate), and corresponding standard errors (σVsE, σVsN); trench parallel velocities (Vss) with standard errors (σVss) and azimuth of trench normal (ϑTn, clockwise from North); T1 and T2 are the start and end limits of the fitting time span, respectively.
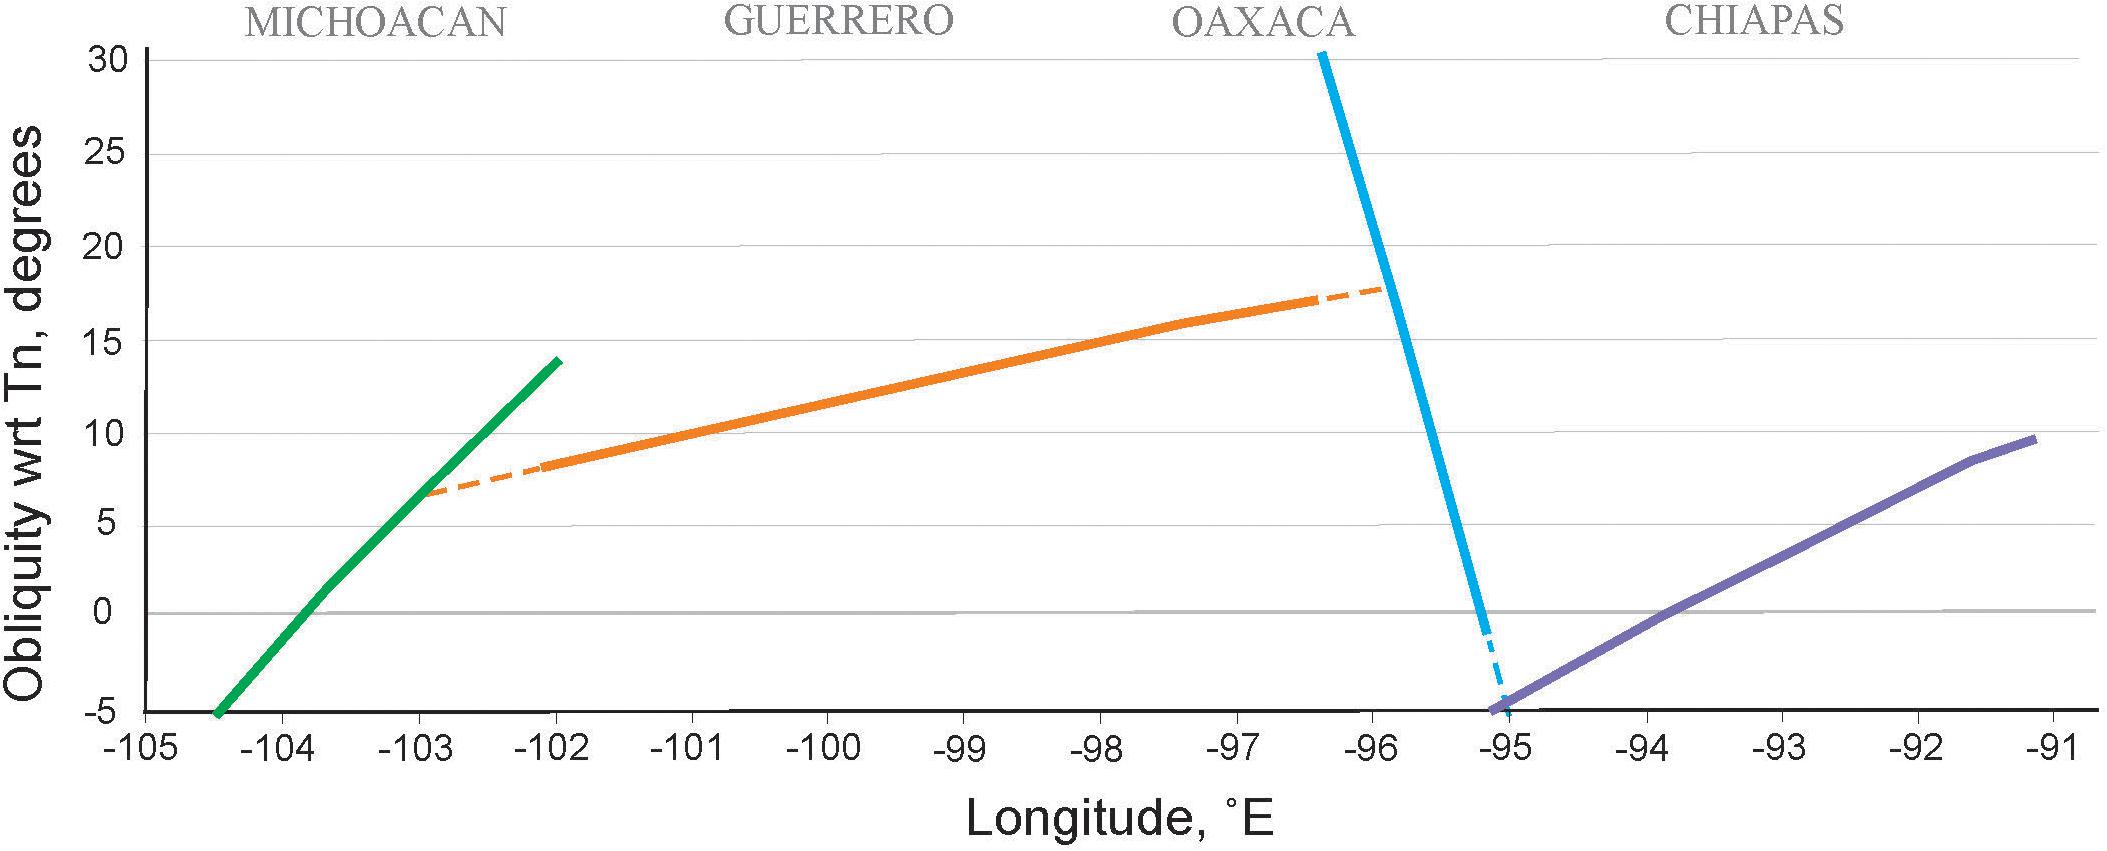
Figure 3. Variation of obliquity angle along the Mexican fragment of the Middle America Trench. The obliquity is relatively higher in the Guerrero–Oaxaca segment of the MAT and low or negative in Michoacan and Chiapas.
All VS and VSS vectors are plotted in Figure 1, where an abrupt reduction of secular trench-parallel velocity, VSS, is obvious from south-west to north-east, across the LVC fault zone, especially in Guerrero, with a broader coverage of the GPS network. To reveal a tectonic significance of the LVC fault zone, we projected VSS amplitudes onto a general profile perpendicular to the MAT (Figure 4). As it is seen in Figure 4, the strain rate in Guerrero suddenly changes roughly from −93 to −4 nrad/year at approximately 100–120 km inland from the MAT, which is an average location of the LVC shear zone. At the same distance, the Vss diminishes by 2–5 mm/year in Guerrero and by more than 6 mm/year in Oaxaca. These velocity slumps may represent a partitioning of the oblique convergence between the Cocos and North America plates with a sinistral motion (wrt NA) of the forearc Xolapa sliver. Abrupt fault-parallel velocity change as a function of fault-perpendicular distance is a usual attribute of major active strike-slip faults (e.g., Smith and Sandwell, 2006; Alchalbi et al., 2010; Smith-Konter et al., 2011; Jolivet et al., 2015); thus, our observations suggest that the LVC fault area is tectonically active, at least during the GPS epoch.
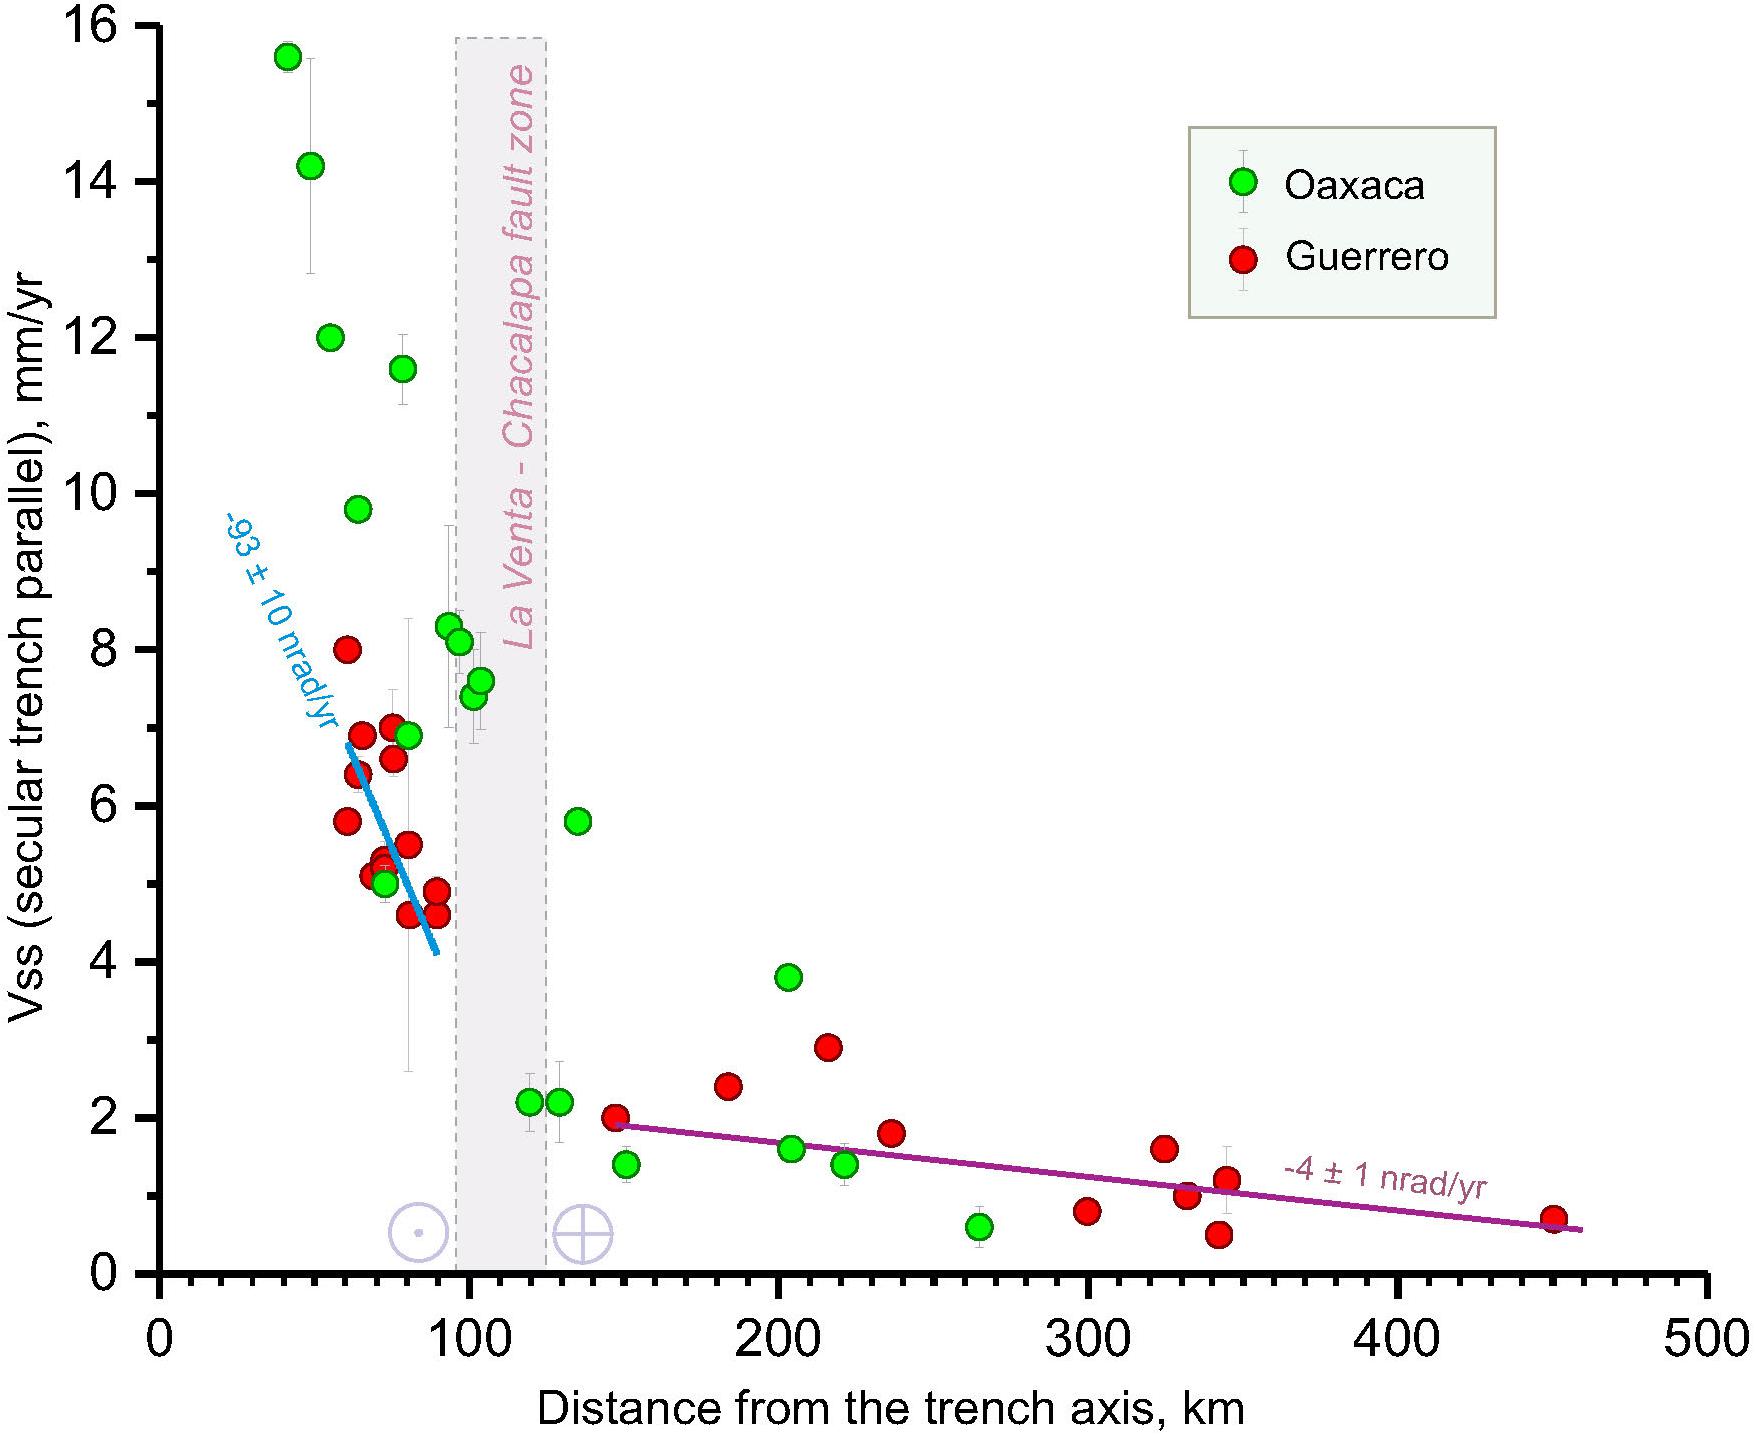
Figure 4. Distribution of trench-parallel component of GPS secular velocity (VSS) along the profile perpendicular to the MAT (Figure 1, red vectors amplitudes projected on the profile shown by the red dashed line). Red circles correspond to the GPS stations in the Guerrero state and green circles to those in the Oaxaca state. Blue line annotated with the strain rate estimate is a best fit to the VSS measurements for the Xolapa sliver (south of the LVC fault zone) in Guerrero, while the magenta line is the best fit to the VSS data north of the LVC. Sharp change in the strain rate across the LVC is evident as well as an abrupt drop of VSS by 3–5 mm/year in Guerrero and by more than 6 mm/year in Oaxaca. Thus, the LVC fault zone is active at least during the epoch of GPS observations. Light gray band shows roughly the LVF zone.
There are not enough GPS stations to reliably model the LVC fault properties along all of its extent (Figure 1). The only fairly acceptable GPS covered area is in Guerrero, where the ∼450-km-long cross-section could be roughly appraised using a simple screw dislocation model (Savage and Burford, 1973; Cohen, 1999) for the infinite vertical strike-slip fault (Figure 5). The modeled fits to the observed Vss data show strike-slip displacement on the surface produced by the creeping fault at the depth more than 10 km while its shallower section is locked. Of course, these models cannot constrain the fault coupling depth, but they highlight the slower strike-slip motion (∼3 mm/year) on the LVC fault zone within the Guerrero seismic gap compared to the adjacent areas (∼5 mm/year). This inconsistency may be related to the influence of periodic SSEs, which effectively reduce the long-term subduction plate interface coupling in the gap area (e.g., Radiguet et al., 2012).
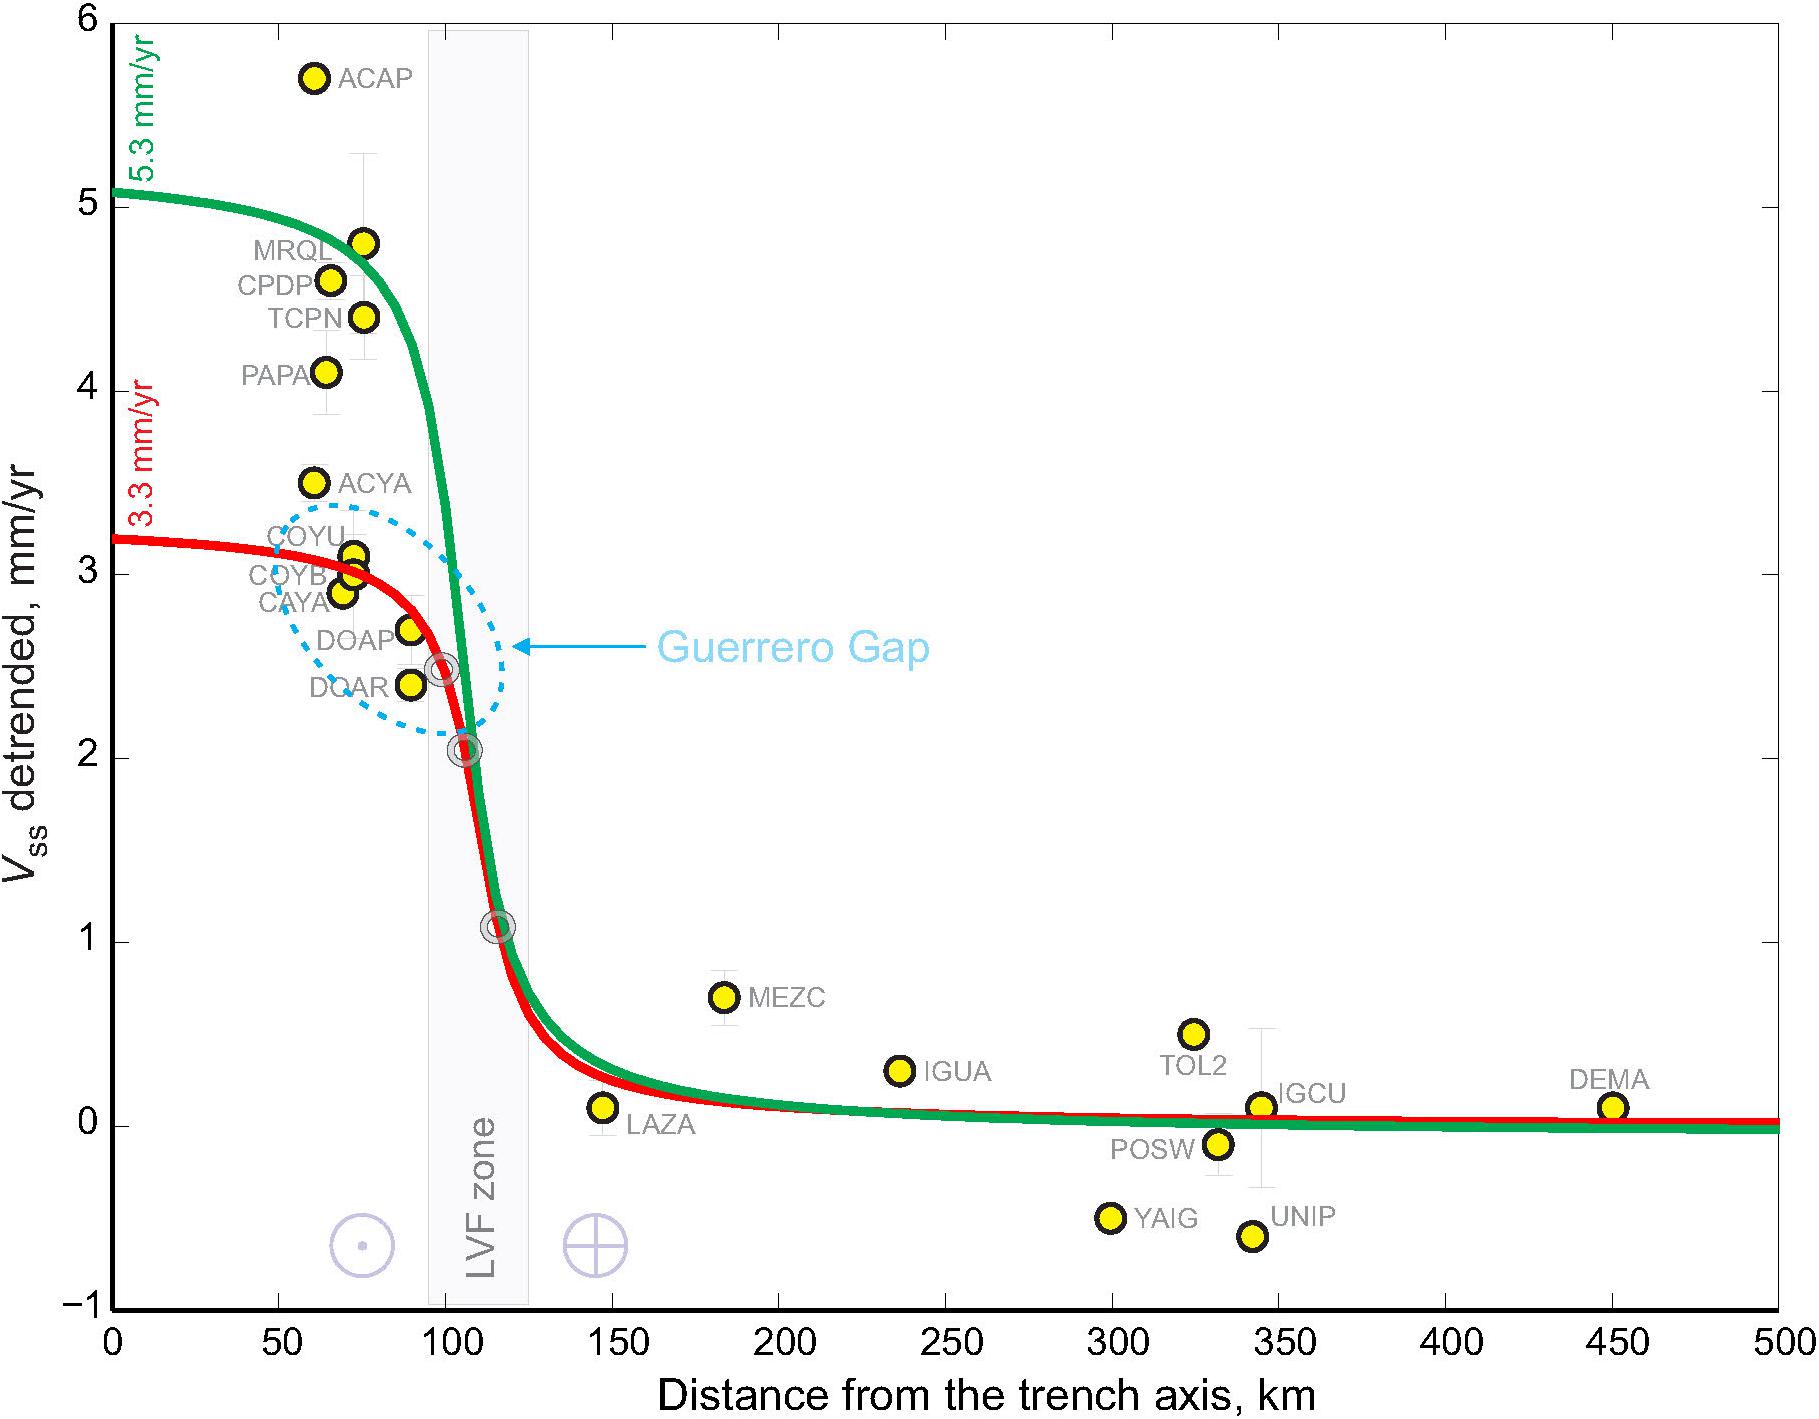
Figure 5. Screw dislocation models in elastic half space for a vertical strike slip fault (Savage and Burford, 1973) in the LVC zone. The models show strike-slip displacement on the surface produced by the creeping fault at the depth more than 10 km. The fault is locked from 0 to 10 km. Yellow circles are detrended trench parallel rates (Vss, wrt NA fixed plate) at the permanent GPS stations (see Figure 1), ΔVss, (after the secular linear strain trend is subtracted from the Vss). The trend north from the LVF fault zone is produced by the simple shear in the upper 10 km of the locked fault segment. Red line is a feasible fit for the Vss in the area of the Guerrero seismic gap (G-GAP, ∼100–101°W) for the Xolapa sliver velocity, ΔVss, of 3.3 mm/year. Green line is the fit for Vss values for the Guerrero GPS stations located off the G-GAP, and ΔVss = 5.3 mm/year. Light gray band indicates the LVF zone. Error bars are 3σ. Gray open circles show only locations of three GPS stations recently installed in the LVF zone to constrain better the fault model.
Based on the variation of GPS sinistral secular velocities along the coast (Figure 1), the active LVC fault zone strikes off the Zihuatanejo city area, some ∼650 km eastward along the Pacific coast, and gets somewhere close to the Salina Cruz city on the land. A continuation of the LVC into the Guatemala basin remains problematic to trace as yet without detailed bathymetry and marine geophysics data.
Seismicity
Large historic strike-slip earthquakes are unknown in the continental crust along the entire length of the fault system. Only a few shallow and small magnitude earthquakes have probably occurred on it, according to the catalog of the National Seismological Service of Mexico (SSN). Just one well-documented normal type with a small strike-slip component, Mw 5.8, Coyuca earthquake, followed by numerous aftershocks, has been recorded on October 8, 2001 (Pacheco et al., 2002; Pacheco and Singh, 2010), on the reactivated sub-fault, south of the La Venta fault (LVF; Figure 6). This rare event occurred right after the large 2001 SSE that created a temporal extension of the forearc (Kostoglodov et al., 2003).
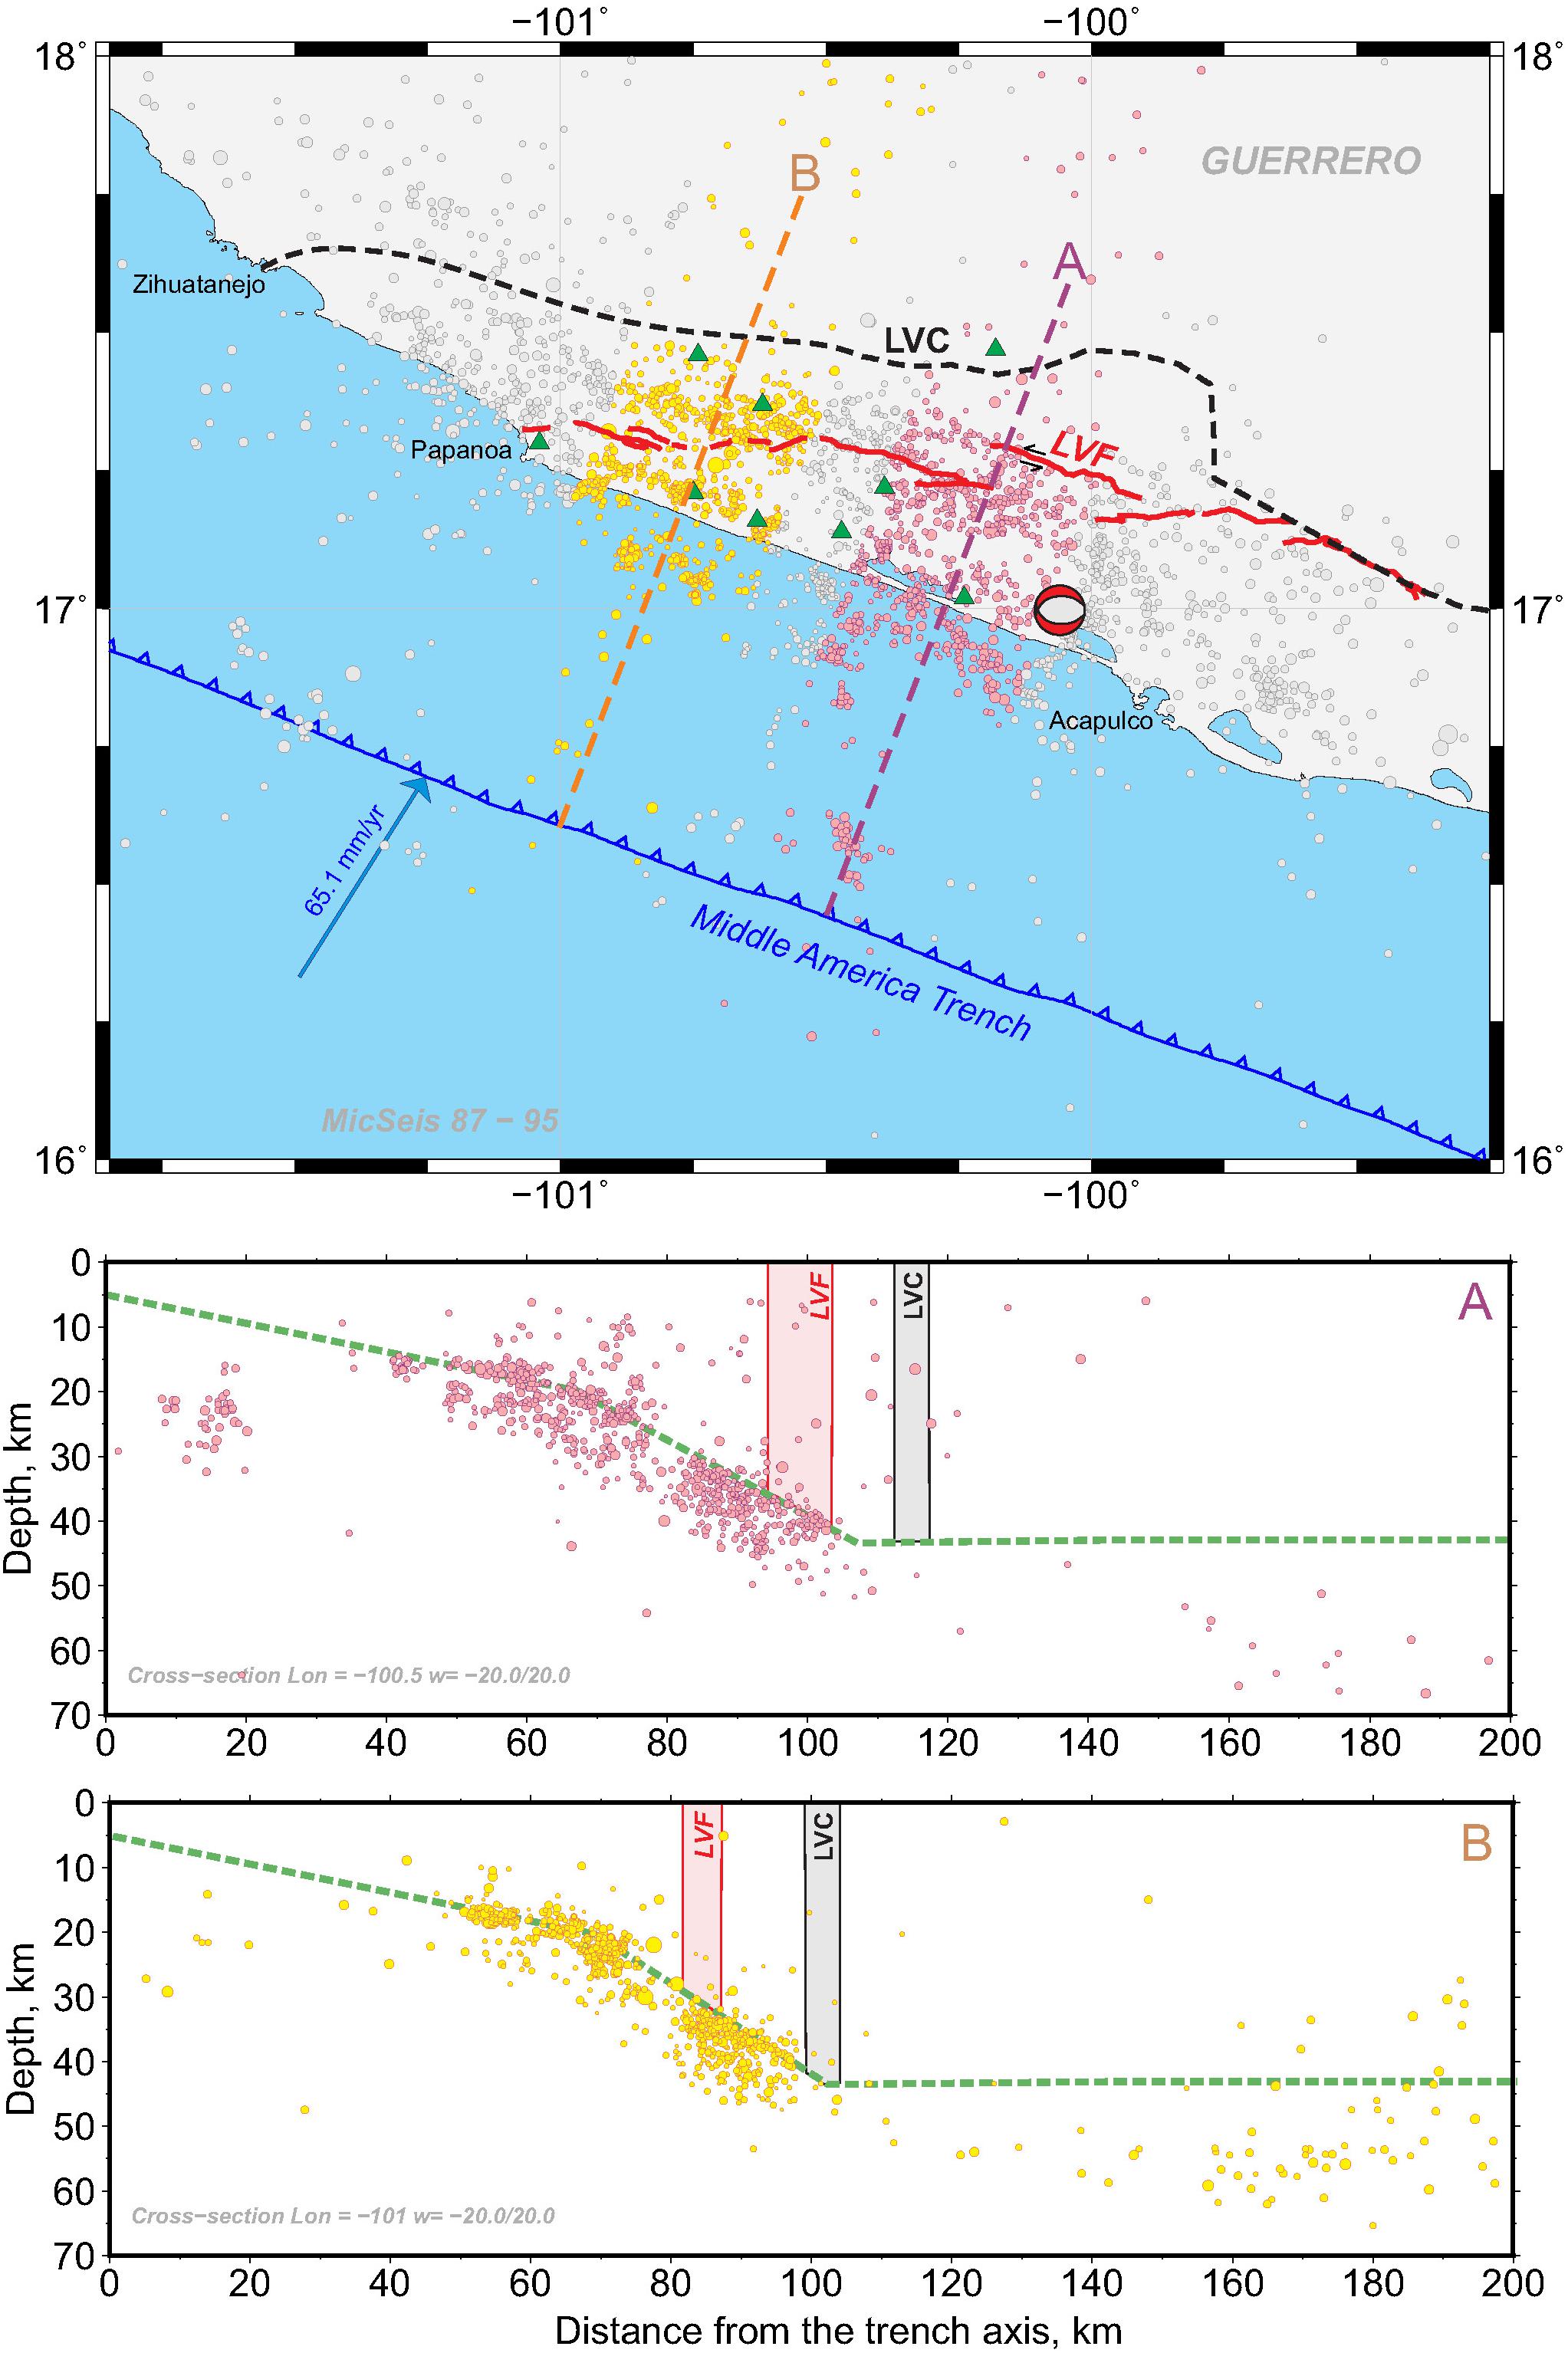
Figure 6. Top map: seismicity in the Guerrero seismic gap area from the local network catalog [1987–1995, 1.0 < Mc < 4.0, (Suárez et al., 1990)]. Green triangles are locations of short period seismometers of the network. LVC, black dashed line shows location of the La Venta–Chacalapa fault zone from geological studies (Tolson, 2005; Solari et al., 2007). Red lines denote a trace of the La Venta fault, LVF, according to Gaidzik et al. (2016). Dashed lines A and B perpendicular to the trench mark two profiles on which the seismic events from the catalog were projected. The events in each cross-section, yellow and magenta on the map, are from the bands of 40-km-wide, centered along the profiles. Red-white focal mechanism shows a location of the October 8, 2001 Coyuca, Mw 5.8, Earthquake (Pacheco and Singh, 2010). A: seismicity cross-section along the profile A (magenta line and events on the map). Pink trapezoid shows roughly a projection of the LVF zone assuming that the fault is vertical. Gray rectangle is a projection of the LVC fault zone assuming that the fault is vertical. Green dashed line is an approximation of the plate interface. B: seismicity cross-section along the profile B (yellow line and seismic events on the map). Other notations are the same as for the cross-section A.
Seismic events hypocenters in the SSN catalog (1962–2015) do not have sufficient precision to make a definite conclusion on the LVC seismicity. Supplementary Figure A2 shows only that the fault zone approximately coincides with the location where density of seismic events drops significantly to the north of the fault trace. The higher-precision catalog obtained from the local seismic network in the seismic gap of Guerrero [1.0 < Mc < 4.0, (Suárez et al., 1990)] may be used to examine the seismic activity of the LVC. Seismicity cross-sections perpendicular to the MAT show that this fault zone is mainly aseismic for the time span of the catalog (1987–1995; Figure 6). Very low seismicity on active faults needs to be explained. One of the plausible insights may be a the model of Lamb and Smith (2013), where the strike-slip fault is totally locked in the surface elastic layer during a long-lasting interseismic period and is thus behaving almost aseismically. This locked shallow patch of the fault produces a background secular linear surface strain trend of ∼4 nrad/year (see Figure 4). In the deeper part of the crust, beneath the locked fault zone, the fault is creeping on a narrow shear zone that produces an apparent near-fault geodetic signal, which depends on the maximum depth of the locked segment of the fault. This model may explain the total observed GPS surface displacements and a lack of seismicity on the LVC. Strain accumulation on the upper locked zone of the fault is relatively slow, ΔVss = 3–5 mm/year (Figure 5), which should lead to a long-lasting seismic cycle of the order of thousand years.
Recently reported local seismic swarms in the Oaxaca section of the LVC (Fasola et al., 2019) are apparently related to someway relocated fault. Still insufficient accuracy and precision of the local seismic catalog (Fasola et al., 2016) does not permit us to make a definitive conclusion on the seismic activity of the LVC.
La Venta–Chacalapa Fault Trace Mapping
The fault shape and its location are essential to analyze the stress pattern and appraise the elastic strain accumulation, which may finally be released seismically. The precise position of the LVC shear zone is unknown for most of its length. There are only two explored segments of this zone detected by geological studies, Chacalapa (Tolson, 2005) and La Venta (Solari et al., 2007)—C and L annotations accordingly in Figure 1. All published LVC fault configurations render a geologically depicted borderline of the Xolapa terrane (e.g., Cerca et al., 2007). Gaidzik et al. (2016), acquired and analyzed abundant structural field data in the western part of the Xolapa terrane (∼99°–101.3°W), and after a morphotectonic interpretation of 15-m resolution digital elevation model (DEM) and satellite images of the area, they could trace the superficial left-lateral strike-slip continuation of the La Venta fault zone (LVF in Figure 1). According to this study, the LVF is segmented with 4- to 8-km-wide compressional or extensional step-overs and its nearly E–W average trace crosses the coastline close to the town of Papanoa.
The westernmost segment of the fault is less well constrained. As the Zihuatanejo GPS (ZIHP in Figure 1) has a clear secular trench-parallel motion comparable to other GPS sites on the Xolapa sliver, we can assume that the active LVF extends up to that longitude of approximately −101.5°. An absence of GPS stations between LVF and LVC does not permit us to determine the northern limit of the Xolapa sliver, while the LVF trace is more reliable based on detailed study of Gaidzik et al. (2016). It is important to note that the Xolapa sliver is not identical to the geologically determined Xolapa complex (Ducea et al., 2004) or the same name terrain. The LVF location may be considered as a trace of active LVC fault system (Ramírez-Herrera et al., 2018) in western Guerrero mainly because the northern boundary of the Xolapa complex has no clear expression on the landscape (Gaidzik et al., 2016). Part of the LVF (Gaidzik et al., 2016) appears to coincide with the geologically defined Eocene–Oligocene LVC shear zone (Riller et al., 1992; Tolson, 2005; Solari et al., 2007).
Nevertheless, GPS estimates show that the westernmost section of the LVC should extend up to the Zihuatanejo city area where the Xolapa sliver is stretching from the NA plate. Thus, some of the LVF segments possibly are subfaults of the LVC fault system (Ramírez-Herrera et al., 2018). Therefore, the principal conclusions of Gaidzik et al. (2016) study concerning the age of the LVF, its seismic activity, stress regime, and reactivation would be valid similarly for the LVC (Ramírez-Herrera et al., 2018).
The trace of the tectonically active eastern part of the LVC fault zone needs to be investigated using the same methodology as in Gaidzik et al. (2016) together with high resolution GPS and local seismological studies. Until now there is only geologically defined trace of the LVC shear zone (Ramírez-Herrera et al., 2018), which is poorly confirmed by any reliable observations, particularly in Oaxaca region (between −99.0 and −97°E; dashed line in Figure 1). Just a few GPS stations landward from and close to the LVC zone are not enough to estimate the active fault zone location. For that reason, the geological LVC trace is the only one that can tentatively be used as a reference for the active LVC in Oaxaca. Analyzing secular trench-parallel velocities, VSS, of the easternmost GPS stations (OXUM, HUAT, SLCR, OZTH, and MARO; Figure 1) we conclude that the active LVC fault zone (Ramírez-Herrera et al., 2018) should cross the shoreline somewhere between Huatulco (HUAT) and Salina Cruz cities. Tectonic implication of this observation is considered later.
Xolapa Sliver
Azimuthal angle differences (slip partitioning) between slip vectors of subduction thrust earthquakes and the direction normal to the trench allow assessing the partial decoupling of the seismogenic plate interface and the rigid forearc sliver rate in oblique convergence margins (McCaffrey, 1992; Haq and Davis, 2010). Ego and Ansan (2002) thoroughly selected shallow thrust earthquakes on the subduction interface of Southern Mexico from the Harvard centroid moment tensor (CMT, 1977–2001, Mw ≥ 5.3) catalog. They analyzed 31 slip vector angles for the area between 96°W and 105°W, the subduction zone segment, which includes both partially the LVC fault zone (Ramírez-Herrera et al., 2018) and the area outside of it. For the Guerrero area, between 102°W and 96°W along the MAT, they observed a significant slip partitioning up to 10° and estimated an average sliver rate of Vsl = 8 ± 3 mm/year. This inference is slightly higher but roughly consistent with our direct GPS observations of VSS.
Using similar selection criteria for the CMT events as of Ego and Ansan (2002), we have compiled a more ample catalog of the CMTs from 1976 up to 2018, which contains 89 shallow thrust events that corresponded only to the LVC longitudinal extent (-95.5 and −101.5°E, see Supplementary Table A2 for other criteria). Analyzing this CMT data subset, the average estimate of Vsl ≈ 5.4–6.3 mm/year (see Supplementary Figure A3), which is closer to the VSS values obtained with the GPS. The large dispersion of CMT slip vector angles is apparently related to uncertainties in the CMT catalog, complicated structures of the LVC fault system (Ramírez-Herrera et al., 2018) and the Xolapa sliver, inhomogeneous Co-NA plate interface, variation of the plate coupling (e.g., Kostoglodov and Ponce, 1994), and more complicated than just a simple friction rheology of the fault (Kazachkina et al., 2019). Furthermore, observed dispersion is partially related to the increase of the Co-NA convergence velocity southeastward along the MAT. Obviously, McCaffrey’s model is too simple to allow for all these factors. Nevertheless, it provides some useful appraisals of sliver motion rate and average static friction coefficient on the fault (Haq and Davis, 2010), which in case of the LVC should be μ ≤ 0.15 (Supplementary Figure A4). For many crustal faults μ < 0.3 (e.g., Behr and Platt, 2014; Middleton and Copley, 2014).
Tectonic Implications
As the Xolapa sliver, in reality, is not a rigid block, it should undergo some internal deformation that depends on the convergence rate and the interplate coupling, which are changing along its extent. The systematic increase of the subduction velocity in the southeastern direction should result in general extension of the sliver. However, the plate coupling modulates the strain, and this results in some variation of the secular trench-parallel velocity, VSS, for example in the area of Guerrero seismic gap, between −101° and −100° of longitude (Figure 1).
Northwestern End of the Xolapa Sliver
In western Guerrero, an expected transtensional offshore continuation of the LVF on the continental slope is not so clear because of a lack of detailed bathymetric data. Low-resolution bathymetry offshore of Papanoa and Zihuatanejo [The Global Multi-Resolution Topography synthesis, GMRT (Ryan et al., 2009)] shows only two wide depressions on the continental slope that can be interpreted as an extension produced by the trailing edge of the Xolapa sliver moving southeastward (Figure 7). The total stretching of the continental margin estimated from the trench parallel bathymetric profile presented in Figure 7 is of the order of 40 km (referenced to the depth of 1,500 m). Southeastern displacement of the Xolapa sliver leading edge is expected to be of a similar distance, assuming that the sliver was rigid. The Cocos–North America spreading rate was almost invariable since at least the Late Miocene (Cande and Kent, 1992; Conrad and Lithgow-Bertelloni, 2007) and if the average mobility of the sliver was unchanging (∼5 mm/year), the reactivation of the LVC fault system (Ramírez-Herrera et al., 2018) could have occurred some ∼8–10 million year ago after the reorganization of spreading from the failing Mathematician ridge to the new propagating East Pacific Rise (Klitgord and Mammerickx, 1982; Mammerickx et al., 1988).
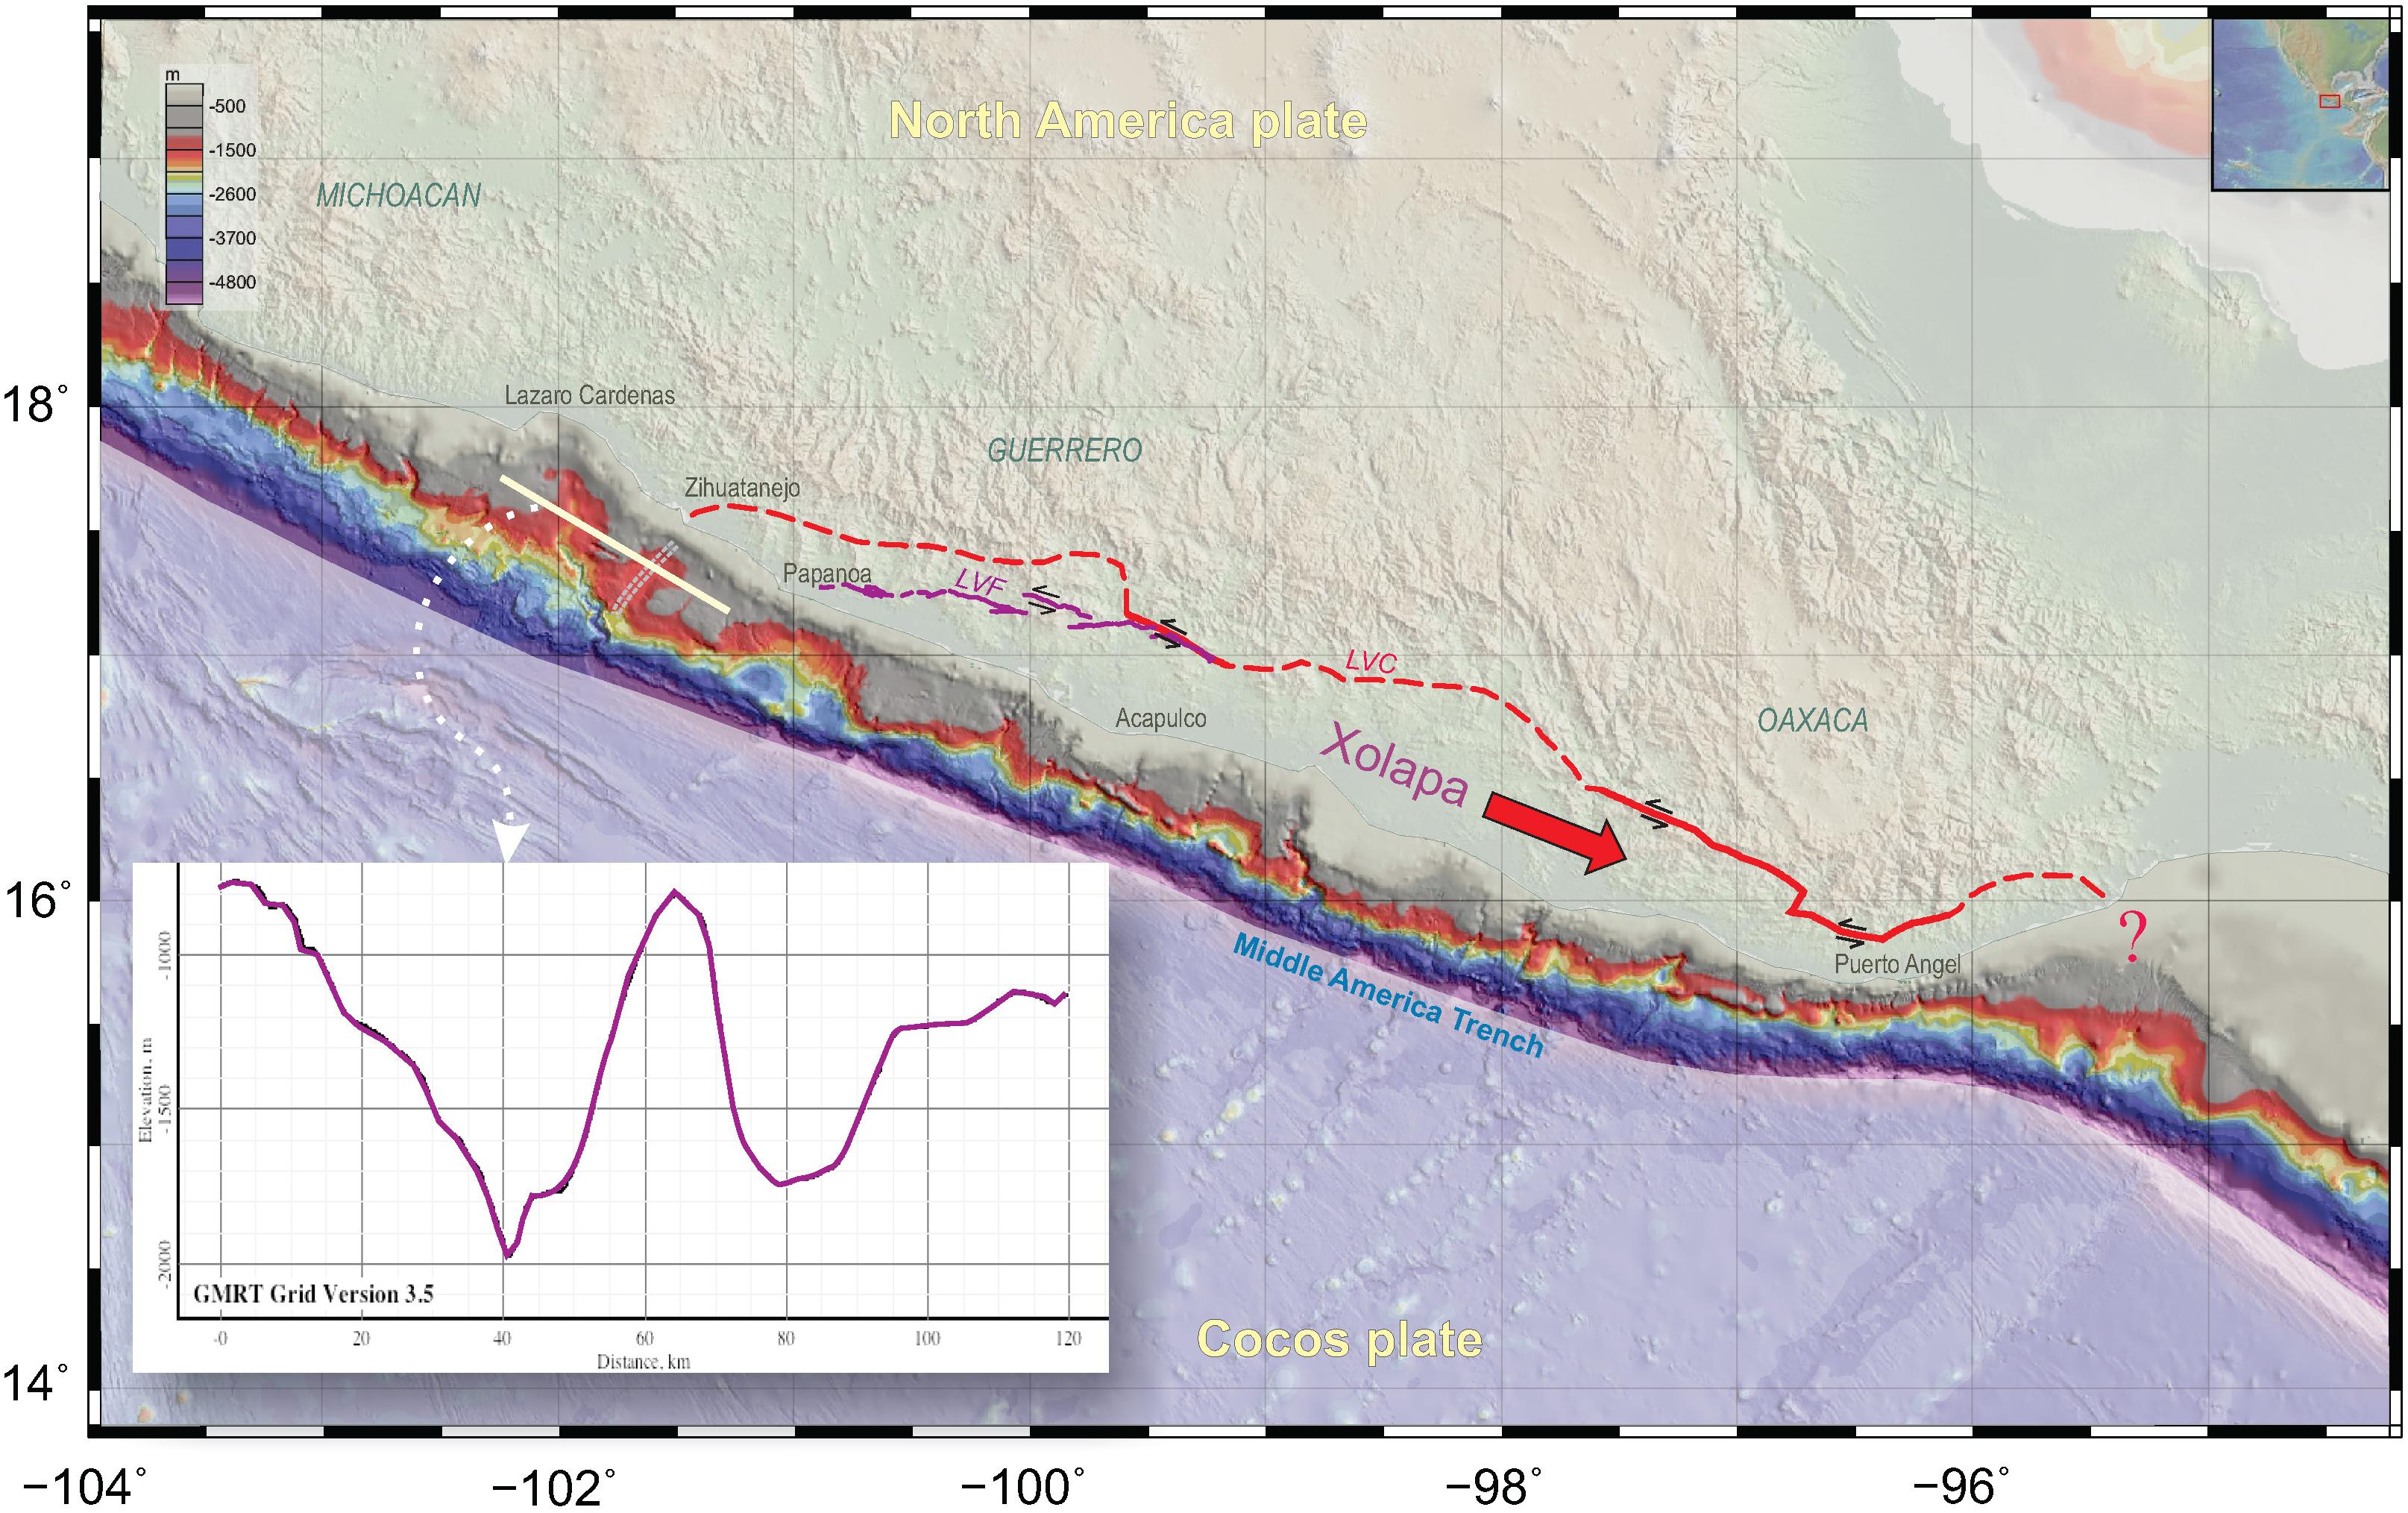
Figure 7. Topographic and bathymetry map [The Global Multi-Resolution Topography synthesis, GMRT (Ryan et al., 2009)], exposing a continental margin in Southern Mexico. The 750–1,600 m depth range is in red. A bathymetric profile at ∼1,500 m from Lazaro Cardenas city to Papanoa is shown in the bottom inlet. Two prominent depressions have a total average width of ∼40 km (at 1,500 km depth). The red arrow indicates the Xolapa sliver southeast motion. Local concave shape of the continental margin is seen in the area of the Tehuantepec ridge. The red line is a trace of the LVC fault system (Tolson, 2005). Magenta lines in the coastal area show the LVF fault discovered by Gaidzik et al. (2016).
Mexico–Guatemala Triple Junction and Eastern Extent of the Xolapa Sliver
While the geologic and tectonic history of the Xolapa terrain is still under discussion (e.g., Cerca et al., 2007; Moran-Zenteno et al., 2009; Talavera-Mendoza et al., 2013; Peña-Alonso et al., 2018), the earlier sinistral motion on the LVC fault system is recognized to occur in Early Eocene–Oligocene (50–25 Ma) (Tolson, 2005; Solari et al., 2007). Since then, it is unknown how long has been the LVC active and what the tectonic consequences are of the Xolapa sliver motion. The models of the Xolapa tectonic evolution are usually related to the translation of the Chortis block from its initial position, possibly bordering the Xolapa from the south (Schaaf et al., 1995), to its present location along the Polochic-Motagua fault system in Guatemala and Honduras (e.g., Ortega-Gutiérrez et al., 2007; Rogers et al., 2007). Regardless of the tectonic and geologic history of the Xolapa terrain, the present-day activity of the LVC fault system (Ramírez-Herrera et al., 2018) and the Xolapa sliver motion should be relevant to the seismotectonic situation in southern Mexico.
The next question, related to the challenging problem of the North America–Cocos–Caribbean tectonic plates triple junction, is how do the LVC (Ramírez-Herrera et al., 2018) and the Xolapa sliver continue to the continental margin of Chiapas. Lack of detailed bathymetry and marine geophysics data in this area leaves any hypothesis on the matter to be tentative. Thick accumulated sediments (e.g., Straume et al., 2019) entirely hide the tectonic structure on a wide continental margin. The Xolapa sliver movement into this area cannot stop abruptly. Still, it may lead to a deformation of the sliver body, or the sliver continues its trajectory along the trench. In the latter case, a left-lateral continuation of the LVC sub-parallel to the trench fault would exist on the continental margin of Chiapas (Figure 8). Further speculating, this fault may be lined up with the Polochic-Motagua fault system. Obviously, there are two main observations that would contradict this hypothesis: First, there is no obliquity in the Cocos-North America convergence offshore of the Chiapas segment of the MAT (-95.0 to −92.0°E). That causes an absence of a driving force for the sliver at a distance of more than 300 km along the trench. Second, the Central America forearc sliver (DeMets, 2001) southeastward motion in the NA reference frame starts only at −92°E, as it is seen at GPS stations (Figure 8; Franco et al., 2012; Ellis et al., 2018).
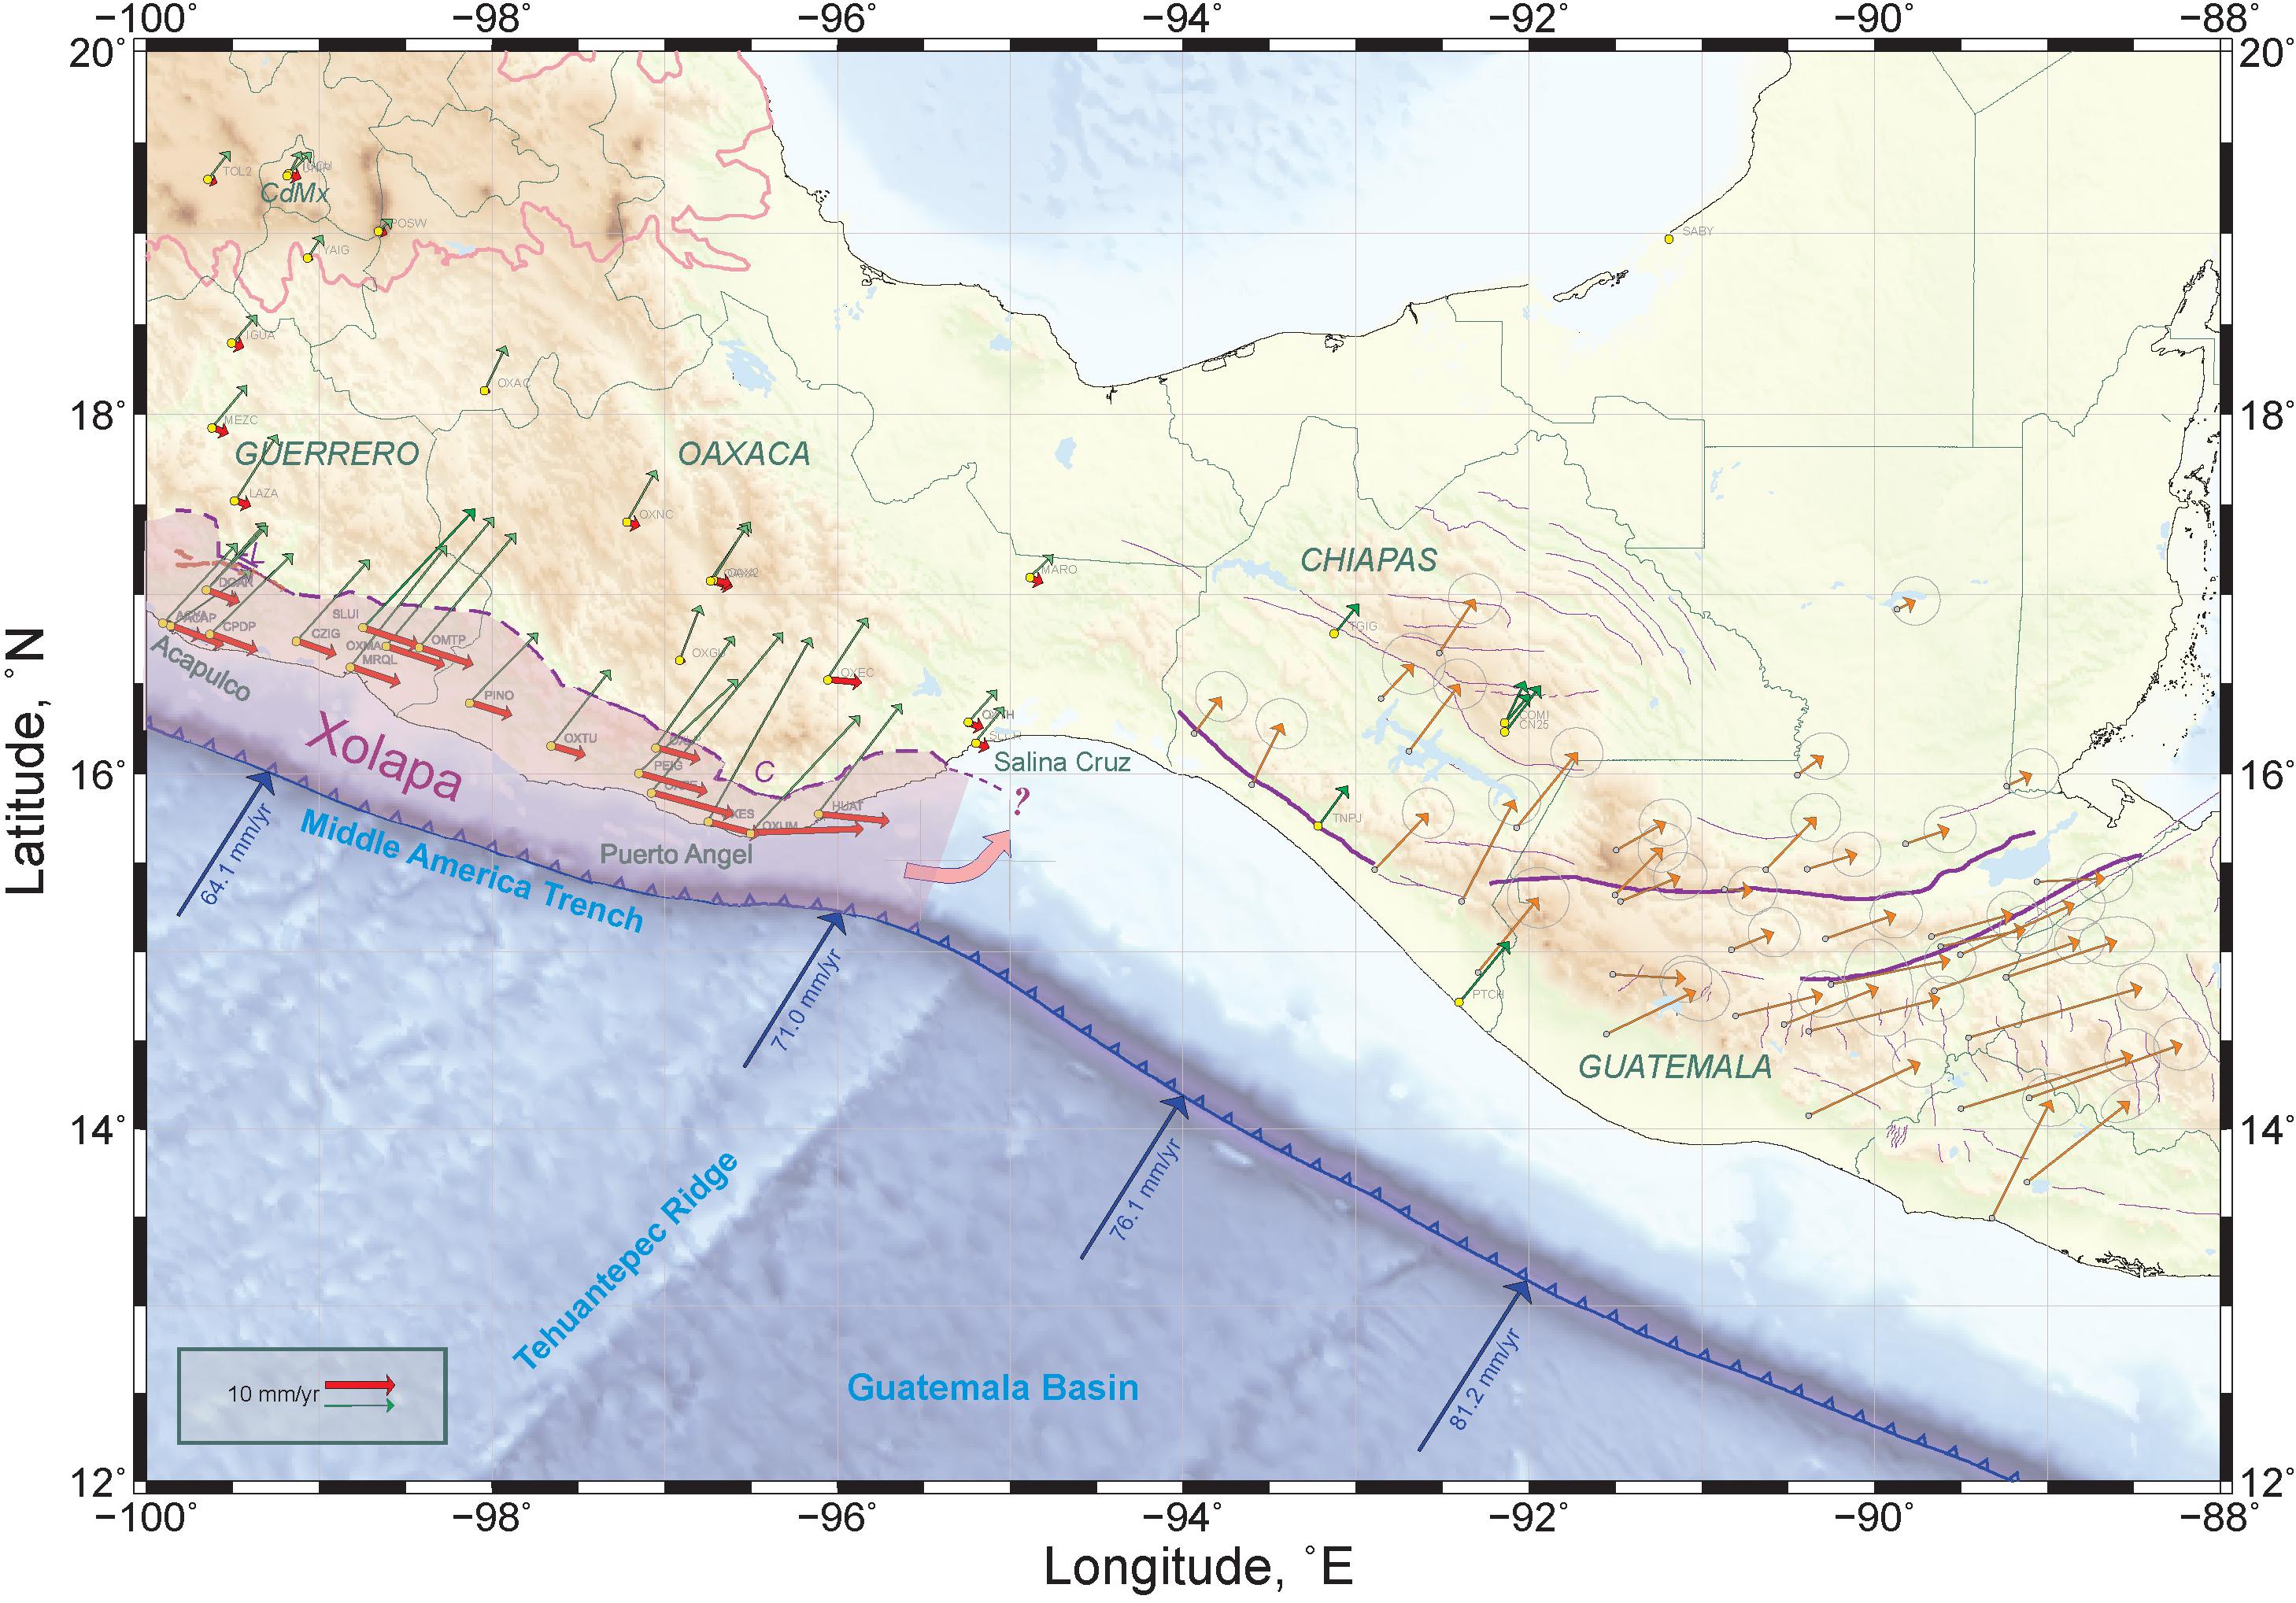
Figure 8. A map of southern Mexico that illustrates models of LVC sliver progression in the Guatemala basin. There is no obliquity in the Cocos–North America convergence offshore of the Chiapas segment of the MAT (-95.0 to −92.0°E). That causes an absence of a driving force for the sliver at a distance of more than 300 km along the MAT. Pink curved arrow indicates probable northward bending of the Xolapa sliver. Orange GPS vectors in Chiapas and Guatemala are from Ellis et al. (2018). Other captions are the same as in Figure 1.
Bearing in mind the inconsistencies of the previous hypothesis, another model of the Xolapa sliver leading-edge progression may be that it is bending northeastward in the area of Tehuantepec ridge subduction. This bending may be accompanied by fracturing, which depends on the force moment loading rate (the function of coupling, etc.) and the mechanical properties of the sliver. This scenario is probably more reliable, but it requires the existence of a system of faults limiting the sliver on the continental margin of Chiapas. Scarce seismologic data (Roman-Reinoso, 2004) in this region indicate only that this concept may be valid. In Figure 9, we demonstrate several faults (the area location is on Figure 9) and just a few rare CMT solutions of the strike-slip type in the crust forearc of Chiapas, which may be interpreted as consequences of the Xolapa sliver northeastern bending and fracturing. Unfortunately, the last hypothesis leaves the triple junction problem still unresolved until more marine geophysics data would be available.
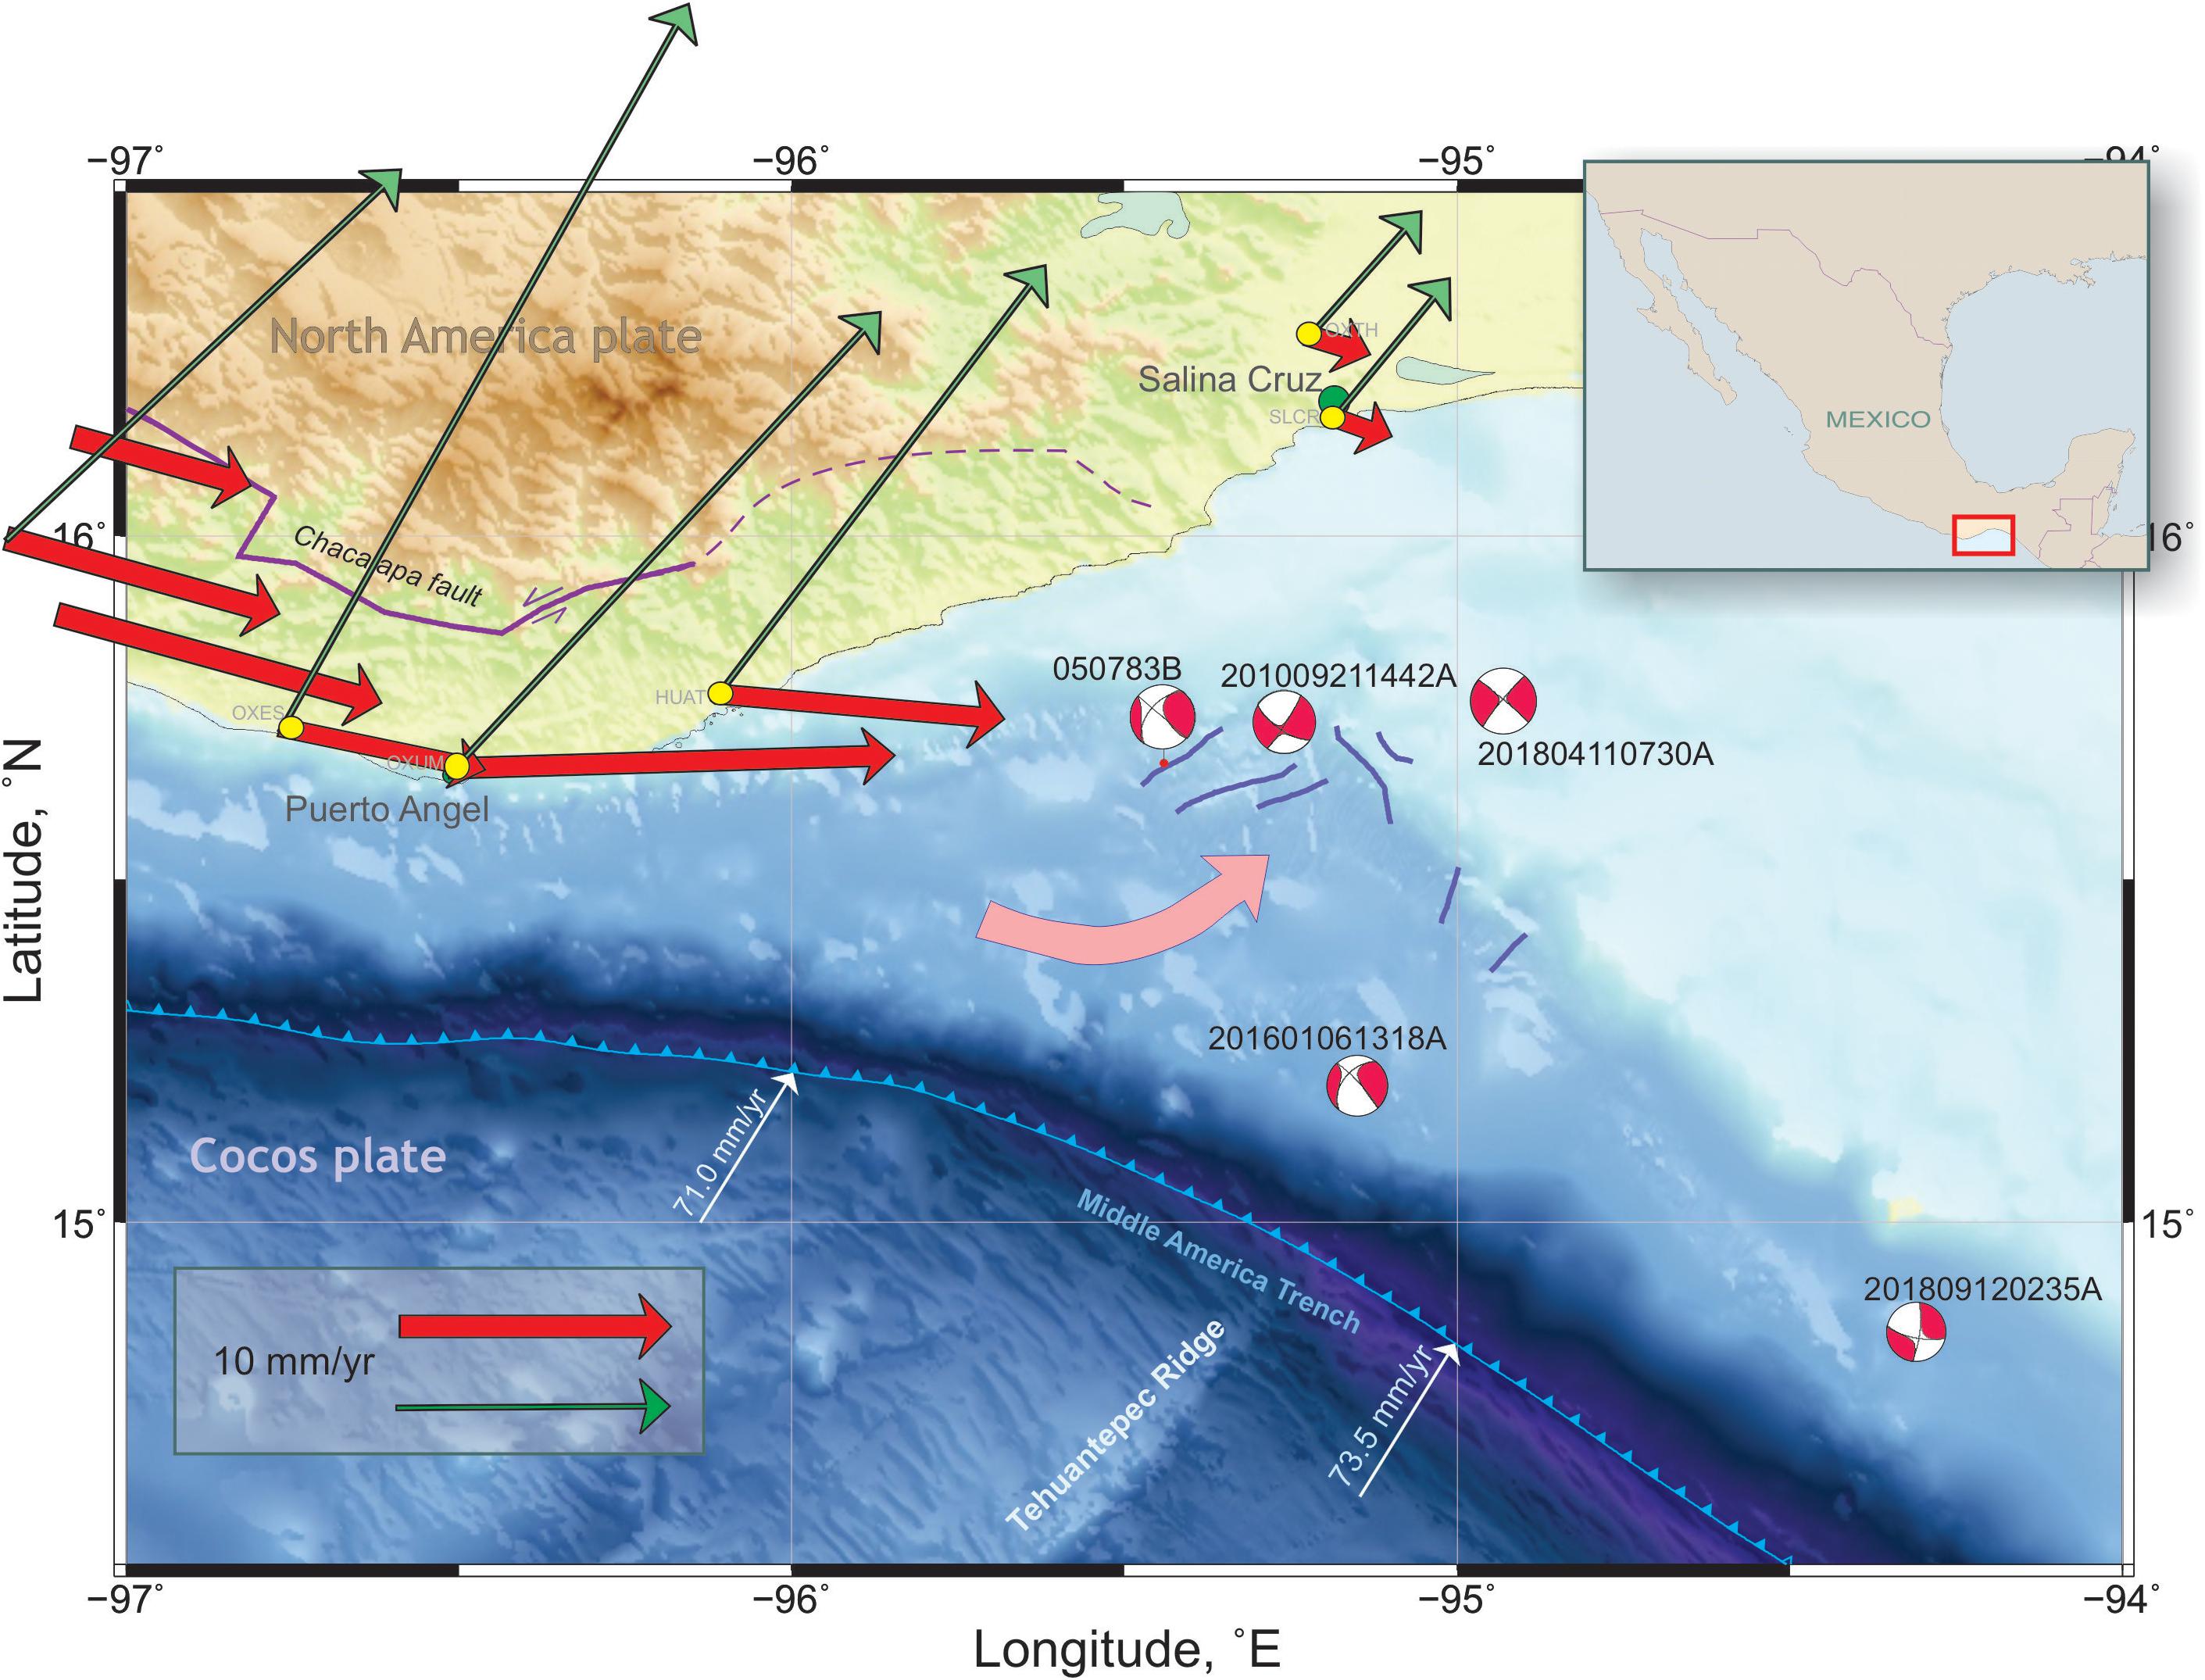
Figure 9. Detailed map of the subduction zone in the region of the Tehuantepec ridge. The inset shows a location of this area. Red vectors are secular sinistral GPS velocities (the same as in Figure 8). The only crustal strike-slip events in the Global CMT catalog are shown as red beach balls with their catalog codes. Blue lines offshore, south of Salina Cruz city are conceivably active faults (Roman-Reinoso, 2004).
Conclusion
Long-lasting GPS observations and geomorphology studies in the Guerrero–Oaxaca area of the Mexican subduction zone show that, despite the almost complete absence of historic and instrumentally recorded seismicity in the western LVC fault zone, this mainly left-lateral shear zone is a complex and active system of numerous distributed strike-slip faults that accommodates strain partitioning produced by oblique subduction of the CO. The average velocity of the sinistral motion of the Xolapa sliver predicted from the slip vectors of subduction thrust earthquakes (∼5.4–6.3 mm/year) is consistent with the direct GPS observed trench parallel velocity component across the LVC fault (5–6 mm/year in Guerrero). As the result of the present study, we should admit that the LVC fault system is the principal active tectonic feature in Southern Mexico, which must be considered as a source of potential seismic hazard.
It is not known so far for how long time was the LVC fault zone active and what is a cumulative offset across the LVC fault zone in time. Existing GPS records only are not enough to constitute a previously unrecognized hazard in Southern Mexico related to the active LVC fault system. We need to obtain quantitative constraints on the age of the LVC faulting at least for the last few thousand years. Accurate trace and structure of the LVC was not yet explored except perhaps its western Guerrero segment (Gaidzik et al., 2016). The motion of the Xolapa sliver in Oaxaca remains rather hypothetic until more data would be available on new GPS stations installed inland from the LVC zone. Apart of the more precise location of the LVC fault and its coupling structure modeling, future investigations will also focus on a possible relationship between large subduction thrust SSE and displacements on the LVC fault zone.
The Xolapa sliver is not a rigid block and should undergo different internal deformations, which depend on subduction rate, coupling, and changes in the friction along the 650-km length of the LVC. The leading edge of the LVC in the Guatemala basin is still undefined. It is apparently not related to the triple junction, but a contortion of the Xolapa sliver in the area of the Tehuantepec ridge is probably a key to make this problem clearer.
Data Availability Statement
All datasets generated for this study are included in the article/Supplementary Material.
Author Contributions
EK carried out the main part of the study and wrote the manuscript. VK developed the main idea and wrote the manuscript. NC and AW participated in GPS data processing and analysis. MR-H and KG contributed to geomorphological interpretations. AH participated in project discussion and manuscript writing. JS managed the GPS network and provided the most of raw data used in this study.
Funding
This research was supported by the UNAM PAPIIT IN109117, IN110514, and IN110519, CONACYT 178058, 284212, and 284365 grants.
Conflict of Interest
The authors declare that the research was conducted in the absence of any commercial or financial relationships that could be construed as a potential conflict of interest.
Acknowledgments
Some of the GPS and seismological data are from the National Seismological Service of Mexico (SSN, http://www.ssn.unam.mx/). The GPS data for the Oaxaca region were partly provided by Enrique Cabral Cano. Several GPS position time series for the Michoacan and Colima states of Mexico are in free access from the UNAVCO web site (https://www.unavco.org/instrumentation/networks/status/tlalocnet). We thank Victor Cruz Atienza and Michel Campillo for helpful discussions. Several figures were generated with the Generic Mapping Tools (GMT) software (Wessel and Smith, 1998). We thank Jorge Real Perez and Juan Payero for their efforts in collecting the data and maintenance of the Guerrero GPS network in very complicated field conditions of Southern Mexico.
Supplementary Material
The Supplementary Material for this article can be found online at: https://www.frontiersin.org/articles/10.3389/feart.2020.00155/full#supplementary-material
Footnotes
References
Alchalbi, A., Daoud, M., Gomez, F., Mcclusky, S., Reilinger, R., Romeyeh, M. A., et al. (2010). Crustal deformation in northwestern Arabia from GPS measurements in Syria: slow slip rate along the northern Dead Sea Fault. Geophys. J. Int. 180, 125–135. doi: 10.1111/j.1365-246X.2009.04431.x
Altamimi, Z., Collilieux, X., and Métivier, L. (2011). ITRF2008: an improved solution of the international terrestrial reference frame. J. Geodesy 85, 457–473. doi: 10.1007/s00190-011-0444-4
Andreani, L., Le Pichon, X., Rangin, C., and Martinez-Reyes, J. (2008). The southern Mexico block: main boundaries and new estimation for its Quaternary motion. Bull. Soc. Geol. France 179, 209–223. doi: 10.2113/gssgfbull.179.2.209
Behr, W. M., and Platt, J. P. (2014). Brittle faults are weak, yet the ductile middle crust is strong: implications for lithospheric mechanics. Geophys. Res. Lett. 41, 8067–8075. doi: 10.1002/2014GL061349
Blewitt, G., and Lavallée, D. (2002). Effect of annual signals on geodetic velocity. J. Geophys. Res. Solid Earth 107, 9–11. doi: 10.1029/2001JB000570
Campa, M. F., and Coney, P. J. (1983). Tectono-stratigraphic terranes and mineral resource distributions in Mexico. Can. J. Earth Sci. 20, 1040–1051. doi: 10.1139/e83-094
Cande, S. C., and Kent, D. V. (1992). A new geomagnetic polarity time scale for the Late Cretaceous and Cenozoic. J. Geophys. Res. Solid Earth 97, 13917–13951. doi: 10.1029/92JB01202
Cerca, M., Ferrari, L., Lopez-Martinez, M., Martiny, B., and Iriondo, A. (2007). Late Cretaceous shortening and early Tertiary shearing in the central Sierra Madre del Sur, southern Mexico: insights into the evolution of the Caribbean-North American plate interaction. Tectonics 26:TC3007. doi: 10.1029/2006tc001981
Cohen, S. C. (1999). “Numerical models of crustal deformation in seismic zones,” in Advances in Geophysics, eds D. Renata and S. Barry (Elsevier), 133–231. doi: 10.1016/s0065-2687(08)60027-8
Conrad, C. P., and Lithgow-Bertelloni, C. (2007). Faster seafloor spreading and lithosphere production during the mid-Cenozoic. Geology 35, 29–32. doi: 10.1130/g22759a.1
Cotte, N., Walpersdorf, A., Kostoglodov, V., Vergnolle, M., Santiago, J.-A., Manighetti, I., et al. (2009). Anticipating the next large silent earthquake in Mexico. Eos Trans. AGU 90, 181–182. doi: 10.1029/2009EO210002
DeMets, C. (2001). A new estimate for present-day cocos-caribbean plate motion: implications for slip along the Central American Volcanic Arc. Geophys. Res. Lett. 28, 4043–4046. doi: 10.1029/2001gl013518
DeMets, C., Gordon, R. G., and Argus, D. F. (2010). Geologically current plate motions. Geophys. J. Int. 181, 1–80. doi: 10.1111/j.1365-246X.2009.04491.x
Ducea, M. N., Gehrels, G. E., Shoemaker, S., Ruiz, J., and Valencia, V. A. (2004). Geologic evolution of the Xolapa complex, southern Mexico: evidence from U-Pb zircon geochronology. GSA Bull. 116, 1016–1025. doi: 10.1130/B25467.1
Ego, F., and Ansan, V. (2002). Why is the central trans-mexican volcanic belt (102o-ì99oW) in transtensive deformation? Tectonophysics 359, 189–208. doi: 10.1016/s0040-1951(02)00511-5
Ellis, A., Demets, C., Briole, P., Cosenza, B., Flores, O., Graham, S. E., et al. (2018). GPS constraints on deformation in northern Central America from 1999 to 2017, Part 1 – Time-dependent modelling of large regional earthquakes and their post-seismic effects. Geophys. J. Int. 214, 2177–2194. doi: 10.1093/gji/ggy249
Fasola, S., Brudzinski, M. R., Ghouse, N., Solada, K., Sit, S., Cabral-Cano, E., et al. (2016). New perspective on the transition from flat to steeper subduction in Oaxaca, Mexico, based on seismicity, nonvolcanic tremor, and slow slip. J. Geophys. Res. Solid Earth 121, 1835–1848. doi: 10.1002/2015JB012709
Fasola, S. L., Brudzinski, M. R., Holtkamp, S. G., Graham, S. E., and Cabral-Cano, E. (2019). Earthquake swarms and slow slip on a sliver fault in the Mexican subduction zone. Proc. Natl. Acad. Sci. 116, 7198–7206. doi: 10.1073/pnas.1814205116
Ferrari, L., Orozco-Esquivel, T., Manea, V., and Manea, M. (2012). The dynamic history of the Trans-Mexican Volcanic Belt and the Mexico subduction zone. Tectonophysics 522-523, 122–149. doi: 10.1016/j.tecto.2011.09.018
Franco, A., Lasserre, C., Lyon-Caen, H., Kostoglodov, V., Molina, E., Guzman-Speziale, M., et al. (2012). Fault kinematics in northern Central America and coupling along the subduction interface of the Cocos Plate, from GPS data in Chiapas (Mexico), Guatemala and El salvador. Geophys. J. Int. 189, 1223–1236. doi: 10.1111/j.1365-246X.2012.05390.x
Gaidzik, K., Ramírez-Herrera, M. T., and Kostoglodov, V. (2016). Active crustal faults in the forearc region, Guerrero Sector of the Mexican Subduction Zone. Pure Appl. Geophys. 173, 3419–3443. doi: 10.1007/s00024-015-1213-8
Graham, S., Demets, C., Cabral-Cano, E., Kostoglodov, V., Rousset, B., Walpersdorf, A., et al. (2016). Slow Slip History for the MEXICO Subduction Zone: 2005 Through 2011. Pure Appl. Geophys. 173, 3445–3465. doi: 10.1007/s00024-015-1211-x
Guzman-Speziale, M. (1995). Hypocentral cross-sections and arc-trench curvature. Geofisica Int. 34, 131–141.
Haq, S. S. B., and Davis, D. M. (2010). Mechanics of fore-arc slivers: insights from simple analog models. Tectonics 29:TC5015. doi: 10.1029/2009tc002583
Herring, T. A., King, R. W., and Mcclusky, S. C. (2015). Introduction to GAMIT/GLOBK. Cambridge, MA: Mass. Inst. of Technol.
Jolivet, R., Simons, M., Agram, P. S., Duputel, Z., and Shen, Z. K. (2015). Aseismic slip and seismogenic coupling along the central San Andreas Fault. Geophys. Res. Lett. 42, 297–306. doi: 10.1002/2014GL062222
Kazachkina, E., Kostoglodov, V., Husker, A., and Cotte, N. (2019). Activity of crustal faults and the Xolapa sliver motion in Guerrero–Oaxaca forearc of Mexico, from seismic data. Earth Planet. Space 71:104. doi: 10.1186/s40623-019-1084-9
Klitgord, K. D., and Mammerickx, J. (1982). Northern East Pacific Rise: magnetic anomaly and bathymetric framework. J. Geophys. Res. Solid Earth 87, 6725–6750. doi: 10.1029/JB087iB08p06725
Kostoglodov, V., and Ponce, L. (1994). Relationship between subduction and seismicity in the Mexican Part of the Middle America Trench. J. Geophys. Res. Solid Earth 99, 729–742. doi: 10.1029/93jb01556
Kostoglodov, V., Singh, S. K., Santiago, J. A., Franco, S. I., Larson, K. M., Lowry, A. R., et al. (2003). A large silent earthquake in the Guerrero seismic gap, Mexico. Geophys. Res. Lett. 30:GL017219. doi: 10.1029/2003gl017219
Lamb, S., and Smith, E. (2013). The nature of the plate interface and driving force of interseismic deformation in the New Zealand plate-boundary zone, revealed by the continuous GPS velocity field. J. Geophys. Res. Solid Earth 118, 3160–3189. doi: 10.1002/jgrb.50221
Mammerickx, J., Naar, D. F., and Tyce, R. L. (1988). The mathematician paleoplate. J. Geophys. Res. Solid Earth 93, 3025–3040. doi: 10.1029/JB093iB04p03025
McCaffrey, R. (1992). Oblique plate convergence, slip vectors, and forearc deformation. J. Geophys. Res. Solid Earth 97, 8905–8915. doi: 10.1029/92jb00483
Middleton, T. A., and Copley, A. (2014). Constraining fault friction by re-examining earthquake nodal plane dips. Geophys. J. Int. 196, 671–680. doi: 10.1093/gji/ggt427
Moran-Zenteno, D. J. K., Duncan, J., Martiny, B., and Gonzales-Torres, E. (2009). Reassessment of the Paleogene position of the Chortis block relative to southern Mexico: hierarchical ranking of data and features. Rev. Mexicana Ciencias Geol. 26, 177–188.
Ortega-Gutiérrez, F., Solari, L. A., Ortega-Obregón, C., Elías-Herrera, M., Martens, U., Morán-Icál, S., et al. (2007). The maya-chortís boundary: a tectonostratigraphic approach. Int. Geol. Rev. 49, 996–1024. doi: 10.2747/0020-6814.49.11.996
Pacheco, J. F., Iglesias, A., Singh, S. K., Gutierrez, C., Espitia, G., and Alcantara, L. (2002). The 8 October 2001 Coyuca, Guerrero, Mexico earthquake (Mw 5.9): a normal fault in an expected compressional environment. Seismol. Res. Lett. 73, 263–264.
Pacheco, J. F., and Singh, S. K. (2010). Seismicity and state of stress in Guerrero segment of the Mexican subduction zone. J. Geophys. Res. 115:B01303. doi: 10.1029/2009jb006453
Peña-Alonso, T. A., Molina-Garza, R. S., Villalobos-Escobar, G., Estrada-Carmona, J., Levresse, G., and Solari, L. (2018). The opening and closure of the Jurassic-Cretaceous Xolapa basin, southern Mexico. J. South Am. Earth Sci. 88, 599–620. doi: 10.1016/j.jsames.2018.10.003
Radiguet, M., Cotton, F., Vergnolle, M., Campillo, M., Walpersdorf, A., Cotte, N., et al. (2012). Slow slip events and strain accumulation in the Guerrero gap, Mexico. J. Geophys. Res. 117:B04305. doi: 10.1029/2011jb008801
Ramírez-Herrera, M. T., Gaidzik, K., Forman, S., Bürgmann, R., and Johnson, C. W. (2018). Relating long-term and short-term vertical deformation across of the foreac in the Central mexican subduction zone. Geosphere 14, 419–439. doi: 10.1130/GES01446.1
Riller, U., Ratschbacher, L., and Frisch, W. (1992). Left-lateral transtension along the Tierra Colorada deformation zone, northern margin of the Xolapa magmatic arc of southern Mexico. J. S. Am. Earth Sci. 5, 237–249. doi: 10.1016/0895-9811(92)90023-R
Rogers, R. D., Mann, P., and Emmet, P. A. (2007). “Tectonic terranes of the Chortis block based on integration of regional aeromagnetic and geologic data,” in Geologic and Tectonic Development of the Caribbean Plate Boundary in Northern Central America, ed. P. Mann (Boulder: Geological Society of America).
Roman-Reinoso, S. J. (2004). Procesamiento y Análisis Estratigrátigrafico de Perfiles de Reflexión Sísmica en el Talud Continental del Golfo de Tehuantepec. BSc thesis, Universidad Nacional Atónoma de México, México.
Ryan, W. B. F., Carbotte, S. M., Coplan, J. O., O’hara, S., Melkonian, A., Arko, R., et al. (2009). Global Multi-Resolution Topography synthesis. Geochem. Geophys. Geosyst. 10:GC002332. doi: 10.1029/2008gc002332
Savage, J. C., and Burford, R. O. (1973). Geodetic determination of relative plate motion in central California. J. Geophys. Res. 78, 832–845. doi: 10.1029/JB078i005p00832
Schaaf, P., Morán-Zenteno, D., Hernández-Bernal, M. D. S., Solís-Pichardo, G., Tolson, G., and Köhler, H. (1995). Paleogene continental margin truncation in southwestern Mexico: Geochronological evidence. Tectonics 14, 1339–1350. doi: 10.1029/95TC01928
Smith, B. R., and Sandwell, D. T. (2006). A model of the earthquake cycle along the San Andreas Fault System for the past 1000 years. J. Geophys. Res. Solid Earth 111:B01405. doi: 10.1029/2005JB003703
Smith-Konter, B. R., Sandwell, D. T., and Shearer, P. (2011). Locking depths estimated from geodesy and seismology along the San Andreas Fault System: implications for seismic moment release. J. Geophys. Res. Solid Earth 116:B06401. doi: 10.1029/2010JB008117
Solari, L. A., De León, R. T., Hernández Pineda, G., Solé, J., Solís-Pichardo, G., and Hernández-Treviño, T. (2007). Tectonic significance of Cretaceous, Tertiary magmatic and structural evolution of the northern margin of the Xolapa Complex, Tierra Colorada area, southern Mexico. Geol. Soc. Am. Bull. 119, 1265–1279. doi: 10.1130/b26023.1
Straume, E. O., Gaina, C., Medvedev, S., Hochmuth, K., Gohl, K., Whittaker, J. M., et al. (2019). GlobSed: updated total sediment thickness in the World’s Oceans. Geochem. Geophys. Geosyst. 20, 1756–1772. doi: 10.1029/2018gc008115
Suárez, G., Monfret, T., Wittlinger, G., and David, C. (1990). Geometry of subduction and depth of the seismogenic zone in the Guerrero gap, Mexico. Nature 345:336. doi: 10.1038/345336a0
Suter, M., Quintero, O., and Johnson, C. A. (1992). Active faults and state of stress in the central part of the Trans-Mexican Volcanic Belt, Mexico 1. The Venta de Bravo Fault. J. Geophys. Res. Solid Earth 97, 11983–11993. doi: 10.1029/91JB00428
Talavera-Mendoza, O., Ruiz, J., Corona-Chavez, P., Gehrels, G. E., Sarmiento-Villagrana, A., García-Díaz, J. L., et al. (2013). Origin and provenance of basement metasedimentary rocks from the Xolapa Complex: new constraints on the Chortis–southern Mexico connection. Earth Planet. Sci. Lett. 36, 188–199. doi: 10.1016/j.epsl.2013.03.021
Tolson, G. (2005). La falla Chacalapa en el sur de Oaxaca. Boletín Soc. Geol. Mexic. 57, 111–122. doi: 10.18268/bsgm2005v57n1a6
Unam_Seismology_Group (2013). Ometepec-Pinotepa Nacional, Mexico Earthquake of 20 March 2012 (Mw 7.5): a preliminary report. Geofísica Int. 52, 173–196. doi: 10.1016/S0016-7169(13)71471-5
Unam_Seismology_Group (2015). Papanoa, Mexico earthquake of 18 April 2014 (M w 7.3). Geofísica Int. 54, 363–386.
Vergnolle, M., Walpersdorf, A., Kostoglodov, V., Tregoning, P., Santiago, J. A., Cotte, N., et al. (2010). Slow slip events in Mexico revised from the processing of 11 year GPS observations. J. Geophys. Res. 115:B08403. doi: 10.1029/2009jb006852
Keywords: fault system, oblique subduction, sliver motion, tectonics, GPS, earthquake slip
Citation: Kazachkina E, Kostoglodov V, Cotte N, Walpersdorf A, Ramirez-Herrera MT, Gaidzik K, Husker A and Santiago JA (2020) Active 650-km Long Fault System and Xolapa Sliver in Southern Mexico. Front. Earth Sci. 8:155. doi: 10.3389/feart.2020.00155
Received: 01 February 2020; Accepted: 27 April 2020;
Published: 16 June 2020.
Edited by:
Jeroen Van Hunen, Durham University, United KingdomReviewed by:
Bernard Mercier De Lépinay, Centre National de la Recherche Scientifique (CNRS), FranceLuis E. Lara, Servicio Nacional de Geología y Minería de Chile (SERNAGEOMIN), Chile
Copyright © 2020 Kazachkina, Kostoglodov, Cotte, Walpersdorf, Ramirez-Herrera, Gaidzik, Husker and Santiago. This is an open-access article distributed under the terms of the Creative Commons Attribution License (CC BY). The use, distribution or reproduction in other forums is permitted, provided the original author(s) and the copyright owner(s) are credited and that the original publication in this journal is cited, in accordance with accepted academic practice. No use, distribution or reproduction is permitted which does not comply with these terms.
*Correspondence: Ekaterina Kazachkina, a2F6YWNoa2luYUBpZ2VvZmlzaWNhLnVuYW0ubXg=