 Joaquín M. C. Belart1,2,3*
 Eyjólfur Magnússon1
 Etienne Berthier2
 Ágúst Þ. Gunnlaugsson1,4
 Finnur Pálsson1
 Guðfinna Aðalgeirsdóttir1
 Tómas Jóhannesson4Thorsteinn Thorsteinsson4
 Helgi Björnsson1
- 1Institute of Earth Sciences, University of Iceland, Reykjavík, Iceland
- 2Laboratoire d'Etudes en Géophysique et Océanographie Spatiales, Université de Toulouse, CNES, Toulouse, France
- 3National Land Survey of Iceland, Akranes, Iceland
- 4Icelandic Meteorological Office (IMO), Reykjavík, Iceland
To date, most mass balance studies in Iceland have concentrated on the three largest ice caps. This study turns the focus toward smaller Icelandic glaciers, presenting geodetic mass-balance estimates for 14 of them (total area 1,005 km2 in 2017) from 1945 to 2017, in decadal time spans. These glaciers, distributed over the country, are subject to different climatic forcing. The mass balance, derived from airborne and spaceborne stereo imagery and airborne lidar, is correlated with precipitation and air temperature by a first-order equation including a reference-surface correction term. This permits statistical modeling of annual mass balance, used to temporally homogenize the mass balance for a region-wide mass balance assessment for the periods 1945–1960, 1960–1980, 1980–1994, 1994–2004, 2004–2010, and 2010–2017. The 14 glaciers were close to equilibrium during 1960–1994, with an area-weighted mass balance of 0.07 ± 0.07 m w.e. a−1. The most negative mass balance occurred in 1994–2010, accounting for −1.20 ± 0.09 m w.e. a−1, or 21.4 ± 1.6 Gt (1.3 ± 0.1 Gt a−1) of mass loss. Glaciers located along the south and west coasts show higher decadal mass-balance variability and static mass-balance sensitivities to summer temperature and winter precipitation, −2.21 ± 0.25 m w.e. a−1 K−1 and 0.22 ± 0.11 m w.e. a−1(10%)−1, respectively, while glaciers located inland, north and northwest, have corresponding mass-balance sensitivities of −0.72 ± 0.10 m w.e. a−1 K−1 and 0.13 ± 0.07 m w.e. a−1(10%)−1. These patterns are likely due to the proximity to warm (south and west) vs. cold (northwest) oceanic currents.
1. Introduction
Glacier mass balance is a robust proxy closely linked to climate variations (Ahlmann, 1940; Ohmura, 2011; Vaughan et al., 2013; Bojinski et al., 2014). At high latitudes, mass balance is related to winter precipitation (winter snow) and summer temperature (a proxy for available energy to melt snow and ice). Glaciers have variable response times to changing climate, ranging from a few years to several decades depending on their thickness, slope and mass turnover (Jóhannesson et al., 1989; Lüthi and Bauder, 2010; Harrison, 2013; Roe et al., 2017). They filter out the high frequency seasonal and shorter-term climate variability, resulting in length or volume changes that represent integrated response to longer-term climate variability (Elsberg et al., 2001; Marzeion et al., 2012; Christian et al., 2018).
Glaciological mass-balance observations are sparse and costly, whereas mass balance inferred from remote-sensing observations, e.g., geodetic mass balance (Cogley et al., 2011), has become the most common method to measure glacier-mass changes in glacierized regions without demanding field logistics (Zemp et al., 2019). The remote sensing era started during the early 1900s, and the mapping cameras developed rapidly in the 1930s, leading to numerous airborne and spaceborne photogrammetric and photoreconnaissance surveys worldwide (Livingston, 1963; Spriggs, 1966; Bindschadler and Vornberger, 1998). These surveys provide valuable sources to create Digital Elevation Models (DEMs) with the potential for geodetic mass-balance measurements (e.g., Finsterwalder, 1954; Bolch et al., 2011; Magnússon et al., 2016a; Fieber et al., 2018).
Despite the vast amount of historical archives of stereo images, the geodetic records of the first half of the twentieth century are still scarce and mostly based on contour maps (e.g., Bauder et al., 2007). Observations became fairly common after 1980 (e.g., Fischer et al., 2015) and have been very frequent since 2000 (e.g., Zemp et al., 2019) due to the rapid development and availability of sensors with capabilities to measure the glacier surface geometry (e.g., optical stereoscopic imagery, radar, and lidar).
Spatially distributed geodetic mass balance is available for several glacierized regions, e.g., the Alps (Fischer et al., 2015; Huss et al., 2015; Berthier et al., 2016), Andes (Soruco et al., 2009; Braun et al., 2019; Dussaillant et al., 2019), Greenland (Gardner et al., 2013; Huber et al., 2020), Norway (Andreassen et al., 2020), and High Mountain Asia (Kääb et al., 2012; Brun et al., 2017; Shean et al., 2020). These studies advance the understanding of the relationship between glacier variations and climate, are useful to calibrate regional and global climate models and constrain regional glacier-mass loss and sea-level rise (e.g., Marzeion et al., 2014; Huss et al., 2015).
In Iceland, mass-balance observations have mostly focused on the three largest ice caps: Vatnajökull, Langjökull, and Hofsjökull (7,676, 844, and 813 km2 in 2017, respectively; Hannesdóttir et al., submitted), with a 30-year record of glaciological mass balance (Björnsson and Pálsson, 2008; Pálsson et al., 2012; Björnsson et al., 2013; Thorsteinsson et al., 2017, Aðalgeirsdóttir et al., submitted). These account for about 90% of the total glacierized area, and their mass-balance records have been used to estimate the Icelandic glacier-mass loss and sea-level rise contribution (Björnsson et al., 2013). Other glaciers and ice caps are less significant for the total Icelandic mass loss, but they are spatially distributed across all parts of Iceland and have the potential to provide insights into regional climate variations.
The aim of this study is to produce a catalog of maps of elevation difference and a 70-year record of geodetic mass balance of spatially distributed glaciers in Iceland. The mass balance is statistically correlated to records of temperature and precipitation to infer its static sensitivity to climate fluctuations, and the mass balance is temporally homogenized for a region-wide multi-temporal mass-balance study. The results are discussed in the context of climate-driven changes of the 14 glaciers.
2. Study Areas
For the current study, 14 glaciers and ice caps were selected, distributed across all parts of Iceland (Figure 1). They are located in different climatic regimes: the climate near the southern coast is influenced by the warm Irminger oceanic current, whereas the climate at the northern coast is affected by the cold East Greenland oceanic current (e.g., Björnsson and Pálsson, 2008; Björnsson et al., 2013). Geodetic mass-balance estimates have recently been obtained for three of the glaciers: Drangajökull (Magnússon et al., 2016a), Tungnafellsjökull (Gunnlaugsson, 2016), and Eyjafjallajökull (Belart et al., 2019). Glaciological mass-balance observations have been carried out at a few locations on Mýrdalsjökull since 2001 (Ágústsson et al., 2013) and on Drangajökull during 2005–2015 (e.g., Belart et al., 2017; Anderson et al., 2018). Previous studies have also calculated geodetic mass balance over one to two decades on Snæfellsjökull (Jóhannesson et al., 2011), Eyjafjallajökull, Tindfjallajökull, and Torfajökull (Guðmundsson et al., 2011). The rest of the glaciers have very limited, or no, previous mass-balance observations.
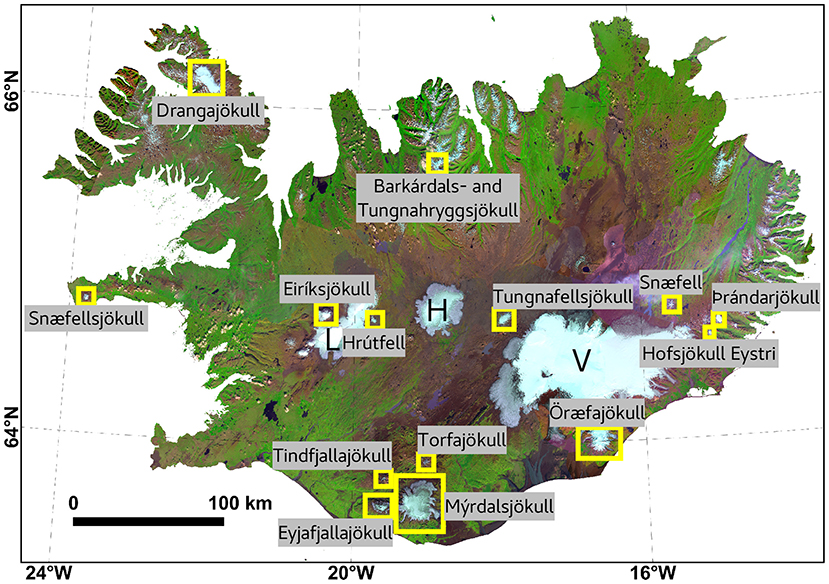
Figure 1. Map of Iceland showing the 14 glaciers of this study (yellow boxes), as well as the three largest ice caps: Langjökull (L), Hofsjökull (H), and Vatnajökull (V). Background: composite mosaic from Landsat 8 (www.usgs.gov), created by the National Land Survey of Iceland (www.lmi.is).
The size of the glaciers varies from 3 km2 for Hofsjökull Eystri to 517 km2 for Mýrdalsjökull, and their total area is 1,005 km2, or 9.8% of the total of Icelandic glaciers in 2017; Hannesdóttir et al., submitted. Their elevation span ranges from ~200 m (Hofsjökull Eystri) to ~2,000 m (Öræfajökull). Further characteristics of the studied glaciers are shown in Table 1.
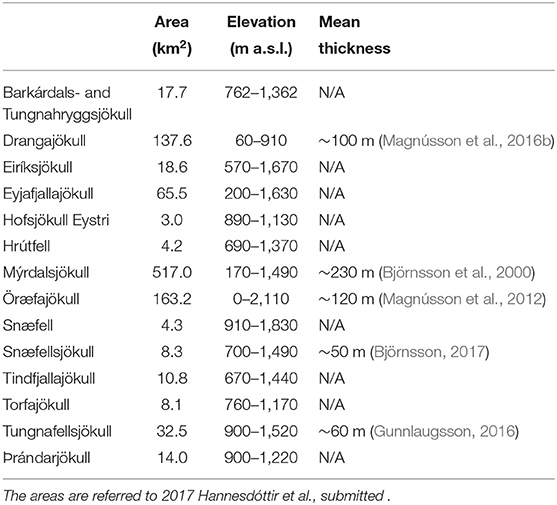
Table 1. Overview of 14 glaciers and ice caps.
The three largest ice caps, Vatnajökull, Langjökull, and Hofsjökull, were excluded from this study with the exception of Öræfajökull, which is a part of Vatnajökull (Figure 1). This was due to the complexity of the required processing for those large glaciers: the relatively small footprint of the historical aerial photographs in comparison with the glacier area would limit the availability of bare ground areas needed for reference (i.e., in the vicinity of the ice cap and nunataks) for a large amounts of aerial photographs, causing large distortions in the resulting DEMs. The aerial surveys of these ice caps were also carried out over multiple dates (months to years), complicating the mosaicking and interpretation of the results.
3. Data
The data used in this study are described by Belart et al. (2019), and consists of a large collection of stereoscopic imagery available in Iceland from 1945 to 2017, from airborne and spaceborne, frame camera and pushbroom sensors, together with airborne lidar data (Figure 2).
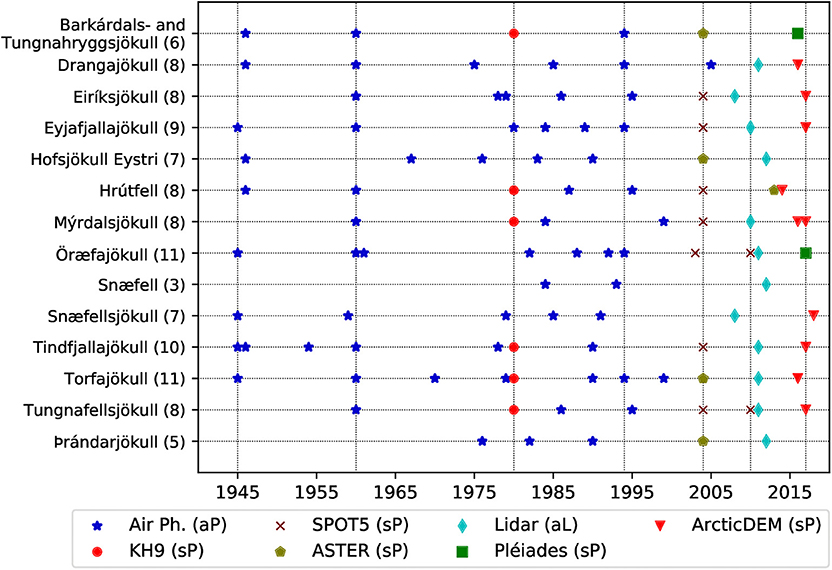
Figure 2. Temporal distribution of the datasets for each glacier. The numbers in parentheses indicate the amount of surveys carried out on each glacier. Vertical lines are emplaced at the most repeated survey times, based on airborne photogrammetry (aP, 1945, 1960, 1994) and spaceborne photogrammetry (sP, 1980). 2004 contained abundant measurements from SPOT 5 (Korona et al., 2009) and ASTER (Raup et al., 2007). The airborne lidar (aL) surveys are spread over five years and adjusted to year 2010 (Jóhannesson et al., 2013). Recent satellite sub-meter stereo images from Pléiades (Berthier et al., 2014) and the ArcticDEMs (Porter et al., 2018) were acquired during 2016–2018 and adjusted to 2017.
A total of 836 aerial photographs acquired during 1945–1995 were collected from the National Land Survey of Iceland. The interval between surveys for each glacier was ~10–20 years (e.g., Magnússon et al., 2016a; Pedersen et al., 2018; Belart et al., 2019). An additional series of photographs of Mýrdalsjökull and Torfajökull (acquired in 1999) were obtained from the private company Loftmyndir.
This study also used a DEM and orthoimage based on six images from Hexagon KH9 satellite acquired in August 1980, originally processed in Belart et al. (2019). They covered eight of the 14 glaciers, (from south to north) Eyjafjallajökull, Mýrdalsjökull, Tindfjallajökull, Torfajökull, Hrútfell, Tungnafellsjökull, Barkárdals-, and Tungnahryggsjökull.
In 2002–2015, SPOT 5 acquired numerous satellite stereo images of glacierized areas, particularly through the SPOT 5 Stereoscopic Survey of Polar Ice: Reference Images and Topographies (SPIRIT) project (Korona et al., 2009). This provided datapoints through the 2000s for Eyjafjallajökull, Mýrdalsjökull, Tindfjallajökull, Eiríksjökull, Hrútfell, Öræfajökull, and Tungnafellsjökull. The two last-mentioned glaciers include two acquisitions, in 2003/2004 and 2010.
Advanced Spaceborne Thermal Emission and Reflection Radiometer (ASTER) satellite stereo images, with modified gain setup specifically for surveying glaciers through the Global Land Ice Measurements from Space (GLIMS) project (Raup et al., 2007), were used for Barkárdals- and Tungnahryggsjökull, Torfajökull, Þrándarjökull, and Hofsjökull Eystri in 2004, and for Hrútfell in 2013.
The lidar datasets were collected between 2008 and 2012, starting with Snæfellsjökull and Eiríksjökull and finishing with Snæfell and Þrándarjökull (Figure 2; Jóhannesson et al., 2013). Pléiades satellite stereo images (Berthier et al., 2014) were acquired over the summers 2016 (Barkárdals- and Tungnahryggsjökull) and 2017 (Öræfajökull). Both of them were surveyed in two satellite acquisitions over the course of two weeks. Data from the ArcticDEM (Porter et al., 2018) from 2013 to 2018 were also used.
The large majority of the surveys (~80%) were carried out in August, September, or October. ~15% were carried out in July, one in June and one in November. Most of the surveys from 1945/1946 were done in late September or early October.
Daily gridded climatic records were used: linearly modeled precipitation from 1958 to 2007 (LT, 1 × 1 km; Crochet et al., 2007), numerically downscaled modeled precipitation from 1980–2019 (HARMONIE, 2.5 × 2.5 km; Nawri et al., 2017) and interpolated temperature from 1948 to 2019 based on meteorological stations (1 × 1 km; Crochet and Jóhannesson, 2011). The gridded precipitation and temperature were measured in millimeters and Celsius degrees, respectively. Remarks on the data quality and associated uncertainties of the climatic records can be found in the mentioned studies and in Belart et al. (2019).
The glacier margins of Icelandic glaciers in ~2000 were extracted from the GLIMS inventory (Raup et al., 2007), as a first approximation of the glacier outlines of the 14 glaciers.
4. Methods
For each of the glaciers, the processing steps described by Belart et al. (2019) were followed, and we refer the readers to that article for further technical details. In summary, these consist of: (1) processing of stereo imagery and DEMs for creation of co-registered orthoimages, DEMs and difference of DEMs (dDEM); (2) glacier outline delineating for the two analyzed dates; (3) bias correction and uncertainty estimation in the volume changes using Sequential Gaussian Simulation (SGSim; Magnússon et al., 2016a); (4) filtering of outliers, gap filling and calculation of volume changes; (5) applying a seasonal correction to account for the volume change between the date of each survey and 1 October of the respective year; (6) geodetic mass-balance estimation, using a conversion factor of 850 ± 60 kg m−3 between volume and mass change (Huss, 2013). This workflow resulted in two values of geodetic mass balance, Ḃ, one relative to the survey dates (floating-date system) and one fixed to the hydrological year, 1 October to 30 September (fixed-date system).
The photogrammetric processing of the aerial photographs (step 1) was done with MicMac software (Pierrot Deseilligny and Clery, 2011; Rupnik et al., 2017) using Ground Control Points (GCPs) extracted from a reference, in most cases from a lidar DEM, except for Barkárdals- and Tungnahryggsjökull (Pléiades DEM and orthoimage, Papasodoro et al., 2015), and Hrútfell (ArcticDEM). The pushbroom stereo images, i.e., Pléiades, ASTER, and SPOT 5 data, were processed using Ames StereoPipeline (ASP) software (Shean et al., 2016, 2020). The resulting DEMs and orthoimages, as well as the ArcticDEMs, were co-registered to the aforementioned reference using the Iterative Closest Point method in ASP (Shean et al., 2016).
The glacier outlines obtained from GLIMS were updated using the orthoimages (shaded relief images of the DEMs when no orthoimages were available). We modified the definition of the margins of N-Eiríksjökull, where we included the debris-covered ice in the low areas (Figure S3). When gaps in the orthoimages were present at particular locations of the margins, due to clouds or bad stereo coverage, the outline was completed using aerial photographs, Landsat, or ASTER data with dates differing up to 2 years from the year-of-interest.
The SGSim method (Magnússon et al., 2016a), used for retrieving uncertainties and bias correction in the volume changes, required as input the ice-free areas of the dDEMs, manually masked from outliers. Semivariograms were created from the dDEMs on ice-free areas and manually fitted into semivariogram models. A total of 1,000 SGSims were run on each glacier, obtaining a map of errors propagated onto the respective glacier. These maps of errors were then subtracted from the dDEMs to locally remove systematic errors in elevation, and a histogram retrieved from the SGSim was used to extract the uncertainty of the volume change obtained from the dDEMs (95% confidence level).
The seasonal correction applied is based on a degree-day melt model combined with a late-summer snow accumulation model, using the daily gridded climate records. The setup parameters and uncertainties of the model are described in Belart et al. (2019). This seasonal correction model was run using bootstrapping, and from the 1,000 realizations of the runs we obtained a volume change from the date of survey to the 1 Oct, as well as the associated uncertainty (95% confidence level).
In some cases, we combined DEMs from surveys carried out up to two years apart, in order to fill gaps in the maps of elevation difference. This was done for Tindfjallajökull (70% in Sep 1945 and 30% in Sep 1946), Öræfajökull (60% in Aug 1960 and 40% in Jul 1960, and 50% in Aug 1992 and 50% in Aug 1994), Eiríksjökull (80% in Aug 1978 and 20% in Aug 1979), and Mýrdalsjökull (90% in 2016 and 10% in 2017). Each of the surveys covered the majority of the elevation span of the respective ice cap. In these cases the dDEM with smaller coverage was shifted to the main dDEM by the mean difference of the overlapping areas of the mosaic.
Remaining gaps in the maps of elevation difference (due to incomplete surveys, cloud presence, and lack of texture in the images) were interpolated as a function of elevation, using the local hypsometric method (e.g., Brun et al., 2017; McNabb et al., 2019). The uncertainty of these areas was increased based on the number of datapoints and variations in elevation difference for each elevation band (Supplement S1). The uncertainty of each geodetic mass balance was calculated as the square root of the sum of squares of the derivative of the mass balance with respect to each of the variables involved (Belart et al., 2019). The resulting uncertainty was subsequently combined with the uncertainty due to data gaps as the root sum of their squares.
Annual mass balance and static mass-balance sensitivities were calculated by correlating the fixed-date geodetic mass balance to the climatic records, using the following equation (Belart et al., 2019)
where Ts and Pw are mean summer temperature and winter precipitation at the equilibrium line altitude (ELA), respectively. The summer is defined from 21 May to 30 September, the approximate period when the temperature is typically positive at the ELA and the aimed dates for the glaciological mass balance campaigns in Iceland (e.g., Belart et al., 2017, 2019). The winter precipitation is normalized, i.e., divided by the average winter precipitation of the available records (Oerlemans and Reichert, 2000). The ELA is assumed to be the snowline in ~2004, and unchanged over the period of study for simplicity. The term is the difference between a reference area, e.g., 1960, and the average area between each two years of survey. Together with γ and k, this serves as a correction to relate conventional and reference-surface mass balance (Elsberg et al., 2001; Harrison et al., 2001), and gives a better correlation of mass balance with climate (Cogley et al., 2011; Huss et al., 2012). The reference-surface term is simplified by assuming that relative changes in glacier area and ice volume are linearly related for the analyzed time period (Pálsson et al., 2012; Belart et al., 2019).
Equation (1) was solved with a least-squares fit, weighted with mass-balance uncertainties (Belart et al., 2019). The coefficients ϕ and ω are equivalent to the static mass-balance sensitivity of mass balance to summer temperature (δḂ/δTs, m w.e. a−1 K−1) and winter precipitation (δḂ/δPw, m w.e. a−1 (10%)−1), respectively. We solved the least-squares fit for individual glaciers, obtaining a set of ϕ, ω, γ and k for each glacier. This, however, led to unrealistically high and low sensitivity to summer temperature for Snæfellsjökull and Þrándarjökull, respectively, likely due to a limited number of observations available for these glaciers. We then grouped the glaciers in two sets, using a threshold of 1.4 m w.e. a−1K−1 from the initial sensitivities. This criteria fitted with the regional characteristics of the grouped glaciers: glaciers located at the southern and western coasts (Eyjafjallajökull, Mýrdalsjökull, Öræfajökull, Snæfellsjökull, Tindfjallajökull, and Torfajökull) and glaciers in central, northern, and eastern Iceland (Drangajökull, Eiríksjökull, Hrútfell, Tungnafellsjökull, Barkárdals- and Tungnahryggsjökull, Hofsjökull Eystri, and Þrándarjökull).
We performed the least-squares fit for each group of glaciers, calculating one single coefficient ϕ and ω per group, while the coefficients γ and k were determined for each individual glacier within the group. The least-squares fit did not include Snæfell, for which only two geodetic mass balances are available (Figure 2).
For a decadal, region-wide comparison, we selected the years 1945, 1960, 1980, 1994, 2004, 2010, and 2017 as the most common survey years (Figure 2). The geodetic mass balance of each glacier was temporally homogenized (e.g., Lambrecht and Kuhn, 2007; Fischer et al., 2015) to these years when needed, by using the modeled annual mass balance from Equation (1). An uncertainty of ±0.5 m w.e. a−1 was assumed for each year of modeled annual mass balance when calculating the temporally-homogenized mass balance. The annual correction was not applied to datasets acquired in 1946 due to lack of climate data.
We also estimated the geodetic mass balance for two additional, longer, time periods: 1960–1994 (relatively cold period and close to zero balance) and 1994–2010 (warmer period and the largest ice wastage). These additional geodetic mass balances were estimated using the DEMs closest in time to 1960, 1994, and 2010. They were corrected to the hydrological year, and temporally homogenized when needed, using the modeled annual mass balances.
5. Results
Over 100 DEMs of the 14 glaciers, between 1945 and 2018, were utilized in this study. This included the creation of 63 DEMs from historical aerial photographs. The gaps on the glaciers were on average 15% of the total glacier area; seven DEMs contained gaps that were >30% of the glacier area, with a maximum of 40% on Snæfellsjökull in 1945 and 1959. A time series of elevation changes for each of the glaciers is shown in Supplement S2.
A total of 96 geodetic mass balances were computed, a number increasing to 111 after including the results from Magnússon et al. (2016a) and Belart et al. (2019), i.e., eight time periods on average for each of the 14 glaciers, and nine of them starting in 1945 (Figure 3). Tabulated observations of floating-date and fixed-date geodetic mass balance are provided in Supplement S3. These observations are also available at the World Glacier Monitoring Service (WGMS, www.wgms.ch).
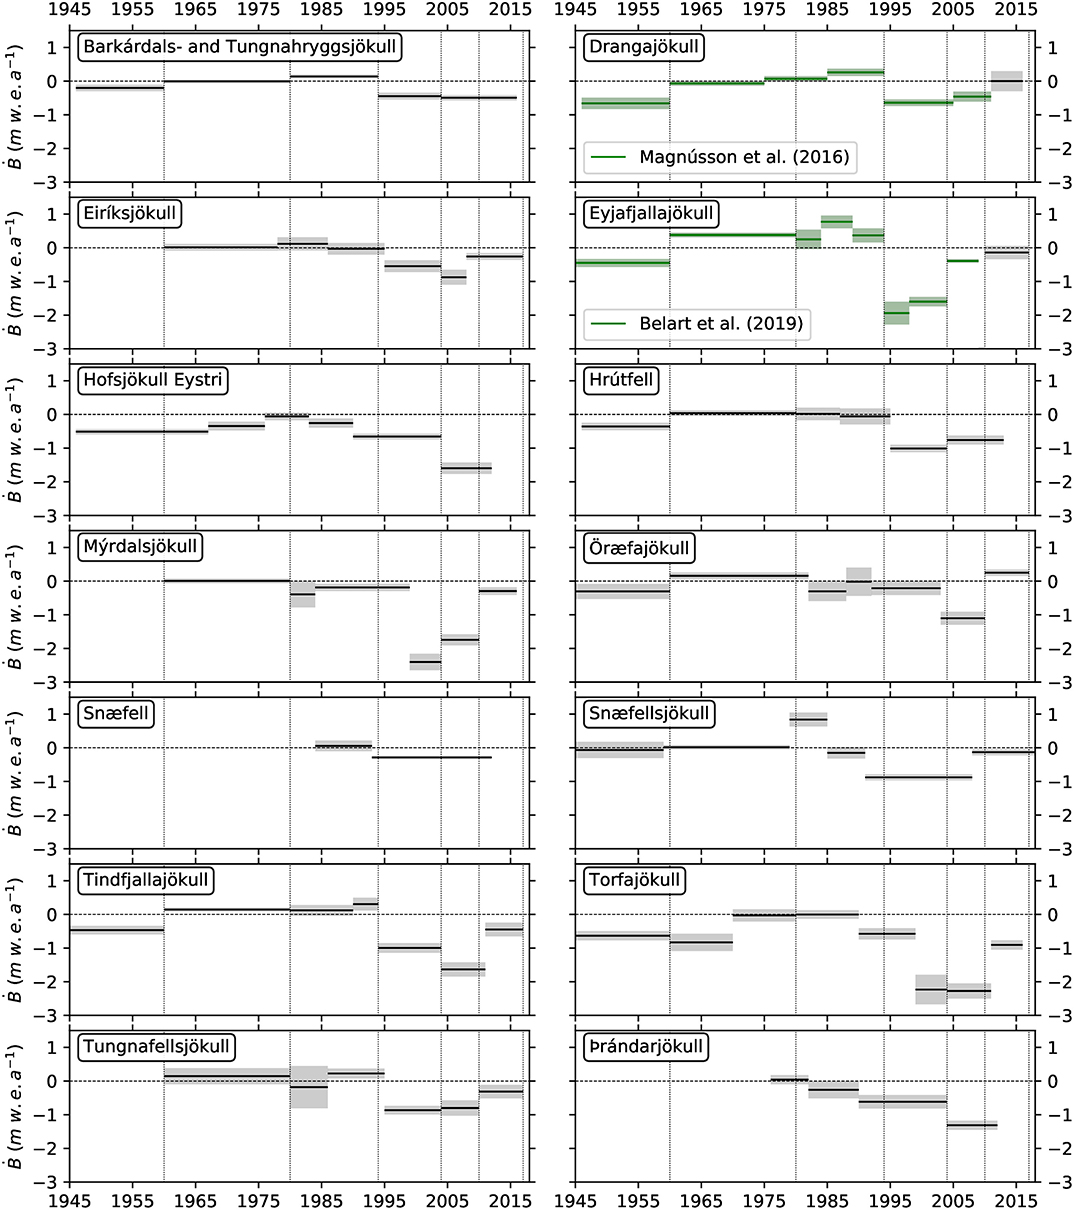
Figure 3. Glacier-wide geodetic mass balance of the 14 glaciers. The mass balance is estimated from 1 October to 30 September (fixed-date system), based on seasonal corrections. Gray bands indicate uncertainty at 95% confidence level (Magnússon et al., 2016a). Dashed vertical lines show the years selected for a region-wide, temporally homogenized mass-balance comparison. Additional mass balances can be found in Table S1, relative to longer time periods and for Torfajökull (1970–1979 and 1979–1990) and Tindfjallajökull (1960–1978 and 1978–1980), which are further analyzed in the discussion.
Uncertainties in the geodetic estimates were typically <0.1 m w.e. a−1 (95% confidence level) for periods longer than 10 years, but they increased for the shorter time periods (e.g., Huss, 2013) or if the DEMs contained significant gaps. The maximum and minimum fixed-date geodetic mass balances were, respectively, 0.84 ± 0.21 m w.e. a−1 on Snæfellsjökull in 1985–1991 and −2.40 ± 0.25 m w.e. a−1 on Mýrdalsjökull in 1999–2004. The seasonal correction was generally small (<0.1 m w.e. a−1) over ~10-year periods, but was significantly larger for the shorter time periods (e.g., Belart et al., 2019).
The obtained mass-balance sensitivity to summer temperature was −2.21 ± 0.25 m w.e. a−1 K−1 for the group of high-sensitivity glaciers, and −0.72 ± 0.10 m w.e. a−1 K−1 for the group of low-sensitivity glaciers. The sensitivities to winter precipitation are 0.22 ± 0.11 m w.e. a−1 (10%)−1 for the high-sensitivity glaciers, and 0.13 ± 0.07 m w.e. a−1 (10%)−1 for the low-sensitivity glaciers.
The fit between mass balance and climatic variables (Equation 1) yielded a high correlation between observed and statistically derived mass balance, with a coefficient of determination R2 = 0.71 for the group of high-sensitivity glaciers and R2 = 0.77 for the group of low-sensitivity glaciers (Table 2). This correlation was substantially lower in a combined least-squares fit using all glaciers in one single group (R2 = 0.59) or assuming γ = 0, i.e., without adding the reference-surface correction term (Table 2).
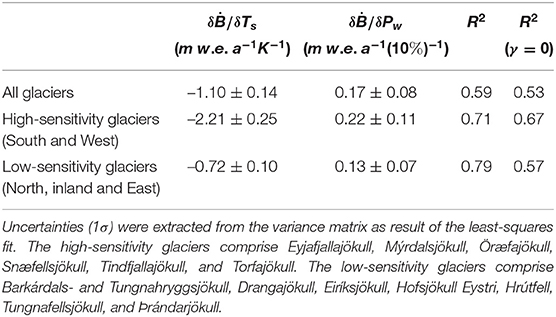
Table 2. Mass-balance sensitivities of the glaciers to a 1°C rise in temperature and to a 10% increase in precipitation.
The mean (standard deviation in parenthesis) mass balance, calculated without area-weights, of the 14 glaciers was −0.42 (0.17) m w.e. a−1 in 1945–1960, 0.00 (0.21) m w.e. a−1 in 1960–1980, 0.12 (0.21) m w.e. a−1 in 1980–1994, −1.01 (0.45) m w.e. a−1 in 1994–2004, −1.22 (0.63) m w.e. a−1 in 2004–2010, and −0.18 (0.22) m w.e. a−1 in 2010–2017. The area-weighted mean (standard deviation in parenthesis) was 0.04 (0.12) m w.e. a−1 in 1960–1980, 0.10 (0.14) m w.e. a−1 in 1980–1994, −1.27 (0.53) m w.e. a−1 in 1994–2004, −1.32 (0.51) m w.e. a−1 in 2004–2010, and −0.18 (0.22) m w.e. a−1 in 2010–2017. No area-weighted value was calculated for 1945–1960 due to the lack of observations for Mýrdalsjökull (by far the largest glacier among the 14) in this time period. Tabulated results of the temporally homogenized geodetic mass balance and associated uncertainties (95% confidence level) are shown in Supplement S4.
The overall results from 1960 to 1994 indicate a near-zero balance for the 14 glaciers. Most of the mass loss occurred in 1994–2010: 21.4 ± 1.6 Gt (1.3 ± 0.1 Gt a−1), or 0.059 ± 0.005 mm Sea Level Equivalent (SLE). In this time period, Mýrdalsjökull accounted for about 70% of the mass loss. The group of glaciers <100 km2 contributed significantly more to the mass loss than some larger (>100 km2) ice caps such as Öræfajökull, and more than twice as much as Drangajökull for the same period (Table 3).
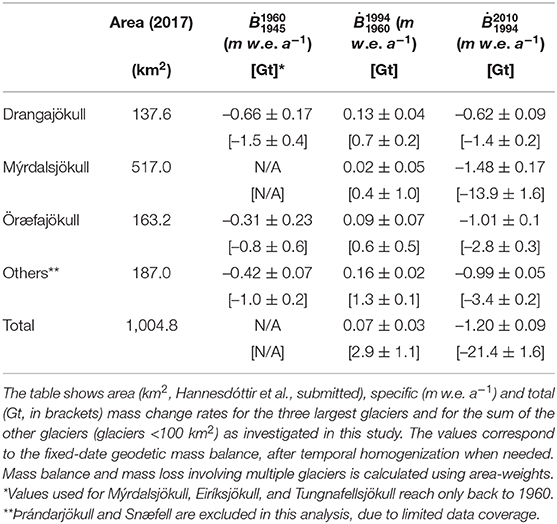
Table 3. Mass changes of 14 Icelandic glaciers from 1945–1960 to 1994–2010.
6. Discussion
6.1. Spatio-Temporal Mass Balance and Climate Distribution
The long (>100-year) temperature record from Stykkishólmur (W-Iceland) indicates a maximum in the 1930s followed by gradual cooling until the 1960s, and then warming again in the 1990s. During 1945–1960, the glaciers experienced mass losses (Figure 4A). During 1960–1980 most of the glaciers had a close to zero mass balance, with the exception of Torfajökull and Mýrdalsjökull, which had slightly negative mass balance. Most glaciers gained mass or were close to equilibrium in 1980–1994, with the highest mass gain on Snæfellsjökull (W) and Eyjafjallajökull (S) (Figures 3, 4B,C, 5). These observations of mass balance during 1945–1990 agree with previous studies on several Icelandic glaciers (Pálsson et al., 2012; Björnsson et al., 2013; Hannesdóttir et al., 2015).
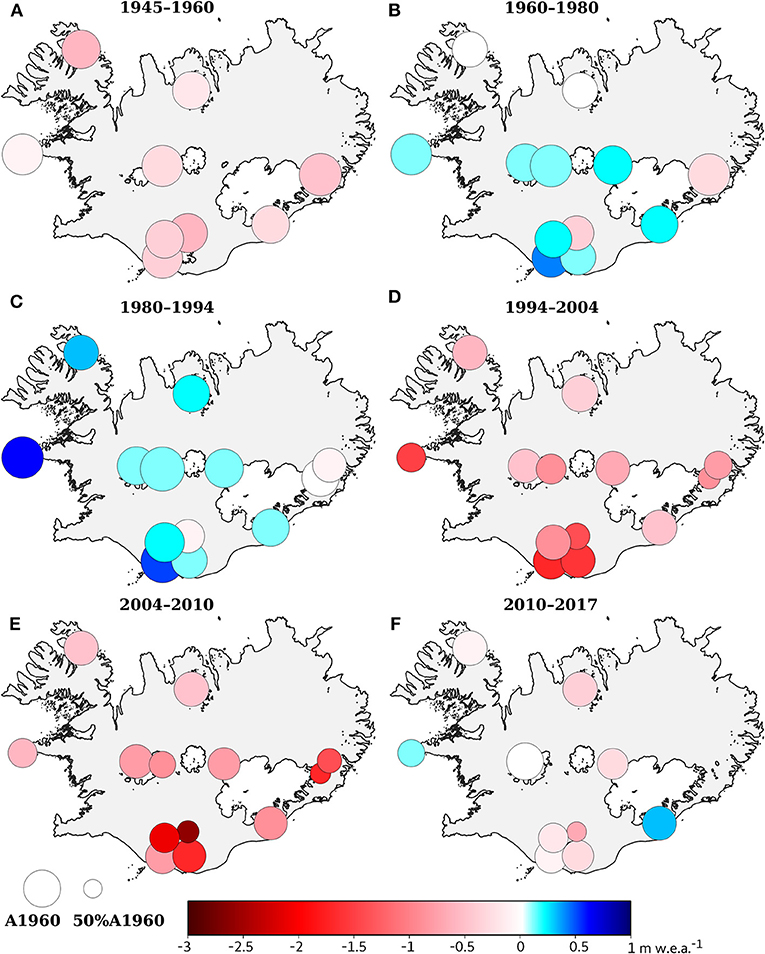
Figure 4. Glacier-wide geodetic mass balance for six time periods between 1945 and 2017. (A) 1945–1960. (B) 1960–1980. (C) 1980–1994. (D) 1994–2004. (E) 2004–2010. (F) 2010–2017. Red and blue colors indicate negative and positive mass balance, respectively. The size of each circle shows the ratio of area changes relative to 1960. Tabulated values of temporally homogenized mass balance and associated uncertainties (95% confidence level) are shown in Table S2.
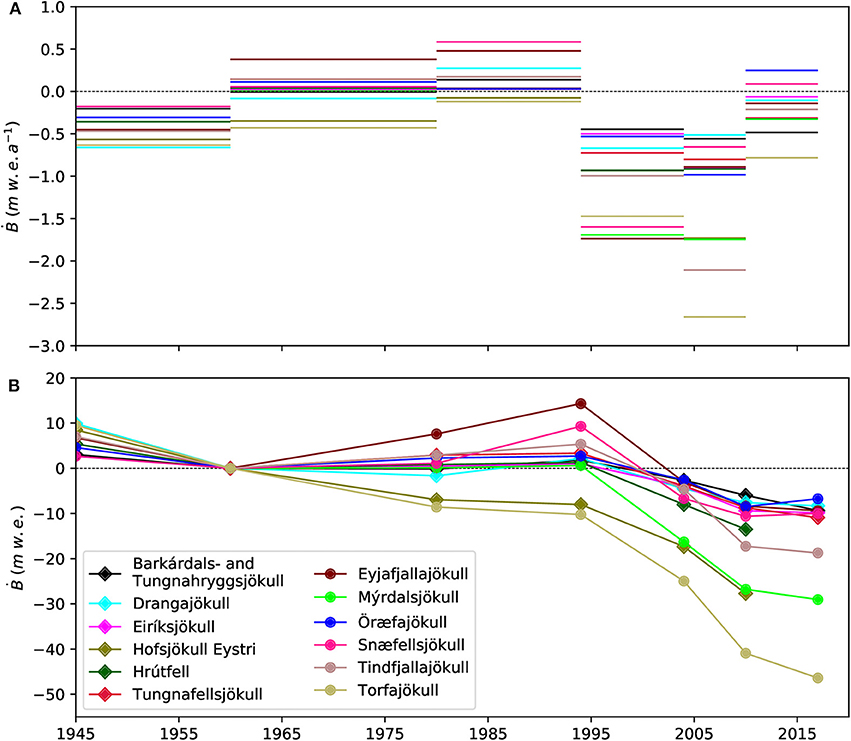
Figure 5. (A) Average mass balance after temporal homogenization during the six time periods. (B) Cumulative mass balance centered on 1960 (common year for the selected glaciers). Diamonds indicate glaciers located in the interior, North and East of Iceland and circles glaciers on South and West Iceland.
A substantial mass loss was experienced by the 14 glaciers in 1994–2010 (Figures 4D,E). The highest mass loss is found at coastal glaciers in the south and west and glaciers located at lower elevations (lower than ca. 1,200 m a.s.l., Table 1). The area-weighted mass balance of the 14 glaciers was −1.27 ± 0.09 m w.e. a−1 in this period (Table 3), similar to the glaciological mass balance measured at Hofsjökull and Langjökull (−1.3 m w.e. a−1), but more negative than for Vatnajökull (−0.8 m w.e. a−1) (Pálsson et al., 2012; Björnsson et al., 2013; Thorsteinsson et al., 2017) during the same period. The presented results for the periods 1994–2010 and 2004–2010 also encompass the effects of the increased summer melt of 2010 as a consequence of the Eyjafjallajökull eruption in 2010 (e.g., Björnsson et al., 2013).
There was less mass loss in 2010–2017 than in the previous two decades (Figure 4F), as has been also observed in Greenland (Shepherd et al., 2020), in mainland Norway (Andreassen et al., 2020), and also in Iceland by gravimetric methods (Wouters et al., 2019) and by glaciological observations (Aðalgeirsdóttir et al., submitted). Öræfajökull gained mass during this period (0.43 ± 0.08 m w.e. a−1) and some of its outlets have shown significant advances (Figure S9). It covers the largest elevation range (0–2,100 m a.s.l.), collects the highest amount of precipitation in Iceland (Crochet et al., 2007) with likely summer snowfalls and has steep outlets leading to rapid mass transport. The modeled precipitation used in our study (Nawri et al., 2017) indicates increased winter precipitation in recent years on Öræfajökull.
The decadal variability of mass balance is strongly related to the proximity of the glaciers to the coasts (Figure 6). Glaciers located at the south and west coast are classified as maritime (e.g., De Woul and Hock, 2005) and show large mass-balance variations and high static sensitivities to summer temperature and winter precipitation. The inland glaciers are subject to rain shadows and experience less variable precipitation. Their temporal variability in mass balance may be explained by differences in elevation. Torfajökull and Tindfjallajökull have a narrower elevation span, larger decadal mass-balance variability and are more sensitive to temperature changes than other inland glaciers, hence they were included in the coastal glaciers group. Glaciers farther north, like Drangajökull and the glaciers on Tröllaskagi, have significantly lower mass-balance decadal variability and sensitivities and are situated close to the cold East Greenland oceanic current (Björnsson et al., 2013). Þrándarjökull and Hofsjökull Eystri, despite being located near the SE coast, show lower sensitivity to summer temperature and were grouped with the central and northern glaciers.
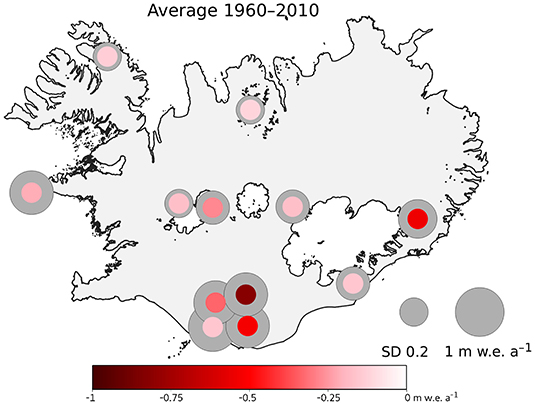
Figure 6. Mass-balance average over the period 1960–2010. The size of the gray circles shows the temporal variability, estimated for each glacier as the standard deviation of the temporally homogenized mass balance, using a weight based on the length of each time period.
The regional pattern of high decadal mass-balance variability and sensitivities also fits the regional pattern of average melt-season albedo during 2000–2019 estimated for most Icelandic glaciers by Gunnarsson et al. (2020). The southern glaciers have significantly lower average melt-season albedo than the glaciers located in central or northern Iceland. This can be partly explained by the two aforementioned climatic regimes: higher summer temperatures in the southern glaciers lead to stronger melt and an early appearance of the firn and ice layer, and the opposite effect would occur in the central and northern glaciers. However, this is also partly explained by the presence of more dust and tephra on the southern glaciers, which can also significantly lower the albedo (e.g., Möller et al., 2014, 2019; Gunnarsson et al., 2020).
We observed high intraregional variability of mass balance, particularly prominent for Tindfjallajökull, Torfajökull, Eyjafjallajökull, and Mýrdalsjökull (S-Iceland, within 40 km of each other). Analogously, different catchments of some of the glaciers can exhibit substantial differences in mass balance: (1) Drangajökull shows strong differences in mass balance between the eastern and western catchments, probably associated with the effects of precipitation and snow drift (Magnússon et al., 2016a,b; Belart et al., 2017). (2) On Mýrdalsjökull, the northern (inland) outlets show an almost continuous lowering during all observed time periods, as opposed to the southern (coastal) outlets, which show fluctuations between lowering and thickening through the past decades (Figure S8). The same pattern is observed on Vatnajökull (Björnsson et al., 2013) and can be explained by the maritime regime of the southern outlets, with most precipitation falling at these locations, while the northern outlets are located in a rain shadow (Crochet et al., 2007; Ágústsson et al., 2013). (3) One of the outlets of Öræfajökull is affected by significant calving at its terminus (Magnússon et al., 2012), causing more negative mass balance than the rest of the ice cap (Figure S9).
Mýrdalsjökull contributed 70% of the mass loss of the studied glaciers in 1994–2010, although it accounts for only about 50% of the area encompassed by the 14 glaciers (Table 3). This shows that extrapolation of mass balance from a few glaciers to an entire region (e.g., Björnsson et al., 2013) can lead to erroneous estimates of mass loss from small glaciers. In this context, Mýrdalsjökull and the southern small glaciers contribute more to sea-level rise than the northern glaciers, like Drangajökull or the cluster of glaciers in Tröllaskagi. Nevertheless, the small glaciers cover 10% of the total glacierized area of Iceland, and their mass loss is close to one order of magnitude smaller than for the entire country (9.5 Gt a−1, Björnsson et al., 2013, vs. 1.3 Gt a−1).
In comparison with to long-term (>50-year) mass-balance observations in other glacierized regions, the evolution of Icelandic glaciers has followed similar patterns during the study period to those observed in the Alps (Huss et al., 2010), Pyrenees (Marti et al., 2015), or in tropical glaciers as in Cordillera Real (Soruco et al., 2009). The intraregional variability observed in Iceland during 1994–2004 (SD = 0.44 m w.e. a−1, N = 13) and 2004–2010 (SD = 0.57 m w.e. a−1, N = 13) appears to be similar to that in the Himalayas in 2000–2016 (Brun et al., 2017). Some other glacierized regions such as the Alps have, however, experienced more homogeneous mass loss during the last few decades (Fischer et al., 2015).
6.2. Statistical Estimation of Mass Balance From Precipitation and Temperature Records
A first-order equation (Equation 1) can be used to estimate the annual mass balance as a function of summer temperature, winter precipitation and area, permitting a practical temporal homogenization of geodetic mass balance (e.g., Lambrecht and Kuhn, 2007; Fischer et al., 2015). The mass balance correlates well with climatic variables (Cogley et al., 2011; Huss et al., 2012). In other words, a large fraction of the mass-balance variability can be explained by variations in summer temperature and winter precipitation, in addition to feedback effects due to changes in the geometry of the glacier. The reference-surface correction term improves the fit (R2, Table 2) by up to 20% for the group of central and northern glaciers.
The initial results when the Equation (1) was solved for individual glaciers (as opposed to groups of glaciers) led to unrealistically high and low mass-balance sensitivities for Snæfellsjökull and Þrándarjökull, respectively. This can be attributed to the limited observations used for these two glaciers, but also by other factors mentioned in the following discussion. Grouping the glaciers in two regions added robustness to the statistical analysis. The obtained sensitivities agree with the range of sensitivities calculated by De Woul and Hock (2005) for specific outlet glaciers of Vatnajökull [ranging −1.5 to −2 m w.e. a−1 K−1 and 0.2 to 0.3 m w.e. a−1 (10%)−1], similar to our estimates for the southern glaciers, and for specific outlet glaciers of Hofsjökull [ranging −0.7 to −1.3 m w.e. a−1 K−1 and 0.1 m w.e. a−1 (10%)−1], similar to our estimates for the central and northern glaciers. Based on the joint analysis of mass balance and climate, we find that, for the group of southern and western glaciers, the mass loss during 1994–2010 was entirely attributed to an increase in summer temperature relative to 1960–1994, while the winter precipitation remained approximately constant on average during these two time periods.
Torfajökull, with DEMs acquired in 1979 and 1980, and Tindfjallajökull, with DEMs acquired in 1978 and 1980, served as a test of the temporal homogenization. For these two glaciers, applying temporal homogenization using the 1978 and 1979 DEMs (i.e., 1 and 2 years apart from 1980) had similar results to using the 1980 DEM, with differences lower than 0.1 m w.e. a−1 between observed and temporally homogenized mass balances, which is within the uncertainty of the geodetic estimates. Additionally, area-weighted averages of the annual mass balance obtained from Equation (1) were computed for the two sub-regions. These results are presented in (Figure 7), and compared with annual glaciological mass-balance observations for Vatnajökull, Langjökull and Hofsjökull (Thorsteinsson et al., 2017; WGMS, 2019; Hannesdóttir et al., submitted). The annual mass balance obtained for group of southern and western glaciers shows good correlation with the glaciological mass balance of Vatnajökull (R2 = 0.52), Langjökull (R2 = 0.57), and especially with Hofsjökull (R2 = 0.73).
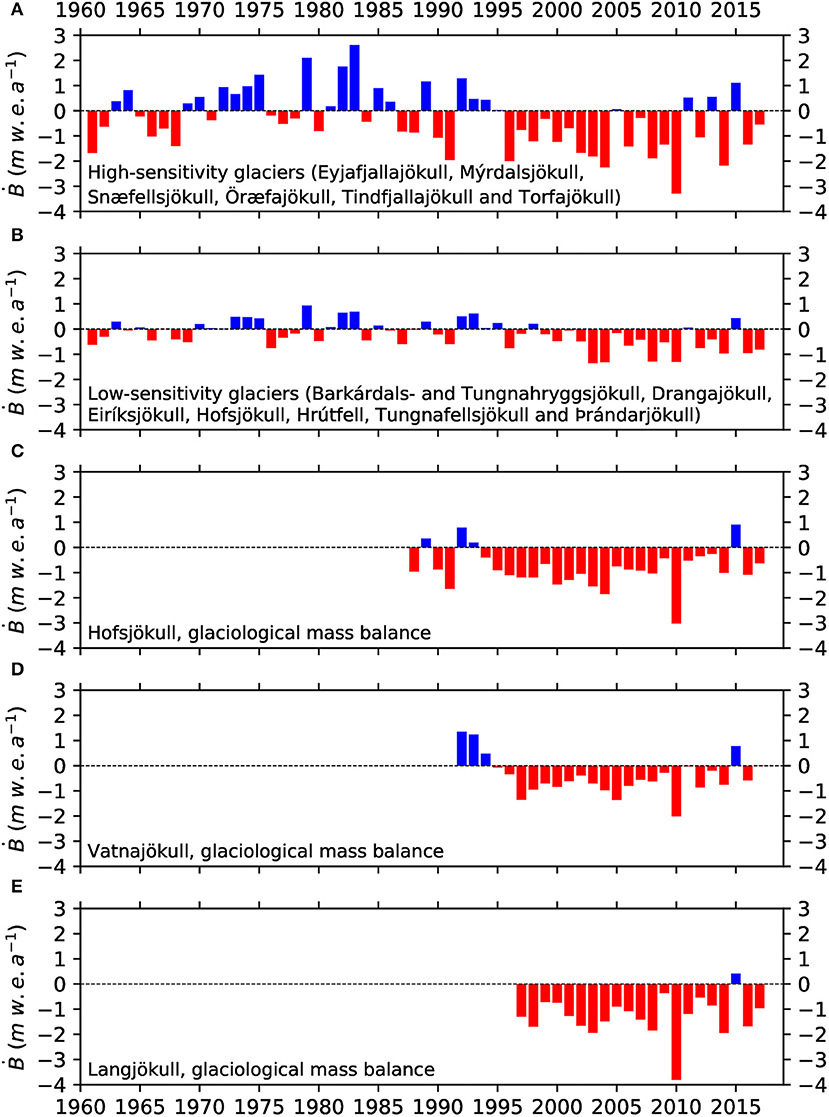
Figure 7. (A,B) Area-weighted average annual mass balance of the two sub-regions, obtained from Equation (1) over the period 1960–2017. (C–E) Glaciological mass balance measured on Hofsjökull, Vatnajökull, and Langjökull (Thorsteinsson et al., 2017; WGMS, 2019; Aðalgeirsdóttir et al., submitted).
The annual mass balance should, however, be interpreted with caution, particularly for individual glaciers and for time periods where there is a mismatch between modeled and observed mass balance (Supplement S5). The mismatches can be attributed to either an incomplete climate model or to an over-simplified linear fit between climate and mass balance. Measuring and modeling winter precipitation is challenging (e.g., Jarosch et al., 2012). In Öræfajökull, the precipitation is overestimated by the model used (Schmidt et al., 2017). Moreover, the mass balance is controlled by other variables neglected in our simple model. Full energy-balance models can better reproduce the response of glaciers to climate variations (e.g., Arnold et al., 1996; Hock and Holmgren, 2005), accounting, for example, for albedo changes, which can intensify melting if dust (e.g., Arnalds et al., 2016; Wittmann et al., 2017) or thin tephra (e.g., Möller et al., 2014; Gascoin et al., 2017) is deposited on the glacier, or can decrease the melt if snow fall occurs during summer.
The mass balance of Icelandic glaciers has additional forcing besides temperature and precipitation, such as: (1) Wind-drifted snow can contribute to winter accumulation in individual catchments, as observed for Drangajökull (Magnússon et al., 2016a,b; Belart et al., 2017). (2) Debris (either rock or tephra), present on Icelandic glaciers like Eiríksjökull, enhances or reduces the melt rate depending on the thickness (e.g., Östrem, 1959). (3) Volcanic forcing can affect the mass balance, typically for one hydrological year (Björnsson et al., 2013), and possibly over longer periods (Möller et al., 2019). (4) Local changes in geothermal heat flux underneath the glacier, as observed on Mýrdalsjökull (Guðmundsson et al., 2007), can also affect the mass balance (Björnsson, 2003).
The reference-surface correction term in the mass-balance model (Equation 1) was generalized by Elsberg et al. (2001) and Harrison et al. (2001), and further in Belart et al. (2019) by assuming a linear relationship between the volume changes and area changes of the glacier. This correlation is generally found applicable in the 14 glaciers, with a typical fit R2>0.8 between volume changes and area changes (e.g., Pálsson et al., 2012; Belart et al., 2019), but it does not apply for three surge-type catchments in Drangajökull and two in Mýrdalsjökull (Björnsson et al., 2003). Several outlet glaciers of Mýrdalsjökull and Öræfajökull, not identified as surge-type glaciers, present a series of noteworthy elevation changes during the 1960s to 1990s: their accumulation area lowered while the ablation area was gained elevation and their margins were advanced, which suggests acceleration in their ice motion. This led to a rapid area increase, while the overall volume remained unchanged (Figures S8, S9).
The suggested acceleration in the ice motion during the colder time periods, particularly as observed on Mýrdalsjökull and Öræfajökull is worth further study. This is also a key for fully describing the mass-balance–climate relationship. Due to the availability of bedrock maps of Mýrdalsjökull and Öræfajökull (Björnsson et al., 2000; Magnússon et al., 2012), further studies may include the development of fully coupled mass balance-ice dynamic models which could reproduce the series of dDEMs obtained for these glaciers in this study.
7. Conclusions
This study presents a 70-year record of elevation changes and geodetic mass balance of glaciers distributed across all parts of Iceland (excluding the three largest ice caps), most of them previously lacking mass-balance measurements. The glaciers were close to equilibrium during the period 1960–1994, with an area-weighted mass balance of 0.07 ± 0.07 m w.e. a−1. This was followed by a rapid decline of the glaciers: −1.20 ± 0.09 m w.e. a−1 and a mass loss of 21.4 ± 1.6 Gt (1.3 ± 0.1 Gt a−1), or 0.059 ± 0.005 mm SLE, during the period 1994–2010.
The region-wide, multitemporal intercomparison of mass balance revealed spatial patterns across Iceland: glaciers located close to the south and west coast experience larger decadal oscillations in mass balance, a consequence of larger static mass-balance sensitivities to summer temperature and winter precipitation, than the interior, northern and eastern glaciers. This pattern can likely be explained by different local climate, related to oceanic currents surrounding Iceland, rain shadows, and elevation of the glaciers. Due to a large intraregional variability, particular care should be taken when extrapolating mass balance from one glacier to another, even at close distances.
A linear model relating mass balance, summer temperature and winter precipitation explained more than 70% of the observed mass-balance variability. Yet we acknowledge some limitations of this model, such as other mass balance forcing or the assumption of linearity between area and volume changes. The latter assumption was not satisfied at specific time periods, with lowering in the accumulation area while the glacier fronts were advancing. This was attributed to changes in ice flux toward the ablation area, suggesting additional complexity due to the dynamical response to mass-balance fluctuations. This encourages further studies aiming at coupling mass balance to ice dynamics, especially focused at reproducing events of increased ice flux toward the ablation area.
Data Availability Statement
The mass-balance records calculated in this study are presented in Supplementary Material, and have been submitted to WGMS (www.wgms.ch). The glacier outlines will be uploaded to GLIMS [www.glims.org], Hannesdóttir et al., submitted. The DEMs and orthoimages created from aerial photographs, Hexagon KH9 photographs, SPOT 5 and ASTER, as well as the lidar DEMs, are available upon request. Maps of elevation difference using Pléiades data are available upon request.
Author Contributions
JB, EM, and EB designed the research study and methods. JB performed the data processing and calculations. ÁG contributed in processing data for Mýrdalsjökull and Tungnafellsjökull. TJ prepared meteorological data for the statistical analysis of mass balance. FP and HB provided the glaciological mass balance of Vatnajökull and Langjökull. TT provided the glaciological mass balance of Hofsjökull. All coauthors interpreted the results and helped writing the manuscript.
Funding
This study was funded by the University of Iceland (UI) Research Fund and the Icelandic research council (Rannís) through the project Katla Kalda (number 163391-053), the Jules Vernes research fund, and Landsvirkjun. EB acknowledges support from the French Space Agency (CNES).
Conflict of Interest
The authors declare that the research was conducted in the absence of any commercial or financial relationships that could be construed as a potential conflict of interest.
Acknowledgments
Karsten Kristinsson is acknowledged for scanning the aerial photographs stored at the National Land Survey of Iceland. Loftmyndir efh. is acknowledged for contributing aerial photographs from 1999. Pléiades images were acquired at research price thanks to the CNES ISIS programme (http://www.isis-cnes.fr). The ArcticDEM project is acknowledged for numerous DEMs used from 2013 to 2018. This study uses the lidar mapping of the glaciers in Iceland, funded by the Icelandic Research Fund, the Landsvirkjun research fund, the Icelandic Road Administration, the Reykjavík Energy Environmental and Energy Research Fund, the Klima- og Luftgruppen research fund of the Nordic Council of Ministers, the Vatnajökull National Park, the organization Friends of Vatnajökull, LMÍ, IMO, and the UI research fund. This study uses the GLIMS database of the outlines of Icelandic glaciers. Bolli Pálmason is acknowledged for providing downscaled precipitation data from regular forecast runs of the IMO for 2016–2019. Ken Moxham is acknowledged for the English-language editing of the manuscript. Michelle Koutnik is thanked for fruitful discussions about potential applications from the datasets. MZ, TS, and MH are acknowledged for their valuable comments during the revision of the manuscript. This study is based on the last chapter of the PhD dissertation of Belart (2018).
Supplementary Material
The Supplementary Material for this article can be found online at: https://www.frontiersin.org/articles/10.3389/feart.2020.00163/full#supplementary-material
References
Ágústsson, H., Hannesdóttir, H., Thorsteinsson, Þ., Pálsson, F., and Oddsson, B. (2013). Mass balance of Mýrdalsjökull ice cap accumulation area and comparison of observed winter balance with simulated precipitation. Jökull 63, 91–104.
Ahlmann, H. (1940). The relative influence of precipitation and temperature on glacier regime. Geogr. Ann. 22, 188–205. doi: 10.1080/20014422.1940.11880689
Anderson, L. S., Flowers, G. E., Jarosch, A. H., Aðalgeirsdóttir, G., Áslaug, G., Miller, G. H., et al. (2018). Holocene glacier and climate variations in Vestfirðir, Iceland, from the modeling of Drangajökull ice cap. Quarter. Sci. Rev. 190, 39–56. doi: 10.1016/j.quascirev.2018.04.024
Andreassen, L. M., Elvehøy, H., Kjøllmoen, B., and Belart, J. M. C. (2020). Glacier change in Norway since the 1960s - an overview of mass balance, area, length and surface elevation changes. J. Glaciol. 66, 313–328. doi: 10.1017/jog.2020.10
Arnalds, O., Dagsson-Waldhauserova, P., and Ólafsson, H. (2016). The Icelandic volcanic aeolian environment: processes and impacts – A review. Aeolian Res. 20, 176–195. doi: 10.1016/j.aeolia.2016.01.004
Arnold, N. S., Willis, I. C., Sharp, M. J., Richards, K. S., and Lawson, W. J. (1996). A distributed surface energy-balance model for a small valley glacier. I. Development and testing for Haut Glacier d' Arolla, Valais, Switzerland. J. Glaciol. 42, 77–89. doi: 10.1017/S0022143000030549
Bauder, A., Funk, M., and Huss, M. (2007). Ice-volume changes of selected glaciers in the Swiss Alps since the end of the 19th century. Ann. Glaciol. 46, 145–149. doi: 10.3189/172756407782871701
Belart, J. M. C. (2018). Mass balance of Icelandic glaciers in variable climate (Ph.D. thesis). University of Iceland; University of Toulouse III, Paul Sabatier.
Belart, J. M. C., Berthier, E., Magnússon, E., Anderson, L. S., Pálsson, F., Thorsteinsson, Þ., et al. (2017). Winter mass balance of Drangajökull ice cap (NW Iceland) derived from satellite sub-meter stereo images. Cryosphere 11, 1501–1517. doi: 10.5194/tc-11-1501-2017
Belart, J. M. C., Magnússon, E., Berthier, E., Pálsson, F., Aðalgeirsdóttir, G., and Jóhannesson, T. (2019). The geodetic mass balance of Eyjafjallajökull ice cap for 1945-2014: processing guidelines and relation to climate. J. Glaciol. 65, 395–409. doi: 10.1017/jog.2019.16
Berthier, E., Cabot, V., Vincent, C., and Six, D. (2016). Decadal region-wide and glacier-wide mass balances derived from multi-temporal ASTER satellite digital elevation models. Validation over the Mont-Blanc area. Front. Earth Sci. 4:63. doi: 10.3389/feart.2016.00063
Berthier, E., Vincent, C., Magnússon, E., Gunnlaugsson, Á. Þ., Pitte, P., Le Meur, E., et al. (2014). Glacier topography and elevation changes derived from Pléiades sub-meter stereo images. Cryosphere 8, 2275–2291. doi: 10.5194/tc-8-2275-2014
Bindschadler, R., and Vornberger, P. (1998). Changes in the West Antarctic ice sheet since 1963 from declassified satellite photography. Science 279, 689–692. doi: 10.1126/science.279.5351.689
Björnsson, H. (2003). Subglacial lakes and jökulhlaups in Iceland. Glob. Planet. Change 35, 255–271. doi: 10.1016/S0921-8181(02)00130-3
Björnsson, H., Pálsson, F., and Guðmundsson, M. (2000). Surface and bedrock topography of the Mýrdalsjökull ice cap, Iceland. Jökull 49, 29–46.
Björnsson, H., Pálsson, F., Guðmundsson, S., Magnússon, E., Aðalgeirsdóttir, G., Jóhannesson, T., et al. (2013). Contribution of Icelandic ice caps to sea level rise: trends and variability since the Little Ice Age. Geophys. Res. Lett. 40, 1–5. doi: 10.1002/grl.50278
Björnsson, H., Pálsson, F., Sigurðsson, O., and Flowers, G. E. (2003). Surges of glaciers in Iceland. Ann. Glaciol. 36, 82–90. doi: 10.3189/172756403781816365
Bojinski, S., Verstraete, M., Peterson, T. C., Richter, C., Simmons, A., and Zemp, M. (2014). The concept of essential climate variables in support of climate research, applications, and policy. Bull. Am. Meteorol. Soc. 95, 1431–1443. doi: 10.1175/BAMS-D-13-00047.1
Bolch, T., Pieczonka, T., and Benn, D. I. (2011). Multi-decadal mass loss of glaciers in the Everest area (Nepal Himalaya) derived from stereo imagery. Cryosphere 5, 349–358. doi: 10.5194/tc-5-349-2011
Braun, M. H., Malz, P., Sommer, C., Farías-Barahona, D., Sauter, T., Casassa, G., et al. (2019). Constraining glacier elevation and mass changes in South America. Nat. Clim. Change 9, 130–136. doi: 10.1038/s41558-018-0375-7
Brun, F., Berthier, E., Wagnon, P., Kääb, A., and Treichler, D. (2017). A spatially resolved estimate of High Mountain Asia glacier mass balances from 2000 to 2016. Nat. Geosci. 10:668. doi: 10.1038/ngeo2999
Christian, J. E., Koutnik, M., and Roe, G. (2018). Committed retreat: controls on glacier disequilibrium in a warming climate. J. Glaciol. 64, 675–688. doi: 10.1017/jog.2018.57
Cogley, J. G., Hock, R., Rasmussen, L. A., Arendt, A. A., Bauder, A., Braithwaite, R. J., et al. (2011). Glossary of glacier mass balance and related terms, IHP-VII Technical Documents in Hydrology No. 86, IACS Contribution No. 2. Paris: UNESCO-IHP.
Crochet, P., and Jóhannesson, T. (2011). A dataset of daily temperature in Iceland for the period 1949-2010. Jökull 61, 1–17.
Crochet, P., Jóhannesson, T., Jónsson, T., Sigurðsson, O., Björnsson, H., Pálsson, F., et al. (2007). Estimating the spatial distribution of precipitation in Iceland using a linear model of orographic precipitation. J. Hydrometeorol. 8, 1285–1306. doi: 10.1175/2007JHM795.1
De Woul, M., and Hock, R. (2005). Static mass-balance sensitivity of Arctic glaciers and ice caps using a degree-day approach. Ann. Glaciol. 42, 217–224. doi: 10.3189/172756405781813096
Dussaillant, I., Berthier, E., Brun, F., Masiokas, M., Hugonnet, R., Favier, V., et al. (2019). Two decades of glacier mass loss along the andes. Nat. Geosci. 12, 802–808. doi: 10.1038/s41561-019-0432-5
Elsberg, D. H., Harrison, W. D., Echelmeyer, K. A., and Krimmel, R. M. (2001). Quantifying the effects of climate and surface change on glacier mass balance. J. Glaciol. 47, 649–658. doi: 10.3189/172756501781831783
Fieber, K. D., Mills, J. P., Miller, P. E., Clarke, L., Ireland, L., and Fox, A. J. (2018). Rigorous 3D change determination in Antarctic Peninsula glaciers from stereo WorldView-2 and archival aerial imagery. Remote Sens. Environ. 205(Suppl. C), 18–31. doi: 10.1016/j.rse.2017.10.042
Finsterwalder, R. (1954). Photogrammetry and glacier research with special reference to glacier retreat in the eastern Alps. J. Glaciol. 2, 306–315. doi: 10.3189/S0022143000025119
Fischer, M., Huss, M., and Hoelzle, M. (2015). Surface elevation and mass changes of all Swiss glaciers 1980-2010. Cryosphere 9, 525–540. doi: 10.5194/tc-9-525-2015
Gardner, A. S., Moholdt, G., Cogley, J. G., Wouters, B., Arendt, A. A., Wahr, J., et al. (2013). A reconciled estimate of glacier contributions to sea level rise: 2003 to 2009. Science 340, 852–857. doi: 10.1126/science.1234532
Gascoin, S., Guðmundsson, S., Aðalgeirsdóttir, G., Pálsson, F., Schmidt, L., Berthier, E., et al. (2017). Evaluation of MODIS Albedo product over ice caps in Iceland and impact of volcanic eruptions on their Albedo. Remote Sens. 9:399. doi: 10.3390/rs9050399
Guðmundsson, M. T., Högnadóttir, H., Kristinsson, A. B., and Guðbjörnsson, S. (2007). Geothermal activity in the subglacial Katla caldera, Iceland, 1999-2005, studied with radar altimetry. Ann. Glaciol. 45, 66–72. doi: 10.3189/172756407782282444
Guðmundsson, S., Björnsson, H., Magnússon, E., Berthier, E., Pálsson, F., Guðmundsson, M. T., et al. (2011). Response of Eyjafjallajökull, Torfajökull and Tindfjallajökull ice caps in iceland to regional warming, deduced by remote sensing. Polar Res. 30:7282. doi: 10.3402/polar.v30i0.7282
Gunnarsson, A., Gardarsson, S. M., Pálsson, F., Jóhannesson, T., and Sveinsson, O. G. B. (2020). Annual and interannual variability and trends of albedo for icelandic glaciers. Cryosphere Discuss. 2020, 1–32. doi: 10.5194/tc-2019-328
Gunnlaugsson, Á. Þ. (2016). The geodetic mass balance and ice thickness of Tungnafellsjökull ice cap (M.Sc. Thesis). University of Iceland, Reykjavik, Iceland.
Hannesdóttir, H., Björnsson, H., Pálsson, F., Aðalgeirsdóttir, G., and Guðmundsson, S. (2015). Changes in the southeast Vatnajökull ice cap, Iceland, between ~1890 and 2010. The Cryosphere 9, 565–585, doi: 10.5194/tc-9-565-2015
Harrison, W. (2013). How do glaciers respond to climate? Perspectives from the simplest models. J. Glaciol. 59, 949–960. doi: 10.3189/2013JoG13J048
Harrison, W. D., Elsberg, D. H., Echelmeyer, K. A., and Krimmel, R. M. (2001). On the characterization of glacier response by a single time-scale. J. Glaciol. 47, 659–664. doi: 10.3189/172756501781831837
Hock, R., and Holmgren, B. (2005). A distributed surface energy-balance model for complex topography and its application to Storglaciaren, Sweden. J. Glaciol. 51, 25–36. doi: 10.3189/172756505781829566
Huber, J., McNabb, R., and Zemp, M. (2020). Elevation changes of west-central Greenland glaciers from 1985 to 2012 from remote sensing. Front. Earth Sci. 8:35. doi: 10.3389/feart.2020.00035
Huss, M. (2013). Density assumptions for converting geodetic glacier volume change to mass change. Cryosphere 7, 877–887. doi: 10.5194/tc-7-877-2013
Huss, M., Dhulst, L., and Bauder, A. (2015). New long-term mass-balance series for the Swiss Alps. J. Glaciol. 61, 551–562. doi: 10.3189/2015JoG15J015
Huss, M., Hock, R., Bauder, A., and Funk, M. (2010). 100-year mass changes in the Swiss Alps linked to the Atlantic Multidecadal Oscillation. Geophys. Res. Lett. 37:L10501. doi: 10.1029/2010GL042616
Huss, M., Hock, R., Bauder, A., and Funk, M. (2012). Conventional versus reference-surface mass balance. J. Glaciol. 58, 278–286. doi: 10.3189/2012JoG11J216
Jarosch, A. H., Anslow, F. S., and Clarke, G. K. C. (2012). High-resolution precipitation and temperature downscaling for glacier models. Clim. Dyn. 38, 391–409. doi: 10.1007/s00382-010-0949-1
Jóhannesson, T., Björnsson, H., Magnússon, E., Guðmundsson, S., Pálsson, F., Sigurðsson, O., et al. (2013). Ice-volume changes, bias estimation of mass-balance measurements and changes in subglacial lakes derived by lidar mapping of the surface of Icelandic glaciers. Ann. Glaciol. 54, 63–74. doi: 10.3189/2013AoG63A422
Jóhannesson, T., Björnsson, H., Pálsson, F., Sigurðsson, O., and Thorsteinsson, Þ. (2011). LiDAR mapping of the Snæfellsjökull ice cap, western Iceland. Jökull 61, 19–32.
Jóhannesson, T., Raymond, C., and Waddington, E. D. (1989). Time-scale for adjustment of glaciers to changes in mass balance. J. Glaciol. 35, 355–369.
Kääb, A., Berthier, E., Nuth, C., Gardelle, J., and Arnaud, Y. (2012). Contrasting patterns of early twenty-first-century glacier mass change in the Himalaya. Nature 488, 495–498. doi: 10.1038/nature11324
Korona, J., Berthier, E., Bernard, M., Remy, F., and Thouvenot, E. (2009). SPIRIT. SPOT 5 stereoscopic survey of Polar Ice: Reference Images and Topographies during the fourth International Polar Year (2007-2009). ISPRS J. Photogr. Remote Sens. 64, 204–212. doi: 10.1016/j.isprsjprs.2008.10.005
Lambrecht, A., and Kuhn, M. (2007). Glacier changes in the Austrian Alps during the last three decades, derived from the new Austrian glacier inventory. Ann. Glaciol. 46, 177–184. doi: 10.3189/172756407782871341
Livingston, R. (1963). A History of Military Mapping Camera Development. USAF Liaison Office, U.S. Army Engineer, Geodesy, Intelligence and Mapping R. & D. Agency, 79–110.
Lüthi, M. P., and Bauder, A. (2010). Analysis of alpine glacier length change records with a macroscopic glacier model. Geogr. Helvetica 65, 92–102. doi: 10.5194/gh-65-92-2010
Magnússon, E., Belart, J., Pálsson, F., Ágústsson, H., and Crochet, P. (2016a). Geodetic mass balance record with rigorous uncertainty estimates deduced from aerial photographs and lidar data - Case study from Drangajökull ice cap, NW Iceland. Cryosphere 10, 159–177. doi: 10.5194/tc-10-159-2016
Magnússon, E., Belart, J. M. C., Pálsson, F., Anderson, L., Gunnlaugsson, A. Þ., Berthier, E., et al. (2016b). The subglacial topography of Drangajökull ice cap, NW-Iceland, deduced from dense RES-profiling. Jökull 66, 1–26.
Magnússon, E., Pálsson, F., Björnsson, H., and Guðmundsson, S. (2012). Removing the ice cap of Öræfajökull central volcano, SE-Iceland: mapping and interpretation of bedrock topography, ice volumes, subglacial troughs and implications for hazards assessments. Jökull 62, 131–150.
Marti, R., Gascoin, S., Houet, T., Ribière, O., Laffly, D., Condom, T., et al. (2015). Evolution of ossoue glacier (French Pyrenees) since the end of the Little ice age. Cryosphere 9, 1773–1795. doi: 10.5194/tc-9-1773-2015
Marzeion, B., Cogley, J. G., Richter, K., and Parkes, D. (2014). Attribution of global glacier mass loss to anthropogenic and natural causes. Science 345, 919–921. doi: 10.1126/science.1254702
Marzeion, B., Hofer, M., Jarosch, A. H., Kaser, G., and Mölg, T. (2012). A minimal model for reconstructing interannual mass balance variability of glaciers in the European Alps. Cryosphere 6, 71–84. doi: 10.5194/tc-6-71-2012
McNabb, R., Nuth, C., Kääb, A., and Girod, L. (2019). Sensitivity of glacier volume change estimation to dem void interpolation. Cryosphere 13, 895–910. doi: 10.5194/tc-13-895-2019
Möller, R., Dagsson-Waldhauserova, P., Möller, M., Kukla, P. A., Schneider, C., and Gudmundsson, M. T. (2019). Persistent albedo reduction on southern Icelandic glaciers due to ashfall from the 2010 Eyjafjallajökull eruption. Remote Sens. Environ. 233:111396. doi: 10.1016/j.rse.2019.111396
Möller, R., Möller, M., Björnsson, H., Guðmundsson, S., Pálsson, F., Oddsson, B., et al. (2014). MODIS-derived albedo changes of Vatnajökull (Iceland) due to tephra deposition from the 2004 Grímsvötn eruption. Int. J. Appl. Earth Observ. Geoinform. 26, 256–269. doi: 10.1016/j.jag.2013.08.005
Nawri, N., Pálmason, B., Petersen, G. N., Björnsson, H., and Þorsteinsson, A. Þ. (2017). The ICRA Atmospheric Reanalysis Project for Iceland. Icelandic Meteorological Office, VÍ 2017-005.
Oerlemans, J., and Reichert, B. K. (2000). Relating glacier mass balance to meteorological data by using a seasonal sensitivity characteristic. J. Glaciol. 46, 1–6. doi: 10.3189/172756500781833269
Ohmura, A. (2011). Observed mass balance of mountain glaciers and Greenland Ice Sheet in the 20th Century and the present Trends. Surveys Geophys. 32, 537–554. doi: 10.1007/s10712-011-9124-4
Östrem, G. (1959). Ice melting under a thin layer of moraine, and the existence of ice cores in moraine ridges. Geogr. Ann. 41, 228–230. doi: 10.1080/20014422.1959.11907953
Pálsson, F., Guðmundsson, S., Björnsson, H., Berthier, E., Magnússon, E., Guðmundsson, S., et al. (2012). Mass and volume changes of Langjökull ice cap, Iceland, ~1890 to 2009, deduced from old maps, satellite images and in situ mass balance measurements. Jökull 62, 81–96.
Papasodoro, C., Berthier, E., Royer, A., Zdanowicz, C., and Langlois, A. (2015). Area, elevation and mass changes of the two southernmost ice caps of the Canadian Arctic Archipelago between 1952 and 2014. Cryosphere 9, 1535–1550. doi: 10.5194/tc-9-1535-2015
Pedersen, G. B. M., Belart, J. M. C., Magnússon, E., Vilmundardóttir, O. K., Kizel, F., Sigurmundsson, F. S., et al. (2018). Hekla volcano, Iceland, in the 20th century: Lava volumes, production rates and effusion rates. Geophys. Res. Lett. 45, 1805–1813. doi: 10.1002/2017GL076887
Pierrot Deseilligny, M., and Clery, I. (2011). Apero, an open source bundle adjusment software for automatic calibration and orientation of set of images. Int. Arch. Photogr. Remote Sens. Spat. Inform. Sci. 3816, 269–276. doi: 10.5194/isprsarchives-XXXVIII-5-W16-269-2011
Porter, C., Morin, P., Howat, I., Noh, M.-J., Bates, B., Peterman, K., et al. (2018). ArcticDEM. Harvard Dataverse, V1. Polar Geospatial Center, University of Minnesota. doi: 10.7910/DVN/OHHUKH
Raup, B., Racoviteanu, A., Khalsa, S. J. S., Helm, C., Armstrong, R., and Arnaud, Y. (2007). The GLIMS geospatial glacier database: a new tool for studying glacier change. Glob. Planet. Change 56, 101–110. doi: 10.1016/j.gloplacha.2006.07.018
Roe, G. H., Baker, M. B., and Herla, F. (2017). Centennial glacier retreat as categorical evidence of regional climate change. Nat. Geosci. 10, 95–99. doi: 10.1038/ngeo2863
Rupnik, E., Daakir, M., and Pierrot Deseilligny, M. (2017). MicMac - a free, open-source solution for photogrammetry. Open Geospatial Data Softw. Stand. 2:14. doi: 10.1186/s40965-017-0027-2
Schmidt, L. S., Aðalgeirsdóttir, G., Guðmundsson, S., Langen, P. L., Pálsson, F., Mottram, R., et al. (2017). The importance of accurate glacier albedo for estimates of surface mass balance on Vatnajökull: evaluating the surface energy budget in a regional climate model with automatic weather station observations. Cryosphere 11, 1665–1684. doi: 10.5194/tc-11-1665-2017
Shean, D. E., Alexandrov, O., Moratto, Z. M., Smith, B. E., Joughin, I. R., Porter, C., et al. (2016). An automated, open-source pipeline for mass production of digital elevation models (DEMs) from very-high-resolution commercial stereo satellite imagery. ISPRS J. Photogr. Remote Sens. 116, 101–117. doi: 10.1016/j.isprsjprs.2016.03.012
Shean, D. E., Bhushan, S., Montesano, P., Rounce, D. R., Arendt, A., and Osmanoglu, B. (2020). A systematic, regional assessment of high mountain asia glacier mass balance. Front. Earth Sci. 7:363. doi: 10.3389/feart.2019.00363
Shepherd, A., Ivins, E., Rignot, E., Smith, B., van den Broeke, M., Velicogna, I., et al. (2020). Mass balance of the Greenland ice sheet from 1992 to 2018. Nature 579, 233–239. doi: 10.1038/s41586-019-1855-2
Soruco, A., Vincent, C., Francou, B., Ribstein, P., Berger, T., Sicart, J. E., et al. (2009). Mass balance of Glaciar Zongo, Bolivia, between 1956 and 2006, using glaciological, hydrological and geodetic methods. Ann. Glaciol. 50, 1–8. doi: 10.3189/172756409787769799
Spriggs, R. M. (1966). The Calibration of Military Cartographic Cameras, Technical Note. Wright-Patterson Air Force Base.
Thorsteinsson, Þ., Jóhannesson, T., Sigurðsson, O., and Einarsson, B. (2017). Afkomumælingar á Hofsjökli 1988–2017 (Mass balance of Hofsjökull 1988–2017). Icelandic Meteorological Office Report 2017-016, 1–82.
Vaughan, D. G., Comiso, J. C., Allison, J., Carrasco, J., Kaser, R., Kwok, R., et al. (2013). “Observations: Cryosphere,” in Climate Change 2013: The Physical Science Basis. Contribution of Working Group I to the Fifth Assessment Report of the Intergovernmental Panel on Climate Change. Cambridge, UK; New York, NY: Cambridge University Press.
Wittmann, M., Groot Zwaaftink, C. D., Steffensen Schmidt, L., Guðmundsson, S., Pálsson, F., Arnalds, O., et al. (2017). Impact of dust deposition on the albedo of Vatnajökull ice cap, Iceland. Cryosphere 11, 741–754. doi: 10.5194/tc-11-741-2017
Wouters, B., Gardner, A. S., and Moholdt, G. (2019). Global glacier mass loss during the GRACE satellite mission (2002-2016). Front. Earth Sci. 7:96. doi: 10.3389/feart.2019.00096
Keywords: region-wide mass balance, glacier–climate relationship, mass-balance sensitivity, Iceland, remote sensing, historical aerial photographs
Citation: Belart JMC, Magnússon E, Berthier E, Gunnlaugsson ÁÞ, Pálsson F, Aðalgeirsdóttir G, Jóhannesson T, Thorsteinsson T and Björnsson H (2020) Mass Balance of 14 Icelandic Glaciers, 1945–2017: Spatial Variations and Links With Climate. Front. Earth Sci. 8:163. doi: 10.3389/feart.2020.00163
Received: 22 December 2019; Accepted: 29 April 2020;
Published: 03 June 2020.
Edited by:
Michael Zemp, University of Zurich, SwitzerlandReviewed by:
Thomas Vikhamar Schuler, University of Oslo, NorwayMatthias Huss, ETH Zürich, Switzerland
Copyright © 2020 Belart, Magnússon, Berthier, Gunnlaugsson, Pálsson, Aðalgeirsdóttir, Jóhannesson, Thorsteinsson and Björnsson. This is an open-access article distributed under the terms of the Creative Commons Attribution License (CC BY). The use, distribution or reproduction in other forums is permitted, provided the original author(s) and the copyright owner(s) are credited and that the original publication in this journal is cited, in accordance with accepted academic practice. No use, distribution or reproduction is permitted which does not comply with these terms.
*Correspondence: Joaquín M. C. Belart, am9hcXVpbkBsbWkuaXM=