 Fabio Arzilli1*
 Paola Stabile2
 Alessandro Fabbrizio3Patrizia Landi4Bruno Scaillet5Eleonora Paris2
 Michael R. Carroll2
- 1Department of Earth and Environmental Sciences, University of Manchester, Manchester, United Kingdom
- 2School of Science and Technology, Geology Division, University of Camerino, Camerino, Italy
- 3Institute of Petrology and Structural Geology, Faculty of Science, Charles University, Prague, Czechia
- 4Istituto Nazionale di Geofisica e Vulcanologia, Sezione di Pisa, Pisa, Italy
- 5Institut des Sciences de la Terre d’Orléans, CNRS-Université d’Orléans-BRGM, Orléans, France
Peralkaline rhyolites, associated with extensional tectonic settings, are medium to low viscosity magmas that often produce eruptive styles ranging from effusive to highly explosive eruptions. The role of pre-eruptive conditions and crystallization kinetics in influencing the eruptive style of peralkaline rhyolitic magmas has been investigated and debated considering equilibrium conditions. However, experimental constraints on the effect of disequilibrium in crystallization in such magmas are currently lacking in the literature. Therefore, we performed isobaric cooling experiments to investigate alkali feldspar crystallization kinetics in peralkaline rhyolitic melts. Experiments were performed under water-saturated, water-undersaturated, and anhydrous conditions between 25 and 100 MPa, at 670–790°C and with experimental durations ranging from 0.5 to 420 h. Here we present the first data on crystallization kinetics of alkali feldspar, which is the main crystal phase in peralkaline rhyolitic melts, in order to improve our understanding of the evolutionary timescales of these melts and their ability to shift between effusive and explosive activity. Our experimental results indicate that the alkali feldspar nucleation delay can range from hours to several days as a function of undercooling and H2O content in the melt. Thus, a peralkaline rhyolitic magma can be stored at the pre-eruptive conditions for days without important variations of its crystal fraction. This suggests that crystallization may not necessarily play the main role in triggering fragmentation during explosive eruptions of peralkaline rhyolitic magmas.
Introduction
Peralkaline rhyolitic magmas erupt in diverse geological settings, including continental rifts, intra-plate ocean islands, subduction zones, and back-arc basins (e.g., Morra et al., 1994; Barclay et al., 1996; Heumann and Davies, 2002; Lustrino et al., 2004; Macdonald and Scaillet, 2006; White et al., 2006, 2009; Ren et al., 2006; Marshall et al., 2009; Bhushan et al., 2010; Rooney et al., 2012; Parker et al., 2012; Renna et al., 2013; Hong et al., 2013). Recent studies have emphasized that many flood basalt provinces dominated by basaltic lavas are also characterized by the presence of peralkaline and metaluminous rhyolitic rocks (Bellieni et al., 1986; Harris and Erlank, 1992; Ewart et al., 1998, 2004; Ayalew et al., 2002; Bryan et al., 2002; Peccerillo et al., 2003). Particularly, peralkaline rhyolites can dominate over metaluminous rhyolites in some flood silicic provinces (Ayalew et al., 2002). Peralkaline volcanic rocks are volumetrically minor with respect to other rhyolitic compositions on Earth but globally widespread. They are not yet systematically studied in terms of exsolved volatiles budget, ascent dynamics and crystallization kinetics compared to common calcalkaline rhyolites (e.g., Hammer and Rutherford, 2002; Couch, 2003; Couch et al., 2003; Hammer, 2004; Brugger and Hammer, 2010).
Peralkaline rhyolites (both highly peralkaline pantellerites and less peralkaline comendites) are characterized by high silica contents (>68 wt.%) and by a peralkalinity index higher than unity [molar (Na2O + K2O)/Al2O3 > 1, e.g., Macdonald, 1974; Dingwell et al., 1998; Di Genova et al., 2013). Notably, the viscosity of peralkaline rhyolites is relatively low compared with that of calc-alkaline rhyolites. This is due to their alkali-rich compositions that depolymerize the melt structure (Stevenson et al., 1998; Mysen, 2007; Mysen and Toplis, 2007; Di Genova et al., 2013; Stabile et al., 2016). Although hydrous peralkaline rhyolites with concentration of H2O ≤ 4 wt.% have relatively low viscosities (102 to 105 Pa s; Di Genova et al., 2013), their volcanic activity is characterized by a wide range of eruptive styles. These can vary from lava flow to lava fountaining to Plinian-type eruptions associated with pyroclastic flows and ignimbrites (e.g., Schmincke, 1974; Mahood and Hildreth, 1986; Duffield, 1990; Lowestern and Mahood, 1991; Houghton et al., 1992; Stevenson et al., 1993; Webster et al., 1993; Wilding et al., 1993; Barclay et al., 1996; Stevenson and Wilson, 1997; Horn and Smincke, 2000; Gottsmann and Dingwell, 2002).
Recent experimental investigations (Scaillet and Macdonald, 2001, 2003, 2006; Di Carlo et al., 2010; Stabile et al., 2018) and melt inclusion studies (Kovalenko et al., 1988; Webster et al., 1993; Wilding et al., 1993; Barclay et al., 1996; Gioncada and Landi, 2010) have shown that peralkaline melts may be rather H2O-rich (up to 4–5 wt.%; e.g., Lowestern and Mahood, 1991; Scaillet and Macdonald, 2001; Gioncada and Landi, 2010; Neave et al., 2012; Lanzo et al., 2013), in contrast to previous inferences (e.g., Bailey and Macdonald, 1987). Both experimental and volatile studies confirm that peralkaline rhyolite evolution is essentially related to their residence within crustal magma bodies in which crystallization changes the residual liquids towards more peralkaline compositions, enriched in volatiles and many incompatible trace elements.
Crystal nucleation and growth in magmas are affected by multiple variables, including: melt composition, temperature (T), pressure (P), undercooling (ΔT = Tliquidus − Tcrystallization), melt water content, oxygen fugacity (fO2), and cooling and decompression rates (e.g., Fenn, 1977; Swanson, 1977; Toplis and Carroll, 1995; Couch et al., 2003; Martel and Schmidt, 2003; Hammer, 2006; Brugger and Hammer, 2010; Martel, 2012; Mollard et al., 2012; Arzilli and Carroll, 2013; Shea and Hammer, 2013; Welsch et al., 2016; Masotta et al., 2020). Pre- and syn-eruptive crystallization plays a key role in controlling the rheology of magmas in the magma chamber and in the conduit. The decrease of H2O dissolved in the magma due to the degassing and the increase of crystal fraction above 0.3 over time can produce a dramatic increase of the magma viscosity, controlling magma ascent, outgassing and the fragmentation process in peralkaline rhyolitic magmas (Di Genova et al., 2013; Campagnola et al., 2016). Therefore, crystallization can have a major role in controlling the shift between explosive and effusive eruptive style of peralkaline rhyolitic volcanic systems, such as the case of Pantelleria Island.
For instance, Pantelleria Island, located in the Mediterranean Sea south of Sicily (Italy), is characterized by highly explosive peralkaline rhyolitic and trachytic eruptions. The Pantelleria eruptive cycle between 180 and 50 ka was dominated by more than eight large ignimbritic eruptions (Mahood and Hildreth, 1986; Speranza et al., 2012), which ended with the Green Tuff Plinian eruption and the formation of the Cinque Denti caldera. The subsequent volcanic activity was mainly dominated by lava flows and mild explosive eruptions (violent to mild strombolian) (Mahood and Hildreth, 1986; Landi and Rotolo, 2015). The most recent activity on the island, dated at 6–8 ka, is associated with the eruptive centers of Cuddia Randazzo and Cuddia del Gallo which emplaced pumice cones and lava flows (Mahood and Hildreth, 1986; Speranza et al., 2010; Gioncada and Landi, 2010; Scaillet et al., 2011; Landi and Rotolo, 2015).
Fast magma ascent rate has been inferred for peralkaline rhyolitic explosive eruptions, ranging between ∼5 and 100 ms–1 (Campagnola et al., 2016). Below 800°C, the attainment of crystal-melt equilibrium in peralkaline rhyolitic melts is reached in ∼300 h (Di Carlo et al., 2010), indicating that disequilibrium crystallization should be ubiquitous in affecting the conduit and eruptive dynamics of peralkaline highly explosive magmatism. However, crystallization in peralkaline melts has only been investigated under equilibrium conditions (Scaillet and Macdonald, 2001, 2003, 2006; Di Carlo et al., 2010). Notably, alkali feldspar is one of the most abundant phases in peralkaline rhyolitic rocks (White et al., 2005; Di Carlo et al., 2010; Gioncada and Landi, 2010; Landi and Rotolo, 2015; Campagnola et al., 2016), but studies of its crystallization kinetics in peralkaline melts under disequilibrium conditions are lacking. For this reason, here we present for the first time new experimental data on the kinetics of alkali feldspar nucleation and growth in peralkaline rhyolitic magmas; these results are fundamental to better understand the eruption dynamics of peralkaline rhyolitic magmatic systems.
Isobaric single-step cooling experiments were performed, using a peralkaline rhyolitic melt composition from Pantelleria Island, under water-saturated, water-undersaturated, and anhydrous conditions. Oxygen fugacities under reducing and oxidizing conditions (NNO −1.15, NNO +0.8, and NNO +1) were investigated. Experiments were conducted at constant pressures (100, 50, and 25 MPa) in order to simulate magma stagnation in a reservoir or in a conduit at pre- and syn-eruptive conditions in order to constrain the conditions and the timescales of crystal formation.
Experimental and Analytical Methods
Starting Materials and Capsule Preparation
The starting material used in the present experimental work is a peralkaline rhyolitic pumice (PANT15) collected from the eruptive fall unit of Cuddia del Gallo (Pantelleria, Italy) (Gioncada and Landi, 2010). The Cuddia del Gallo deposit lies above the Randazzo pumice (Rotolo et al., 2007) and consists of a 4 m-thick fall sequence of coarse pumice interbedded with layers of ash. In the upper part, the pumice fall is locally agglutinated to produce vitrophyric bands. Samples were collected from the basal layer, mainly consisting of light gray pumices with sizes <20 cm.
The bulk composition of PANT 15 pumice is characterized by SiO2 = 68.65 wt.%, Al2O3 = 10.65 wt.%, K2O+Na2O = 10.76 wt.% and the peralkalinity index is 1.43 (Table 1). The total iron is 8.71 wt.%, which is comparable with other peralkaline rhyolites. The pumices of Cuddia del Gallo contain ˜10 vol.% of phenocrysts, including alkali feldspar (anorthoclase, Or30–40, An <1, with 0.3–2 wt.% of Fe2O3) and aenigmatite, associated with minor hedenbergitic clinopyroxene, ilmenite and Ti-magnetite. Quartz crystals are sporadic or absent. The groundmass is glassy or poorly crystallized with presence of mainly feldspar microlites.
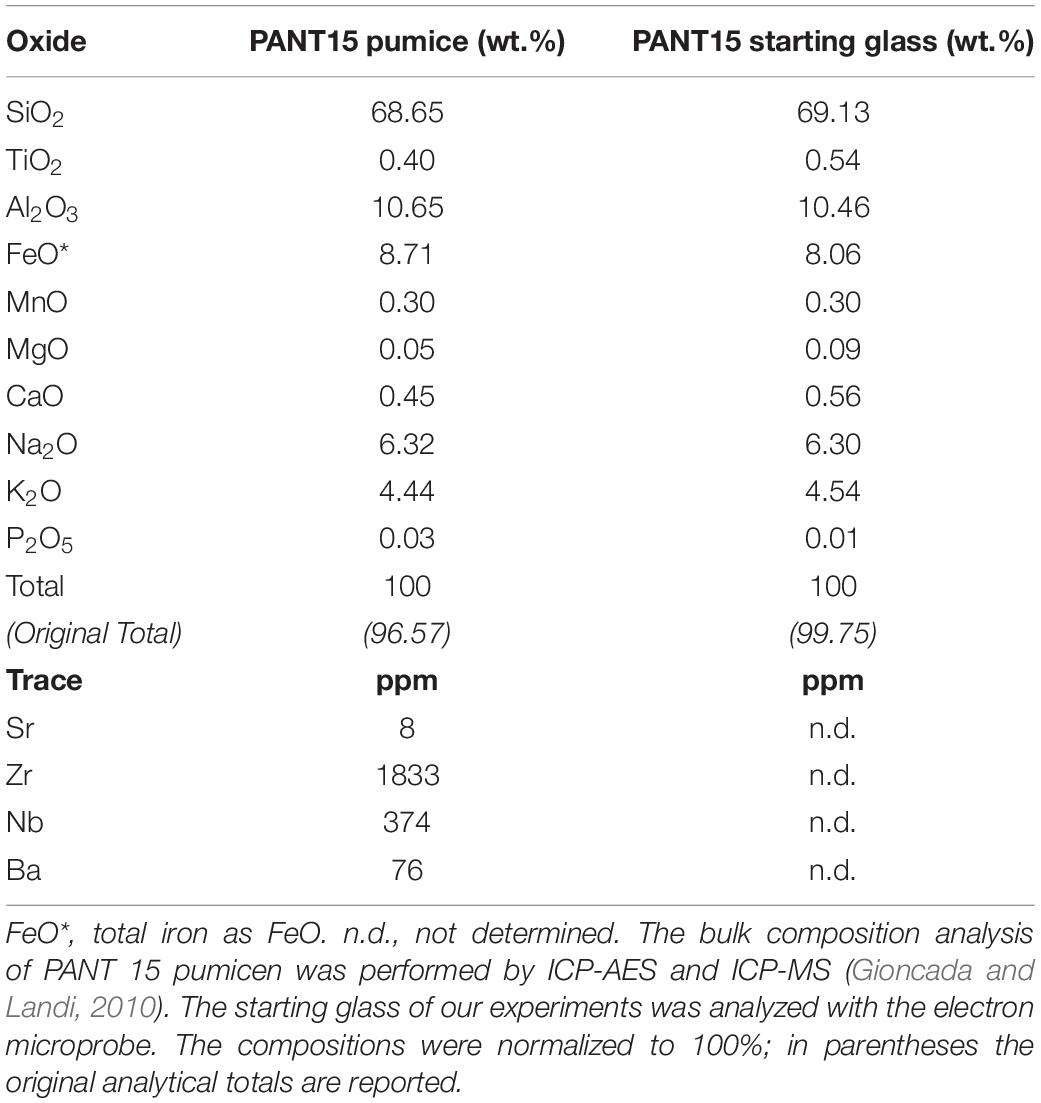
Table 1. Bulk compositions of Cuddia del Gallo pumice (PANT 15, Gioncada and Landi, 2010) and of the molten pumice (starting glass).
Fragments of the natural pumice were ground in an agate mortar under ethanol until a fine grain powder (∼20 microns) was reached. This powder was fused twice at 1200°C in an iron-saturated Pt crucible for 4 h at ambient pressure. The resulting glass was analyzed by electron microprobe (BRGM-CNRS-University of Orléans analytical facility, Orléans, France) to check its composition (Table 1). Comparing the composition of our starting glass (8.06 wt.% FeOtotal) with the whole-rock (8.71 wt.% FeOtotal) analyzed by Gioncada and Landi (2010; Table 1), we note a small difference in FeO (∼7% relative). We interpreted this difference as a small FeO loss, which may have occurred during the melting at 1200°C. The glass was then finely ground to a powder (∼20 microns) and used as the starting material for crystallization experiments.
Isobaric cooling experiments were performed under water-saturated, water-undersaturated and dry conditions. Gold capsules (18 mm in length, inner diameter 2.6 mm, outer diameter 3 mm) were used as sample containers. Regarding hydrous experiments (at saturated and undersaturated conditions), capsules were filled with a measured amount of distilled and deionized water using a micro syringe, then ∼40 mg of the powdered starting material were added. Water was added in the amount to ensure either water-saturated or water-undersaturated conditions. The amount of water needed to achieve water-saturated conditions was calculated with the water solubility model developed by Papale et al. (2006) (Table 2 and Supplementary Figure 1). Capsules were weighed after each addition of material, then crimped and welded shut by arc-welding, and finally weighed to check for water loss. Welded capsules were heated overnight at 110°C to homogenize the water distribution within the capsule before the experiment and weighed again to check for any leaks. Regarding anhydrous experiments, capsules were loaded only with ∼40 mg of the powdered starting material and then were welded shut by arc-welding.
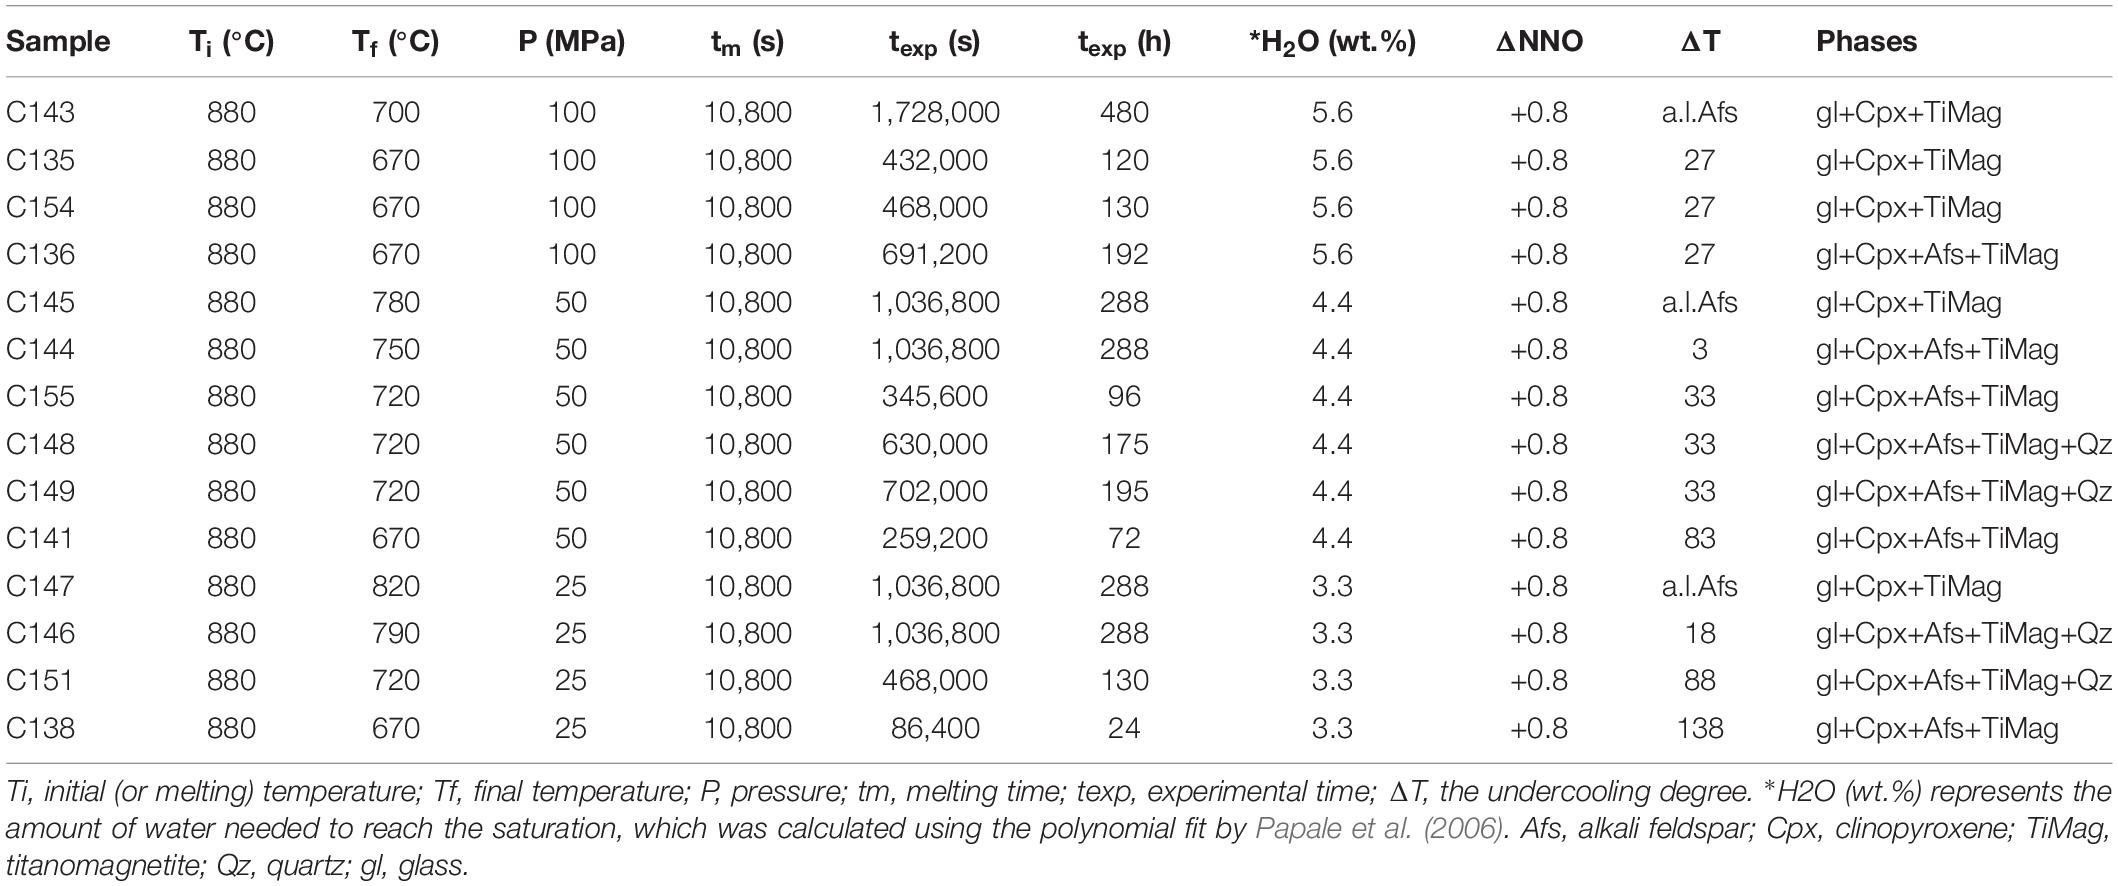
Table 2. Experimental conditions of water-saturated experiments.
Crystallization Experiments
A total of 14 isobaric cooling experiments were performed under water-saturated conditions (Table 2) with water-pressurized cold seal pressure vessels (CSPV, Nimonic 105) at the Geology Division of the University of Camerino (Italy). The intrinsic redox condition of the CSPV apparatus is close to NNO +0.8 (Di Matteo et al., 2004; Fabbrizio et al., 2006; Fabbrizio and Carroll, 2008). Temperature was measured in the sample position with a K-type thermocouple with an accuracy of ±5°C. Pressure was monitored by a high-pressure transducer or Bourdon-tube pressure gages, considered accurate to ±2 MPa. The sample was heated and pressurized to reach the initial temperature of 880°C (Ti) and the pressure of interest. The pressures investigated are 25, 50, and 100 MPa. The amount of added H2O necessary to obtain water-saturated conditions was estimated with the model of Papale et al. (2006; Table 2 and Supplementary Figure 1). Experiments were initially held for 3 h at 880°C, at pressure of 25, 50, or 100 MPa, to allow the melting and the hydration of the starting material. Then, temperature was rapidly decreased (15°C/min) to the final temperature (Tf = 670, 700, 720, 750, 780, 790, and 820°C), whilst, the pressure was kept constant (Table 2). Experiments were held at the final conditions for several durations that range from 24 to 480 h that allow us to investigate the crystallization kinetics of alkali feldspar (Table 2). The experimental durations of 288 and 480 h were in particular chosen for five experiments in order to reach equilibrium conditions (in agreement with Di Carlo et al., 2010) and, therefore, to constrain the alkali-feldspar liquidus. At the end of the experiments, the samples were rapidly quenched (cooling rate ∼150°C s–1; Dobson et al., 1989) by lowering the magnetically levitated sample holder into a water-cooled chamber at the base of the bomb (Carroll and Blank, 1997; Arzilli and Carroll, 2013).
Isobaric cooling experiments under water-undersaturated and anhydrous conditions (28 and 5 experiments, respectively; Table 3) were performed using an internally heated pressure vessel (IHPV) pressurized by an Ar-H2 mixture at the ISTO-CNRS Orleans (France). The Ar/H2 ratio was fixed by sequential loading at room temperature to reach the desired target fO2 (Scaillet et al., 1992; Di Carlo et al., 2010). The redox conditions investigated are NNO −1.15 and NNO +1. Pressure was recorded by a transducer calibrated against a Heise Bourdon tube gage (uncertainty is ±2 MPa). Three chromel-alumel thermocouples allowed the continuous control of temperature over the hotspot length (∼4 cm). Uncertainties in temperature are estimated to be ±5°C. Samples were pressurized up to the target pressure (25, 50, and 100 MPa) and heated at an initial temperature of 1020°C (Ti). Samples were maintained at the initial conditions for 3 h to allow the melting and the hydration of the starting materials. Five experiments were quenched after 3 h at the initial conditions to verify the absence of crystals at the initial conditions (Table 3). Regarding the single-step cooling experiments, after the melting period at 25, 50, and 100 MPa the temperature was rapidly decreased (15°C/min) to the final temperature (Tf) of 720°C. Experiments were held at the final conditions for several durations that range from 0.5 to 240 h. The samples were rapidly quenched by switching off the power supply.
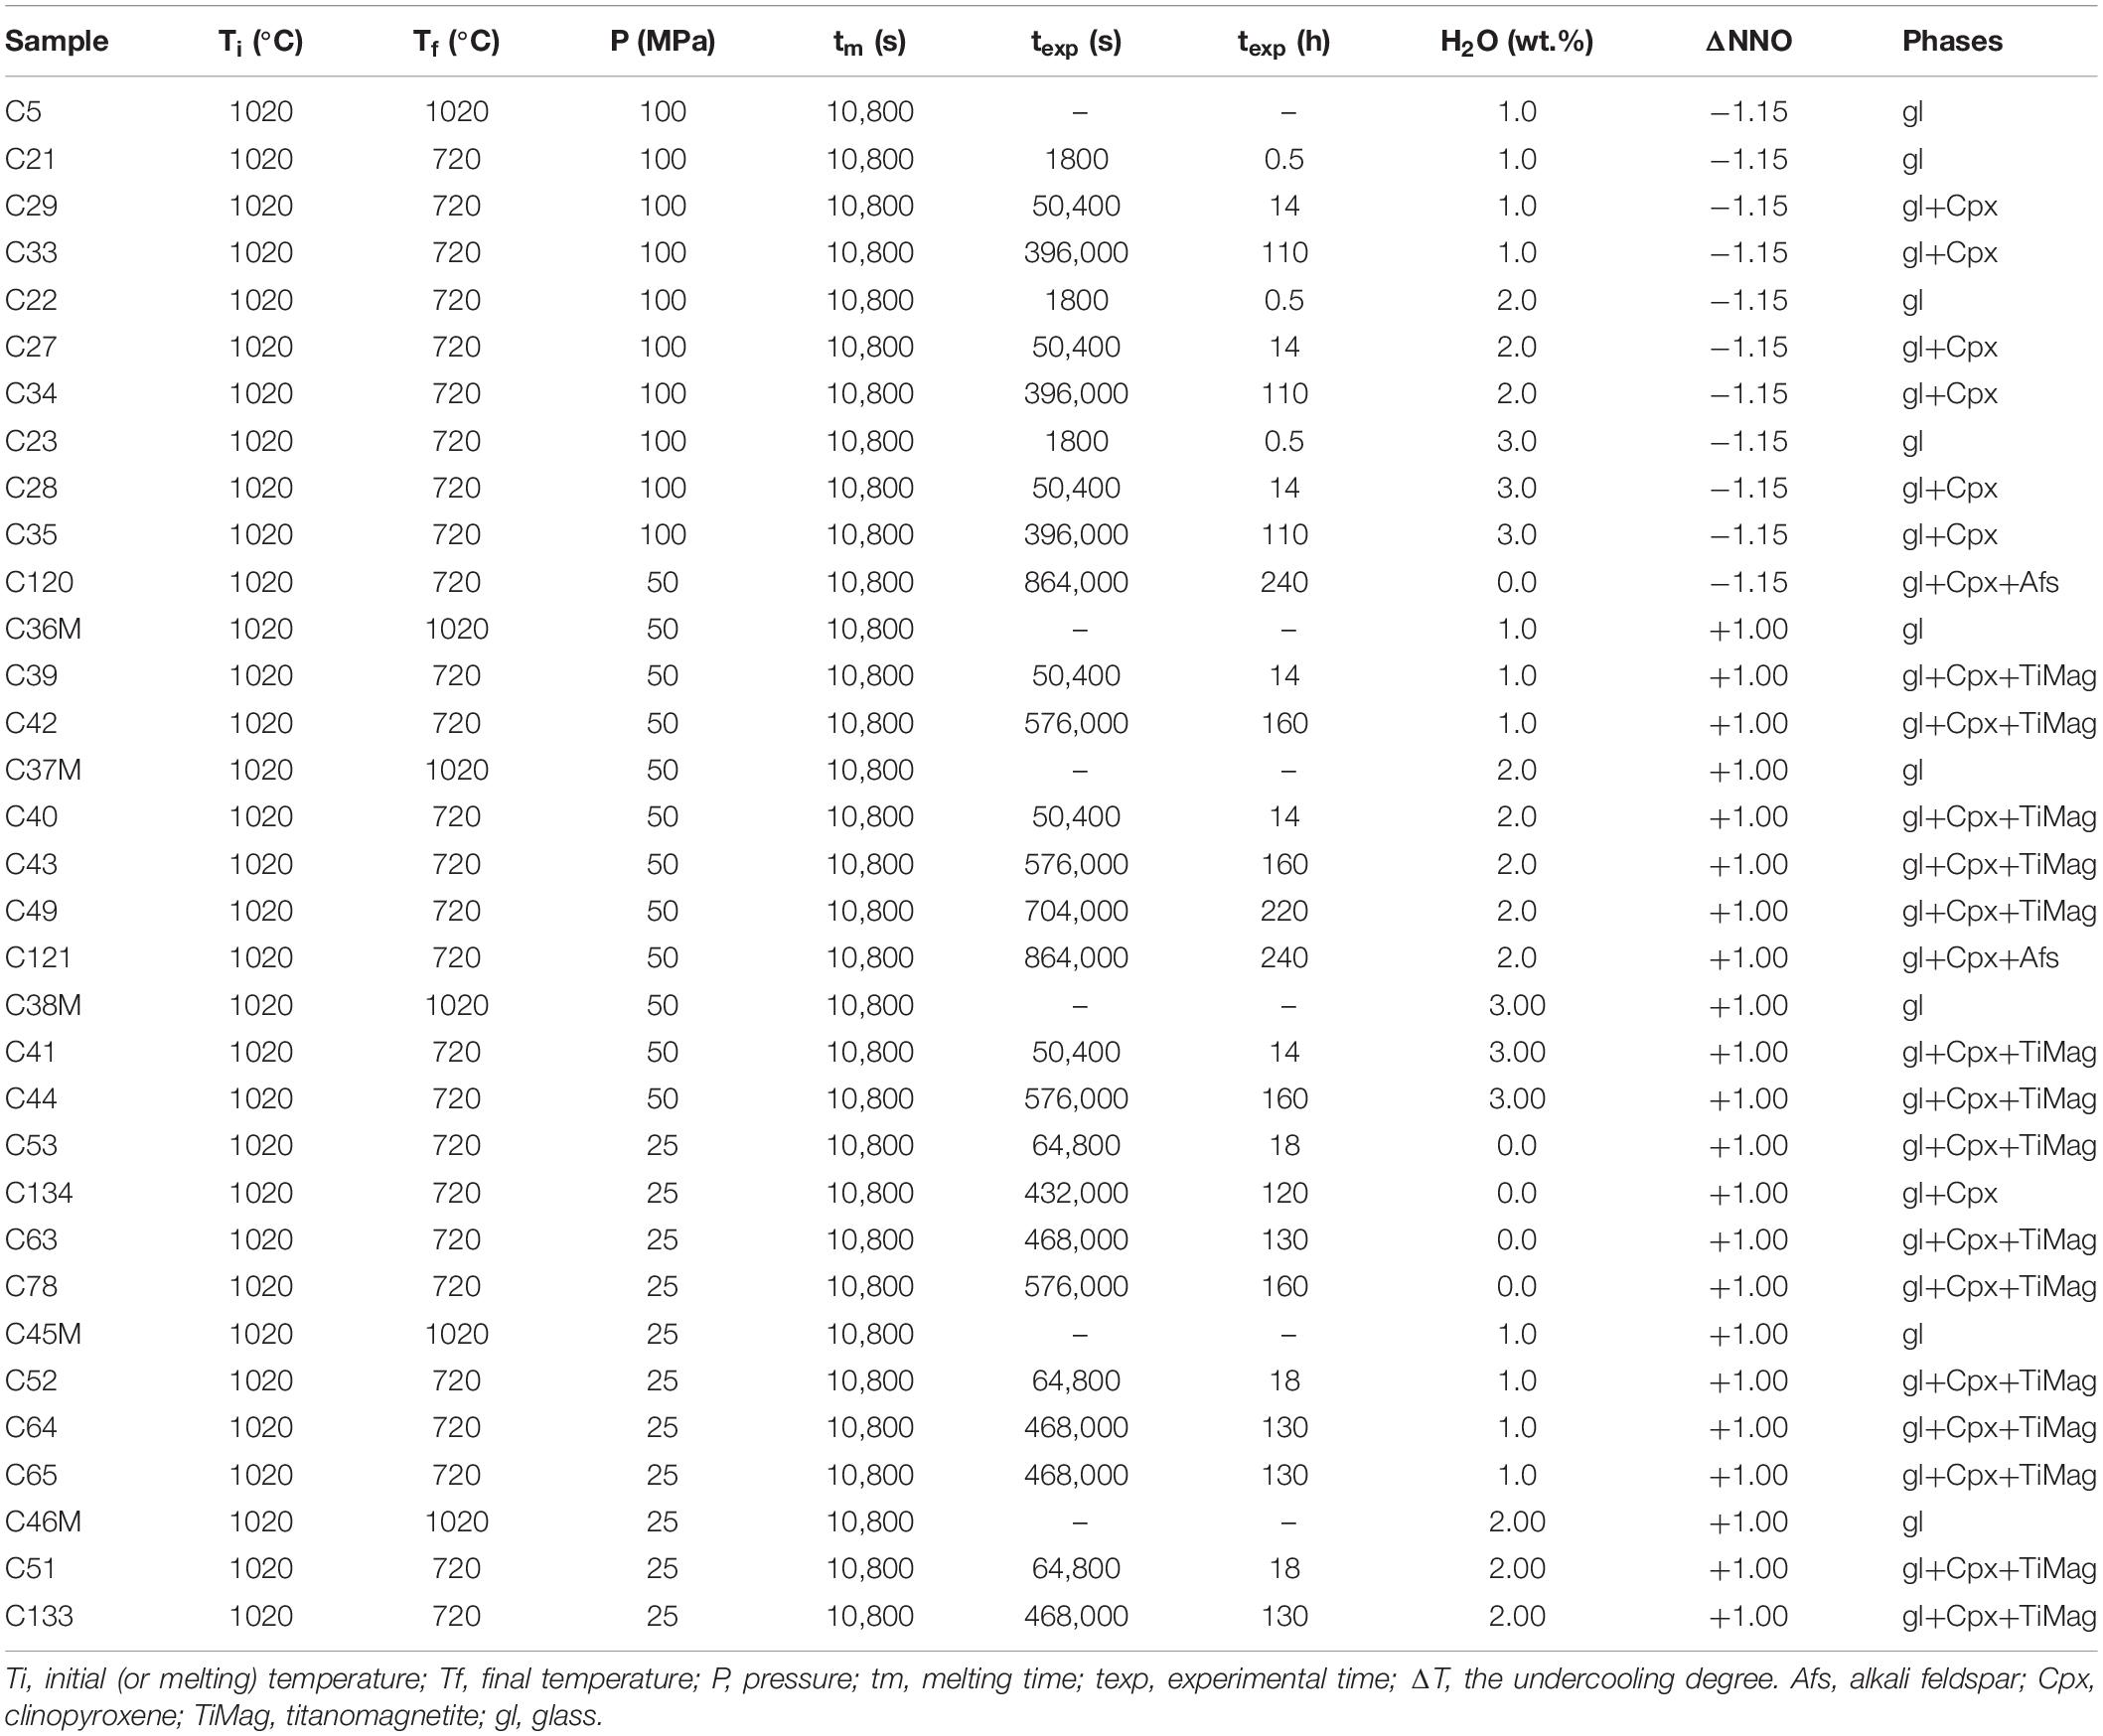
Table 3. Experimental condition of water-undersaturated experiments.
After each experiment, the capsule was weighed to check for leaks and opened; only samples showing no weight changes (±0.3 mg) were accepted as successful. All charges were mounted in epoxy and polished before optical examination and carbon coating for electron microprobe/SEM analysis.
Image Analysis
Back-scattered electron (BSE) images of the samples produced under water-saturated conditions were collected using a ZEISS EVO MA10 scanning electron microscope (SEM) at the Istituto Nazionale di Geofisica e Vulcanologia, Pisa, Italy. BSE images of the samples obtained under water-undersaturated and anhydrous conditions were collected using a JEOL WINSET JSM 6400 SEM at the Institut des Sciences de la Terre d’Orléans (ISTO), Orleans, France. For both instruments, the analytical conditions were 15 kV accelerating voltage and 10 nA beam current.
Textural analysis on BSE images was performed using ImageJ software (NIH Image; Abramoff et al., 2004; Schneider et al., 2012) to quantify the crystal fraction and the sizes of alkali feldspar crystals. To measure the areas of alkali feldspar (Afs), glass, clinopyroxene, quartz, oxide, and bubbles, each phase was segmented by using manual bi-level grayscale thresholding based on the grayscale histogram of the image, therefore, the phases were defined in the image by appropriate threshold values (Arzilli and Carroll, 2013). Pre- and post-segmentation smoothing filters were required to both ease and refine the segmentation procedure (Arzilli et al., 2016a). The crystal area fraction (ϕ) of alkali feldspar was calculated on a vesicle-free basis. We refer to the vesicle-corrected sample area as the “reference area” (Ar), and this was obtained by subtracting vesicle areas from the total image area (Hammer et al., 1999). Therefore, the reference area in each BSE image consists of only glass and crystals, thus, all abundances refer to phase proportions in glass plus crystals. The alkali feldspar crystal fraction (ϕ) was obtained from (Hammer et al., 1999):
Crystal dimensions were also measured using ImageJ. The largest 10 crystals in each image were measured (Couch, 2003; Arzilli and Carroll, 2013) because of the interest in determining the maximum growth rate. Growth rate (YL) was calculated using only the largest dimension of each crystal (e.g., Fenn, 1977; Hammer and Rutherford, 2002; Couch et al., 2003). The uncertainty for sizes and growth rate measurements was estimated on the basis of the 10 largest crystals observed in each sample. According to Couch (2003) and Calzolaio et al. (2010), we used the following relationship:
where t is the duration of the experiment. Furthermore, incremental growth rate (YLi) was calculated to study the influence of time on growth process, using the following relationship:
where L2 and L1 are the maximum lengths measured at experimental times t2 and t1, respectively, for two experiments with the same ΔT and different durations.
Chemical Analysis
Major element compositions of alkali feldspar crystals, formed during isobaric cooling experiments, were analyzed by electron microprobe (EMP). An electron microprobe Cameca SX50 at the BRGM-CNRS of the University of Orléans (Orléans, France) was used for the samples obtained under water-undersaturated and anhydrous conditions. An electron microprobe Cameca SX 50 at CNR Institute for Geosciences and Earth Resources of the University of Padova (Padova, Italy) and a Jeol JXA-8530F equipped with five wave dispersive spectrometers (WDS) at the Institute of Petrology and Structural Geology of the Charles University (Prague, CZE) were used for the samples obtained under water-saturated conditions and the natural alkali feldspar crystals from Cuddia del Gallo products (PANT15). For all instruments, the operating conditions were as follows: 15 kV accelerating voltage, 6 nA beam current, counting times of 10 s on peak and 5 s on background. Alkali feldspar crystals were analyzed with a beam diameter of 5 μm. Na, K, and Si were measured first to minimize effects of alkali mobility under the electron beam (lower Na, K, higher Si). Calibration standards were quartz for Si, corundum for Al, anorthite for Ca, aegirine for Na, sanidine for K, rutile for Ti, fayalite for Fe, forsterite for Mg and tephroite for Mn. The uncertainty is between 1 and 5% for major elements and up to 10% for elements at concentration <0.2 wt.%.
The chemical composition of natural alkali feldspar crystals from Cuddia del Gallo products (PANT15), was analyzed using a Zeiss EVO MA 10 SEM, equipped with an Oxford ISIS microanalytical EDS system at the INGV, Pisa (Italy). The operating conditions for EDS analysis are: 15 kV acceleration voltage, 2 nA beam current and 50 s live time.
Results
Alkali Feldspar Liquidus Under Water-Saturated Conditions
The alkali feldspar liquidus, under water-saturated conditions, was constrained using the results of the single-step cooling experiments reported in Table 2. The mineral assemblage of these experiments and, therefore, the absence and presence of alkali feldspar at different P-T conditions allowed us to define the alkali feldspar liquidus for the PANT15 composition at NNO +0.8 (Figure 1). In the mineral assemblage of the water-saturated experiments, clinopyroxene and titanomagnetite are ubiquitous in all the conditions investigated. Quartz is present at 50 MPa, 720°C and an experimental duration of 195 h. Quartz is also present at 25 MPa and at temperatures of 720 and 790°C for durations longer than 130 h. Alkali feldspar crystals are present at 100 MPa and 670°C, at 50 MPa and temperatures ≤750°C and, at 25 MPa and temperatures ≤790°C. Experiments at 100 MPa and 700°C, 50 MPa and 780°C and, 25 MPa and 820°C indicate that alkali feldspar does not crystallize. Therefore, the liquidus is located between 670 and 700°C at 100 MPa, between 750 and 780°C at 50 MPa and between 790 and 820°C at 25 MPa (Figure 1).
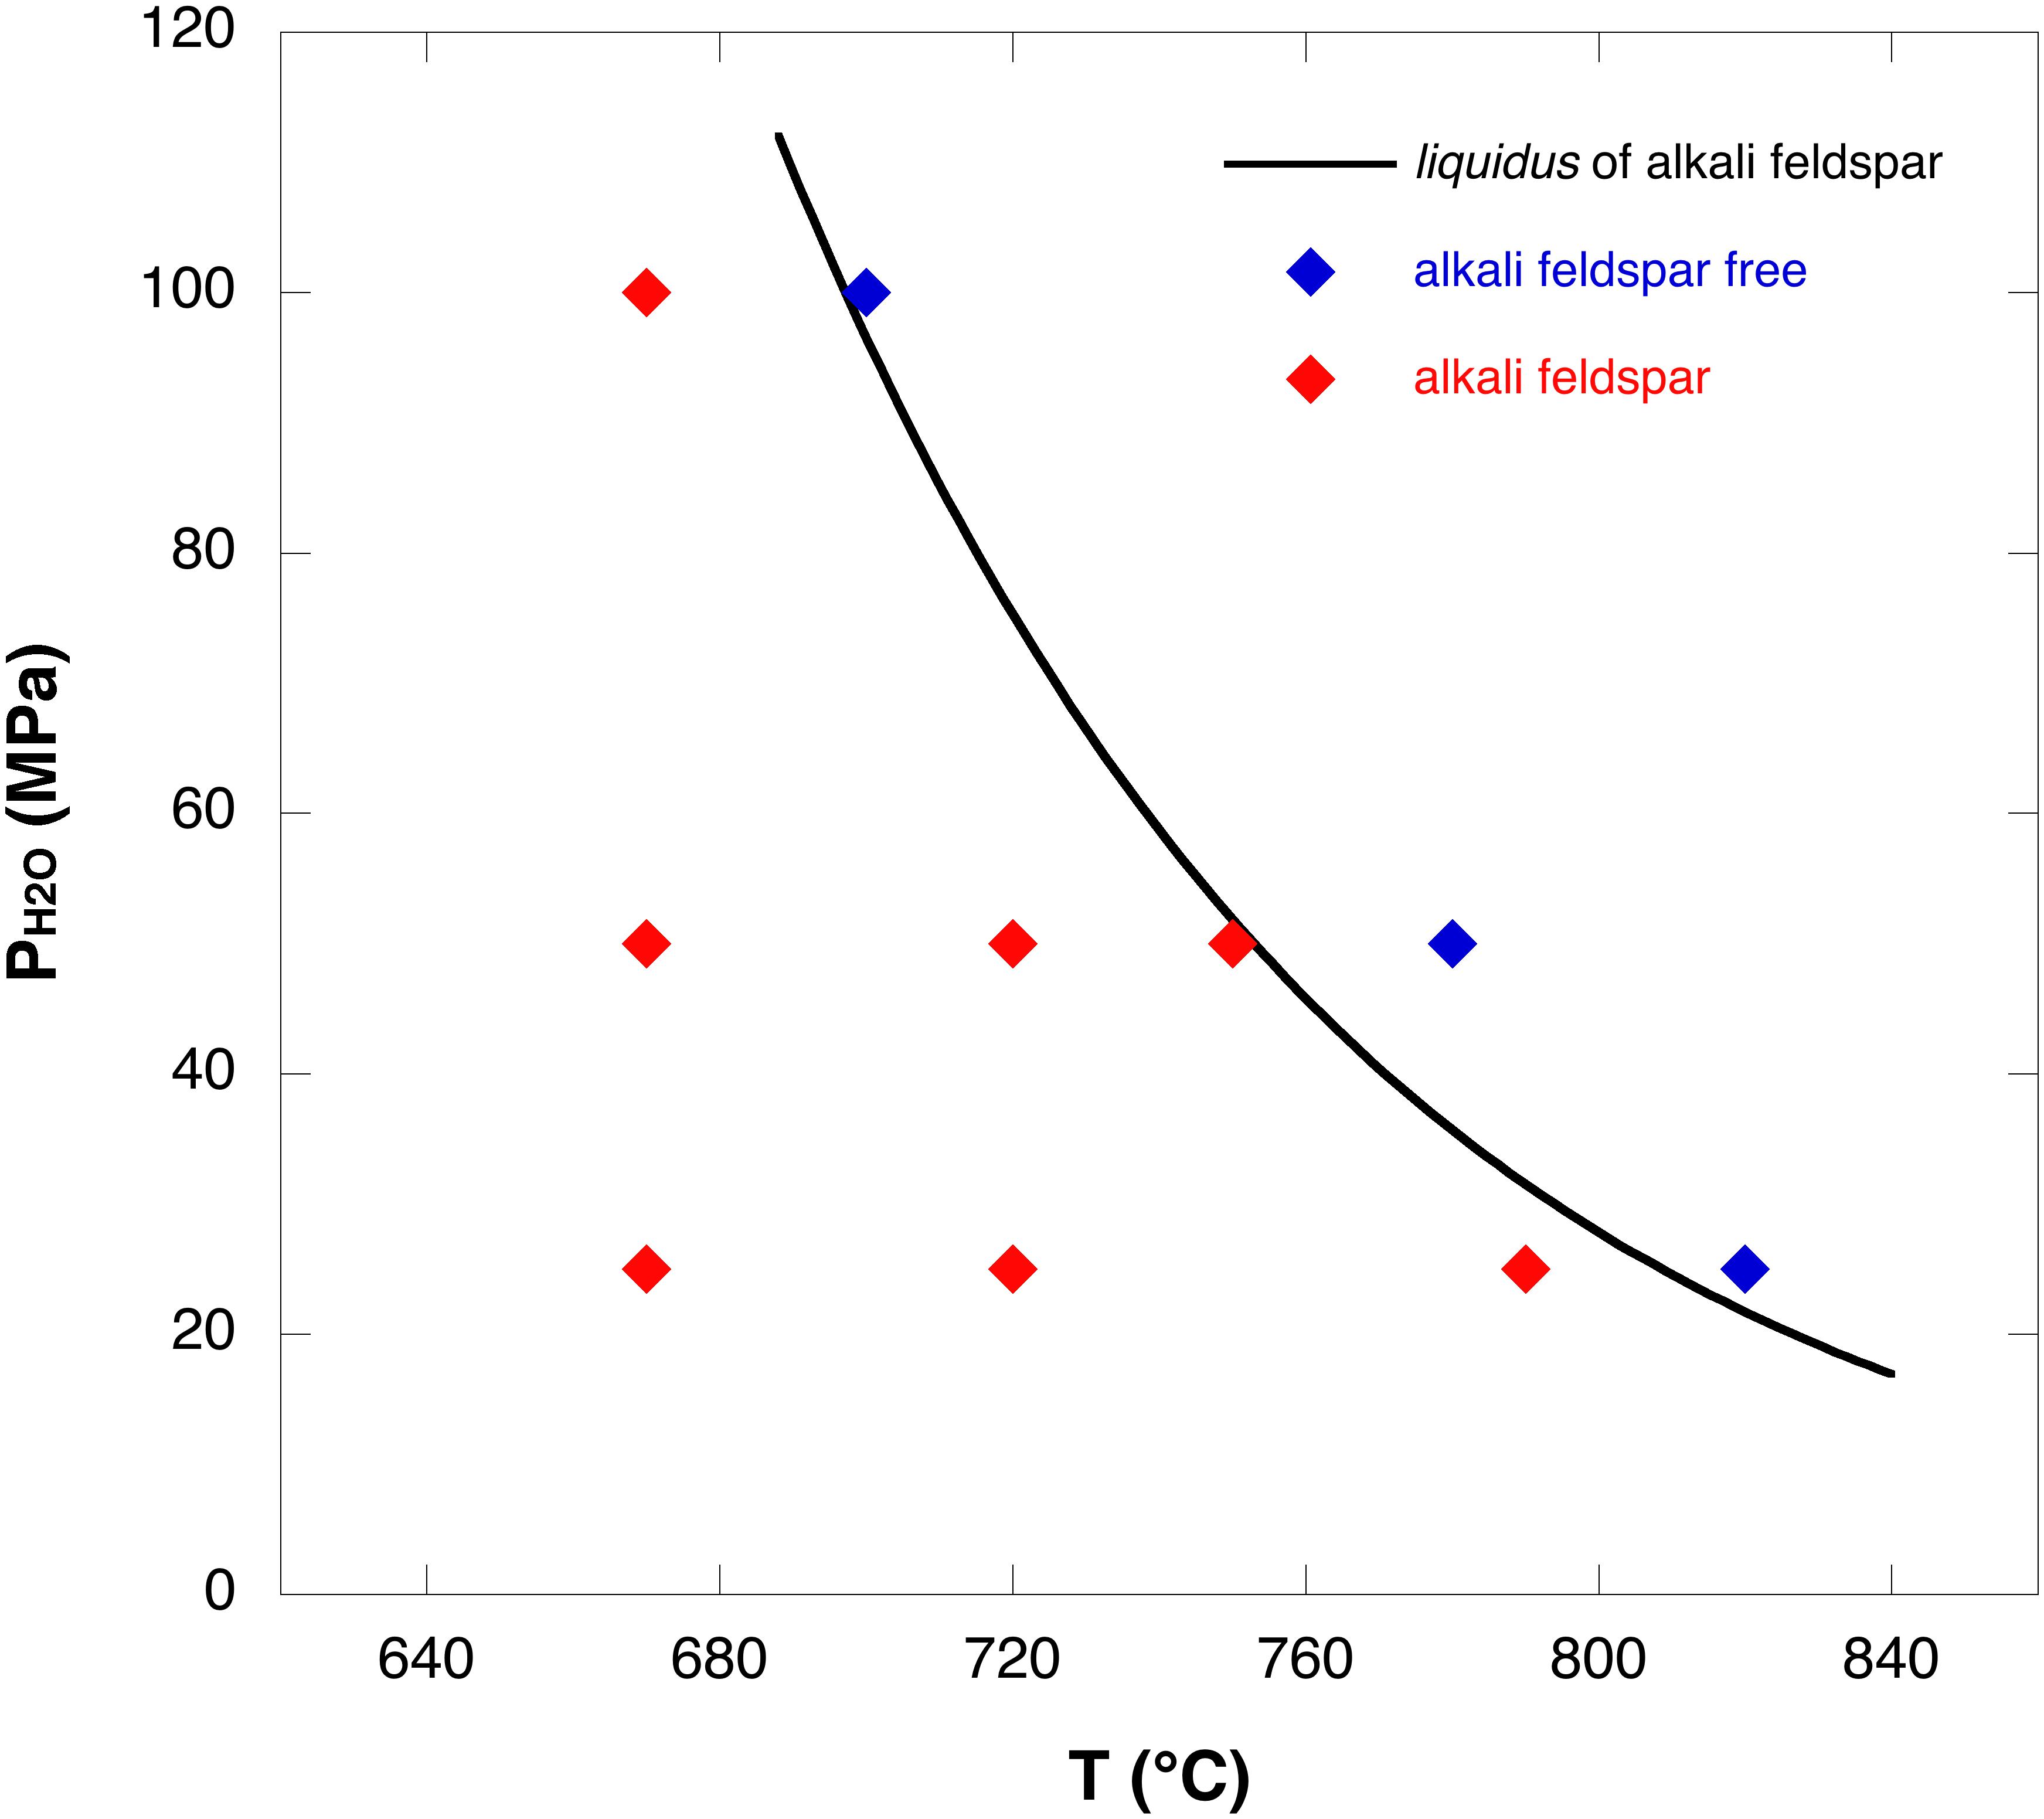
Figure 1. Phase diagram for alkali feldspar. The solid line represents the liquidus of alkali feldspar under water-saturated conditions at NNO+0.8. Blue diamonds, alkali feldspar-free charges; red diamonds, alkali feldspar-bearing charges.
Alkali Feldspar Crystallization Under Water-Undersaturated Conditions
The alkali feldspar crystallization, under water-undersaturated conditions, was constrained using the results of the single-step cooling experiments reported in Table 3. Regarding the results obtained at 100 MPa, 720°C, reduced conditions (NNO −1.15) and experimental durations ≤110 h, alkali feldspar was not able to crystallize. Only clinopyroxene formed at durations ≥14 h. Alkali feldspar is present at reduced conditions (NNO −1.15) after 240 h under anhydrous conditions at 50 MPa.
Regarding the results obtained at 720°C, oxidized conditions (NNO +1) and experimental durations ≤220 h at 50 MPa and ≤160 h at 25 MPa, alkali feldspar was not able to crystallize. Alkali feldspar crystallized only after 240 h at 50 MPa with 2 wt.% of H2O.
We note that titanomagnetite is absent at reduced conditions (NNO −1.15), whereas it is present at more oxidized conditions (NNO +1) (Table 3), therefore, fO2 controls the liquidus geometry of titanomagnetite that may be shifted at lower temperature at reduced conditions. Clinopyroxene crystals, instead, are present both at reduced and oxidized conditions with dendritic and spherulitic morphologies.
Nucleation Delay of Alkali Feldspar
The nucleation delay of alkali feldspar was constrained from the experiments performed at 670 and 720°C, under water-saturated and -undersaturated conditions, considering the pressure-time space investigated (Figure 2 and Tables 2, 3).
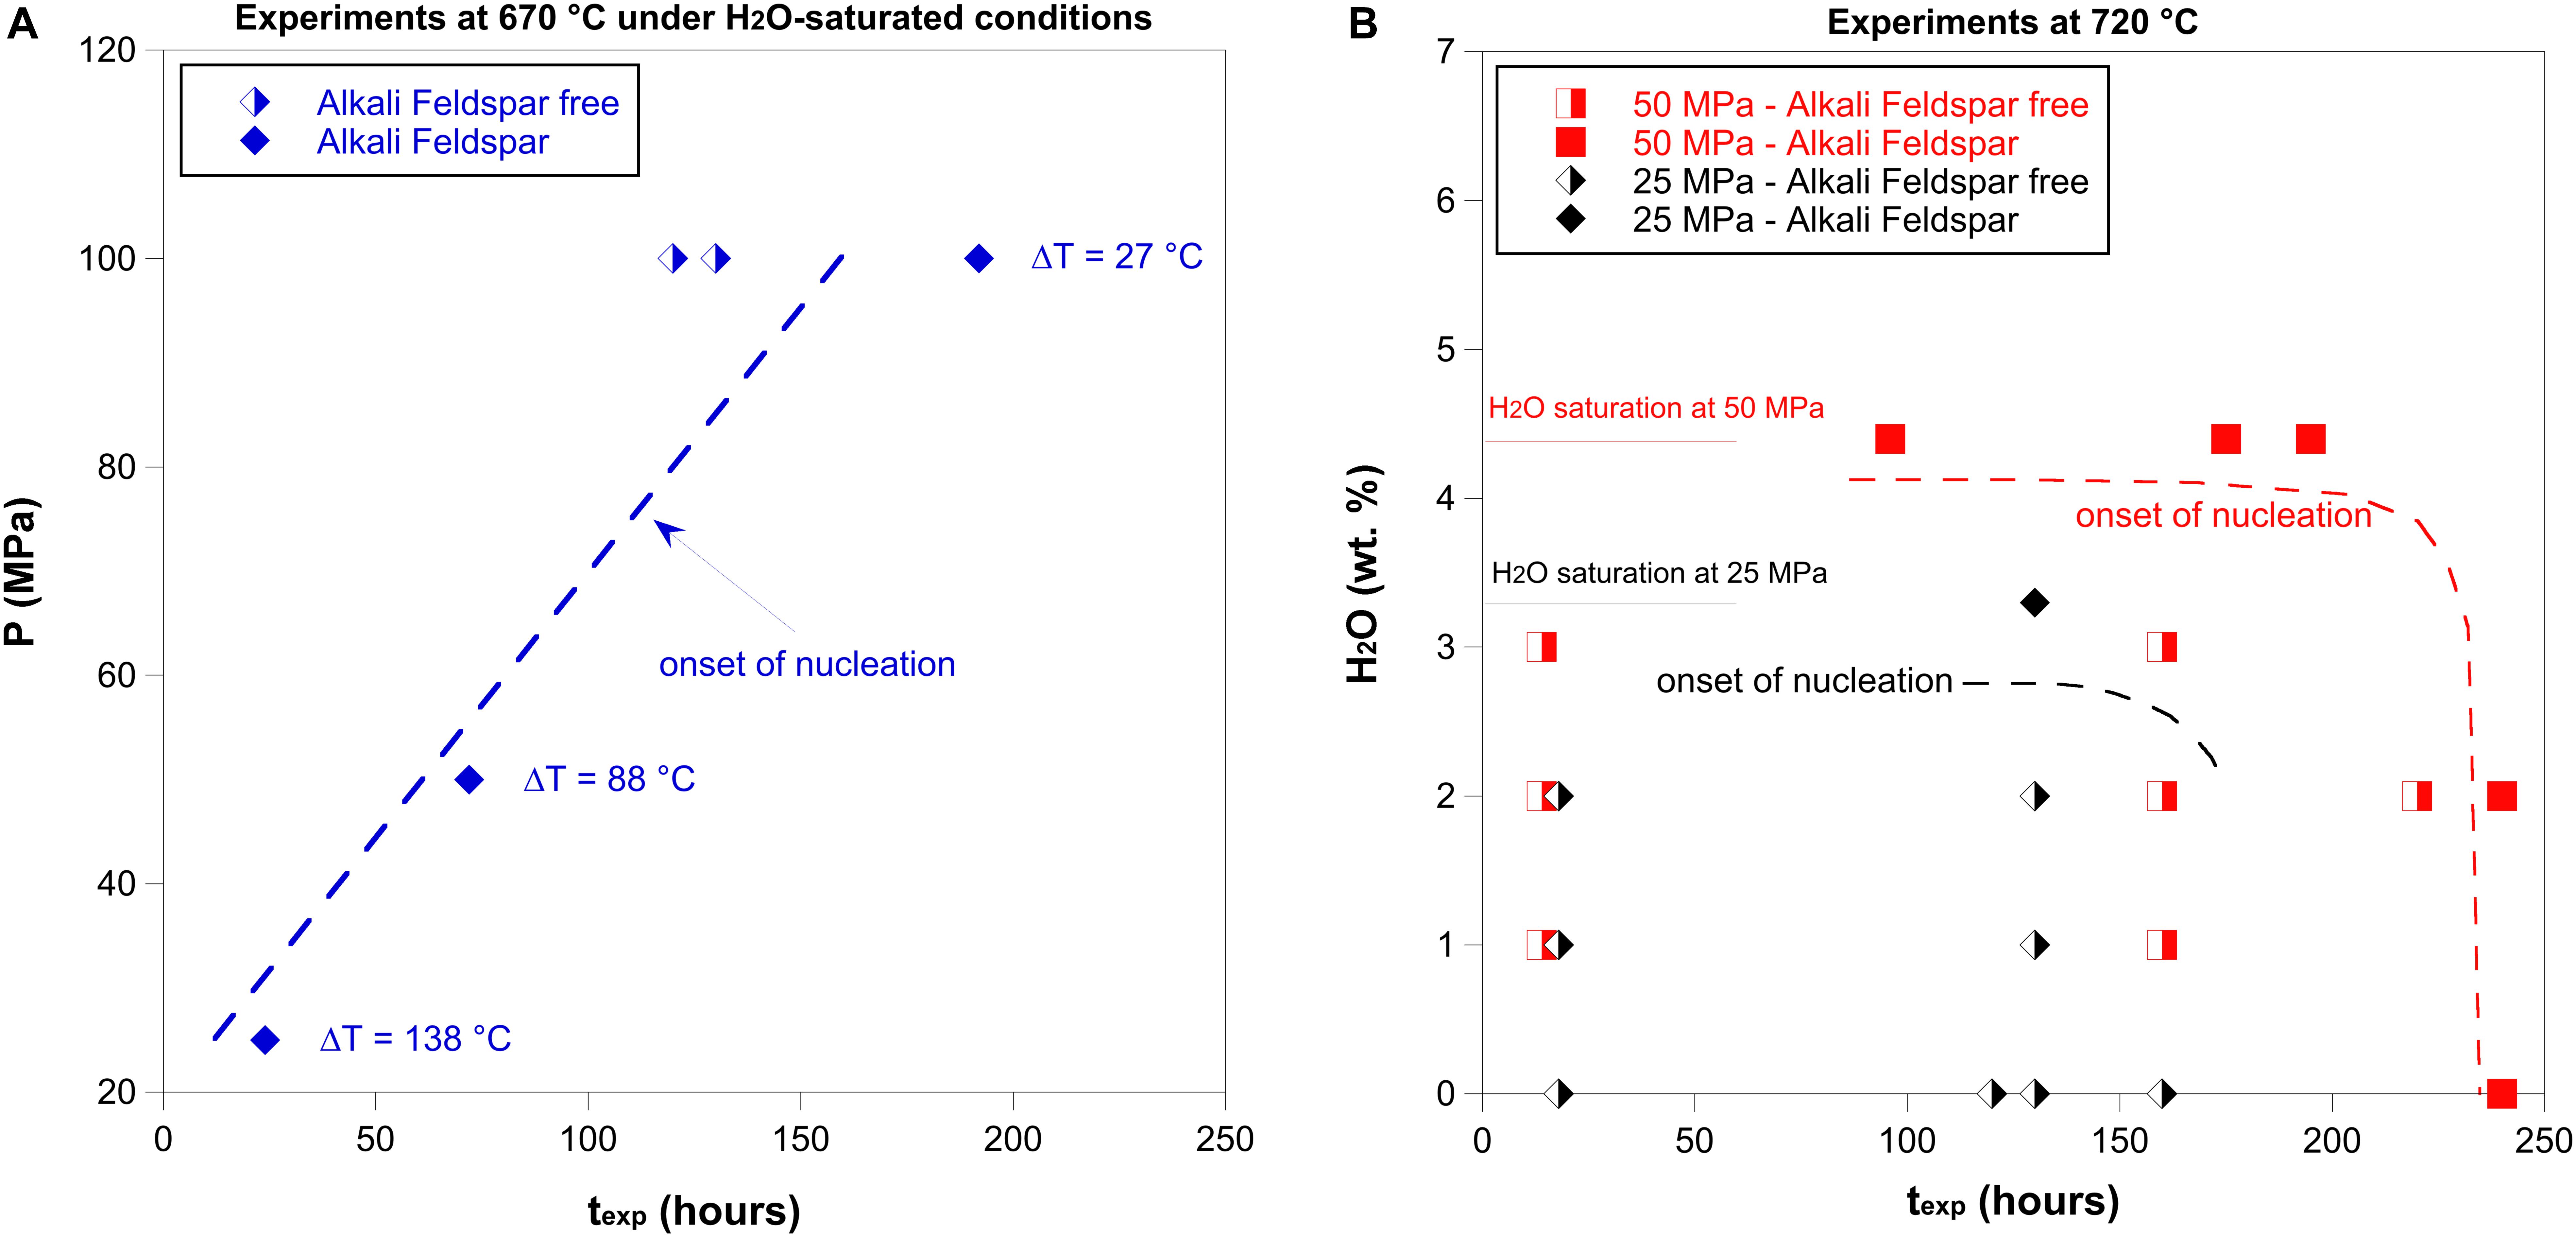
Figure 2. The alkali feldspar nucleation delay as a function of final temperature (Tf), pressure, H2O content dissolved in the melt and experimental duration (texp). (A) Experiments at 670°C under water-saturated conditions. The dashed line represents the onset of nucleation. (B) Experiments at 720°C under water-saturated and undersaturated conditions. The black dashed line represents the onset of nucleation at 25 MPa, whereas the red dashed line represents the onset of nucleation at 50 MPa.
Experiments performed at 670°C under water-saturated conditions indicate that alkali feldspar was not able to crystallize within 130 h at 100 MPa. However, alkali feldspar crystallized within 72 h at 50 MPa and within 24 h at 25 MPa (Figures 2A, 3). In agreement with the liquidus in Figure 1, for water-saturated experiments, when the pressure decreases the undercooling increases. Therefore, the experiments at 670°C indicate that the nucleation delay is smaller at higher undercooling (Figure 2A).
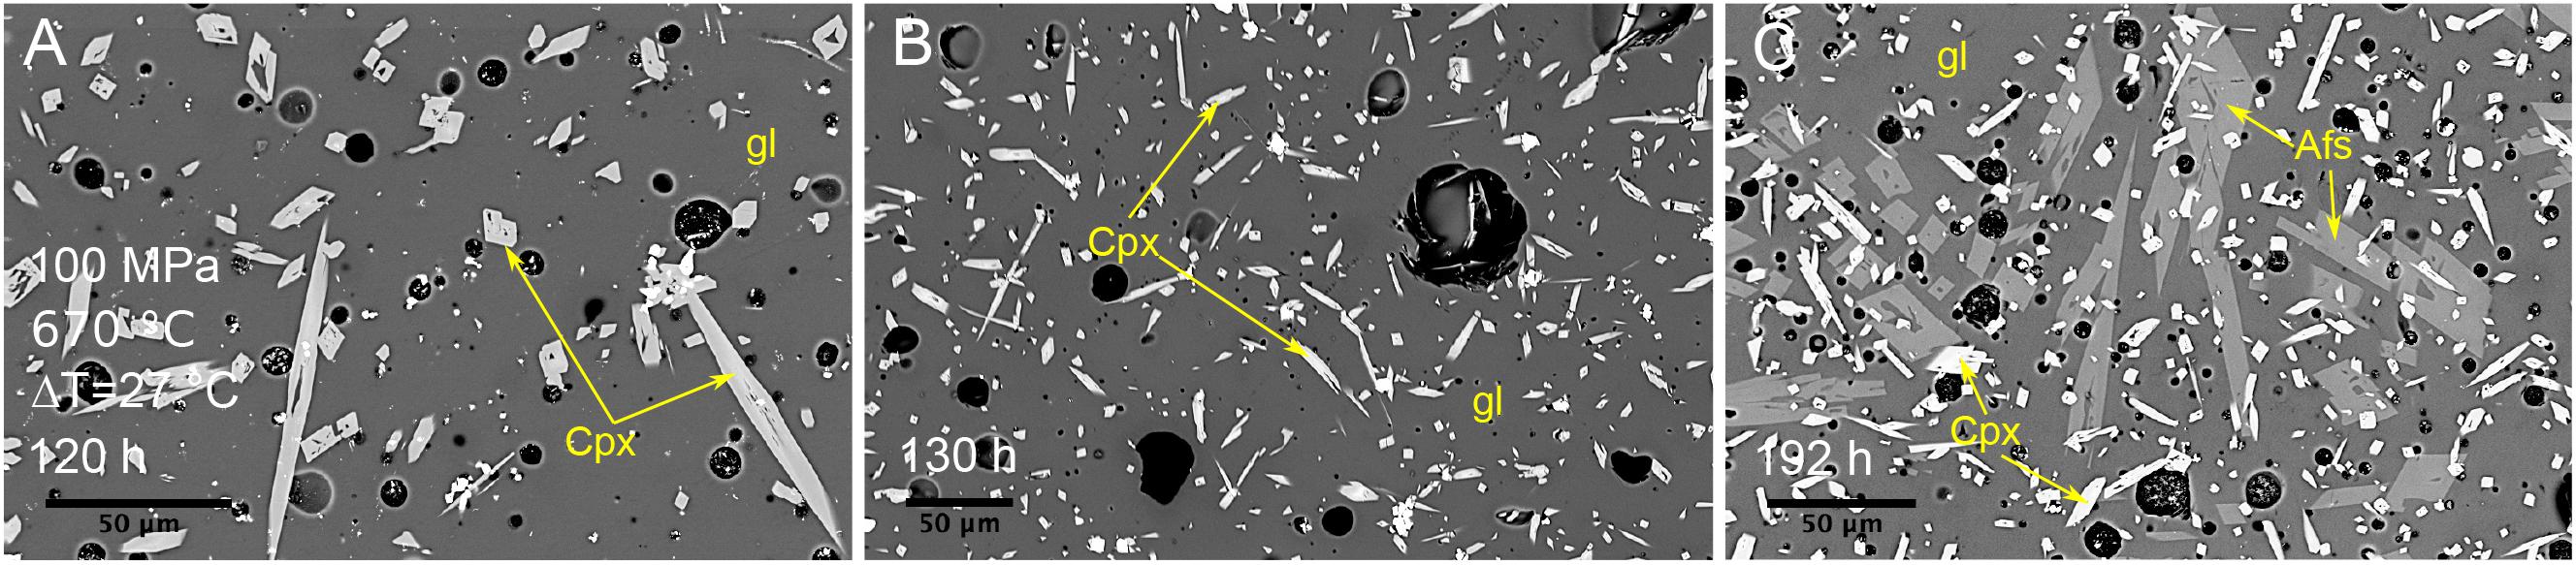
Figure 3. Backscattered SEM images of textures obtained from isobaric cooling experiments at 100 MPa, 670°C and ΔT = 27°C. (A) Sample C135: experimental duration of 120 h. (B) Sample C154: experimental duration of 130 h. (C) Sample C136: experimental duration of 192 h. Afs, alkali feldspar; Cpx, clinopyroxene; gl, glass.
Experiments at 50 MPa and 720°C show that alkali feldspar was able to form after 240 h under anhydrous and water-undersaturated conditions (0 and 2 wt.% of H2O), but under water saturated conditions, alkali feldspar crystallized within 96, 175, and 195 h (Figures 2B, 4). Experiments at 25 MPa and 720°C also show that alkali feldspar was not crystallized within 130 h under anhydrous and water-undersaturated conditions (0, 1, and 2 wt.% of H2O). However, alkali feldspar formed within 130 h under water-saturated conditions (Figures 2B, 5).
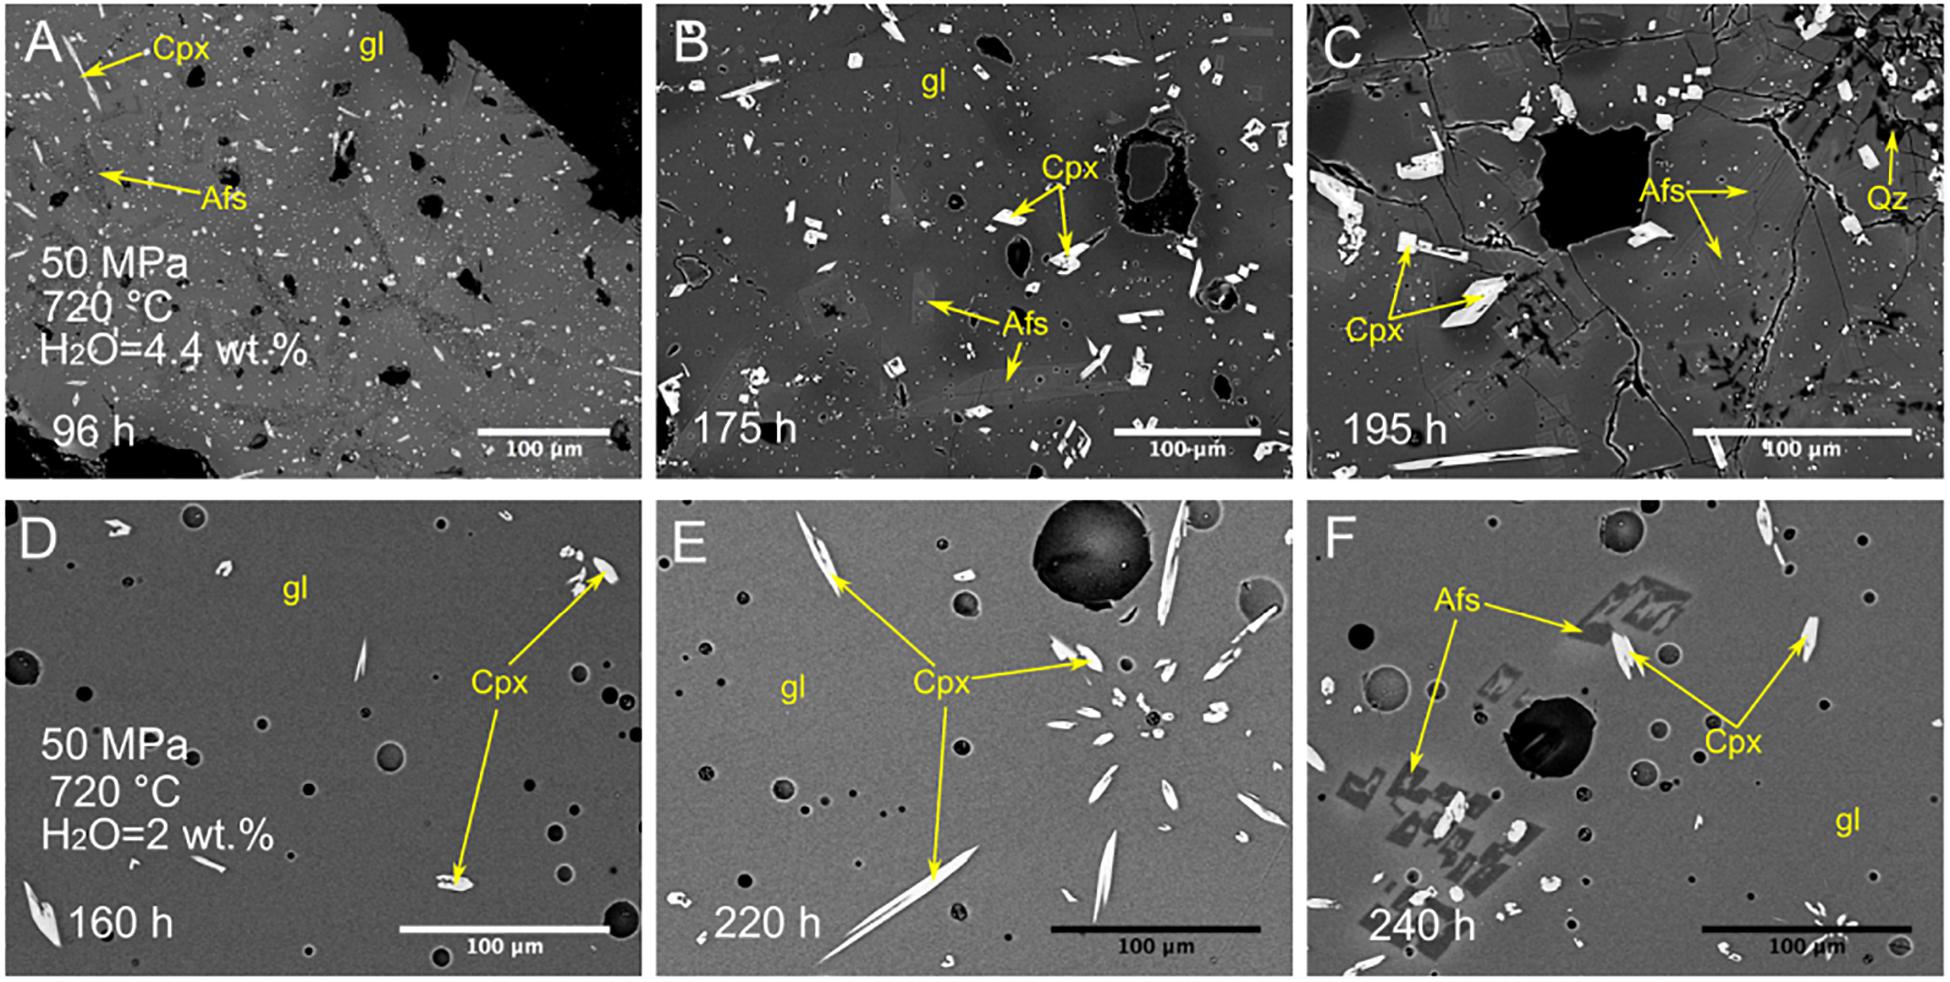
Figure 4. Backscattered SEM images of textures obtained from isobaric cooling experiments at 50 MPa and 720°C under water-saturated and -undersaturated conditions. Experiments under water-saturated conditions (H2O = 4.4 wt.%): (A) Sample C155: experimental duration of 96 h and ΔT = 33°C; (B) Sample C148: experimental duration of 175 h and ΔT = 33°C; (C) Sample C149: experimental duration of 195 h and ΔT = 33°C. Experiments under water-undersaturated conditions (H2O = 2 wt.%): (D) Sample C43: experimental duration of 160 h; (E) Sample C49: experimental duration of 220 h; (F) Sample C121: experimental duration of 240 h. Afs, alkali feldspar; Cpx, clinopyroxene; Qz, quartz; gl, glass.
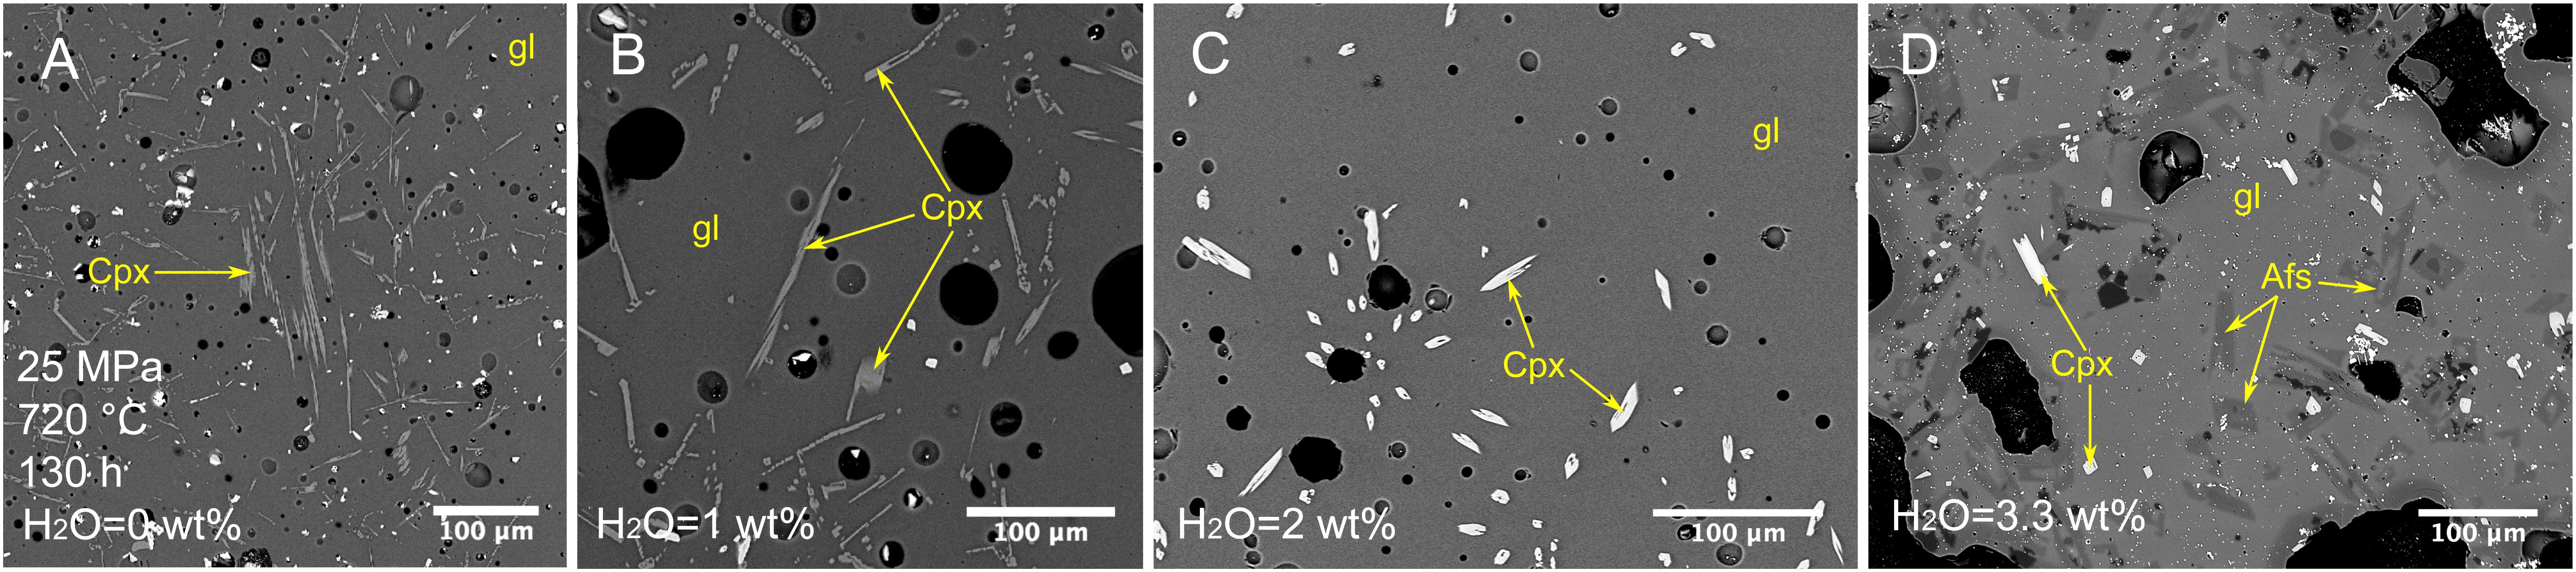
Figure 5. Backscattered SEM images of textures obtained from isobaric cooling experiments at 25 MPa, 720°C and experimental duration of 130 h. (A) Sample C63: experiment at anhydrous condition. (B) Sample C65: experiment under water-undersaturated condition H2O = 1 wt.%. (C) Sample C133: experiment under water-undersaturated condition H2O = 2 wt.%. (D) Sample C151: experiment under water-saturated condition H2O = 3.3 wt.%. Afs, alkali feldspar; Cpx, clinopyroxene; gl, glass.
Crystallization Kinetics of Alkali Feldspar
The crystal fraction (ϕ) and the growth rates (YL and YLi) of alkali feldspar were quantified from experiments performed under water-saturated conditions and the data are reported in Figure 6 and Supplementary Table 1. Experiments at 100 MPa and 670°C (ΔT = 27°C) indicate that alkali feldspar is not able to crystallize after 130 h and its crystal fraction can reach 0.07 after 195 h; for these conditions the onset of nucleation and growth should be between 130 and 195 h (Figure 2A). Experiments at 50 MPa and 720°C (ΔT = 33°C) indicate also that the alkali feldspar crystal fraction can increase from 0.07 to 0.09 at durations between 96 and 195 h, implying that the growth process is still active at these conditions. Considering similar experimental durations, the crystal fractions obtained at ΔT = 33°C are similar to that calculated at ΔT = 27°C, whereas, ϕ increases up to 0.19 as ΔT increases at 88°C (Figure 6). At large ΔT (138°C) ϕ is 0.02 after 24 h.
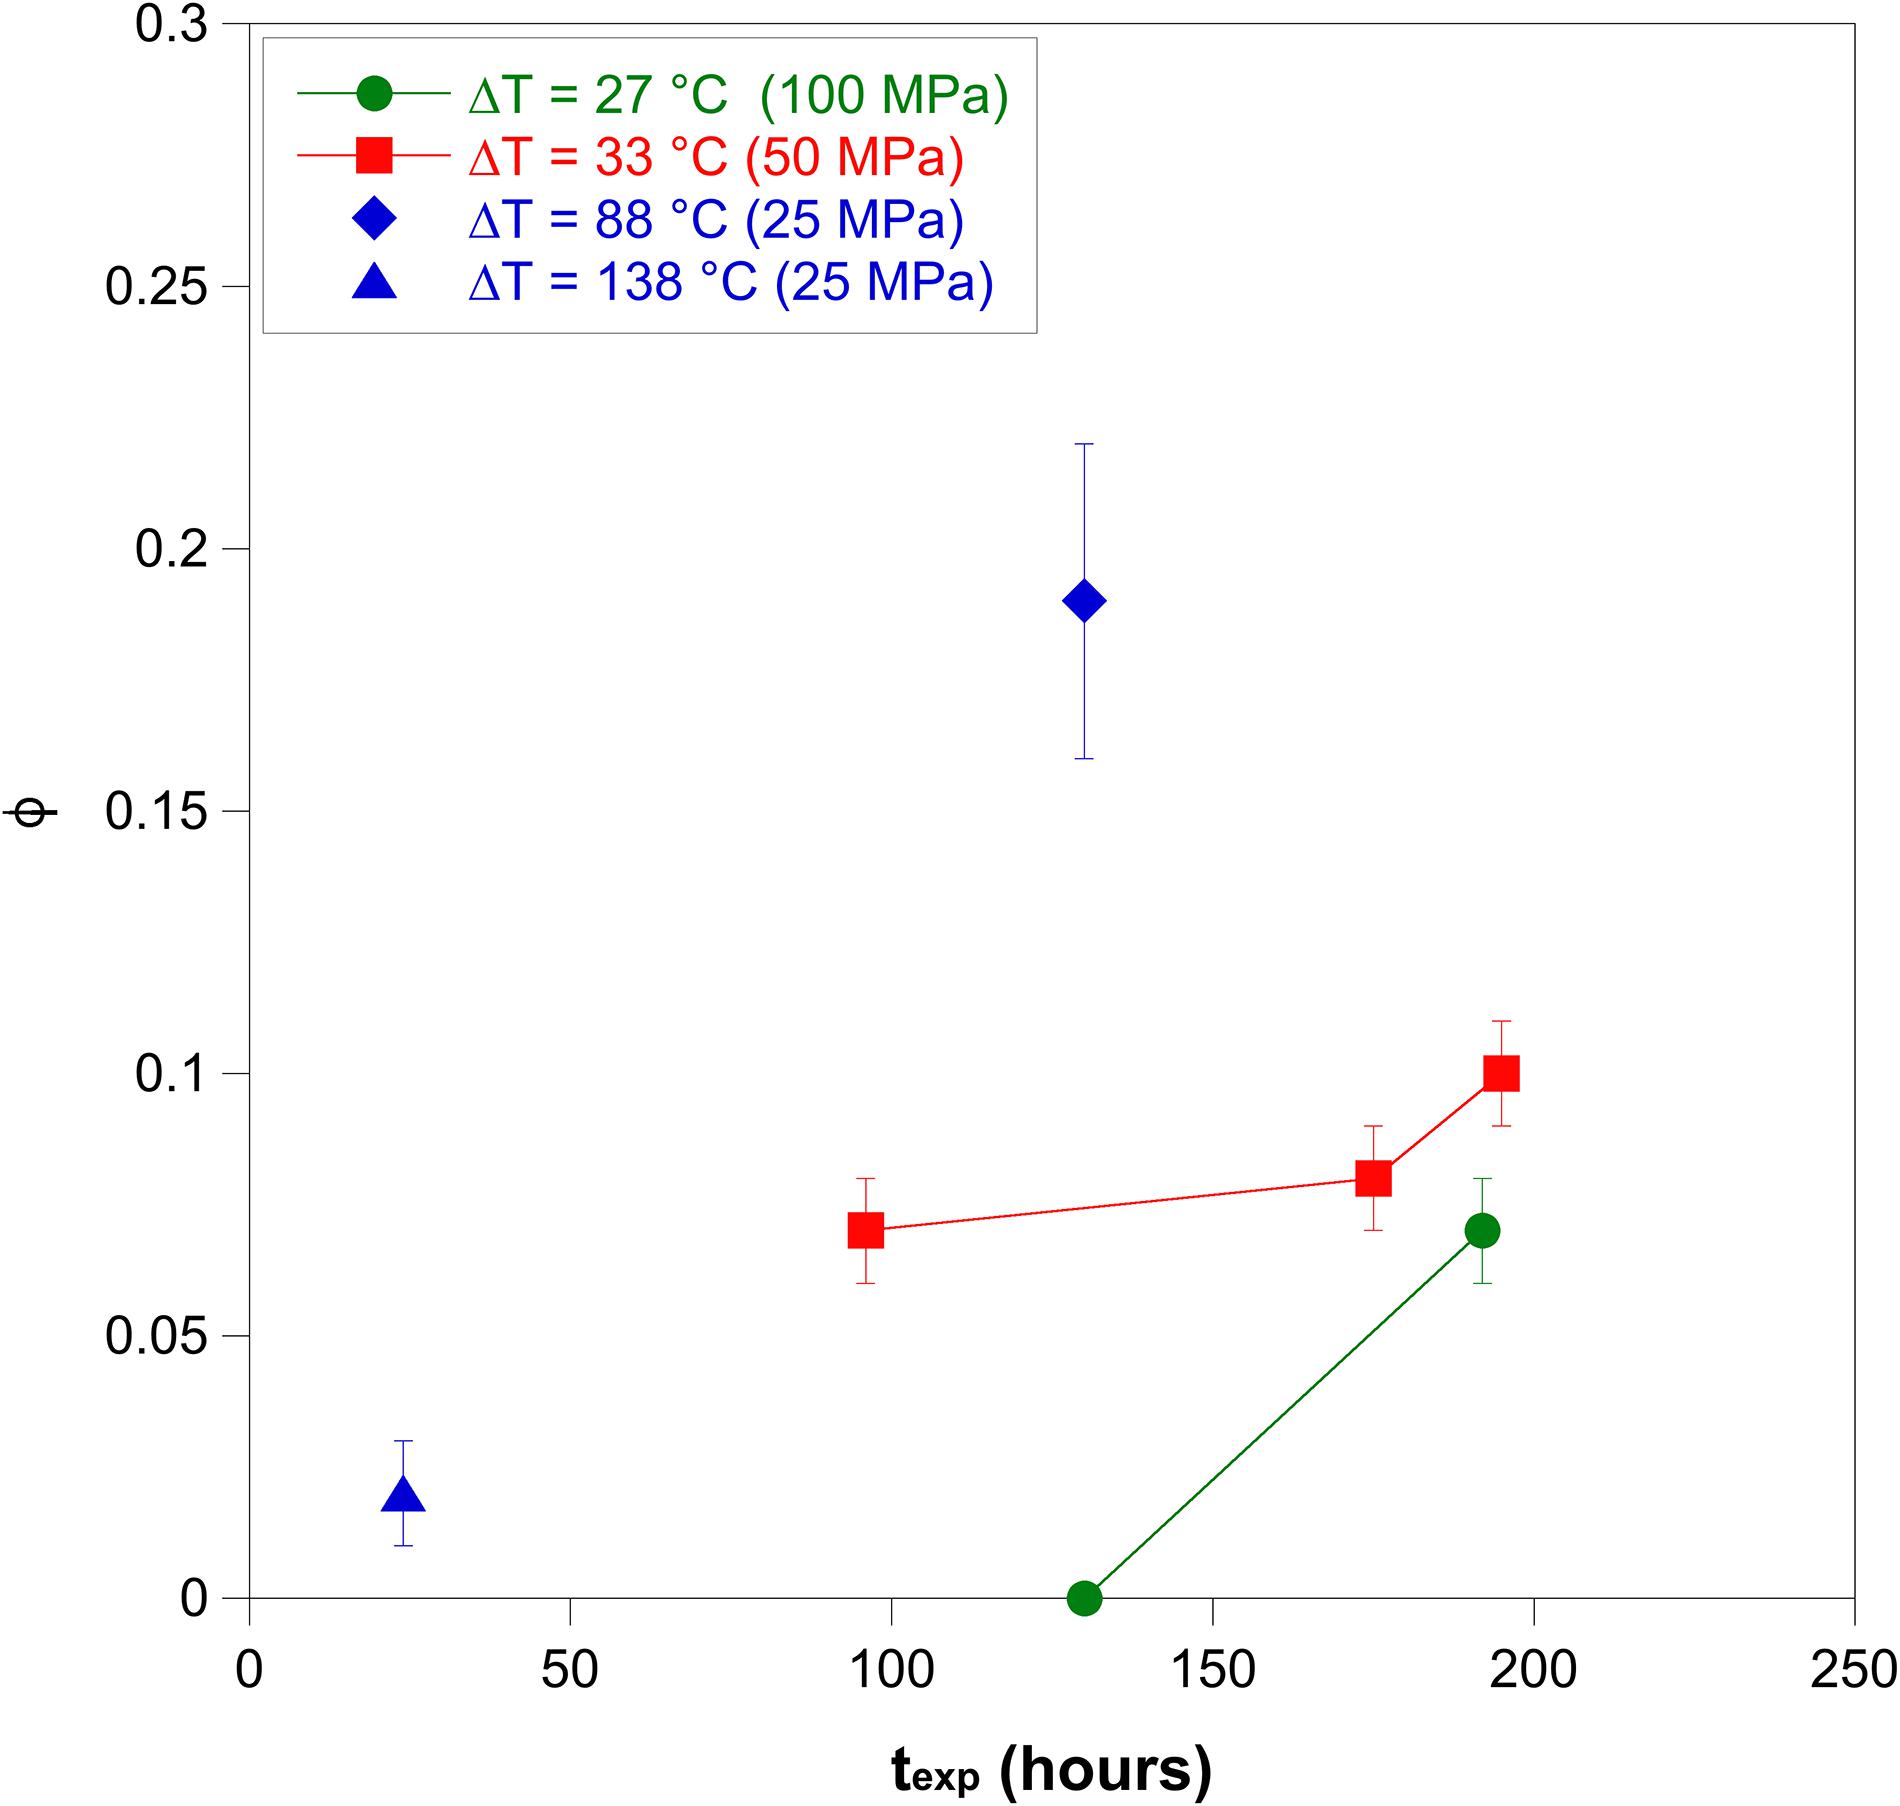
Figure 6. Crystal fraction of alkali feldspar (ϕ) as function of the experimental duration (texp).
Our results indicate that YL ranges between 9 × 10⁻⁹ and 3 × 10⁻⁸ cm s–1 (Supplementary Table 1). Considering the incremental growth recorded in the experiments at 50 MPa (between C155 and C148 and, between C148 and C149) and at 100 MPa (between C154 and C136), the incremental growth rate (YLi) ranges from 2 × 10⁻⁸ to 3 × 10⁻⁸ cm s–1 (Supplementary Table 1). This indicates that at durations between 100 and 200 h the alkali feldspar crystals are able to grow at constant rate, favoring the increase of crystal fraction (Figure 6). This implies that the equilibrium is not reached yet at these conditions.
Composition of Alkali Feldspar Crystals
The alkali feldspar crystals formed during the experiments both under water-saturated and -undersaturated conditions are characterized by orthoclase (Or) content between 31 and 67 mol% (Figure 7 and Supplementary Table 2). The Or content of alkali feldspar crystals formed at 670°C ranges from 47 to 67 mol%, instead, the alkali feldspar crystallized at temperatures ≥720°C is characterized by Or content between 31 and 37 mol%. Therefore, the alkali feldspar is more albitic at temperatures between 720 and 790°C, independently of the pressure and the amount of H2O dissolved in the melt.
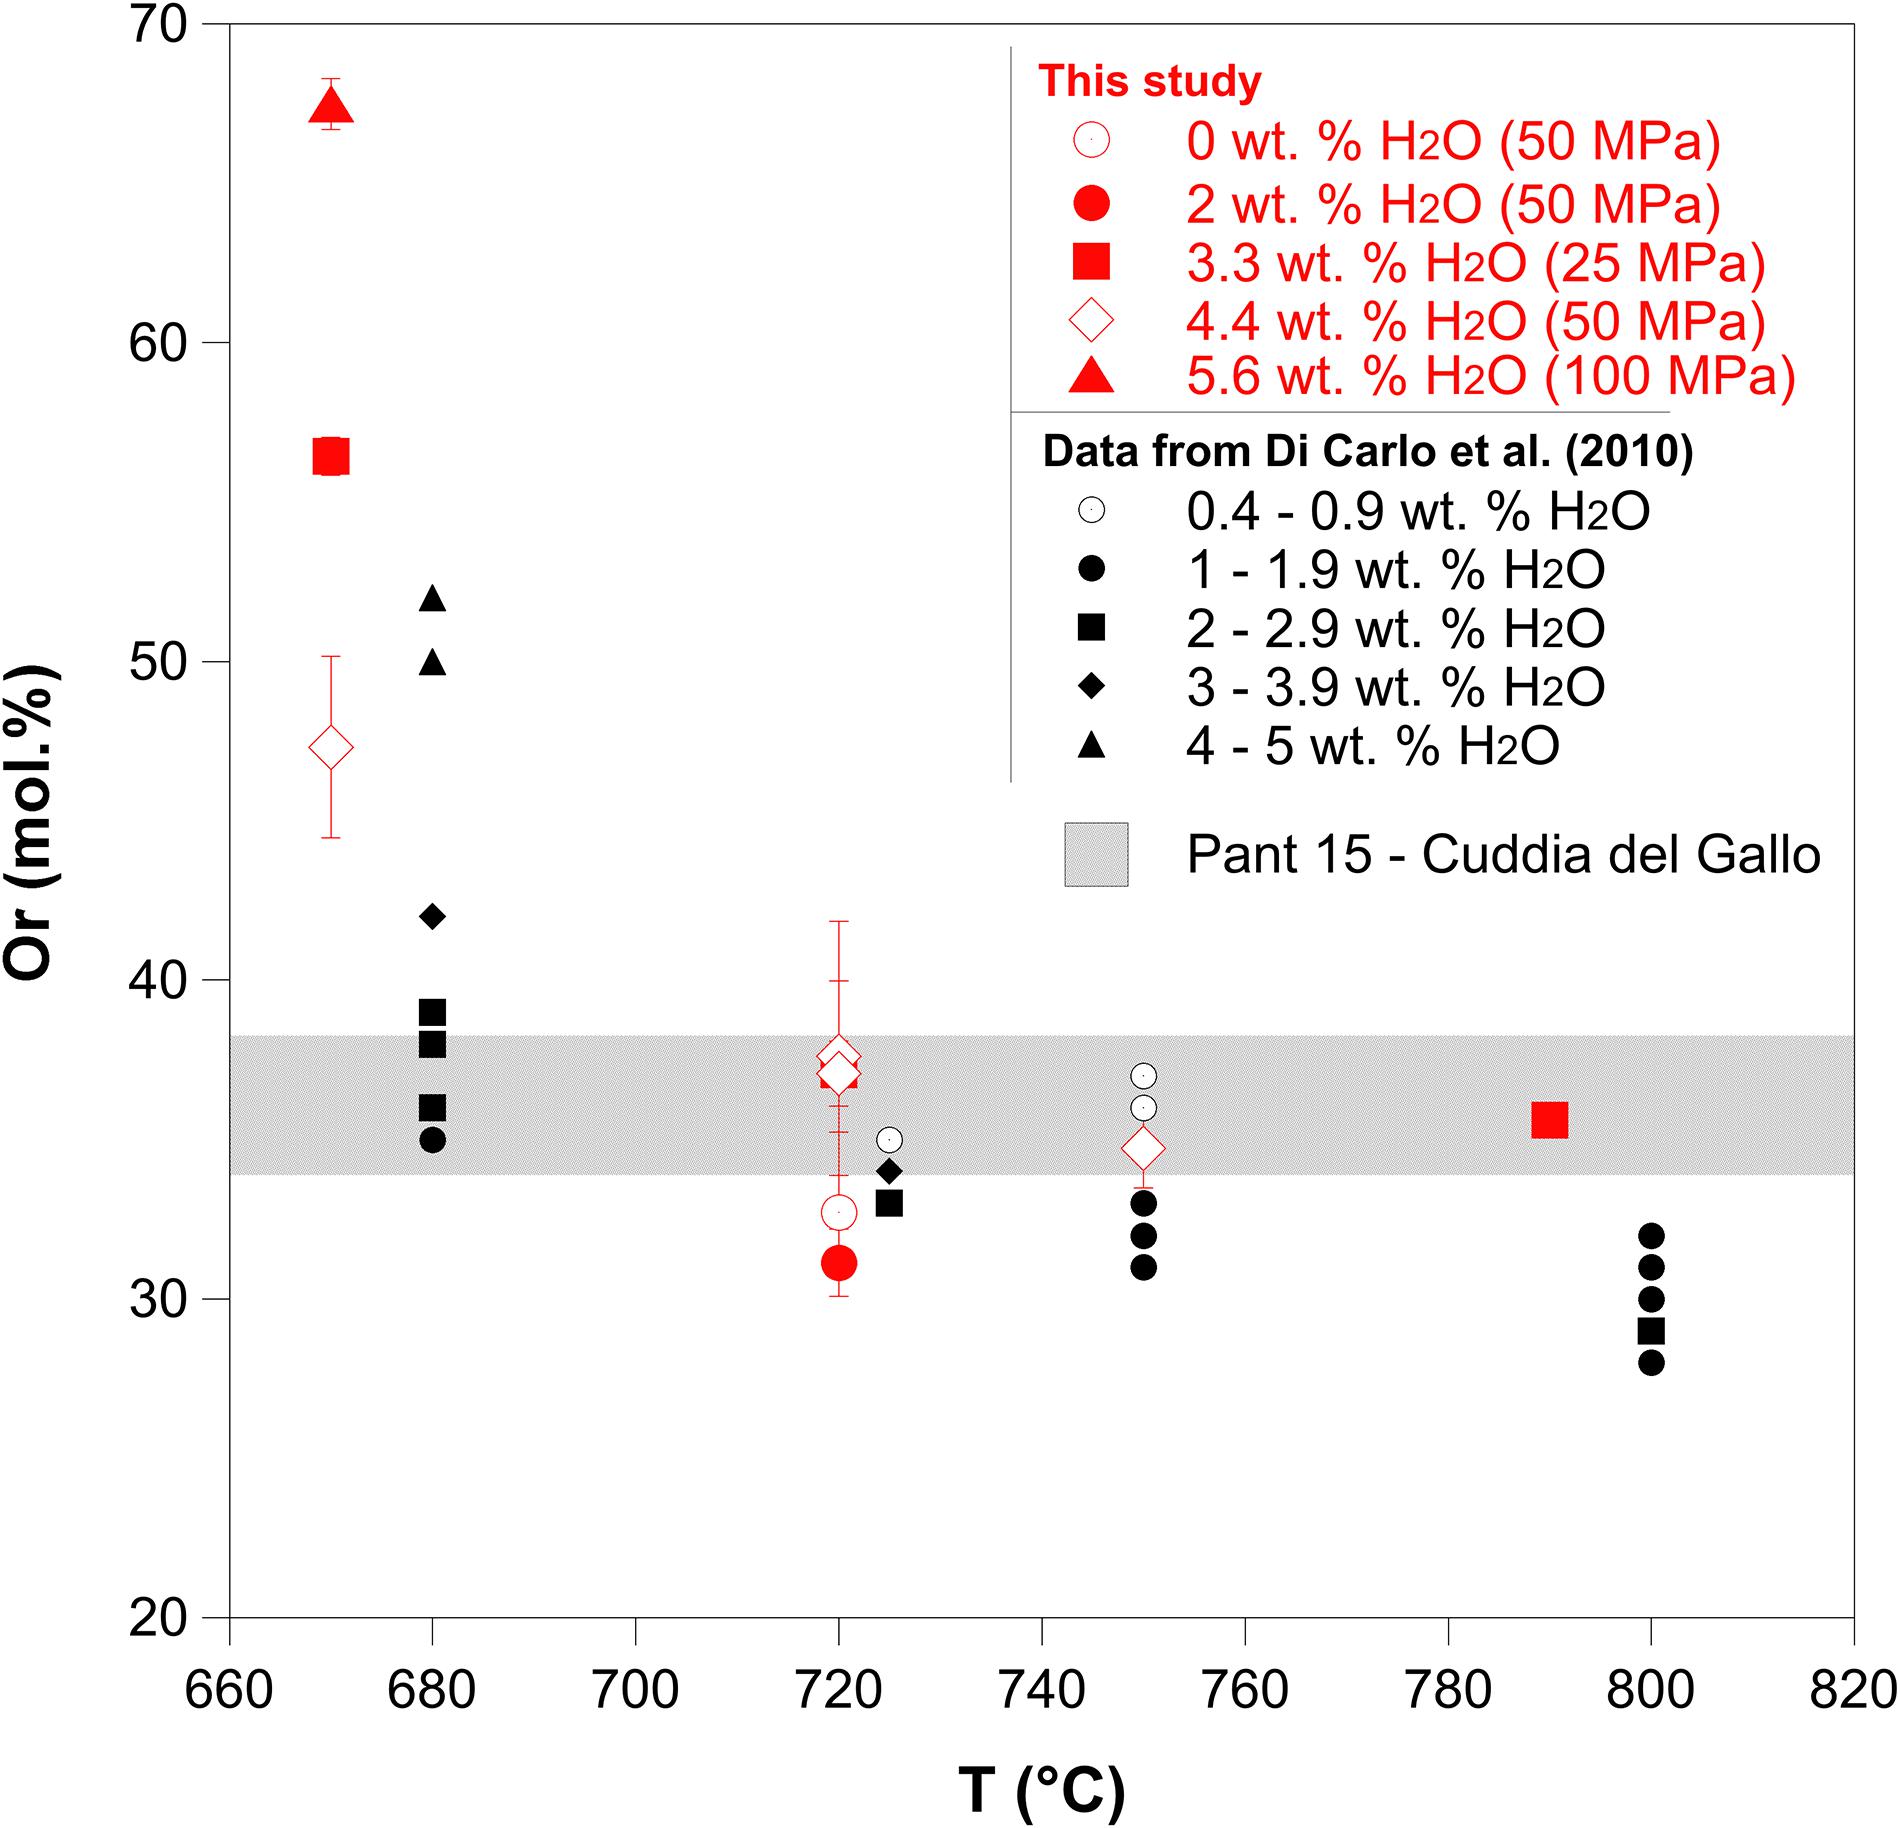
Figure 7. Orthoclase (Or) content of alkali feldspars as a function of the final temperature (Tf) and H2O content dissolved in the melt. Data obtained in this study through isobaric cooling experiments are indicated in red. Data obtained from Di Carlo et al. (2010) are indicated in black. The gray shaded band indicates the range of Or contents (34–38 mol%) in natural alkali feldspar crystals obtained from Cuddia del Gallo products (PANT15).
Regarding the alkali feldspar phenocrysts analyzed from the natural samples PANT15 of Cuddia de Gallo (Pantelleria, Italy), the Or content ranges from 34 to 38 mol% (Figure 7).
Discussion
Alkali Feldspar Nucleation Delay in Peralkaline Rhyolitic Melts
The degree of undercooling, which is controlled by pressure, temperature, and melt H2O content, plays a fundamental role in controlling the crystallization of magmas (e.g., Hammer and Rutherford, 2002; Couch et al., 2003; Arzilli and Carroll, 2013). However, ΔT is not the unique variable in controlling crystal nucleation and growth. In fact, crystallization is a process that moves from disequilibrium conditions and approaches equilibrium through time (thus ΔT will decrease with time as crystallization proceeds). Therefore, the time needed to reach equilibrium plays an important role in the textural and rheological evolution of a magma.
Crystal nucleation can only be favored when temperature and pressure conditions fall below the liquidus and a system is undercooled. Nucleation is promoted at large ΔT, as the activation energy for the formation of a crystalline nucleus decreases with increasing undercooling (Kirkpatrick, 1981, 1983). However, one aspect of this process that is still poorly understood and not quantified is the nucleation delay to a given undercooling that is imposed on the system. From a volcanological point of view, ΔT can change after a perturbation of the system. For example, the arrival of fresh magma can induce heating and decrease ΔT, instead, rapid decompression and degassing (magma ascent) can increase ΔT. The time needed for magma to crystallize in response to a perturbation of the system is important, as crystal incubation time plays a fundamental role in controlling crystallization (Iezzi et al., 2008, 2014), magma crystal fraction and its rheology at pre- and syn-eruptive conditions. Several recent studies suggest that the injection of hotter trachytic magmas into cooler peralkaline rhyolitic magmas may play a major role in triggering an eruption (Landi and Rotolo, 2015; Romano et al., 2018; Neave, 2020). This scenario implies that peralkaline rhyolitic magmas are heated at pre-eruptive conditions (Neave, 2020) with consequent decrease of ΔT. Our experimental results indicate that the decrease of ΔT (reaching conditions close to the liquidus of alkali feldspar) promotes a further delay of alkali feldspar nucleation (up to 5 days). For example, the stagnation of a hydrous peralkaline rhyolitic magma at 100 MPa and small ΔT for a few days (Figure 2A) prior to the onset of the eruption may happen without crystallization, which can result in a small amount of crystallization during magma ascent. Therefore, if a rapid triggering of the eruption occurs, caused by magma injection in a peralkaline rhyolitic magma, crystallization may be inhibited, affecting dramatically the magma rheology. Instead, the rapid magma ascent during highly explosive eruptions may also inhibit crystallization in felsic magmas as crystal nucleation needs more time to be activated (Mollard et al., 2012), whereas, for basaltic magma crystallization can be fast enough to change the magma rheology (Arzilli et al., 2019). Within this context, the competing influence of ΔT and time needed for nucleation should be systematically investigated in peralkaline rhyolitic magmas, in order to understand whether or not crystallization can be promoted over short timescales at large ΔT during rapid magma ascent. Overall, our results indicate that in a peralkaline rhyolite under water-saturated conditions the alkali feldspar nucleation delay decreases from days to hours with increasing ΔT (Figure 2A). Therefore, the undercooling could play an important role in controlling the extent of the alkali feldspar nucleation delay.
Our experimental results at 720°C, considering experiments at 25 and 50 MPa (Figure 2B), also indicate that the water content can play a role in controlling the nucleation delay. Figure 2B indicate that the transition between water-undersaturated and water-saturated conditions, with an increase of water content dissolved in the melt, can decrease dramatically the alkali feldspar nucleation delay. A reduced nucleation delay may be due to the effect of water in reducing the melt viscosity and increasing diffusion rates within silicate melts (e.g., Watson, 1994).
Crystallization Kinetics of Alkali Feldspar: Peralkaline Rhyolite vs Trachyte
Trachytic and peralkaline rhyolitic magmas are frequently the felsic endmembers of the bimodal mafic-felsic magmatism in continental rifts and oceanic island settings. For instance, the coexistence of these two magmas is observed in the Green Tuff ignimbrite, one of the most catastrophic highly explosive eruptions on the island of Pantelleria (Mahood and Hildreth, 1986; Campagnola et al., 2016). Both trachytic and peralkaline rhyolitic magmas tend to form alkali feldspar as the main crystal phase. Instead, in calc-alkaline magmas, alkali feldspar is less abundant or absent as plagioclase is the dominant feldspar phase. Although alkali feldspar is the most abundant phase in trachytic and peralkaline rhyolitic melts, the crystallization kinetics are different between these two melt compositions (Figure 8). For instance, textural analyses performed by Campagnola et al. (2016) on Green Tuff volcanic products reveal that alkali feldspar phenocryst content varies significantly from 0.05 in the peralkaline rhyolitic pumices (Member A) to 0.18 in trachytic pumices (Member H). Cooling and decompression experiments performed by Arzilli and Carroll (2013) and Arzilli et al. (2016b) on trachytic melts indicate that the nucleation delay of alkali feldspar is constantly shorter than 2 h when ΔT, pressure and H2O content are varied. The nucleation delay of alkali feldspar in peralkaline rhyolitic melts can range from several hours to several days (Figure 2). This implies that nucleation in trachytic melts responds more rapidly to changes in pressure and temperature at subliquidus conditions compared with peralkaline rhyolitic melts. The experimental data reported in Figure 8 indicate that alkali feldspar crystal fractions obtained by cooling and decompression experiments in trachytic melts (Arzilli and Carroll, 2013; Arzilli et al., 2016b) increase as ΔT and the experimental duration increases. Particularly, considering experimental durations between 2 and 16 h and ΔTs between 10 and 140°C, trachytic melts can produce an alkali feldspar crystal fraction that ranges between 0.15 and 0.95. In a similar range of ΔT, but with experimental durations between 24 and 288 h, peralkaline rhyolitic melts are able to produce an alkali feldspar crystal fraction between 0.02 and 0.20 (Figure 8). This indicates that despite the fact that peralkaline rhyolitic melts spend more time (days) than trachytic melts (hours) in subliquidus conditions at similar ΔTs, the former are not able to produce a dramatic change in crystal fraction. The implications of this result are important from a rheological perspective at pre- and syn-eruptive conditions.
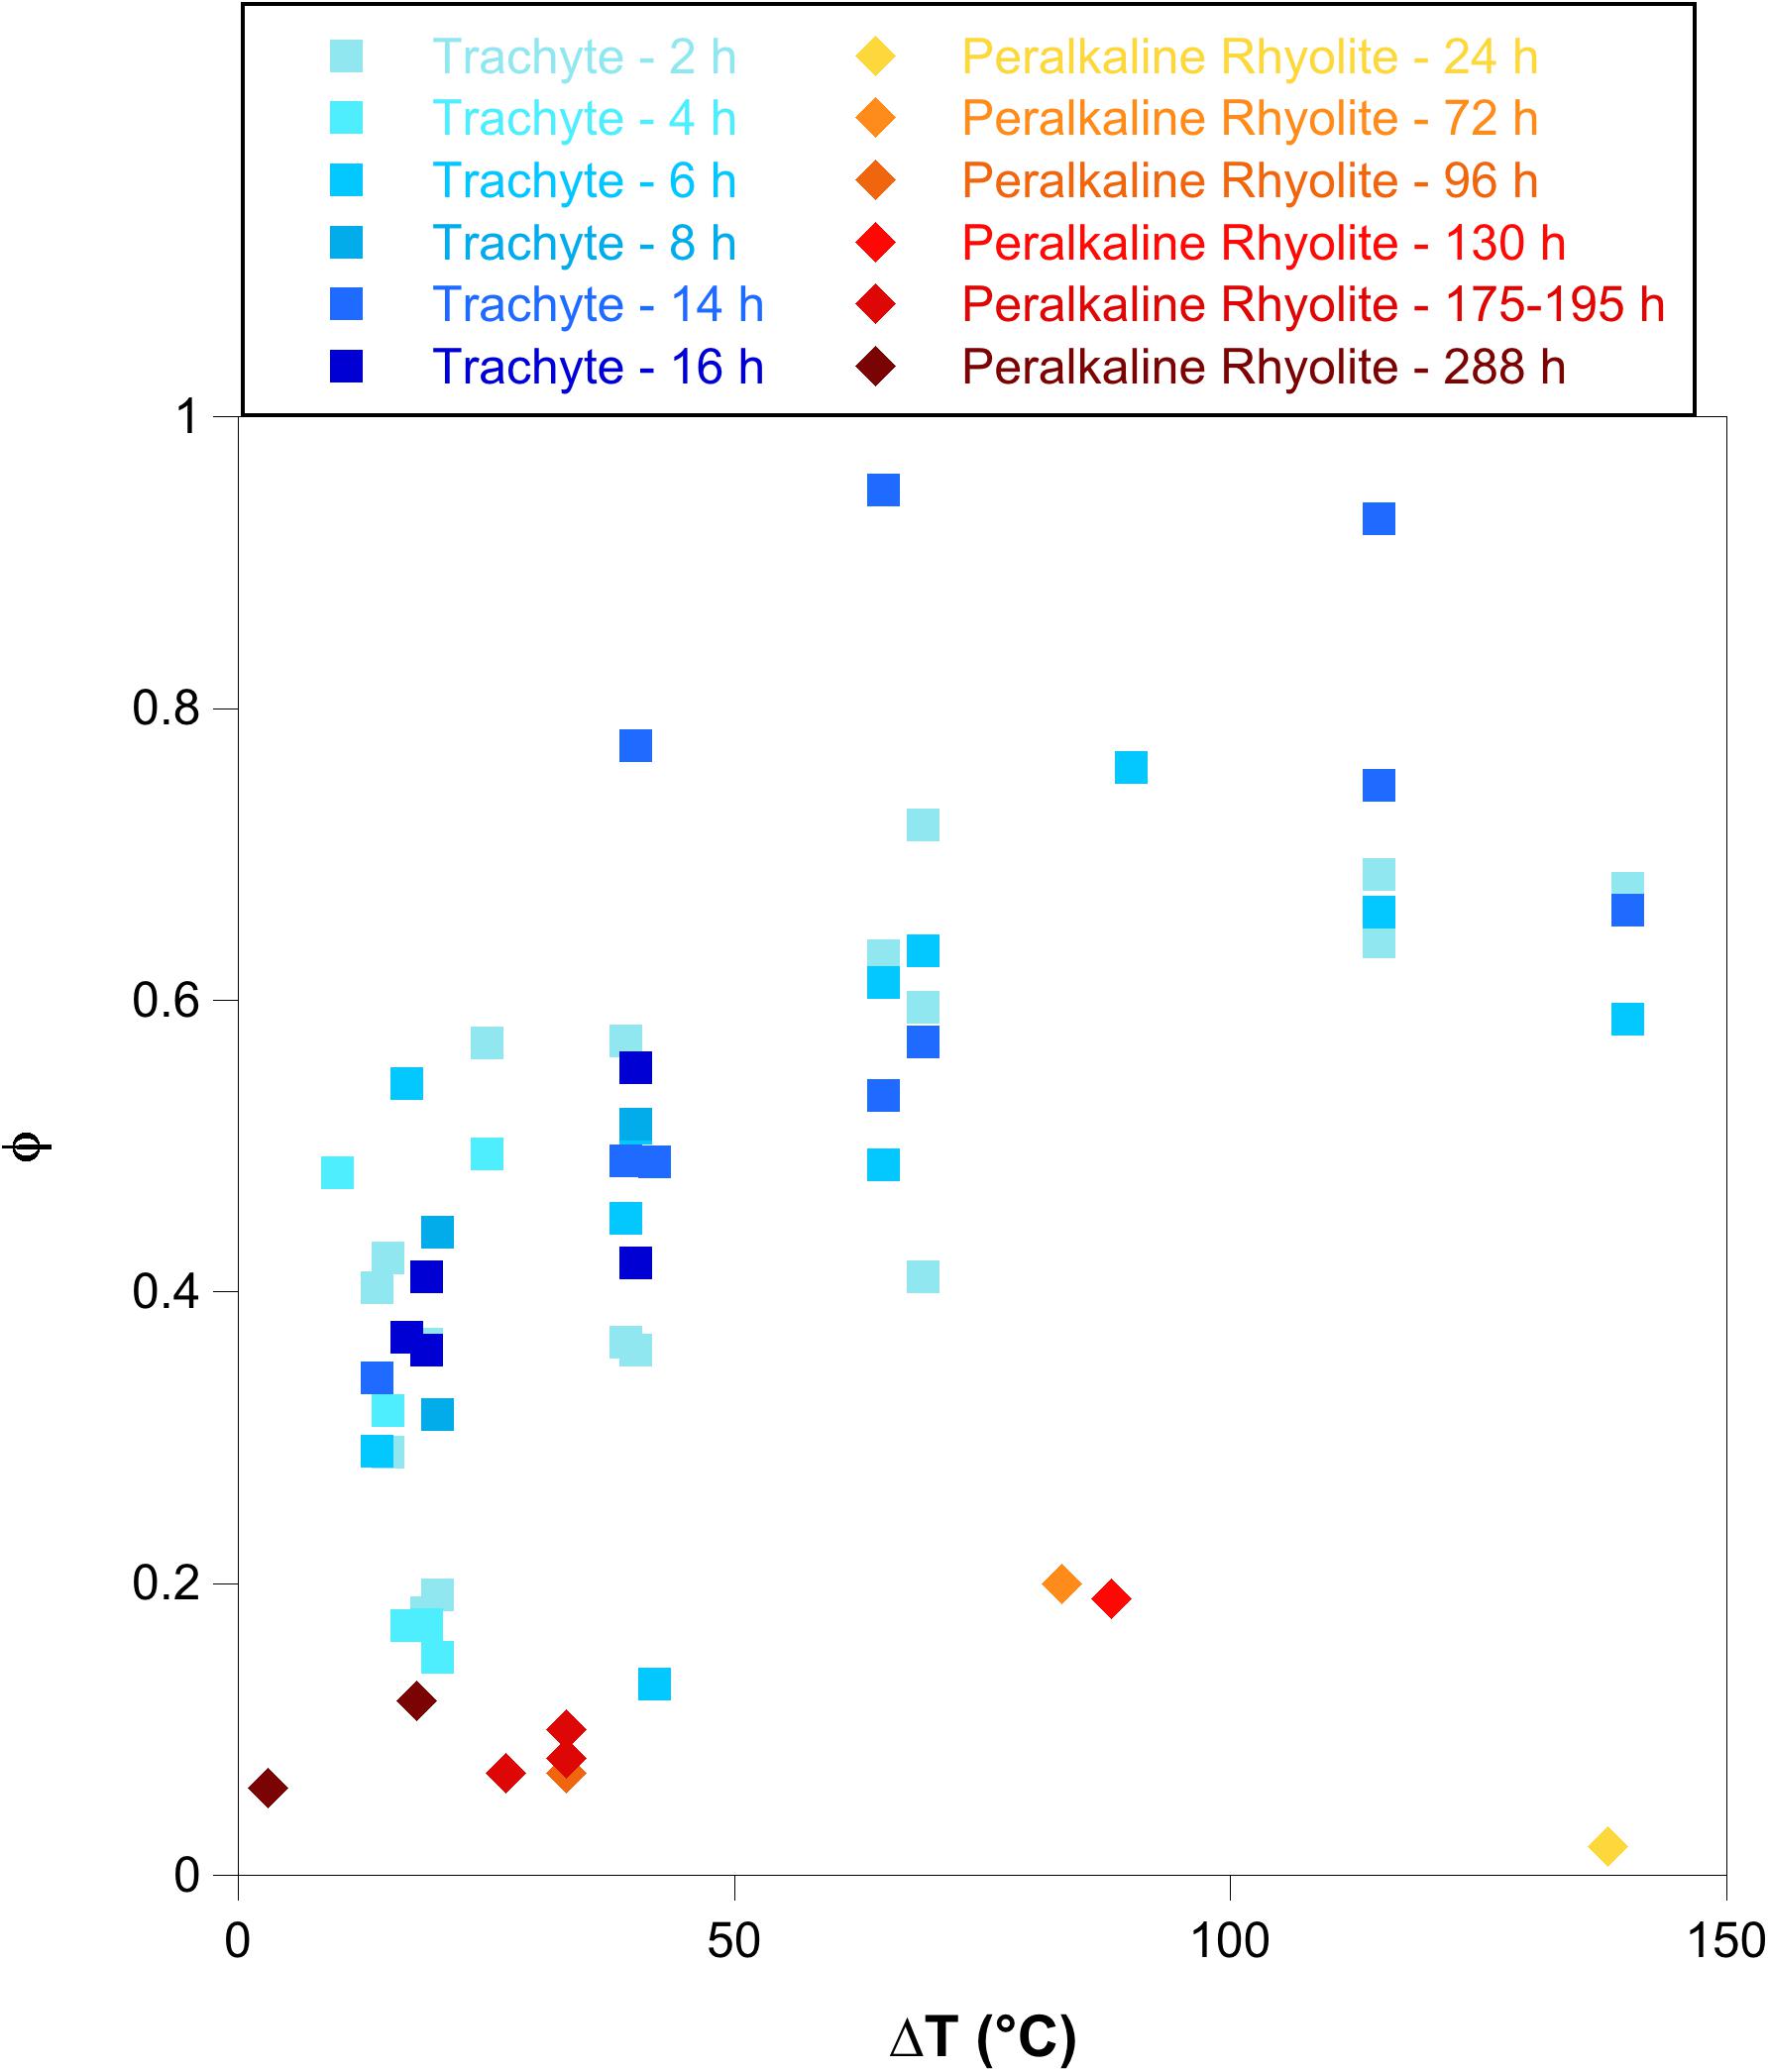
Figure 8. Crystal fraction of alkali feldspar (ϕ) as function of ΔT. The diagram displays a comparison between alkali feldspar crystal fraction obtained in this study (Peralkaline rhyolite in redish squares) and ϕ obtained by cooling and decompression experiments in trachytic melts (bluish squares) (Arzilli and Carroll, 2013; Arzilli et al., 2016b).
Implications for Pantelleria Volcanic System
The results obtained from the isobaric cooling experiments performed in this study can be used to investigate the possible pre-eruptive conditions of the Pantelleria volcanic system, simulating the stagnation of a peralkaline rhyolitic magma at 100, 50, and 25 MPa. Previous studies established that the shallow magma reservoir of the Pantelleria volcanic system should be located at ∼4 km depth (∼100 MPa) (Civetta et al., 1998; Mattia et al., 2007; Civile et al., 2008; Di Carlo et al., 2010; Gioncada and Landi, 2010). Therefore, the experiments at 100 MPa may represent the shallow magma reservoir conditions, whereas, 50 and 25 MPa may represent conduit conditions.
Pre-eruptive temperatures of Pantelleria eruptions are still debated (White et al., 2009; Di Carlo et al., 2010; Lanzo et al., 2013; Landi and Rotolo, 2015; Campagnola et al., 2016), yet recent geochemical and petrological investigation estimated a temperature range of 680–800°C (White et al., 2009; Di Carlo et al., 2010; Lanzo et al., 2013). Numerical simulations with a conduit model performed by Campagnola et al. (2016), which investigated the conduit dynamics of the highly explosive Green Tuff eruption, suggest that peralkaline rhyolitic magmas could shift between explosive and effusive eruptions, mainly as a function of the pre-eruptive temperature. Our experimental results indicate that the Or content of alkali feldspar decrease as the temperature increases (Figure 7), in agreement with Di Carlo et al. (2010). We note that the results obtained from Di Carlo et al. (2010) at more reduced conditions (NNO-1 to NNO-2) show the same relation between Or content and temperature that we obtained in our crystallization experiments at NNO +0.8. This suggests that the Or content may not be influenced by fO2 (and consequent effects on melt FeO content), but mainly by the temperature. Accordingly, the alkali feldspar is more albitic at temperatures between 720 and 790°C, with Or content of 31–37 mol%. Figure 7 also indicates that the Or content of alkali feldspar crystals formed at temperature of 720–790°C in hydrous peralkaline rhyolitic melts is similar to that of alkali feldspar formed from the Cuddia del Gallo magma. The alkali feldspar crystals analyzed in the Green tuff products (Lanzo et al., 2013) and in the Randazzo pumices (Gioncada and Landi, 2010) have also similar range of Or content (31–38 mol%) to that of Cuddia del Gallo. Instead, alkali feldspar crystals formed at 670°C are characterized by high Or content (up to 67 mol%), which is too high to meet the chemical composition of the natural alkali feldspar of Cuddia del Gallo. This inverse relationship between Or content and temperature (Figure 7) has been observed and discussed in other compositionally similar systems (e.g., Scaillet and Macdonald, 2003; Di Carlo et al., 2010; Romano et al., 2018) and it is related to the temperature, An content, and the H2O content dissolved in the melt. The experiments performed in this study indicate mainly the effect of temperature on the Or content in alkali feldspar, whereas, the effect of H2O is less obvious. Our experimental results based on the relationship between T and Or content support the pre-eruptive temperatures estimated from Di Carlo et al. (2010) regarding the Fastuca eruption (a sub-Plinian eruption, according to Orsi et al., 1989), which range between 720 and 740°C for pre-eruptive pressure of about ∼100–120 MPa (4–5 km depth). Numerical modeling performed by Campagnola et al. (2016) also indicates that pre-eruptive temperature of the peralkaline rhyolitic explosive eruptions should be ∼750°C. This suggests that the pre-eruptive temperatures of the Pantelleria volcanic system, which might promote explosive eruptive styles, lies in range between 720 and 750°C (considering water-saturated conditions).
As observed in many products erupted explosively at the Pantelleria Island, the alkali feldspar crystal content is ubiquitously low (Campagnola et al., 2016; Hughes et al., 2017; Clarke et al., 2019). This evidence may be explained invoking the alkali feldspar nucleation delay that can slow down crystallization in natural peralkaline rhyolitic magmas (Figure 2). In fact, low crystal fractions are also observed in our experiments, which suggest that a peralkaline rhyolitic magma within the Pantelleria plumbing system may be stored at pre-eruptive conditions (50–100 MPa) for a few hours/days and then suddenly erupted. This relative short time at sub-liquidus conditions might coincide with the transient incubation stage of nucleation, which may inhibit or form only a small amount of alkali feldspar crystals (for example in Green Tuff volcanic products, phenocryst content is 0.05, whilst, microlites are absent). Although, peralkaline rhyolitic magmas are characterized by low crystal cargo (∼0.10 in total where alkali feldspar and clinopyroxene phenocrysts are the dominant fraction), they are able to reach magma fragmentation, erupting explosively (Gioncada and Landi, 2010; Campagnola et al., 2016; Di Genova et al., 2017; Hughes et al., 2017). Therefore, crystallization may not have a major role in controlling the shift between explosive and effusive eruption style of peralkaline rhyolitic volcanic systems, such as the case of Pantelleria Island.
A limitation of the interpretation of the data for the Pantelleria volcanic system may be related to the fO2 conditions investigated. The oxygen fugacity considered in this study may not be representative of the Pantelleria magmatic system, as previous fO2 estimates made by White et al. (2005, 2009) and Di Carlo et al. (2010) indicate relatively reducing conditions for Pantelleria peralkaline rhyolites (NNO-1 to NNO-2). Oxygen fugacity may affect the liquidus geometry of the phases present in peralkaline rhyolitic melts, as we noted for titanomagnetite in this study. However, the liquidus temperatures of alkali feldspar obtained in this work at 100 and 50 MPa (Figure 1) are similar to those obtained from Di Carlo et al. (2010) at the same pressures near to the water saturation. This similarity implies that the geometry of the alkali feldspar liquidus in peralkaline rhyolites may not be strongly sensitive to fO2. In support of such an assertion are the phase equilibria obtained on less peralkaline (comendite) rhyolites by Scaillet and Macdonald (2001). These authors have established the phase relationships of three peralkaline rhyolites from the Kenya rift under two contrasted fO2, either reduced (NNO −1.6) or oxidized (NNO +3.5). The results show clearly that a change of fO2 by five orders of magnitude does not affect the liquidus curves of tectosilicates. However, more work is needed to rigorously address the role of oxygen fugacity on peralkaline rhyolite crystallization.
Conclusion
This study shows the role of ΔT and water in controlling the alkali feldspar nucleation delay in peralkaline rhyolitic melts. Our results indicate that the nucleation delay can reach up to a few days under small ΔT, whereas, it decreases from days to hours with increasing ΔT and H2O content dissolved in the melt. Small ΔT can drastically reduce the crystallization in natural peralkaline rhyolitic magmas, and it explains the low crystal content observed in the present experimental study and in previous works (e.g., Campagnola et al., 2016; Hughes et al., 2017; Clarke et al., 2019). We infer that a peralkaline rhyolitic magma can be stored at the pre-eruptive conditions at constant temperature and pressure for a few days without dramatic variations of its crystal fraction before the triggering of the eruption.
Our experimental results indicate, with respect to the Or content of the alkali feldspar crystals, a pre-eruptive temperature range between 720 and 750°C within the Pantelleria plumbing system and a pre-eruptive pressure near 100 MPa, at near H2O-saturation, which corresponds to a shallow magma reservoir (in agreement with previous studies, e.g., Civetta et al., 1998; Di Carlo et al., 2010; Gioncada and Landi, 2010; Campagnola et al., 2016). These pre-eruptive conditions may promote explosive eruptive activity in the Pantelleria volcanic system. In fact, despite the low crystal content, peralkaline rhyolitic magmas in the Pantelleria volcanic system provide clear evidence of their ability to reach fragmentation and shift from effusive lava flow to explosive activity (Barclay et al., 1996; Campagnola et al., 2016; Di Genova et al., 2017; Hughes et al., 2017), and from Strombolian to Plinian style. The overall results provide new constraints on disequilibrium crystallization timescales in peralkaline rhyolitic magmas and improve our understanding of the rheological behavior at pre- and syn-eruptive conditions of peralkaline volcanic systems.
Data Availability Statement
All datasets generated for this study are included in the article/Supplementary Material.
Author Contributions
MC, FA, PL, PS, and EP conceived the research project on peralkaline rhyolitic melts. FA, PS, BS, and MC participated in the experimental work. AF, PS, FA, and PL performed SEM and electron microprobe analyses. FA and PS performed the image analysis of the samples. All authors contributed to discussion and interpretation of the data and were actively involved in preparation of the manuscript.
Funding
This work was supported by PRIN 2009 (2009PZ47NA_002), FAR2012, PRIN 2017 (2017J277S9 – all MC) and the EU LIFE project (LIFE14 ENV/IT/000801 ECO TILES – EP). Support from the Czech Science Foundation is acknowledged (GACR – project 18-01982S – AF).
Conflict of Interest
The authors declare that the research was conducted in the absence of any commercial or financial relationships that could be construed as a potential conflict of interest.
Acknowledgments
Raul Carampin (CNR-IGG, Padova) provided valuable assistance during electron microprobe analysis.
Supplementary Material
The Supplementary Material for this article can be found online at: https://www.frontiersin.org/articles/10.3389/feart.2020.00177/full#supplementary-material
FIGURE 1 | H2O solubility in peralkaline rhyolitic melt as a function of pressure, calculated following Papale et al. (2006). The maximum amount of H2O estimated by model of Papale et al. (2006) as a function of pressure is considered the H2O content dissolved in the melt to reach the water-saturated conditions in this study.
TABLE 1 | Experimental results for alkali feldspar crystallization kinetics in peralkalinerhyolitic melts.
TABLE 2 | Chemical compositions of alkali feldspar.
References
Abramoff, M. D., Magalhaes, P. J., and Ram, S. J. (2004). Image processing with ImageJ. Biophotonics Int. 11, 36–42.
Arzilli, F., and Carroll, M. R. (2013). Crystallisation kinetics of alkali feldspars in cooling and decompression-induced crystallisation experiments in trachytic melt. Contrib. Mineral. Petrol. 166, 1011–1027. doi: 10.1007/s00410-013-0906-1
Arzilli, F., La Spina, G., Burton, M. R., Polacci, M., Le Gall, N., Hartley, M. E., et al. (2019). Magma fragmentation in highly explosive basaltic eruptions induced by rapid crystallization. Nat. Geosci. 12, 1023–1028. doi: 10.1038/s41561-019-0468-6
Arzilli, F., Piochi, M., Mormone, A., Agostini, C., and Carroll, M. R. (2016b). Constraining pre-eruptive magma conditions and unrest timescales during the Monte Nuovo eruption (1538 AD; Campi Flegrei, Southern Italy): integrating textural and CSD results from experimental and natural trachy-phonolites. Bull. Volcanol. 78:72.
Arzilli, F., Polacci, M., Landi, P., Giordano, D., Baker, D. R., and Mancini, L. (2016a). A novel protocol for resolving feldspar crystals in synchrotron X-ray microtomographic images of crystallized natural magmas and synthetic analogs. Am. Mineral. 101, 2301–2311. doi: 10.2138/am-2016-5788
Ayalew, D., Barbey, P., Marty, B., Reisberg, L., Yirgu, G., and Pik, R. (2002). Source, genesis, and timing of giant ignimbrite deposits associated with Ethiopian continental flood basalts. Geochim. Cosmochim. Acta 66, 1429–1448. doi: 10.1016/s0016-7037(01)00834-1
Bailey, D. K., and Macdonald, R. (1987). “Dry peralkaline felsic liquids and carbon dioxide flux through the Kenya rift zone,” in Magmatic Processes: Physicochemical Principles, Vol. 1, ed. B. Mysen (University Park, PA: Geochemical Society), 91–105.
Barclay, J., Carroll, M. R., Houghton, B. F., and Wilson, C. J. N. (1996). Preeruptive volatile content and degassing history of an evolving peralkaline volcano. J. Volcanol. Geotherm. Res. 74, 75–87. doi: 10.1016/s0377-0273(96)00058-3
Bellieni, G., Comin-Chiaramonti, P., Marques, L. S., Melfi, A. J., Nardy, A. J. R., Papatrechas, C., et al. (1986). Petrogenetic Aspects of Acid and Basaltic Lavas from the Parana Plateau (Brazil): geological, mineralogical and petrochemical relationships. J. Petrol. 27, 915–944. doi: 10.1093/petrology/27.4.915
Bhushan, S. K., Rao, K. N., and Vidyadharan, K. T. (2010). Petrography and geochemistry of St. Mary islands, near Malpe, Dakshina Kannada district, Karnataka. J. Geol. Soc. India 76, 155–163. doi: 10.1007/s12594-010-0088-7
Brugger, C. R., and Hammer, J. E. (2010). Crystallisation kinetics in continuous decompression experiments: implications for interpreting natural magma ascent processes. J. Petrol. 51, 1941–1965. doi: 10.1093/petrology/egq044
Bryan, S. E., Riley, T. R., Jerram, D. A., Stephens, C. J., and Leat, P. L. (2002). “Silicic volcanism: an under- valued component of large igneous provinces and vol- canic rifted margins,” in Volcanic Rifted Margins, Vol. 362, eds M. A. Menzies, S. L. Klemperer, C. J. Ebinger, and J. Baker (Boulder, CO: Geological Society of America), 97–118.
Calzolaio, M., Arzilli, F., and Carroll, M. R. (2010). Growth rate of alkali feldspars in decompression-induced crystallisation experiments in a trachytic melt of the Phlegraean Fields (Napoli, Italy). Eur. J. Mineral. 22, 485–493. doi: 10.1127/0935-1221/2010/0022-2012
Campagnola, S., Romano, C., Mastin, L., and Vona, A. (2016). Confort 15 model of con- duit dynamics: applications to Pantelleria Green Tuff and Etna 122 BC eruptions. Contrib. Mineral. Petrol. 171, 1–25.
Carroll, M. R., and Blank, J. G. (1997). The solubility of water in phonolitic melts. Am. Mineral. 82, 167–174.
Civetta, L., D’Antonio, M., Orsi, G., and Tilton, G. R. (1998). The geochemistry of volcanic rocks from Pantelleria island, Sicily channel: petrogenesis and characteristics of the mantle source region. J. Petrol. 39, 1453–1491. doi: 10.1093/petroj/39.8.1453
Civile, D., Lodolo, E., Torterici, L., Lanzafame, G., and Brancolini, G. (2008). Relationships between magmatism and tectonics in a continental rift: the Pantelleria Island region (Sicily Channel, Italy). Mar. Geol. 251, 32–46. doi: 10.1016/j.margeo.2008.01.009
Clarke, B., Calder, E. S., Dessalegn, F., Fontijn, K., Cortés, J. A., Naylor, M., et al. (2019). Fluidal pyroclasts reveal the intensity of peralkaline rhyolite pumice cone eruptions. Nat. Commun. 10, 1–10. doi: 10.1038/s41467-019-09947-8
Couch, S. (2003). Experimental investigation of crystallisation kinetics in a haplogranite system. Am. Mineral. 88, 1471–1485. doi: 10.2138/am-2003-1011
Couch, S., Sparks, R. S. J., and Carroll, M. R. (2003). The kinetics of degassing-induced crystallisation at Soufrire Hills volcano, Montserrat. J. Petrol. 44, 1477–1502. doi: 10.1093/petrology/44.8.1477
Di Carlo, I., Rotolo, S. G., Scaillet, B., Buccheri, V., and Pichavant, M. (2010). Phase equilibrium constraints on pre-eruptive conditions of recent felsic explosive volcanism at Pantelleria Island, Italy. J. Petrol. 5, 2245–2276. doi: 10.1093/petrology/egq055
Di Genova, D., Romano, C., Hess, K.-U., Vona, A., Poe, B. T., Giordano, D., et al. (2013). The rheology of peralkaline rhyolites from Pantelleria Island. J. Volcanol. Geotherm. Res. 249, 201–216. doi: 10.1016/j.jvolgeores.2012.10.017
Di Genova, D., Sicola, S., Romano, C., Vona, A., Fanara, S., and Spina, L. (2017). Effect of iron and nanolites on Raman spectra of volcanic glasses: reassessment of existing strategies to estimate the water content. Chem. Geol. 475, 76–86. doi: 10.1016/j.chemgeo.2017.10.035
Di Matteo, V., Carroll, M. R., Behrens, H., Vetere, F., and Brooker, R. (2004). Water solubility in trachytic melts. Chem. Geol. 213, 187–196. doi: 10.1016/j.chemgeo.2004.08.042
Dingwell, D. B., Hess, K.-U., and Romano, C. (1998). Extremely fluid behavior of hydrous peralkaline rhyolites. Earth Planet. Sci. Lett. 158, 31–38. doi: 10.1016/s0012-821x(98)00046-6
Dobson, P. F., Epstein, E., and Stolper, E. (1989). Hydrogen isotope fractionation between coexisting vapour and silicate glasses and melts at low pressure. Geochim. Cosmochim. Acta 53, 2723–2370.
Duffield, W. A. (1990). Eruptive fountains of silicic magma and their possible effects on tin content of fountain-fed lavas. Geol. Soc. Am. Spec. Pap. 246, 251–261.
Ewart, A., Marsh, J. S., Milner, S. C., Duncan, A. R., Kamber, B. S., and Armstrong, R. A. (2004). Petrology and geochemistry of early Cretaceous bimodal continental flood volcanism of the NW Etendeka, Namibia. Part 1: introduction, mafic Lavas and re-evaluation of mantle source components. J. Petrol. 45, 59–105. doi: 10.1093/petrology/egg083
Ewart, A., Milner, S. C., Armstrong, R. A., and Duncan, A. R. (1998). Etendeka Volcanism of the Goboboseb Mountains and Messum Igneous Complex, Namibia. Part II: voluminous quartz latite volcanism of the Awahab magma system. J. Petrol. 39, 227–253. doi: 10.1093/petroj/39.2.227
Fabbrizio, A., and Carroll, M. R. (2008). Experimental constraints on the differentiation process and pre-eruptive conditions in the magmatic system of Phlegrean Fields (Naples, Italy). J. Volcanol. Geoth. Res. 171, 88–102. doi: 10.1016/j.jvolgeores.2007.11.002
Fabbrizio, A., Rouse, P. J., and Carroll, M. R. (2006). New experimental data on biotite+magnetite+sanidine saturated phonolitic melts and application to the estimation of magmatic water fugacity. Am. Mineral. 91, 1863–1870. doi: 10.2138/am.2006.2055
Fenn, P. M. (1977). The nucleation and growth of alkali feldspars from hydrous melts. Canadian Mineral. 15, 135–161.
Gioncada, A., and Landi, P. (2010). The pre-eruptive volatile contents of recent basaltic and pantelleritic magmas at Pantelleria (Italy). J. Volcanol. Geoth. Res. 189, 191–201. doi: 10.1016/j.jvolgeores.2009.11.006
Gottsmann, J., and Dingwell, D. B. (2002). The thermal history of a spatter-fed lava flow: the 8-ka pantellerite flow on Mayor Island, New Zealand. Bull. Volcanol. 64, 410–422. doi: 10.1007/s00445-002-0220-7
Hammer, J. E. (2004). Crystal nucleation in hydrous rhyolite: Experimental data applied to classical theory. Am. Mineral. 89, 1673–1679. doi: 10.2138/am-2004-11-1212
Hammer, J. E. (2006). Influence of fO2 and cooling rate on the kinetics and energetics of Fe-rich basalt crystallization. Earth Planet. Sci. Lett. 248, 618–637. doi: 10.1016/j.epsl.2006.04.022
Hammer, J. E., and Rutherford, M. J. (2002). An experimental study of the kinetics of decompression-induced crystallisation in silicic melt. J. Geophys. Res. 107:2021.
Hammer, J. E., Cashman, K. V., Hoblitt, R. P., and Newman, S. (1999). Degassing and microlite crystallisation during pre-climactic events of the 1991 eruption of Mt. Pinatubo, Philippines. Bull. Volcanol. 60, 355–380. doi: 10.1007/s004450050238
Harris, C., and Erlank, A. J. (1992). The production of large-volume, low-δ18O rhyolites during the rifting of Africa and Antarctica: the Lebombo Monocline, southern Africa. Geochim. Cosmochim. Acta 56, 3561–3570. doi: 10.1016/0016-7037(92)90399-4
Heumann, A., and Davies, G. R. (2002). U–Th disequilibrium and Rb–Sr age constraints on the magmatic evolution of peralkaline rhyolites from Kenya. J. Petrol. 43, 557–577. doi: 10.1093/petrology/43.3.557
Hong, W., Xu, X., and Zou, H. (2013). Petrogenesis of coexisting high-silica aluminous and peralkaline rhyolites from Yunshan (Yongtai), southeastern China. J. Asian Earth Sci. 74, 316–329. doi: 10.1016/j.jseaes.2013.01.005
Horn, S., and Smincke, H. U. (2000). Volatile emission during the eruption of Baitoushan volcano (China/North Korea) ca. 969 AD. Bull. Volcanol. 61, 537–555. doi: 10.1007/s004450050004
Houghton, B. F., Weaver, S. D., Wilson, C. J. N., and Lanphere, M. A. (1992). Evolution of a quaternary peralkaline volcano: Major Island, New Zealand. J. Volcanol. Geotherm. Res. 51, 217–236. doi: 10.1016/0377-0273(92)90124-v
Hughes, E. C., Neave, D. A., Dobson, K. J., Withers, P. J., and Edmonds, M. (2017). How to fragment peralkaline rhyolites: observations on pumice using combined multi-scale 2D and 3D imaging. J. Volcanol. Geoth. Res. 336, 179–191. doi: 10.1016/j.jvolgeores.2017.02.020
Iezzi, G., Mollo, S., Shahini, E., Cavallo, A., and Scarlato, P. (2014). The cooling kinetics of plagioclase feldspar as revealed by electron-microprobe mapping. Am. Mineral. 99, 898–907. doi: 10.2138/am.2014.4626
Iezzi, G., Mollo, S., Ventura, G., Cavallo, A., and Romano, C. (2008). Experimental solidification of anhydrous latitic and trachytic melts at different cooling rates: the role of nucleation kinetics. Chem. Geol. 253, 91–101. doi: 10.1016/j.chemgeo.2008.04.008
Kirkpatrick, R. J. (1981). “Kinetics of crystallisation of igneous rocks,” in Kinetics of Geochemical Processes: Review in Mineralogy, Vol. 8, eds A. C. Lasaga and R. J. Kirkpatrick (Washington, DC: Mineralogical Society of America), 321–398. doi: 10.1515/9781501508233-012
Kovalenko, V. I., Herving, R. L., and Sheridan, M. F. (1988). Ion-microprobe analyses of trace elements in anorthoclase, hedembergite, aenigmatite, quartz, apatite and glass in Pantellerite: evidence for high water content in pantellerite melt. Am. Mineral. 73, 1038–1045.
Landi, P., and Rotolo, S. G. (2015). Cooling and crystallization recorded in trachytic enclaves hosted in pantelleriticmagmas (Pantelleria, Italy): implications for pantellerite petrogenesis. J. Volcanol. Geotherm. Res. 301, 169–179. doi: 10.1016/j.jvolgeores.2015.05.017
Lanzo, G., Landi, P., and Rotolo, S. G. (2013). Volatiles in pantellerite magmas: a case study of the Green Tuff Plinian eruption (Island of Pantelleria, Italy). J. Volcanol. Geotherm. Res. 262, 153–163. doi: 10.1016/j.jvolgeores.2013.06.011
Lowestern, J. B., and Mahood, G. A. (1991). New data on magmatic H2O contents with implications for petrogenesis and eruptive dynamics at Pantelleria. Bull. Volcanol. 54, 78–83. doi: 10.1007/bf00278208
Lustrino, M., Morra, V., Melluso, L., Brotzu, P., D’Amelio, F., Fedele, L., et al. (2004). The Cenozoic igneous activity of Sardinia. Period. Mineral. 73, 105–134.
Macdonald, R. (1974). Nomenclature and petrochemistry of the peralkaline oversaturated extrusive rocks. Bull. Volcanol. 38, 498–516. doi: 10.1007/bf02596896
Macdonald, R., and Scaillet, B. (2006). The central Kenya peralkaline province: Insights into the evolution of peralkaline salic magmas. Lithos 91, 59–73. doi: 10.1016/j.lithos.2006.03.009
Mahood, G. A., and Hildreth, W. (1986). Geology of the peralkaline volcano at Pantelleria, Strait of Sicily. Bull. Volcanol. 48, 143–172. doi: 10.1007/bf01046548
Marshall, A. S., Macdonald, R., Rogers, N. W., Fitton, J. G., Tindle, A. G., Nejbert, K., et al. (2009). Fractionation of peralkaline silicic magmas: the Greater Olkaria Volcanic Complex, Kenya Rift Valley. J. Petrol. 50, 323–359. doi: 10.1093/petrology/egp001
Martel, C. (2012). Eruption dynamics inferred from microlite crystallization experiments: application to Plinian and dome-forming eruptions of Mt Pelée e (Martinique, Lesser Antilles). J. Petrol. 53, 699–725. doi: 10.1093/petrology/egr076
Martel, C., and Schmidt, B. C. (2003). Decompression experiments as an insight into ascent rates of silicic magmas. Contrib. Mineral. Petrol. 144, 397–415. doi: 10.1007/s00410-002-0404-3
Masotta, M., Pontesilli, A., Mollo, S., Armienti, P., Ubide, T., Nazzari, M., et al. (2020). The role of undercooling during clinopyroxene growth in trachybasaltic magmas: insights on landimagma decompression and cooling at Mt. Etna volcano. Geochim. Cosmochim. Acta 268, 258–276. doi: 10.1016/j.gca.2019.10.009
Mattia, M., Bonaccorso, A., and Guglielmino, F. (2007). Ground deformations in the Island of Pantelleria (Italy): insights into the dynamic of the current intereruptive period. J. Geophys. Res. 112:B11406.
Mollard, E., Martel, C., and Bourdier, J. L. (2012). Decompression-induced Crystallisation in Hydrated Silica-rich Melts: empirical models of experimental plagioclase nucleation and growth kinetics. J. Petrol. 0, 1–24.
Morra, V., Secchi, F. A. G., and Assorgia, A. (1994). Petrogenetic significance of peralkaline rocks from Cenozoic calc-alkaline volcanism from SW Sardinia, Italy. Chem. Geol. 118, 109–142. doi: 10.1016/0009-2541(94)90172-4
Mysen, B. O. (2007). The solution behaviour of H2O in peralkaline aluminosilicate melts at high pressure with implication for properties of hydrous melts. Geochim. Cosmochim. Acta 71, 1820–1834. doi: 10.1016/j.gca.2007.01.007
Mysen, B. O., and Toplis, M. J. (2007). Structural behaviour of Al3+ in peralkaline, metaluminous, and peraluminous silicate melts and glasses at ambient pressure. Am. Mineral. 92, 933–946. doi: 10.2138/am.2007.2334
Neave, D. A. (2020). Chemical variability in peralkaline magmas and magma reservoirs: insights from the Khaggiar lava flow, Pantelleria, Italy. Contrib. Mineral. Petrol. 175:39.
Neave, D. A., Fabbro, G., and Herd, R. (2012). Melting, Differentiation and Degassing at the Pantelleria Volcano, Italy. J. Petrol. 53, 637–663. doi: 10.1093/petrology/egr074
Orsi, G., Ruvo, L., and Scarpati, C. (1989). The Serra della Fastuca Tephra at Pantelleria: physical parameters for an explosive eruption of peralkaline magma. J. Volcanol. Geotherm. Res. 39, 55–60. doi: 10.1016/0377-0273(89)90020-6
Papale, P., Moretti, R., and Barbato, D. (2006). The compositional dependence of the saturation surface of H2O + CO2 fluids in silicate melts. Chem. Geol. 229, 78–95. doi: 10.1016/j.chemgeo.2006.01.013
Parker, D. F., Ren, M., Adams, D. T., Tsai, H., and Long, L. E. (2012). Mid-Tertiary magmatism in western Big Bend National Park, Texas, U.S.A.: evolution of basaltic source regions and generation of peralkaline rhyolite. Lithos 144, 161–176. doi: 10.1016/j.lithos.2012.04.019
Peccerillo, A., Barberio, M. R., Yirgu, G., Ayalew, D., Barbieri, M., and Wu, T. W. (2003). Relationships between Mafic and Peralkaline Silicic Magmatism in Continental Rift Settings: a Petrological, Geochemical and Isotopic Study of the Gedemsa Volcano, Central Ethiopian Rift. J. Petrol. 44, 2003–2032. doi: 10.1093/petrology/egg068
Ren, M., Omenda, P. A., Anthony, E. Y., White, J. C., Macdonald, R., and Berley, D. K. (2006). Application of the QUILF thermobarometer to the peralkaline trachyte and pantellerites of the Eburru volcanic complex, East Africa Rift, Kenya. Lithos 91, 109–124. doi: 10.1016/j.lithos.2006.03.011
Renna, M. R., Tribuzio, R., and Braga, R. (2013). Petrogenesis relationships between peralkaline rhyolite dykes and mafic rocks in the post-Variscan gabbroic complex from Bocca di Tenda (Northern Corsica, France). Contrib. Mineral. Petrol. 165, 1073–1085. doi: 10.1007/s00410-012-0848-z
Romano, P., Andújar, J., Scaillet, B., Romengo, N., Di Carlo, I., and Rotolo, S. G. (2018). Phase equilibria of Pantelleria trachytes (Italy): Constraints on pre-eruptive conditions and on the metaluminous to peralkaline transition in silicic magmas. J. Petrol. 59, 559–588. doi: 10.1093/petrology/egy037
Rooney, T. O., Hart, W. K., Hall, C. M., Ayalew, D., Ghiorso, M. S., Hidalgo, P., et al. (2012). Peralkaline magma evolution and the tephra record in the Ethiopian Rift. Contrib. Mineral. Petrol. 164, 407–426. doi: 10.1007/s00410-012-0744-6
Rotolo, S. G., La Felice, S., Mangalaviti, A., and Landi, P. (2007). Geology and petrochemistry of the recent (< 25 ka) silicic volcanism at Pantelleria Island. Boll. Soc. Geol. It. 126, 191–208.
Scaillet, B., and Macdonald, R. (2001). Phase Relations of peralkaline silicic magmas and petrogenetic implications. J. Petrol. 42, 825–845. doi: 10.1093/petrology/42.4.825
Scaillet, B., and Macdonald, R. (2003). Experimental Constraints on the Relationships between Peralkaline Rhyolites of the Kenya Rift Valley. J. Petrol. 44, 1867–1894. doi: 10.1093/petrology/egg062
Scaillet, B., and Macdonald, R. (2006). Experimental constraints on pre-eruption conditions of pantelleritic magmas: evidence from the Eburru complex, Kenya Rift. Lithos 91, 95–108. doi: 10.1016/j.lithos.2006.03.010
Scaillet, B., Pichavant, M., Roux, J., Humbert, G., and Lefèvre, A. (1992). Improvements on the Shaw membrane technique for measurement and control of f H2 at high temperatures and pressures. Am. Mineral. 77, 647–655.
Scaillet, S., Rotolo, S. G., La Felice, S., and Vita-Scaillet, G. (2011). High-resolution 40Ar/39Ar chronostratigraphy of the post-caldera (<20 ka) volcanic activity at Pantelleria, Sicily Strait. Earth Planet. Sci. Lett. 309, 280–290. doi: 10.1016/j.epsl.2011.07.009
Schmincke, H.-U. (1974). Volcanological aspects of peralkaline silicicwelded ash-flow tuffs. Bull. Volcanol. 38, 594–636. doi: 10.1007/bf02596900
Schneider, C. A., Rasband, W. S., and Eliceiri, K. W. (2012). NIH Image to ImageJ: 25 years of image analysis. Nat. Methods 9, 671–675. doi: 10.1038/nmeth.2089
Shea, T., and Hammer, J. E. (2013). Kinetics of cooling- and decompression-induced crystallization in hydrous mafic–intermediate magmas. J. Volcanol. Geotherm. Res. 260, 127–145. doi: 10.1016/j.jvolgeores.2013.04.018
Speranza, F., Di Chiara, A., and Rotolo, S. G. (2012). Correlation of welded ignimbrites on Pantelleria (Strait of Sicily) using paleomagnetism. Bull. Volcanol. 74, 341–357. doi: 10.1007/s00445-011-0521-9
Speranza, F., Landi, P., Caracciolo, F. D. A., and Pignatelli, A. (2010). Paleomagnetic dating of the most recent silicic eruptive activity at Pantelleria (Strait of Sicily). Bull. Volcanol. 72, 847–858. doi: 10.1007/s00445-010-0368-5
Stabile, P., Radica, F., Bello, M., Behrens, H., Carroll, M. R., Paris, E., et al. (2018). H2O solubility in pantelleritic melts: pressure and alkali effects. J. Min. Geochem. 195, 1–9. doi: 10.1127/njma/2017/0060
Stabile, P., Webb, S., Knipping, J. K., Behrens, H., Paris, E., and Giuli, G. (2016). Viscosity of pantelleritic and alkali-silicate melts: effect of Fe redox state and Na/(Na+K) ratio. Chem. Geol. 422, 73–82. doi: 10.1016/j.chemgeo.2016.09.003
Stevenson, R. J., Bagdassarov, N. S., Dingwell, D. B., and Romano, C. (1998). The influence of trace amounts of water on the viscosity of rhyolites. Bull. Volcanol. 60, 89–97. doi: 10.1007/s004450050218
Stevenson, R. J., Briggs, R. M., and Hodder, A. P. W. (1993). Emplacement history of a low-viscosity, fountain-fed pantelleritic lava flow. J. Volcanol. Geother. Res. 57, 39–56. doi: 10.1016/0377-0273(93)90030-u
Stevenson, R. J., and Wilson, L. (1997). Physical volcanology and eruption dynamics of peralkaline agglutinates from Pantelleria. J. Volcanol. Geotherm. Res. 79, 97–122. doi: 10.1016/s0377-0273(97)00021-8
Swanson, S. E. (1977). Relation of nucleation and crystal-growth rate to the development of granitic textures. Am. Mineral. 62, 966–978.
Toplis, M. J., and Carroll, M. R. (1995). An experimental study of the influence of oxygen fugacity on Fe-Ti oxide stability, phase relations, and mineral- melt equilibria in ferro-basaltic systems. J. Petrol. 36, 1137–1170. doi: 10.1093/petrology/36.5.1137
Watson, E. B. (1994). “Diffusion in volatile-bearing magmas,” in Volatiles in Magmas. Reviews in Mineralogy,” Vol. 30, eds M. R. Carroll and J. R. Holloway (Washington, DC: Mineralogical Society of America), 331–371.
Webster, J. D., Taylor, R. P., and Bean, C. (1993). Pre-eruptive melt composition and constraints on degassing of a water-rich pantellerite magma, Fantale volcano, Ethiopia. Contrib. Mineral. Petrol. 114, 53–62. doi: 10.1007/bf00307865
Welsch, B., Hammer, J., Baronnet, A., Jacob, S., Hellebrand, E., and Sinton, J. (2016). Clinopyroxene in postshield Haleakala ankaramite: 2. Texture, compositional zoning and supersatu- ration in the magma. Contrib. Mineral. Petrol. 171, 1–19. doi: 10.1007/s00410-015-1213-9
White, J. C., Benker, S. C., Ren, M., Urbanczyk, K. M., and Corrick, D. W. (2006). Petrogenesis and tectonic setting of peralkaline Pine Canyon caldera, Trans-Pecos Texas, USA. Lithos 91, 74–94. doi: 10.1016/j.lithos.2006.03.015
White, J. C., Parker, D. F., and Ren, M. (2009). The origin of trachyte and pantellerite from Pantelleria, Italy: insights from major elements, trace elements, and thermodynamic modelling. J. Volcanol. Geotherm. Res. 179, 33–55. doi: 10.1016/j.jvolgeores.2008.10.007
White, J. C., Ren, M., and Parker, D. F. (2005). Variation in mineralogy, temperature, and oxygen fugacity in a suite of strongly peralkaline lavas and tuffs, Pantelleria, Italy. Canadian Mineral. 43, 1331–1347. doi: 10.2113/gscanmin.43.4.1331
Keywords: alkali feldspar, peralkaline rhyolite, nucleation delay, crystallization kinetics, Pantelleria volcanic system
Citation: Arzilli F, Stabile P, Fabbrizio A, Landi P, Scaillet B, Paris E and Carroll MR (2020) Crystallization Kinetics of Alkali Feldspar in Peralkaline Rhyolitic Melts: Implications for Pantelleria Volcano. Front. Earth Sci. 8:177. doi: 10.3389/feart.2020.00177
Received: 06 February 2020; Accepted: 06 May 2020;
Published: 02 June 2020.
Edited by:
Catherine Annen, Université Savoie Mont Blanc, FranceReviewed by:
Jenni Barclay, University of East Anglia, United KingdomIan Ernest Masterman Smith, The University of Auckland, New Zealand
Copyright © 2020 Arzilli, Stabile, Fabbrizio, Landi, Scaillet, Paris and Carroll. This is an open-access article distributed under the terms of the Creative Commons Attribution License (CC BY). The use, distribution or reproduction in other forums is permitted, provided the original author(s) and the copyright owner(s) are credited and that the original publication in this journal is cited, in accordance with accepted academic practice. No use, distribution or reproduction is permitted which does not comply with these terms.
*Correspondence: Fabio Arzilli, ZmFiaW8uYXJ6aWxsaUBtYW5jaGVzdGVyLmFjLnVr; YXJ6aWxsaS5mYWJpb0BnbWFpbC5jb20=