 Stephan Kolzenburg
 Kai-Uwe Hess
 Kim Berlo2
 Donald B. Dingwell
- 1Department of Earth and Environmental Sciences, Ludwig-Maximilians-University, Munich, Germany
- 2Department of Earth and Planetary Sciences, McGill University, Montreal, QC, Canada
- 3Department of Geology, University at Buffalo, Buffalo, NY, United States
Large volcanic eruptions are frequently triggered by the intrusion of hot primitive magma into a more evolved magma-chamber or -mush zone. During intrusion into the cooler mush zone, the basaltic magma undergoes crystallization, which in turn can release heat and volatiles to the mush. This should cause a drop in bulk mush-viscosity, potentially leading to its mobilization and even eruption. The non-linear changes in the transport properties of both magmas during this interaction also modulate how the magmas accommodate deformation during both interaction and ascent. As such, this interaction represents a complex disequilibrium phenomenon, during which the material properties guiding the processes (dominantly viscosity) are in constant evolution. This scenario highlights the importance of non-isothermal sub-liquidus processes for the understanding of natural magmatic and volcanic systems and underlines the need for a rheological database to inform on, and to model, this interaction process. Here we present new experimental data on the disequilibrium rheology of the least evolved end-member known to be involved in magma mixing and eruption triggering as well as lava flow processes in the Phlegrean volcanic district (PVD). We measure the melt's subliquidus rheological evolution as a function of oxygen fugacity and cooling rate and map systematic shifts in its rheological “cut off temperature; Tcutoff” (i.e., the point where flow ceases). The data show that (1) the rheological evolution and solidification behavior both depend on the imposed cooling-rate, (2) decreasing oxygen fugacity decreases the temperature at which the crystallization onset occurs and modifies the kinetics of melt crystallization and (3) the crystallization kinetics produced under dynamic cooling are significantly different than those observed at or near equilibrium conditions. Based on the experimental data we derive empirical relationships between the environmental parameters and Tcutoff. These empirical descriptions of solidification and flow may be employed in numerical models aiming to model lava flow emplacement or to reconstruct the thermomechanical interaction between basalts and magma mush systems. We further use the experimental data in concert with existing models of particle suspension rheology to derive the disequilibrium crystallization kinetics of the melt and its transition from crystallization to glass formation.
Introduction
General Overview
The growing number of inhabitants, tourists, and economic activities near volcanoes require adequate volcanic hazard assessment and mitigation plans to guide decision-making in the case of volcanic unrest. Large eruptions across many volcanic centers on Earth are documented to have been triggered by intrusion of hot primitive (basaltic) magma into an evolved (dacite to rhyolite) magma-chamber or -mush zone (Sparks et al., 1977; Blake and Ivey, 1986; Eichelberger et al., 2000; Laeger et al., 2019; Morgavi et al., 2019); examples include the Campi Flegrei and Yellowstone calderas (Civetta et al., 1997; Pritchard et al., 2013; Morgavi et al., 2019), Quizapu (Ruprecht and Bachmann, 2010) and Pinatubo (Pallister et al., 1996). During this intrusion process the primitive melt cools and crystallizes (Wager and Bailey, 1953; Wiebe, 1993a; Blake and Fink, 2000), and is able to supply heat and volatiles to the evolved magma mush, which brings forth large changes in the effective viscosity of both melts during the interaction. Heating and volatile fluxing of the mush cause a drop in mush-viscosity and may mobilize the mush zone, whereas cooling of the primitive melt against the crystal mush triggers crystallization and solidification of the intruding melt (Wiebe, 2016). The primitive melt's dynamic rheology during intrusion and quenching against the magma mush in turn guides its emplacement geometry and thus the nature and efficacy of this interaction (i.e., heat and volatile transfer); see for example Sparks and Marshall (1986), Blake and Fink (2000) and references therein. The resulting, non-linear changes in the magma transport properties during solidification may therefore modulate the generation of large volumes of eruptible magma and may separate scenarios generating eruptible vs. non-eruptible magma and dictate effusive vs. explosive behavior.
In this interaction process, the solidification of the primitive intruding magma during quench against the cooler evolved magma represents a key rheological transition zone. During solidification, slight changes in magma componentry (i.e., volumetric fractions of melt vs. crystals) produce remarkable changes in effective viscosity. Even though this transition zone has long been identified (Bruce and Huppert, 1990; Griffiths et al., 2003; Lyman and Kerr, 2006; Iezzi et al., 2011; Vetere et al., 2013) and the computational capacities to model volcanic eruptions have grown exponentially over the past decades (Miyamoto and Sasaki, 1997; Costa and Macedonio, 2005; Favalli et al., 2006; Herault et al., 2009), the available computer models do not produce coherent results. This is, in part, because such predictive approaches rely on accurate rheological data that are applicable to the modeled scenarios, which are very scarce to date.
The viscosity of crystal- and bubble-free silicate melts is reasonably well-constrained (Giordano et al., 2008a) and the growing availability of rheological data of analog materials has been consolidated to model the effect of particles and bubbles on the viscosity of analog suspensions; See Mader et al. (2013) for a review. Natural multicomponent systems are, however, more difficult to characterize owing to the challenges of high temperature rheometry. Despite these difficulties, several studies on the rheology of crystal bearing natural magmas and lavas at constant temperature and pressure have been accomplished in the past decade; for example (Ishibashi and Sato, 2007; Vona et al., 2011; Vona and Romano, 2013; Chevrel et al., 2015; Campagnola et al., 2016; Soldati et al., 2016). Volcanic eruptions and magma migration, however, occur almost exclusively under dynamic disequilibrium conditions (e.g., decreasing pressure and temperature), inducing changes in the thermomechanical state of the melt and thereby its rheology. These changes determine whether and how a magma is able to erupt and, thus, its risk potential for mankind and the environment.
Experimental data on the rheological evolution of crystalizing magmas are indispensable to provide accurate rheological models for the assessment of volcanic eruption styles and intensities. To date, data straddling these critical transition zones under non-isothermal conditions are, however, scarce. Measurements at disequilibrium conditions, employing new experimental methods (Giordano et al., 2007; Kolzenburg et al., 2017, 2018a; Vetere et al., 2019) and infrastructure (Kolzenburg et al., 2016, 2018b) have only recently become more numerous. This underlines the relevance of developing a comprehensive database of the temperature dependent rheology of crystallizing magmas and lavas in dynamic temperature–, shear-rate–, and oxygen fugacity (fO2) -space to accurately constrain physical property based lava flow and magma mixing models. Such a database can then be employed to derive theoretical flow laws for lavas and magmas under disequilibrium conditions.
Magma Interaction in the Phlegrean Volcanic District (PVD)
The Phlegrean volcanic district (PVD; Naples, Italy) poses a significant threat to both the local population as well as the Eurasian continent as a whole, especially since the caldera has entered a new cycle of unrest (Kilburn et al., 2017; Forni et al., 2018). Forecasting of volcanic behavior in the PVD is, in part, hampered by a lack of understanding of magma transport properties, inhibiting accurate assessment of flow and migration timescales. Magma transport in the recent volcanic history of the PVD (i.e., in the past 10 ka) that was sourced from deep shoshonitic–latitic reservoirs followed one of two general paths (Arienzo et al., 2010b): (1) ascent as dikes (for example along regional faults), ultimately reaching the surface and producing both explosive and effusive eruptions and (2) stalling of the ascending melt in magma chambers of shallower depth where they interacted with resident melts, further differentiated and/or were contaminated. In the latter case, mixing of at least three different magmatic components has been suggested based on Sr-isotopic disequilibria among pumice samples, whole rocks and hosted minerals (D'antonio et al., 1999b). In fact, interaction between the evolved magma storage system and intruding primitive magmas is a ubiquitous process in the PVD (Civetta et al., 2004; Mangiacapra et al., 2008; Isaia et al., 2009; González-García et al., 2017; Morgavi et al., 2019) and is documented in several ignimbrites (Civetta et al., 1997; Moretti et al., 2019) as well as dome lavas (Melluso et al., 2012). The Fondo Riccio, Minopoli, and Santa Maria delle Grazie eruptions are of particular interest here, as they document extensive interaction of potassium-rich-basaltic magmas with trachytes—producing explosive eruptions of latitic composition (Cannatelli et al., 2007; Isaia et al., 2009). This highlights that the interaction between basaltic and trachytic magmas has the potential to trigger eruptions in the PVD and is important to consider for future Phlegrean eruptions.
Here we present new experimental data on the disequilibrium rheology of the least evolved end member known to be involved in both lava flow production and magma mixing and eruption triggering processes in the PVD. We further deduce the basalt's disequilibrium crystallization kinetics from the rheological data by employing particle suspension rheology models that were validated on analog materials. This enables us to address two major limitations in current efforts to investigate magma and lava crystallization dynamics under disequilibrium: (1) textural investigations of disequilibrium measurements are commonly impeded due to the rapid crystallization kinetics; this new approach allows comparison of volumetric crystallization rates and (2) using this approach, the melt's crystallization kinetics can be assessed at shear rates relevant for natural magmas and lavas, which classic crystallization experiments in the absence of deformation can not address.
Sample Preparation and Experimental Methods
Sample Selection and Geological Relevance
While Shoshonitic (high K) and latitic lavas and melt inclusions are abundant in the PVD (e.g., in the Minopoli and Fondo Riccio eruptions) and have long been though to represent the least evolved end members of the magma interaction process (Civetta et al., 1997; Di Vito et al., 1999; Pappalardo et al., 2002; Di Matteo et al., 2006; Mangiacapra et al., 2008), eruptive products cropping out on the islands of Procida and nearby Ventotene and melt inclusions within them (D'antonio et al., 1999a; de Astis et al., 2004; Fedele et al., 2006; Esposito et al., 2011) suggest the presence of less evolved, lower SiO2 and K2O (bordering calc-alkaline) melts than previously thought. This observation is also supported by the presence of primitive melt inclusions in the eruptive products of the Campanian Ignimbrite; See data compilation in Moretti et al. (2019) and references therein. Trachybasaltic compositions have also been measured in melt inclusions entrapped in olivine crystals from the Pomici Principali eruption (Arienzo et al., 2010a). Thus, while the erupted magmas at Campi Flegrei differ slightly from those erupted on Ischia and Procida, it is likely that xenoliths of high-K basaltic composition in the Solchiaro tuff (Procida) represent the least-evolved rocks of the whole PVD (D'antonio et al., 1999a; Esposito et al., 2011).
The composition chosen for this study is reported in Table 1 and the experimental sample is compared to a selection of compositions reported in melt inclusions and whole rock analyses from the studies reviewed above in Figure 1. Note that while the composition used in these experiments was chosen with the PVD magmatic system in mind, the results presented here are applicable for the interpretation of a large variety of magmatic and volcanic processes in a range of tectonic settings where melts of similar composition are present.
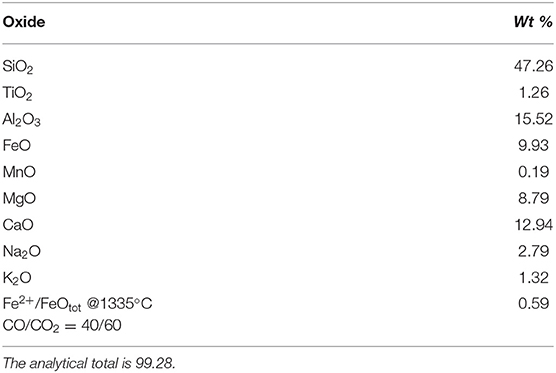
Table 1. Composition of the sample in this study as wt % oxides measured via elecrton probe microanalysis (EPMA) after the experiments; normalized to 100% (analytical precision is better than 2.5% relative).
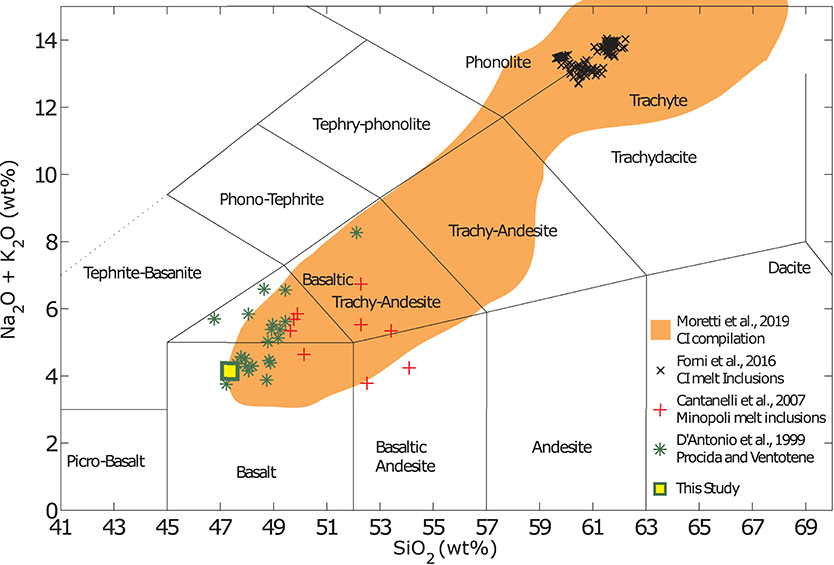
Figure 1. Compilation of compositional analyses on eruptive products from the PVD. Summary of select compositions occurring within the PVD. Data are shown for the Campanian Ignimbrite (CI) eruption; compilation by Moretti et al. (2019) and Forni et al. (2018), as well as for melt inclusions and eruptive products of the Minopoli eruption (Cannatelli et al., 2007) and lavas and xenoliths from Procida and Ventotene (D'antonio et al., 1999a). The composition used in this study is synthesized to represent the least evolved composition known to occur in the PVD.
Sample Preparation and Compositional Analysis
The experimental sample was synthesized from powder mixtures (100 g decarbonated equivalent) of SiO2, TiO2, Al2O3, Fe2O3, MnO, MgO, CaCO3, Na2CO3, and K2CO3. Powders were mechanically homogenized before melting. Melt homogenization was performed by repeating the following procedure twice: The powders were melted in thin–walled Pt crucibles (100 ml) in a Nabertherm® MoSi2 box furnace at 1,500°C (in air), as successive additions of ~10 grams added every 5 min. This process avoids spillage of the melt as a result of foaming. Synthetic samples vesiculate during synthesis due to decarbonization, producing a bubbly melt. This vesicle loss is complete after ~20 min at 1,500°C and the crucible remains in the furnace for ~1 h after initial melting to ensure complete degassing. Melting of the 100 g sample yield was done in Fe saturated crucibles, ensuring that Fe-loss to the crucible is negligible. Loss of volatile elements is negligible due to short melting times and a small surface to volume ratio of the sample. The melt is quenched to a glass by pouring it onto a steel plate. This glass is then crushed and milled in an agate mortar and re–melted into a Pt80Rh20 cylindrical crucible of 51 mm height and 26.6 mm diameter for viscometry. Final homogenization took place in a concentric cylinder viscometer by re-melting and stirring the sample at 40 rpm at 1,500°C for 12 h.
The resulting glass composition is measured with a Cameca SX100 electron probe micro-analyzer (EPMA). Analyses are performed at 15 kV acceleration voltage and a defocused beam (10 μm) and 5 nA beam current is used to minimize the alkali loss. Calibration standards are wollastonite (Ca), periclase (Mg), hematite (Fe), natural orthoclase (Al, K), and albite (Na, Si). The precision is better than 2.5 % for all analyzed elements and was determined by analyzing two reference glasses at the start of the analytical session. Homogeneity of the sample is verified by performing ~12 analyses per sample. The measured glass composition is reported in Table 1.
Backscattered electron images and Energy Dispersive Spectra (EDS) for elemental analysis to determine the crystal stoichiometry are collected using a Phenom XL desktop scanning electron microscope, equipped with a Phenom ProX EDS detector, that is located at McGill University. The machine is operated at 15 kV acceleration voltage with a spot size of ~1 μm.
Iron Redox Titration
Measurements of iron redox state are performed on samples recovered from the gas mixing furnace using a dip quench approach for which an alumina ceramic rod is dipped into the melt and the sample is extracted from the furnace. Quenching to below Tg occurs within a few seconds. The sample material is digested in concentrated sulfuric (H2SO4) and hydrofluoric (HF) acids. Potassium dichromate titration, calibrated against iron(II) ethyldiammoniumsulfate, is then performed on these digestions and the amount of Fe2+ is determined via the following redox reaction:
In combination with the EPMA analyses, these data are used to calculate the Fe2+/FeOtot. of the sample and the analytical results are reported in Table 1.
Concentric Cylinder Experiments
We perform both isothermal super-liquidus viscosity concentric cylinder measurements and non-isothermal viscometry experiments on the synthetic sample. Concentric cylinder measurements are a widely–applied method for viscometry of silicate melts at both sub- and superliquidus temperatures (Dingwell and Virgo, 1987; Dingwell, 1989; Sato, 2005; Giordano et al., 2007, 2008b; Vona et al., 2011; Chevrel et al., 2013, 2015; Vona and Romano, 2013; Kolzenburg et al., 2016, 2017; Vetere et al., 2017). Measurement precision for the apparatus used here is ±3% (Dingwell and Virgo, 1987; Kolzenburg et al., 2016). The gas mixing setup and its use are described in Dingwell and Virgo (1987) and Chevrel et al. (2013). The melt is reduced under constant stirring at 1,335°C by flowing a 40/60 ratio mix of CO/CO2 through the muffle tube for 36 h. The flow rate of the gas mixture is set to 100 ml min−1 via Tylan electronic gas flow controllers. Confirmation of reaching redox equilibrium is given by a constant torque reading for over 5 h. This homogenization was performed at a constant temperature of 1,335 and 1,395°C for reduced and oxidized conditions, respectively until reaching constant torque and temperature readings to ensure chemical and thermal homogeneity (see Kolzenburg et al., 2016; for calibration procedure). The temperature is then reduced in steps of ~25°C and held constant until steady temperature and torque readings are achieved (typically ~45 min). The samples' super–liquidus viscosity at oxidizing and reduced conditions is recovered from these data.
The sample used to measure the liquid viscosity is also used for all sub–liquidus experiments. Each cooling-rate is individually calibrated for these constant cooling-rate experiments, since the thermal inertia of the measurement setup creates unique thermal conditions (lag after initiation of cooling and offset between furnace and sample temperature). The experimental procedure, device calibration and the limitations of constant–cooling-rate experiments are presented in Kolzenburg et al. (2017) and Kolzenburg et al. (2018a). Measurements are performed by imposing constant cooling-rate of 0.1, 0.2, 0.5, 1, 3, and 5°C min−1 and a mean initial shear-rate of 0.77 s−1. We use a 14.3 mm diameter and 33.9 mm length spindle with a 45° conical tip, which reduces edge effects (Dingwell and Virgo, 1987). During the dynamic sub-liquidus experiments the measured torque increases with increasing apparent viscosity of the suspension. The viscometer head used here (Brookfield DV–III+) has a maximum torque capacity of 0.7187 mNm. The imposed shear-rate is halved whenever this limit is reached. Between experiments, the sample is re–heated to 1,335°C and homogenized at a shear-rate of 6.12 s−1 for between 2 and 23 h (depending on the previous experiment time) in order to ensure complete melting of any crystalline phase formed during the previous experiment. This re-homogenization period is set to be longer than the previous experiment, ensuring redox re–equilibration. This is supported by the return of the measured torque values after re–homogenization to within ~1.5% of the value measured after initial reduction. Dip quench samples are taken after the final dynamic crystallization experiment to determine the Fe2+/Fetot. following the procedure described earlier; see Table 1. After the dip quench sampling, the furnace is turned off and the remaining sample left in the furnace during cooling, where it partially crystallized (see Figure 6). This sample is used to determine the nature of the growing crystals as detailed below.
Relative Viscosity and the Effect of Crystallization on Melt Composition
The viscosity of silicate melts is highly temperature dependent and increases by several orders of magnitude with decreasing temperature. Below the melt's liquidus temperature this viscosity increase is paralleled by crystallization, increasing the solid fraction in the magmatic suspension, which further increases the effective viscosity of the magma.
Separating the temperature dependence of the melt viscosity from the effect of crystal growth on the apparent viscosity of the magmatic suspension requires a model of the temperature–viscosity dependence of the pure melt. To develop such a model we estimate the melt viscosity in the supercooled liquid state by application of a shift factor to data from differential thermal analysis (DTA) following the approach presented in Gottsmann et al. (2002); Giordano et al. (2008b). We measure the glass transition temperature (Tg) of the sample using a Netzsch Pegasus 404 differential scanning calorimeter (DSC). In a first step, the samples are annealed by imposing a heating and cooling cycle at a constant-rate of 10°C min−1. This replaces the samples thermal history, which it acquired during initial quenching with a standardized one. Tg is then measured at a heating-rate of 10°C min−1 in Ar–atmosphere. We correlate the onset (Tgonset) and peak (Tgpeak) of the measured DTA curve to the melts viscosity; see Giordano et al. (2008b). We then fit a Vogel Fulcher Tammann (VFT)–model to the low T viscosity measurements combined with the high T measurements. The VFT fit parameters obtained using this approach are well within the expected range for basaltic melts (Russell et al., 2003). Using this model, we normalize the data from the crystallization experiments to recover the suspensions relative viscosity:
where ηr, ηs, and ηl are the relative viscosity, the suspension viscosity (i.e., liquid plus crystals), and the liquid viscosity, respectively.
During crystallization the residual melt composition may change since certain components are removed from the melt to form crystals. This change is largest once the magmatic suspension has reached thermodynamic equilibrium and at atmospheric f O2 conditions because crystallization is at its thermodynamic maximum and oxidizing conditions favor crystallization (Mysen et al., 1985; Toplis and Carroll, 1995; Markl et al., 2010; Gualda and Ghiorso, 2015). During constant cooling experiments this state is not reached because the sample is driven to increasingly higher degrees of undercooling. The effects of changing melt composition must, therefore, be smaller in disequilibrium experiments than at equilibrium conditions. To assess the largest possible effect (i.e., at equilibrium conditions) that the change in melt composition may have on the viscosity measurement we model the melt composition in equilibrium at the lowest measured temperature (1,075°C) using MELTS (Gualda and Ghiorso, 2015) and assess its viscosity using the model of (Giordano et al., 2008a). We do this because sampling the interstitial melt composition is not possible in disequilibrium experiments due to the extremely rapid crystallization kinetics; see Kolzenburg et al. (2017) and Kolzenburg et al. (2018a) for details. Following this approach, we find that the viscosity of the initial composition and the fractionated melt at equilibrium, when attaining 60 vol. % crystallinity vary within less than ~0.4 log units and this variation is smaller at higher temperatures. We can therefore exclude that a change in melt composition has a drastic effect on the viscosity measurement and assign the relative viscosity changes over the experiment to crystal nucleation and growth (i.e., increasing suspension solid fraction).
Results
Liquid Viscosity
Results from the super-liquidus concentric cylinder viscosity measurements are plotted in Figure 2 and the data are reported in Table 2. The melt viscosity increases by 0.08 log units with increasing f O2 (i.e., oxidation). This increase is tied to the increased degree of melt polymerization that results from the transition of network modifying, five – and/or six-fold coordinated Fe2+ to tetrahedral Fe3+.
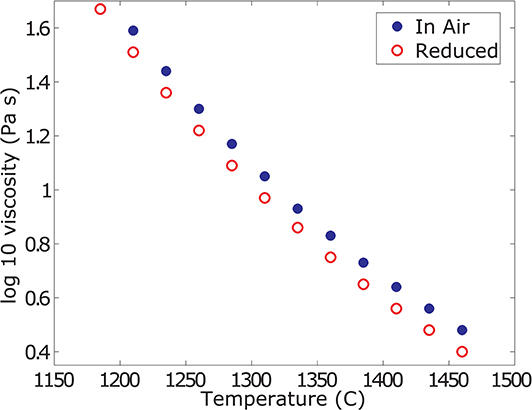
Figure 2. Liquid viscosity data. Summary of the super-liquidus viscosity measurements in air and at reduced conditions. The melt viscosity at reduced conditions is 0.08 log units lower than in air. For ease of comparison and reporting, the data are reported as values interpolated at the same temperatures.
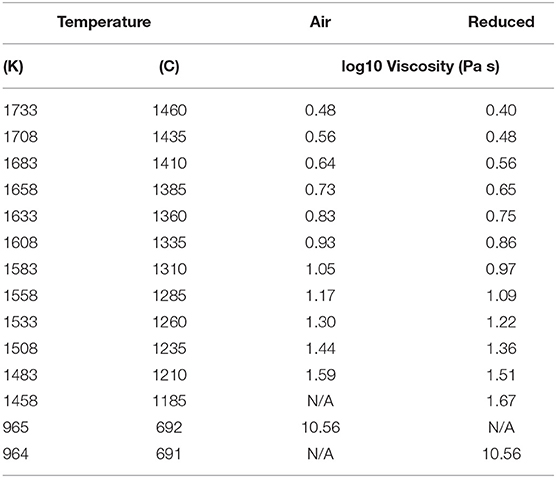
Table 2. Summary of liquid viscosity measurements (high temperatures) and model estimates of the low temperature viscosity of the melt.
For temperatures below 1,185°C at reduced conditions and 1,210°C in air, the torque reading does not stabilize but constantly increases, suggesting slow crystallization of the sample. When re-measuring at higher temperatures, steady and reproducible torque readings are achieved, supporting this observation. Data from these unsteady measurements and at lower temperatures are discarded for the analysis of the liquid viscosity, as these do not represent a pure melt viscosity but a suspension of melt and crystals.
Disequilibrium Rheology
The experimental data at varying cooling-rates and oxygen fugacities are plotted as absolute viscosity in Figure 3A and relative viscosity in Figure 3B. Initially, the viscosity measurement follows the trend of the liquid data and the extrapolated VFT fit for the supercooled liquid. Hence the resulting log ηr is zero (0) (Figure 3B). Tables 3, 4 report the data as log absolute and log relative viscosity, respectively. Once crystallization begins due to the increasing undercooling experienced by the sample, the apparent suspension viscosity increases relative to the theoretical liquid trend (i.e., ηr >0). This departure occurs at progressively increasing degree of undercooling (i.e., below the liquidus temperature) with increasing cooling-rate. Undercooling is largest for the highest cooling-rate and progressively decreases for lower cooling-rates. These relative viscosity (ηr) changes are directly linked to the crystallization-rate, as they result purely from a larger fraction of crystals impeding flow.
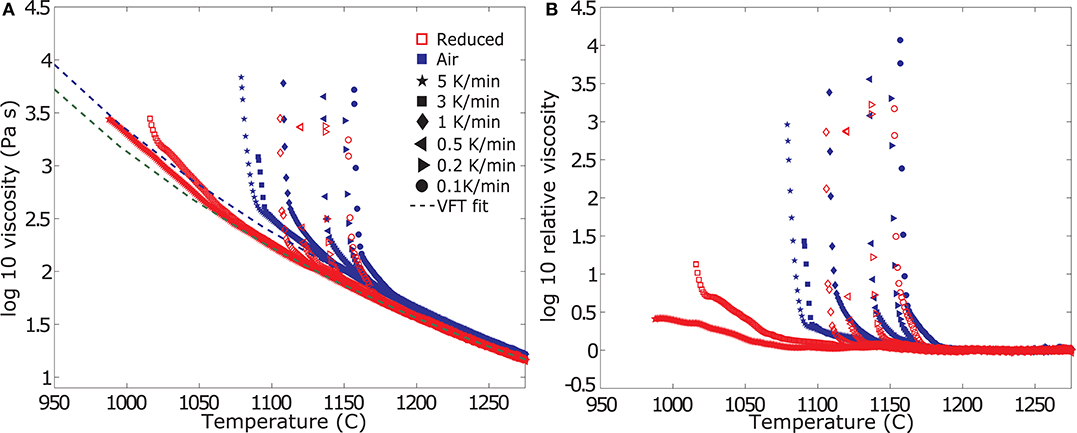
Figure 3. Evolution of viscosity measurements of the crystalizing melts. (A) Summary of the measured apparent viscosities from dynamic crystallization experiments at varying cooling-rates in air (blue filled symbols) and under reduced conditions (red open symbols), including the VFT–model fitted to the liquid viscosity data of Table 2. All measurements follow the VFT model until crystallization occurs, resulting in an increase in the apparent viscosity of the suspension. (B) Summary of the calculated relative viscosity data from the dynamic crystallization experiments plotted in (A). The data represent the measured viscosity normalized to the VFT model.
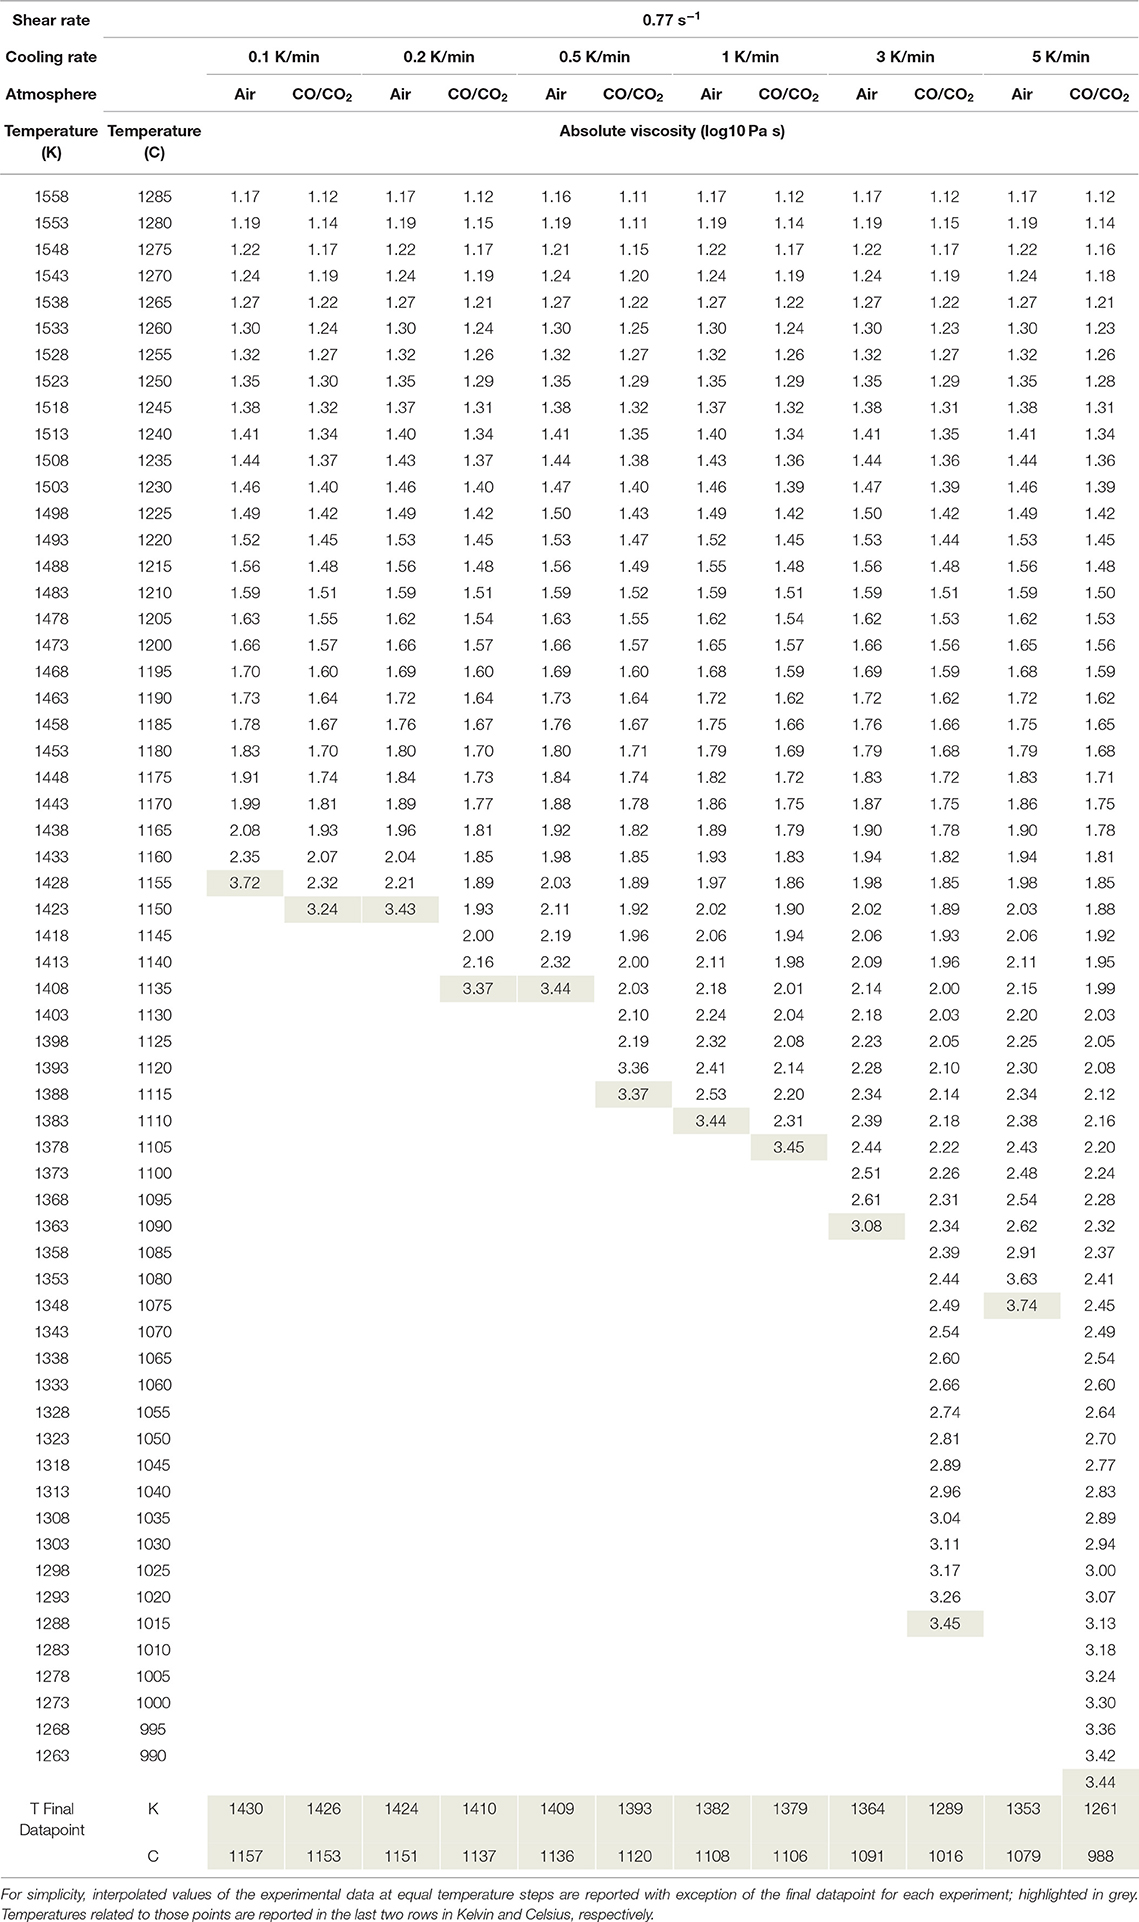
Table 3. Summary of absolute viscosity measurements of all experiments.
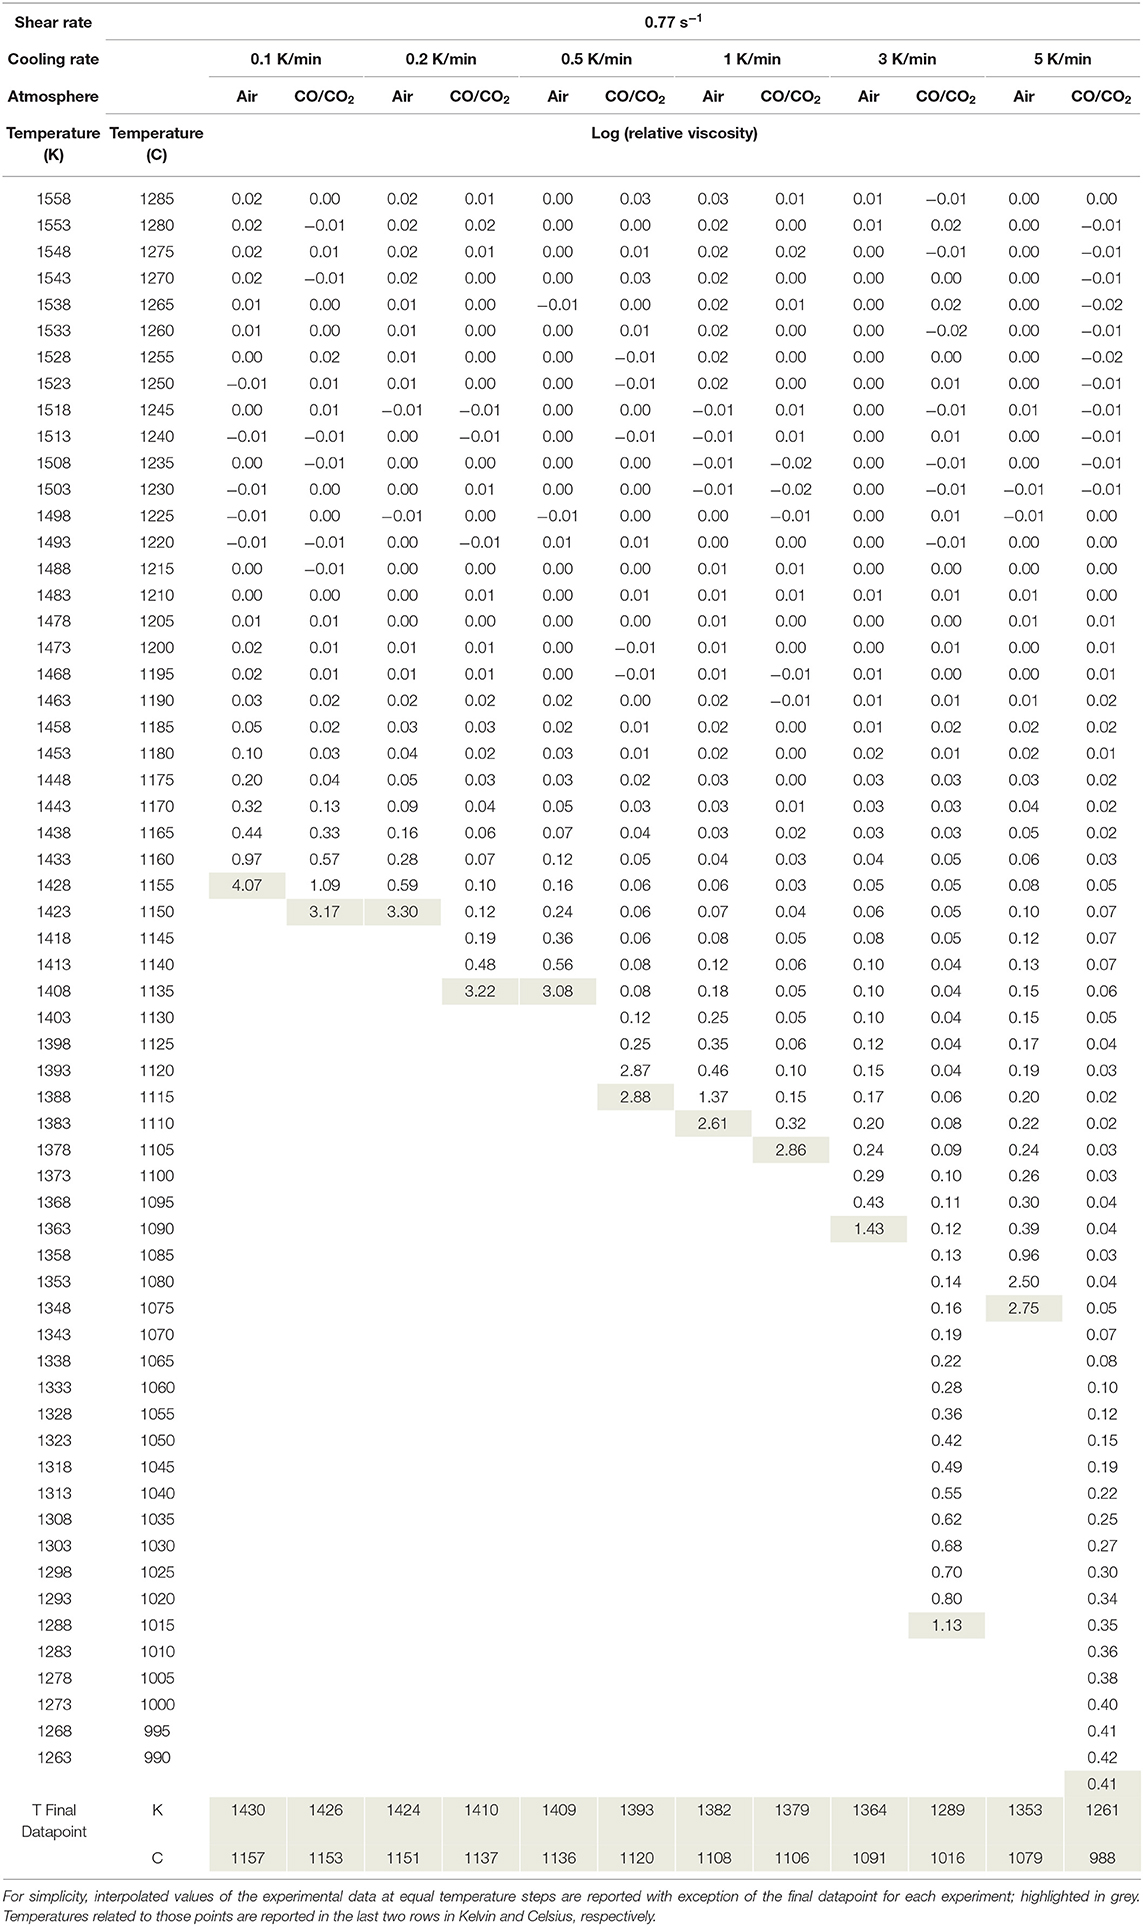
Table 4. Summary of the calculated relative viscosities of all experiments.
With decreasing f O2 both the onset of crystallization (i.e., the point of initial departure of the viscosity data from the VFT model) as well as the rheological cut-off shift to lower temperatures. Reducing conditions further bring forth a change in the samples crystallization kinetics, decreasing the temperature of crystallization onset but inducing higher crystallization rates once the process starts (i.e., steeper slopes in Figures 3A,B). Specifically, the onset of crystallization is suppressed by at least 12 degrees for the slowest cooling rate of 1 K/min and up to 100 degrees for the fastest cooling rate of 5 K/min. A detailed description of the changes in crystallization kinetics is presented in the section titled “Deducing Disequilibrium Crystallization Kinetics” below. While the onset of crystallization shifts drastically, the Tcutoff temperature does not change as much as a result of the more rapid crystallization kinetics and only varies between 3 and 15 degrees for cooling rates between 0.1 and 1 K/min; the Tcutoff prediction for cooling rates of 3 and 5 K/min was inconclusive for measurements at reducing conditions; see the next section for details.
A Solidification Model for Campi Flegrei Basalts
Mechanical constraints of the experimental apparatus inhibit measurements beyond the highest viscosity values reported in Table 3. The two main limitations are: (1) the rheometer torque limit and (2) the frictional limit of the crucible holder, where, when overcome, the sample container starts to slip and rotate; rendering the measurement invalid. To overcome these limitations and evaluate the solidification temperature of the suspension, Kolzenburg et al. (2019) presented a numerical approach, the Tcutoff forecast method (TFM). This method exploits the self-accelerating trend of the rheological measurement to forecast Tcutoff (i.e., the temperature where the sample rheologically solidifies and reaches infinite viscosity). It is based on the failure forecast method (FFM) used in volcano seismology and material science to predict material failure based on the acceleration of the seismic energy release rate prior to failure (Voight, 1988, 1989). The TFM utilizes the rate of increase in the measured effective viscosity and deduces the point at which it reaches a runaway state (i.e., solidification) from the signal acceleration. The TFM uses the following equations:
where dΩ/dt and d2Ω/dt2 are the rate and acceleration of the monitored phenomenon, respectively. A and α are empirical parameters (Voight, 1988, 1989). The exponent ∝ in Equation 2 increases with process acceleration and the point at which the process approaches the uncontrolled propagation is described by the condition ∝≈ 2. Thus, for Tcutoff forecasting, we set ∝ = 2 and simplify Equation 2 to:
where T is the temperature, and (dη/dT)0 is the value of (dη/dT) at the temperature of crystallization onset. Plotting the inverse viscosity rate against temperature describes a linear trend of negative slope, where the temperature at which dη/dT tends to infinity (i.e., sample solidification) is equal to the temperature at which the inverse rate reaches zero; details are reported in Kolzenburg et al. (2019). In Figure 4 we present example plots of the inverse rate of viscosity increase against temperature for selected experiments for illustration.
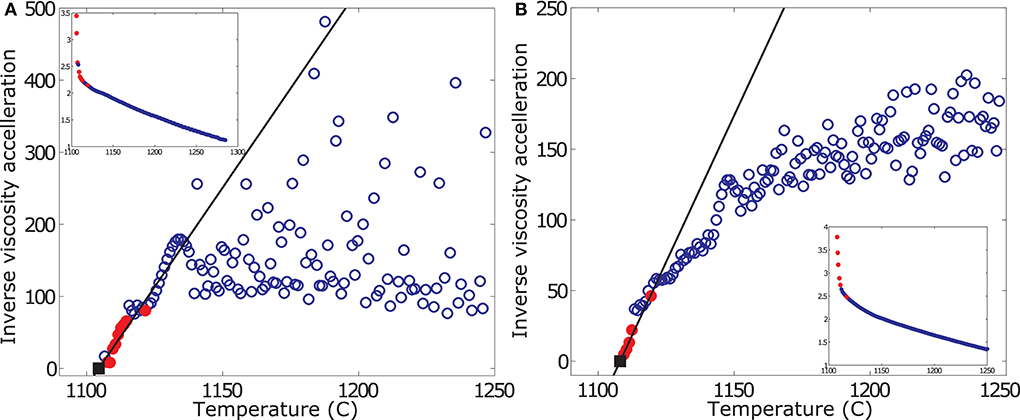
Figure 4. Sample plot of TFM results, showing inverse viscosity acceleration rate vs. temperature. Data are plotted for a cooling rate of 1 K/min reducing and oxidizing conditions in are plotted in subplots (A,B), respectively. Small inserts show the respective viscosity measurement. Blue open circles report the measured data interpolated at 1 degree intervals. Red filled circles highlight the peak acceleration values used in the TFM for fitting of the linear viscosity acceleration model to extrapolate to Tcutoff. Black squares represent the forecasted Tcutoff (i.e., dη/dT = ∞). The precision of the viscosity measurement is ± 3%.
The viscosity acceleration is small (i.e., large inverse acceleration) at high temperatures, and the data plot randomly. Once crystallization starts, the measured effective viscosity of the suspension increases in an accelerating manner. This forces the data to converge on a linear trend of negative slope. Tcutoff is then obtained by linear extrapolation of the peak acceleration rates of this trend to the X-axis. Note that at reduced conditions, the TFM is inconclusive for high cooling rates. This is because at these high cooling rates, where the zone between liquidus and glass transition temperature is crossed very rapidly, sample crystallization is effectively suppressed, favoring glass formation and inhibiting deduction of Tcutoff.
The values recovered using this method are plotted for all experiments as a function of cooling rate in Figure 5. In order to derive a simple, empirical, model that describes the solidification of the investigated melt power law curves are fitted to the Tcutoff values. These describe the data with R-squared values of 0.977 and 0.997 for oxidizing and reducing conditions, respectively.
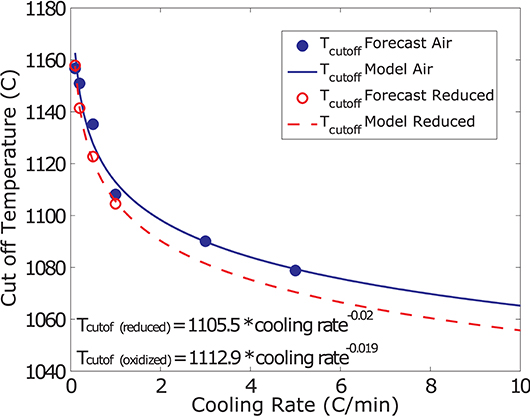
Figure 5. T cutoff as a function of cooling-rate for varying f O2. Blue filled and red open circles represent the forecasted values for oxidizing and reducing conditions, respectively. The blue solid and red dashed lines represent the power law model fitted to these data describing Tcutoff as a function of cooling rate for oxidizing and reducing conditions, respectively.
Post Experiment Sample Texture and Phase Assembly
After all rheological experiments, the furnace is turned off and the sample remained in the furnace during cooling, where it partially crystallized. This sample was prepared to investigate the nature of the growing crystals. Reflected light photomicrographs shown in Figure 6 reveal that the crystal habits are acicular, dendritic to fibrous and the crystals form low aspect ratio, “snowflake” type, clusters of 15–50 micron diameter. Note that the sample crystalized in the absence of deformation, which affects the crystal habit and thus, the crystals show dendritic rather than euhedral growth (Kouchi et al., 1986; Vona and Romano, 2013; Kolzenburg et al., 2018b). This sample is used because in-situ textural investigations of samples from disequilibrium crystallization experiments are not possible to date due to the fact that the sample crystallizes at very high rates during extraction from the furnace. Thus, the texture observed in the sample recovered from the furnace after the experiment includes processes from the point of stopping the experiment through quenching to below the glass transition temperature. Real-time textural characterization would require high temporal resolution in-situ tomography. Hence the textures shown here represent the no-shear end member. The composition of the growing phases was investigated using energy dispersive spectroscopy (EDS), and the crystal clusters were identified as clinopyroxene, intergrown with small amounts of plagioclase and small, dispersed oxide phases. This is consistent with the phase assembly modeled using MELTS software (Gualda and Ghiorso, 2015) for this composition when crystallizing at equilibrium conditions.
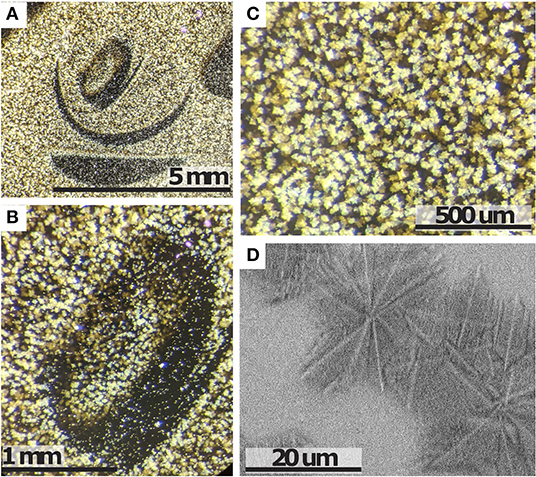
Figure 6. Textural characteristics of the sample extracted from the furnace after rheological experimentation. (A–C) Reflected light photomicrographs at increasing magnification. The textures in (A,B) are a result of distortion of the melt upon extraction of the spindle from the sample. Crystal habits are acicular, dendritic to fibrous and the crystals form low aspect ratio, “snowflake” type, clusters. (D) Close up of a back-scattered electron (BSE) photomicrograph of the crystal clusters.
Discussion
Deducing Disequilibrium Crystallization Kinetics
As outlined in the previous section, direct textural ties between the relative viscosity data and crystal content or shape are not currently possible in these experiments. This is because the rapid nucleation and growth rates, which also vary with decreasing temperature, do not allow recovery of representative samples during or after the dynamic cooling experiment. However, the decrease in Tcutoff (i.e., the point where the melt effectively solidifies) with increasing cooling rate is a direct result of changes in crystal-nucleation and -growth kinetics. These vary with the rate at which the sample is driven into undercooling (Kolzenburg et al., 2016, 2018a). Since the relative viscosity increase shown in Figure 3B results purely from increasing crystal content, these data allow for the deduction of crystal volume fraction in dynamic temperature space.
A number of models have been proposed that describe the relative viscosity of a particle suspension as a function of particle volume fraction, particle shape, and the surface nature of the particles. For a detailed review see for example Mader et al. (2013). The proposed models can be separated into tree general shapes: (1) small, linear or curvilinear, increase in ηr as a function of crystal volume fraction (Φ) (Einstein, 1906; Guth and Gold, 1938; Vand, 1948), (2) variably complex forms of an exponential increase in ηr with Φ to effective solidification at the maximum particle packing fraction (Φm) (Eilers, 1941; Maron and Pierce, 1956; Krieger and Dougherty, 1959; Chong et al., 1971; Faroughi and Huber, 2015; Moitra and Gonnermann, 2015), and (3) sigmoidal increase in ηr with Φ that include an initial exponential part and kink point at Φ ~ Φm (Costa et al., 2009; Liu et al., 2017). Equations of the first type have proven unreliable to describe ηr beyond the dilute regime (Φ>0.3), while equations of the second type have been shown to provide good descriptions of particle suspension rheology up to Φ ~ 0.8 * Φm. Here we use the equation proposed by Maron and Pierce (1956) to deduce the evolution of crystal volume fraction in the sample during the experiment, as this represents the simplest of the available models that is capable to describe the observed acceleration in relative viscosity. It takes the form of:
We couple this model to the Φm model for rough particles presented in Mueller et al. (2011):
Where Φm1 is the maximum packing fraction for equant particles, which is reported by Mueller et al. (2011) as 0.656 and 0.55 for smooth and rough particles, respectively; b is a fitting parameter equal to 1.08 and 1 for smooth and rough particles, respectively. rp is the aspect ratio defined as , where la is the particle's axis of rotational symmetry and lb is its maximum length perpendicular to that. In this treatment, non-spherical particles are approximated as prolate/oblate spheroids or cylinders (Mueller et al., 2011).
The sample recovered after the last experiment shows spherulitic, radial growth of acicular crystals that form clusters with aspect ratios ~1 (see Figure 6). Stoichiometric analysis of the EDS data revealed that the crystallizing phases are dominantly clinopyroxene inter-grown with small amounts of plagioclase. Higher aspect ratio, euhedral crystals may form at lower cooling rates and lower degree of undercooling (Vona and Romano, 2013; Chevrel et al., 2015; Vetere et al., 2015) or during constant cooling at high shear rates (Kouchi et al., 1986; Vona and Romano, 2013; Kolzenburg et al., 2018b) but aspect ratios > 5 are rarely achieved. We thus assume a range of feasible particle aspect ratios of 1–5.
Figures 7A,B show an example of the evolution of crystal volume fraction deduced from the rheological data as a function of temperature and time, respectively. The data show that for smaller aspect ratios, a somewhat higher crystal volume fraction is required to produce the same rheological response as calculated for higher aspect ratio particles, reflecting the effect of particle shape on the maximum packing fraction (Mueller et al., 2011). However, the difference between the crystal volume fractions calculated for aspect ratios of 1–5 is small (± ~5 % of the mean value), indicating that the uncertainty in crystallization kinetics deduced from the rheological data is small. For comparison we also plot the temperature dependent crystallization path predicted using MELTS software for crystallization at the NNO and QFM+1 buffers (Gualda and Ghiorso, 2015). At eruptive temperatures, oxygen fugacities of basaltic lavas and shallow magmatic systems range from logfO2 = −7 to −11 (QFM −1 to (NNO) buffer) (Hamilton et al., 1964; Markl et al., 2010; Mollo et al., 2015). Once erupted on the surface, the melts are exposed to oxidizing conditions and fO2 increases toward atmospheric values. This would shift the equilibrium curves to progressively higher temperatures.
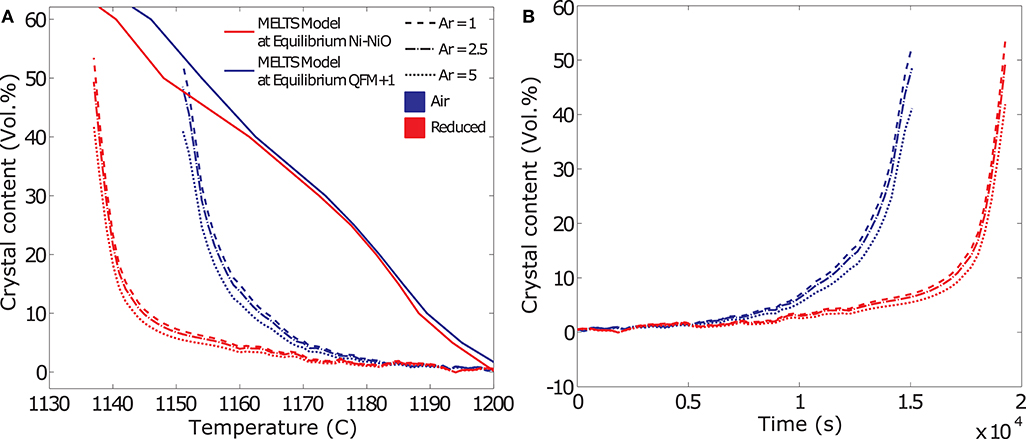
Figure 7. Results from the deduction of the crystallization kinetics from rheological data. The data shown in these example plots are from dynamic crystallization experiments at a cooling rate of 0.2 K/min. (A) Evolution of crystal volume fraction deduced from the rheological data as a function of temperature and comparison to equilibrium models at the Ni-NiO and QFM+1 buffers. Crystal fraction (Φ) reconstructed for aspect ratios and resulting Φm of 1–5. (B) Evolution of crystal volume fraction deduced from the rheological data as a function of time.
In order to deduce the volumetric crystallization rate, we evaluate the crystal volume derived from the experimental data as a function of time. An example of this evaluation that allows tracking the volumetric crystallization rate is plotted in Figure 7B. After an initial, slow, increase in crystal volume fraction, the crystallization rate accelerates as the melt reaches higher degrees of undercooling and reach maximum values as they approach Tcutoff.
For an analysis of the changes in crystallization rate as a function of the experimental conditions we evaluate the average and maximum crystallization rates of all experiments, reconstructed for an aspect ratio of 2.5. Average crystallization rates represent the mean slope of the curve in in Φ – t space (Figure 7B), whereas maximum crystallization rates represent the steepest slope in 8 – t space, as the sample approaches Tcutoff. Note that, while the deduced volumetric crystallization rates vary depending on the assumed crystal aspect ratio, the overall process kinetics remain unchanged. The results of this analysis are plotted for average and maximum crystallization rates in Figures 8A,B, respectively. At cooling rates <1 K/min, both average and maximum volumetric crystallization growth rates increase with increasing cooling rate and hence increasing degree of undercooling independent of fO2 conditions. While time averaged crystallization rates are similar at both oxidizing and reducing conditions, maximum crystallization rates are higher at low fO2, reflecting the later onset but faster acceleration of the viscosity signal discussed for the data plotted in Figure 3. For measurements in air, this trend continues up to the highest measured cooling rate. At reducing conditions, however, cooling rates > 1 K/min suppress crystallization, resulting in a decrease of both average and maximum crystallization rates. This departure marks the onset of the transition from crystallization driven solidification to glass formation.
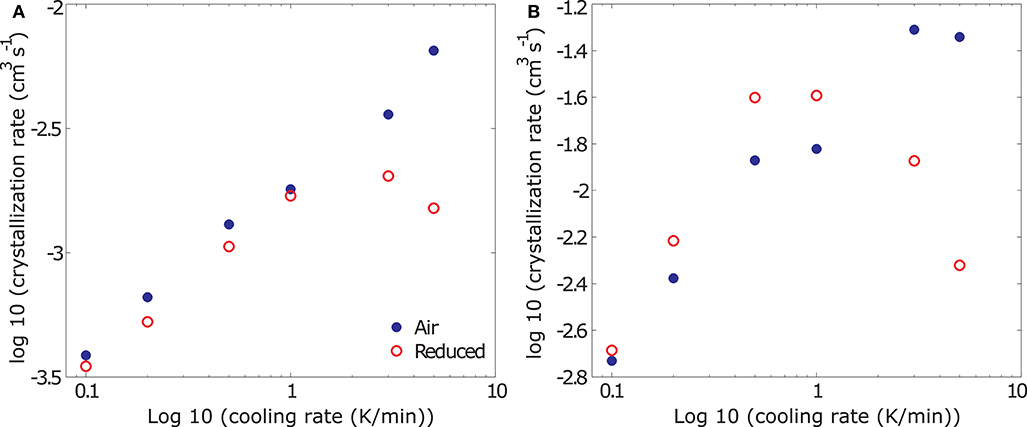
Figure 8. Results from the deduction of average (A) and maximum (B) volumetric crystallization rates from rheological data presented in log-log space. At cooling rates <1 K/min, average crystallization rates (A) are similar independent of fO2 conditions, at cooling rates >1 K/min, the average crystallization rates under reduced conditions drastically decreases - indicating the initiation of glass formation rather than crystallization. At cooling rates <1 K/min, maximum crystallization rates (B) increase with decreasing fO2 and are higher than those measured in air, whereas at cooling rates >1 K/min, maximum crystallization rates plummet under reducing conditions in a similar way as the average crystallization rates.
Conversely to the results from standard crystallization experiments, that only allow to assess the time averaged growth rates of crystals between the liquidus temperature and the end of the experiment when the sample is quenched, the approach presented here allows to track the dynamics of the crystallization process in time and temperature space. This highlights the potential for rheology derived evaluations to provide insights into process dynamics that are not assessable in standard techniques for measuring the crystallization kinetics of silicate melts. Further, it allows tracking the onset and systematics of the transition from crystallization to glass formation of silicate melts.
Implications for Lava Flow Emplacement
Measured cooling rates in basaltic lavas range from 0.01 to 15 K/min (Flynn and Mouginis-Mark, 1992; Hon et al., 1994; Witter and Harris, 2007; Kolzenburg et al., 2017). They are lowest in the well-insulated transport system (e.g., lava tubes or channels) and increase sharply once the lava leaves this transport system during late stages of flow (i.e., near the flow front or at breakouts). Therefore, the lower cooling rates are most representative of the dominant flow phase. The experiments carried out in this study thus expand the available rheological database at disequilibrium conditions to cooling rates applicable to a broader spectrum of emplacement conditions (down to 0.1 K/min). The data show that the correlation of increasing Tcutoff with decreasing cooling rate remains systematic and follows a power-law trend (Figure 5).
Lava flows (with a wide range of compositions from basaltic, trachybasaltic to phono-trachitic) are a common feature throughout the PVD and nearby volcanic centers. Examples include: Procida and Ventotene Islands (D'antonio et al., 1999a; de Astis et al., 2004), Astroni Volcano, (Isaia et al., 2004), the Monte Nuovo eruption (Di Vito et al., 1987), and Vesuvius (Civetta et al., 2004; Principe et al., 2004; Scandone et al., 2008). Thus, incorporating the presented Tcutoff model in numerical lava-flow emplacement models will allow more accurate prediction of lava flow emplacement in the PVD and anywhere that lavas of similar composition are erupted. As such, the rheological data presented here, and the derived Tcutoff models enable evaluation of the maximum emplacement rates and flow distances of PVD lavas; both key parameters for accurate assessment of volcanic risk and for the development of civil protection strategies in the densely populated PVD.
Further, and more generally, the data allow for the concept of a lava yield strength to be replaced by a Tcutoff model that is melt specific and dependent on composition, shear- and cooling-rate (Kolzenburg et al., 2016, 2018a,b). Yield strength or other arbitrary or empirical parameters like assumed crystal content, temperature or lava undercooling were previously used in numerical simulations of lava flows (see Miyamoto and Sasaki, 1997 and Harris et al., 2015 referenced therein) in order to ascribe a halting criterion to a modeled lava parcel. Yield strength is also used for the derivation of rheological parameters from lava flow morphology in planetary sciences. The latter approach is derived from analog material experiments e.g. (Hulme, 1974; Fink and Griffiths, 1990). This is, however, problematic, as this method does not account for the very common process of lava flow inflation, as demonstrated in Kolzenburg et al. (2018c). The presented Tcutoff data are therefore a more realistic description of the lavas rheology and therewith serve to more accurately constrain the results of lava flow emplacement models in general.
Implications for Magma Interaction
Aphanitic textures in basaltic melts quenched against more evolved magma or crystal mushes are ubiquitous in the geological record (Wager and Bailey, 1953; Wiebe, 1993a). In some areas these contacts preserve extremely fine grained textures in the basalt and, thus document high cooling rates; see (Wiebe, 2016) and references therein. This highlights that rapid, cooling induced, changes in magma rheology play a fundamental role in guiding the efficacy of magma mingling and –mixing, therewith contributing to driving a magmatic system from a quiescent to a potentially supercritical system—poised for eruption. Further, this documents that magma mixing and mingling most frequently occurs at sub liquidus temperatures and, hence, super liquidus magma interaction and mixing experiments only serve to delineate the fastest possible mixing timescales. Magma mixing and mingling in natural settings act at lower temperatures (i.e., on longer timescales) and involve more complex processes (i.e., crystallization and the resulting physical and chemical changes and not only diffusion). The results presented here show that cooling rate is the most important parameter in determining when (i.e., in temperature space) and how (crystallization vs. glass formation) solidification, and therewith heat and volatile transfer, occurs during cooling of basaltic melts.
Additionally, the thermal and mechanical state of the magma or mush that the basalt quenches against is equally important in driving this interaction. If the magma is crystal poor and thus relatively low in viscosity, the basaltic intrusion may disperse and form enclaves, such as proposed in for example Wiebe et al. (1997) or Rooyakkers et al. (2018) and references therein. This will generate globular, high surface to volume ratio, enclaves and therewith rapid cooling rates. As a result, solidification of the basalt as well as heat and volatile transfer into the evolved magma will be rapid. If, on the other hand, the magma is crystal-rich and rheologically locked, propagation of the intruding basalt will follow a dike- or sill-like geometry, akin to the propagation of low viscosity gas in mushes (Oppenheimer et al., 2015; Suckale et al., 2016). Upon encountering more liquid like lenses in the mush, these dikes may spread within the liquid lenses, forming pāhoehoe like basaltic “magma-flows” within the storage system (Wiebe, 1993a,b, 2016). Intrusion in dike and “magma-flow” geometries generates well-insulated crusts at the contact interface and can significantly prolong the solidification, and therewith heat- and volatile transfer, times for the intruding basalt.
Limitations on the Applicability of the Presented Data
The data, discussion and the derived models presented above provide tools to modeling disequilibrium transport conditions in magmatic systems. It is however important to highlight the parameter space in which these are applicable in order to ensure that any results derived from these models describe meaningful geological processes.
Extrapolation of the Tcutoff models presented in Figure 5 suggests that higher cooling rates would result in a decreasing effect of cooling rate on Tcutoff, whereas lower cooling rates would further increase Tcutoff. Since the Tcutoff model describes a crystallization induced threshold, it is important to highlight that it is only applicable at disequilibrium conditions (i.e., under constant cooling rates) and sub-liquidus temperatures. This Tcutoff model is bound by two distinct thermodynamic points: (1) the melts' liquidus temperature at the high temperature end, above which no crystallization occurs and (2) the melts' glass transition temperature (Tg) at the low temperature end, where solidification occurs by glass formation, not crystallization. This means, that at lower cooling rates than measured here, the Tcutoff model is bound by the temperature at which the crystal content is equal to the maximum packing fraction Φm at equilibrium conditions (i.e., the equilibrium solidification limit), which is a function of the crystal aspect ratio and polydispersity (Mueller et al., 2011; Klein et al., 2018). At higher cooling rates, solidification (i.e., Tcutoff) is no longer brought forth by crystallization but crossing of the glass transition temperature. Here the material will solidify without significant crystallization and may remain in the glassy state. High silica lavas are the most well-known examples of this limit where significant portions of the lava flow may quench to glass due to the drastic difference between crystallization- and cooling-rates even at very high degrees of undercooling (Iezzi et al., 2008a,b; Vetere et al., 2015; Rusiecka et al., 2020).
Further, when interpreting the data with respect to nature, it has to be noted that both pressure and volatile activity (e.g., aH2O and aCO2) affect the crystallization-dynamics of the melt and, therewith, its rheological evolution. The presented experiments are performed on vesicle-free melts at ambient pressure. With respect to the pure melt viscosity, aH2O has the largest effect, and addition of only a few weight percent of water may decrease Tg by over 100 degrees and viscosity by up to 6 log units in rhyolites and 1.5 log units for basalts (Dingwell et al., 1996; Robert et al., 2008; Di Genova et al., 2014). Shear-rate also influences the crystallization kinetics of lavas, as shown recently for both isothermal (Vona and Romano, 2013; Vetere et al., 2017) and non-isothermal experiments (Kolzenburg et al., 2017, 2018b). To rigorously constrain the magnitude of this effect, however, requires expanded experimental datasets that are unavailable to date. A higher water content also shifts the crystallization onset to lower temperatures, which is well-known from static crystallization experiments, (e.g., Hamilton et al., 1964; Davis et al., 1997; Arzilli and Carroll, 2013). Hence decreasing Tcutoff. Increasing pressure may change both the crystallization-onset and -sequence (e.g., Hammer, 2008; Gualda et al., 2012; Arzilli and Carroll, 2013). To date, however, no infrastructure exists to investigate these effects experimentally in rheological measurements. The presented data thus describe the dry, low pressure, end member of dynamic magma rheology.
Conclusions
Based on the data presented above and the accompanying analytical results and discussion we draw the following conclusions:
• Disequilibrium conditions affect Tcutoff and, therewith, lava flow length as well as melt-mush interactions in magmatic systems.
• Varing oxygen fugacity affects both the lavas crystallization kinetics and Tcutoff. Specifically, more oxidizing conditions increase Tcutoff and lower peak crystallization rates.
• Tcutoff can be predicted via a modified FFM (failure forecasting method) and the derived solidification models may be employed in models of lava flow emplacement and magma ascent dynamics that aim to include the melts' thermorheological properties.
• The presented data contribute to a growing database of the temperature dependent viscosity of crystallizing lavas and magmas in dynamic temperature–, shear-rate–, and f O2-space needed to accurately constrain physical property based lava flow and magma mixing models.
• The rheological evolution of basalts during intrusion into cold mush zones dictates emplacement geometry and, therewith efficiency of heat and volatile transfer.
• Disequilibrium crystallization kinetics can be derived from rheological data and allow to track the dynamics of the crystallization process in time and temperature space. This provides insights into process dynamics that are not assessable in standard techniques for measuring crystallization kinetics.
• Future studies need to systematically address the effect of pressure to expand disequilibrium rheology models to magmatic conditions.
Data Availability Statement
All datasets generated for this study are included in the article/supplementary material.
Author Contributions
SK, KB, and DD conceptualized the study. K-UH performed the DSC measurements and data analyses. SK performed the viscometry experiments, data analyses and wrote the manuscript, to which all authors have contributed.
Funding
SK acknowledges the support of a H2020 Marie Skłodowska-Curie fellowship DYNAVOLC—No.795044. The presented research was partially funded by an ERC Advanced Investigator Grant (EVOKES—No. 247076) to DD. DD acknowledges the support of ERC 2018 Advanced Grant 834225 (EAVESDROP).
Conflict of Interest
The authors declare that the research was conducted in the absence of any commercial or financial relationships that could be construed as a potential conflict of interest.
Acknowledgments
We would like to thank Werner Ertel–Ingrisch, Dirk Mueller, and Antonia Wimmer for support in the laboratory and interesting discussions during the experimental campaign. We would further like to thank Cristina De Campos and Ilenia Arienzo for interesting discussions on the Campi Flegrei volcanic system. Erin Gibbons and Catherine Crotty are thanked for support during the Phenom SEM analyses. We thank Joshua Kastner for discussions on the data processing part of the manuscript. We further thank GI for the editorial handling, as well as LC and FA for their constructive comments that helped to improve this contribution.
References
Arienzo, I., Civetta, L., D'antonio, M., Di Vito, M. A., Moretti, R., Orsi, G., et al. (2010a). “The pomici principali eruption: a 10.3 ka old Plinian event in the Campi Flegrei caldera (Italy),” in EGU General Assembly Conference Abstracts (Vienna).
Arienzo, I., Moretti, R., Civetta, L., Orsi, G., and Papale, P. (2010b). The feeding system of Agnano–Monte Spina eruption (Campi Flegrei, Italy): dragging the past into present activity and future scenarios. Chem. Geol. 270, 135–147. doi: 10.1016/j.chemgeo.2009.11.012
Arzilli, F., and Carroll, M. R. (2013). Crystallization kinetics of alkali feldspars in cooling and decompression-induced crystallization experiments in trachytic melt. Contrib. Miner. Petrol. 166, 1011–1027. doi: 10.1007/s00410-013-0906-1
Blake, S., and Fink, J. H. (2000). On the deformation and freezing of enclaves during magma mixing. J. Volcanol. Geother. Res. 95, 1–8. doi: 10.1016/S0377-0273(99)00129-8
Blake, S., and Ivey, G. N. (1986). Magma-mixing and the dynamics of withdrawal from stratified reservoirs. J. Volcanol. Geother. Res. 27, 153–178. doi: 10.1016/0377-0273(86)90084-3
Bruce, P. M., and Huppert, H. E. (1990). Solidification and melting along dykes by the laminar flow of basaltic magma. Magma Transport Storage 57, 87–101.
Campagnola, S., Vona, A., Romano, C., and Giordano, G. (2016). Crystallization kinetics and rheology of leucite-bearing tephriphonolite magmas from the Colli Albani volcano (Italy). Chem. Geol. 424, 12–29. doi: 10.1016/j.chemgeo.2016.01.012
Cannatelli, C., Lima, A., Bodnar, R., de Vivo, B., Webster, J., and Fedele, L. (2007). Geochemistry of melt inclusions from the Fondo Riccio and Minopoli 1 eruptions at Campi Flegrei (Italy). Chem. Geol. 237, 418–432. doi: 10.1016/j.chemgeo.2006.07.012
Chevrel, M. O., Cimarelli, C., Debiasi, L., Hanson, J. B., Lavallée, Y., Arzilli, F., et al. (2015). Viscosity measurements of crystallizing andesite from Tungurahua volcano (Ecuador). Geochem. Geophys. Geosyst. 16, 870–889. doi: 10.1002/2014GC005661
Chevrel, M. O., Giordano, D., Potuzak, M., Courtial, P., and Dingwell, D. B. (2013). Physical properties of CaAl2Si2O8-CaMgSi2O6-FeO–Fe2O3 melts: analogues for extra-terrestrial basalt. Chem. Geol. 346, 93–105. doi: 10.1016/j.chemgeo.2012.09.004
Chong, J., Christiansen, E., and Baer, A. (1971). Rheology of concentrated suspensions. J. Appl. Polym. Sci. 15, 2007–2021. doi: 10.1002/app.1971.070150818
Civetta, L., D'antonio, M., De Lorenzo, S., Di Renzo, V., and Gasparini, P. (2004). Thermal and geochemical constraints on the ‘deep'magmatic structure of Mt. Vesuvius. J. Volcanol. Geother. Res. 133, 1–12. doi: 10.1016/S0377-0273(03)00387-1
Civetta, L., Orsi, G., Pappalardo, L., Fisher, R. V., Heiken, G., and Ort, M. (1997). Geochemical zoning, mingling, eruptive dynamics and depositional processes — the Campanian Ignimbrite, Campi Flegrei caldera, Italy. J. Volcanol. Geother. Res. 75, 183–219. doi: 10.1016/S0377-0273(96)00027-3
Costa, A., Caricchi, L., and Bagdassarov, N. (2009). A model for the rheology of particle-bearing suspensions and partially molten rocks. Geochem. Geophys. Geosyst. 10:2138. doi: 10.1029/2008GC002138
Costa, A., and Macedonio, G. (2005). Computational modeling of lava flows: a review. Geol. Soc. Am. Special Pap. 396, 209–218. doi: 10.1130/0-8137-2396-5.209
D'antonio, M., Civetta, L., and Di Girolamo, P. (1999a). Mantle source heterogeneity in the Campanian Region (South Italy) as inferred from geochemical and isotopic features of mafic volcanic rocks with shoshonitic affinity. Mineral. Petrol. 67, 163–192. doi: 10.1007/BF01161520
D'antonio, M., Civetta, L., Orsi, G., Pappalardo, L., Piochi, M., Carandente, A., et al. (1999b). The present state of the magmatic system of the Campi Flegrei caldera based on a reconstruction of its behavior in the past 12 ka. J. Volcanol. Geother. Res. 91, 247–268. doi: 10.1016/S0377-0273(99)00038-4
Davis, M. J., Ihinger, P. D., and Lasaga, A. C. (1997). Influence of water on nucleation kinetics in silicate melt. J. Non Cryst. Solids 219, 62–69. doi: 10.1016/S0022-3093(97)00252-4
de Astis, G., Pappalardo, L., and Piochi, M. (2004). Procida volcanic history: new insights into the evolution of the Phlegraean Volcanic District (Campania region, Italy). Bull. Volcanol. 66, 622–641. doi: 10.1007/s00445-004-0345-y
Di Genova, D., Romano, C., Alletti, M., Misiti, V., and Scarlato, P. (2014). The effect of CO2 and H2O on Etna and Fondo Riccio (Phlegrean Fields) liquid viscosity, glass transition temperature and heat capacity. Chem. Geol. 377, 72–86. doi: 10.1016/j.chemgeo.2014.04.001
Di Matteo, V., Mangiacapra, A., Dingwell, D., and Orsi, G. (2006). Water solubility and speciation in shoshonitic and latitic melt composition from Campi Flegrei Caldera (Italy). Chem. Geol. 229, 113–124. doi: 10.1016/j.chemgeo.2006.01.015
Di Vito, M., Isaia, R., Orsi, G., Southon, J., D'antonio, M., de Vita, S., et al. (1999). Volcanic and deformation history of the Campi Flegrei caldera in the past 12 ka. J. Volcanol. Geotherm. Res. 91, 221–246. doi: 10.1016/S0377-0273(99)00037-2
Di Vito, M., Lirer, L., Mastrolorenzo, G., and Rolandi, G. (1987). The 1538 Monte Nuovo eruption (Campi Flegrei, Italy). Bull. Volcanol. 49, 608–615. doi: 10.1007/BF01079966
Dingwell, B. D., Romano, C., and Hess, K.-U. (1996). The effect of water on the viscosity of a haplogranitic melt under P-T-X conditions relevant to silicic volcanism. Contribut. Mineral. Petrol. 124, 19–28. doi: 10.1007/s004100050170
Dingwell, D. B., and Virgo, D. (1987). The effect of oxidation state on the viscosity of melts in the system Na2O-FeO-Fe2O3-SiO2. Geochim. Cosmochim. Acta 51, 195–205. doi: 10.1016/0016-7037(87)90231-6
Eichelberger, J. C., Chertkoff, D. G., Dreher, S. T., and Nye, C. J. (2000). Magmas in collision: rethinking chemical zonation in silicic magmas. Geology 28, 603–606. doi: 10.1130/0091-7613(2000)28<603:MICRCZ>2.0.CO;2
Eilers, V. H. (1941). Die viskosität von emulsionen hochviskoser stoffe als funktion der konzentration. Kolloid-Zeitschrift 97, 313–321. doi: 10.1007/BF01503023
Einstein, A. (1906). Eine neue bestimmung der moleküldimensionen. Ann. Phys. 324, 289–306. doi: 10.1002/andp.19063240204
Esposito, R., Bodnar, R., Danyushevsky, L., de Vivo, B., Fedele, L., Hunter, J., et al. (2011). Volatile evolution of magma associated with the Solchiaro eruption in the Phlegrean Volcanic District (Italy). J. Petrol. 52, 2431–2460. doi: 10.1093/petrology/egr051
Faroughi, S. A., and Huber, C. (2015). A generalized equation for rheology of emulsions and suspensions of deformable particles subjected to simple shear at low Reynolds number. Rheologica Acta 54, 85–108. doi: 10.1007/s00397-014-0825-8
Favalli, M., Chirico, G., Papale, P., Pareschi, M., Coltelli, M., Lucaya, N., et al. (2006). Computer simulations of lava flow paths in the town of Goma, Nyiragongo volcano, Democratic Republic of Congo. J. Geophys. Res. Solid Earth 111:6202. doi: 10.1029/2004JB003527
Fedele, L., Morra, V., Perrotta, A., and Scarpati, C. (2006). Volcanological and geochemical features of the products of the Fiumicello eruption, Procida island, Campi Flegrei (Southern Italy). Periodico Mineral. 75, 43–72.
Fink, J. H., and Griffiths, R. W. (1990). Radial spreading of viscous-gravity currents with solidifying crust. J. Fluid Mech. 221, 485–509. doi: 10.1017/S0022112090003640
Flynn, L. P., and Mouginis-Mark, P. J. (1992). Cooling rate of an active Hawaiian lava flow from nighttime spectroradiometer measurements. Geophys. Res. Lett. 19, 1783–1786. doi: 10.1029/92GL01577
Forni, F., Degruyter, W., Bachmann, O., de Astis, G., and Mollo, S. (2018). Long-term magmatic evolution reveals the beginning of a new caldera cycle at Campi Flegrei. Sci. Adv. 4:eaat9401. doi: 10.1126/sciadv.aat9401
Giordano, D., Polacci, M., Longo, A., Papale, P., Dingwell, D.B., Boschi, E., et al. (2007). Thermo-rheological magma control on the impact of highly fluid lava flows at Mt. Nyiragongo. Geophys. Res. Lett. 34:6301. doi: 10.1029/2006GL028459
Giordano, D., Potuzak, M., Romano, C., Dingwell, D. B., and Nowak, M. (2008b). Viscosity and glass transition temperature of hydrous melts in the system CaAl2Si2O8?CaMgSi2O6. Chem. Geol. 256, 203–15. doi: 10.1016/j.chemgeo.2008.06.027
Giordano, D., Russell, J. K., and Dingwell, D. B. (2008a). Viscosity of magmatic liquids: a model. Earth Planet. Sci. Lett. 271, 123–134. doi: 10.1016/j.epsl.2008.03.038
González-García, D., Behrens, H., Petrelli, M., Vetere, F., Morgavi, D., Zhang, C., et al. (2017). Water-enhanced interdiffusion of major elements between natural shoshonite and high-K rhyolite melts. Chem. Geol. 466, 86–101. doi: 10.1016/j.chemgeo.2017.05.023
Gottsmann, J., Giordano, D., and Dingwell, D. B. (2002). Predicting shear viscosity during volcanic processes at the glass transition: a calorimetric calibration. Earth Planet. Sci. Lett. 198, 417–427. doi: 10.1016/S0012-821X(02)00522-8
Griffiths, R. W., Kerr, R. C., and Cashman, K. V. (2003). Patterns of solidification in channel flows with surface cooling. J. Fluid Mech. 496, 33–62. doi: 10.1017/S0022112003006517
Gualda, G. A., and Ghiorso, M. S. (2015). MELTS_excel: a microsoft excel-based MELTS interface for research and teaching of magma properties and evolution. Geochem. Geophys. Geosyst. 16, 315–324. doi: 10.1002/2014GC005545
Gualda, G. A., Ghiorso, M. S., Lemons, R. V., and Carley, T. L. (2012). Rhyolite-MELTS: a modified calibration of MELTS optimized for silica-rich, fluid-bearing magmatic systems. J. Petrol. 53, 875–890. doi: 10.1093/petrology/egr080
Guth, E., and Gold, O. (1938). Viscosity and electroviscous effect of the AgI sol. II. Influence of the concentration of AgI and of electrolyte on the viscosity. Phys. Rev 53:322.
Hamilton, D., Burnham, C. W., and Osborn, E. (1964). The solubility of water and effects of oxygen fugacity and water content on crystallization in mafic magmas. J. Petrol. 5, 21–39. doi: 10.1093/petrology/5.1.21
Hammer, J. E. (2008). Experimental studies of the kinetics and energetics of magma crystallization. Rev. Miner. Geochem. 69, 9–59. doi: 10.2138/rmg.2008.69.2
Harris, A. J., Rhéty, M., Gurioli, L., Villeneuve, N., and Paris, R. (2015). Simulating the thermorheological evolution of channel-contained lava: FLOWGO and its implementation in EXCEL. Geol. Soc. London Special Publ. 426:SP426.429. doi: 10.1144/SP426.9
Herault, A., Vicari, A., Ciraudo, A., and Del Negro, C. (2009). Forecasting lava flow hazards during the 2006 Etna eruption: using the MAGFLOW cellular automata model. Comput. Geosci. 35, 1050–1060. doi: 10.1016/j.cageo.2007.10.008
Hon, K., Kauahikaua, J., Denlinger, R., and Mackay, K. (1994). Emplacement and inflation of pahoehoe sheet flows: observations and measurements of active lava flows on Kilauea Volcano, Hawaii. Geol. Soc. Am. Bull. 106, 351–370. doi: 10.1130/0016-7606(1994)106<0351:EAIOPS>2.3.CO;2
Hulme, G. (1974). The interpretation of lava flow morphology. Geophys. J. Int. 39, 361–383. doi: 10.1111/j.1365-246X.1974.tb05460.x
Iezzi, G., Mollo, S., Torresi, G., Ventura, G., Cavallo, A., and Scarlato, P. (2011). Experimental solidification of an andesitic melt by cooling. Chem. Geol. 283, 261–273. doi: 10.1016/j.chemgeo.2011.01.024
Iezzi, G., Mollo, S., and Ventura, G. (2008a). “Solidification behaviour of natural silicate melts and volcanological implications,“ in New Research on Volcanoes: Formation, Eruptions and Modeling (Hauppauge, NY: Nova Science Publishers, Inc.).
Iezzi, G., Mollo, S., Ventura, G., Cavallo, A., and Romano, C. (2008b). Experimental solidification of anhydrous latitic and trachytic melts at different cooling rates: the role of nucleation kinetics. Chem. Geol. 253, 91–101. doi: 10.1016/j.chemgeo.2008.04.008
Isaia, R., D'antonio, M., Dell'erba, F., Di Vito, M., and Orsi, G. (2004). The Astroni volcano: the only example of closely spaced eruptions in the same vent area during the recent history of the Campi Flegrei caldera (Italy). J. Volcanol. Geother. Res. 133, 171–192. doi: 10.1016/S0377-0273(03)00397-4
Isaia, R., Marianelli, P., and Sbrana, A. (2009). Caldera unrest prior to intense volcanism in Campi Flegrei (Italy) at 4.0 ka BP: implications for caldera dynamics and future eruptive scenarios. Geophys. Res. Lett. 36:513. doi: 10.1029/2009GL040513
Ishibashi, H., and Sato, H. (2007). Viscosity measurements of subliquidus magmas: Alkali olivine basalt from the Higashi-Matsuura district, Southwest Japan. J. Volcanol. Geother. Res. 160, 223–238. doi: 10.1016/j.jvolgeores.2006.10.001
Kilburn, C. R. J., De Natale, G., and Carlino, S. (2017). Progressive approach to eruption at Campi Flegrei caldera in southern Italy. Nat. Commun. 8:15312. doi: 10.1038/ncomms15312
Klein, J., Mueller, S. P., Helo, C., Schweitzer, S., Gurioli, L., and Castro, J. M. (2018). An expanded model and application of the combined effect of crystal-size distribution and crystal shape on the relative viscosity of magmas. J. Volcanol. Geother. Res. 357, 128–133. doi: 10.1016/j.jvolgeores.2018.04.018
Kolzenburg, S., Di Genova, D., Giordano, D., Hess, K. U., and Dingwell, D. B. (2018a). The effect of oxygen fugacity on the rheological evolution of crystallizing basaltic melts. Earth Planet. Sci. Lett. 487, 21–32. doi: 10.1016/j.epsl.2018.01.023
Kolzenburg, S., Giodano, D., Hess, K. U., and Dingwell, D. B. (2018b). Shear rate-dependent disequilibrium rheology and dynamics of basalt solidification. Geophys. Res. Lett. 45, 6466–6475. doi: 10.1029/2018GL077799
Kolzenburg, S., Giordano, D., Cimarelli, C., and Dingwell, D. B. (2016). In situ thermal characterization of cooling/crystallizing lavas during rheology measurements and implications for lava flow emplacement. Geochim. Cosmochim. Acta 195, 244–258. doi: 10.1016/j.gca.2016.09.022
Kolzenburg, S., Giordano, D., Di Muro, A., and Dingwell, D. B. (2019). Equilibrium viscosity and disequilibrium rheology of a high magnesium basalt from piton De La Fournaise volcano, La Reunion, Indian Ocean, France. Ann. Geophys. 62:218. doi: 10.4401/ag-7839
Kolzenburg, S., Giordano, D., Thordarson, T., Höskuldsson, A., and Dingwell, D. B. (2017). The rheological evolution of the 2014/2015 eruption at Holuhraun, central Iceland. Bull. Volcanol. 79:45. doi: 10.1007/s00445-017-1128-6
Kolzenburg, S., Jaenicke, J., Münzer, U., and Dingwell, D. B. (2018c). The effect of inflation on the morphology-derived rheological parameters of lava flows and its implications for interpreting remote sensing data - a case study on the 2014/2015 eruption at Holuhraun, Iceland. J. Volcanol. Geother. Res. 357, 200–212. doi: 10.1016/j.jvolgeores.2018.04.024
Kouchi, A., Tsuchiyama, A., and Sunagawa, I. (1986). Effect of stirring on crystallization kinetics of basalt: texture and element partitioning. Contribut. Mineral. Petrol. 93, 429–438. doi: 10.1007/BF00371713
Krieger, I. M., and Dougherty, T. J. (1959). A mechanism for non-Newtonian flow in suspensions of rigid spheres. Trans. Soc. Rheol. 3, 137–152. doi: 10.1122/1.548848
Laeger, K., Petrelli, M., Morgavi, D., Lustrino, M., Pimentel, A., Paredes-Mariño, J., et al. (2019). Pre-eruptive conditions and triggering mechanism of the~ 16 ka Santa Bárbara explosive eruption of Sete Cidades Volcano (São Miguel, Azores). Contribut. Mineral. Petrol. 174:11. doi: 10.1007/s00410-019-1545-y
Liu, Z., Pandelaers, L., Blanpain, B., and Guo, M. (2017). Viscosity of heterogeneous silicate melts: assessment of the measured data and modeling. ISIJ Int. 57, 1895–1901. doi: 10.2355/isijinternational.ISIJINT-2017-288
Lyman, A. W., and Kerr, R. C. (2006). Effect of surface solidification on the emplacement of lava flows on a slope. J. Geophys. Res. Solid Earth 111:B05206. doi: 10.1029/2005JB004133
Mader, H. M., Llewellin, E. W., and Mueller, S. P. (2013). The rheology of two-phase magmas: a review and analysis. J. Volcanol. Geotherm. Res. 257, 135–158. doi: 10.1016/j.jvolgeores.2013.02.014
Mangiacapra, A., Moretti, R., Rutherford, M., Civetta, L., Orsi, G., and Papale, P. (2008). The deep magmatic system of the Campi Flegrei caldera (Italy). Geophys. Res. Lett. 35:L21304. doi: 10.1029/2008GL035550
Markl, G., Marks, M. A., and Frost, B. R. (2010). On the controls of oxygen fugacity in the generation and crystallization of peralkaline melts. J. Petrol. 51, 1831–1847. doi: 10.1093/petrology/egq040
Maron, S. H., and Pierce, P. E. (1956). Application of Ree-eyring generalized flow theory to suspensions of spherical particles. J. Colloid Sci. 11, 80–95. doi: 10.1016/0095-8522(56)90023-X
Melluso, L., De'gennaro, R., Fedele, L., Franciosi, L., and Morra, V. (2012). Evidence of crystallization in residual, Cl–F-rich, agpaitic, trachyphonolitic magmas and primitive Mg-rich basalt–trachyphonolite interaction in the lava domes of the Phlegrean Fields (Italy). Geol. Mag. 149, 532–550. doi: 10.1017/S0016756811000902
Miyamoto, H., and Sasaki, S. (1997). Simulating lava flows by an improved cellular automata method. Comput. Geosci. 23, 283–292. doi: 10.1016/S0098-3004(96)00089-1
Moitra, P., and Gonnermann, H. M. (2015). Effects of crystal shape- and size-modality on magma rheology. Geochem. Geophys. Geosyst. 16:5554. doi: 10.1002/2014GC005554
Mollo, S., Giacomoni, P., Coltorti, M., Ferlito, C., Iezzi, G., and Scarlato, P. (2015). Reconstruction of magmatic variables governing recent Etnean eruptions: constraints from mineral chemistry and P–T–f O2-H2O modeling. Lithos 212, 311–320. doi: 10.1016/j.lithos.2014.11.020
Moretti, R., Arienzo, I., Di Renzo, V., Orsi, G., Arzilli, F., Brun, F., et al. (2019). Volatile segregation and generation of highly vesiculated explosive magmas by volatile-melt fining processes: the case of the Campanian Ignimbrite eruption. Chem. Geol. 503, 1–14. doi: 10.1016/j.chemgeo.2018.10.001
Morgavi, D., Arienzo, I., Montagna, C., Perugini, D., and Dingwell, D. B. (2019). “Magma mixing: history and dynamics of an eruption trigger,” in Volcanic Unrest : From Science to Society, eds J. Gottsmann, J. Neuberg, and B. Scheu (Cham: Springer International Publishing), 123–137. doi: 10.1007/11157_2017_30
Mueller, S., Llewellin, E. W., and Mader, H. M. (2011), The effect of particle shape on suspension viscosity implications for magmatic flows. Geophys. Res. Lett. 38:L13316. doi: 10.1029/2011GL047167
Mysen, B. O., Virgo, D., Neumann, E.-R., and Seifert, F. A. (1985). Redox equilibria and the structural states of ferric and ferrous iron in melts in the system CaO-MgO-Al2O3-SiO2-FeO; relationships between redox equilibria, melt structure and liquidus phase equilibria. Am. Mineral. 70, 317–331.
Oppenheimer, J., Rust, A., Cashman, K., and Sandnes, B. (2015). Gas migration regimes and outgassing in particle-rich suspensions. Front. Phys. 3:60. doi: 10.3389/fphy.2015.00060
Pallister, J. S., Hoblitt, R. P., Meeker, G. P., Knight, R. J., and Siems, D. F. (1996). Magma mixing at Mount Pinatubo: petrographic and chemical evidence from the 1991 deposits. Fire Mud 1, 687–731.
Pappalardo, L., Piochi, M., D'antonio, M., Civetta, L., and Petrini, R. (2002). Evidence for multi-stage magmatic evolution during the past 60 kyr at Campi Flegrei (Italy) deduced from Sr, Nd and Pb isotope data. J. Petrol. 43, 1415–1434. doi: 10.1093/petrology/43.8.1415
Principe, C., Tanguy, J., Arrighi, S., Paiotti, A., Goff, M., and Zoppi, U. (2004). Chronology of Vesuvius' activity from A.D. 79 to 1631 based on archeomagnetism of lavas and historical sources. Bull. Volcanol. 66, 703–724. doi: 10.1007/s00445-004-0348-8
Pritchard, C. J., Larson, P. B., Spell, T. L., and Tarbert, K. D. (2013). Eruption-triggered mixing of extra-caldera basalt and rhyolite complexes along the East Gallatin–Washburn fault zone, Yellowstone National Park, WY, USA. Lithos 175-176, 163–177. doi: 10.1016/j.lithos.2013.04.022
Robert, G., Russell, J. K., Giordano, D., and Romano, C. (2008). High-temperature deformation of volcanic materials in the presence of water. Am. Min. 93, 74–80. doi: 10.2138/am.2008.2665
Rooyakkers, S. M., Wilson, C. J., Schipper, C. I., Barker, S. J., and Allan, A. S. (2018). Textural and micro-analytical insights into mafic–felsic interactions during the Oruanui eruption, Taupo. Contribut. Mineral. Petrol. 173:35. doi: 10.1007/s00410-018-1461-6
Ruprecht, P., and Bachmann, O. (2010). Pre-eruptive reheating during magma mixing at Quizapu volcano and the implications for the explosiveness of silicic arc volcanoes. Geology 38, 919–922. doi: 10.1130/G31110.1
Rusiecka, M. K., Bilodeau, M., and Baker, D. R. (2020). Quantification of nucleation delay in magmatic systems: experimental and theoretical approach. Contribut. Mineral. Petrol. 175:47. doi: 10.1007/s00410-020-01682-4
Russell, J., Giordano, D., and Dingwell, D. (2003). High-temperature limits on viscosity of non-Arrhenian silicate melts. Am. Mineral. 88, 1390–1394. doi: 10.2138/am-2003-8-924
Sato, H. (2005). Viscosity measurement of subliquidus magmas:1707 basalt of Fuji volcano. J. Mineral. Petrol. Sci. 100, 133–142. doi: 10.2465/jmps.100.133
Scandone, R., Giacomelli, L., and Speranza, F. F. (2008). Persistent activity and violent strombolian eruptions at Vesuvius between 1631 and 1944. J. Volcanol. Geother. Res. 170, 167–180. doi: 10.1016/j.jvolgeores.2007.09.014
Soldati, A., Sehlke, A., Chigna, G., and Whittington, A. (2016). Field and experimental constraints on the rheology of arc basaltic lavas: the January 2014 Eruption of Pacaya (Guatemala). Bull. Volcanol. 78, 1–19. doi: 10.1007/s00445-016-1031-6
Sparks, R. S. J., and Marshall, L. A. (1986). Thermal and mechanical constraints on mixing between mafic and silicic magmas. J. Volcanol. Geother. Res. 29, 99–124. doi: 10.1016/0377-0273(86)90041-7
Sparks, S. R. J., Sigurdsson, H., and Wilson, L. (1977). Magma mixing: a mechanism for triggering acid explosive eruptions. Nature 267:315. doi: 10.1038/267315a0
Suckale, J., Keller, T., Cashman, K., and Persson, P. O. (2016). Flow-to-fracture transition in a volcanic mush plug may govern normal eruptions at Stromboli. Geophys. Res. Lett. 43, 12071-12081. doi: 10.1002/2016GL071501
Toplis, M., and Carroll, M. (1995). An experimental study of the influence of oxygen fugacity on Fe-Ti oxide stability, phase relations, and mineral—melt equilibria in ferro-basaltic systems. J. Petrol. 36, 1137–1170. doi: 10.1093/petrology/36.5.1137
Vand, V. (1948). Viscosity of solutions and suspensions. I. Theory. J. Phys. Chem. 52, 277–299. doi: 10.1021/j150458a001
Vetere, F., Iezzi, G., Behrens, H., Cavallo, A., Misiti, V., Dietrich, M., et al. (2013). Intrinsic solidification behaviour of basaltic to rhyolitic melts: a cooling rate experimental study. Chem. Geol. 354, 233–242. doi: 10.1016/j.chemgeo.2013.06.007
Vetere, F., Iezzi, G., Behrens, H., Holtz, F., Ventura, G., Misiti, V., et al. (2015). Glass forming ability and crystallisation behaviour of sub-alkaline silicate melts. Earth Sci. Rev. 150, 25–44. doi: 10.1016/j.earscirev.2015.07.001
Vetere, F., Murri, M., Alvaro, M., Domeneghetti, M.C., Rossi, S., Pisello, A., et al. (2019). Viscosity of pyroxenite melt and its evolution during cooling. J. Geophys. Res. Planets 124, 1451–1469. doi: 10.1029/2018JE005851
Vetere, F., Rossi, S., Namur, O., Morgavi, D., Misiti, V., Mancinelli, P., et al. (2017). Experimental constraints on the rheology, eruption and emplacement dynamics of analog lavas comparable to Mercury's northern volcanic plains. J. Geophys. Res. Planets. 122:5181. doi: 10.1002/2016JE005181
Voight, B. (1988). A method for prediction of volcanic eruptions. Nature 332:125–130. doi: 10.1038/332125a0
Voight, B. (1989). A relation to describe rate-dependent material failure. Science 243, 200–203. doi: 10.1126/science.243.4888.200
Vona, A., and Romano, C. (2013). The effects of undercooling and deformation rates on the crystallization kinetics of Stromboli and Etna basalts. Contribut. Mineral. Petrol. 166, 491–509. doi: 10.1007/s00410-013-0887-0
Vona, A., Romano, C., Dingwell, D. B., and Giordano, D. (2011). The rheology of crystal-bearing basaltic magmas from Stromboli and Etna. Geochim. Cosmochim. Acta 75, 3214–3236. doi: 10.1016/j.gca.2011.03.031
Wager, L. R., and Bailey, E. B. (1953). Basic magma chilled against acid magma. Nature 172, 68–69. doi: 10.1038/172068a0
Wiebe, R. A. (1993a). Basaltic injections into floored silicic magma chambers. Eos Trans. Am. Geophys. Union 74, 1–3. doi: 10.1029/93EO00161
Wiebe, R. A. (1993b). The pleasant bay layered gabbro—diorite, coastal maine: ponding and crystallization of basaltic injections into a silicic magma chamber. J. Petrol. 34, 461–489. doi: 10.1093/petrology/34.3.461
Wiebe, R. A. (2016). Mafic replenishments into floored silicic magma chambers. Am. Mineralogist 101, 297–310. doi: 10.2138/am-2016-5429
Wiebe, R. A., Smith, D., Sturm, M., King, E. M., and Seckler, M. S. (1997). Enclaves in the cadillac mountain granite (coastal maine): samples of hybrid magma from the base of the chamber. J. Petrol. 38, 393–423. doi: 10.1093/petroj/38.3.393
Keywords: campi flegrei, rheology, crystallization, oxygen fugacity, lava, magma, viscometry, disequilibrium
Citation: Kolzenburg S, Hess K-U, Berlo K and Dingwell DB (2020) Disequilibrium Rheology and Crystallization Kinetics of Basalts and Implications for the Phlegrean Volcanic District. Front. Earth Sci. 8:187. doi: 10.3389/feart.2020.00187
Received: 27 February 2020; Accepted: 08 May 2020;
Published: 26 June 2020.
Edited by:
Gianluca Iezzi, Università degli Studi G. d'Annunzio Chieti e Pescara, ItalyReviewed by:
Fabio Arzilli, University of Manchester, United KingdomLuca Caricchi, Université de Genève, Switzerland
Copyright © 2020 Kolzenburg, Hess, Berlo and Dingwell. This is an open-access article distributed under the terms of the Creative Commons Attribution License (CC BY). The use, distribution or reproduction in other forums is permitted, provided the original author(s) and the copyright owner(s) are credited and that the original publication in this journal is cited, in accordance with accepted academic practice. No use, distribution or reproduction is permitted which does not comply with these terms.
*Correspondence: Stephan Kolzenburg, c3RlcGhhbmtAYnVmZmFsby5lZHU=