 Mingjian Liang
 Lichun Chen
 Yongkang Ran1
- 1Institute of Geology, China Earthquake Administration, Beijing, China
- 2Sichuan Earthquake Agency, Chengdu, China
- 3Guilin University of Technology, Guilin, China
According to historical earthquake records, the Luhuo segment of the Xianshuihe fault has produced two large earthquakes: the 1816 M7.5 earthquake and the 1973 M7.6 earthquake. The surface ruptures caused by these events remain well preserved. This study focused on the rupture behavior of the Luhuo segment. Based on field investigations, trench excavations and analysis of historical earthquakes, we identified six seismic events that occurred within the past 3000 years, which are dated at 769 BC, 318–545 AD, 677–833 AD, 1008–1444 AD, 1816 AD and 1973 AD. The recurrence intervals of these events, from oldest to youngest, are approximately 1200, 324, 471, 590 and 157 years. Thus, the recurrence behavior of the fault segment appears inconsistent with time- or slip-predictable models, whereas, the revealed seismic sequence appears consistent with clustering and abnormal accelerating stress release behavior. The fault strike-slip rate during the period of anomalous stress release is approximately 2–3 times faster than the average rate of 8.4 mm/a. Moreover, the Luhuo segment has experienced ongoing high levels of seismic activity over the past 3000 years, and the entire Xianshuihe fault currently shows a high degree of seismic activity. Therefore, we suggest there was a long period of earthquake quiescence prior to 3000 years ago, which might have balanced the high activity and accelerating stress release of current earthquakes.
Introduction
Knowledge of the rupture behavior of large seismic events is critical to understanding the spatiotemporal variations of strain loading and release on active faults. The time-dependent earthquake recurrence model is rooted in elastic rebound theory (Reid, 1910), which states that tectonic strain accumulates gradually between earthquake events and is released suddenly during earthquakes (Weldon et al., 2004). This theory also implies that the relationship between slip rate and recurrence intervals of characteristic earthquakes is linear (or approximately linear) on active strike-slip faults (Shimazaki and Nakata, 1980; Schwartz and Coppersmith, 1984; Savage and Cockerham, 1987); in other words, the slip rates of strike-slip faults are consistent on different time scales. However, some studies have argued that fault behavior does not completely follow theory and that slip rates on strike-slip faults exhibit spatiotemporal variability over time (Donnellan et al., 1993; Bull et al., 2006; Mouslopoulou et al., 2009). For example, some slip patterns related to strike-slip faults, such as characteristic slip, spatiotemporal slip variability and pulsed slip behavior, have been detected during the past two decades (Mason et al., 2006; Gold and Cowgill, 2011; Klinger et al., 2011; Zielke et al., 2014; Dolan et al., 2016). Temporal variability of fault slip rate might be related closely to the rupture behavior of large earthquakes on a fault (Mason et al., 2006; Onderdonk et al., 2015; Dolan et al., 2016; Gold et al., 2016).
The Xianshuihe fault is an important left-lateral strike-slip fault on the eastern margin of the Tibetan Plateau. Along the entire length of the fault, there have been seven major earthquakes of ≥M7 during the past 300 years (Wen et al., 2008). Early study on the Xianshuihe fault focused on the fault’s geometric features, fault segmentation and surface ruptures related to the strong historical earthquakes (Wen et al., 1989; Allen et al., 1991; Li et al., 1997). However, few studies have investigated paleoearthquakes and the recurrence behavior of large earthquakes along the fault. Furthermore, most trenches for early paleoearthquake study were excavated across fault scarps or surface ruptures in denudation environments (Li et al., 1997; Zhou et al., 2001). Therefore, lacking of young sedimentary deposits in such eroded environment meant that evidence of seismic events was missing. Over the past 10 years, detailed paleoseismic studies have been undertaken along the southern segment of the Xianshuihe fault (Hu et al., 2015; Li et al., 2017; Yan and Lin, 2017). However, research on the recurrence behavior of large earthquakes of the Xianshuihe fault remains infirmly. In this paper, we focus on the Luhuo segment (the northwestern segment) of the Xianshuihe fault and study the rupture behavior of large earthquakes.
Late Quaternary Tectonic Activity of the Xianshuihe Fault
The Xianshuihe fault zone is a left-lateral fault system along the southeastern boundary of the Bayan Har Block, which has played an important role in the evolution of the eastern margin of the Tibetan Plateau (Papadimitriou et al., 2004; Yan and Lin, 2015). Taking the Huiyuansi Basin as a cut-off boundary, the northwestern and southeastern segments of the Xianshuihe fault exhibit different structural characteristics (Figure 1; Wen et al., 1989; Allen et al., 1991). The northwestern segment, which comprises the Luhuo, Daofu, and Qianning sections arranged in left-stepping echelon, consists of a single fault strand. Conversely, the southeastern segment that has complex structure can be divided into three subfaults: the Yalahe, Selaha, and Zheduotang segments. The Yalahe segment is located in the east, the Selaha segment is in the middle, and the Zheduotang segment is in the west. South of Kangding County, the Xianshuihe fault becomes a single structure again. To the south of Xinmin, in Shimian County, the active trace of the fault becomes obscure. Ultimately, the fault trace ends near Gongyihai, south of Shimian County.
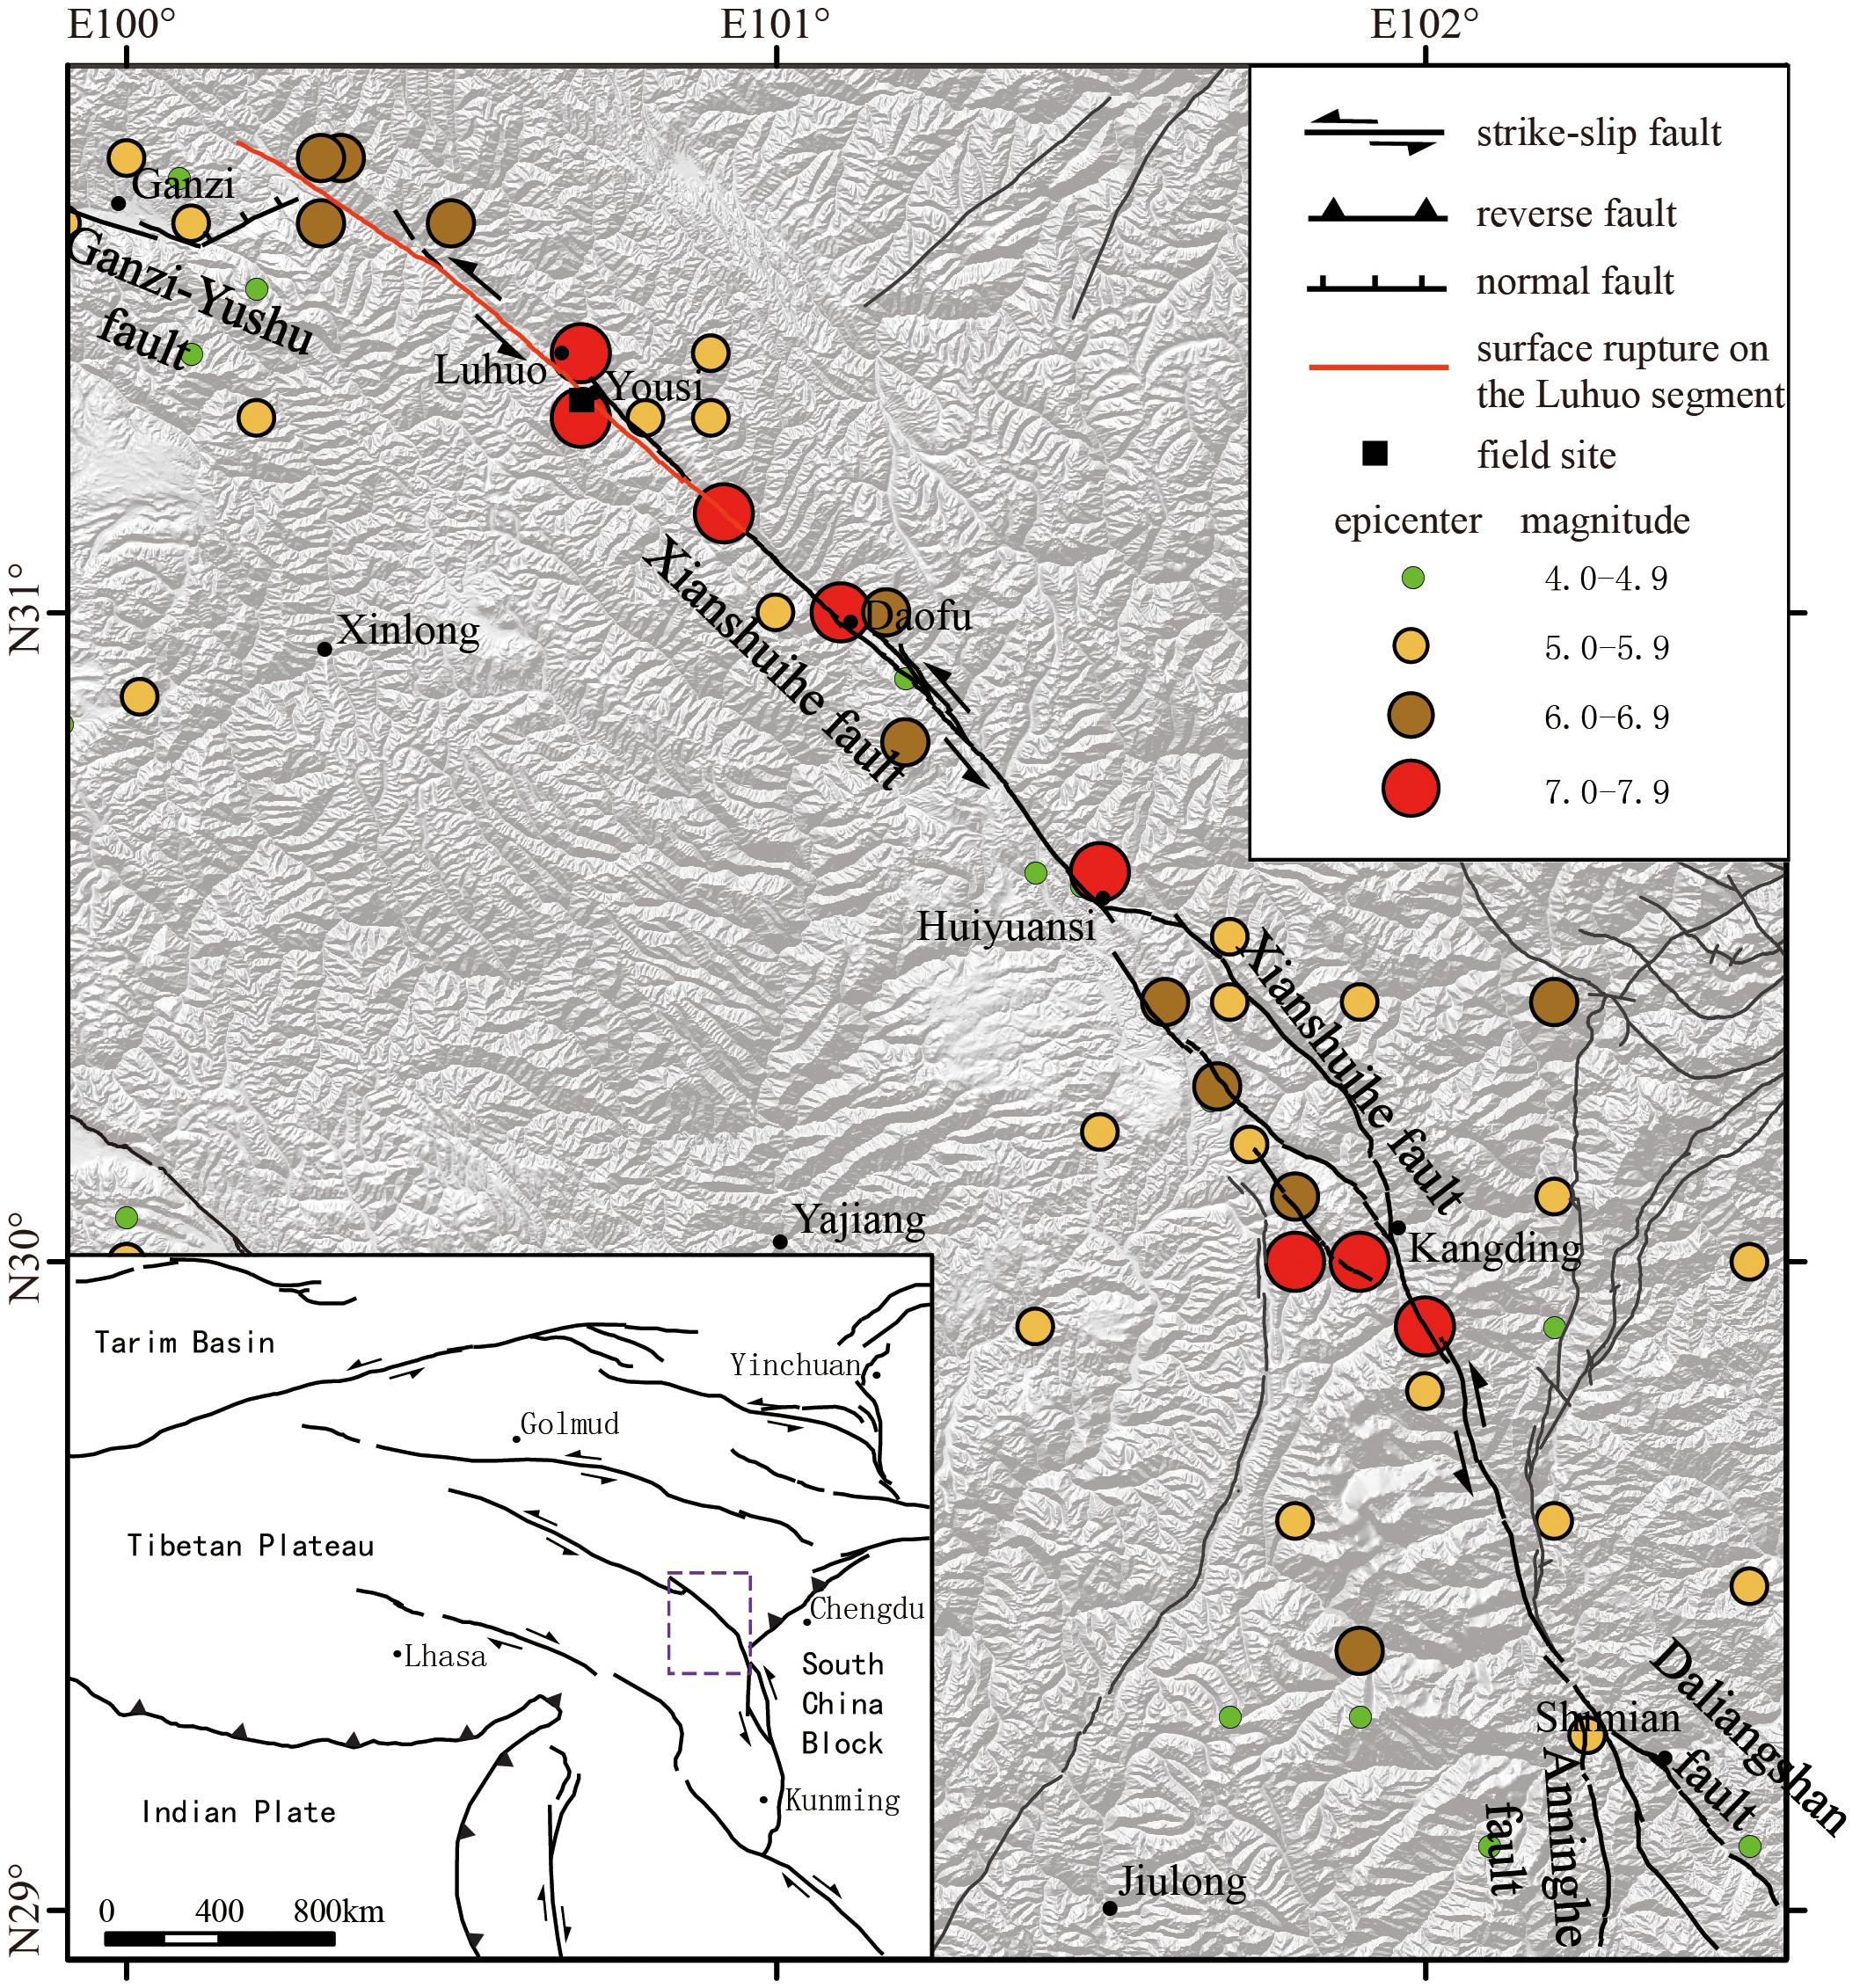
Figure 1. Grayscale map (modified from 90-m-resolution SRTM4 data) showing the topographic and tectonic setting of the Xianshuihe fault. The earthquake catalog was provided by Sichuan Earthquake Agency, Chengdu, China. The fault line was modified from Li et al. (2017).
Based on multiple measurements taken in past decades, the Xianshuihe fault is regarded as a high-slip-rate fault. In particular, geological surveys have indicated that the northwestern segment has a high slip rate of 12–17 mm/a (Qian, 1989; Wen et al., 1989; Zhang, 2013; Chen et al., 2016). Most estimates of the slip-rate of Xianshuihe fault obtained from GPS observations or InSAR data, are approximately 9–13 mm/a (Wang et al., 2009; Jiang et al., 2015; Rui and Stamps, 2016). However, other studies have suggested that the slip rate of the Xianshuihe fault is not so high, and could be perhaps ≤7 mm/a (England and Molnar, 2005). The Xianshuihe fault, which exhibits a high degree of seismic activity, has produced seven earthquakes of ≥M7.0 along its entire length during the past 300 years (Wen et al., 1989, 2008; Bai et al., 2018). The surface ruptures of these historical earthquakes remain preserved on some segments of the fault, e.g., the Luhuo, Daofu, Selaha, and Yalahe faults. Two large events (>M7.0) have occurred on the Luhuo fault: the M7.5 earthquake of 1816 and the M7.6 earthquake of 1973. The surface rupture of the 1973 event, which cut the pressure ridge produced by the preceding earthquake, remains clearly visible. Geographically, the Luhuo fault is the northwesternmost segment of the Xianshuihe fault, and it is arranged in left-stepping echelon with the Ganzi–Yushu and Daofu faults. Geomorphologically, the Luhuo fault has reasonable linear geomorphology, and many deflected streams, offset alluvial fans and sag ponds occur along its length.
Paleoearthquake Investigations
Site Description
To better constrain the timing of paleoearthquakes and analyze the rupture behavior of the Xianshuihe fault, we chose an ideal study site for trench excavation near the village of Yousi, in Luhuo County (Figure 1). The study site is located on a platform of glacial deposits to the northwest of Yousi. Here, many geomorphological markers of recent tectonic activity of the Xianshuihe fault are well preserved, e.g., a 20–30-m high reverse fault scarp, gully and platform edge left-laterally displaced by 183 ± 18 m, and sag ponds (Figure 2). The surface rupture of the 1973 M7.6 earthquake is also preserved very well. The surface rupture developed along the root of an older fault scarp, and it cut a pressure ridge produced by the preceding earthquake. Two sag ponds of different sizes are present at this site (Figure 3a). In such a sedimentary environment, earthquake events could be well recorded in the strata. Northwest of the sag ponds, the surface rupture cut the newest alluvial fan. The upstream part of the gully is split into several branches at distances of approximately 4–5 m (Figure 3b), which were offset by the latest fault activity. Here, the sediments transported from the upstream part of the gully deposit, were rapidly deposited and can be well preserved. Different pressure ridges produced by different earthquake events remain preserved on the diluvial fan (Figure 3b). This observation suggests that these events were likely to be well recorded in the diluvial units. In conclusion, the site was considered ideal for research on the rupture behavior of the Xianshuihe fault.
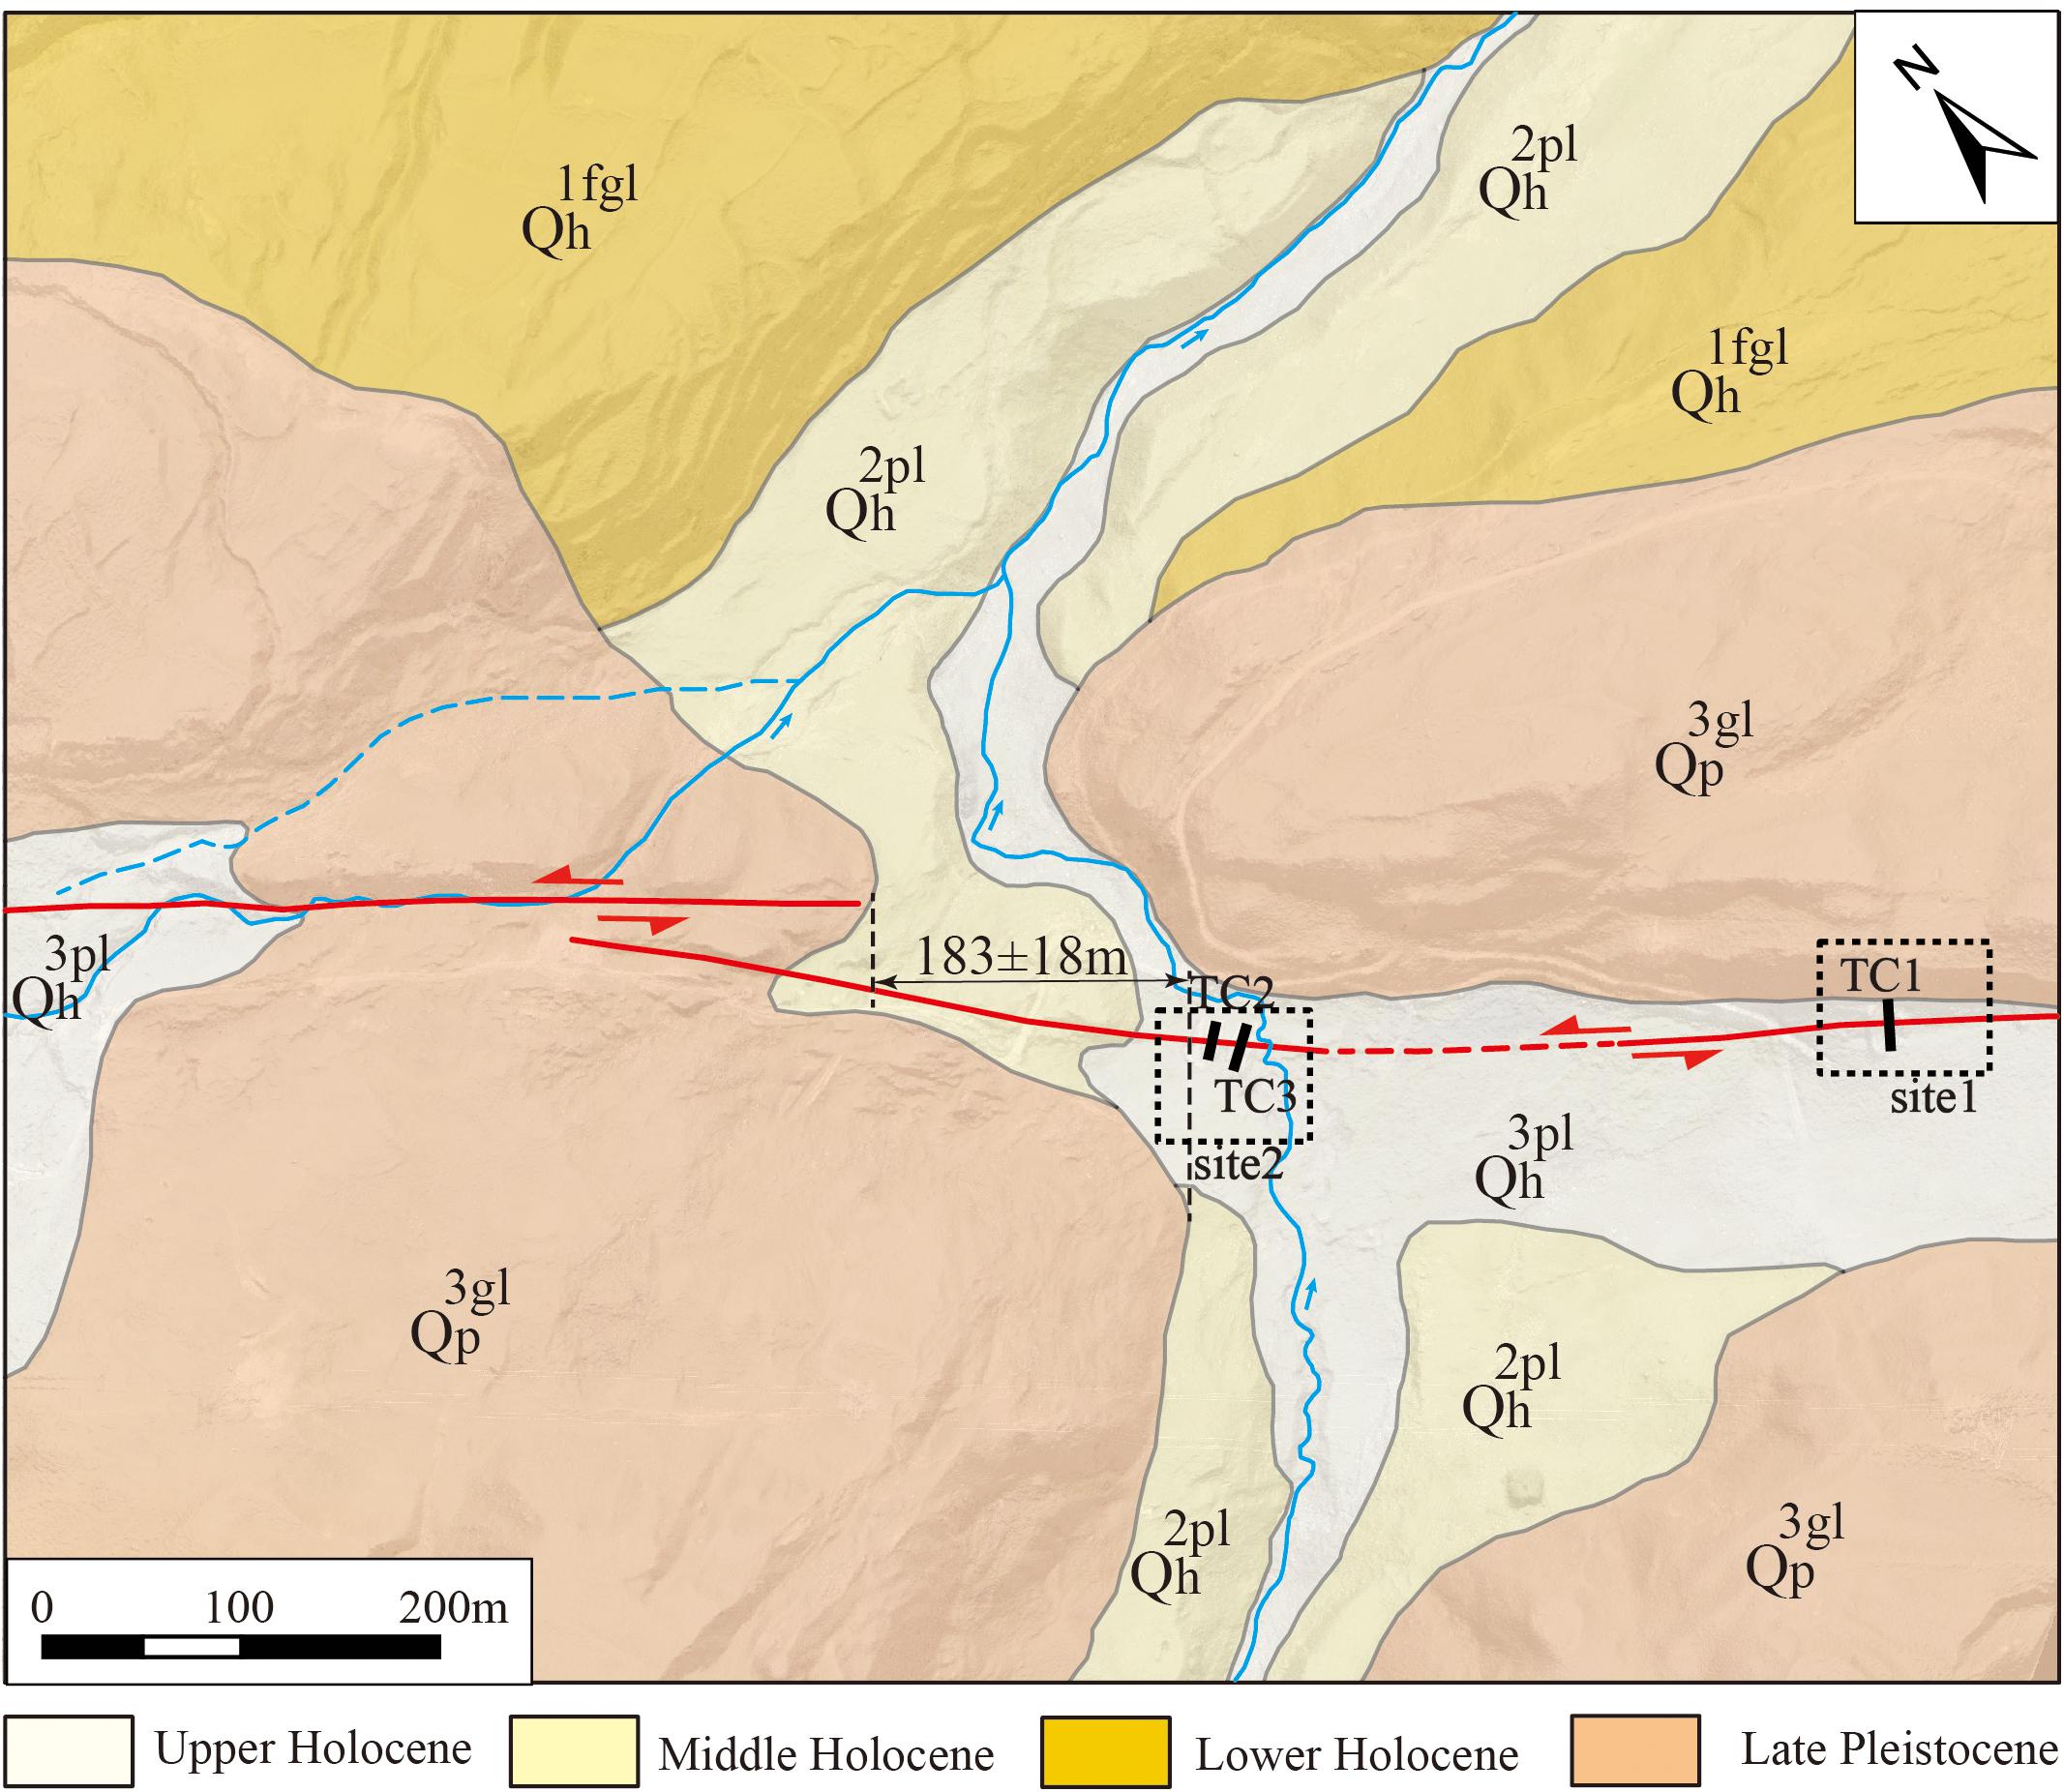
Figure 2. Geological map and distribution of trenches (indicated by black solid rectangles) at the Yousi field site (the location of the black solid square in Figure 1).
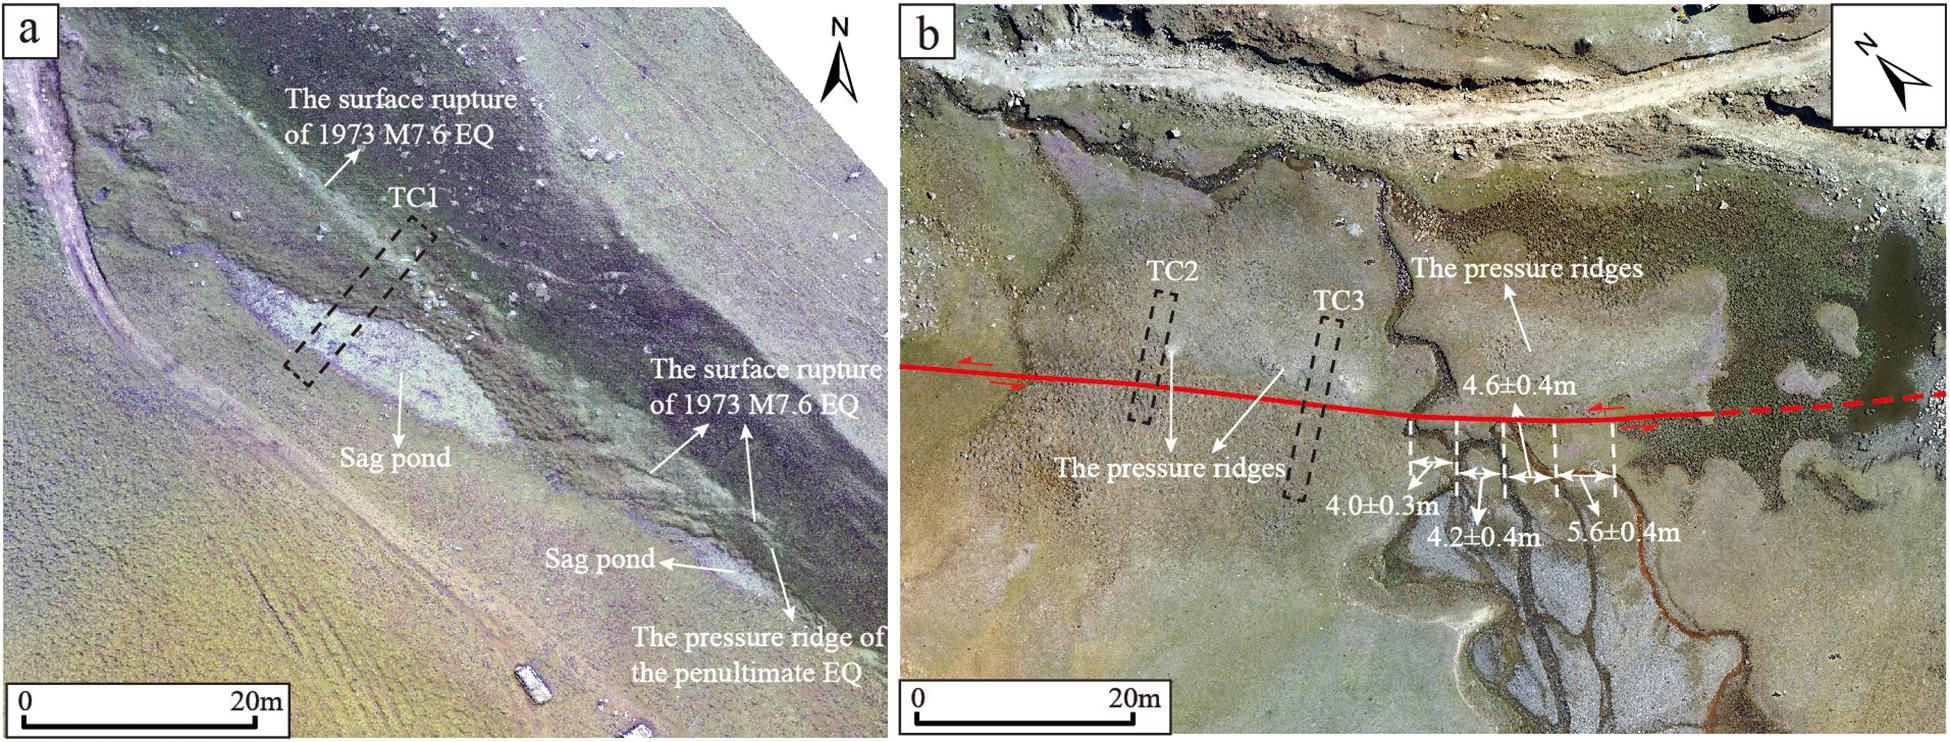
Figure 3. The surface rupture of the 1973 M7.6 earthquake and the tectonic landforms at the trench sites: (a) site 1 and (b) site 2 (as shown in Figure 2). The black dashed rectangles mark the locations of the trenches.
Trench Study at Site 1
Stratigraphic and Paleoearthquake Sequences in TC1
There are two sag ponds at site 1. Trench TC1 was excavated across the larger sag pond and the surface rupture of the 1973 M7.6 earthquake (Figure 3a). We identified six units that are summarized as follows.
Y1: This unit is composed of a gray sand-gravel layer and coarse sand layer, representing a diluvial deposit facies. The upper part (Y1b) is a dark-brown coarse sand layer full of organic material.
Y2: This unit can be divided into two subunits. Y1a is composed of dark-gray fine sand layers and sand gravel layers with a certain rhythmic characteristic. Y2b is mainly composed of fine sand with some organic interlayering. The sedimentary characteristics of the unit represent alternation between relatively low-energy and medium-energy hydrodynamic environments.
Y3: This unit is a sedimentary deposit environment of sag pond in the middle of the trench, which is composed of gray-black loam and fine sand. In the western part of the trench, this unit can be divided into two subunits. Y3a is composed of brown fine sand interbedded with coarse sand lenses. This subunit is full of organic material. Y3b is composed of gray loam. The sedimentary characteristics of the unit represent a very low-energy depositional environment.
Y4: This unit, which differs between the western and eastern parts of the trench, can be divided into two subunits. Y4a is composed of livid fine sand, suggesting a low-energy water-rich environment. At the bottom of Y4a is a continuous layer of subrounded gravel (diameter: 3–5 cm). Y4b is composed of variegated sand–gravel. The western part of Y4b, which overlaps Y4a, and pinchs out westward, contains some well-rounded severely weathered granitic pebbles. Y4b can be interpreted as a scarp-derived colluvial deposit.
Y5: This unit also can be divided into two subunits based on differences between western and eastern parts of the trench. Y5a is composed of flavescens fine sand with a certain degree of horizontal bedding. There are also some well-rounded granitic pebbles in the eastern part of the subunit. Y5b, which contains intermingled brownish-yellow sand and small gravel, is interpreted as scarp-derived colluvial deposit.
Y6: This unit contains brown sand soil that is rich in grass roots and contains small gravel.
Five earthquake events were identified in the trench TC1. Although contact relationships between unit Y1 and the faults were not revealed directly in the trench, Y1b is obviously deformed and rumpled and has unconformable contact with the overlying unit Y2 (Figure 4). These observations suggest that an event (Event I) occurred after deposition of Y1b. In Event II, Y2 was displaced by the faults. A sag pond formed after this event, within which unit Y3 was deposited (Figures 5, 6). In Event III, Y3 was displaced by the faults and a colluvial wedge (V1) developed. Further obvious evidence for this event is the displacement and rumpling of units Y3a and Y3b revealed in the western part of trench TC2 (Figures 4, 5, 6b). Some well-rounded pebbles are present at the eastern edge of Y4b, which might have rolled down from the fault scarp during the event. In Event IV, Y4 was displaced by faults F1 and F2. The thickness of Y5a on the eastern side of F2 is greater than that on the western side (Figures 4, 5). The well-rounded pebbles at the eastern edge of Y5b might have rolled down from the fault scarp during Event IV. In Event V, the units were displaced by faults F1 and F2 (Figures 4, 6a); this event can also be inferred from the surface rupture.
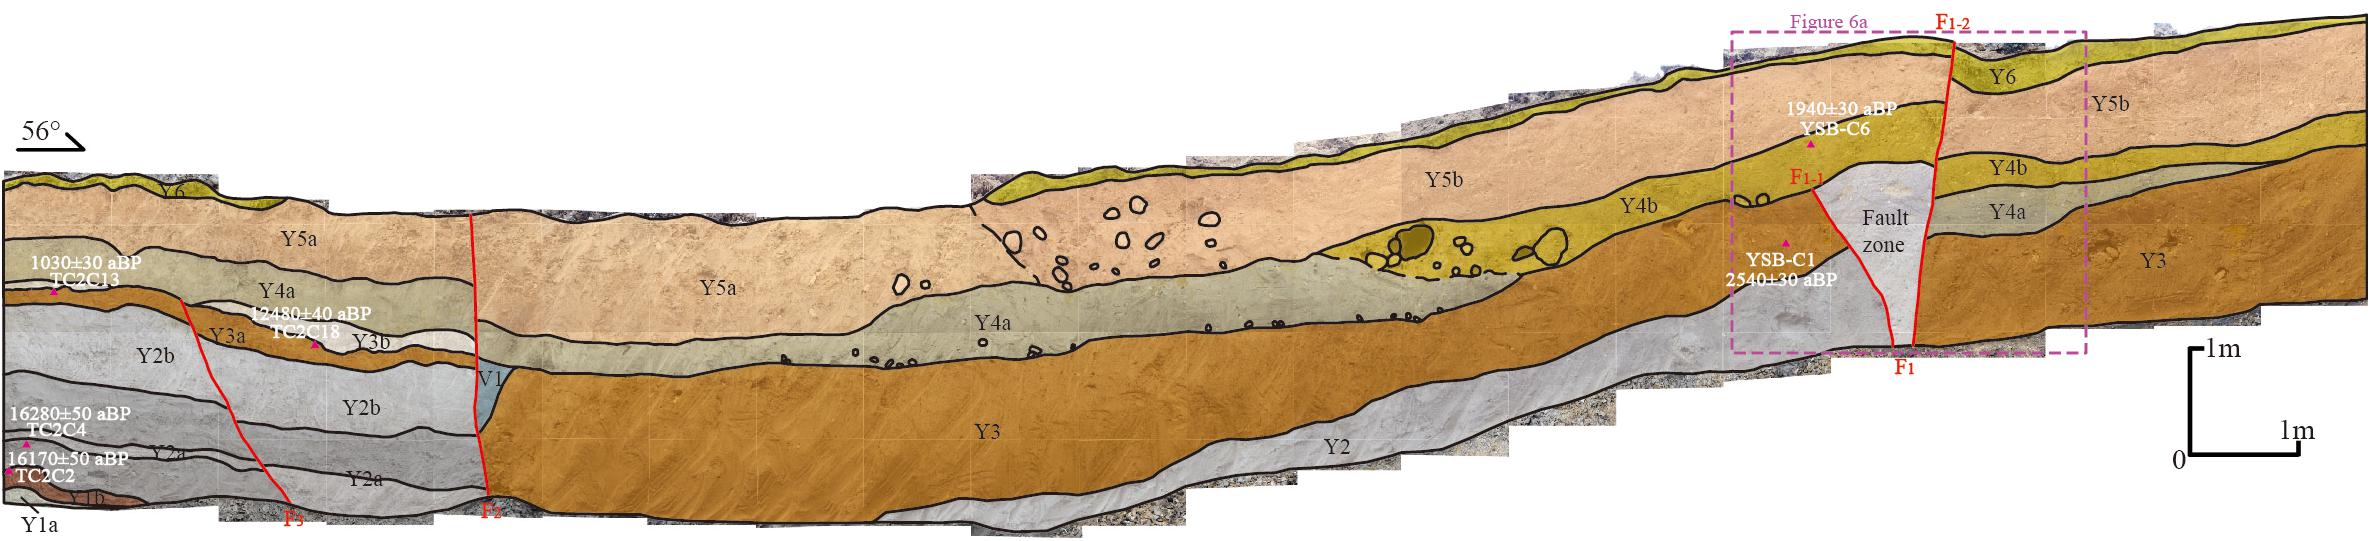
Figure 4. The exposed northwestern wall and geological section of TC1 showing stratigraphic units U1–U6. The purple triangles show the collecting positions of the samples used for carbon dating. The purple dashed rectangle indicates the location of Figure 6a.
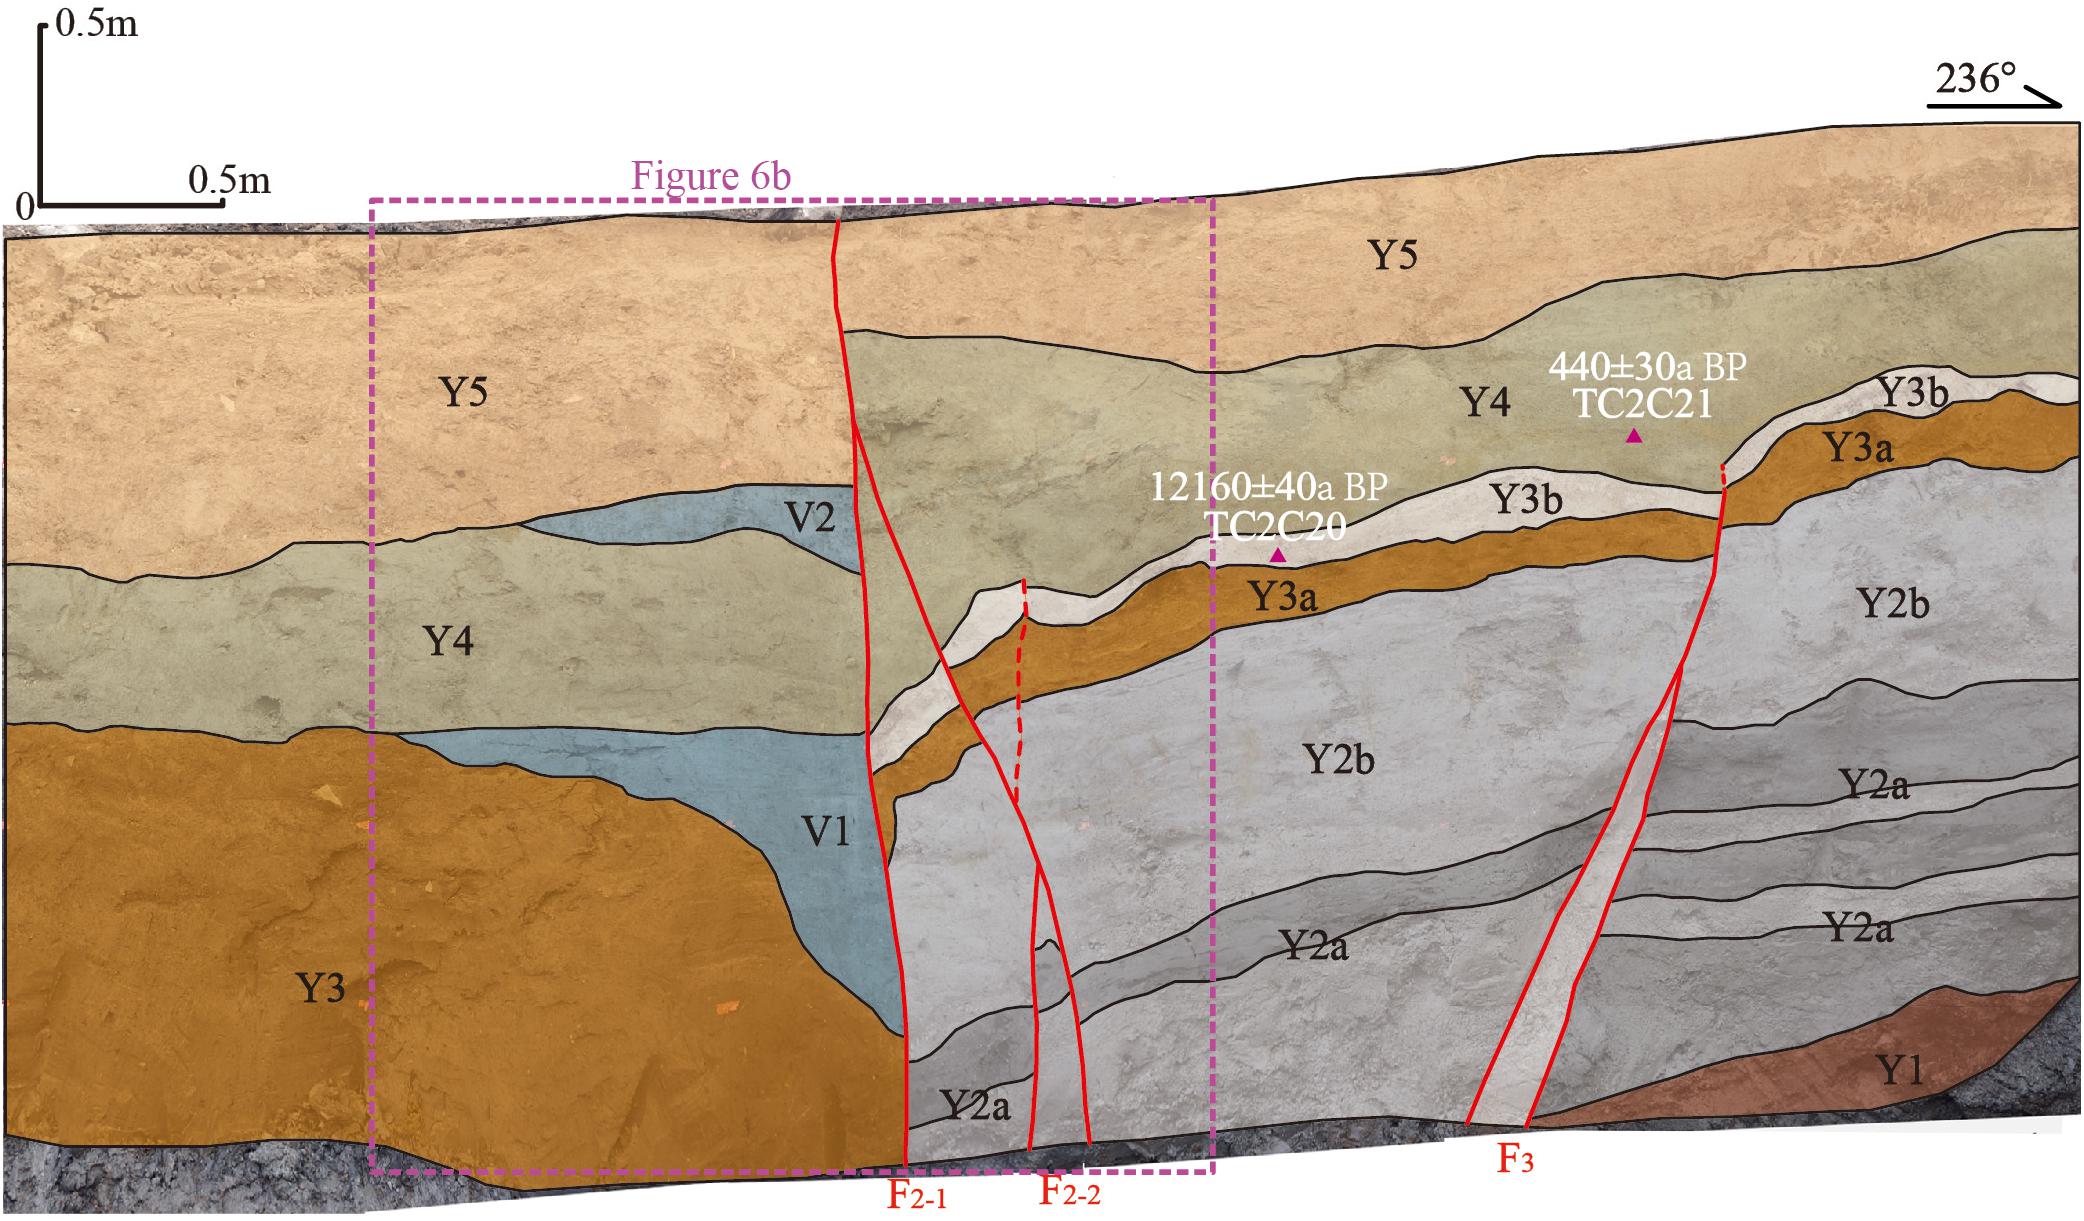
Figure 5. The exposed part of the southeastern wall and geological section of TC1 showing stratigraphic units U1–U5. The purple triangles show the collecting positions of the samples use for carbon dating. The purple dashed rectangle indicates the location of Figure 6b.
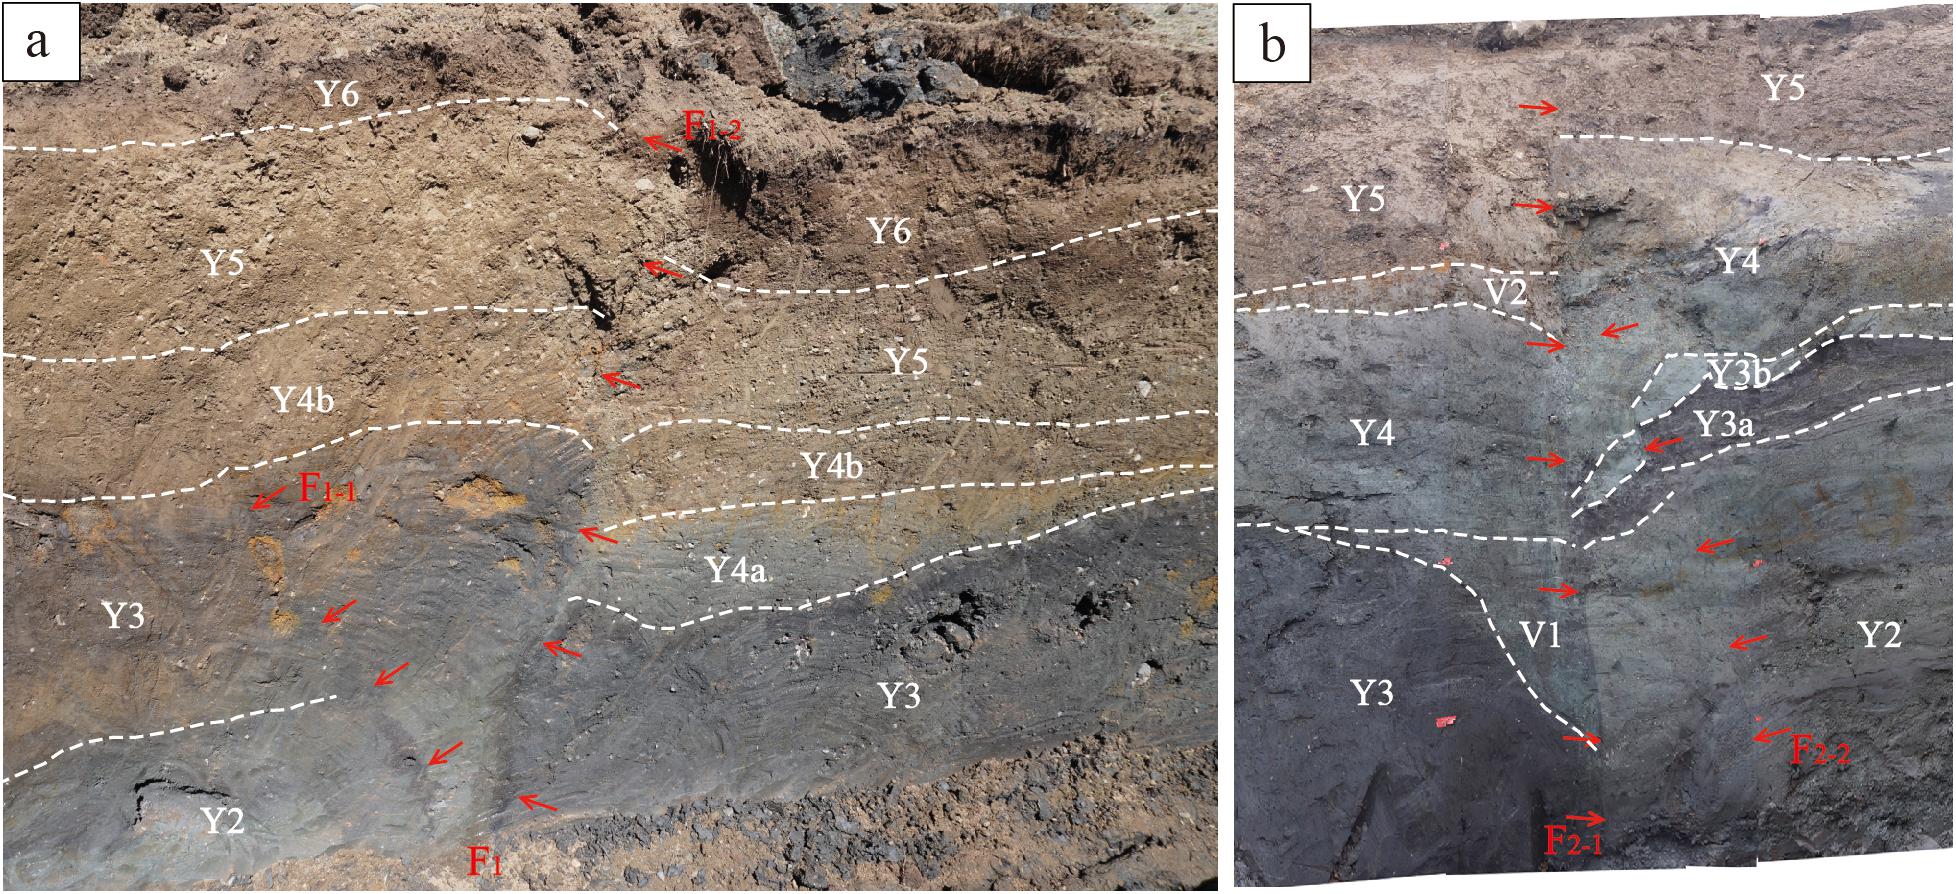
Figure 6. Photographs of parts of the walls of TC1: (a) part of the northwestern wall showing the relationship between fault F1 and deformation of the strata, and (b) part of the southeastern wall showing the relationship between fault F2 and deformation of the strata. White dashed lines mark stratigraphic boundaries; red arrows indicate fault traces.
Dating Constraints on Paleoearthquakes at Site 1
Here, we analyze the stratigraphic sequence and evidence for paleoearthquakes exposed in trench TC1. After reconsidering and removing some older and unreasonable dating results (Figure 7 and Table 1), we identified the occurrence and timing of five paleoevents. The evidence for Event I (E1) is rumpling–folding of Y1b and its unconformable contact with the overlying unit. Base on carbon-dating results for samples TC2C2 and TC2C4, Event I is constrained to 16280 ± 50 to 16170 ± 50 a BP and Event II (E2) is constrained to 12160 ± 40 to 2540 ± 30 a BP. An obvious piece of evidence for this event is that Y2 was faulted and a sag pond opened after the event. Subsequently, Y3 was deposited and it is thickest nearest the fault (Figures 4, 5). In addition, unit Y3 was deposited gradually in a very low-energy water-rich environment. We obtained four carbon samples TC2C13, YSB-C1, TC2C18 and TC2C20 from unit Y3, which were dated at 1030 ± 30, 2540 ± 30, 12480 ± 40 and 12160 ± 40 a BP, respectively. In contrast to the carbon-dating results obtained from Y2, the results for samples TC2C18 and TC2C20 are much older than the depositional age of Y3. We speculate that these two samples might have come from the upper part of Y2 and that their ages might represent the depositional age of that unit. Thus, the test results of samples TC2C13 and YSB-C1 could reasonably represent the depositional age of Y3. Furthermore, the dating of YSB-C1 is closer to the depositional age of the lower part of Y3. Therefore, the age of Event II is likely to be closer to 2540 ± 30 a BP. Obvious evidence for Event III (E3) is that Y3 has been faulted and rumpled and a colluvial wedge (V1) developed (Figure 5). Event E3 is constrained to 1030 ± 30 to 440 ± 30 a BP by the carbon dating of units Y3 and Y4 (especially the results for samples TC2C13 and TC2C21). In Event E4, unit Y4 was displaced and it formed a colluvial wedge (V2). Obviously, E4 occurred after deposition of Y4, which is dated to about 440 ± 30 a BP. The latest event (E5), which could not be carbon dated but could be identified from the surface rupture, was the 1973 M7.6 earthquake.
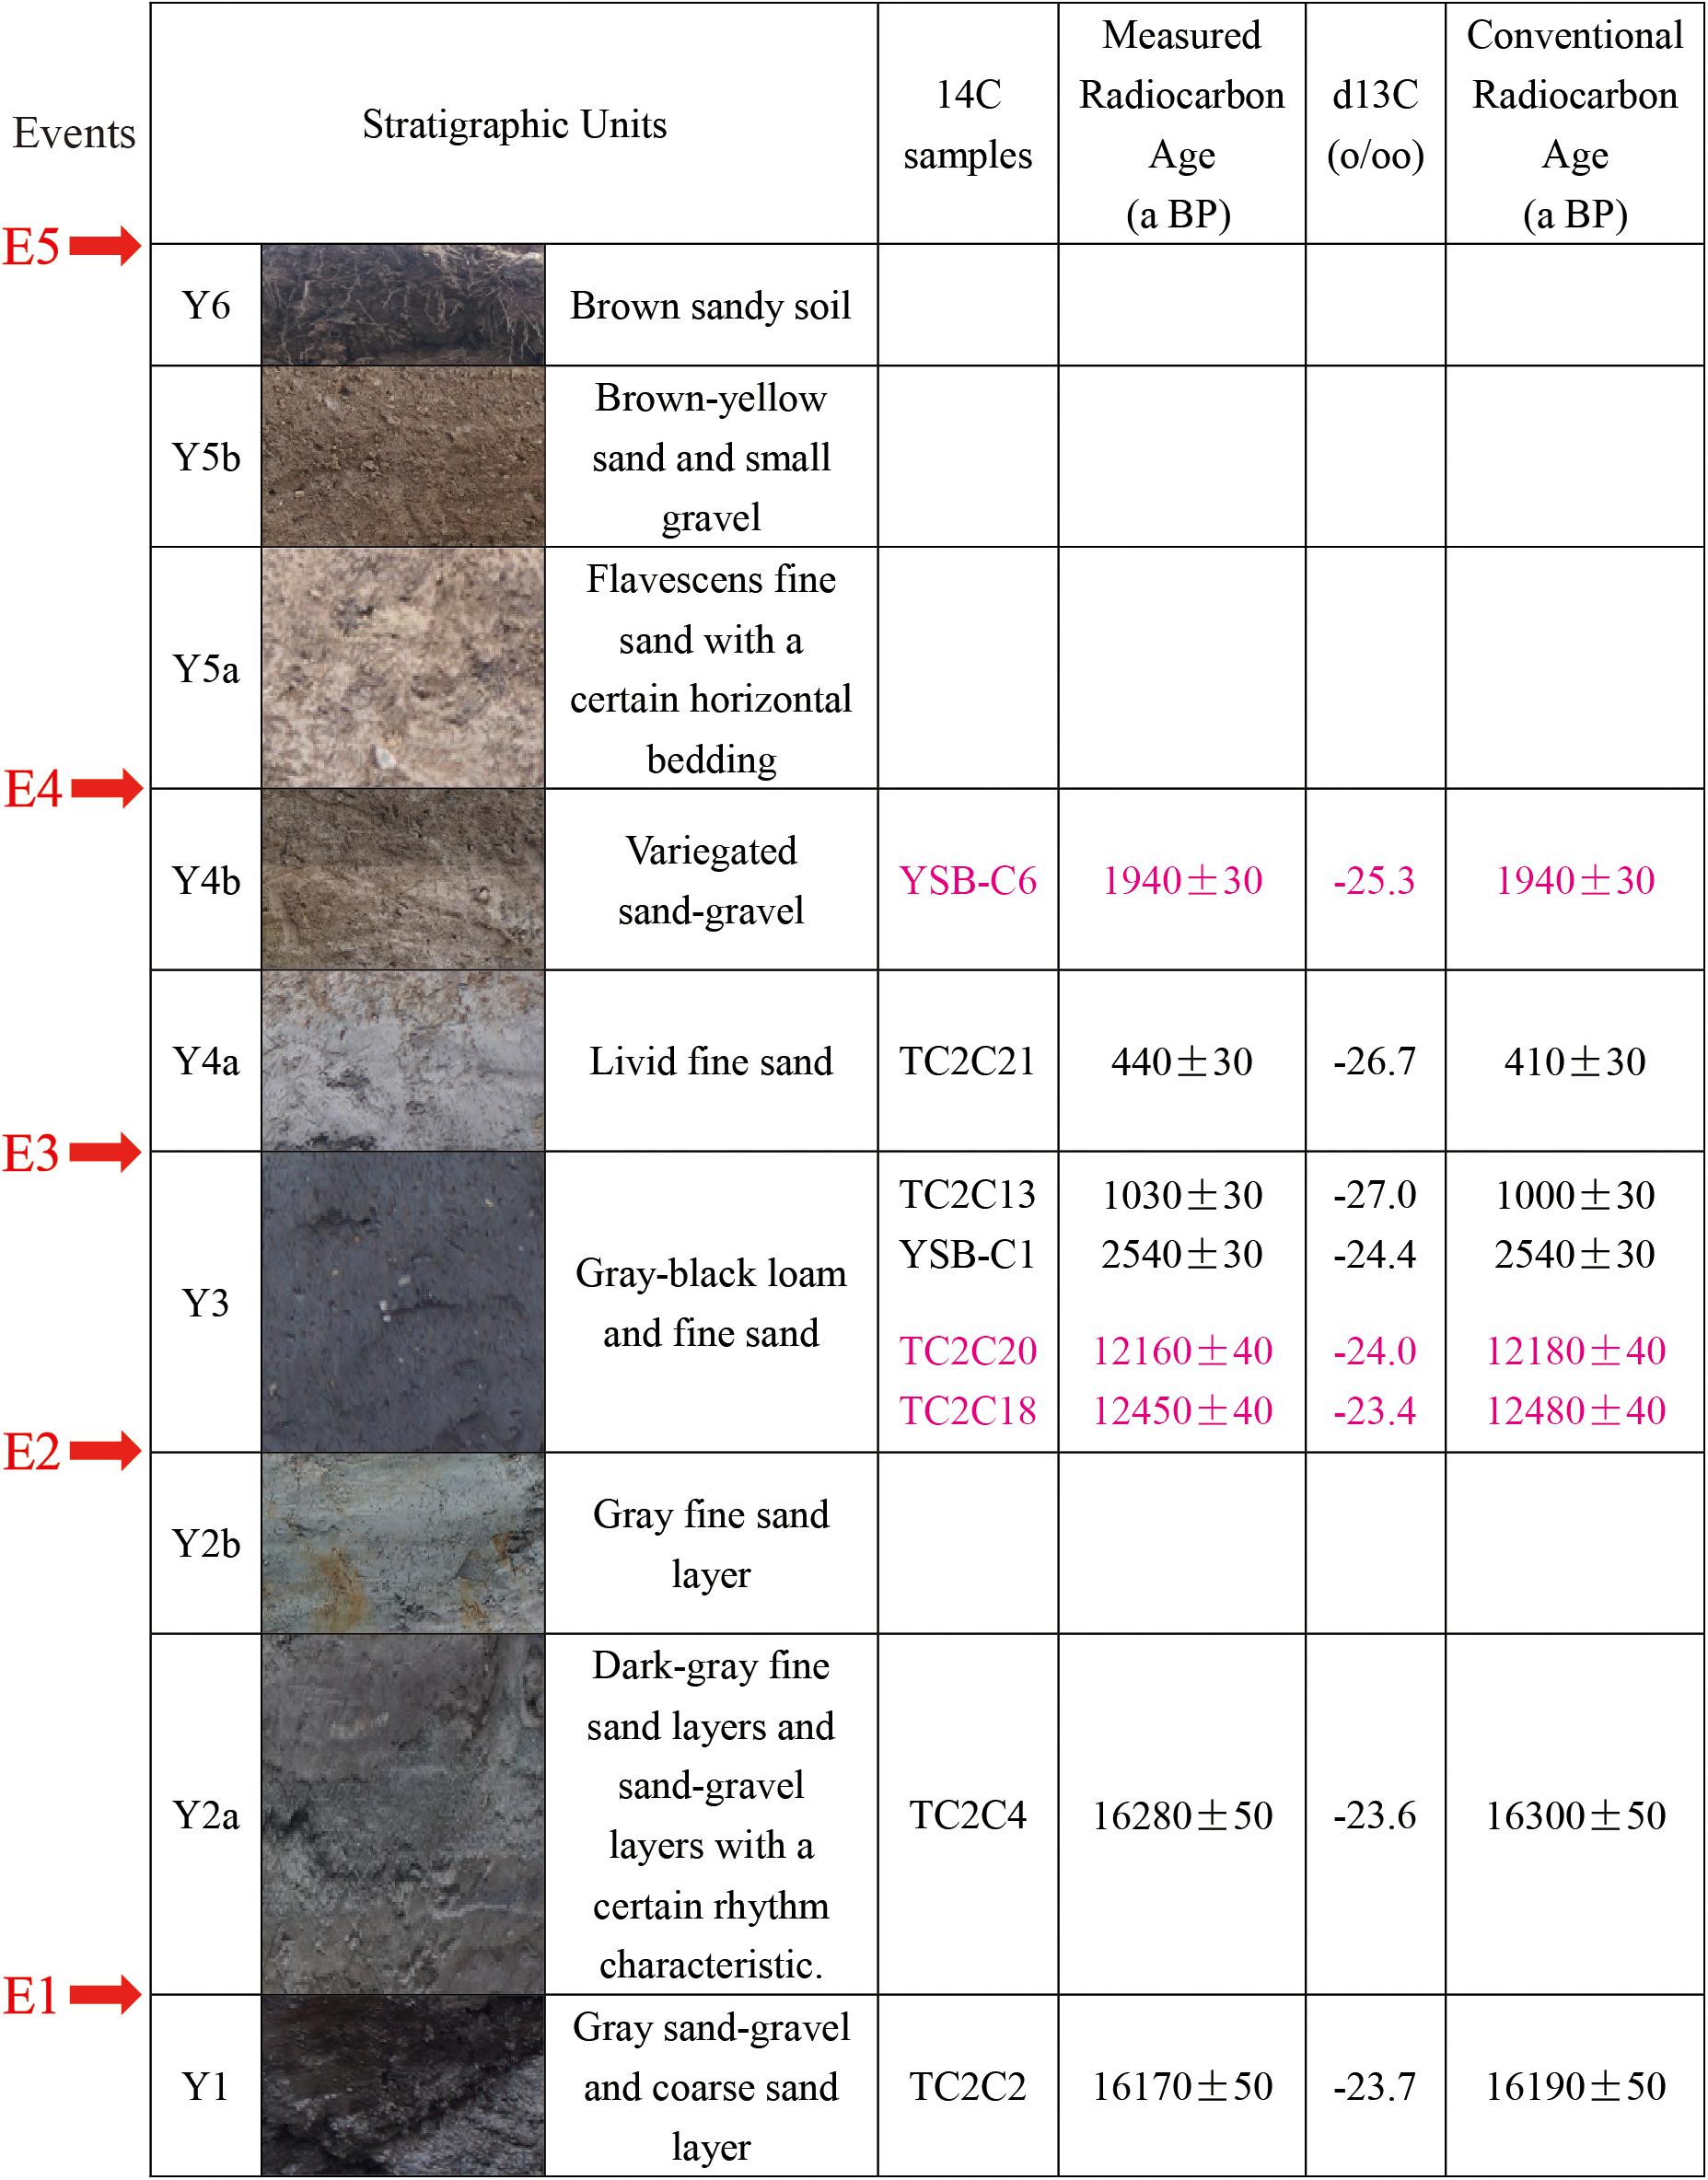
Figure 7. Stratigraphic sequence and radiocarbon dates of TC1. The samples labeled in purple text are considered markedly older than the depositional units in which they occur. All samples were processed at Beta Analytic Inc., Miami, FL, United States.
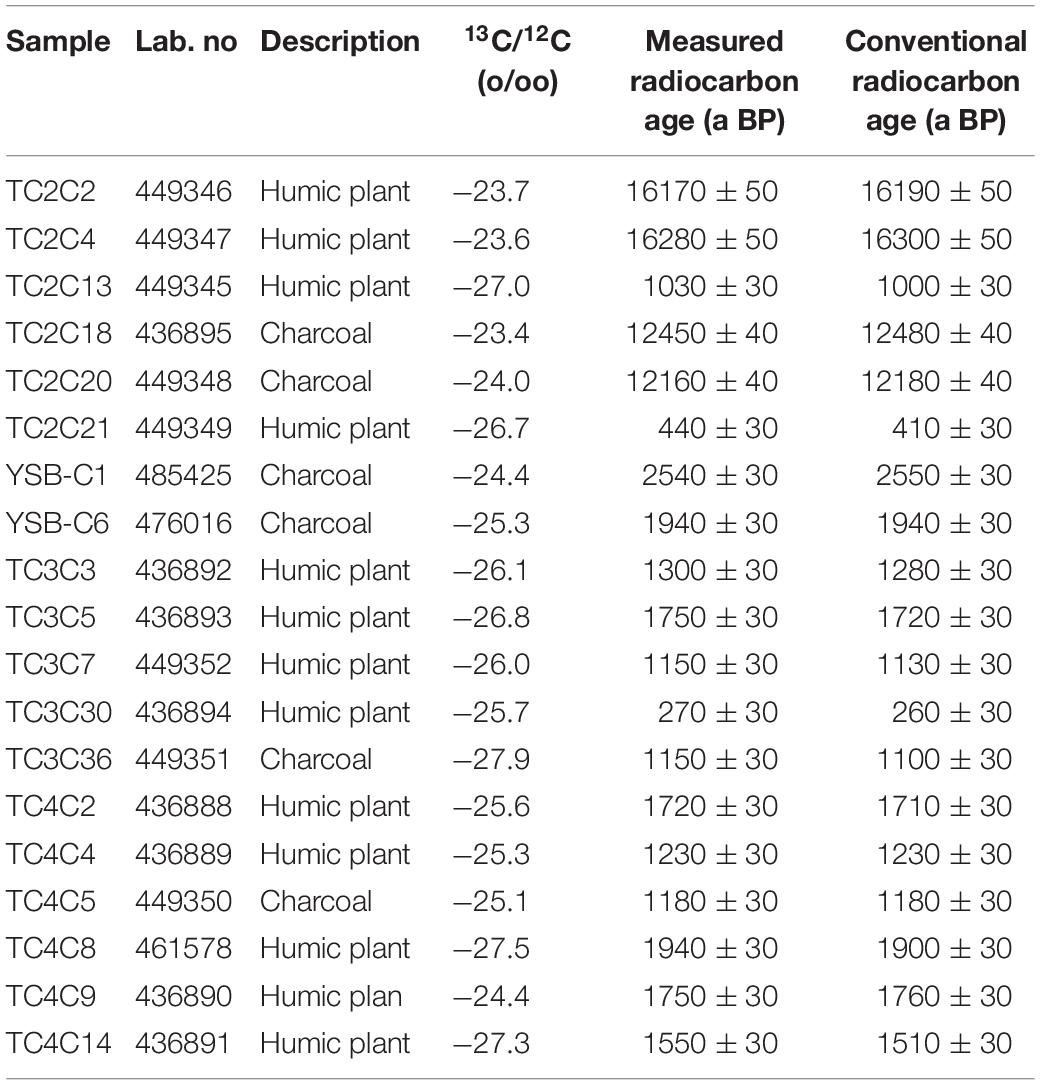
Table 1. Radiocarbon ages from the Yousi trenching site.
We built an age model for the stratigraphy in TC1 using OxCal4.3.1 (Figure 8; Ramsey and Lee, 2013) and inferred the occurrence of five events. The radiocarbon calibrated dating and stratigraphic constraints for the events are 17862–17517 BC, 769 BC, 1008–1444 AD, 1451–1655 AD and 1973 AD.
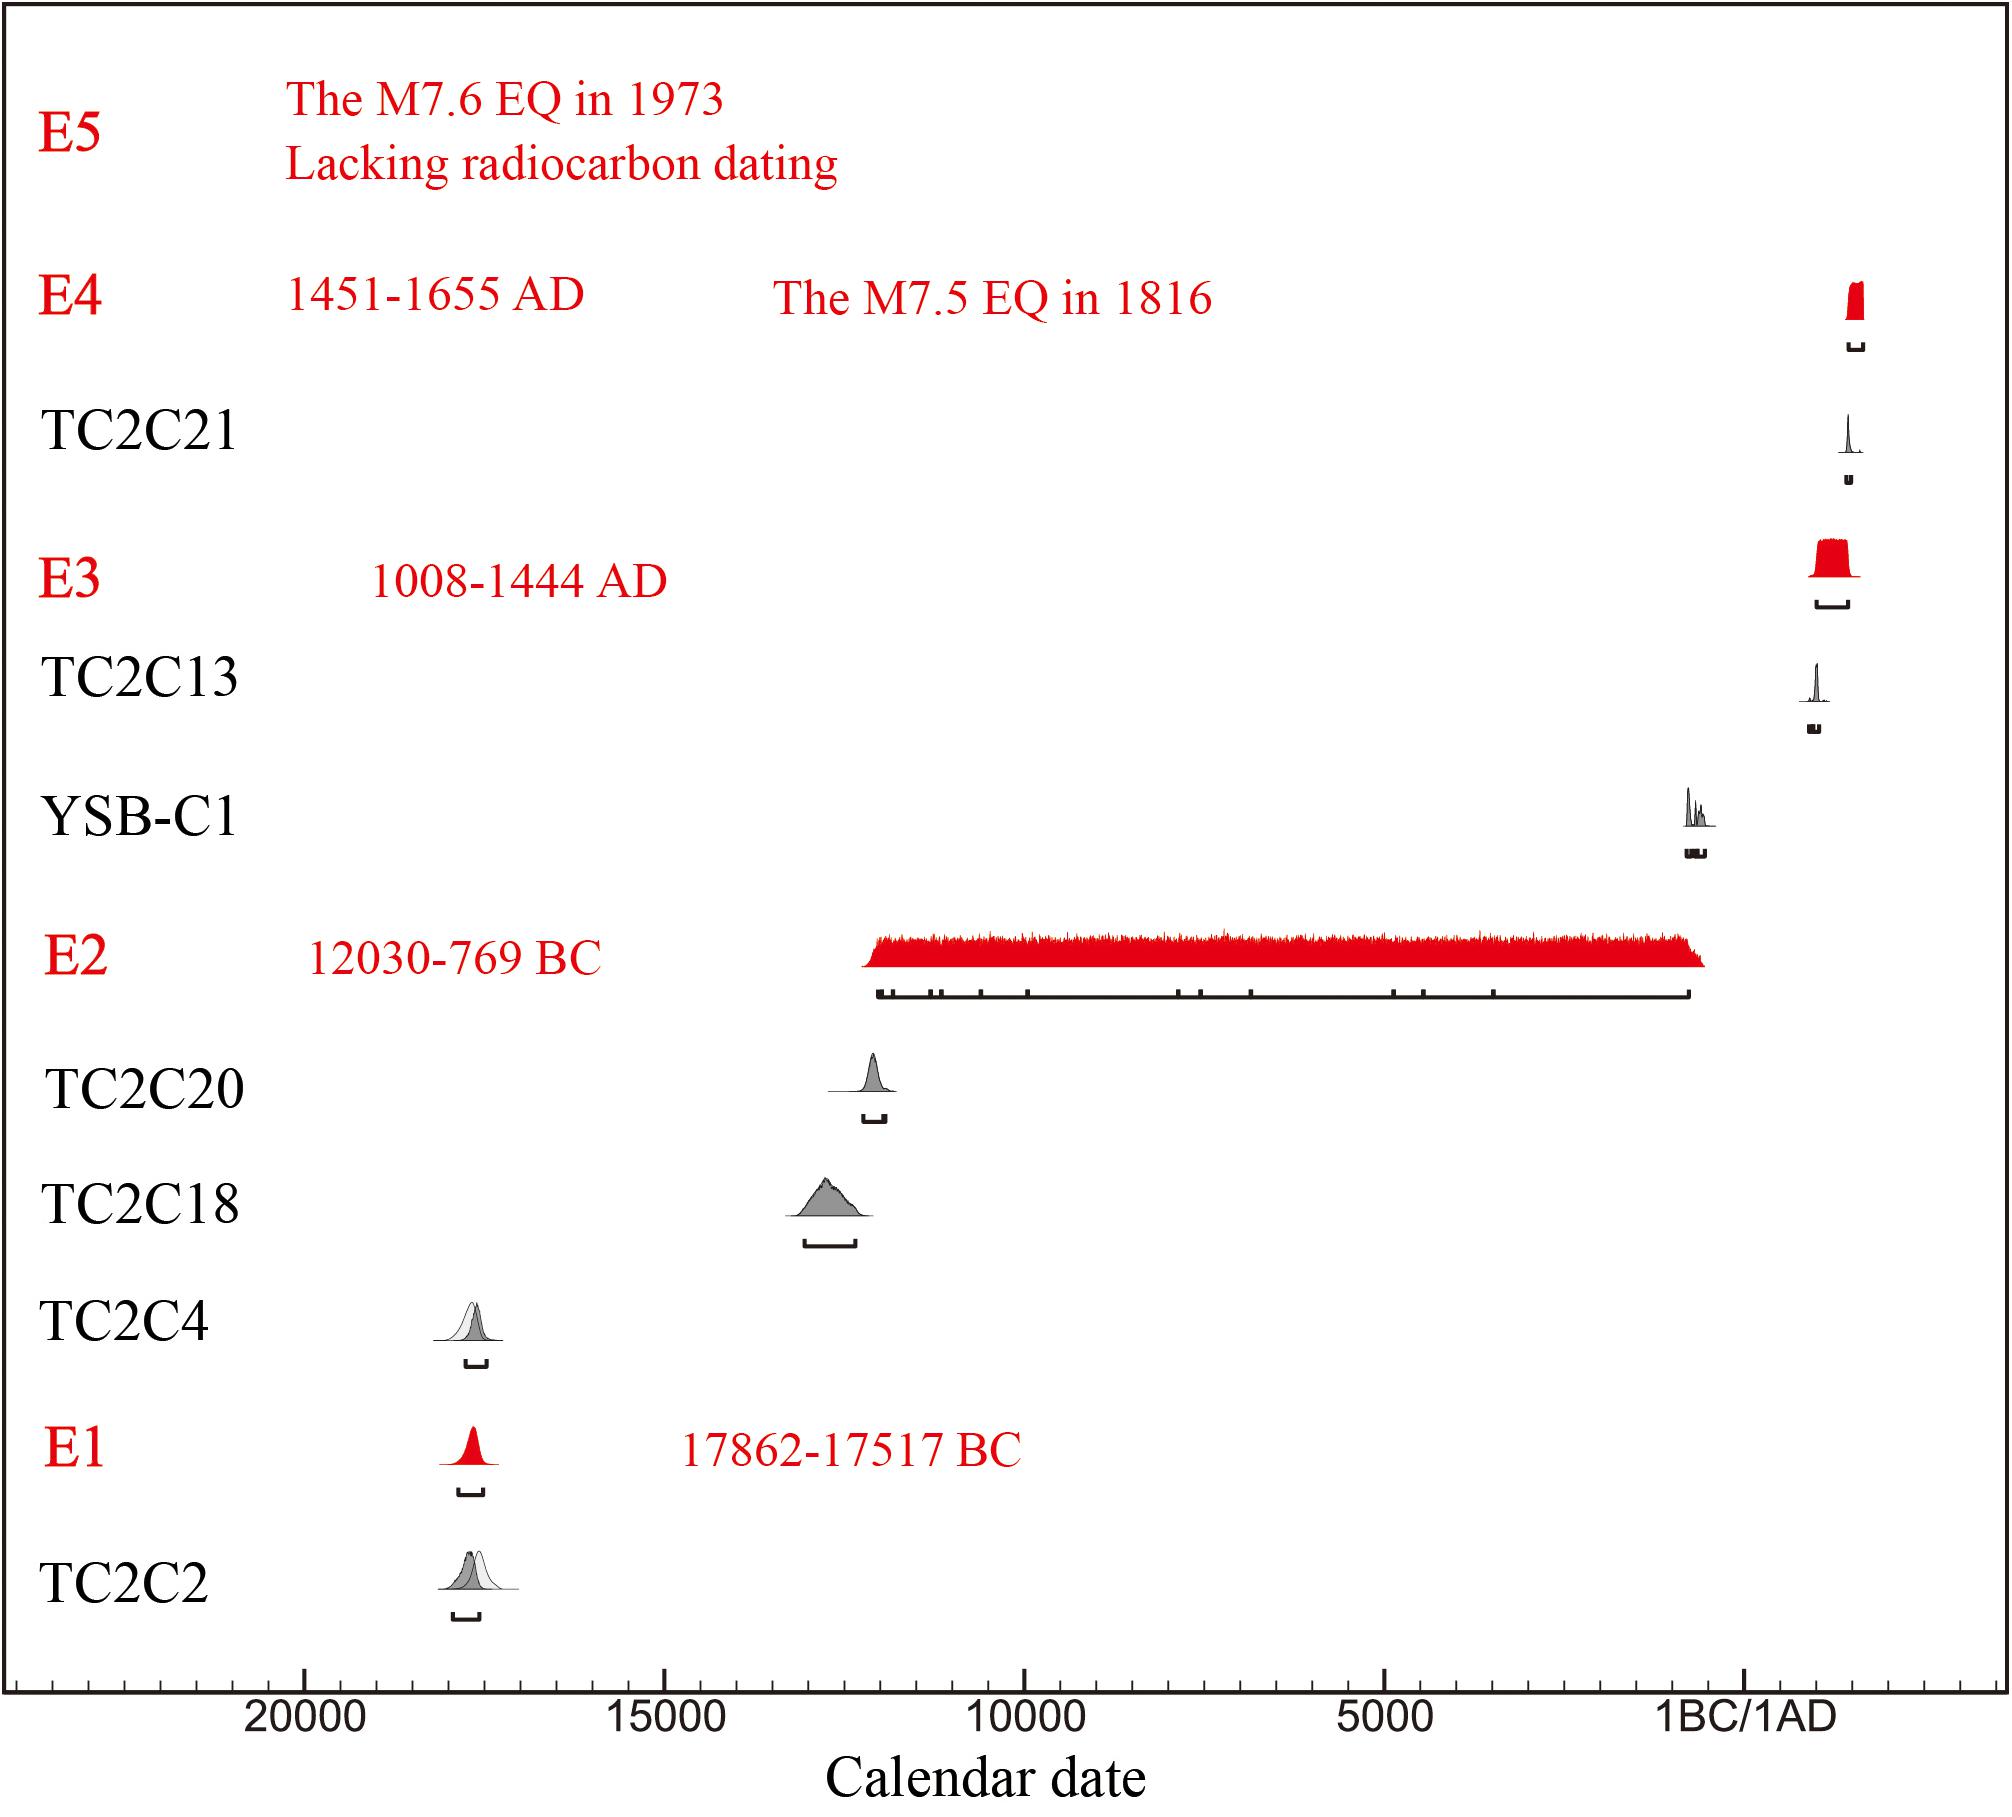
Figure 8. Results of OxCal analysis of radiocarbon dates from site 1. The raw radiocarbon ages were calibrated using OxCal 4.3.1 (Ramsey and Lee, 2013).
Trench Study at Site 2
At site 2, we excavated two trenches (TC2 and TC3, Figure 3b) that intersected the pressure ridge on the diluvial fan. The trenches revealed a succession of excellent sedimentary strata that comprised distinct sedimentary units that had a rapid rate of deposition. We divided the sediments into five major units that are summarized as follows (Figure 9).
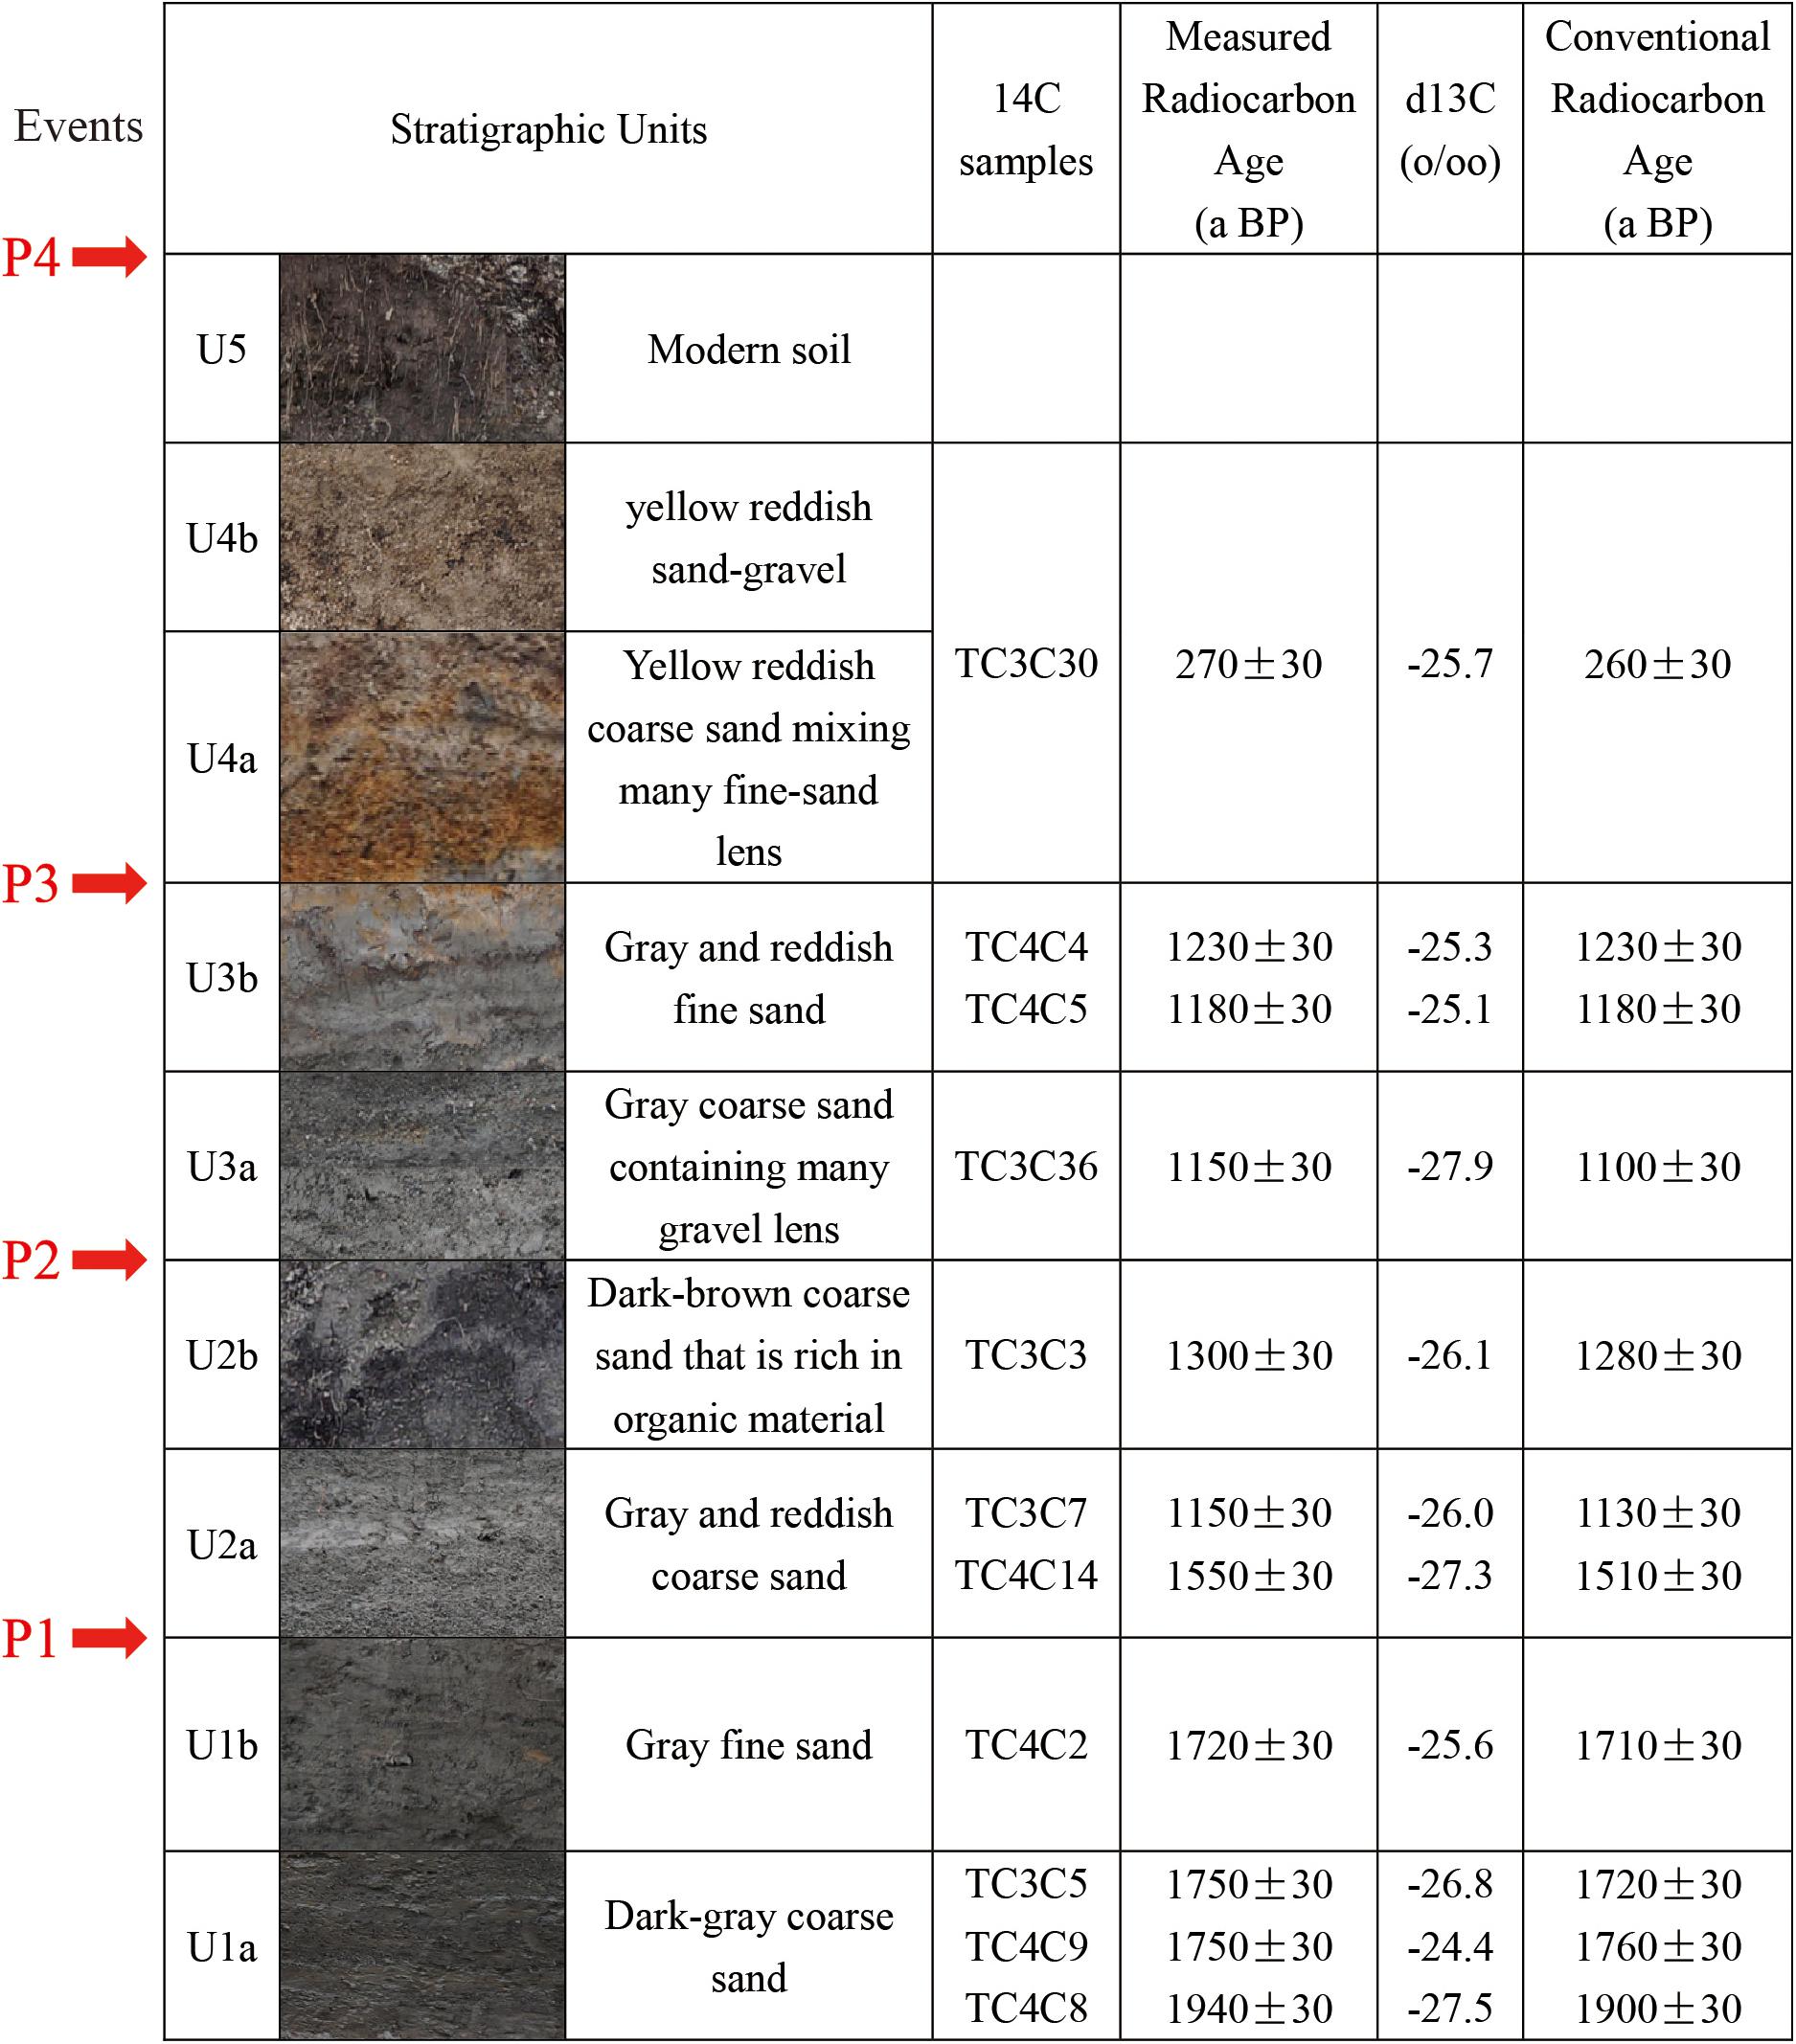
Figure 9. Stratigraphic sequence and radiocarbon dating results of TC2 and TC3 at site 2. All samples were processed at Beta Analytic Inc., Miami, FL, United States.
U1: Gray-brown fine sand and coarse sand. The lower part (U1a) is mainly composed of coarse sand, in which there are some interlayers or colluvial wedges composed of fine sand and abundant organic material. On the top of this subunit is a layer composed of gravel that is much more angular, suggesting an alluvial and diluvial sedimentary facies. The upper section (U1b) of the unit is mainly composed of fine sand, containing some brown sand belts rich in organic material. This unit, on the western wall of the fault zone in TC3, consists of alternating layers of fine sand and coarse sand with different colors.
U2: Gray and reddish coarse sand, containing many fine sand lumps and small gravel lenses. In TC2, there are some thin layers rich in organic material in the top part of the unit. The unit belongs to a diluvial depositional facies in a water-rich environment.
U3: The unit is composed of gray reddish coarse sand and fine sand with a certain sedimentary rhythm in TC3. However, in TC2, the unit does not show obvious formational bedding and it contains many gravel lens and fine sand lumps that represents a high-energy water-rich environment.
U4: A setting of yellow reddish sand-gravel mixed with many fine sand lenses and clumps representing a diluvial sedimentary facies. There is a certain sedimentary rhythm evident on the eastern wall of the fault zone revealed in TC2.
U5: Modern soil.
Based on the depositional characteristics and the relationships between the strata and faults, we infer that four paleoearthquakes have affected the site. Event I (P1) is clear in both trenches. In TC2, unit U1 is faulted by fault F3, and it exhibits a cumulative displacement of approximately 24 cm (Figure 10). This displacement is larger than the 10-cm offset of U2b produced by the subsequent earthquake (Event II) (Figure 11a). In TC3, additional clear evidence shows that this event led to subsidence of the surface and faulting of the strata. Especially on the eastern wall of TC3, subunit U1b, which can be regarded as a marker for this event and contains some thin sand layers rich in organic material, was obviously displaced and deformed and it is unconformably overlain by sedimentary unit U2 (Figure 12). The clearest evidence for Event II (P2), as revealed in TC2, is that layer U2b, which has been crumpled and deformed, was displaced by about 10 cm by fault F3 prior to deposition of an unconformable sedimentary layer U3 (Figures 10, 11a). The occurrence of Event III (P3) can be inferred from the postdepositional displacement of unit U3 by faults F1, F2, F3, and F4, as well as the uplift of the same unit on the hangingwall of fault F1, as visible in TC2 (Figures 10, 11b). These displacements indicate the occurrence of an event before deposition of unit U4. In TC3, further obvious evidence for this event is that faults F1 and F2 have displaced unit U3 and formed a colluvial wedge (W) (Figure 12). Subunit U4a is another marker for identification of P3. This subunit is a yellow and brown gravel layer with an unconformable relationship to unit U3, overlying the wedge. Event IV (P4) is the most recent event, i.e., the 1973 M7.6 earthquake, which produced the surface rupture.
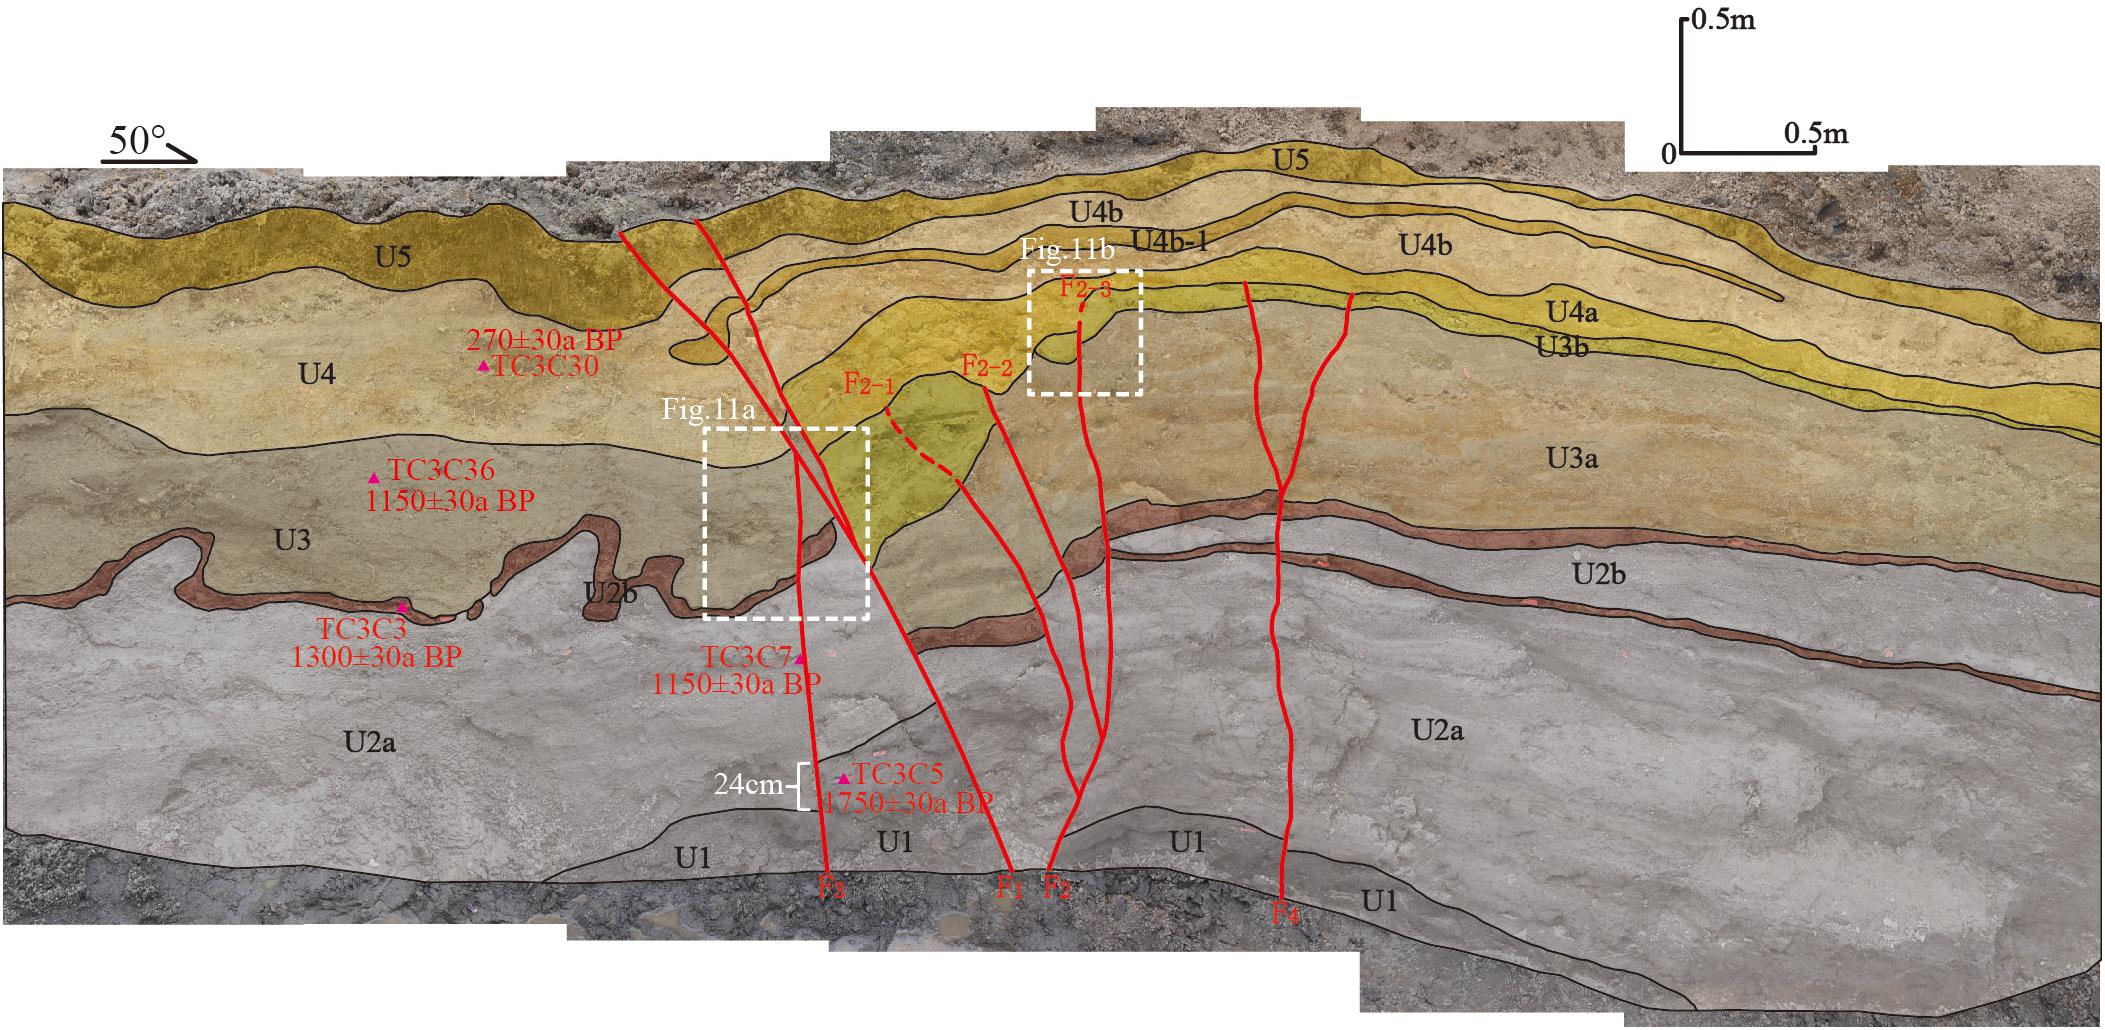
Figure 10. The exposed northwestern wall and geological section of TC2 showing stratigraphic units U1–U5. The purple triangles mark the collecting position of the samples used for carbon dating. The white dashed rectangles mark the locations of Figures 11a,b.
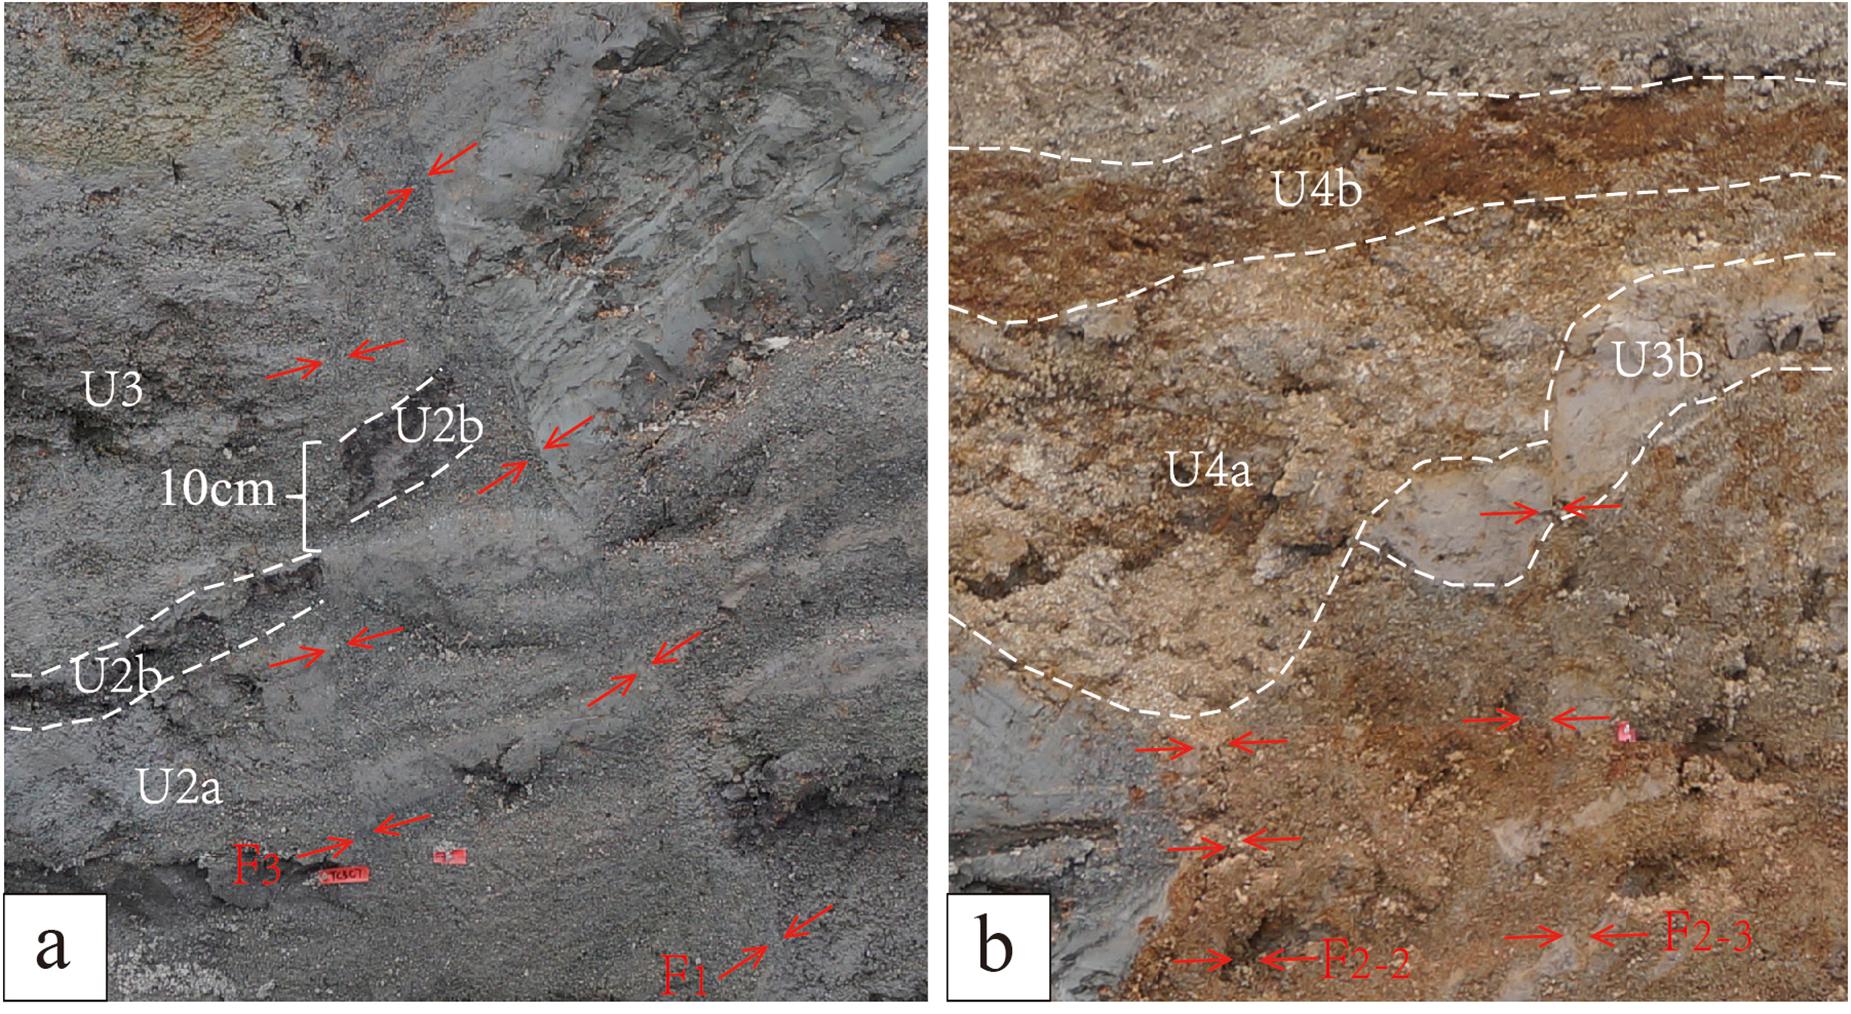
Figure 11. Local enlarged photographs of the northwestern wall of trench TC2: (a) marker unit U2b-1, which was displaced by F3 during Event II, and (b) unit U3b, which was displaced by F2–3 and covered by unit U4 during Event III.
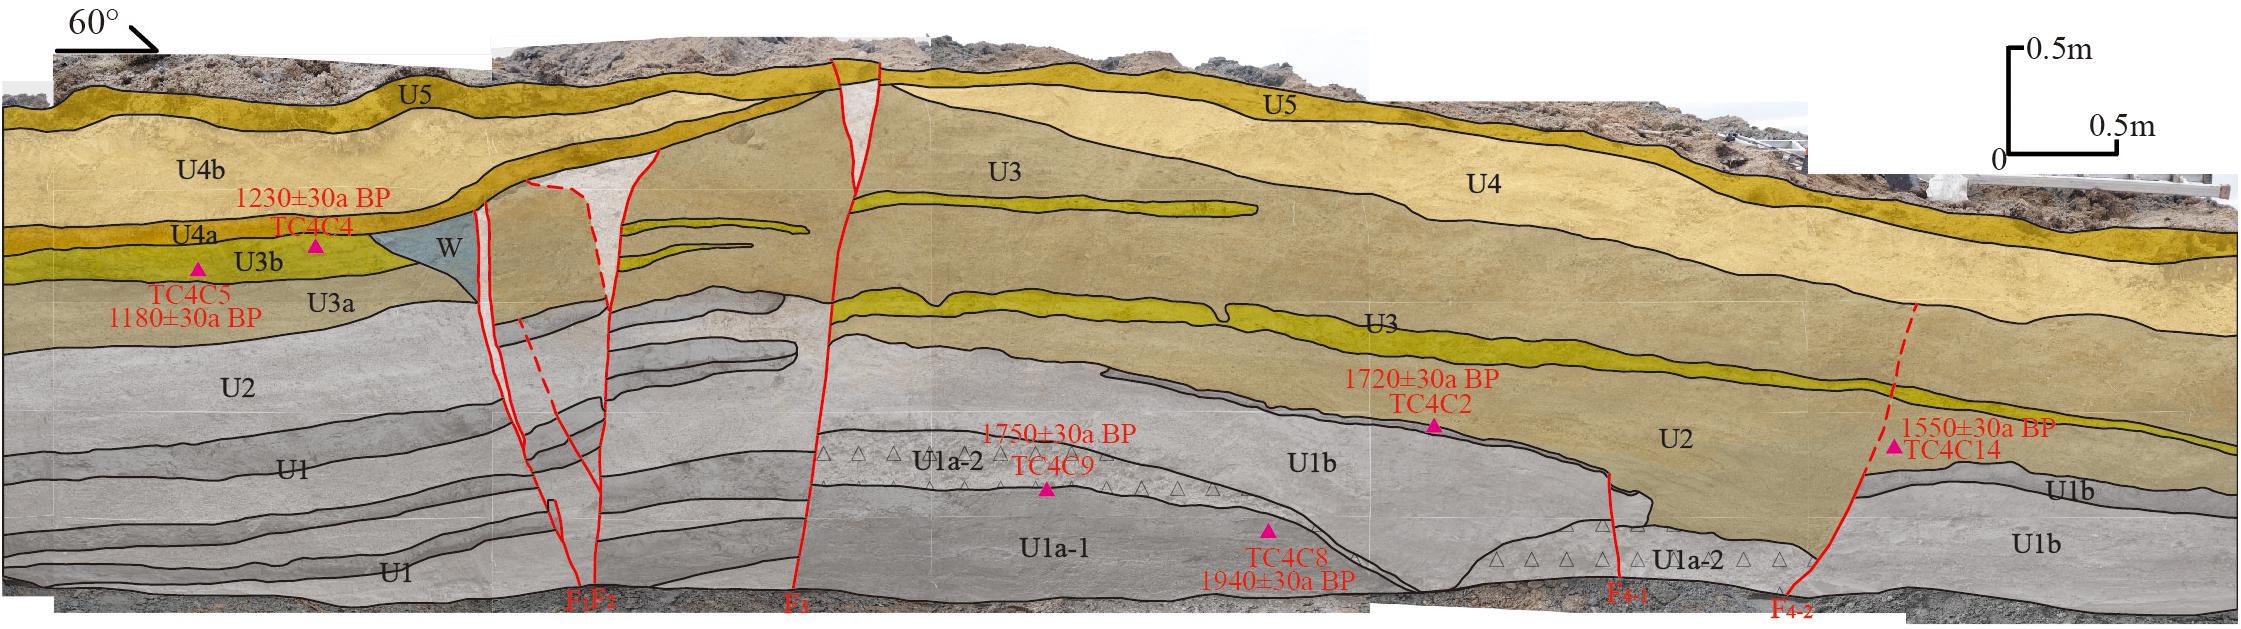
Figure 12. The exposed northwestern wall and geological section of trench TC3 showing stratigraphic units U1–U5. The purple triangles mark the collecting positions of the samples used for carbon dating.
Based on the sequence of strata and the radiocarbon dating results (Figure 9 and Table 1), we constructed a stratigraphy–age model using OxCal4.3.1 and we concluded that four events had occurred (Figure 13). The radiocarbon calibrated dating and stratigraphic constraints for the events are 318–545 AD, 677–833 AD, 907–1622 AD and 1973 AD.
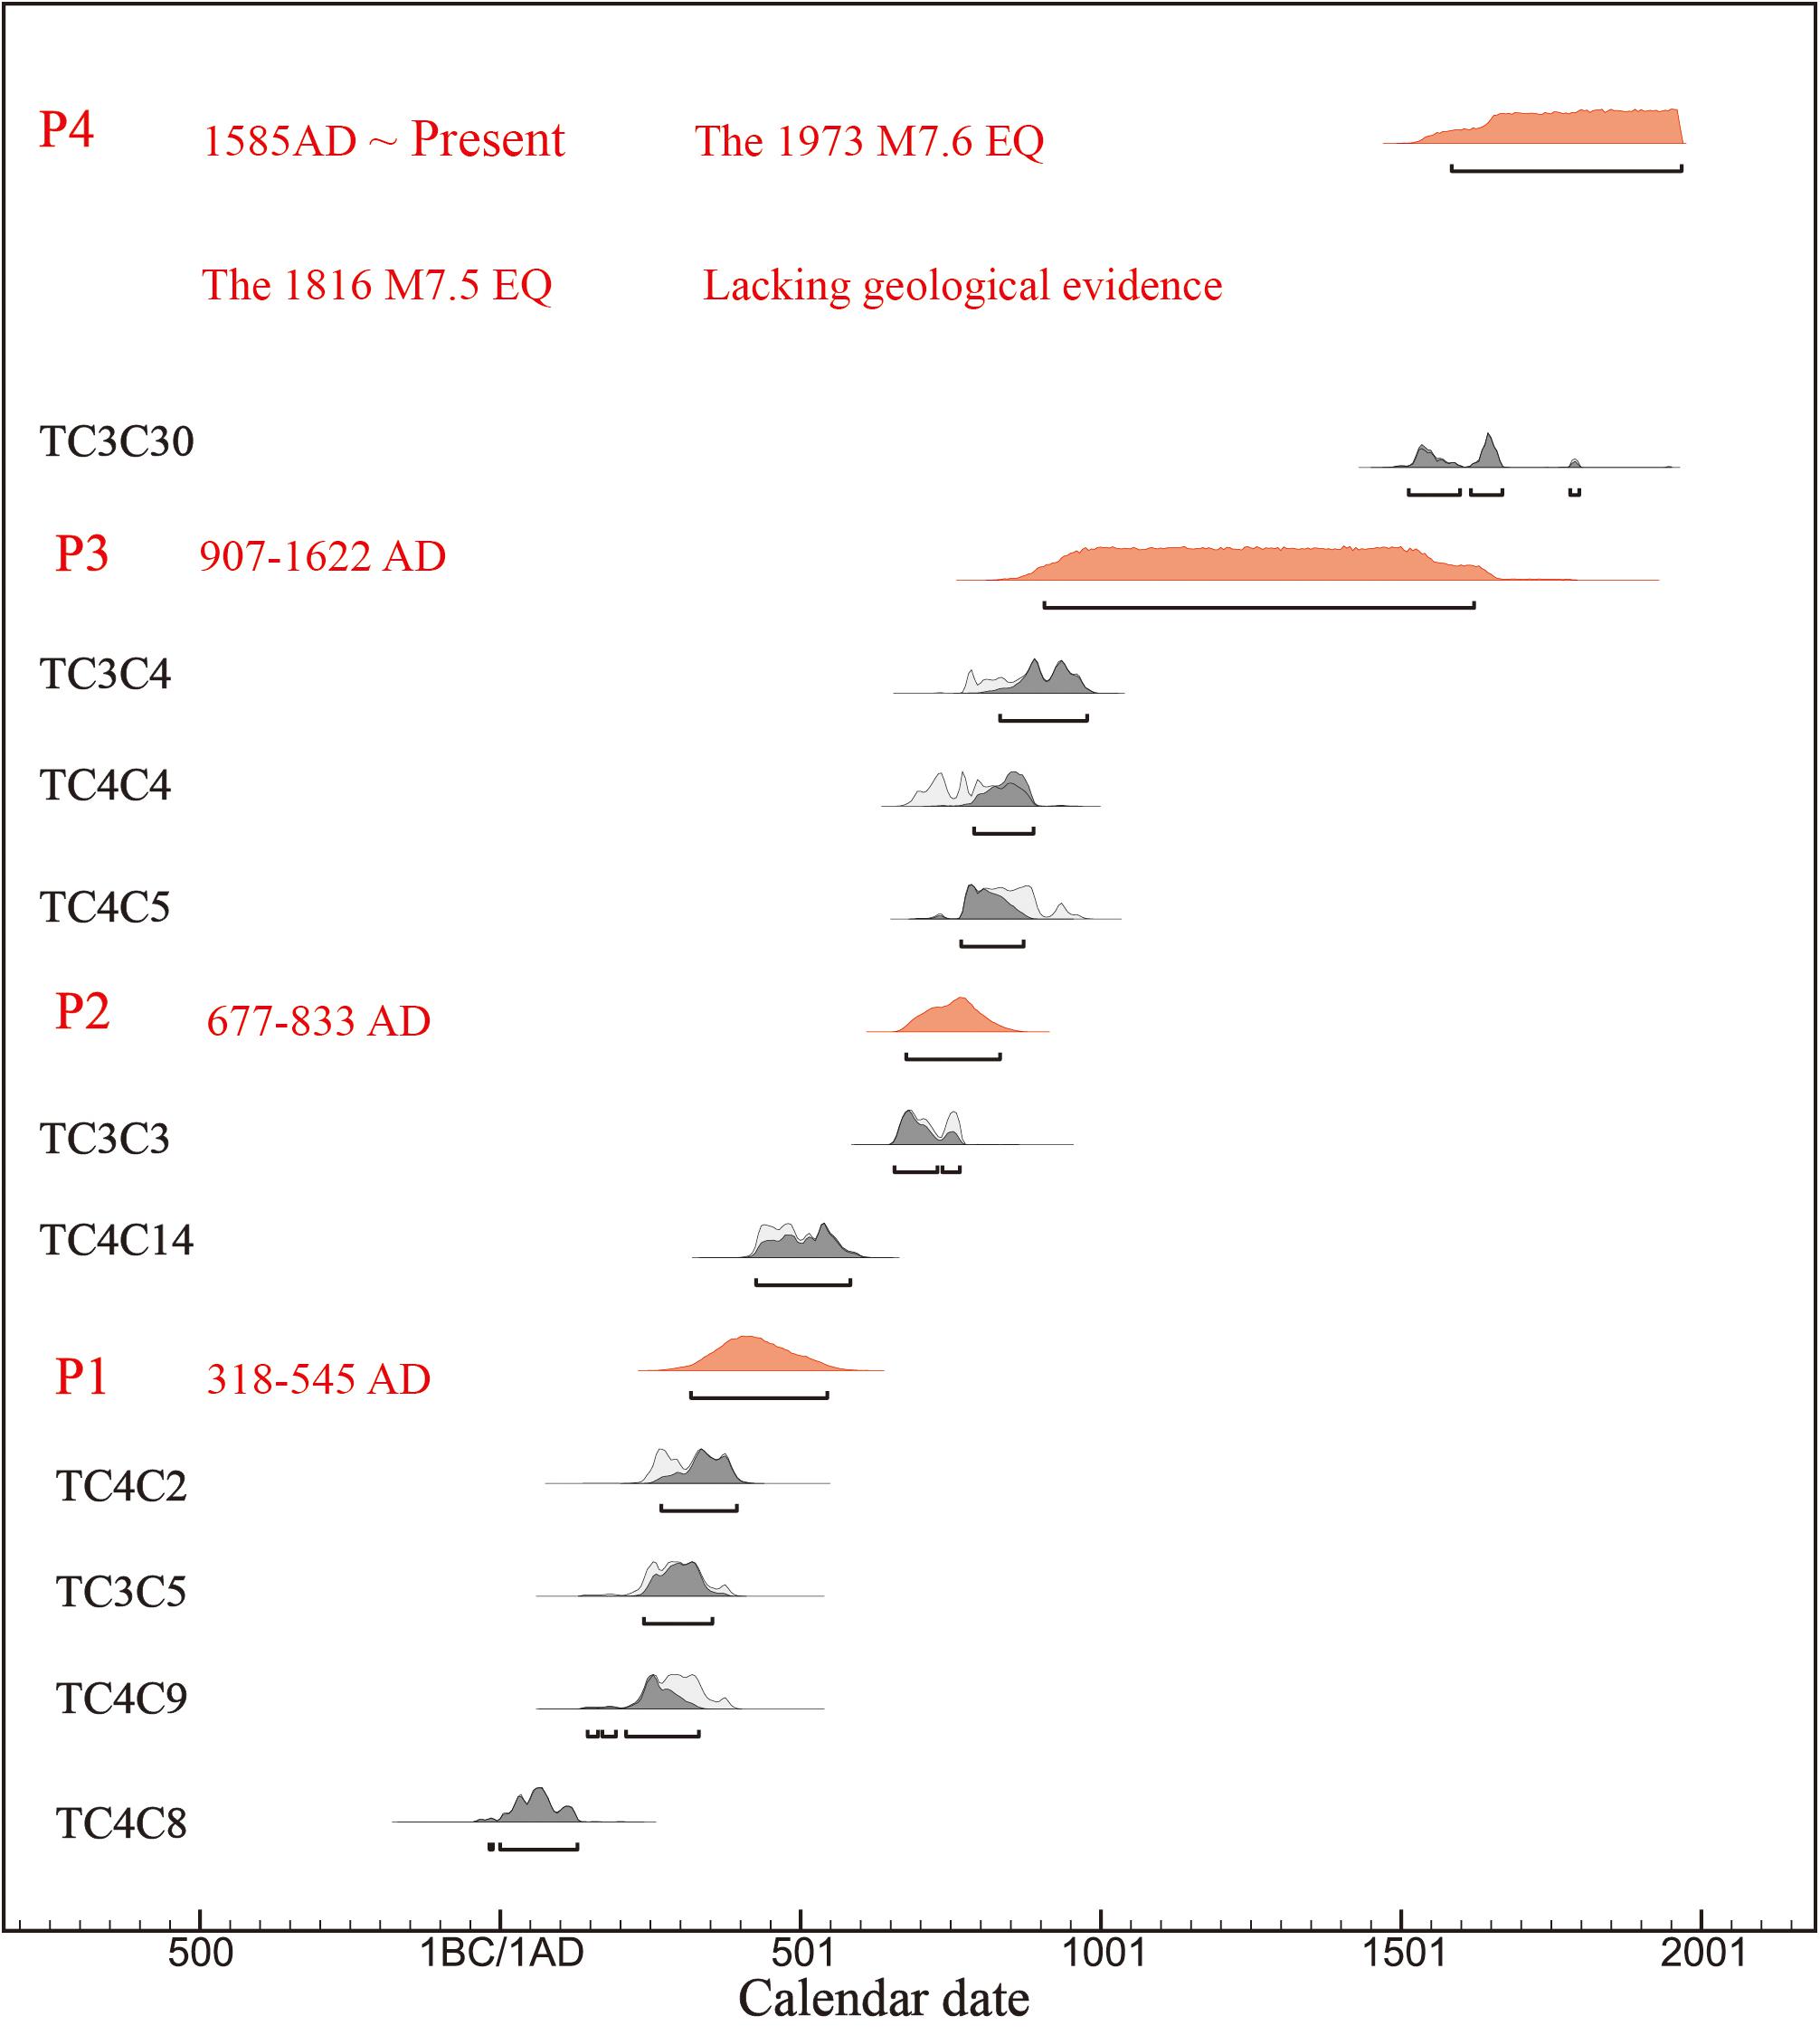
Figure 13. Results of OxCal analysis of radiocarbon dates from site 2. The raw radiocarbon ages were calibrated by OxCal 4.3.1.
Discussion
Earthquake Sequence of the Luhuo Section
At site 1, we identified five earthquake events (E1–E5) that are dated to 17862–17517 BC, 12030–769 BC, 1008–1444 AD, 1451–1655 AD and 1973 AD (Figure 8). In addition, four events (P1–P4) were identified at site 2. These events are dated to 318–545 AD, 677–833 AD, 907–1662 AD, and 1973 AD (Figure 13). It is clear that the latest event was the 1973 earthquake, based on the surface rupture that it produced. The preceding event was dated at 1451–1655 AD in TC1. From historical records of large earthquakes, the earliest record of an M7.7 seismic event was in 1327 AD, which occurred on the southern segment of the Xianshuihe fault (Wen et al., 2008). Thus, details of the occurrence of an earthquake of ≥7.0 on the Xianshuihe fault in the past 500 years would be included in historical literature. The date of the penultimate inferred event is close to the 1816 earthquake; therefore, we suggest that this event was the 1816 earthquake. Although there is a lack of effective geological evidence in the succession revealed in trenches TC2 and TC3, the occurrence of the 1816 earthquake can be inferred from the historical record and geomorphological evidence. As mentioned above, the surface rupture of the 1973 earthquake cut the pressure ridge produced by the previous earthquake (Figure 3a), and hence, it indicates the existence of the event. The dating of E3 in TC1 is 1008–1444 AD, which is consistent with the date of 907–1662 AD for event P3 in TC2 and TC3. Thus, we suggest that E3 and P3 were the same event. Events P1 and P2, identified in TC2 and TC3, are dated as younger than E2 in TC1, which is dated at 12030–769 BC, but closer to 769 BC. That is to say, we cannot find effective geological evidence in TC1 for the two events revealed in TC2 and TC3. After Event II, a sag pond formed in TC1 and unit Y3 was deposited gradually in a very low-energy environment, resulting in poor layering. This makes it very difficult for us to distinguish seismic events in the unit. Event E2, revealed in TC2, is inferred from the faulting of unit Y2 and the formation of the sag pond. The pond constitutes a low-energy sedimentary environment, in which sedimentary unit Y3 formed slowly after E2. These sedimentary conditions would have probably resulted in poor stratification of the deposit. In addition, the geological records of seismic events would be very unclear and identification of different earthquake events would be difficult. Conversely, the well-stratified sedimentary sequence exposed in TC2 and TC3 is representative of a high-energy diluvial environment, which is conducive to identification of paleoearthquakes.
Based on the evidence, we constructed a reasonably complete earthquake sequence for the past 3000 years that includes six events dated at 769 BC, 318–545 AD, 677–833 AD, 1008–1444 AD, 1816 AD and 1973 AD. The intervals between these events are approximately 1200, 324, 471, 590, and 157 years.
Large Earthquake Recurrence Behavior of the Luhuo Section
The recurrence intervals of the events provide evidence that the rupture behavior of the Luhuo section of the Xianshuihe fault deviates from the classic time- or slip-predictable models and instead, represents clustering seismic behavior. Moreover, the segment has experienced an ongoing seismically active period over the past 3000 years. Even now, the entire Xianshuihe fault shows a high degree of seismic activity. Temporal variation in the occurrence of large earthquakes has fundamental implications for understanding how active faults store and release strain energy. Dolan et al. (2016) believed that the rates of stress accumulation and release must be balanced within an earthquake cycle, whilst undergoing two different stages: slower-than-average stress accumulation and faster-than-average stress release. On the Luhuo segment, the earliest earthquake for which evidence is revealed in our trenches is dated at 17862–17517 BC. The second paleoearthquake, which is dated to approximately 769 BC, is identified based on the opening of the sag pond in TC1. We cannot rule out the possibility of paleoearthquake omissions during such a long recurrence interval, however, we suggest that there was a long lull in earthquake activity during this period, which might balance the high level of activity and abnormal accelerating stress release of current earthquakes.
We obtained a reasonably complete earthquake sequence for the past 3000 years. Moreover, Qian (1989) found fault offsets with a similar distribution to those produced by the 1973 earthquake on the Luhuo segment and suggested that these offsets were produced by earthquakes of similar magnitude. We also found a gully was faulted with sizable offsets of approximately 4–5 m (Figure 3b) on the newest diluvial fan, which could be regarded as coseismic offsets of the earthquake events. Reid’s elastic rebound theory (Reid, 1910) has long been used as the fundamental conceptual theory of earthquake behavior (Matthews et al., 2002; Field et al., 2014). According to the theory, stress is released suddenly during major earthquake ruptures and it accumulates slowly between earthquakes. From the earthquake recurrence intervals and the coseismic offsets, the slip rate in different periods can be calculated. However, it was not possible to obtain the coseismic offset of the earliest earthquake because of the rupture characteristics of the Luhuo segment (as mentioned above); therefore we instead used the average value of coseismic offsets. There were two episodes of pulsed slip with rates of approximately 17.3 and 25.5 mm/a over the past 3000 years (Figure 14). The fault strike-slip rate during the pulsed slip period is approximately 2–3 times faster than the average rate at 8.4 mm/a. The characteristics of the earthquake recurrence intervals on the Luhuo segment indicate that the cause of the slip pulse is temporal earthquake clustering. Similar behavior has been documented for other active faults. For example, based on study of the response of the Sanxiton River to the activities of the Awatere Fault in New Zealand, Mason et al. (2006) found that the slip rate of the fault varied with time. Dolan et al. (2016) also found evidence that the Garlock Fault, in CA (United States), displayed pronounced variations in slip rate. Gold et al. (2016) reported that there was a pulse of accelerated slip on the Altyn Tagh fault, northwest China, in the past 16000 years. Moreover, they suggested that the cause of slip pulses could be either spatiotemporal clustering of earthquakes or a single great earthquake. Therefore, we suggest that the Luhuo segment of the Xianshuihe fault exhibits temporal variations in slip rate because of the seismic clustering behavior of large earthquakes.
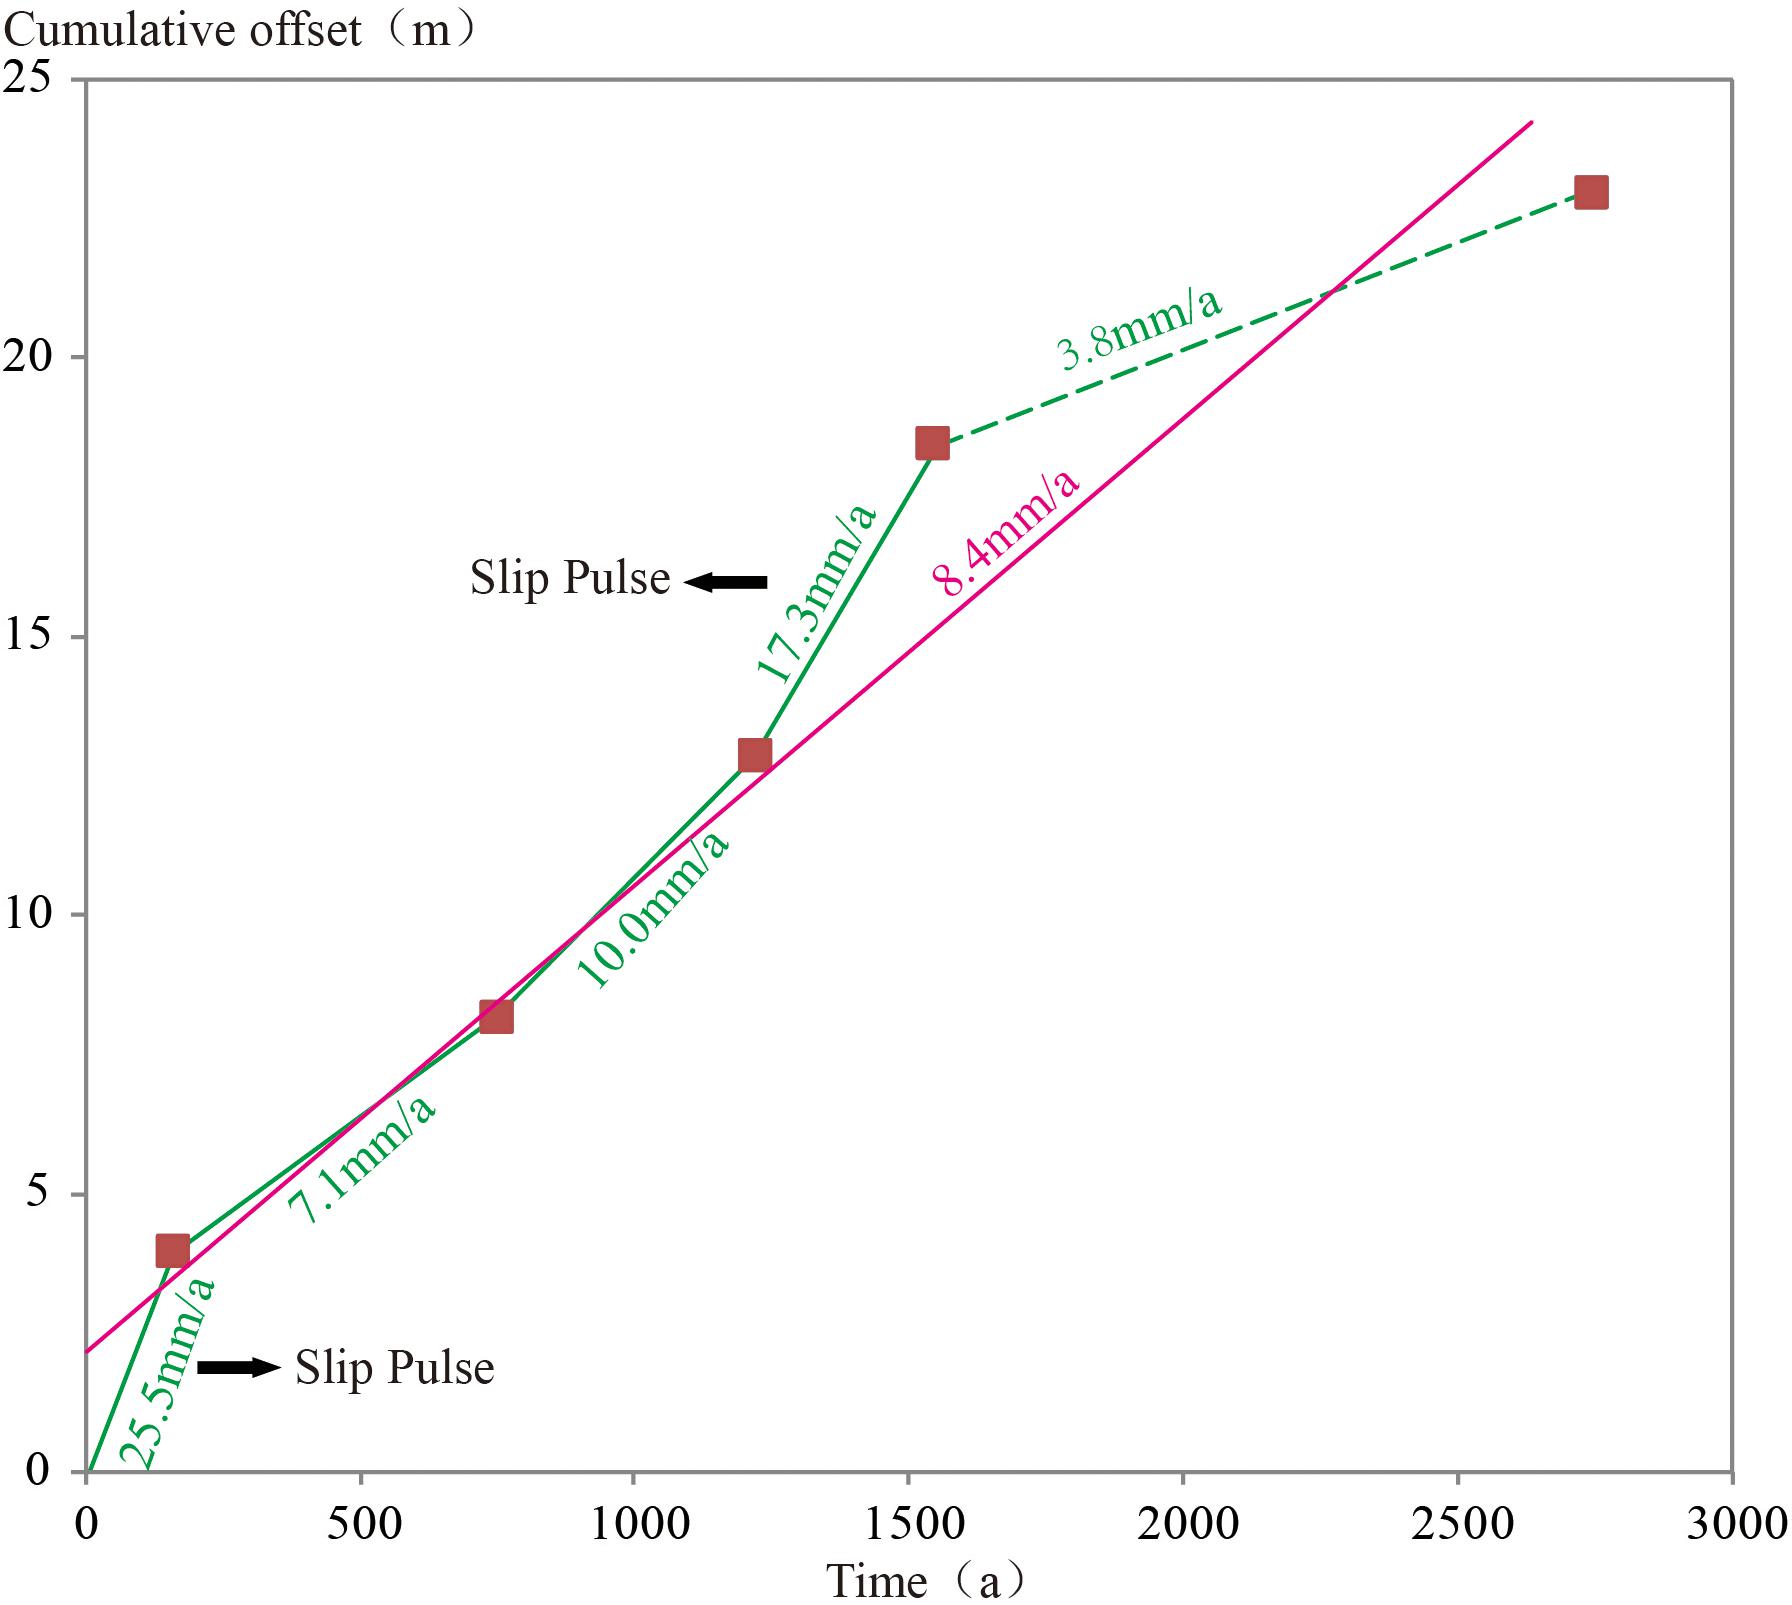
Figure 14. Slip rates of the Luhuo segment over the past 3000 years. Green lines show slip rates in different periods. Purple line shows the average slip rate over past 3000 years.
In addition, the Luhuo segment displays complexity of earthquake occurrence over time. Two large historical earthquakes have occurred on the Luhuo segment of the Xianshuihe fault, i.e., the 1973 M7.6 earthquake and the 1816 M7.5 earthquake. The occurrence interval between these two events is only 157 years. However, it remains unknown why sufficient stress might remain after the occurrence of a major earthquake to allow another similarly sized event to occur shortly thereafter (Tormann et al., 2015). We can propose two possible explanations for the abnormal accelerated stress release between the 1816 and 1923 earthquakes. The first possibility, assuming the strain energy was released completely after the two historical earthquakes, is that the rupture behavior would show pulsed slip caused by earthquake clustering. The second possibility is that the energy was not released completely, suggesting that the Luhuo segment could produce an earthquake greater than the two historical events if all the energy of the segment were released in a single event. In our study, we only obtain the recurrence behavior of the Luhuo segment in past 3000 years and suggest there was a long lull in earthquake activity prior to this period, which might balance the high level of activity and abnormal accelerating stress release of current earthquakes. But we have not obtained a longer record of the paleoearthqaukes and could not discovered a complete super-cycle of large earthquakes. We still need to do more work to reveal more detail of large earthquake recurrence behavior on the Luhuo segment of the Xianshuihe fault.
Conclusion
Through field investigations, trench excavations and analysis of historical earthquakes of the Luhuo segment of the Xianshuihe fault, we identified six seismic events in the past 3000 years, which were dated to 769 BC, 318–545 AD, 677–833 AD, 1008–1444 AD, 1816 AD and 1973 AD. The intervals between these events are approximately 1200, 324, 471, 590, and 157 years. The recurrence behavior of large earthquakes on the fault deviates from the classic time- or slip-predictable models, representing clustering behavior. Two episodes of pulsed slip, in which the release rate was approximately 2–3 times faster than the average rate at 8.4 mm/a, occurred in the past 3000 years. Based on the large earthquake sequence characteristics, we suggest that the slip pulses were caused by temporal seismic clustering. Moreover, the Luhuo segment has experienced ongoing high seismic activity in the past 3000 years, and the entire Xianshuihe fault currently exhibits a high degree of seismic activity. Thus, we suggest there was a long lull in paleoearthquake activity before this period, which might balance the high level of activity and abnormal accelerating stress release of current earthquakes.
Data Availability Statement
All datasets analyzed for this study are included in the article/supplementary material.
Author Contributions
ML mainly participated in the field work and completed the writing of the article. LC mainly participated in field work, formed the idea of the article, and supported the completion of the article. YR, YL, SG, MH, and LL participated in field work for the article. All authors contributed to the article and approved the submitted version.
Funding
The earthquake catalog for this study was provided by Sichuan Earthquake Agency, Chengdu, China. The topography data (SRTM data V4) were obtained from the website: http://srtm.csi.cgiar.org. This work was supported financially by the National Natural Science Foundation of China (Grant 41372218), Basic Scientific Work of the Institute of Geology, China Earthquake Administration (IGCEA1418) and the Project of Science for Earthquake Resilience (XH192305), which is part of the China Earthquake Administration.
Conflict of Interest
The authors declare that the research was conducted in the absence of any commercial or financial relationships that could be construed as a potential conflict of interest.
References
Allen, C. R., Luo, Z. L., Qian, H., Wen, X. Z., Zhou, H. W., and Huang, W. S. (1991). Field study of a highly active fault zone: the Xianshuihe fault of southwestern China. Geol. Soc. Am. Bull. 103, 1178–1199.
Bai, M. K., Chevalier, M. L., Pan, J. W., Replumaz, A., Leloup, P. H., Métois, M., et al. (2018). Southeastward increase of the late quaternary slip-rate of the Xianshuihe fault, eastern Tibet. Geodynamic and seismic hazard implications. Earth Planet. Sci. Lett. 485, 19–31. doi: 10.1016/j.epsl.2017.12.045
Bull, J. M., Barnes, P. M., Lamarche, G., Sanderson, D. J., Cowie, P. A., Taylor, S. K., et al. (2006). High-resolution record of displacement accumulation on an active normal fault: implications for models of slip accumulation during repeated earthquakes. J. Struct. Geol. 28, 1146–1166. doi: 10.1016/j.jsg.2006.03.006
Chen, G. H., Xu, X. W., Wen, X. Z., and Chen, Y. G. (2016). Late quaternary slip-rates and slip partitioning on the southeastern Xianshuihe Fault system, Eastern Tibetan Plateau. Acta Geol. Sin. 90, 537–554. doi: 10.1111/1755-6724.12689
Dolan, J. F., Mcauliffe, L. J., Rhodes, E. J., Mcgill, S. F., and Zinke, R. (2016). Extreme multi-millennial slip rate variations on the garlock fault, California: strain super-cycles, potentially time-variable fault strength, and implications for system-level earthquake occurrence. Earth Planet. Sci. Lett. 446, 123–136. doi: 10.1016/j.epsl.2016.04.011
Donnellan, A., Hager, B. H., and King, R. W. (1993). Discrepancy between geological and geodetic deformation rates in the Ventura basin. Nature 366, 333–336. doi: 10.1038/366333a0
England, P., and Molnar, P. (2005). Late quaternary to decadal velocity fields in Asia. J. Geophys. Res. Solid Earth 110, 1–27. doi: 10.1029/2004JB003541
Field, E. H., Arrowsmith, R. J., Biasi, G. P., Bird, P., Dawson, T. E., Felzer, K. R., et al. (2014). Uniform california earthquake rupture forecast, version 3 (UCERF3)–the time-independent model. Bull. Seismol. Soc. Am. 104, 1122–1180. doi: 10.1785/0120130164
Gold, R. D., and Cowgill, E. (2011). Deriving fault-slip histories to test for secular variation in slip, with examples from the Kunlun and Awatere faults. Earth Planet. Sci. Lett. 301, 52–64. doi: 10.1016/j.epsl.2010.10.011
Gold, R. D., Cowgill, E., Arrowsmith, J. R., and Friedrichd, A. M. (2016). Pulsed strain release on the Altyn Tagh fault, northwest China. Earth Planet. Sci. Lett. 2017, 291–300.
Hu, C. Z., Yang, P. X., Liang, P., Su, P., Xiong, R. W., Li, X. Q., et al. (2015). The Holocene paleoearthquakes on the 2014 Kangding Ms6.3 earthquake faults. Chin. Sci. Bull. 60, 2236–2244.
Jiang, G. Y., Xu, X. W., Chen, G. H., Liu, Y. J., Fukahata, Y., Wang, H., et al. (2015). Geodetic imaging of potential seismogenic asperities on the Xianshuihe-Anninghe-Zemuhe fault system, southwest china, with a new 3-D viscoelastic interseismic coupling model. J. Geophys. Res. Solid Earth 120, 1855–1873. doi: 10.1002/2014JB011492
Klinger, Y., Etchebes, M., Tapponnier, P., and Narteau, C. (2011). Characteristic slip for five great earthquakes along the Fuyun fault in China. Nat. Geosci. 4, 389–392. doi: 10.1038/ngeo1158
Li, D. Y., Chen, L. C., Liang, M. J., Gao, S. P., Zeng, D., Wang, H., et al. (2017). Holocene paleoseismologic record and rupture behavior of large earthquake on the Xianshuihe fault. Seismol. Geol. 39, 623–643. doi: 10.3969/j.issn.0253-4967.2017.04.001
Li, T. T., Du, Q. F., and You, Z. L. (1997). The Xianshuihe Fault Zone And Assessment Of Strong Earthquake Risk. Chengdu: Science and Techonology Press of Sichuan.
Mason, D. P. M., Little, T. A., and Dissen, R. J. V. (2006). Rates of active faulting during late Quaternary fluvial terrace formation at Saxton River, Awatere fault, New Zealand. Geol. Soc. Am. Bull. 118, 1431–1446. doi: 10.1130/B25961.1
Matthews, M. V., Ellworth, W. L., and Reasenberg, P. A. (2002). A brownian model for recurrent earthquakes. Bull. Seismol. Soc. Am. 92, 2233–2250. doi: 10.1785/0120010267
Mouslopoulou, V., Walsh, J. J., and Nicol, A. (2009). Fault displacement rates on a range of timescales. Earth Planet. Sci. Lett. 278, 186–197. doi: 10.1016/j.epsl.2008.11.031
Onderdonk, N., McGill, S., and Rockwell, T. (2015). Short-term variations in slip rate and size of pre-historic earthquakes during the past 2000yrs on the northern San Jacinto fault zone, a major plate boundary structure in Southern California. Lithosphere 7, 211–234.
Papadimitriou, E., Wen, X., Karakostas, V., and Jin, X. (2004). Earthquake triggering along the xianshuihe fault zone of Western Sichuan, China. Pure Appl. Geophys. 161, 1683–1707. doi: 10.1007/s00024-003-2471-4
Qian, H. (1989). Fault landforms along the Xianshuihe fault zone and their seimological significance. Seismol. Geol. 11, 43–49.
Ramsey, C. B., and Lee, S. (2013). Recent and planned developments of the program oxcal. Radiocarbon 55, 720–730. doi: 10.1017/S0033822200057878
Reid, H. F. (1910). Mechanics of the Earthquake, The California Earthquake Of April 18, 1906. Report of the State Investigation Commission. Washington DC: Carnegie Institution of Washington.
Rui, X., and Stamps, D. S. (2016). Present-day kinematics of the eastern tibetan plateau and sichuan basin: implications for lower crustal rheology. J. Geophys. Res. Solid Earth 121, 3846–3866. doi: 10.1002/2016JB012839
Savage, J. C., and Cockerham, R. S. (1987). Quasi-periodic occurrence of earthquakes in the 1978-1986 bishop-mammoth lakes sequence, eastern California. Bull. Seismol. Soc. Am. 77, 1347–1358. doi: 10.1016/0009-2541(87)90172-0
Schwartz, D. P., and Coppersmith, K. J. (1984). Fault behavior and characteristic earthquakes: examples from the wasatch and san andreas fault zones. J. Geophys. Res. 89, 5681–5698. doi: 10.1029/JB089iB07p05681
Shimazaki, K., and Nakata, T. (1980). Time-predictable recurrence model for large earthquakes. Geophys. Res. Lett. 7, 279–282. doi: 10.1029/GL007i004p00279
Tormann, T., Enescu, B., Woessner, J., and Wiemer, S. (2015). Randomness of megathrust earthquakes implied by rapid stress recovery after the Japan earthquake. Nat. Geosci. 8, 152–158. doi: 10.1038/ngeo2343
Wang, H., Wright, T. J., and Biggs, C. J. (2009). Interseismic slip rate of the northwestern Xianshuihe fault from InSAR data. Geophys. Res. Lett. 36:L03302. doi: 10.1029/2008GL036560
Weldon, R., Scharer, K., Fumal, T., and Biasi, G. (2004). Wrightwood and earthquake cycle: what a long recurrence record tells us about how faults work. GSA Today 14, 4–10. doi: 10.1130/1052-517320040142.0CO;2
Wen, X. Z., Allen, C. R., Luo, Z. L., Qian, H., Zhou, H. W., and Huang, W. S. (1989). Segmentation, geometric features, and their seismotectonic implicatons for the Holocene Xianshuihe fault zone. Acta Seismol. Sin. 11, 362–372.
Wen, X. Z., Ma, S. L., Xu, X. W., and He, Y. N. (2008). Historical pattern and behavior of earthquake ruptures along the eastern boundary of the sichuan-yunnan faulted-block, southwestern china. Phys. Earth Planet. 168, 16–36. doi: 10.1016/j.pepi.2008.04.013
Yan, B., and Lin, A. M. (2015). Systematic deflection and offset of the yangtze river drainage system along the strike-slip Ganzi-Yushu-Xianshuihe fault zone, Tibetan Plateau. J. Geodyn. 87, 13–25. doi: 10.1016/j.jog.2015.03.002
Yan, B., and Lin, A. M. (2017). Holocene activity and paleoseismicity of the Selaha Fault, southeastern segment of the strike-slip Xianshuihe Fault Zone, Tibetan Plateau. Tectonophysics 694, 302–318. doi: 10.1016/j.tecto.2016.11.014
Zhang, P. Z. (2013). A review on active tectonics and deep crustal processes of the Western Sichuan region, eastern margin of the Tibetan Plateau. Tectonophysics 584, 7–22. doi: 10.1016/j.tecto.2012.02.021
Zhou, R. J., He, Y. L., Huang, Z. Z., Li, X. G., and Yang, T. (2001). The slip rate and strong earthquake recurrence interval on the qianning-kangding segment of the Xianshuihe fault zone. Acta Seismol. Sin. 3, 250–261.
Keywords: Luhuo segment of the Xianshuihe fault, paleoearthquake, abnormal accelerating stress release behavior, clustering model, slip rate
Citation: Liang M, Chen L, Ran Y, Li Y, Gao S, Han M and Lu L (2020) Abnormal Accelerating Stress Release Behavior on the Luhuo Segment of the Xianshuihe Fault, Southeastern Margin of the Tibetan Plateau, During the Past 3000 Years. Front. Earth Sci. 8:274. doi: 10.3389/feart.2020.00274
Received: 26 February 2020; Accepted: 16 June 2020;
Published: 07 July 2020.
Edited by:
Michele M. C. Carafa, Istituto Nazionale di Geofisica e Vulcanologia (INGV), ItalyReviewed by:
Junjie Ren, China Earthquake Administration, ChinaYong Li, Chengdu University of Technology, China
Chong Xu, China Earthquake Administration, China
Copyright © 2020 Liang, Chen, Ran, Li, Gao, Han and Lu. This is an open-access article distributed under the terms of the Creative Commons Attribution License (CC BY). The use, distribution or reproduction in other forums is permitted, provided the original author(s) and the copyright owner(s) are credited and that the original publication in this journal is cited, in accordance with accepted academic practice. No use, distribution or reproduction is permitted which does not comply with these terms.
*Correspondence: Lichun Chen, Z2x1dGNsY0BnbHV0LmVkdS5jbg==