 Yan Li
 Yang Lu
 Martin J. Siegert
- 1State Key Laboratory of Geodesy and Earth’s Dynamics, Institute of Geodesy and Geophysics, Chinese Academy of Sciences, Wuhan, China
- 2College of Earth and Planetary Sciences, University of Chinese Academy of Sciences, Beijing, China
- 3Department of Earth Science and Engineering, Grantham Institute, Imperial College London, London, United Kingdom
Lake CookE2, upstream of Cook Glacier in East Antarctica, is an “active” subglacial lake that experiences episodic discharge and recharge of basal water. Although around 130 active lakes are known to exist, the majority are not able to be identified by ice-sounding radar techniques, suggesting they are ephemeral and/or distributed stores of small amounts of water rather than permanent significant singular features. However, airborne radar data from Lake CookE2 reveal a bright and flat ice-bed interface, providing clear evidence of deep (>10 m) water surrounded by elevated topography. The data show the lake area is ∼46 km2; three times less than a previous estimate (145 km2) from Ice, Cloud and land Elevation Satellite (ICESat) satellite altimetry, suggesting a bias in identifying subglacial lake area from surface depressions. Using time-series altimetry from ICESat, Cryosat-2, and the Reference Elevation Model of Antarctica, we re-estimate the lake discharged ∼2.73 km3 of water (or ∼59.6 m in lake level) between February 2006 and October 2008. Subsequently, the ice surface over the lake rose steadily and experienced a mean uplift of ∼9 m between January 2011 and November 2016, indicating continuous recharge with total volume increase of ∼0.42 km3. The lake is recharging at a rate of ∼1.1 m/year, which means it could take another ∼39 years to reach the lake level that triggered the previous discharge.
Introduction
Lake CookE2, located at the head of Cook Glacier in Wilkes Land (Figure 1), is an “active” Antarctic subglacial lake. Evidence for this is drawn from the significant surface depression that occurred during 2006–2008 (Smith et al., 2009), interpreted as a sudden loss of basal water. The ice surface lowered by ∼70 m in just 2 years (Mcmillan et al., 2013), due to the largest discharge of basal water measured in Antarctica thus far. Surface depressions with such an amplitude are easily captured by satellite altimetry and/or InSAR techniques (Flament et al., 2014). So far, 129 active subglacial lakes have been identified in Antarctica according to this interpretation, and they featured in the latest inventory of Antarctic subglacial lakes (Wright and Siegert, 2012).
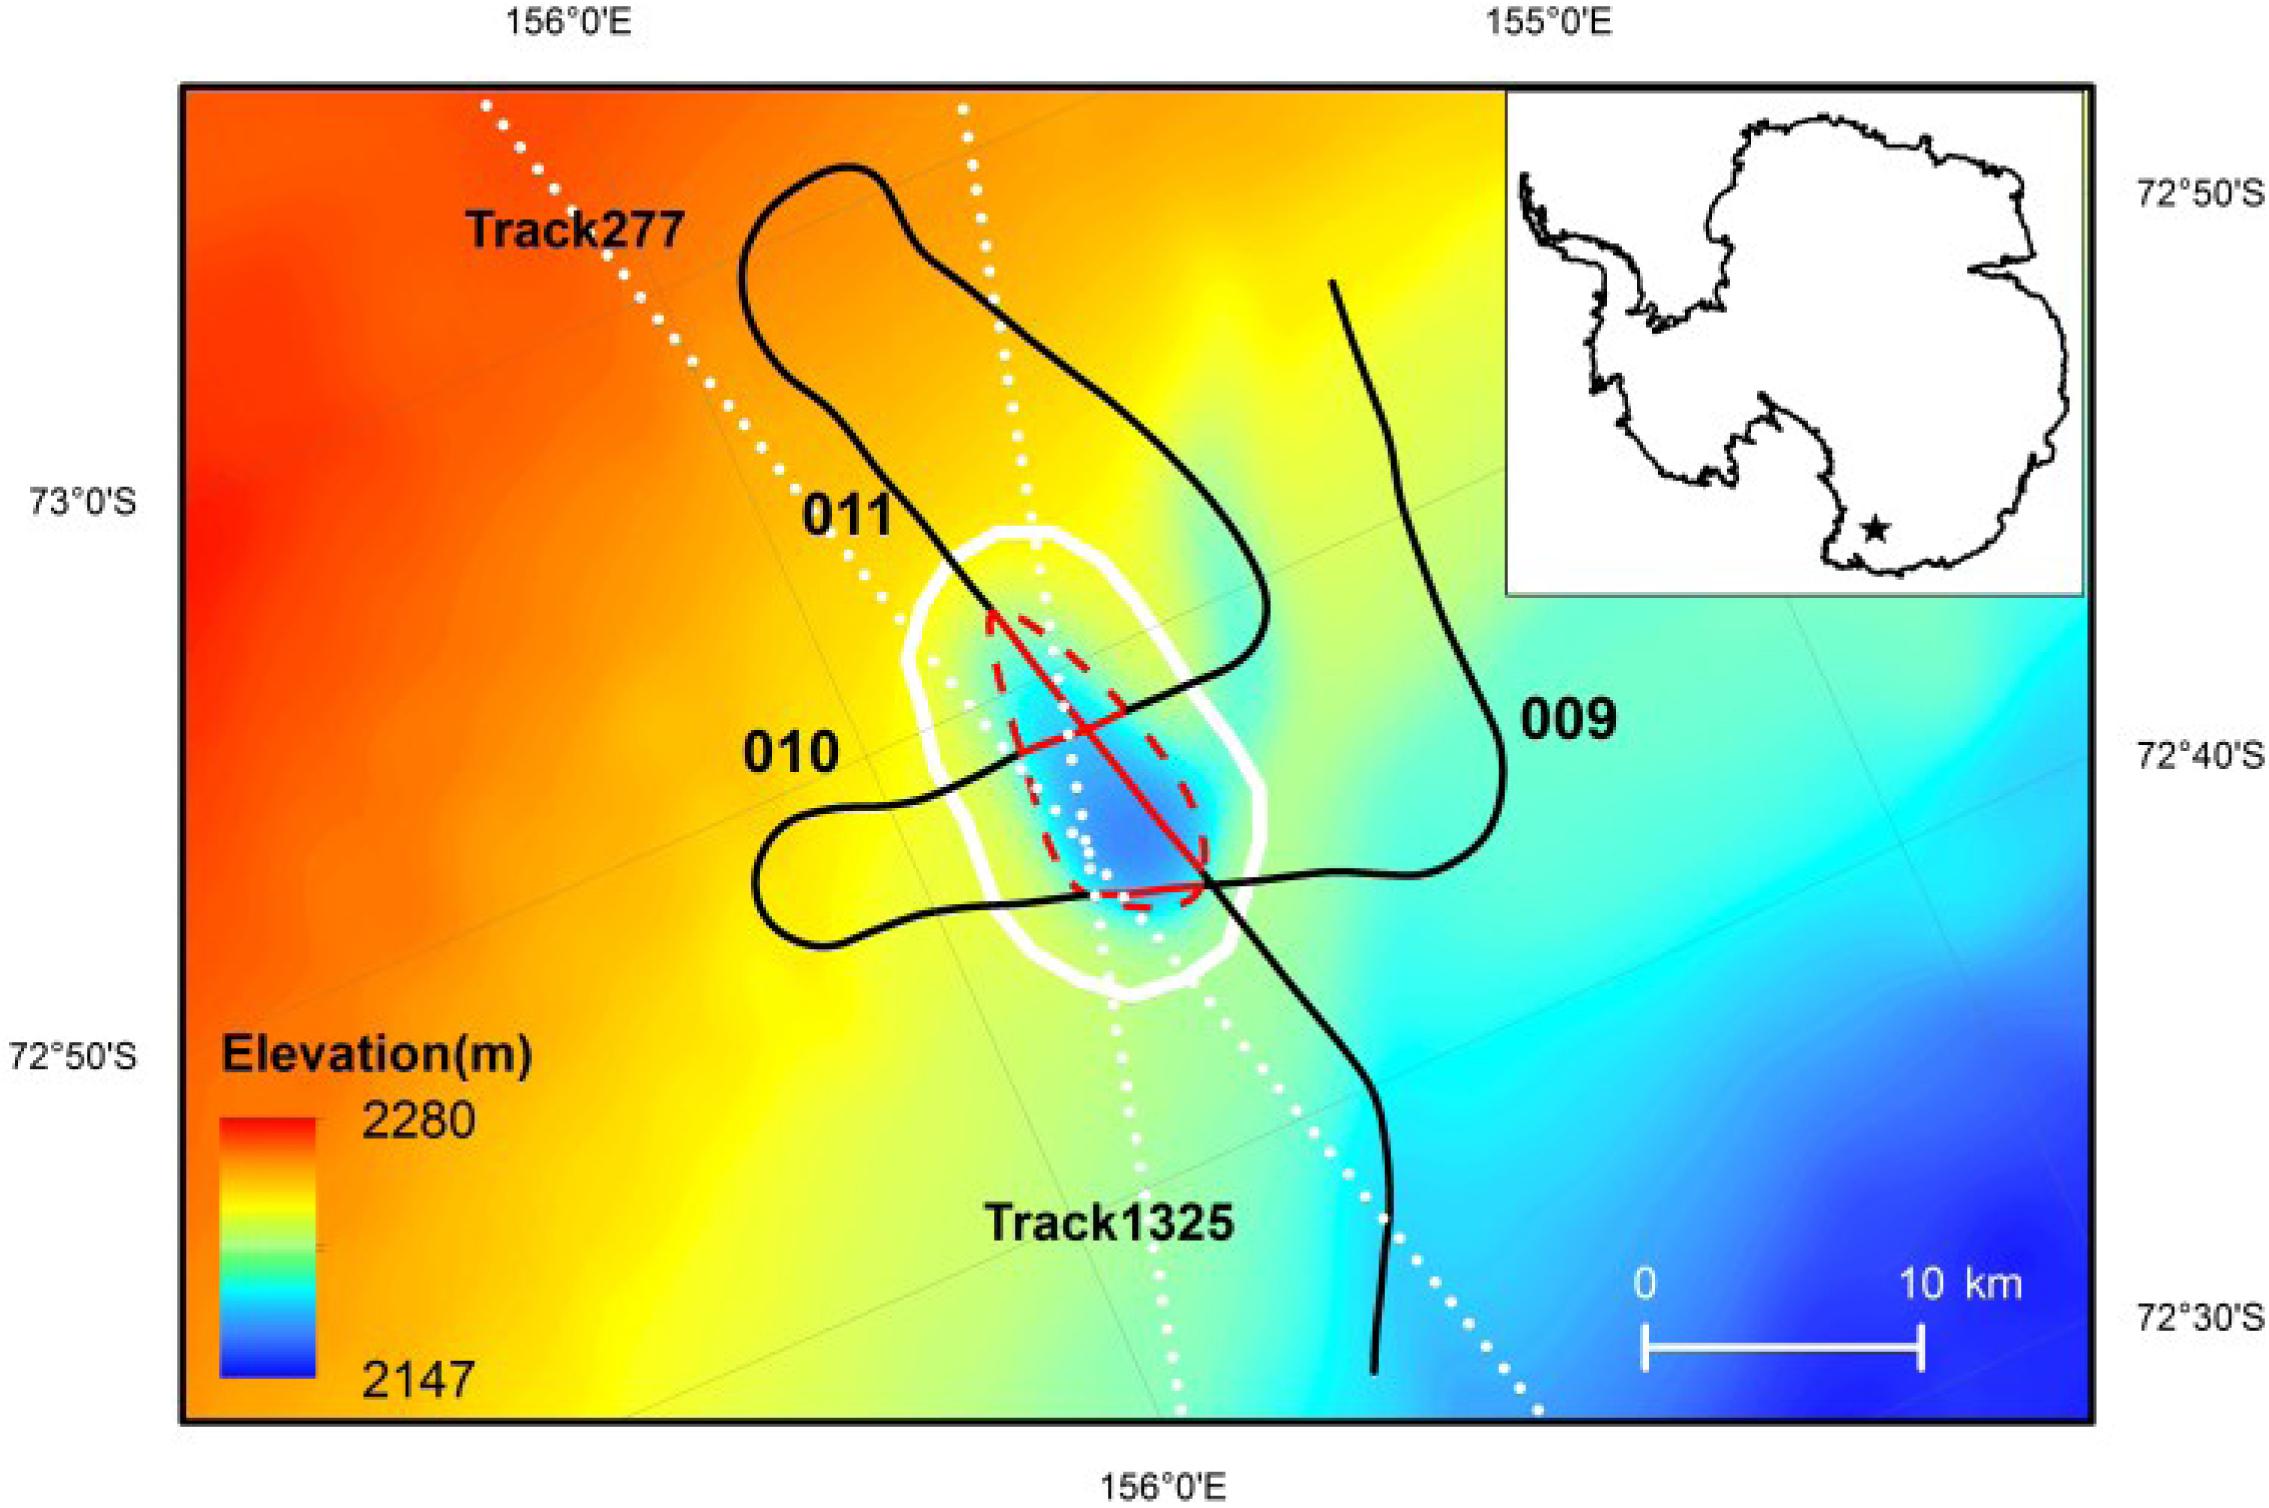
Figure 1. Location of Lake CookE2 and radar transects. Ice surface elevation is from Howat et al. (2019). The white line denotes outline of Lake CookE2 identified by ICESat repeat-pass method (Smith et al., 2009). The red dashed line denotes the new lake outline derived by airborne ice-penetrating radar (from a NASA Operation IceBridge mission, 29th November 2017, numbered 009, 010, and 011). Radar samples located within the new lake outline are denoted by red lines. Radar samples outside of the new lake outline are given by black lines. White dots show ICESat reference tracks 277 and 1325, respectively. The black star in the inset denotes the location of study area.
Lake CookE2 was discovered from ice-surface altimetry more than a decade ago by Smith et al. (2009), but there has been no measurement of the ice-water interface to confirm it as a deep-water lake as opposed to an ephemeral store of distributed water. Most “active” subglacial lakes are not associated with specular radar reflections that characterize deep-water lakes; many exist as a consequence of a complex interaction between ice flow dynamics over subglacial hills, and the temporary build-up of water on their lee sides (Siegert et al., 2014; Wright et al., 2014), resulting in a spatially variable region of radar reflectivity at the ice sheet bed. According to Ice, Cloud, and Elevation Satellite (ICESat) measurements, the area above Lake CookE2 that experiences ice-surface elevation change is ∼145 km2 determined by Smith et al. (2009). Within this zone, the ice-surface slope can reach ∼2°, suggesting significant hydrological forcing by the ice overburden. Indeed such surface slope is enough to drive water up a hill with a slope of over 20°. Subglacial discharge in active lakes can reduce lubrication between ice base and bed materials, causing faster ice flow toward the margin (Stearns et al., 2008; Paolo et al., 2015). Ice surface elevation change on the order of a few meters have been shown to modify basal water pathways, leading to the spatial redistribution of water downstream (Wright et al., 2008). Hence, substantial discharges on the order estimated for Lake CookE2 could influence both the pathway of basal water and the flow of ice above.
Airborne radar sounding is a valuable means of mapping topography and conditions at the base of the ice sheet. For example, radar echoes from subglacial water bodies >10 m in depth are commonly characterized by bright, flat and specular features (Siegert and Ridley, 1998; Carter et al., 2007; Christianson et al., 2012). Radar echoes also allow for the detection of subglacial sediments (Siegert, 2000), basal water channels (Jeofry et al., 2018) and distinct geomorphological features (Rose et al., 2015). Here, we use Multichannel Coherent Radar Depth Sounder 5 (MCoRDS5) radar measurements collected during a NASA Operation IceBridge mission in November 2017 to better constrain the extent of Lake CookeE2. By comparing the SwSARIn data from Cryosat-2 and the high-resolution elevation model, we derive long-term time-series of ice-surface height change for the lake between 2011 and 2016.
Materials and Methods
In brief, we use data from the MCoRDS5 radar to examine the ice-bed interface over the Lake CookE2 region, to first determine whether the lake exists and then to measure its topographic setting. We also combine a new ice-surface elevation model, REMA (see below), with ICESat and Cryosat-2 SwSARIn data to generate a long-term time-series of ice-surface height change from 2003 to 2016, to understand how the lake has behaved in recent years.
Multichannel Coherent Radar Depth Sounder 5 airborne radar data were acquired over the Lake CookE2 on November 29, 2017 during an IceBridge mission. The radar frequency over this region is 300 MHz. Three transects, 009, 010, and 011 (black and red lines in Figure 1), were obtained over Lake CookE2. We use the MCoRDS5 Level 1B data from Centre for Remote Sensing of Ice Sheets (CReSIS), University of Kansas1, which include necessary geophysical parameters such as geodetic coordinates, range travel-time, aircraft elevation, surface interface travel-time and bottom interface travel-time. Radar echoes from a clear ice-water interface typically show bright and flat returns that are distinct compared with echoes from an ice-rock interface that undulate and have variable but generally weaker strengths. This distinction has been used to identify pooled subglacial water of at least 10 m in depth across the ice sheet (Robin, 1975; Gorman and Siegert, 1999; Ilisei et al., 2018).
Antarctic surface elevation models have been generated from recent satellite altimetry missions (DiMarzio, 2007; Helm et al., 2014; Zwally et al., 2014), with a resolution of 500 m for most regions. Recently, a new elevation model, the Reference Elevation Model of Antarctic (REMA), was generated by stereo-photogrammetry based on sub-meter resolution optical satellite imagery (Howat et al., 2019). The spatial resolution of this elevation model used here is 8 m and the elevation error is within 1 m.
Ice-surface height measurements from two satellite altimetry missions, ICESat (between February 2003 and October 2009) and Cryosat-2 (between November 2010 and December 2016), are combined and then differenced with REMA to construct a 13-year record of topography-free ice-surface height change. ICESat was the first satellite laser altimetry mission to measure surface elevation over land and seas, with a precision of ∼15 cm (Siegfried et al., 2011). Cryosat-2 is a radar altimetry satellite, launched in April 2010. The main aim of Cryosat-2 is to measure changes in ice-surface height and sea ice thickness over the Polar regions. An onboard altimeter operates in three modes: low resolution, SAR and SARIn. The SARIn mode covers ice-sheet margins, providing interferometric measurements over steeply sloping regions. A new SARIn elevation product, named SwSARIn data, was generated recently (Gourmelen et al., 2017a) to provide denser elevation measurements by exploiting full radar waveforms (Foresta et al., 2016; Gourmelen et al., 2017b).
By combining an accurate reference elevation model and dense satellite altimetry measurements, we can construct a long-term time-series of ice-surface height change over Lake CookE2. We use an adapted method based on previous studies (Moholdt et al., 2010; Siegfried and Fricker, 2018). For ICESat data, we collect all available elevation data from 17 campaigns within the lake outline. The REMA is interpolated at each ICESat point to obtain a height difference. Then we filter out potential outliers in height differences based on the three-sigma rule, as follows: (1) we calculate the mean and standard deviation of remaining height differences at the beginning (according to the rule, height differences that exceed the triple standard deviation from the mean of height differences are assumed as outliers and then removed); (2) we calculate the mean and standard deviation again using filtered height differences (this step is iteratively implemented until no outlier is detected); and (3) the mean of the final height differences is used to represent the mean height difference with respect to REMA. Measurements in each campaign are processed following the same workflow.
For Cryosat-2 measurements, we construct monthly ice-surface height differences in four steps as follows. First, we confine our study area within a new outline for Lake CookE2 (based on ice-penetrating radar – see below; red dashed line in Figure 1), to generate an ice-surface height change time-series for the lake. SwSARIn measurements within the lake outline are collected for each month. Second, we collect all elevation measurements for each month. If the number of measurements is less than an empirical value of ∼8000 in a particular month, the measurements are discarded and further processing is not be conducted. This is because limited numbers of measurements are likely to introduce a bias in the ice-surface change derivation, especially if data filtering is applied. After initial examination, the REMA is interpolated at each SwSARIn point collected during a month period to obtain the “topography-free” ice-surface height change with respect to the reference elevation model. Three-sigma rule is iteratively used to filter out unreliable height differences in each group. The mean of the filtered height differences is used to represent height changes relative to the elevation model over the lake area. The process is iteratively implemented for each month. Third, we use a −1.5 m (Cryosat-2 minus ICESat) (Mcmillan et al., 2013) estimate to account for elevation bias between the two satellite altimetry missions. Fourth, we combine height differences with REMA between 2003 and 2016 to construct a 13-year record of ice-surface height change over Lake CookE2. Uncertainties in ice-surface change from ICESat and Cryosat-2 are also estimated. The elevation error of REMA is typically less than 1 m (Howat et al., 2019). The accuracy of ICESat measurements over ice sheet is within ±14 cm (Shuman et al., 2006). The accuracy of SwSARIn measurements is estimated to be ∼2 m. Therefore, the accuracy of ice surface change from ICESat and Cryosat-2 is ∼1 m and ∼2.2 m, respectively.
We estimate the long-term change in ice-surface height using Cryosat-2 data by a quadratic model as follows:
where h is the ice-surface height measurement, t is the measurement time, a1 ∼ a5 are coefficients of the terrain model, and a6 and a7 denote linear model coefficients of ice-surface change during study period. x and y are coordinates in the Polar Stereographic South projection.
Results and Discussion
Airborne Ice Penetrating Radar
We present three radar transects across Lake CookE2 (Figure 2). In each, a bright and smooth bed feature can be observed, typical of an ice-water interface, surrounded by undulating returns and overlain by ∼1700 m of ice. The unbroken nature of the basal reflector indicates that the water must be at least 10 m deep (Gorman and Siegert, 1999), confirming Lake CookE2 as a deep-water subglacial lake. Indeed the lake depth is likely much deeper than 10 m when one considers the steep side-wall slopes bordering the lake, if we extrapolate them toward the lake center. Based on this simple approach, it is possible that the lake is several tens, if not hundreds, of meters deep.
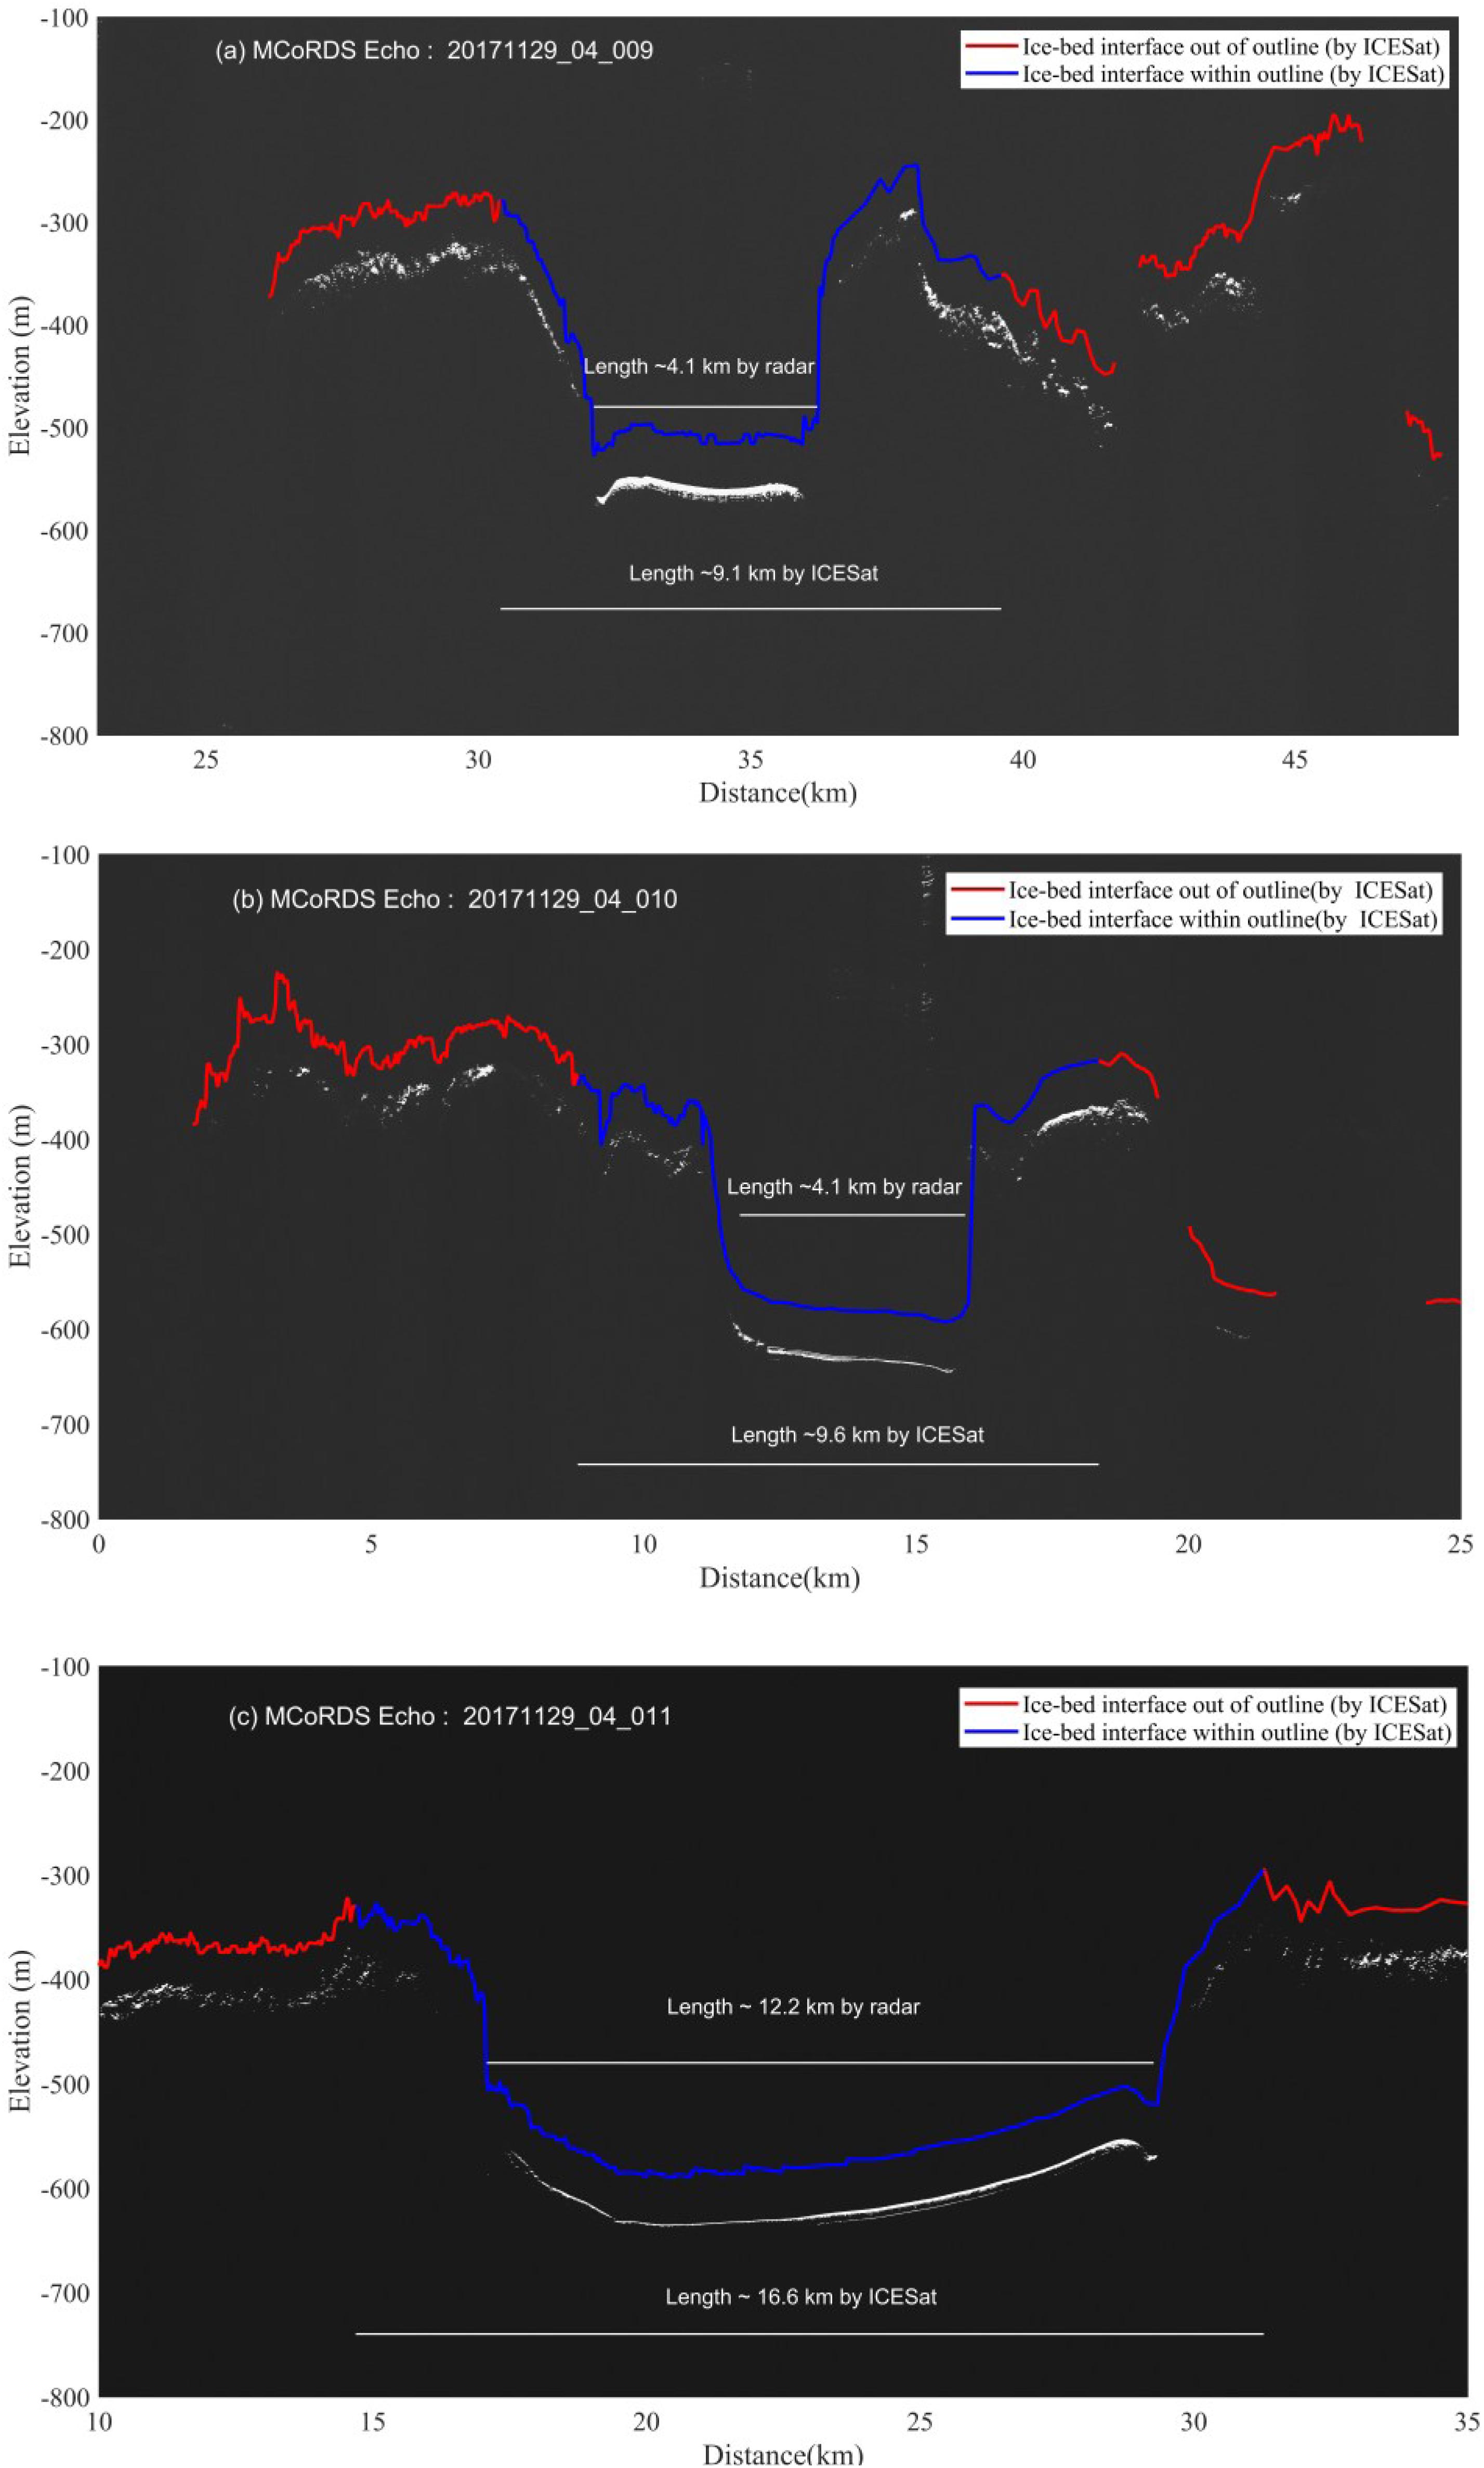
Figure 2. Three airborne radar transects across Lake CookE2. They are sequentially numbered by 20171129_04_009 (a), 20171129_04_010 (b), and 20171129_04_011 (c). In each image, red lines denote the tracked ice-bed interface out of lake outline determined by ICESat; blue lines denote ice-bed interface within lake outline determined by ICESat; and white lines denote lake length identified by radar and the ICESat repeat-pass method (Smith et al., 2009). For clarity, the bed interpretation is offset 50 m vertically from the basal reflection.
Several active subglacial lakes identified by satellite altimetry show no clear evidence of being classic deep-water lakes with bright and smooth radar returns at ice-bed interface (Siegert et al., 2014; Wright et al., 2014; Humbert et al., 2018). These should not be considered as pooled subglacial water bounded by steep-sided topography; rather they occur through the complex interplay between ice flow over topography and the hydrological potential that is created. Pooled water can accumulate on the lee sides of major obstacles, due to a hydropotential minimum established there but, as the water builds and the surface elevation increases, this minimum is reduced. Through this effect, once the hydropotential minimum is reduced to a critical level a discharge can occur. In the case of Lake CookE2, however, we observe a rare example of an active subglacial lake that appears similar to those at the ice-sheet center; i.e., a deep subglacial lake bounded by topography.
In the radar transects, only the middle of the uplifted area contains a bright and smooth base, revealing that the lake outline as identified formerly by satellite altimetry alone is significantly wider than the actual lake beneath. During the discharge, ice directly below the lake lowered significantly due to the loss of basal water on the order of tens of meters. Forced by gravity, the surrounding ice would then flow toward the lake interior, resulting in a depressed surface surrounding the actual lake. Therefore, ice surface lowering is not only caused by collapse of ice immediately above the lake, but also by increased ice flow into the former lake area.
To identify the outline of Lake CookeE2, Smith et al. (2009) used elevation-change anomalies greater than 0.1 m to delineate the lake outline, allowing an estimate of ∼145 km2. By differencing pre-drainage and post-drainage surface elevation change, Mcmillan et al. (2013) estimated the lake area to be ∼260 km2, including a hook-shaped area adjacent to the main body of the lake (southwest blue area in Figure 1). We see no radar echoes characteristic of deep-water in this hook-shaped zone, hence we think this area should not be assumed as part of the main lake. Using elevation change thresholds of 1.5, 3, and 4.5 m, Flament et al. (2014) derived areas of 267 km2, 219 km2, and 192 km2, respectively. Here, we constrain the lake outline through the radar echoes. From the radar records, the lake’s length and width is ∼12.2 km and ∼4.1 km (based on transects 010 and 011, respectively). We estimate the lake’s area to be ∼46 km2. Previous studies estimate the lake area to be 149∼267 km2; around 3–6 times the value we derive.
Temporal and Spatial Characterization of Ice-Surface Height Change
Using ICESat and Cryosat-2 data, we construct a time-series of ice-surface height change over Lake CookE2 between September 2003 and November 2016 (Figure 3a). From February 2006 to October 2008, the ice surface lowered ∼59.6 m, indicating (assuming conservation of volume) ∼2.73 km3 of water was discharged from the lake. Between January 2011 and November 2016, the ice surface rose steadily at a rate of ∼1.1 m/year. The ice-surface began to rise in early 2011, ∼2 years after a drainage event had finished, and continued to do so in the subsequent 6 years. If we assume this rate of recharge is maintained in future, it would take another ∼39 years for the lake to reach the level associated with its previous discharge. Using the lake area derived by ice-penetrating radar, we estimate that the volume of water in CookE2 increased by ∼0.42 km3 in this time. At the same time, we find significant annual variability in ice-surface heights; lowest around January and greatest around May-July in each year.
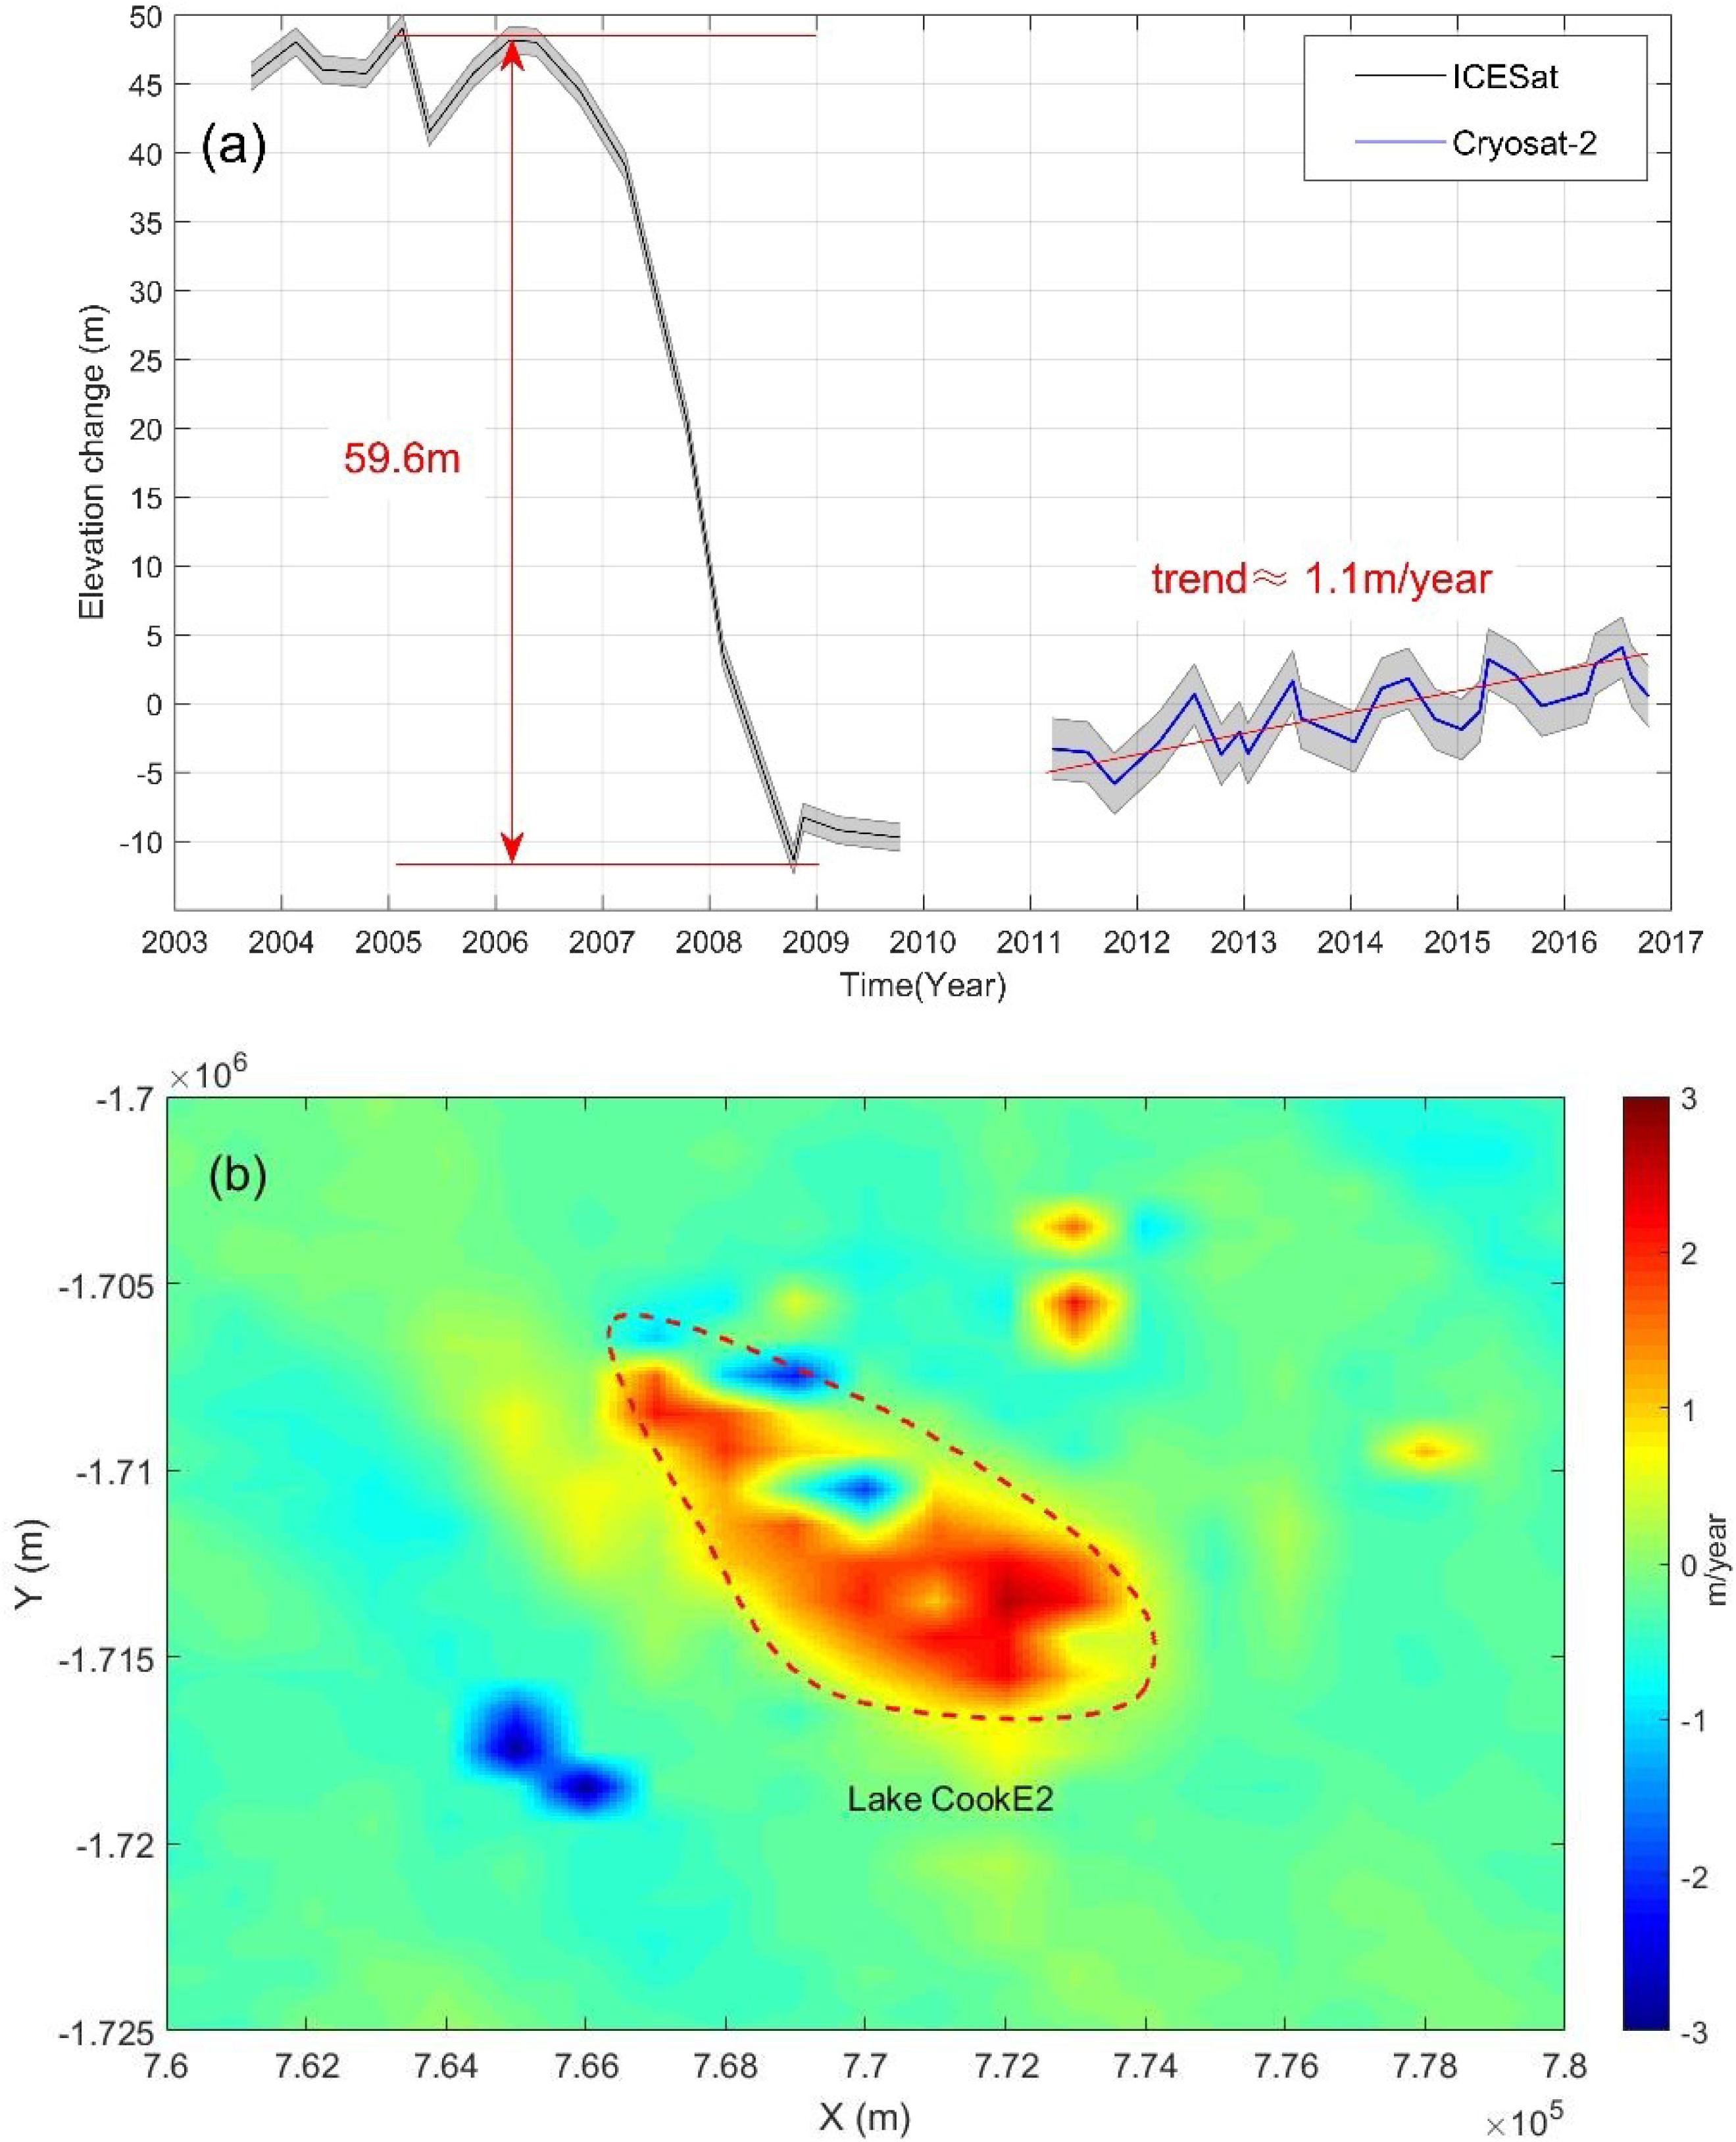
Figure 3. Temporal and spatial characterization of ice-surface height change in the Lake CookE2 region. (a) Ice-surface height temporal change within the outline of Lake CookE2 from September 2003 to November 2016, from ICESat and Cryosat-2 data. Black lines and blue lines denote the ice-surface change differenced with REMA. Gray regions denote uncertainty in the ice-surface change. (b) Ice-surface height change surrounding Lake CookE2 between December 2010 and December 2016, by Cryosat-2. The red dashed line denotes boundary of Lake CookE2 from ice-penetrating radar.
Previous research has confirmed an association between the annual change in ice-surface heights, observed by satellite altimetry, with surface accumulation of snow in Antarctica based on firn-densification modeling (Ligtenberg et al., 2012). Although the temporal variations in surface accumulation described by Ligtenberg et al. (2012) and our annual oscillations in surface elevation change match well, the respective amplitudes are much larger in our study; on the orders of meters over Lake CookE2. As described in section “Materials and Methods,” uncertainty in Cryosat-derived ice surface change is ∼2.2 m whereas uncertainty in the annual variability determined by Ligtenberg et al. (2012) is <3 cm. Although it is possible that our measurements relate to annual surface accumulation changes over the surface depression above the lake, we acknowledge that further work is needed to determine whether this is the case.
Basal Water Flow Sensitivity to Ice-Surface Height Change
Using the latest ice surface and bed data from BedMachine Antarctica, we calculate the hydraulic potential (Figures 4A,B) for Lake CookE2 and its locale (Morlighem et al., 2019). Lake CookE2 lost a great deal of water during the drainage event between 2006 and 2008, leading to a widespread ice surface depression (Figure 4C). As surface elevation dictates the flow of water by 10x the basal slope, such change is likely to lead to modification of basal water pathways. To reveal the response and sensitivity of basal hydrological networks to the observed ice-surface changes, we calculate basal flow paths by a subglacial hydraulic potential method, which assumes that the water pressure is equal to the ice overburden pressure (Shreve, 1972; Livingstone et al., 2013). A previous study found that basal flow paths are sensitive to surface height changes of just a few meters at certain sites in the ice sheet (Wright et al., 2008). We compare the basal routing before and after the discharge event (Figure 4B); calculated by BedMachine bed data, surface data and ice-surface DEM generated by ICESat (DiMarzio, 2007). Widespread ice-surface uplift (Figure 3b) led to modification to the basal flow paths, confirming that they are very sensitive to ice-surface height change (Figures 4B,C).
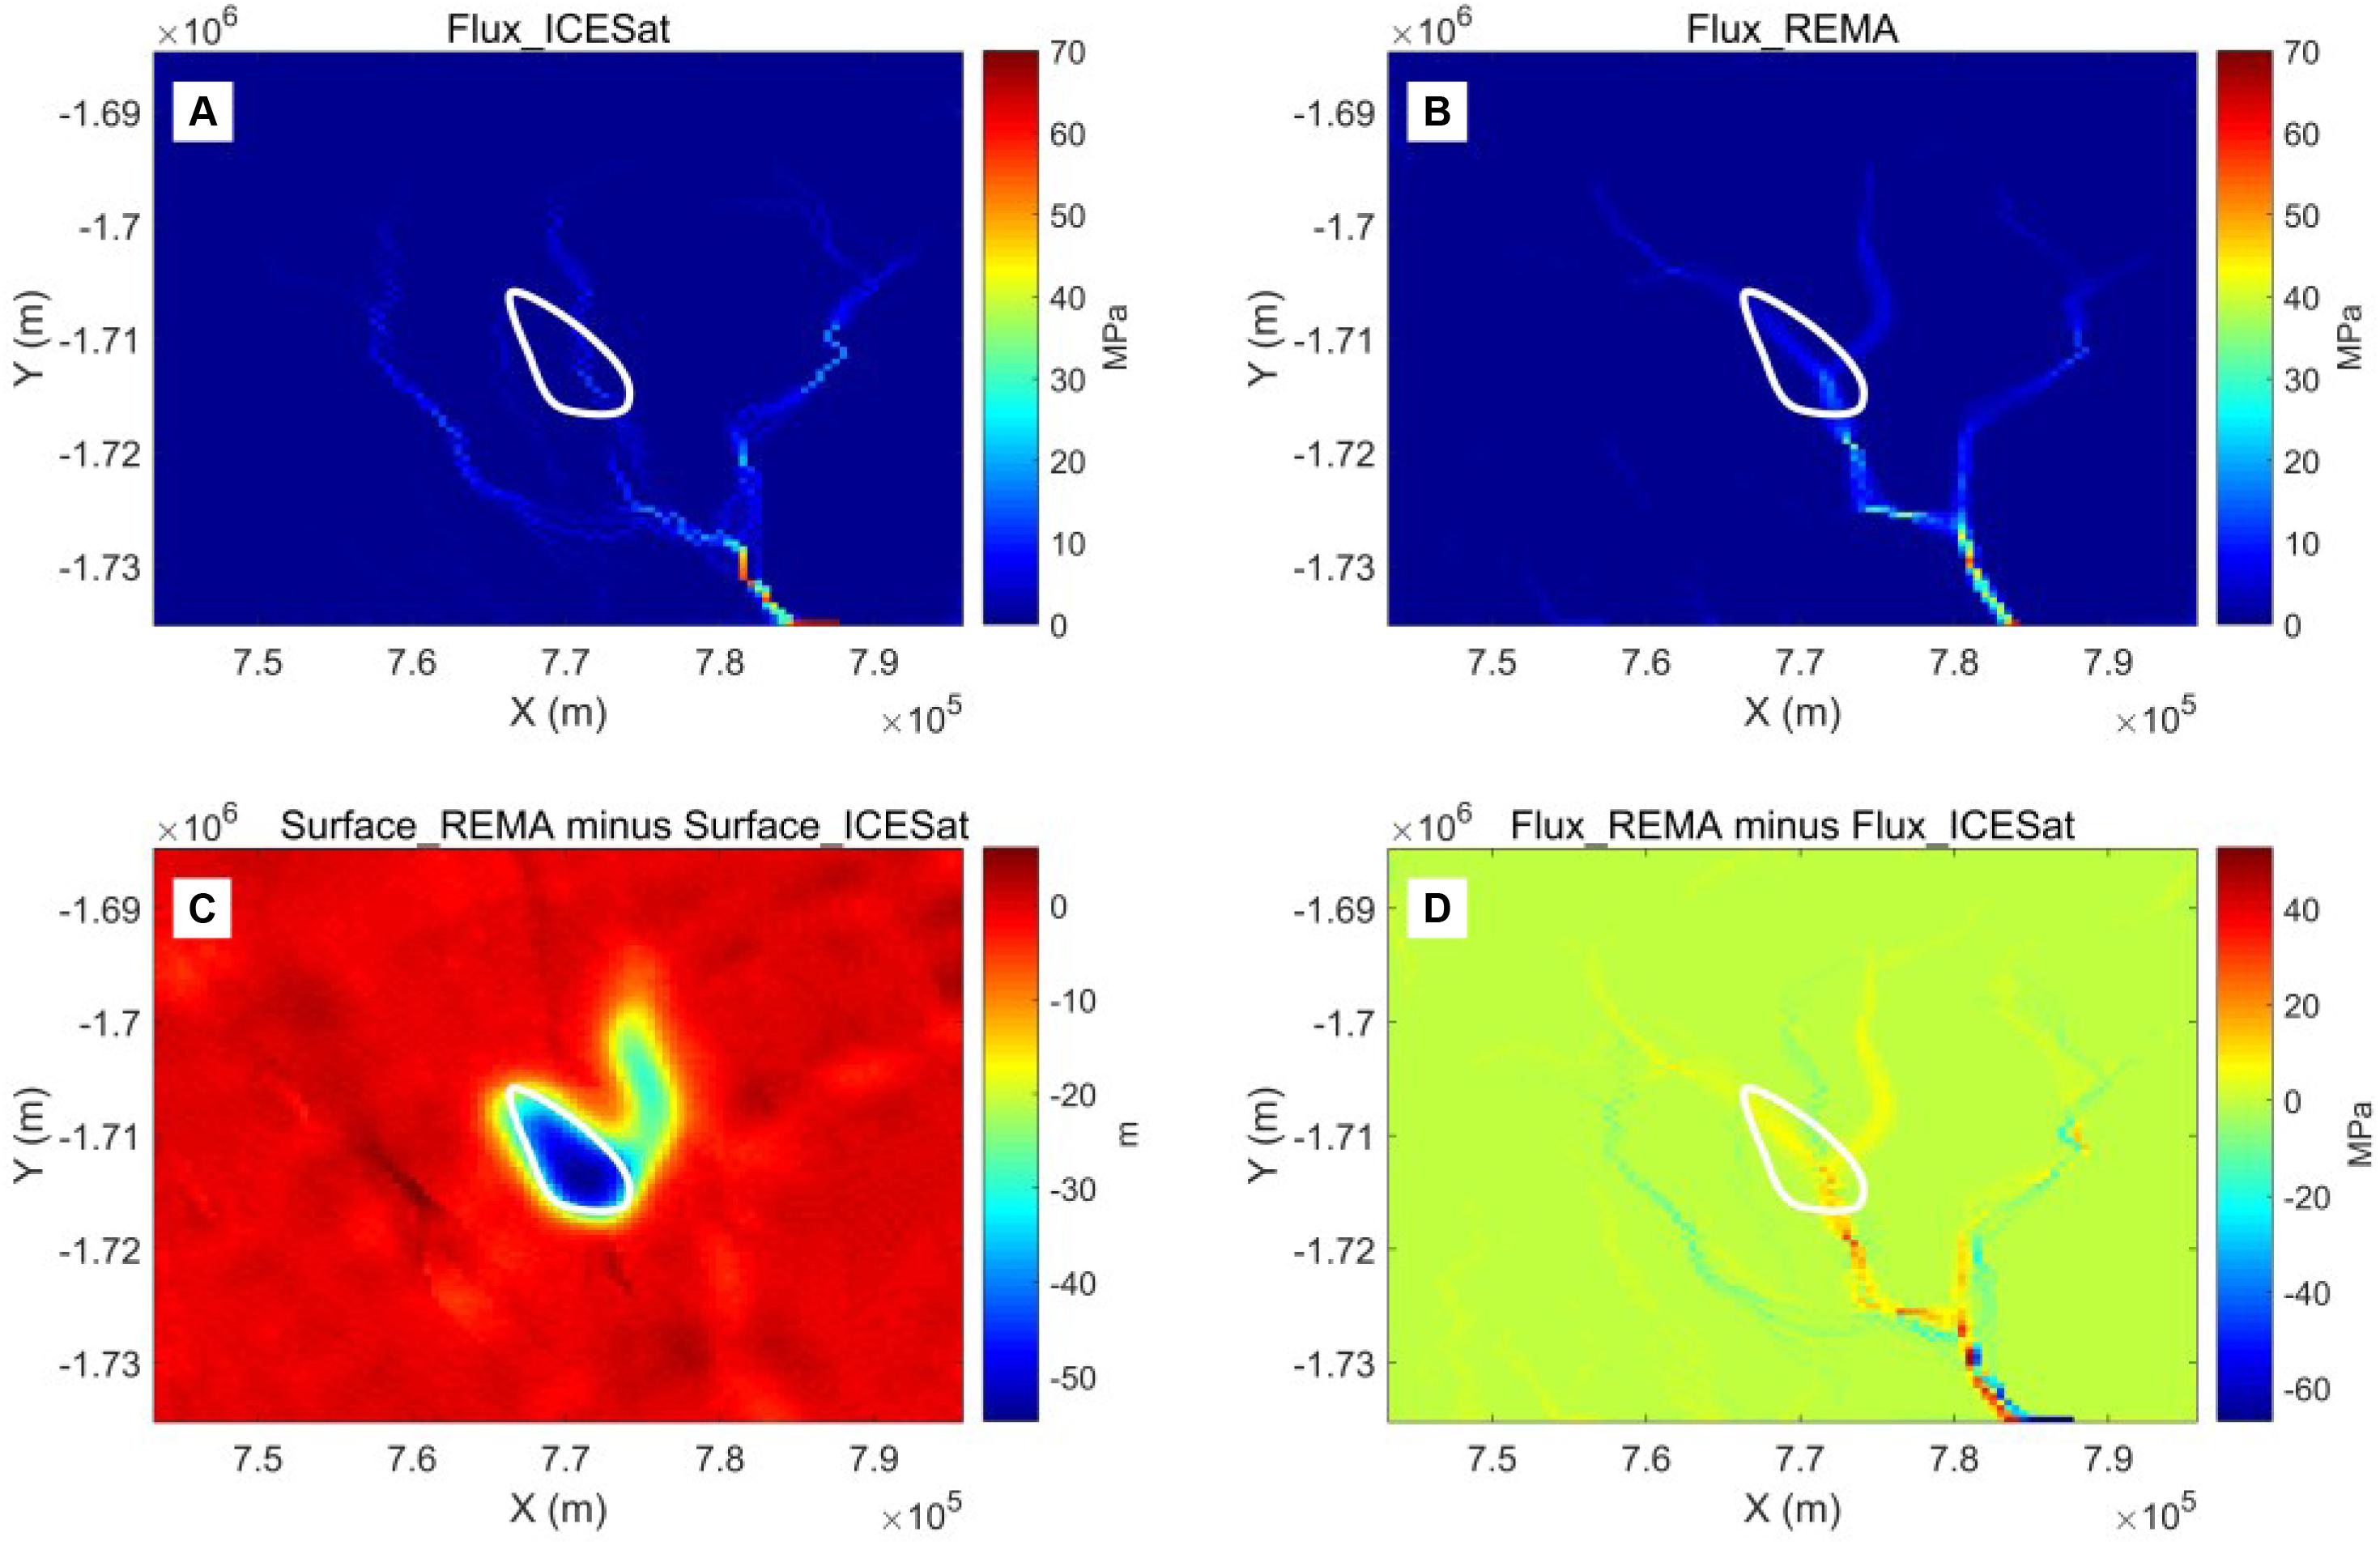
Figure 4. Ice-surface and water flux differences from two data-driven hydraulic potential estimates surrounding Lake CookE2. (A) Hydropotential-driven water flux derived by BedMachine (Morlighem et al., 2019) bed elevation and ICESat ice-surface elevation (DiMarzio, 2007) data. (B) Hydropotential-driven water flux derived by BedMachine bed elevation and REMA ice-surface elevation (Howat et al., 2019) ice-surface elevation data. (C) Ice-surface elevation difference between REMA and ICESat (REMA minus ICESat). (D) Water flux difference between (A,B) (B minus A). Lake CookE2 outline is denoted by white line.
Before the discharge, Lake CookE2 contributed water to downstream hydrological networks. When the lake began to refill after the drainage, basal flow paths on the east side of the lake combined with a tributary downstream of Lake CookE2 (Figure 4B). A comparison between these two states shows that the water flow changed as a consequence of the discharge event (Figure 4D). Hence, subglacial lake dynamics appear to have an influence on the basal hydrology outside of the immediate lake boundary.
Source of Water in Lake CookE2
Given that Lake CookE2 is receiving substantial levels of water over long periods, we can ask where the water originates. To frame the problem we calculate the water storage balance in Lake CookE2. From 2011 to 2016, water in the lake increased at a rate of ∼0.052 ± 0.008 km3/year. Conceptually, water from a variety of sources can contribute to water increase in Lake CookE2, such as basal melt, groundwater in till layers and hydrologic reservoirs. The mean basal melt rate over Lake CookE2 is ∼6–7 mm/year (from ice-sheet modeling) potentially contributing ∼0.005 km3/year of water to the lake (Pattyn, 2010). If we assume the water is all produced by basal melting at this rate, the upstream catchment would require an area of ∼186 km2. This area is only ∼3 times larger than the lake’s, indicating Lake CookE2 is close to the upper regions of a hydraulic catchment. We note recent work that suggests groundwater in basal till layers can contribute to subglacial hydrology networks (Christoffersen et al., 2014; Siegert et al., 2018), meaning that the lake could draw water from its immediate surroundings. If groundwater made a contribution to the lake, this would reduce the area of melting upstream necessary to fill the lake.
Conclusion
We have confirmed, using ice-penetrating radar data, that Subglacial Lake CookE2 in East Antarctica (an active subglacial lake) is similar in its physiography to many stable deep-water lakes that are contained by steep-sided topography. Combining ICESat and Cryosat-2 SwSARIn data from 2003 to 2016, and the high resolution elevation model REMA, we constructed a long-term time-series of topography-free ice-surface height change. We found that the surface elevation over the lake kept rising at a rate of ∼1.1 m/year following a drainage event. We used this rate of recharge to calculate that it would take another ∼39 years for the lake to reach the level associated with its previous discharge. We also investigated the spatial distribution of ice-surface change over 2011–2016, confirming consistency with the new lake area outline defined by ice-penetrating radar, and that previous assessments of lake area from ICESat are overestimated by as much as six times. By comparing basal water flux before and after a drainage event, we showed that water flow is sensitive to ice-surface height change in Lake CookE2, and that water discharged by active subglacial lakes can perturb subglacial hydrology at a regional scale. In addition, we revealed that periodical filling in Lake CookE2 is associated with water input from an upstream hydrologic catchment that is up to three times the lake surface area.
Data Availability Statement
ICESat DEM, elevation data and BedMachine data are available at National Snow and Ice Data Center; Cryosat-2 SwSARIn data are available at British Antarctic Survey; REMA data are available at Polar Geospatial Center in University of Minnesota; MCoRDS5 data are available at Center for Remote Sensing of Ice Sheets. The datasets presented in this study can be found in online repositories. The names of the repository/repositories and accession number(s) can be found below: https://github.com/yanli2020stone/Lake-CookE2-outline.
Author Contributions
YLi and YLu designed the experiment and wrote the manuscript. MS improved the writing and provided advice on estimate of new lake area, ice-surface height change, and sensitivity of subglacial hydrology to ice-surface height changes. All authors contributed to the article and approved the submitted version.
Funding
This work was supported by the National Natural Science Foundation of China (Grant Nos. 41674085 and 41774022) and the Basic Frontier Science Research Program of Chinese Academy of Sciences (Grant No. ZDBS-LY-DQC028).
Conflict of Interest
The authors declare that the research was conducted in the absence of any commercial or financial relationships that could be construed as a potential conflict of interest.
Acknowledgments
The authors thank the editor AH and the reviewers AB and MT for their insightful comments and suggestions.
Footnotes
- ^ CReSIS. 2018. MCoRDS Level 1B, Lawrence, Kansas, United States. Digital Media. http://data.cresis.ku.edu/.
References
Carter, S. P., Blankenship, D. D., Peters, M. E., Young, D. A., and Morse, D. L. (2007). Radar-based subglacial lake classification in Antarctica. Geochem. Geophys. Geosyst. 8:Q03016. doi: 10.1029/2006gc001408
Christianson, K., Jacobel, R. W., Horgan, H. J., Anandakrishnan, S., and Alley, R. B. (2012). Subglacial Lake Whillans—Ice-penetrating radar and GPS observations of a shallow active reservoir beneath a West Antarctic ice stream. Earth Planet. Sci. Lett. 331, 237–245. doi: 10.1016/j.epsl.2012.03.013
Christoffersen, P., Bougamont, M., Carter, S. P., Fricker, H. A., and Tulaczyk, S. (2014). Significant groundwater contribution to Antarctic ice streams hydrologic budget. Geophys. Res. Lett. 41, 2003–2010. doi: 10.1002/2014gl059250
DiMarzio, J. P. (2007). GLAS/ICESat 500 m Laser Altimetry Digital Elevation Model of Antarctica, Version 1. Boulder, CO: NASA National Snow Ice Data Center Distributed Active Archive Center. doi: 10.5067/K2IMI0L24BRJ
Flament, T., Berthier, E., and Rémy, F. (2014). Cascading water underneath Wilkes Land, East Antarctic ice sheet, observed using altimetry and digital elevation models. Cryosphere. 8, 673–687. doi: 10.5194/tc-8-673-2014
Foresta, L., Gourmelen, N., Pálsson, F., Nienow, P., Björnsson, H., and Shepherd, A. (2016). Surface elevation change and mass balance of Icelandic ice caps derived from swath mode CryoSat-2 altimetry. Geophys. Res. Lett. 43, 138–145. doi: 10.1002/2016gl071485
Gorman, M., and Siegert, M. (1999). Penetration of Antarctic subglacial water masses by VHF electromagnetic pulses: estimates of minimum water depth and conductivity. J. Geophys. Res. 104, 29311–29320. doi: 10.1029/1999jb900271
Gourmelen, N., Escorihuela, M. J., Shepherd, A., Foresta, L., Muir, A., Garcia-Mondejar, A., et al. (2017a). CryoSat-2 swath interferometric altimetry for mapping ice elevation and elevation change. Adv. Space Res. 62, 1226–1242. doi: 10.1016/j.asr.2017.11.014
Gourmelen, N., Goldberg, D. N., Snow, K., Henley, S. F., Bingham, R. G., Kimura, S., et al. (2017b). Channelized melting drives thinning under a rapidly melting Antarctic ice shelf. Geophys. Res. Lett. 44, 9796–9804. doi: 10.1002/2017gl074929
Helm, V., Humbert, A., and Miller, H. (2014). Elevation and elevation change of Greenland and Antarctica derived from CryoSat-2. Cryosphere. 8, 1539–1559. doi: 10.5194/tc-8-1539-2014
Howat, I. M., Porter, C., Smith, B. E., Noh, M.-J., and Morin, P. (2019). The reference elevation model of Antarctica. Cryosphere. 13, 665–674. doi: 10.5194/tc-2018-240
Humbert, A., Steinhage, D., Helm, V., Beyer, S., and Kleiner, T. (2018). Missing evidence of widespread subglacial lakes at Recovery Glacier, Antarctica. J. Geophys. Res. Earth Surf. 123, 2802–2826. doi: 10.1029/2017JF004591
Ilisei, A. M., Khodadadzadeh, M., Ferro, A., and Bruzzone, L. (2018). An automatic method for Subglacial Lake detection in ice sheet radar sounder data. IEEE Trans. Geosci. Rem. Sens. 57, 3252–3270. doi: 10.1109/TGRS.2018.2882911
Jeofry, H., Ross, N., Brocq, A. M. L., Graham, A. G. C., Li, J., Gogineni, P., et al. (2018). Hard rock landforms generate 130 km ice shelf channels through water focusing in basal corrugations. Nat. Commun. 9:4576. doi: 10.1038/s41467-018-06679-z
Ligtenberg, S., Horwath, M., Van den Broeke, M., and Legrésy, B. (2012). Quantifying the seasonal “breathing” of the Antarctic ice sheet. Geophys. Res. Lett. 39, L23501. doi: 10.1029/2012GL053628
Livingstone, S. J., Clark, C. D., Woodward, J., and Kingslake, J. (2013). Potential subglacial lake locations and meltwater drainage pathways beneath the Antarctic and Greenland ice sheets. Cryosphere. 7, 1721–1740. doi: 10.5194/tc-7-1721-2013
Mcmillan, M., Corr, H., Shepherd, A., Ridout, A., Laxon, S., and Cullen, R. (2013). Three-dimensional mapping by CryoSat-2 of subglacial lake volume changes. Geophys. Res. Lett. 40, 4321–4327. doi: 10.1002/grl.50689
Moholdt, G., Nuth, C., Hagen, J. O., and Kohler, J. (2010). Recent elevation changes of Svalbard glaciers derived from ICESat laser altimetry. Rem. Sens. Environ. 114, 2756–2767. doi: 10.1016/j.rse.2010.06.008
Morlighem, M., Rignot, E., Binder, T., Blankenship, D., Drews, R., Eagles, G., et al. (2019). Deep glacial troughs and stabilizing ridges unveiled beneath the margins of the Antarctic ice sheet. Nat. Geosci. 13, 132–137. doi: 10.1038/s41561-019-0510-8
Paolo, F. S., Fricker, H. A., and Laurie, P. (2015). Volume loss from Antarctic ice shelves is accelerating. Science. 348, 327–331. doi: 10.1126/science.aaa0940
Pattyn, F. (2010). Antarctic subglacial conditions inferred from a hybrid ice sheet/ice stream model. Earth Planet. Sci. Lett. 295, 451–461. doi: 10.1016/j.epsl.2010.04.025
Robin, G. D. Q. (1975). Radio-echo sounding: glaciological interpretations and applications. J. Glaciol. 15, 49–64. doi: 10.1017/S0022143000034262
Rose, K. C., Ross, N., Jordan, T., Bingham, R. G., Corr, H., Ferraccioli, F., et al. (2015). Ancient pre-glacial erosion surfaces preserved beneath the West Antarctic Ice Sheet. Earth Surf. Dyn. 3, 139–152. doi: 10.5194/esurf-3-139-2015
Shuman, C. A., Zwally, H. J., Schutz, B. E., Brenner, A. C., DiMarzio, J. P., Suchdeo, V. P., et al. (2006). ICESat Antarctic elevation data: preliminary precision and accuracy assessment. Geophys. Res. Lett. 33:L07501. doi: 10.1029/2005gl025227
Shreve, R. L. (1972). Movement of water in glaciers. J. Glaciol. 11, 205–214. doi: 10.3189/s002214300002219x
Siegert, M., Bernd, K., Marion, B., Poul, C., Kerry, K., Andersen, K., et al. (2018). Antarctic subglacial groundwater: a concept paper on its measurement concept and potential influence on ice flow. Geol. Soc. Lond. Spec. Public. 461, 197–213. doi: 10.1144/SP461.8
Siegert, M., Ross, N., Corr, H., Smith, B. E., Jordan, T., Bingham, R., et al. (2014). Boundary conditions of an active West Antarctic subglacial lake: implications for storage of water beneath the ice sheet. Cryosphere. 8, 15–24. doi: 10.5194/tc-8-123-2014
Siegert, M. J. (2000). Radar evidence of water-saturated sediments beneath the East Antarctic Ice Sheet. Geol. Soc. Lond. Spec. Public. 176, 217–229. doi: 10.1144/GSL.SP.2000.176.01.17
Siegert, M. J., and Ridley, J. K. (1998). An analysis of the ice-sheet surface and subsurface topography above the Vostok Station subglacial lake, central East Antarctica. J. Geophys. Res. Solid Earth. 103, 10195–10207. doi: 10.1029/98jb00390
Siegfried, M. R., and Fricker, H. A. (2018). Thirteen years of subglacial lake activity in Antarctica from multi-mission satellite altimetry. Ann. Glaciol. 59, 42–55. doi: 10.1017/aog.2017.36
Siegfried, M. R., Hawley, R. L., and Burkhart, J. F. (2011). High-resolution ground-based GPS measurements show intercampaign bias in ICESat elevation data near Summit, Greenland. IEEE Trans. Geosci. Rem. Sens. 49, 3393–3400. doi: 10.1109/tgrs.2011.2127483
Smith, B. E., Fricker, H. A., Joughin, I. R., and Tulaczyk, S. (2009). An inventory of active subglacial lakes in Antarctica detected by ICESat (2003–2008). J. Glaciol. 55, 573–595. doi: 10.3189/002214309789470879
Stearns, L. A., Smith, B. E., and Hamilton, G. S. (2008). Increased flow speed on a large East Antarctic outlet glacier caused by subglacial floods. Nat. Geosci. 1, 827–831. doi: 10.1038/ngeo356
Wright, A., and Siegert, M. (2012). A fourth inventory of Antarctic subglacial lakes. Antarctic Sci. 24, 659–664. doi: 10.1017/S095410201200048X
Wright, A., Siegert, M., Le Brocq, A., and Gore, D. (2008). High sensitivity of subglacial hydrological pathways in Antarctica to small ice-sheet changes. Geophys. Res. Lett. 35:L17504. doi: 10.1029/2008gl034937
Wright, A. P., Young, D. A., Bamber, J. L., Dowdeswell, J. A., Payne, A. J., Blankenship, D. D., et al. (2014). Subglacial hydrological connectivity within the Byrd Glacier catchment, East Antarctica. J. Glaciol. 60, 345–352. doi: 10.3189/2014JoG13J014
Keywords: airborne ice penetrating radar, satellite altimetry, Lake CookE2, active lake, deep-water, drainage and refill
Citation: Li Y, Lu Y and Siegert MJ (2020) Radar Sounding Confirms a Hydrologically Active Deep-Water Subglacial Lake in East Antarctica. Front. Earth Sci. 8:294. doi: 10.3389/feart.2020.00294
Received: 03 April 2020; Accepted: 23 June 2020;
Published: 14 July 2020.
Edited by:
Alun Hubbard, Arctic University of Norway, NorwayReviewed by:
Adam Booth, University of Leeds, United KingdomMartin Truffer, University of Alaska Fairbanks, United States
Copyright © 2020 Li, Lu and Siegert. This is an open-access article distributed under the terms of the Creative Commons Attribution License (CC BY). The use, distribution or reproduction in other forums is permitted, provided the original author(s) and the copyright owner(s) are credited and that the original publication in this journal is cited, in accordance with accepted academic practice. No use, distribution or reproduction is permitted which does not comply with these terms.
*Correspondence: Yan Li, bGl5YW5AYXNjaC53aGlnZy5hYy5jbg==