 Xianrong Zhang1,2
 Zhilei Sun1,2*
 Libo Wang1,2Xilin Zhang1,2Bin Zhai1,2Cuiling Xu1,2Wei Geng1,2Hong Cao1,2Xijie Yin3Nengyou Wu1,2*
- 1The Key Laboratory of Gas Hydrate, Ministry of Natural Resources, Qingdao Institute of Marine Geology, Qingdao, China
- 2Key Laboratory of Marine Environmental Geology, Ministry of Natural Resources, Qingdao Institute of Marine Geology, Qingdao, China
- 3Thrid Institute of Oceanography, Ministry of Natural Resources, Xiamen, China
Widespread seepage of methane from seafloor sediments on continental margins are released into seawater, a portion of which may escape to the atmosphere. To assess the water column distribution characteristics of methane and its input to the atmosphere, we investigated methane emissions from the shelf and west slope of the back-arc Okinawa Trough (OT), East China Sea. Our results showed a heterogeneity distribution of methane within the water column. The highest value, which was more than 10 times of the background concentration, occurred near a cold seep in the north of the study area which was discovered by a remotely operated underwater vehicle (ROV). Other sources of methane to the water column of the OT, besides cold seepage input, probably also include in situ aerobic methane production, advective transport from the continental shelf, and/or hydrothermal venting. Furthermore, the sea-to-air flux of methane throughout the study area was up to 116 μmol m–2d–1, noticeably higher than that in many other continental shelf waters and seep sites globally, indicating that this region is an active CH4 emission area. Our findings demonstrate that methane discharged from both cold seeps and hydrothermal vents have a significant influence on the methane cycle in the OT, providing a new insight for the methane budget of back-arc basins.
Introduction
Methane (CH4), a significant greenhouse gas, has a global warming potential about 20–40 times higher than that of CO2 on average over a century timescale (St. Louis et al., 2000; IPCC, 2013). Although CH4 emissions from the oceans account for only a small portion (2%) of the global CH4 budget (Reeburgh, 2007), it still plays an important role in the atmospheric chemistry, air-sea interaction, and distribution of chemosynthetic communities. Previous studies estimated that marine CH4 flux to the atmosphere ranges from 0.4 to 1.8 Tg yr –1 in the open ocean (Rhee et al., 2009), while it reaches 13 Tg yr –1 for continental shelves (Bange et al., 1994). This observation suggested that the continental shelf would be the dominant place for the oceanic CH4 emissions.
The major sources of dissolved CH4 in the ocean are terrestrial inputs, sediment emission (including geological sources), and biological metabolism (Fleischer et al., 2001; Jayakumar et al., 2001; Skarke et al., 2014; Mau et al., 2017). Most of this CH4 gas could be dissolved in seawater (McGinnis et al., 2006), generating patches of high CH4 concentration (Leifer et al., 2000), but only a small amount of them can reach the atmosphere (Reeburgh, 2007). In this case, the amount of CH4 estimated based on sea-air gas flux is markedly lower than that discharged from sediment (Milkov and Sassen, 2003). Nevertheless, due to high variability in hydrochemical properties and release rate of CH4 from sediment, the oceanic CH4 budget is poorly documented up to date. Therefore, it is highly essential to carry out more measurements of CH4 production, dissolution, migration, and emissions from the seabed in order to better understand the oceanic CH4 budget and potential influence on climate change.
The first studies on the characteristics of dissolved CH4 in the East China Sea (ECS) have been conducted since the early 1990s (Tsurushima et al., 1996). Previous research demonstrated that terrestrial input and hydrographic circulation systems [Kuroshio, the Taiwan Warm Current Water (TWCW), as well as the East China Sea Coastal Current (ESCC)] were the main controlling factors on CH4 concentration and distribution patterns (Lee et al., 2000; Rehder and Suess, 2001; Liu et al., 2003; Zhang et al., 2004, 2008). However, given that a variety of mud volcanoes, pockmarks, and cold seeps have been discovered in recent decades in the OT (Yin et al., 2003; Li et al., 2015; Sun et al., 2015; Xu et al., 2018), it is reasonable to infer that they may contribute a substantial amount of CH4 to seawater. In addition, as a universal extreme system within the OT, modern hydrothermal activity is pervasive and vigorous from north to south, which can also discharge a large amount of CH4 along with hydrothermal fluids (Sakai et al., 1990; Ishibashi et al., 1995, 2014; Inagaki et al., 2006; Miyazaki et al., 2017). Previous studies found that the distance between the site of the newly discovered cold seeps (Li et al., 2015; Xu et al., 2018) and the hydrothermal vents found in the past (Inagaki et al., 2006; Ishibashi et al., 2014) are less than several tens of kilometers apart. The proximity of the cold seeps to the hydrothermal fluid complicates the material circulation in the OT (Sun et al., 2019). Recently conducted research has confirmed that both hydrothermal and cold seep fluids could contribute a considerable amount of carbon to the seawater (Sun et al., 2019; Zhang et al., 2019). In such situations, due to the complicated supply of methane-rich fluids derived from cold seeps and hydrothermal vents, the aforementioned region has been an important target to explore the characteristics and sources of CH4 in the OT.
In this study, we measured dissolved CH4 concentrations and related physical oceanographic parameters from the full-depth water, and then estimated CH4 fluxes at the sea-air interface in the OT (Figure 1). Our study aimed to determine the fate of the discharged methane and evaluated the regional contribution to atmospheric methane, it would shed light on better understanding the methane budget and the biogeochemical carbon cycle in the OT.
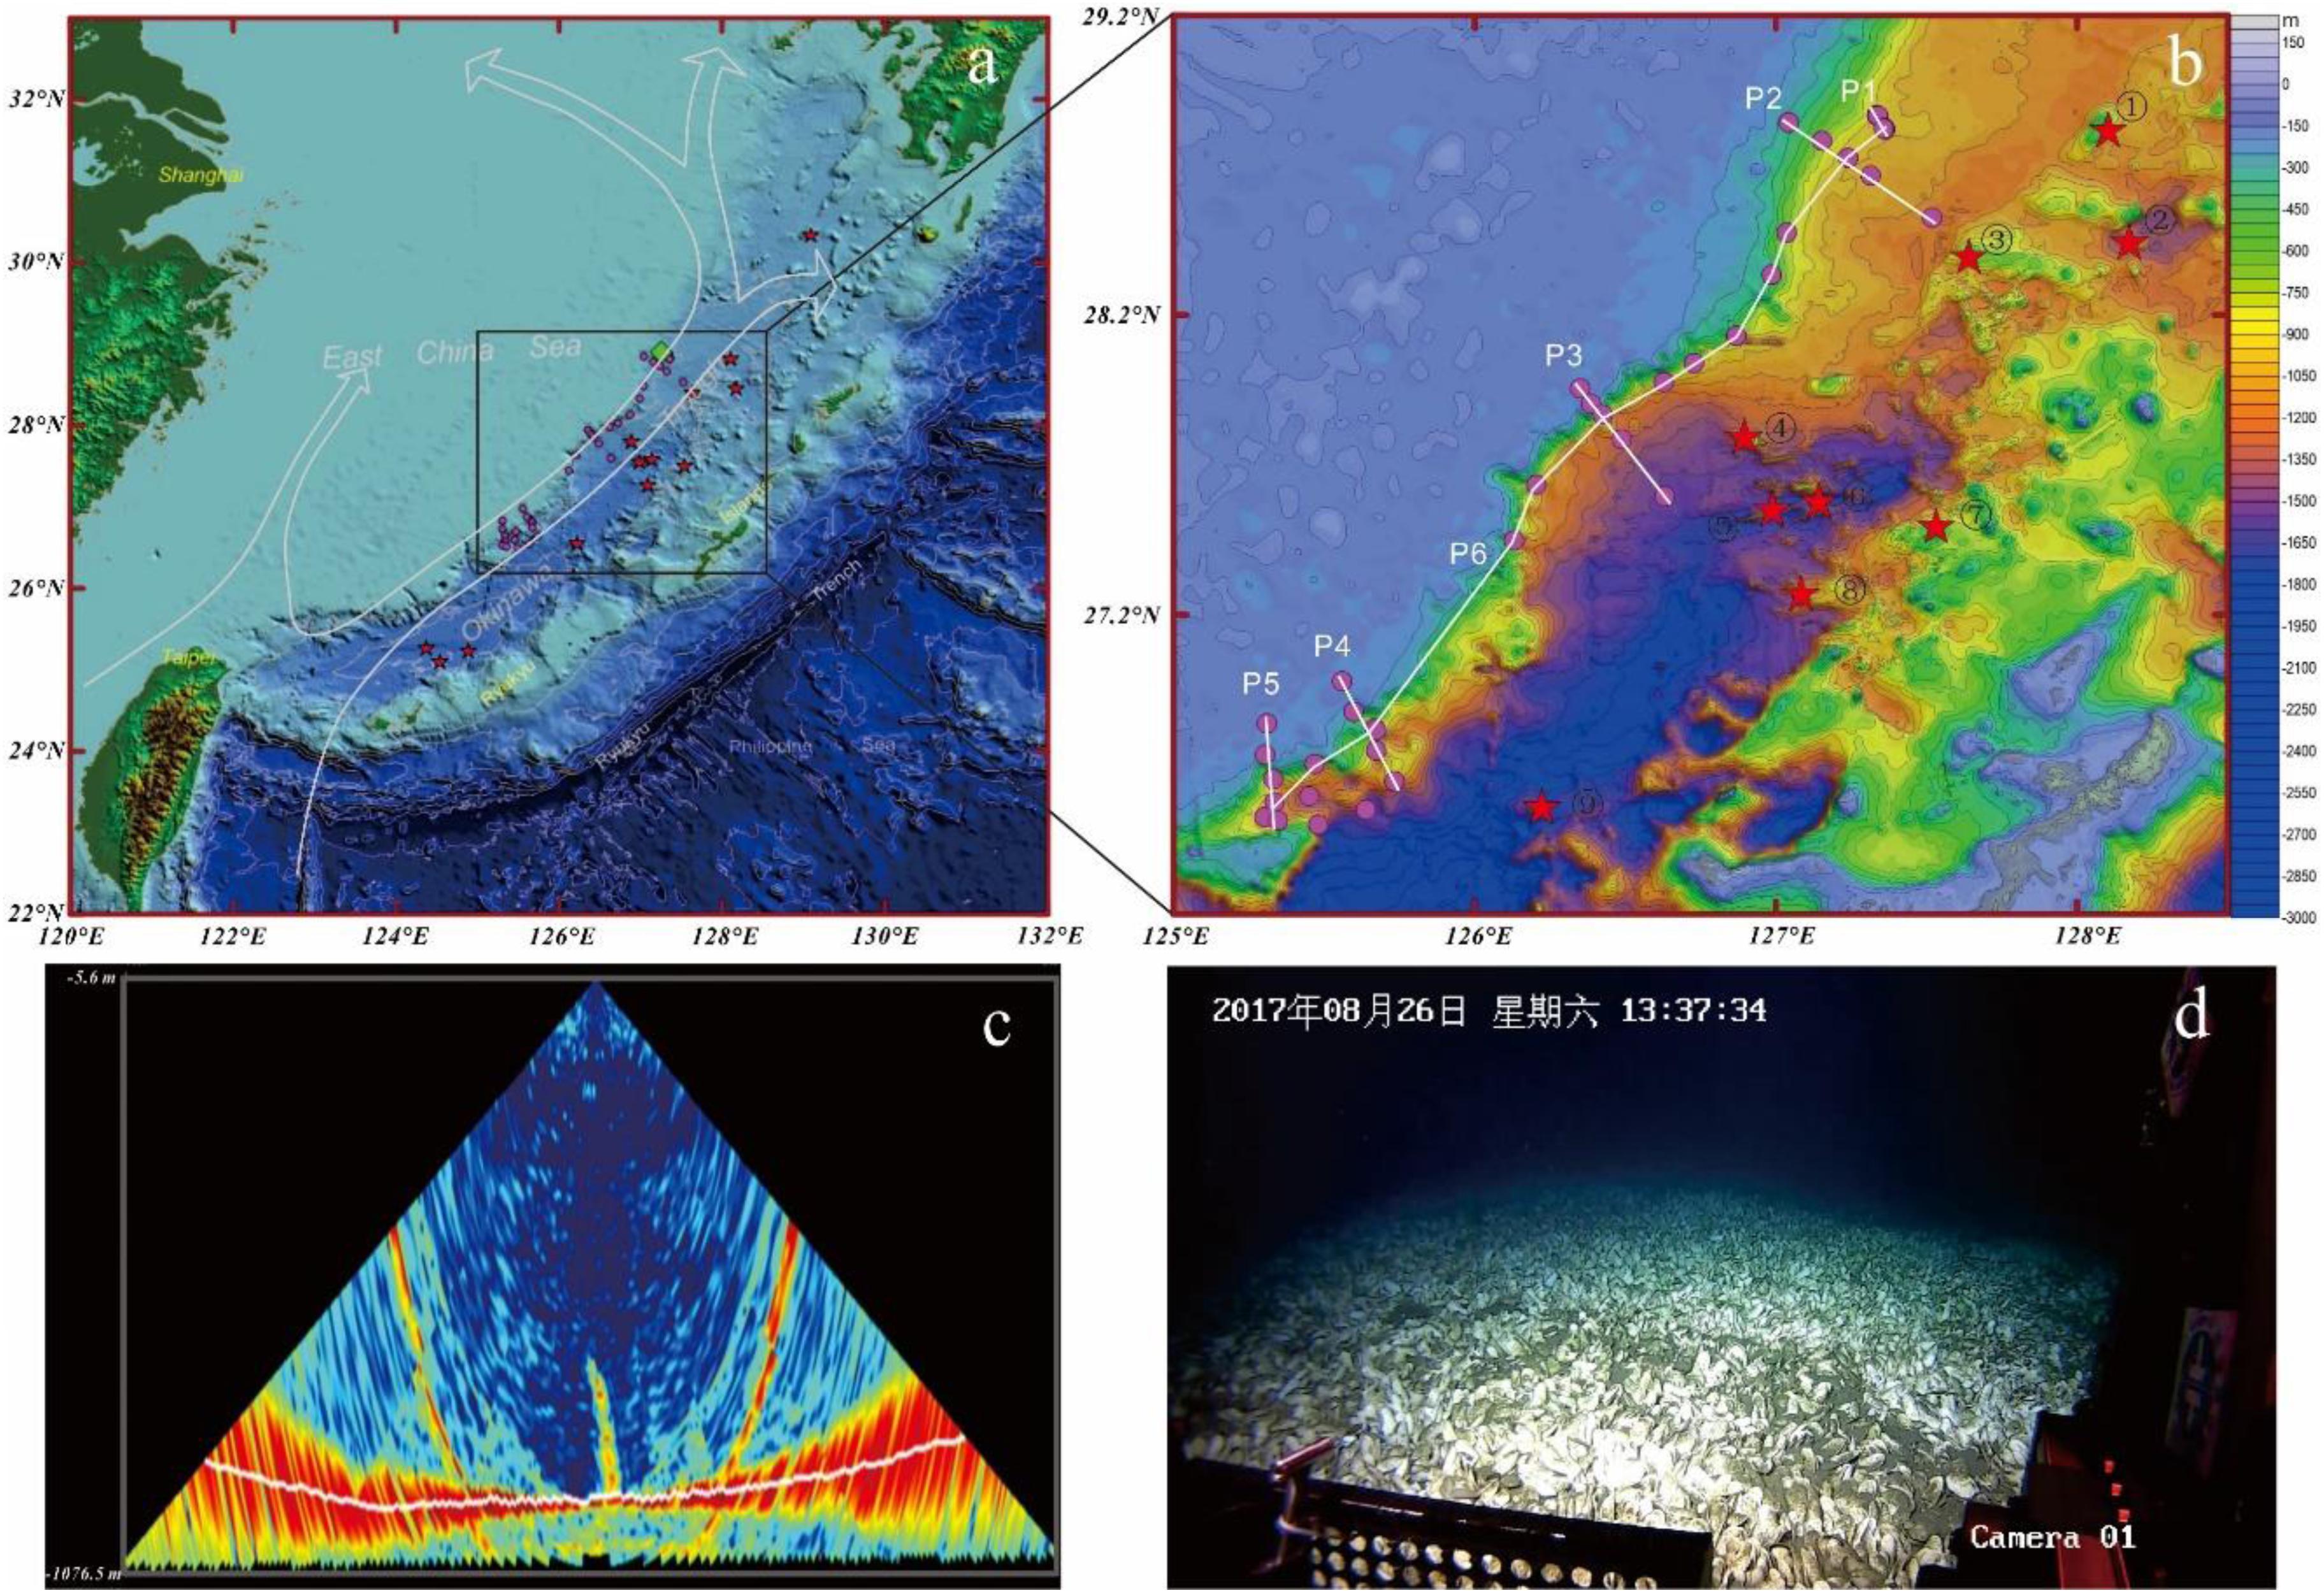
Figure 1. (a) Observational regions and sampling stations in the OT, ECS during the integrated environmental and geological and ROV cruises during 2016 and 2017. The main stream of the Kuroshio Current is shown in solid curves; rose red solid circles represent seawater sampling locations; the green square represents cold seep (Li et al., 2015; Xu et al., 2018); red stars represent hydrothermal vent sites. The identified hydrothermal fields are cited from the InterRidge database (http://interridge.org/) and are listed as follows: (1) Site ES2, (2) Higashi-Ensei, (3) Minami-Ensei Knoll, (4) North Knoll, (5) Iheya Ridge, (6) Natsushima 84-1 Knoll, (7) Yoron Hole, (8) Izena Cauldron, and (9) Higa. (b) Location of sampling site with P1–P6, six transects; (c) acoustic flare representing seafloor methane bubble plume near the CTD10 site on the west slope of the OT. (d) ROV observations of in situ Giant clam beds made during the ROV cruises in 2017.
Geological Setting
The OT is an active semi-depth back-arc basin formed behind the Ryukyu arc-trench system in the West Pacific (Sibuet and Olu, 1998; Shinjo et al., 1999). It is approximately 1200 km in length with the average width of approximately 104 km and characterized by active rifting structures and magmatism along the depression. In this trough, a large section of the seawater is deeper than 1000 m, and the maximum depth is about 2300 m. The thickness of sediments in the northern section of the OT is up to 8 km, due to a huge supply of terrigenous matter from the ESC continental shelf (Sibuet et al., 1987). A topographical study showed that the OT has a typical U-shape, and submarine canyons, fans, and turbidite deposits have extensively developed on the western slope. Modern hydrothermal activities are pervasive and vigorous in the middle and southern sections of the OT (Glasby and Notsu, 2003). In addition, seafloor cold seeps have been discovered in the northern and central OT recently (Li et al., 2015; Sun et al., 2015; Xu et al., 2018).
The hydrological and circulation systems in the OT are complex, and are mainly controlled by the force from the Kuroshio Current and coastal current (Yu et al., 2009). Amongst, the Kuroshio Current, carrying oligotrophic waters northward with low concentrations of nutrients and high temperature and salinity, is the most important factor controlling the environment and hydrological characteristics. It flows above the OT as a water mass up to 100 km wide and 800–1,000 m deep and at a velocity ranging from 45 to 150 cm/s (Qin, 1987). It is the only source of heat and ocean material on the shelf of ECS.
Materials and Methods
Sampling and Regional Survey
Forty sites of full-depth water column samples were selected in this study from the western slope of the middle OT and continental shelf during the integrated environmental and geological expedition of R/V Zhang Jian from June to September 2016 (Figure 1). Seawater samples from different sites and depths were collected with cleaned Go-Flo bottles (20-L) mounted on a Seabird 911 plus CTD/rosette. Surface waters were collected at a depth of ∼3 m and near-bottom waters were at ∼50 m above the seafloor. Once on board, water was collected into 40 mL glass serum vials using a silicone tube. The vials were thrice overfilled without introducing any air bubbles in the sample. Then, those were sealed with a butyl rubber stopper and aluminum cap. After that, methane analyses of these samples were conducted in the laboratory immediately. Temperature, salinity, and oxygen data were obtained from the CTD profiles.
A high-quality in situ giant clam beds map was obtained by a remotely operated underwater vehicle (ROV) Beaver (Shanghai Jiao Tong University) in the cruise of R/V Zhang Jian in 2017 (Figure 1). The dive sites were characterized by several acoustically detected flares in the water column, which were first discovered by the Kongsberg EM302 multi-beam echo-sounder on-board.
Dissolved CH4 Concentration
Headspace gas chromatography was applied for on-board measurements of dissolved gases, as well as high resolution mapping of CH4 concentrations. Briefly, a 40 mL glass vial with half a sample of seawater was immersed into a 25°C constant temperature water bath to balance the CH4 distribution between headspace and seawater. After that, 0.5 mL of headspace gas was injected into a gas chromatograph (GC910 produced by Ke Chuang Company, Shanghai) with a flame-ionization detector. High-purity helium (99.999%) was used as the carrier gas at a flow rate of 30 mL/min. The precision of the analytical method was ± 2.5%.
Calculations of Saturation and Sea-Air Flux
Saturation values R, expressed in%, were calculated as the ratio of the concentration of dissolved gas to the expected equilibrium water concentration. The saturation and sea–air CH4 fluxes (F, μmol⋅m−2⋅d–1) were calculated as follows:
Where Cobs is the observed dissolved CH4 concentration (mol L–1); Ceq is the CH4 concentration in the seawater equilibrated with air, which can be calculated using in situ temperature, salinity, and the solubility equation of Wiesenburg and Guinasso (1979). However, atmospheric CH4 concentration was not determined in the present study. Therefore, a global mean atmospheric CH4 mixing ratio of 1831.16 ppb of 2013, taken from the NOAA/ESRL Global Monitoring Division in situ program1, was used for calculations. k (cm h–1) is the gas transfer velocity, which is a function of wind speed and the Schmidt number (Sc). In the current research, the formula presented by Wanninkhof (1992, 2014) was used to calculate the gas transfer coefficient k. The average wind speed during the cruises is 8.3 m s–1.
Results and Discussion
Horizontal Distribution of CH4
We collected the methane data from the shelf and west slope of the OT, which ranged from 2.7 to 24.7 nM, with an average of 6.5 nM. The horizontal distributions of CH4 in water are shown in Figure 2, presenting a great variation both in the surface and bottom, from 2.0 to 19.9 nM and 2.0 to 24.7 nM, respectively. Careful study found that the CH4 concentrations in the bottom at about 60% of the sites are approximately 10–270% higher than that in the shallower and surface water (Figure 2 and Supplementary Figure S2). This finding suggests there may be an important benthic CH4 originating from the underlying sediment, which can be identified through sediment core incubations (Chronopoulou et al., 2017). However, the high CH4 concentration anomalies are observed on the lower slope of the north study area, with the maximum concentration of 24.7 nM, which is approximately more than 10 times the background concentrations of 2–3 nM in the OT (Tsurushima et al., 1996) and the typical open ocean (Bates et al., 1996; Kock et al., 2008; Tseng et al., 2017). This irregular distribution of CH4 is possibly pointing to seafloor methane seep from sediment.
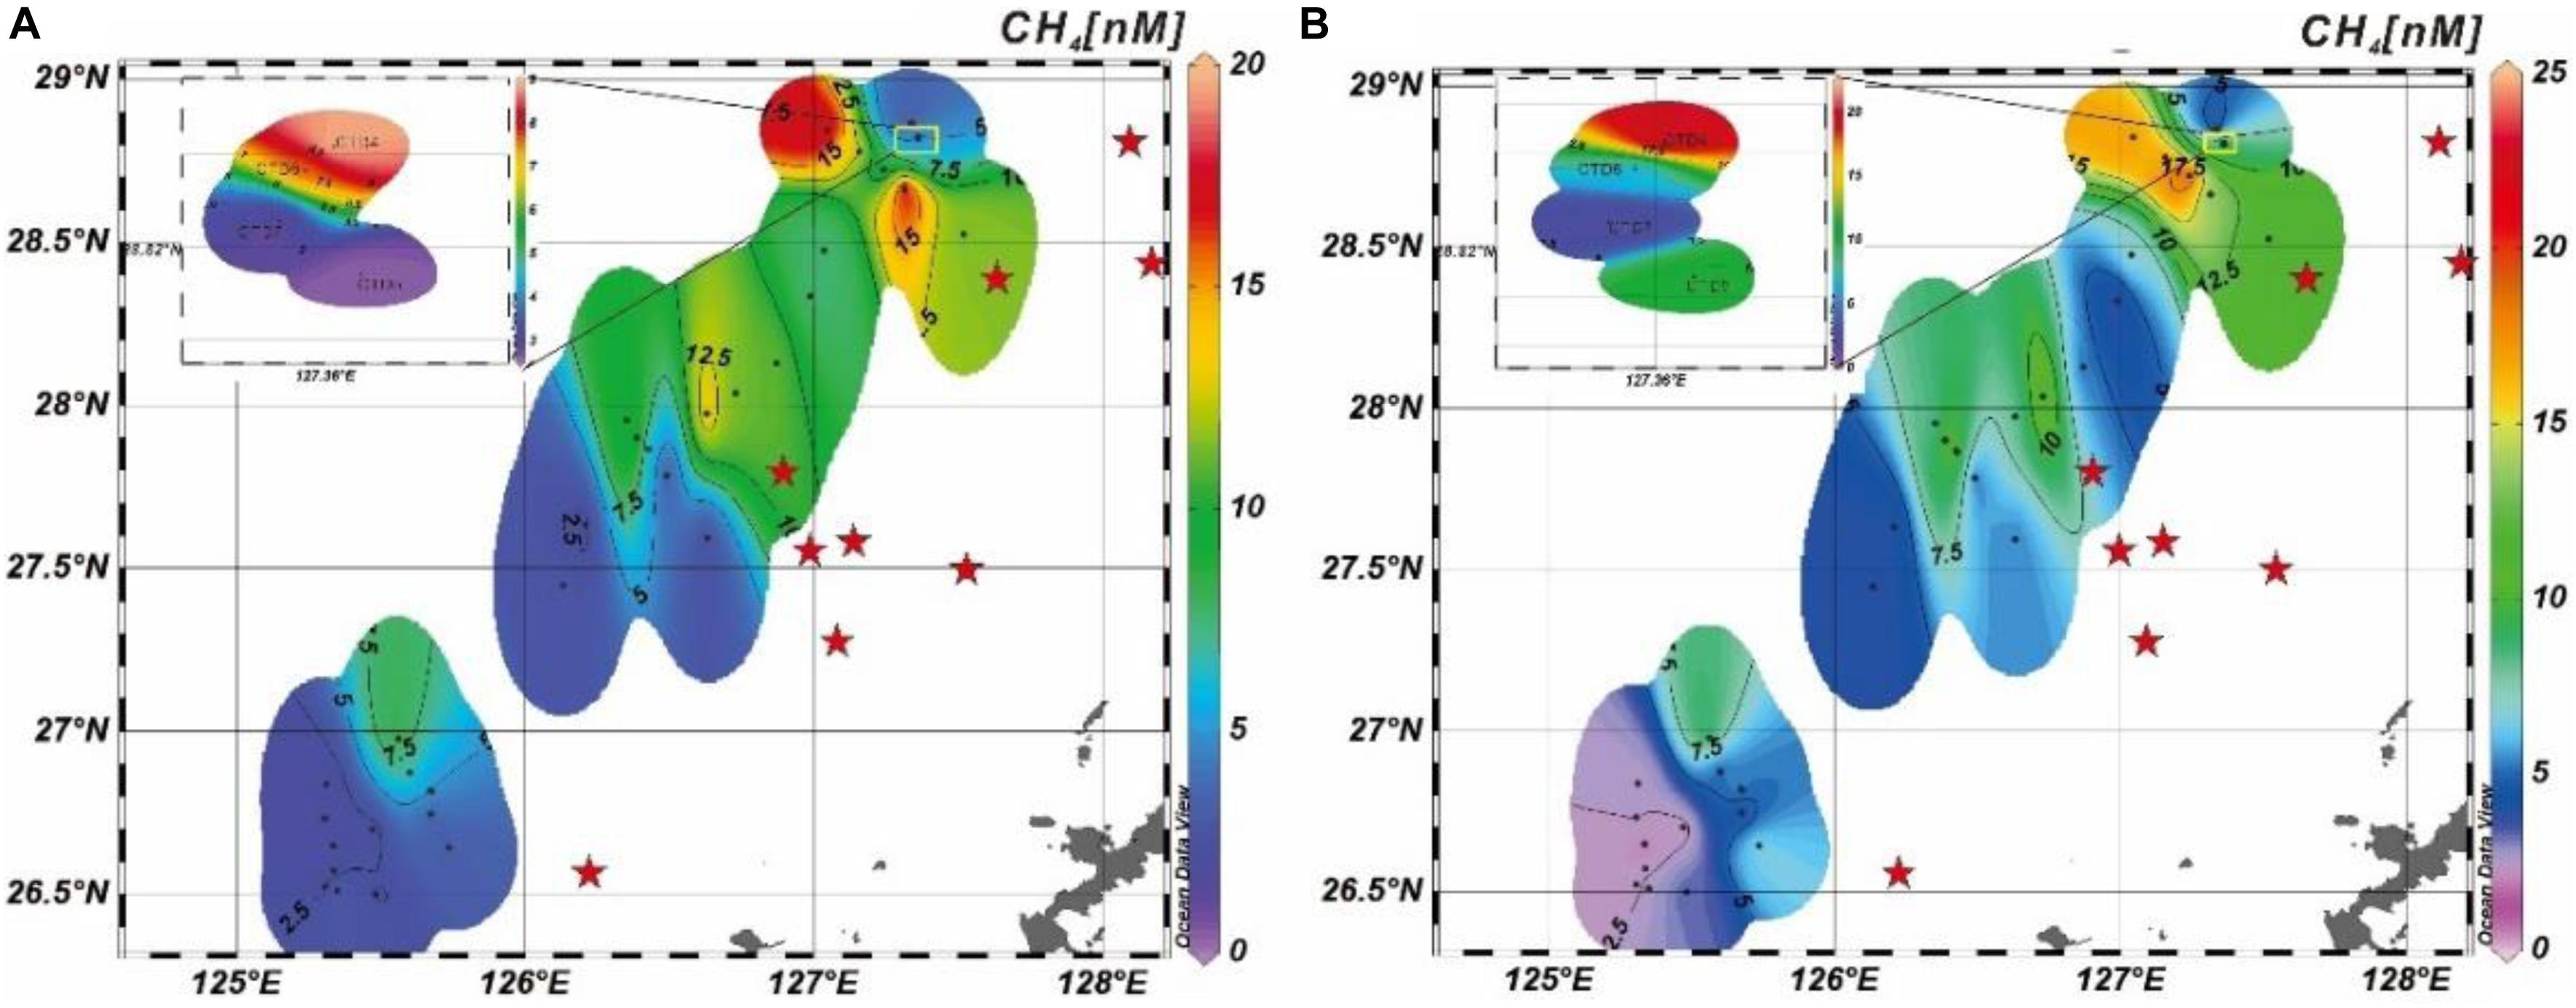
Figure 2. Horizontal distributions of CH4 in (A) surface and (B) bottom water of the OT. Red stars represent hydrothermal vent sites in the middle and northern OT, also in Figure 1. The plots were generated using Ocean Data View (ODV) Version 5.1.0 (Schlitzer, 2018).
Distribution of CH4 Across the Shelf and Slope
We divided our data into six transects. Transects P1–P5 were conducted across the shelf and slope while P6 followed the contour line of the middle slope (Figure 1). Along the P1 transect (Figure 3), CH4 concentrations changed in a wide range, from 2.0 to 20.3 nM. The most conspicuous feature observed in the majority of our sites for the P1 transect was that CH4 concentrations noticeably elevated from the surface to the bottom water. This was particularly pronounced at CTD4 and CTD5, where CH4 concentrations decreased from the surface to 600 m, then increased from 600 m to the seabed (Figure 3). Finally, they reached the maximum value of 20.3 nM for CTD4 and 10.1 nM for CTD5 at the bottom water, which are far more than that in the typical open ocean (Tilbrook and Karl, 1995; Watanabe et al., 1995).
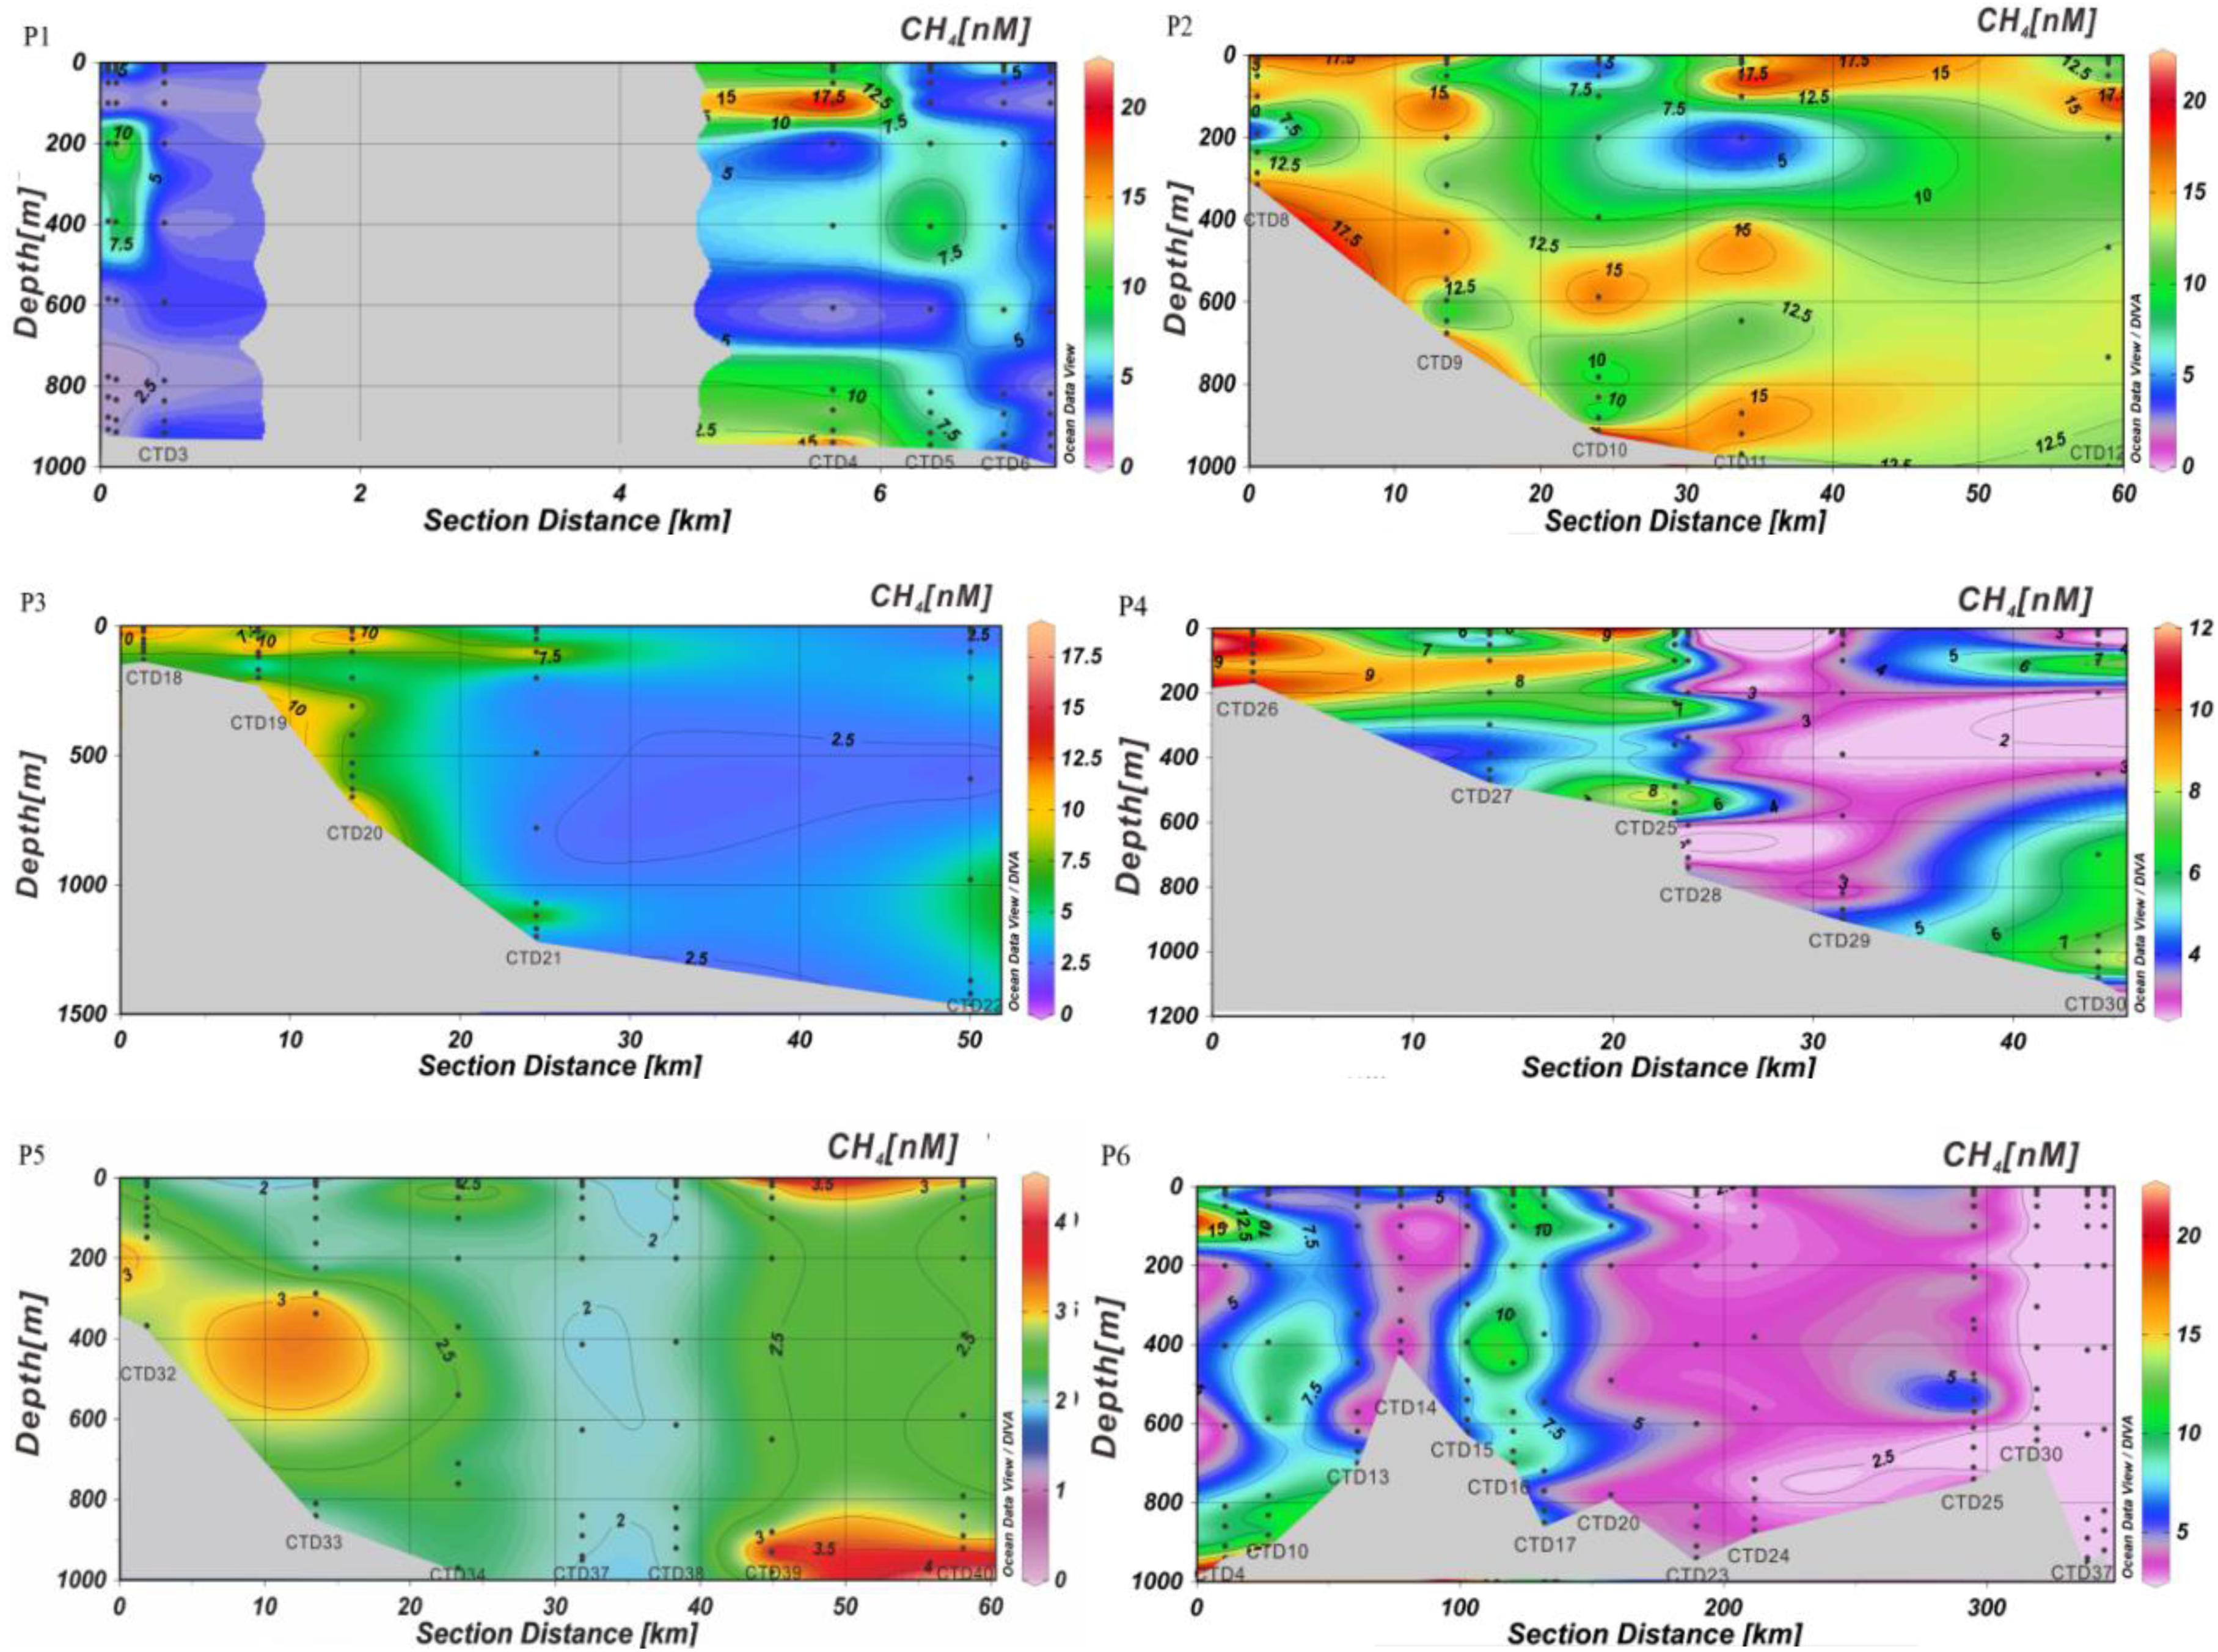
Figure 3. The six transects distribution of CH4 in the OT. The plots were generated using ODV Version 5.1.0 (Schlitzer, 2018). The “gray spaces” in P1 represent areas where there is too little information for ODV to interpolate.
The CH4 concentrations of the P2 and P3 transects unveiled a noticeable shelf-to-slope trend, which increased and then decreased with distance from the shelf. On the continental shelf with shallow water depth, all sites were characterized by relatively high CH4 concentration, with the value > 10 nM, especially in surface waters, which may be influenced by shelf mixed water (Ye et al., 2016; Sun et al., 2018). However, the maximum values in both transects appeared on the slope. In the P3 transect, the highest concentration was 12 times higher than the background value, which appeared at a water depth of approximately 900 m at the site of CTD10. Whereas, the maximum value of P2 appeared at a depth of 1,100 m (near bottom water) at the site of CTD21, with a concentration of 18.4 nM.
Moreover, the characteristics of CH4 concentration in the P4 and P5 transects showed relatively high value in the shelf area and on the lower slope, while it was relatively low on middle slope. This scene can be observed at the CTD26 site with a water depth of 165 m on the shelf area, where CH4 concentration in the whole water depth profile was relatively high, with the range from 8.6 to 10.8 nM. That might be associated with the input of high concentration CH4 from land sources or the production and diffusion from sediment (Ye et al., 2016). However, in the P5 transect located at the canyon in the southern part of the OT, CH4 concentration was lower than that in other sections and was close to the background value, which may be due to the complex geological structure or hydrography (Nakamura et al., 2013). Previous study showed that the internal waves and tides, combined with the Kuroshio current, enhanced the disturbance and mixing of sea water in submarine canyons (Gao, 1996), that resulted in a rapidly dilution of emitted CH4 by surrounding waters. Thus, it was one of the important reasons for the relatively low CH4 concentration in this area.
In the present research, we summarized the distribution characteristic of CH4 in the P6 transect along the contour line on the west middle slope of the OT. Our results showed that the CH4 concentration ranged from 1.9 to 24.7 nM, and the maximum and minimum values were at CTD10 in the middle OT and at CTD37 in the southern area (Figure 3), respectively. However, at the CTD10 site, a high concentration of CH4 was noted throughout the water column, which may be attributed to methane seepage and methane bubble plumes (Figure 1). Similarly, an abnormally high concentration of CH4 was found at the depth water of the CTD4 site, with a distance of only 16 km from the CTD10 site. Moreover, the CH4 concentrations in the near-surface waters of the CTD16 and CTD17 sites were relatively high, with the values of 12.5 and 14.5 nM, respectively.
According to the analysis results of the above-mentioned six transects, it was disclosed that higher CH4 concentration was observed on the shelf and lower slope area within the depth range of 900–1000 m. In order to identify the CH4 influence factors of the main water masses and currents, we presented the CTD profile data of all sites in Figure 4 and Supplementary Figure S1. Most data points indicated that the shelf mixed water (SMW) and Kuroshio (salinity > 34‰, with gradual reduction of temperature with depth) played substantial roles in regulating the distribution of CH4 concentration. The SMW distributed in the shelf edge zone included Changjiang Diluted Water (CDW), TWCW, and Kuroshio Surface Water (KSW) (Zhang et al., 2007; Ye et al., 2016). Previous studies reported that a small number of large rivers in East Asia (Sieburth, 1987) were transporting huge amounts of freshwater along with high concentrations of dissolved CH4 to the ECS, e.g., about 70.6 × 10⁶ mol yr–1 CH4, were imported from the Changjiang (112–190 nM in the surface water in spring) to the ECS (Tsurushima et al., 1996; Zhang et al., 2004; Ye et al., 2016; Sun et al., 2018). It is noteworthy that dissolved CH4 in the river water is almost 2 orders of magnitude higher than that found in the continental shelf edge (Sun et al., 2018), and in summer, this river water mass extends further to the continental shelf, which may justify the relatively high CH4 concentration in this area. However, the main stream of the Kuroshio flowing northeastward along the 200 m isoline (Qin, 1987), is the most important factor that affects the study area (Figure 4), with a relatively low CH4 concentration (Rehder and Suess, 2001; Zhang et al., 2004). This is coupled with our finding in the slope area, and pronounced in the southern area. However, the CH4 concentration is abnormally high at the sites of the lower slope (e.g., CTD4, 10) even though it is affected by the Kuroshio Intermediate Water (KIW) or Kuroshio Deep Water (KDW) (Figure 4). This may be attributed to the observed methane cold seepage (Figure 1).
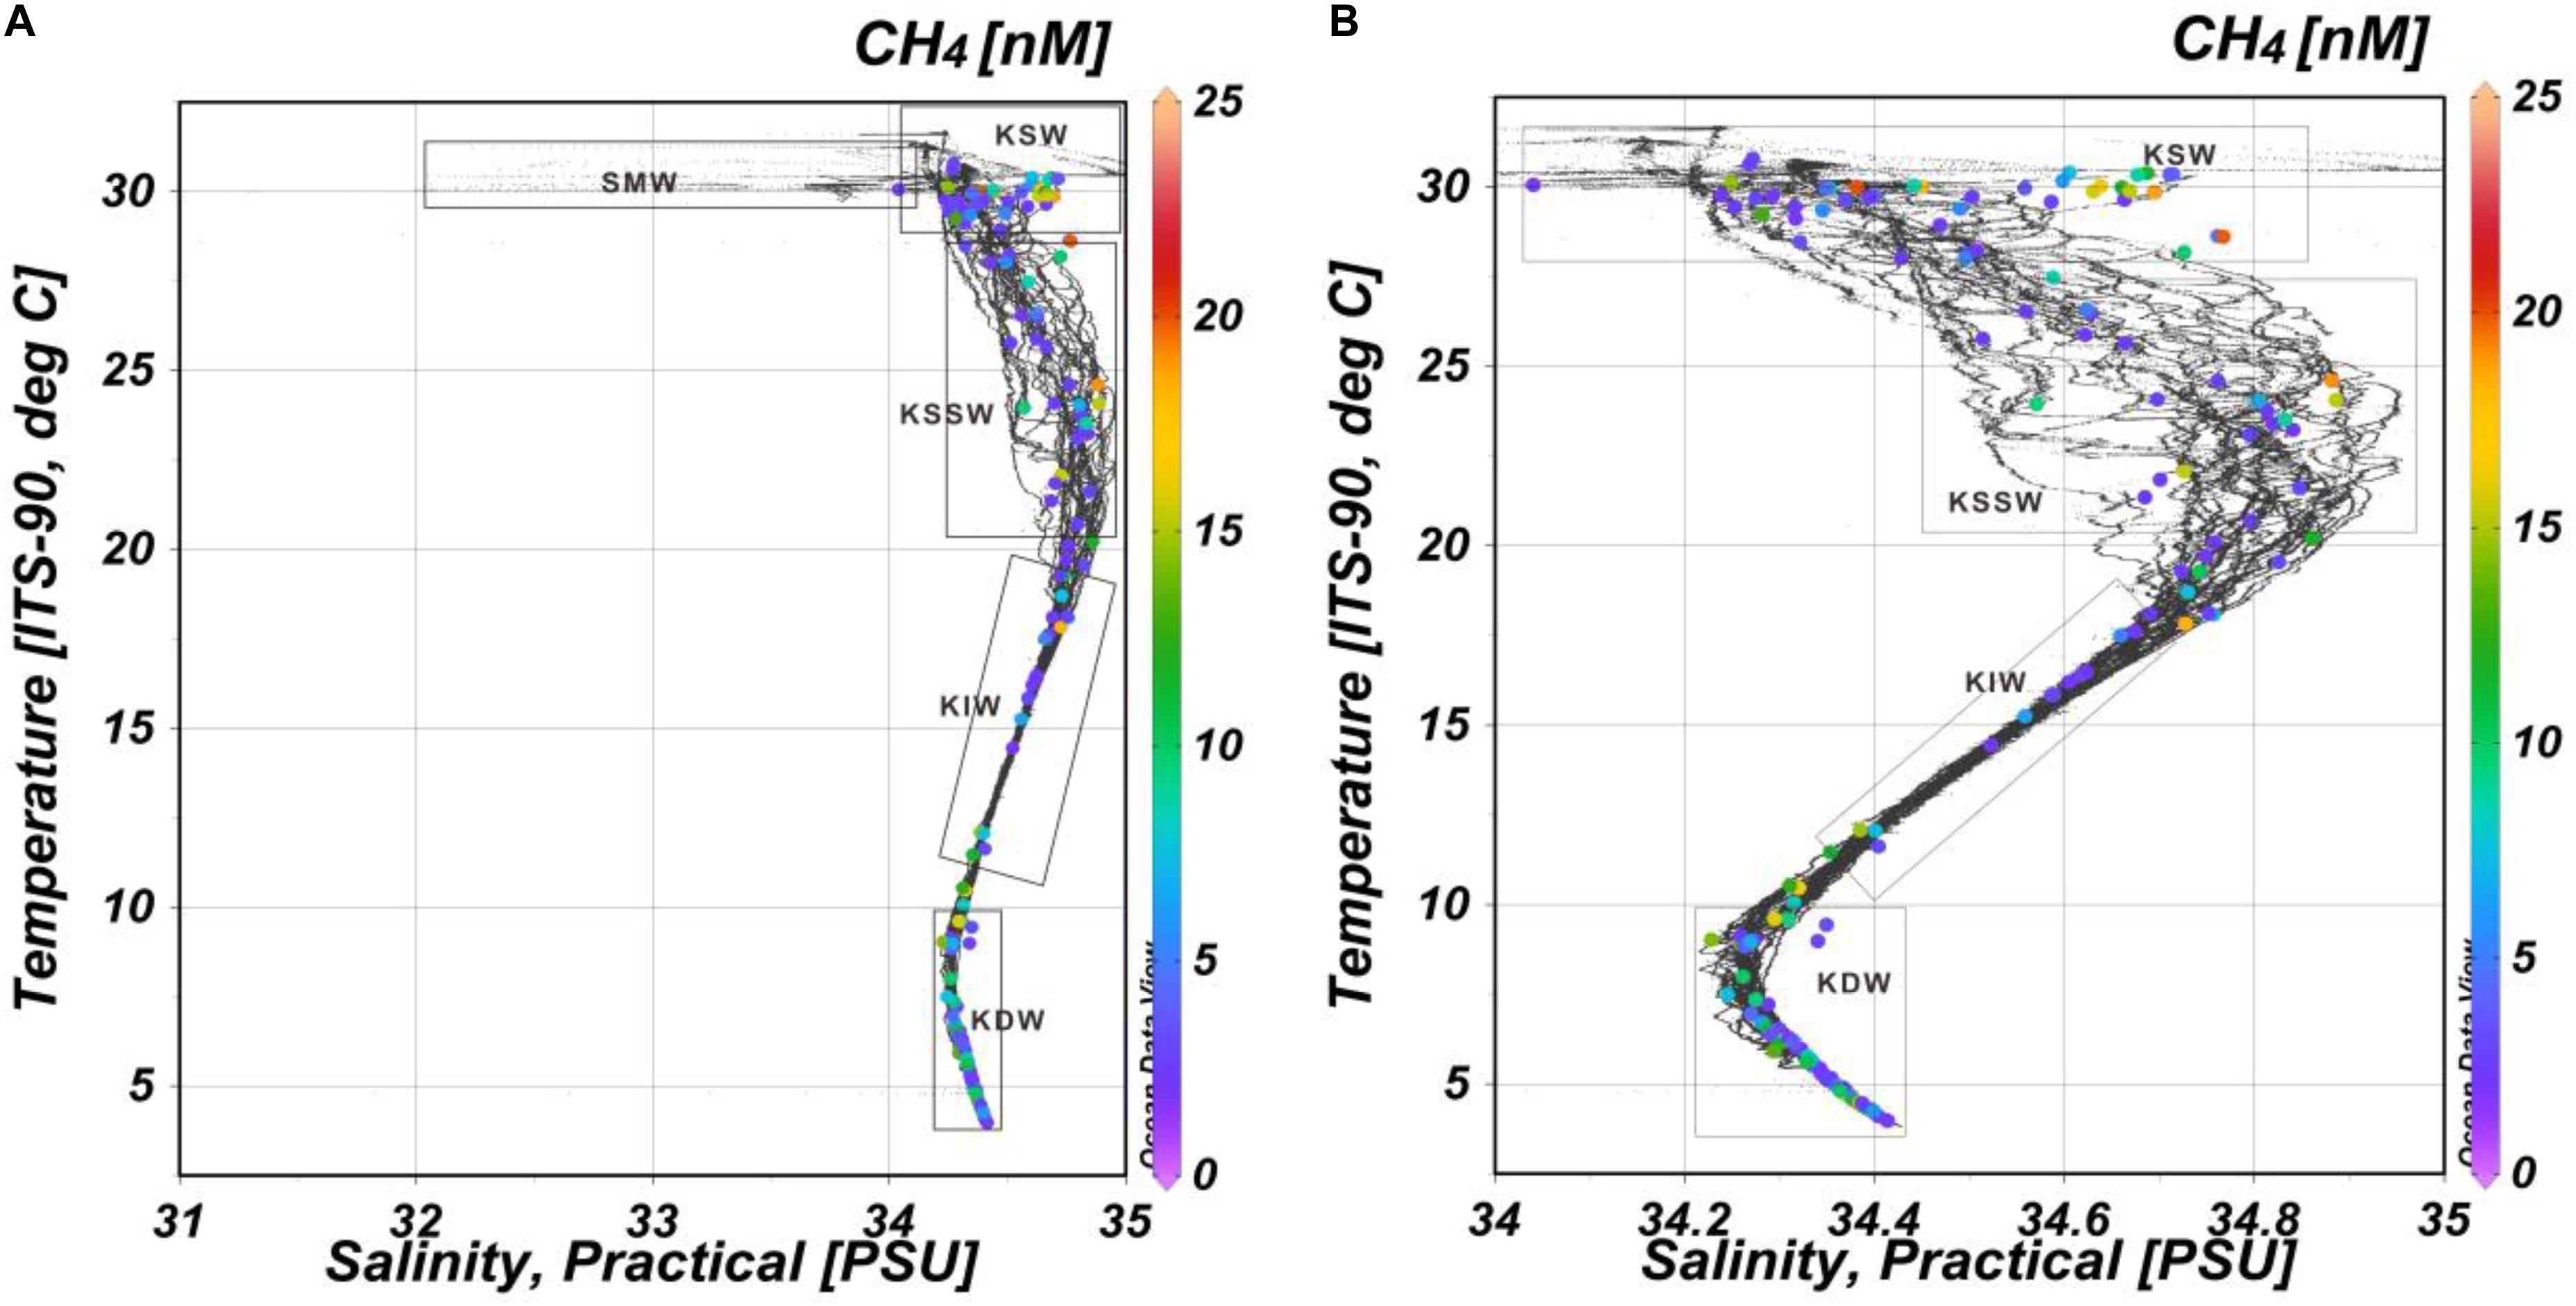
Figure 4. (A) Temperature-salinity diagrams and CH4 concentrations in the OT. (B) A larger version of the Kuroshio Water masses. The dominant water masses are classified according to a previous study (Tang et al., 1997; Li et al., 2012; Qi et al., 2014) and indicated by rectangular outlines. SMW, Shelf Mixed Water; KSW, Kuroshio Surface Water; KSSW, Kuroshio Subsurface Water; KIW, Kuroshio Intermediate Water; KDW, Kuroshio Deep Water. Black dots: non-CH4 sampling point; Colored dots: CH4 sampling points, with concentrations indicated by color scale. The plots were generated using ODV Version 5.1.0 (Schlitzer, 2018).
However, CH4 concentration at the CTD10 and CTD4 sites was found anomalously high in the full depth water column, which was pronounced at a depth of 800–1,100 m near the seafloor. These irregular phenomena are closely related to the cold seepage with methane bubble plumes (Figure 1). CH4 produced in sediments is consumed as it is pushed upward by anaerobic oxidation of methane (AOM) or aerobic CH4 oxidation (Barnes and Goldberg, 1976). However, if the upward CH4 is not fully exhausted by these processes, the extra CH4 is emitted to the ocean, and generates patches of high CH4 concentration (Leifer et al., 2000; Mau et al., 2017). Furthermore, the presence of gas hydrates is inferred from the bottom-simulating reflections (BSRs) in the OT (Fan and Yang, 2004; Xiwu et al., 2008). Geological models calculated that the water depth of the gas hydrate stability zone of the OT was approximately 500 m (Fan and Yang, 2004). Fittingly, the water depth of the CTD10 and CTD4 sites is about 900 m located in the gas hydrate stability zone. In addition, other evidence of pore-water geochemical anomalies (Li et al., 2015; Xu et al., 2018) and geochemical characteristics of authigenic pyrite associated with AOM (Wang et al., 2015) have been documented with cold seepages activities appearing near our study sites. Although CH4 concentration is significantly lower than that in the samples collected by a ROV at the cold seepage sites here, previous studies still supported our augment that anomalously high CH4 concentrations are attributed to the existence of cold seepage. However, the low concentration of CH4 in our samples compared with that in the samples collected by a ROV was attributed to the greater distance above the seafloor during sampling. After emission from the seafloor, CH4 concentration may be noticeably reduced due to continuous oxidation, dissolution, diffusion, and dilution of a large amount of seawater (Leifer et al., 2000; McGinnis et al., 2006; Konn et al., 2009; Faure et al., 2010). Not only that, when the CTD seawater was retrieved, CH4 was partly lost due to a decrease of pressure (Konno et al., 2006). Furthermore, near-surface waters at the CTD16 and CTD17 sites showed high CH4 concentrations, which were more than six times of the background value of the lower slope area, suggesting that there may be methane seepage. Nevertheless, compared with other areas, e.g., west Spitsbergen (up to 524 nM; Gentz et al., 2014), the Gulf of Mexico (∼600 nM; Solomon et al., 2009), and the Hikurangi Margin of New Zealand (up to 3,500 nM; Faure et al., 2010), it seemed that CH4 concentration in this study was lower, and the CH4 seepage was not considerably active in our study area. It is possible that CH4 seepage is episodic, or the seepage is on a small scale or only very close (decimeters) to the seafloor at active seep sites (in the current study, sampled bottom water depth was about 50 m above seafloor). Therefore, it is difficult to catch the abnormality of methane with CTD sampling. Generally, cold seep in a finer scale is spatially associated with canyons, which incision downward into older strata and landward into the upper slope could physically disrupt gas hydrate or free gas deposits. On the contrary, no abnormal CH4 concentration in P5 was detected in the canyon of the study area in spite of the existence of pore water anomalies associated with cold seep (Zhang et al., 2004; Xu et al., 2018). It is also possibly attributed to the episodic characteristic of CH4 seepage or that emitted CH4 is diluted swiftly, distributed by surrounding waters, or is actively consumed in oxygenated seawater.
Notably, our sampling site was relatively close to the hydrothermal vents of the OT (Figures 1, 2), thus, the hydrothermal activity may be an influence factor on the CH4 distribution.
Vertical Distribution of CH4
The vertical concentration profiles of CH4 were irregular due to the complex geography and hydrography of the ECS (Zhang et al., 2004; Figures 3, 5). Nonetheless, CH4 concentrations at nearly half of our study sites exhibited obvious peaks in surface or subsurface water. The largest maximum generally occurred at 50-100 m and coincided with the pycnocline. It was likely the result of in situ aerobic CH4 production caused by microbial biogeochemistry (Reeburgh, 2007). At depths > 200 m, CH4 peaks were present at some sites; for example, at sites CTD5, 13, and 25 (Figure 5), one broad CH4 peak was present at the depth of ∼400 m, which might be associated with the advection and sinking of shelf water across the shelf break (Patra et al., 1998; Ye et al., 2016). Below the depth of ∼ 400 m, CH4 concentration in the majority of profiles decreased with increasing depth and with a concurrent decrease in salinity, indicating the influence of the KIW (Figure 4). Finally, CH4 concentrations increased again when approaching the sea bottom (Figure 5). For instance, CH4 concentrations in the water columns of CTD4, 5, 8, 10, 11, 12, 15, 16, 17, 20, 24, and 28 showed a steady increase to the seafloor, with the maximum value of higher than 10 nM. This may be attributed to CH4 emissions from the underlying sediments discussed above. According to previous studies, biological production of CH4 is expected to be widespread on the shelf due to a copious supply of terrestrial organic matter (Floodgate and Judd, 1992; Lin et al., 1992; Judd and Hovland, 2009). As this organic matter accumulates faster than the supply rate of oxidizing agents, methanogenesis sets in and causes organic carbon concentrations to be partly oxidized to CO2 and partly reduced to CH4 which supports the argument that CH4 in bottom water is maintained by emission from the underlying organic-rich sediments. The water column increase in CH4 concentration when approaching the seafloor was particularly pronounced at the CTD4 and CTD10 sites, with the maximum value of higher than 20 nM at the depth of several meters above the seafloor. This can be attributed to CH4 seepage already reported in this area (Li et al., 2015; Xu et al., 2018).
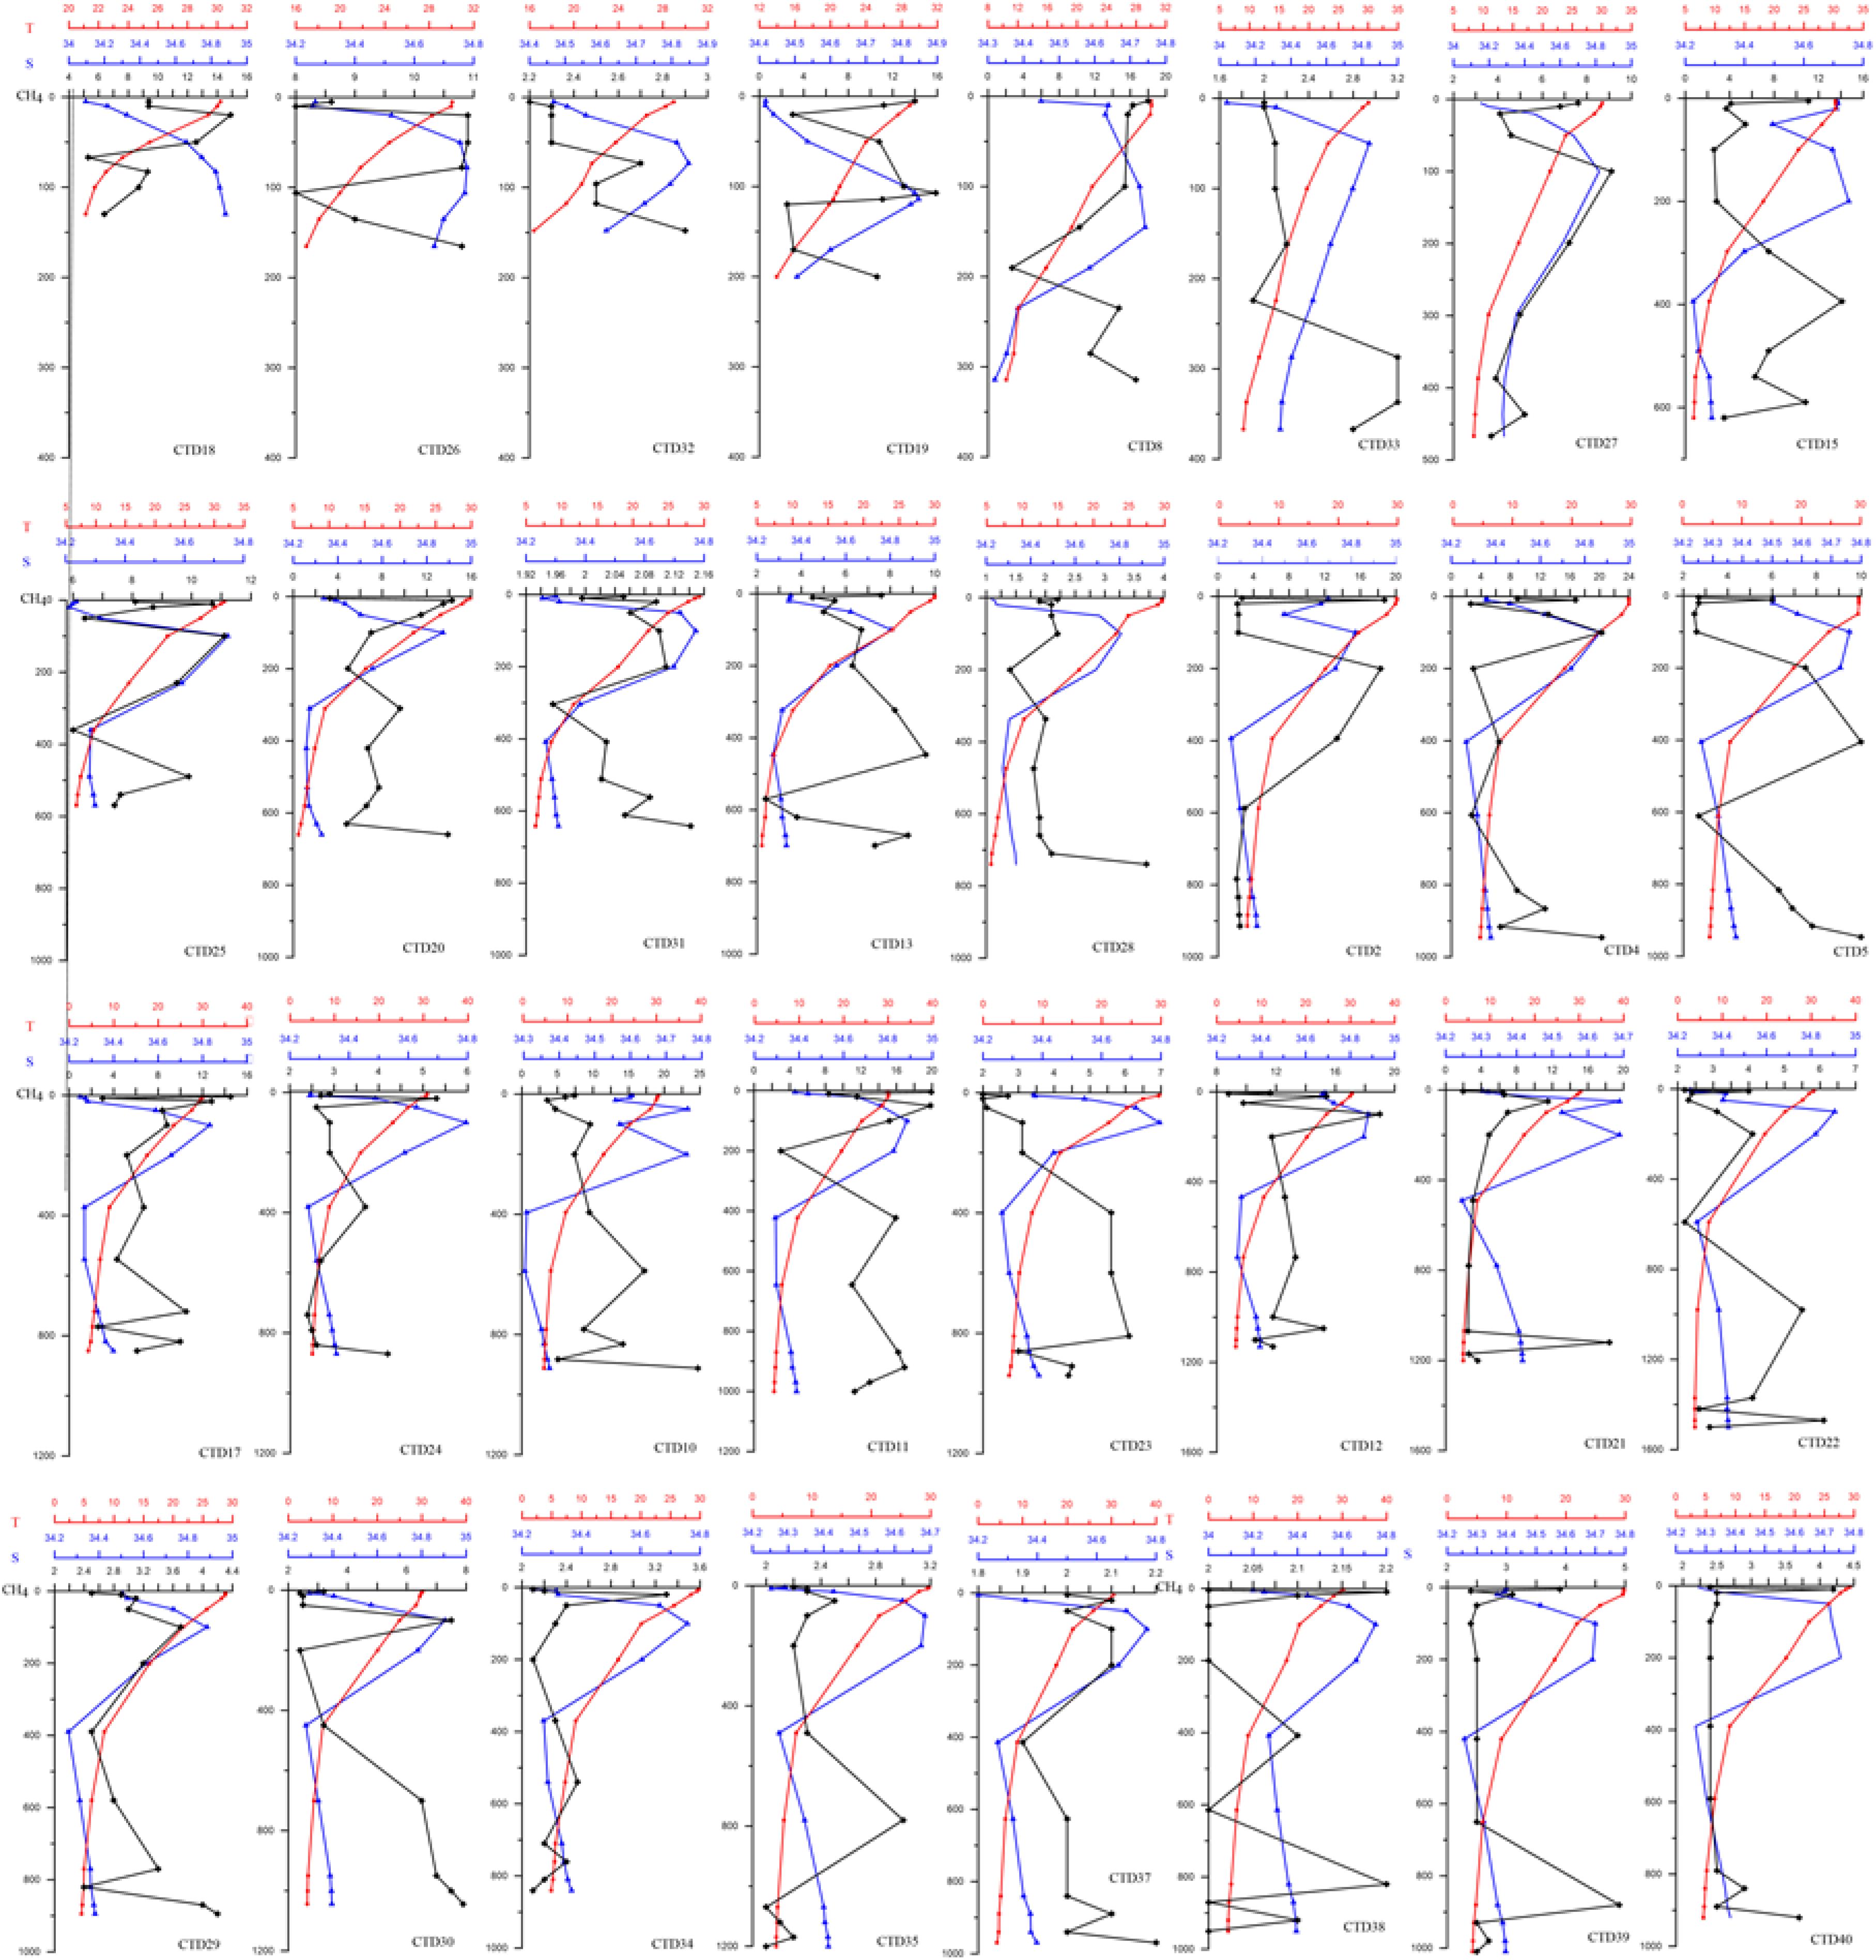
Figure 5. Depth profiles for temperature (°C), salinity (‰), and CH4 (nM) at representative stations of the OT.
Contrary to other sites, the CTD9 site showed positive CH4 anomalies in the entire water column. The CTD10 site showed relatively high CH4 concentration in the depths ranging from ∼450 to 1,000 m, while at CTD4, elevated CH4 concentrations were observed in the depth range from ∼ 850 to 1,000 m. This may indicate that the depth range affected by the seabed CH4 seepage, or the rising height of the methane plume (Figure 1). This is also consistent with the observations of the CH4 bubble plume analyzed through multi-beam data (Sun et al., unpublished data), which revealed that the maximum height of the methane plume can reach 578 m above the seafloor near the CTD10 site where the water depth is about 1,000 m. In general, CH4 can be transported in the form of dissolved or free gas in water (Faure et al., 2010). Bubble dissolution models tell us that a 9 mm diameter pure CH4 bubble released into the water column from a depth of 1,000 m will be dissolved completely when it reaches a depth of 495 m, while a bubble of 15 mm will fully dissipate at 366 m (Greinert and McGinnis, 2009; McGinnis et al., 2006). Assuming that methane bubbles from cold seeps rise from 1,000 to 400 m depth and the bubble dissolution model is applicable to our study, we infer that the diameter of the CH4 bubbles released into the water column must be between 9 and 15 mm.
Methane Lost to the Atmosphere
In this study, we calculated CH4 saturations in the surface seawater (Table 1), which showed obvious spatial variation and was supersaturated throughout the study areas (Supplementary Figure S3), ranged from 108 to 1078%, with the high CH4 saturation mainly noted at lower slope sites surrounding CTD10 and CTD4. This indicated that surface seawater is a net source of atmosphere CH4. Spatially, CH4 saturation ranged from 465 to 975% in the shelf edge area, with an average of 676%. Whereas, in the upper slope area (water depth < 800 m), the saturation varied in a comparatively large range, from 110 to 606%. Different from the shelf and upper slope areas, saturation remarkably changed on the lower slope (108–1078%). Spatial variability among different sites was associated with the characteristics of their geological and physical environment, e.g., seep intensity, water depth, and currents.
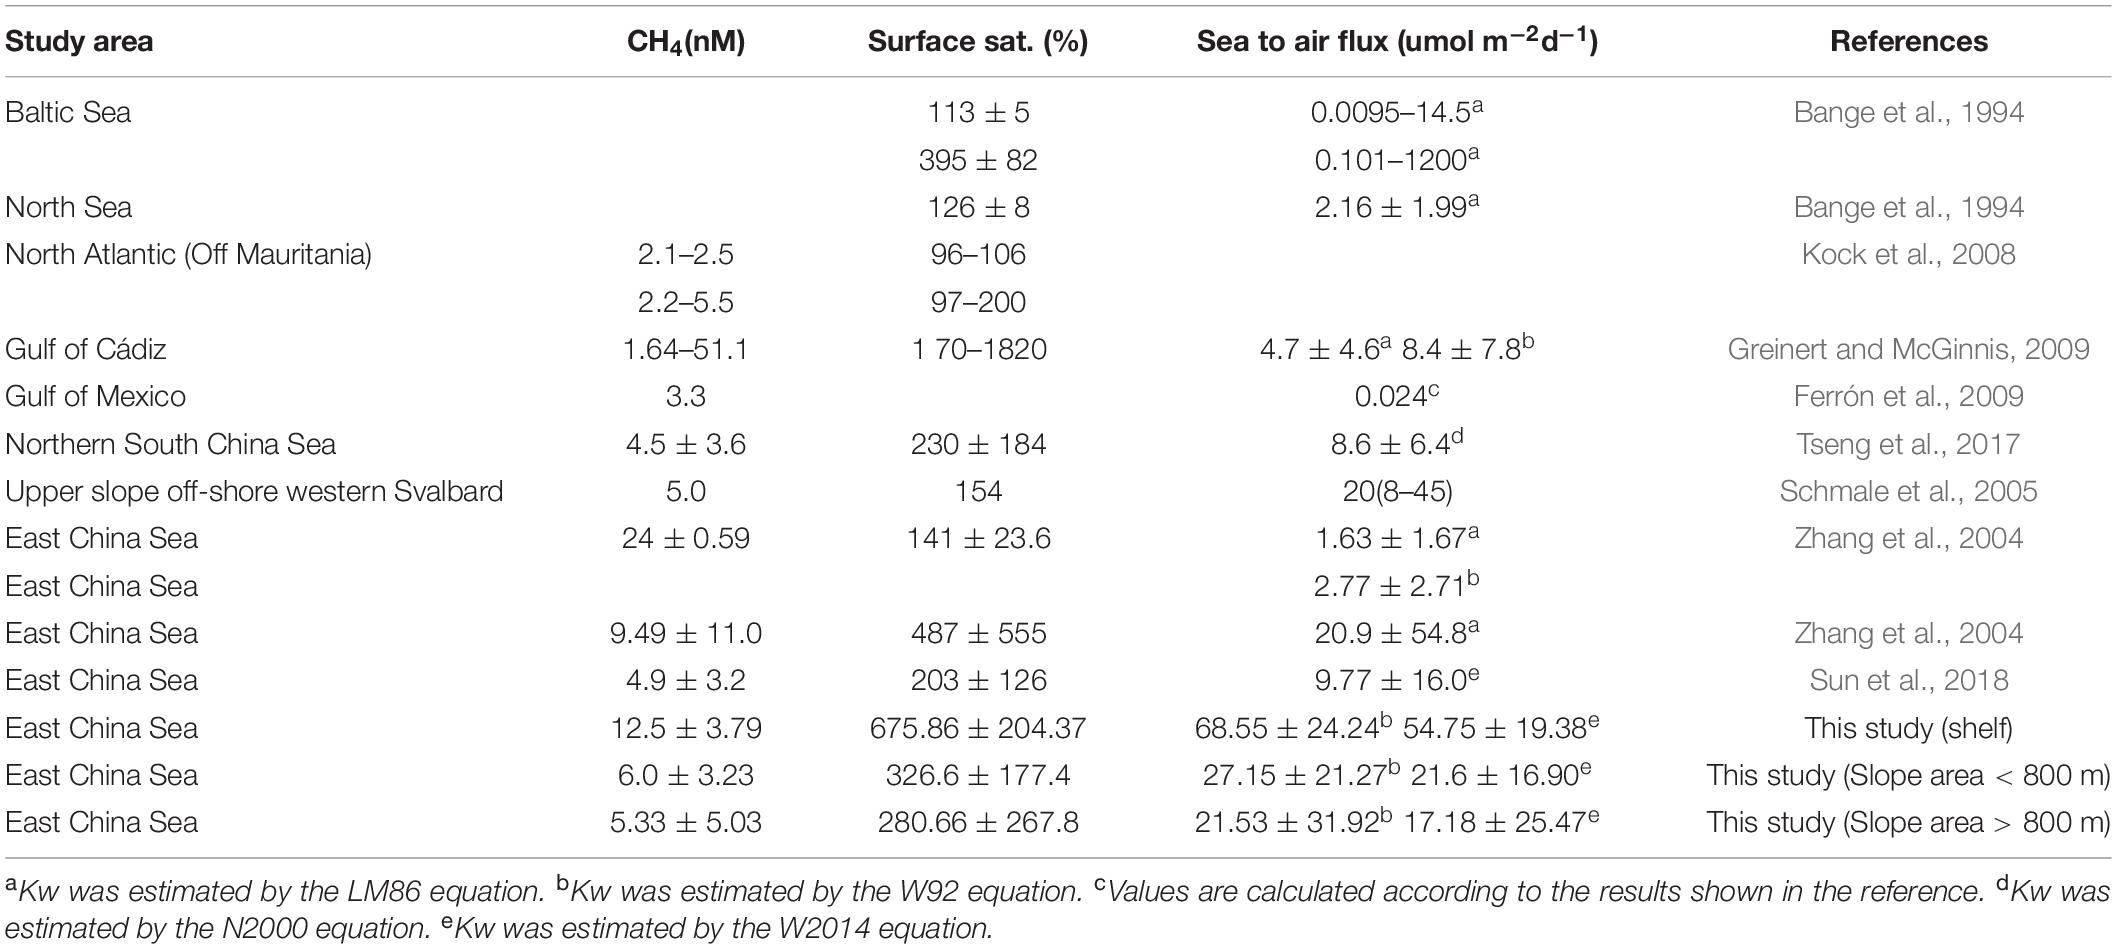
Table 1. Surface concentrations, surface saturations, and sea-to-air fluxes of CH4 reported in different oceanic areas.
To quantify the CH4 lost to the atmosphere in this area, we estimated the sea-air flux. Overall, the sea-air flux of CH4 throughout the study area presented heterogeneity in space (Figure 6), which ranged from 0.74 to 116 μmol m–2d–1, with an average of 26.2 μmol m–2d–1. Compared with the CH4 sea-air flux reported by Tsurushima et al. (1996) and Sun et al. (2018) in the shelf, our estimation showed a higher value, which may be due to different sampling and detection methods. In this study, we conducted CH4 analyses immediately after sampling in a laboratory on-board, which made our detection closer to the actual value than measurements taken after months of store time. Furthermore, the range of the sea-air CH4 flux on the continental shelf is from 34.8 to 104 μmol m–2d–1, with an average of 61.7 μmol m–2d–1, obviously higher than that on the global continental shelf (22–37 μ mol m–2 d–1) (Bange et al., 1994). Compared with other continental shelves worldwide, the sea-air flux was also higher than that in other continental shelf areas of the Western Pacific, such as the South China Sea (Tseng et al., 2017). However, an irregular wide range from 0.74 to 116 μmol m–2d–1 on the slope was noted, with the maximum sea-air CH4 flux value presented around CTD10, which may result from the direct influence of seafloor cold seepage studied previously. Globally, CH4 spillovers on the lower slope are significantly higher than those in the Gulf of Cádiz (Ferrón et al., 2009), the Beihai (Bange et al., 1994), the Philippine Sea (Tseng et al., 2017), and the Gulf of Mexico (Yvon-Lewis et al., 2011; Table 1). In summary, our study area is an active area of CH4 emissions.
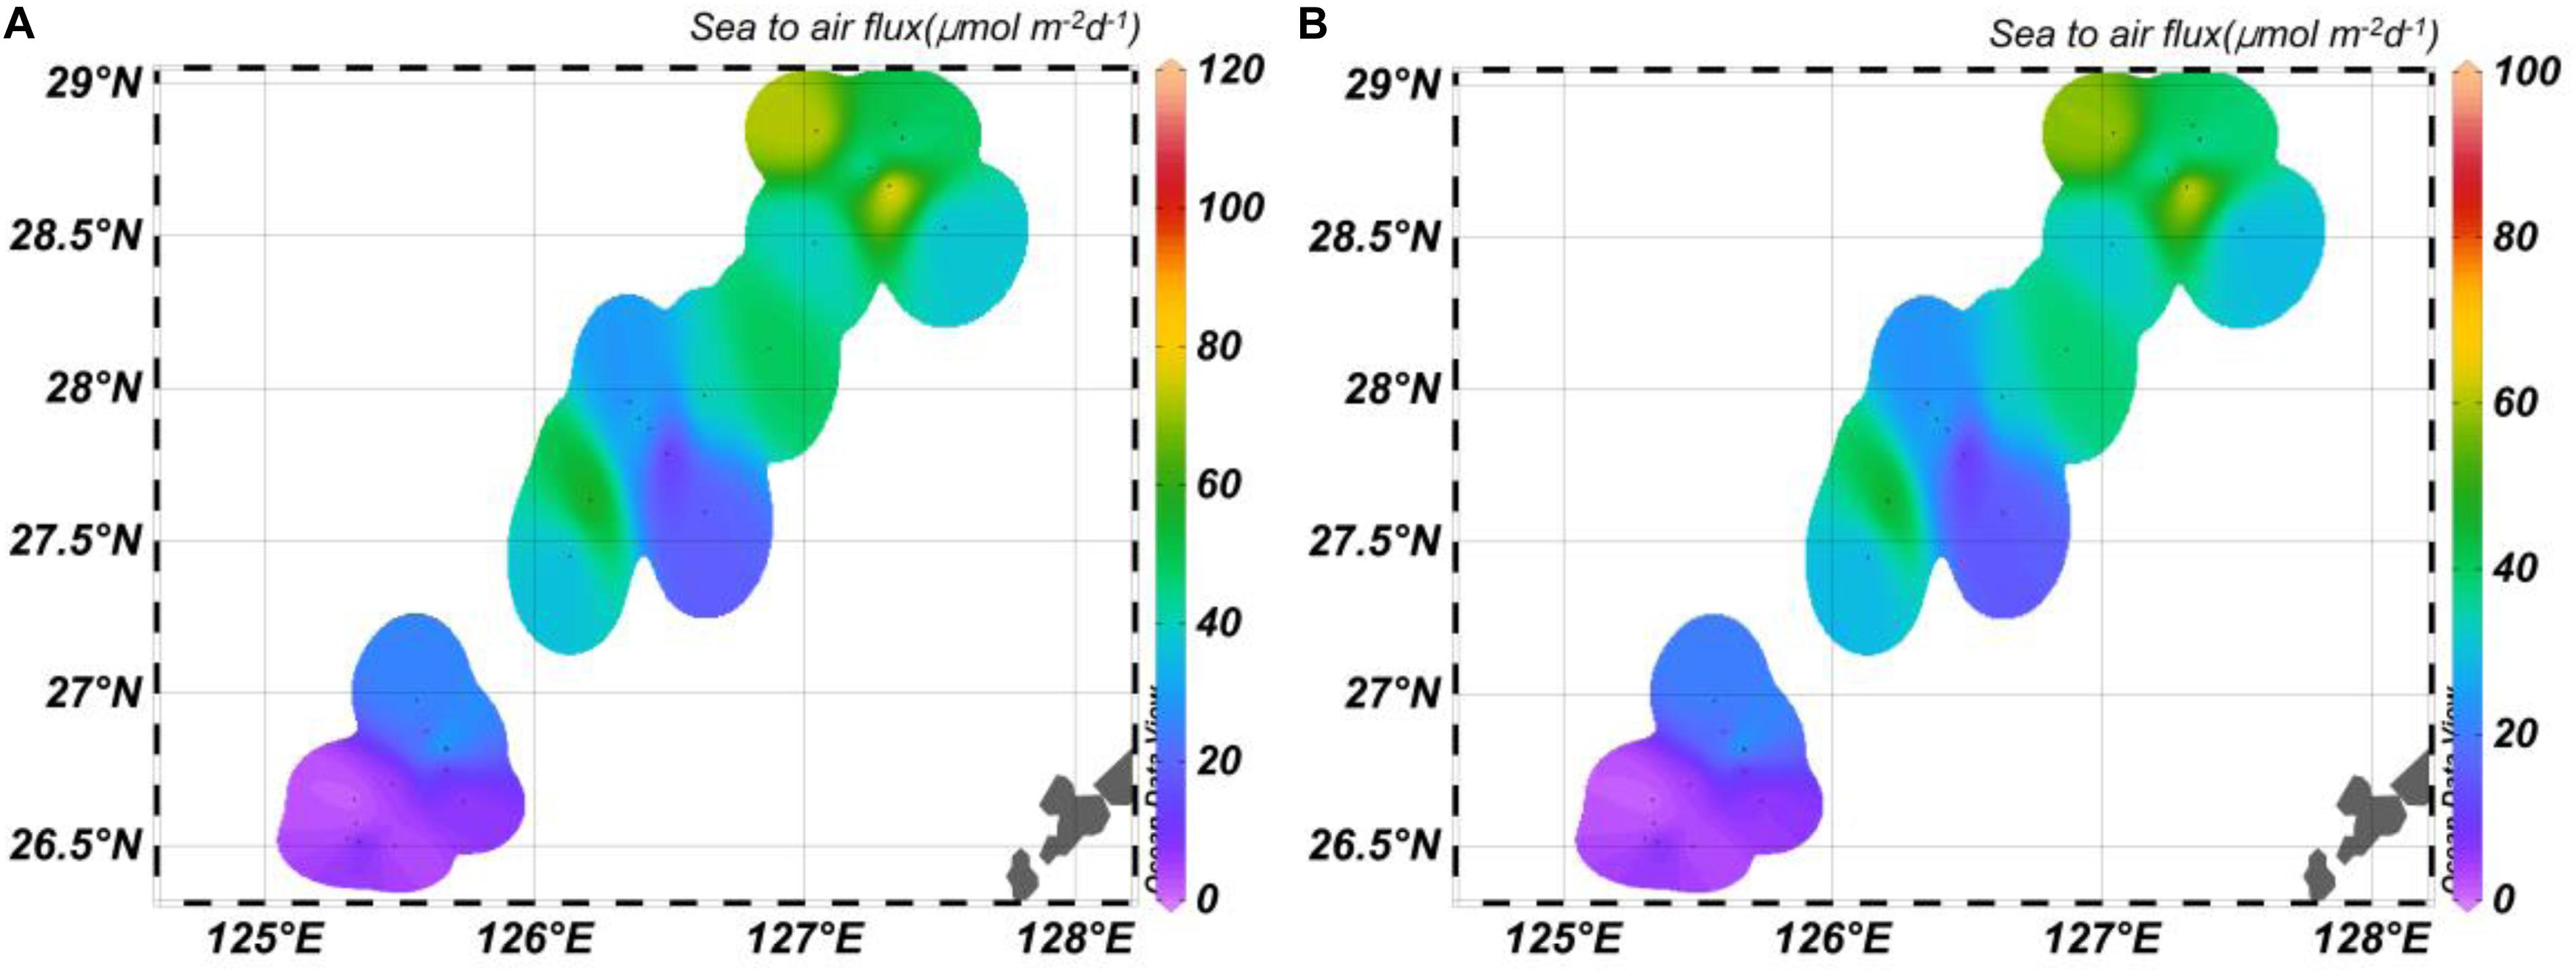
Figure 6. Sea-to-air fluxe of CH4 [(A) Kw was estimated by the W2014 equation; (B) Kw was estimated by the W92 equation].
Possible Effects of Hydrothermal Activities
In addition to the contribution from cold seepage to CH4 in the water of the OT, hydrothermal fluid was noted as an efficient carrier of CH4. Previous studies demonstrated that approximately more than 20 hydrothermal vents have been discovered since the 1980s in the OT (Halbach et al., 1989; Miyazaki et al., 2017). Significant enrichment of hydrothermal fluids of the OT in gas species is one of the geochemical features compared with those in the typical sediment-starved Mid Ocean Ridge (Sakai et al., 1990; Konno et al., 2006; Kawagucci et al., 2011; Ishibashi et al., 2014). Furthermore, anomalously high CH4 concentrations were reported in the venting fluid of Iheya North (up to 7.6 mM; Kawagucci et al., 2011) in the middle OT, and documented CH4 concentration in hydrothermal fluids of the Minami Ensei nearest to our study sites was approximately 2.1 mM (Kawagucci et al., 2013). These fluids, with CH4 concentrations generally a thousand times more than the background value, are a significant contributor to the seawater CH4 (Glasby and Notsu, 2003).
In the current research, CH4 concentration at different sites was anomalously high in the deep-water of the study area. As shown in Figures 1, 2, distribution of high CH4 concentrations in the depth water partly appeared near known hydrothermal sites (Inagaki et al., 2006). For instance, in depth of 1050 mbsl (not the bottom water), the data from CTD12 showed a CH4 concentration of 15.2 nM, and this high concentration may originate from the nearest seep site of CTD10 as discussed earlier. However, it was found to be very close to the Minami Ensei Knoll hydrothermal vent with the high temperature fluid enriched in CH4. The distance measured between them is approximately only 19 km. Although Cowen et al. (2002) reported that CH4 in hydrothermal plumes can be dramatically decayed with dispersed distances by the microbial oxidation process along with dilution of the plume with background waters; CH4 evidence in the hydrothermal plume occurred in a distal station 15 km off the hydrothermal vents of the Juan de Fuca Ridge with a CH4 concentration of 600 nM. However, CH4 concentration in the Minami Ensei Knoll (∼2.1 mM) and the velocity of the current in the OT were significantly higher than that in the Juan de Fuca Ridge (Cowen et al., 2002; Nakamura et al., 2008; Kawagucci et al., 2013), thus, CH4 in the hydrothermal plume could be further transferred. Therefore, we speculate that the CH4 concentration in the CTD12 site may be influenced by the Minami Ensei Knoll hydrothermal fluid. In addition, CTD17 showed a high concentration of CH4 in deep rather than bottom water, with the maximum value of higher than 10 nM, which may be due to the horizontal extra input by non-buoyant plumes (German and Syefried, 2014). Similar to CTD12, a hydrothermal vent was found near the site named Iheya Ridge (Figure 1) with an extremely high CH4 concentration of 7.6 mM (Ishibashi et al., 1995; Kawagucci et al., 2011, 2013). In this case, this might effect the CH4 concentration of CTD17.
Significance of Methane Seepage for the CH4 Budget
Methane seepage from seafloor sediments remains poorly quantified, although it is widespread on continental margins (Judd and Hovland, 2009; Boetius and Wenzhöfer, 2013). Most previous studies demonstrated that the contribution of the oceans to the global atmospheric CH4 budget is minor (Schmale et al., 2005; Yvon-Lewis et al., 2011), with inputs originating from surface seawater, only occurring in regions of supersaturation. In contrast, new sites of seafloor CH4 seepage are being discovered continually (Skarke et al., 2014), and recent studies on CH4 fluxes at sites of seepage have been conducted. However, previous results based on traditional indirect sampling techniques and modeling suggested that bubble plumes emitted from cold seepages at depths greater than 200 m do not reach the surface mixed layer due to bubble dissolution and CH4 oxidation (Valentine et al., 2001). This case is present in deep-water hydrocarbon seepages in offshore Svalbard (Graves et al., 2015) and the northern Gulf of Mexico (Hu et al., 2012), where seafloor makes an insignificant local contribution to the atmosphere due to CH4 oxidation. Similar to these areas, the sea-air flux that we estimated from the west slope of the OT was relatively small. Based on the mean flux, the preliminarily estimated emission rate of CH4 from our study area in the ECS was 2.9 × 10⁻³ Tg yr–1. This indicated that although the study area only accounted for 2.47% of the surface area in the ESC (∼7.7 × 10⁵ km2), it accounted for about 4.5% of CH4 emissions in the ESC (6.4 × 10⁻² Tg yr–1) (Ye et al., 2016). Nevertheless, as a unique back-arc basin, the characteristic of CH4 can be influenced by both the cold seepage and the pervasive hydrothermal fluids as discussed above. Our study area only represented 2.47% of the ESC and was away from the majority of hydrothermal sites; thus, the contribution of emitted CH4 from sediment to atmosphere in the ESC was remarkably larger than that estimated previously (Ye et al., 2016).
Additionally, these CH4 emissions from the seafloor extreme systems may have a significant influence on the carbon cycle. Methane seepage allows buried old or deep sourced carbon to be transported to the seafloor (Boetius and Wenzhöfer, 2013), which contributes allochthonous forms of methane carbon to water (Pohlman et al., 2011; Zhang et al., 2019). At the same time, part of the methane carbon is bio-absorbed and then redeposited in carbonate (Sun et al., 2015), which became the methane sink. On the other hand, Zachos et al. (2004) reported that large releases of methane could have contributed to ocean acidification and with that resulting in the dissolution of large amounts of sedimentary carbonate in historic events. In this case, that would speed up the circulation of methane carbon in the ocean.
Conclusion
CH4 concentrations in the seawaters on the west slope of the OT were in the range of 2.7–24.7 nM, with an average of 6.5 nM. The special distributions revealed that CH4 concentration in the majority of the transections showed a high to low trend from the shelf to the slope. However, CH4 concentration in the P1 and P2 transections was subjected to high variability, showing high values in the bottom water of the CTD4 and CTD10 sites. The vertical distributions indicated that dissolved CH4 can be influenced by in situ aerobic CH4 production caused by microbial biogeochemistry or physical advective supply from the shallower depth water of the continental shelf.
CH4 in the surface water was, in all cases, supersaturated with respect to the atmosphere. Besides, the sea-air flux of CH4 throughout the study area showed high spatial variations, which ranged from 0.74 to 116 μmol m–2d–1, demonstrating that surface seawater is a net source of CH4 to the atmosphere. Based on the mean CH4 flux, the preliminary estimated rate of CH4 from our study area in the ECS was 2.9 × 10⁻³ Tg yr–1, which was higher than the value speculated previously. Therefore, the previously estimated CH4 emission rate in the ESC may be underestimated according to our findings. The coexisted contributions of the cold seepage and hydrothermal vents expand our view of the CH4 budget of the back-arc basin worldwide.
Data Availability Statement
The raw data supporting the conclusions of this article will be made available by the authors, without undue reservation, to any qualified researcher.
Author Contributions
ZS and NW organized and designed sampling strategy. XiaZ, LW, XilZ, and BZ collected the sample. XY analyzed the CH4 concentrations. XiaZ wrote the manuscript. CX, WG, and HC contributed to the data interpretation and discussion of the manuscript at different stages. All authors contributed to the article and approved the submitted version.
Funding
This study was supported by the National Natural Science Foundation of China (Nos. 41606087 and 91858208), the National Key Basic Research and Development Program of China (Nos. 2018YFC031000303 and 2017YFC0307704), and the Marine Geological Survey Program of China Geological Survey (No. DD20190819).
Conflict of Interest
The authors declare that the research was conducted in the absence of any commercial or financial relationships that could be construed as a potential conflict of interest.
Acknowledgments
We thank the captains and crew of Zhang Jian for their assistance in recovering the samples during the ECS marine geological Expedition during 2016 and 127 ROV cruises during 2017. We also thank Dr. Meng Wang and his team members from Shanghai Jiao Tong University for their help in exploration and sampling in cold seeping areas by the ROV Beaver.
Supplementary Material
The Supplementary Material for this article can be found online at: https://www.frontiersin.org/articles/10.3389/feart.2020.00333/full#supplementary-material
Footnotes
References
Bange, H. W., Bartell, U., Rapsomanikis, S., and Andreae, M. O. (1994). Methane in the baltic and north seas and a reassessment of the marine emissions of methane. Global Biogeochem. Cycles 8, 465–480. doi: 10.1029/94GB02181
Barnes, R., and Goldberg, E. (1976). Methane production and consumption in anoxic marine sediments. Geology 4, 297–300. doi: 10.1130/0091-7613(1976)4<297:MPACIA>2.0.CO;2
Bates, T. S., Kelly, K. C., Johnson, J. E., and Gammon, R. H. (1996). A reevaluation of the open ocean source of methane to the atmosphere. J. Geophys. Res. Atmos. 101, 6953–6961. doi: 10.1029/95JD03348
Boetius, A., and Wenzhöfer, F. (2013). Seafloor oxygen consumption fuelled by methane from cold seeps. Nat. Geosci. 6, 725–734. doi: 10.1038/ngeo1926
Chronopoulou, P.-M., Shelley, F., Pritchard, W. J., Maanoja, S. T., and Trimmer, M. (2017). Origin and fate of methane in the eastern tropical north pacific oxygen minimum zone. ISME J. 11, 1386–1399. doi: 10.1038/ismej.2017.6
Cowen, J. P., Wen, X., and Popp, B. N. (2002). Methane in aging hydrothermal plumes. Geochim. Cosmochim. Acta 66, 3563–3571. doi: 10.1016/S0016-7037(02)00975-4
Fan, D.-J., and Yang, Z.-S. (2004). Development and distribution of natural gas hydrate in the okinawa trough. Acta Petrolei Sinica 25, 11–17.
Faure, K., Greinert, J., von Deimling, J. S., McGinnis, D. F., Kipfer, R., and Linke, P. (2010). Methane seepage along the hikurangi margin of new zealand: geochemical and physical data from the water column, sea surface and atmosphere. Mar. Geol. 272, 170–188. doi: 10.1016/j.margeo.2010.01.001
Ferrón, S., Alonso-Pérez, F., Ortega, T., and Forja, J. M. (2009). Benthic respiration on the northeastern shelf of the Gulf of Cádiz (SW Iberian Peninsula). Mar. Ecol. Prog. Ser. 392, 69–80. doi: 10.3354/meps08240
Fleischer, P., Orsi, T., Richardson, M., and Anderson, A. (2001). Distribution of free gas in marine sediments: a global overview. Geo-Mar. Lett. 21, 103–122. doi: 10.1007/s003670100072
Floodgate, G., and Judd, A. (1992). The origins of shallow gas. Cont. Shelf Res. 12, 1145–1156. doi: 10.1016/0278-4343(92)90075-U
Gao, Z. (1996). Deep Water Traction Current Deposition: Study on Internal Tide, Internal Wave and Isocurrent Deposition. Beijing: Science Press. (in chinese).
Gentz, T., Damm, E., von Deimling, J. S., Mau, S., McGinnis, D. F., and Schlüter, M. (2014). A water column study of methane around gas flares located at the West Spitsbergen continental margin. Cont. Shelf Res. 72, 107–118. doi: 10.1016/j.csr.2013.07.013
German, C. R. Jr., and Syefried, W. E. Jr. (2014). “8.7-hydrothermal processes,” in Treatise Geochem, 2nd Edn, eds H. D. Holland and K. K. Turekian (Amsterdam: Elsevier), 191–233. doi: 10.1016/B978-0-08-095975-7.00607-0
Glasby, G., and Notsu, K. (2003). Submarine hydrothermal mineralization in the okinawa trough, SW of Japan: an overview. Ore Geol. Rev. 23, 299–339. doi: 10.1016/j.oregeorev.2003.07.001
Graves, C. A., Steinle, L., Rehder, G., Niemann, H., Connelly, D. P., Lowry, D., et al. (2015). Fluxes and fate of dissolved methane released at the seafloor at the landward limit of the gas hydrate stability zone offshore western Svalbard. J. Geophys. Res.: Oceans 120, 6185–6201. doi: 10.1002/2015JC011084
Greinert, J., and McGinnis, D. F. (2009). Single bubble dissolution model–The graphical user interface SiBu-GUI. Environ. Model. Softw. 24, 1012–1013. doi: 10.1016/j.envsoft.2008.12.011
Halbach, P., Nakamura, K.-I., Wahsner, M., Lange, J., Sakai, H., Käselitz, L., et al. (1989). Probable modern analogue of Kuroko-type massive sulphide deposits in the Okinawa Trough back-arc basin. Nature 338, 496–499. doi: 10.1038/338496a0
Hu, L., Yvon-Lewis, S. A., Kessler, J. D., and MacDonald, I. R. (2012). Methane fluxes to the atmosphere from deepwater hydrocarbon seeps in the northern Gulf of Mexico. J. Geophys. Res. 117, 1–13. doi: 10.1029/2011JC007208
Inagaki, F., Kuypers, M. M., Tsunogai, U., Ishibashi, J.-I., Nakamura, K.-I., Treude, T., et al. (2006). Microbial community in a sediment-hosted CO2 lake of the southern Okinawa Trough hydrothermal system. Proc. Natl. Acad. Sci. U.S.A. 103, 14164–14169. doi: 10.1073/pnas.0606083103
Ishibashi, J., Sano, Y., Wakita, H., Gamo, T., Tsutsumi, M., and Sakai, H. (1995). Helium and carbon geochemistry of hydrothermal fluids from the mid-okinawa trough back arc basin, southwest of Japan. Chem. Geol. 123, 1–15. doi: 10.1016/0009-2541(95)00051-M
Ishibashi, J.-I., Noguchi, T., Toki, T., Miyabe, S., Yamagami, S., Onishi, Y., et al. (2014). Diversity of fluid geochemistry affected by processes during fluid upwelling in active hydrothermal fields in the Izena Hole, the middle Okinawa Trough back-arc basin. Geochem. J. 48, 357–369. doi: 10.2343/geochemj.2.0311
Jayakumar, D., Naqvi, S., Narvekar, P., and George, M. (2001). Methane in coastal and offshore waters of the Arabian Sea. Mar. Chem. 74, 1–13. doi: 10.1016/S0304-4203(00)00089-X
Judd, A., and Hovland, M. (2009). Seabed Fluid Flow: the Impact on Geology, Biology and the Marine Environment. Cambridge: Cambridge University Press.
Kawagucci, S., Chiba, H., Ishibashi, J.-I., Yamanaka, T., Toki, T., Muramatsu, Y., et al. (2011). Hydrothermal fluid geochemistry at the Iheya North field in the mid-okinawa trough: implication for origin of methane in subseafloor fluid circulation systems. Geochem. J. 45, 109–124. doi: 10.2343/geochemj.1.0105
Kawagucci, S., Ueno, Y., Takai, K., Toki, T., Ito, M., Inoue, K., et al. (2013). Geochemical origin of hydrothermal fluid methane in sediment-associated fields and its relevance to the geographical distribution of whole hydrothermal circulation. Chem. Geol. 339, 213–225. doi: 10.1016/j.chemgeo.2012.05.003
Kock, A., Gebhardt, S., and Bange, H. W. (2008). Methane emissions from the upwelling area off Mauritania (NW Africa). Biogeosciences 5, 1119–1125. doi: 10.5194/bg-5-1119-2008
Konn, C., Charlou, J.-L., Donval, J.-P., Holm, N., Dehairs, F., and Bouillon, S. (2009). Hydrocarbons and oxidized organic compounds in hydrothermal fluids from rainbow and lost city ultramafic-hosted vents. Chem. Geol. 258, 299–314. doi: 10.1016/j.chemgeo.2008.10.034
Konno, U., Tsunogai, U., Nakagawa, F., Nakaseama, M., Ishibashi, J. I., Nunoura, T., et al. (2006). Liquid CO2 venting on the seafloor: yonaguni knoll IV hydrothermal system, Okinawa Trough. Geophys. Res. Lett. 33:L16607. doi: 10.1029/2006GL026115
Lee, H. J., Jung, K. T., Foreman, M., and Chung, J. Y. (2000). A three-dimensional mixed finite-difference Galerkin function model for the oceanic circulation in the Yellow Sea and the East China Sea. Cont. Shelf Res. 20, 863–895. doi: 10.1016/S0278-4343(00)00005-4
Leifer, I., Clark, J. F., and Chen, R. F. (2000). Modifications of the local environment by natural marine hydrocarbon seeps. Geophys. Res. Lett. 27, 3711–3714. doi: 10.1029/2000GL011619
Li, Q., Cai, F., Liang, J., Shao, H., Dong, G., Wang, F., et al. (2015). Geochemical constraints on the methane seep activity in western slope of the middle Okinawa Trough, the East China Sea. Sci. China: Earth Sci. 58, 986–995. doi: 10.1007/s11430-014-5034-x
Li, W., Wang, Y. H., Wang, J. N., and Wei, H. (2012). Distributions of water masses and hydrographic structures in the yellow sea and east china sea in spring and summer 2011. Oceanol. Limnol. Sin 43, 615–623. (in Chinese with English Abstract)doi:,Google Scholar
Lin, S., Liu, K., Chen, M., Chen, P., and Chang, F. (1992). Distribution of organic carbon in the KEEP area continental margin sediments. Terr. Atmos. Ocean Sci. 3, 365–377. doi: 10.3319/TAO.1992.3.3.365(KEEP)
Liu, K.-K., Peng, T.-H., and Shaw, P.-T. (2003). Circulation and biogeochemical processes in the East China Sea and the vicinity of Taiwan. Deep Sea Res. II Top. Stud. Oceanogr. 50, 1055–1064. doi: 10.1016/S0967-0645(03)00009-2
Mau, S., Römer, M., Torres, M. E., Bussmann, I., Pape, T., Damm, E., et al. (2017). Widespread methane seepage along the continental margin off Svalbard-from Bjørnøya to Kongsfjorden. Sci. Rep. 7:42997. doi: 10.1038/srep42997
McGinnis, D. F., Greinert, J., Artemov, Y., Beaubien, S., and Wüest, A. (2006). Fate of rising methane bubbles in stratified waters: How much methane reaches the atmosphere? J. Geophys. Res. 111:C09007. doi: 10.1029/2005JC003183
Milkov, A. V., and Sassen, R. (2003). Preliminary assessment of resources and economic potential of individual gas hydrate accumulations in the Gulf of Mexico continental slope. Mar. Pet. Geol. 20, 111–128. doi: 10.1016/S0264-8172(03)00024-2
Miyazaki, J., Kawagucci, S., Makabe, A., Takahashi, A., Kitada, K., Torimoto, J., et al. (2017). Deepest and hottest hydrothermal activity in the okinawa trough: the yokosuka site at yaeyama knoll. R. Soc. Open Sci. 4:171570. doi: 10.1098/rsos.171570
Nakamura, H., Nishina, A., Ichikawa, H., Nonaka, M., and Sasaki, H. (2008). Deep countercurrent beneath the kuroshio in the okinawa trough. J. Geophys. Res. 113:C06030. doi: 10.1029/2007JC004574
Nakamura, H., Nishina, A., Liu, Z., Tanaka, F., Wimbush, M., and Park, J. H. (2013). Intermediate and deep water formation in the Okinawa Trough. J. Geophys. Res. 118, 6881–6893. doi: 10.1002/2013JC009326
Patra, P. K., Lal, S., Venkataramani, S., Gauns, M., and Sarma, V. (1998). Seasonal variability in distribution and fluxes of methane in the Arabian Sea. J. Geophys. Res. 103, 1167–1176. doi: 10.1029/97JC02590
Pohlman, J. W., Bauer, J. E., Waite, W. F., Osburn, C. L., Chapman, N. R. (2011). Methane hydrate-bearing seeps as a source of aged dissolved organic carbon to the oceans. Nat. Geosci. 4, 37–41. doi: 10.1038/ngeo1016
Qi, J., Yin, B., Zhang, Q., Yang, D., and Xu, Z. (2014). Analysis of seasonal variation of water masses in East China Sea. Chin. J. Oceanol. Limnol. 32, 958–971. doi: 10.1007/s00343-014-3269-1
Reeburgh, W. S. (2007). Oceanic methane biogeochemistry. Chem. Rev. 107, 486–513. doi: 10.1021/cr050362v
Rehder, G., and Suess, E. (2001). Methane and pCO2 in the Kuroshio and the South China Sea during maximum summer surface temperatures. Mar. Chem. 75, 89–108. doi: 10.1016/S0304-4203(01)00026-3
Rhee, T., Kettle, A., and Andreae, M. (2009). Methane and nitrous oxide emissions from the ocean: A reassessment using basin-wide observations in the Atlantic. J. Geophys. Res. Atmos. 114:D12304. doi: 10.1029/2008JD011662
Sakai, H., Gamo, T., Kim, E., Tsutsumi, M., Tanaka, T., Ishibashi, J., et al. (1990). Venting of carbon dioxide-rich fluid and hydrate formation in mid-Okinawa trough backarc basin. Science 248, 1093–1096. doi: 10.1126/science.248.4959.1093
Schlitzer, R. (2018). Ocean Data View. Available online at: https://odv.awi.de (accessed July 8, 2019).
Schmale, O., Greinert, J., and Rehder, G. (2005). Methane emission from high-intensity marine gas seeps in the Black Sea into the atmosphere. Geophys. Res. Lett. 32:L07609. doi: 10.1029/2004GL021138
Shinjo, R., Chung, S. L., Kato, Y., and Kimura, M. (1999). Geochemical and Sr-Nd isotopic characteristics of volcanic rocks from the Okinawa Trough and Ryukyu Arc: Implications for the evolution of a young, intracontinental back arc basin. J. Geophys. Res.: Solid Earth 104, 10591–10608. doi: 10.1029/1999JB900040
Sibuet, J. C., Letouzey, J., Barbier, F., Charvet, J., Foucher, J. P., Hilde, T. W., et al. (1987). Back arc extension in the Okinawa Trough. J. Geophys. Res.: Solid Earth 92, 14041–14063. doi: 10.1029/JB092iB13p14041
Sibuet, M., and Olu, K. (1998). Biogeography, biodiversity and fluid dependence of deep-sea cold-seep communities at active and passive margins. DSR 45, 517–567. doi: 10.1016/S0967-0645(97)00074-X
Sieburth, J. M. (1987). “Contrary habitats for redox-specific processes: methanogenesis in oxic waters and oxidation in anoxic waters,” in Microbes in the Sea, Ed. M. A. Sleigh (Halsted Press: Chichester) 11–38.
Skarke, A., Ruppel, C., Kodis, M., Brothers, D., and Lobecker, E. (2014). Widespread methane leakage from the seafloor on the northern US Atlantic margin. Nat. Geosci. 7, 657–661. doi: 10.1038/ngeo2232
Solomon, E. A., Kastner, M., MacDonald, I. R., and Lerfer, I. (2009). Considerable methane fluxes to the atmosphere from hydrocarbon seeps in the gulf of Mexico. Nat. Geosci. 2, 561–565. doi: 10.1038/ngeo574
St. Louis, V. L., Kelly, C. A., Duchemin, É, Rudd, J. W., and Rosenberg, D. M. (2000). Reservoir surfaces as sources of greenhouse gases to the atmosphere: a global estimate: reservoirs are sources of greenhouse gases to the atmosphere, and their surface areas have increased to the point where they should be included in global inventories of anthropogenic emissions of greenhouse gases. Bioscience 50, 766–775. doi: 10.1641/0006-3568(2000)050[0766:RSASOG]2.0.CO;2
Sun, M.-S., Zhang, G.-L., Ma, X., Cao, X.-P., Mao, X.-Y., Li, J., et al. (2018). Dissolved methane in the East China Sea: Distribution, seasonal variation and emission. Mar. Chem. 202, 12–26. doi: 10.1016/j.marchem.2018.03.001
Sun, Z., Wei, H., Zhang, X., Shang, L., Yin, X., Sun, Y., et al. (2015). A unique Fe-rich carbonate chimney associated with cold seeps in the Northern Okinawa Trough, East China Sea. Deep Sea Res.I Oceanogr. Res Pap. 95, 37–53. doi: 10.1016/j.dsr.2014.10.005
Sun, Z., Wu, N., Cao, H., Xu, C., Liu, L., Yin, X., et al. (2019). Hydrothermal metal supplies enhance the benthic methane filter in oceans: An example from the Okinawa Trough. Chem. Geol. 525, 190–209. doi: 10.1016/j.chemgeo.2019.07.025
Tang, Y. X., Lee, H. J., Cho, C. H., and Lee, J. H. (1997). The hydrographic conditions in the northeastern East China Sea in summer. J. Oceanogr. Huanghai Bohai Seas 15, 8–19. (in Chinese with English Abstract)
Tilbrook, B. D., and Karl, D. M. (1995). Methane sources, distributions and sinks from California coastal waters to the oligotrophic North Pacific gyre. Mar. Chem. 49, 51–64. doi: 10.1016/0304-4203(94)00058-L
Tseng, H.-C., Chen, C.-T. A., Borges, A. V., DelValls, T. A., and Chang, Y.-C. (2017). Methane in the South China sea and the Western Philippine Sea. Cont. Shelf Res. 135, 23–34. doi: 10.1016/j.csr.2017.01.005
Tsurushima, N., Watanabe, S., and Tsunogai, S. (1996). Methane in the East China sea water. J. Oceanogr. 52, 221–233. doi: 10.1007/BF02235671
Valentine, D. L., Blanton, D. C., Reeburgh, W. S., and Kastner, M. (2001). Water column methane oxidation adjacent to an area of active hydrate dissociation, Eel River Basin. Geochim. Cosmochim. Acta 65, 2633–2640. doi: 10.1016/S0016-7037(01)00625-1
Wang, M., Cai, F., Li, Q., Liang, J., Yan, G., Dong, G., et al. (2015). Characteristics of authigenic pyrite and its sulfur isotopes influenced by methane seep at Core A, Site 79 of the middle Okinawa Trough. Sci. China Earth Sci. 58, 2145–2153. doi: 10.1007/s11430-015-5196-1
Wanninkhof, R. (1992). Relationship between wind speed and gas exchange over the ocean. J. Geophys. Res. Oceans 97, 7373–7382. doi: 10.1029/92JC00188
Wanninkhof, R. (2014). Relationship between wind speed and gas exchange over the ocean revisited. Limnol. Oceanogr. Methods 12, 351–362. doi: 10.4319/lom.2014.12.351
Watanabe, S., Higashitani, N., Tsurushima, N., and Tsunogai, S. (1995). Methane in the western North Pacific. J. Oceanogr. 51, 39–60. doi: 10.1007/BF02235935
Wiesenburg, D. A., and Guinasso, N. L. Jr. (1979). Equilibrium solubilities of methane, carbon monoxide, and hydrogen in water and sea water. J. Chem. Eng. Data 24, 356–360. doi: 10.1021/je60083a006
Xiwu, L., Wang, K., Hyndman, R., and Willoughby, E. (2008). Bottom simulating reflector and gas seepage in okinawa trough: evidence of gas hydrate in an active back-arc basin. J. China University of Geosci. 19, 152–161. doi: 10.1016/S1002-0705(08)60034-5
Xu, C., Wu, N., Sun, Z., Zhang, X., Geng, W., Cao, H., et al. (2018). Methane seepage inferred from pore water geochemistry in shallow sediments in the western slope of the Mid-Okinawa Trough. Mar. Pet. Geol. 98, 306–315. doi: 10.1016/j.marpetgeo.2018.08.021
Ye, W., Zhang, G., Zhu, Z., Huang, D., Han, Y., Wang, L., et al. (2016). Methane distribution and sea-to-air flux in the East China Sea during the summer of 2013: impact of hypoxia. DSR 124, 74–83. doi: 10.1016/j.dsr2.2015.01.008
Yin, P., Berné, S., Vagner, P., Loubrieu, B., and Liu, Z. (2003). Mud volcanoes at the shelf margin of the East China Sea. Mar. Geol. 194, 135–149. doi: 10.1016/S0025-3227(02)00678-3
Yu, H., Liu, Z., Berné, S., Jia, G., Xiong, Y., Dickens, G. R., et al. (2009). Variations in temperature and salinity of the surface water above the middle Okinawa Trough during the past 37 kyr. Palaeogeogr. Palaeoclimatol. Palaeoecol. 281, 154–164. doi: 10.1016/j.palaeo.2009.08.002
Yvon-Lewis, S. A., Hu, L., and Kessler, J. (2011). Methane flux to the atmosphere from the Deepwater Horizon oil disaster. Geophys. Res. Lett. 38:L01602. doi: 10.1029/2010GL045928
Zachos, J. C., Roehl, U., Schellenberg, S. A., Sluijs, A., Hodell, D. A., Kelly, D. C., et al. (2004). Rapid acidification of the ocean during the paleocene-eocene thermal maximum. Sci 308, 1611–1615. doi: 10.1126/science.1109004
Zhang, G., Zhang, J., Kang, Y., and Liu, S. (2004). Distributions and fluxes of methane in the East China Sea and the Yellow Sea in spring. J. Geophys. Res. 109:C07011. doi: 10.1029/2004JC002268
Zhang, G., Zhang, J., Ren, J., Li, J., and Liu, S. (2008). Distributions and sea-to-air fluxes of methane and nitrous oxide in the North East China Sea in summer. Mar. Chem. 110, 42–55. doi: 10.1016/j.marchem.2008.02.005
Zhang, J., Liu, S., Ren, J., Wu, Y., and Zhang, G. (2007). Nutrient gradients from the eutrophic Changjiang (Yangtze River) Estuary to the oligotrophic Kuroshio waters and re-evaluation of budgets for the East China Sea Shelf. Prog. Oceanogr. 74, 449–478. doi: 10.1016/j.pocean.2007.04.019
Keywords: methane, distribution, discharge, middle Okinawa trough, cold seepage
Citation: Zhang X, Sun Z, Wang L, Zhang X, Zhai B, Xu C, Geng W, Cao H, Yin X and Wu N (2020) Distribution and Discharge of Dissolved Methane in the Middle Okinawa Trough, East China Sea. Front. Earth Sci. 8:333. doi: 10.3389/feart.2020.00333
Received: 16 April 2020; Accepted: 17 July 2020;
Published: 22 September 2020.
Edited by:
Natascha Riedinger, Oklahoma State University, United StatesReviewed by:
Jiwei Li, Institute of Deep-Sea Science and Engineering (CAS), ChinaFrancois L. L. Muller, National Sun Yat-sen University, Taiwan
Copyright © 2020 Zhang, Sun, Wang, Zhang, Zhai, Xu, Geng, Cao, Yin and Wu. This is an open-access article distributed under the terms of the Creative Commons Attribution License (CC BY). The use, distribution or reproduction in other forums is permitted, provided the original author(s) and the copyright owner(s) are credited and that the original publication in this journal is cited, in accordance with accepted academic practice. No use, distribution or reproduction is permitted which does not comply with these terms.
*Correspondence: Zhilei Sun, emhpbGVpc3VuQHllYWgubmV0; Nengyou Wu, d3VueUBtcy5naWVjLmFjLmNu