 Letizia Giuliani1*
 Gianluca Iezzi1,2
 Tyler Hippeli3
 Mark Davis3Aubrey Elbrecht3
 Francesco Vetere4,5
 Manuela Nazzari2
 Silvio Mollo2,6
- 1Dipartimento di Ingegneria e Geologia, Universitá degli Studi di Chieti-Pescara, Chieti, Italy
- 2Istituto Nazionale di Geofisica e Vulcanologia, Rome, Italy
- 3SCHOTT North America, Duryea, PA, United States
- 4Dipartimento di Fisica e Geologia, Universitá degli studi di Perugia, Perugia, Italy
- 5Institute of Mineralogy, Leibniz Universität Hannover, Hanover, Germany
- 6Dipartimento di Scienze della Terra, Sapienza Universitá di Roma, Rome, Italy
The in situ differential scanning calorimetry (DSC) technique has been applied to investigate the solidification paths of a basaltic liquid. The starting glass was heated up to 1300°C, kept at this superliquidus temperature for 2 h and cooled at rates (ΔT/Δt) of 7, 60, 180, 1000, and 1800°C/h, down to 800 and 600°C. Glass transition temperature (Tg), crystallization temperature (Tx_HR) and melting temperature (Tm) were measured by in situ DSC spectra on heating. Tx measured along the cooling paths (Tx_CR) shows exothermic peaks that change from a single symmetric shape (7 and 60°C/h) to multi-component patterns (180, 1000, and 1800°C/h). The recovered products characterized by field emission gun source of the scanning electron microscopy and electron probe micro-analyzer-wavelength dispersive spectrometers show a phase assemblage of spinel (sp), clinopyroxene (cpx), melilite (mel), plagioclase (plg), and glass. Moreover, crystal size distributions (CSDs) and growth rates (Gmax and GCSD) were also determined. The crystal content slightly increases from 7 to 1800°C/h. Faceted sp are present in all the run products with an amount always <2 area%. Cpx increases from 7 to 1800°C/h, changing its texture from almost faceted to dendritic between 60 and 180°C/h. The area% of mel follows an asymmetric Gaussian trend, while plg nucleates only at 7°C/h with a content <2 area%. The coupling of DSC and SEM outcomes indicate that sp nucleate first, followed by cpx and mel (and/or plg). The increment of ΔT/Δt causes an increase of the CSD slope (m) and crystal population density per size (n0), as well as a decrease of the crystal size, for both cpx and sp. The log-linear CSD segments with different slopes at 7 and 60°C/h suggest multiple nucleation events and crystal growth by coarsening. Gmax and GCSD for cpx and sp directly measured on the actual crystallization time by DSC spectra, both increase with the increasing of ΔT/Δt. The onset temperature of crystallization (Txi) decreases as ΔT/Δt increases, following an exponential trend that defines the uppermost portion of a time-transformation-temperature-like curve. This analytical model allows us to quantitatively model the kinetic crystallization paths of dry basalts.
Introduction
Basalts are the most erupted and voluminous products on the Earth surface and their solidification behavior has been the most reproduced process by ex situ laboratory experiments. These latter are generally performed starting from liquidus or sub-liquidus conditions, and quenching the basaltic charges at relative low temperature (T) and/or pressure (P), after different cooling rates (ΔT/Δt) (Cashman, 1993; Lasaga, 1998; Hammer, 2008; Iezzi et al., 2009; Del Gaudio et al., 2010; Vetere et al., 2013, 2015; Mollo and Hammer, 2017) and/or decompression rates (ΔP/Δt) (Hammer, 2008; Applegarth et al., 2013; Fiege et al., 2015; Mollo and Hammer, 2017; Arzilli et al., 2019). Textural and chemical quantifications of the experimental products make it possible to reconstruct the solidification path of a basaltic system. An alternative ex situ approach for investigating nucleation and crystal growth consists of measuring T in basaltic lava flows, sampling the molten portions, and rapidly quenching them in water (Armienti et al., 1994; Burkhard, 2001, 2002, 2003, 2005).
On the other hand, in situ investigations are conducted by different approaches, such as: (1) the direct observation with optical microscopy of crystal nucleation and growth (Sunagawa, 1992; Schiavi et al., 2009; Ni et al., 2014), (2) the use of X-ray and neutron scattering measurements or high-resolution X-ray micro-computed tomography (Baker et al., 2013; Arzilli et al., 2015; Zanatta et al., 2017; Polacci et al., 2018; Tripoli et al., 2019), (3) the measurement of viscosity changes during cooling-induced crystallization of basaltic liquids (Vona et al., 2011; Kolzenburg et al., 2016, 2018a,b, 2020; Tripoli et al., 2019), (4) the measurement of electrical conductivity by impedance spectrometry (Xu et al., 2000; Scarlato et al., 2004; Maumus et al., 2005), and (5) the use of differential scanning calorimetry (DSC) and/or differential thermal analysis (DTA). However, the latter methods are more frequently employed in the field of materials science (Dingwell and Webb, 1990; Shelby, 2005; Zheng et al., 2019) rather than in Earth sciences. Particularly, DSC techniques are the most useful and fastest facility to investigate real-time processes occurring during solidification processes (Lange et al., 1994; Burkhard, 2001; Ray et al., 2005, 2010; Castro et al., 2008; Applegarth et al., 2013; Iezzi et al., 2017; Kolzenburg et al., 2020). DSC allows direct measurements of the heat flux released during an exothermic process (e.g., crystallization), and of the heat flux adsorbed during the endothermic ones (e.g., glass transition and melting). As a result, the DSC spectra (T vs μV/mg) resulting from calorimetric solidification experiments show troughs when the glass transitions (Tg) and melting (Tm) occur, and peaks when crystal nucleation and growth start (Tx). However, despite its effectiveness, in situ DSC techniques have rarely been used to investigate melting and crystallization processes in basaltic materials (Onorato et al., 1980; Lange et al., 1994; Burkhard, 2001; Ray et al., 2005, 2010; Castro et al., 2008; Applegarth et al., 2013; Iezzi et al., 2017), mainly upon heating (glasses) and to a lesser extent on cooling (melts).
Previous in situ investigations conducted on chemically complex (natural) silicate melts (Schiavi et al., 2009; Ni et al., 2014; Kolzenburg et al., 2018a, b) simulated only limited cooling rate (ΔT/Δt) conditions and/or restricted thermal ranges of cooling (ΔTc). However, natural basaltic liquids solidify under highly variable ΔT/Δt from liquidus or sub-liquidus regions down to solidus temperatures which are still poorly explored (cf. Giuliani et al., 2020a, b) and are important to correctly interpret the thermal interval of crystallization (ΔTc).
Most of the early experiments on the onset of melt crystallization as a function of cooling rate were not analyzed with scanning electron microscopy (SEM) and/or electron microprobe (EPMA) (Klein et al., 1975; Uhlmann et al., 1975, 1981, 1979; Onorato and Uhlmann, 1976; Onorato et al., 1980), thus preventing quantitative textural and chemical determinations. The only available time-temperature-transformation (TTT) and continuous cooling (CCT) diagrams for basaltic liquids still refer to these pioneering works (Uhlmann et al., 1981; Weinberg and Zanotto, 1989), albeit more recent data have been also reported in literature (Ray et al., 2005; Vetere et al., 2013; Rogez et al., 2017).
In this study, we have combined in situ DSC investigations (on heating and especially on cooling) with ex situ textural analysis conducted on a basaltic melt cooled from liquidus to solidus conditions using a broad range of rates of 7, 60, 180, 1000, and 1800°C/h. The SEM analysis on the obtained run products allows the quantification of crystal content (area%), crystals per area (#/A), crystal size distributions (CSDs), and the growth rates of clinopyroxene (cpx) and spinel (sp). The chemical composition of phases was obtained by EPMA-WDS. The in situ measurement of the thermal crystallization onset (Txi) leads to analytically model the crystallization paths of basalts, at thermal conditions comparable to those observed for naturally cooling magmas (Vetere et al., 2013, 2015; Giuliani et al., 2020b).
Differential Scanning Calorimetry
Differential scanning calorimetry is the most common method to investigate the kinetics of solidification, particularly referred to the glass stability (GS) and glass-forming ability (GFA) behaviors (Zheng et al., 2019). Although this, DSC is not so used in Earth Sciences, except few investigations (Onorato et al., 1980; Dingwell and Webb, 1990; Burkhard, 2001; Ray et al., 2005, 2010; Castro et al., 2008; Applegarth et al., 2013; Iezzi et al., 2017; Kolzenburg et al., 2020).
DSC technique allows to quantitatively determine in situ the thermodynamic changes occurring during the transformation of a liquid into a solid (cooling) and vice versa (heating). These changes are recorded in terms of differential heat flux, measured as DSC/(μV/mg), between the analyzed sample and a reference standard (Shelby, 2005). In a typical DSC spectrum, the recorded DSC/(μV/mg) is related to T (°C), as shown in Figures 1, 2A and Supplementary Figure S1. The endothermic and exothermic peaks result respectively from the heat absorption and release accompanying phase transformations. When the sample reaches the melting point, the recorded heat flux is lower than that of the standard, resulting in the appearance of an endothermic peak that corresponds to the melting temperature (Tm). A similar peak occurs when the sample passes through the glass transition region (Tg). Contrarily, during the crystallization of the sample, the heat flux from the sample is higher than that from the standard, causing the appearance of an exothermic peak on the DSC spectrum at the crystallization temperature (Tx).

Figure 1. DSC spectra for the basaltic melt, relating the DSC signal based on the differential heat flux (DSC/(μV/mg)) and T (°C). On the left: heating treatment from ambient temperature to 1300°C at 420°C/h. On the right and from top to bottom: cooling rate paths at 7, 60, 180, 1000, and 1800°C/h, respectively. Glass transition temperature (Tg), crystallization temperature (Tx_HR) and melting temperature (Tm) were measured by in situ DSC spectra acquired on heating. Tx was also measured along the cooling path of the melt (Tx_CR). The temperature of the onset of crystallization (Txi) has been computed at 10% of the maximum intensity of the crystallization peaks.
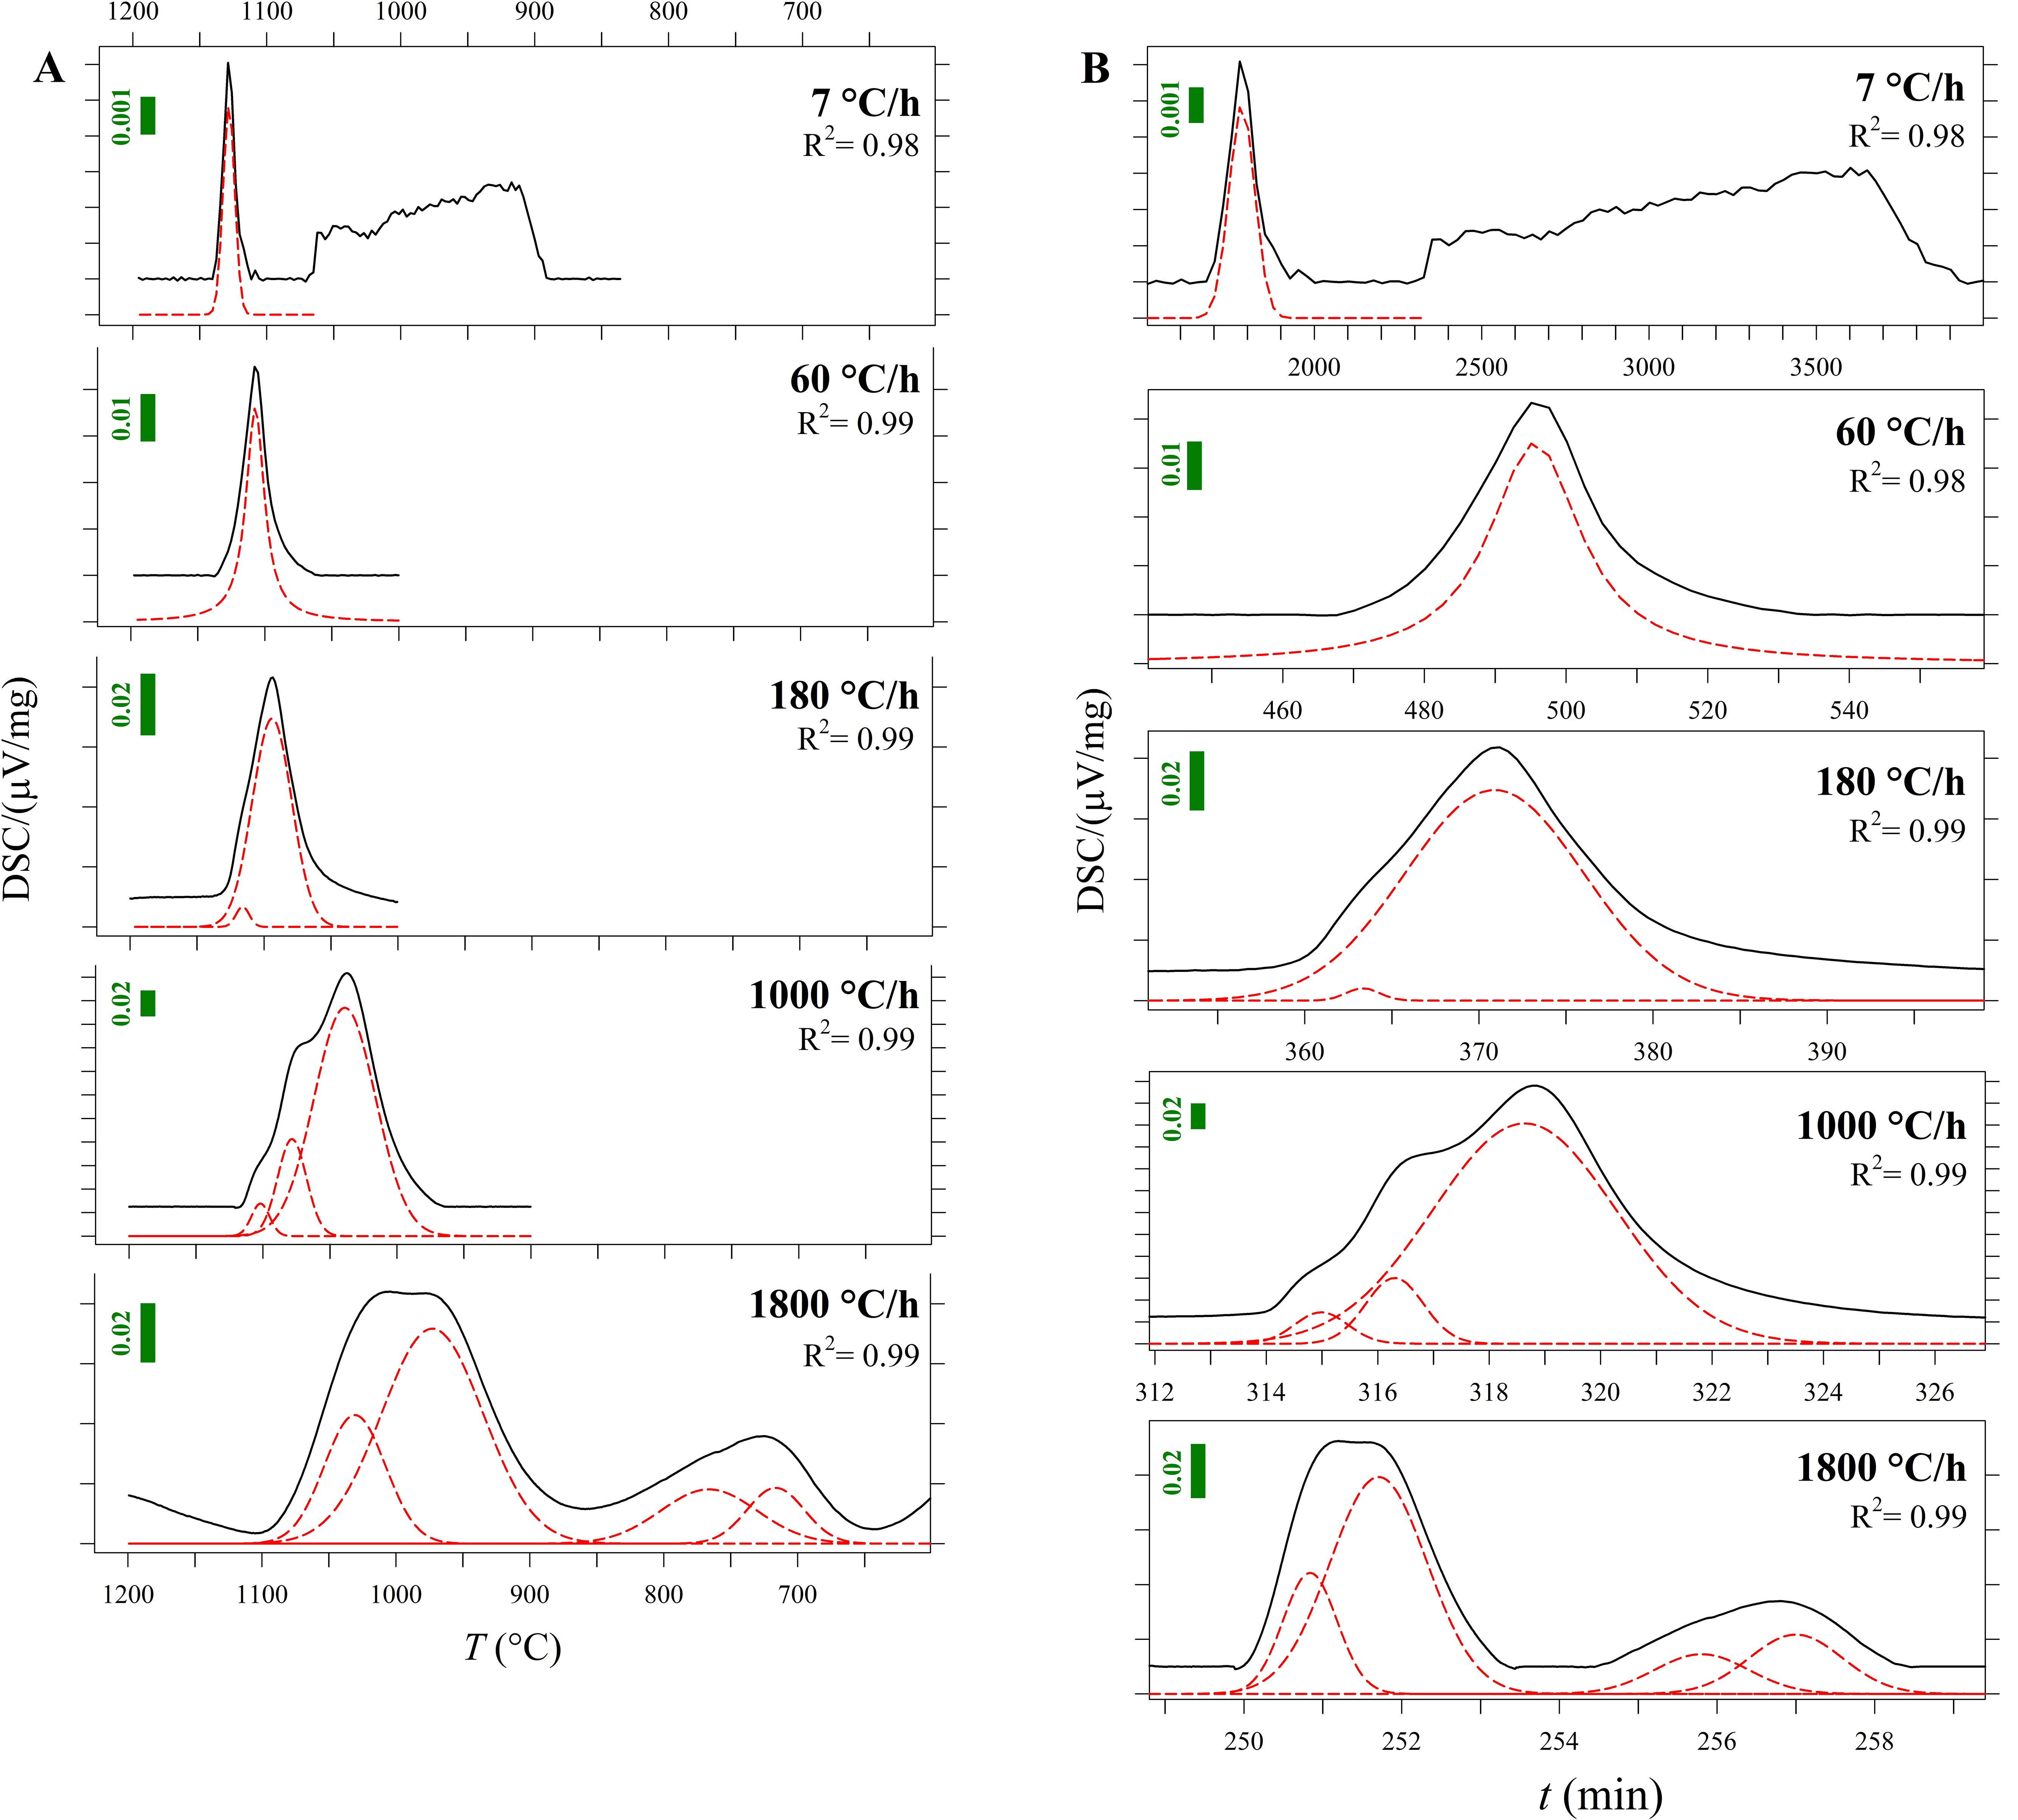
Figure 2. (A) Zoom-in of DSC curves as a function of temperature (T) from Figure 1 and Supplementary Figures S1A–E (blue lines). The fitted components of these peaks are plotted in red and listed in Table 3. Vertical bars show the Y-axis scale. (B) DSC curves as a function of time (t). The fitted components of these peaks are plotted in red and listed in Table 3. Vertical bars show the Y-axis scale.
In this work, Tm and Tg have been identified during the heating processes, while Tx has been measured both on heating (Tx_HR) and along the cooling path (Tx_CR).
Experiments and Starting Material
A tholeiitic basalt from Iceland (B100) was used to produce a homogeneous starting glass, following the procedure described in Vetere et al. (2013, 2015). This natural rock is an USGS-international standard known as BIR-1a, which starting composition (wt.%) is: SiO2 = 48.0; TiO2 = 1.0; Al2O3 = 15.6; FeO = 10.2; MnO = 0.2; MgO = 9.4; CaO = 13.2; Na2O = 1.8; K2O = 0.0; P2O5 = 0.1; H2O = 0.005.
The B100 starting glass was powdered and melted twice at 1600°C for 4 h (ambient P and fO2 of air) and, then, rapidly quenched on a metal plate. For each experiment, several mm-sized B100 glass beads were inserted in cylindrical Pt-crucible with a diameter of 6 mm and a length of 4.3 mm. The Pt-charge was lodged in a DSC (Netzsch STA 449F1) installed at the laboratory of SCHOTT Research & Development – North America in Duryea (Pennsylvania, United States) and heated at a rate of 420°C/h from room temperature to the superliquidus conditions of 1300°C (ambient P and fO2 of air; see Table 1). The Pt-charges were kept at 1300°C for 2 h and then cooled at rates of 7, 60, 180, 1000, and 1800°C/h down to 800 and 600°C (Table 1). The solidification path (heating rate, dwell time, and ΔTc) used in this study are comparable with those adopted by Vetere et al. (2013, 2015), that applied cooling rates of 1, 7, 60, 180, 1800 and 9000°C/h. The DSC spectra were fitted with a linear background, while the exothermic and endothermic peaks are reproduced using pseudo-Voigt components, such to reproduce the observed spectra and to minimize the difference between measured and calculated DSC patterns.

Table 1. Thermal paths used for in situ DSC experiments and BS-SEM microphotographs used for image analysis.
The recovered run products were mounted in epoxy resin and polished to expose a flat surface. Photomicrographs were collected in the back-scattered electron (BSE) mode, using a field emission gun source of the scanning electron microscopy (FEG-SEM) Jeol 6500F (JEOL, Ltd., Tokyo, Japan). The chemical attributes of phases were determined by an electron probe micro-analyzer (EPMA) Jeol JXA-8200 equipped with five wavelength dispersive spectrometers (WDS). Analyses were performed under vacuum using an electron beam of 5 μm, an accelerating voltage of 15 kV, and an electric current of 7.5 nA. The following standards were adopted: Albite (Na, Si, and Al), Forsterite (Mg), Orthoclase (K), Augite (Fe), Rutile (Ti), Apatite (Ca and P) and Chromite (Cr). Sodium and potassium were analyzed first, to limit their possible migration. Both FEG-SEM and EPMA are installed at the HPHT Laboratory of Experimental Volcanology and Geophysics of the Instituto Nazionale di Geofisica e Vulcanologia (INGV) in Rome, Italy.
The textural features of the run products have been quantified by image analysis on several BSE-SEM micro-photos with magnifications from 100 to 5000× (Table 1). The image analysis processing is reported in detail in several previous studies (Lanzafame et al., 2013, 2017; Vetere et al., 2013, 2015; Giuliani et al., 2020b); the quantitative textural data are available in the supplementary excel-spreadsheet. The type, size, and distribution of each crystalline phase were measured, plus the CSD analysis. Crystal size distribution curves were calculated using the CSDcorrections software (Higgins, 2006; Giuliani et al., 2020b).
Results
DSC Spectra
Differential scanning calorimetry spectra of all the experimental charges are displayed in Figure 1; more details and relative thermal paths are reported in Supplementary Figures S1A–E. At the heating rate of 420°C/h it is found (i) a first endothermic peak corresponding to Tg, (ii) two exothermic peaks corresponding to Tx_HR, and (iii) a further intense endothermic peak related to the attainment of Tm. Tg occurs between 693 and 700°C, averaging 698 ± 3°C [i.e., 42°C above the value of 651°C computed by Vetere et al. (2015); Table 2]. The first and second peaks of Tx_HR are centered between 903 and 925°C (average of 911 ± 9°C) and between 1099 and 1116°C (average of 1104 ± 7°C), respectively (Table 2 and Figure 1). The peaks of Tm vary slightly between 1204 and 1207°C, averaging 1205 ± 1°C [i.e., 20–25°C and just below the value of 1233°C computed by Vetere et al. (2015); Table 2 and Figure 1].
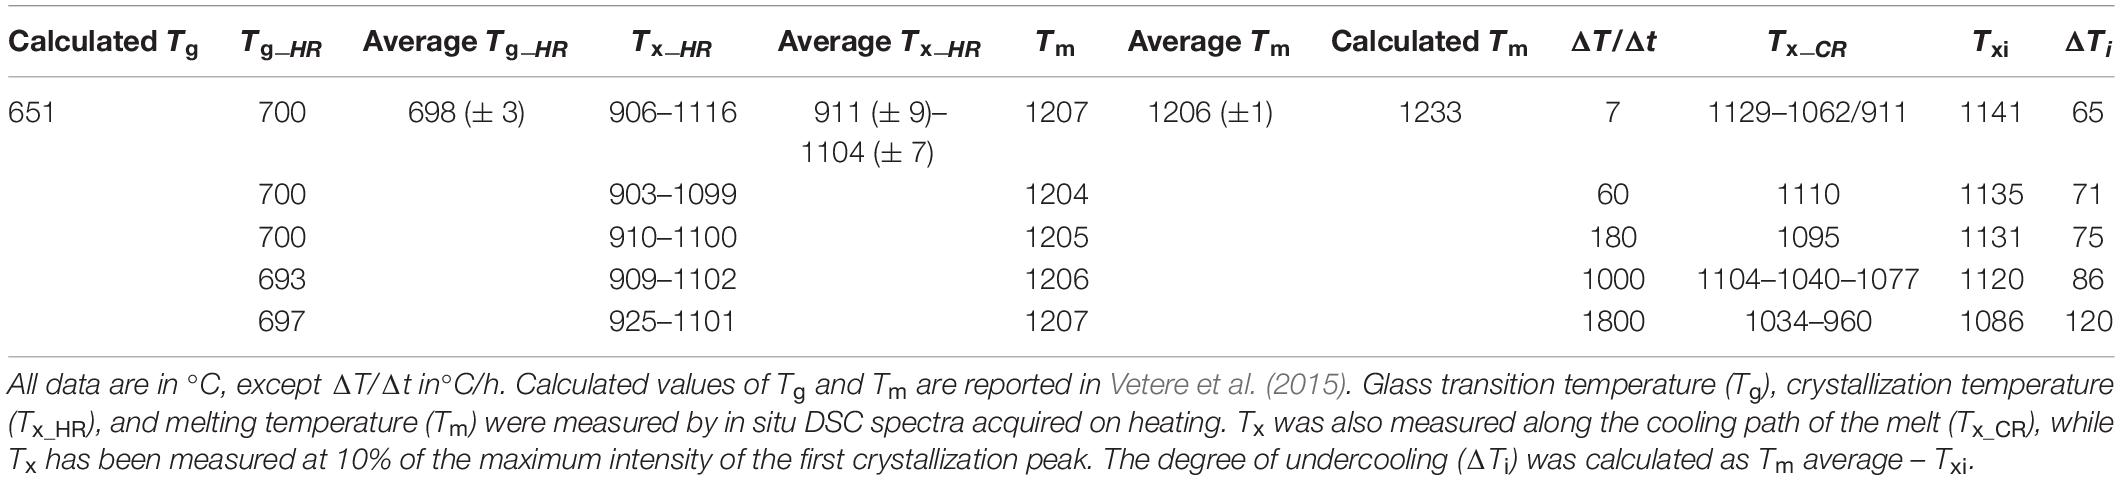
Table 2. Tg_HR, Tx_HR, Tm, Tx_CR, Txi, and ΔTi determined by DSC experiments.
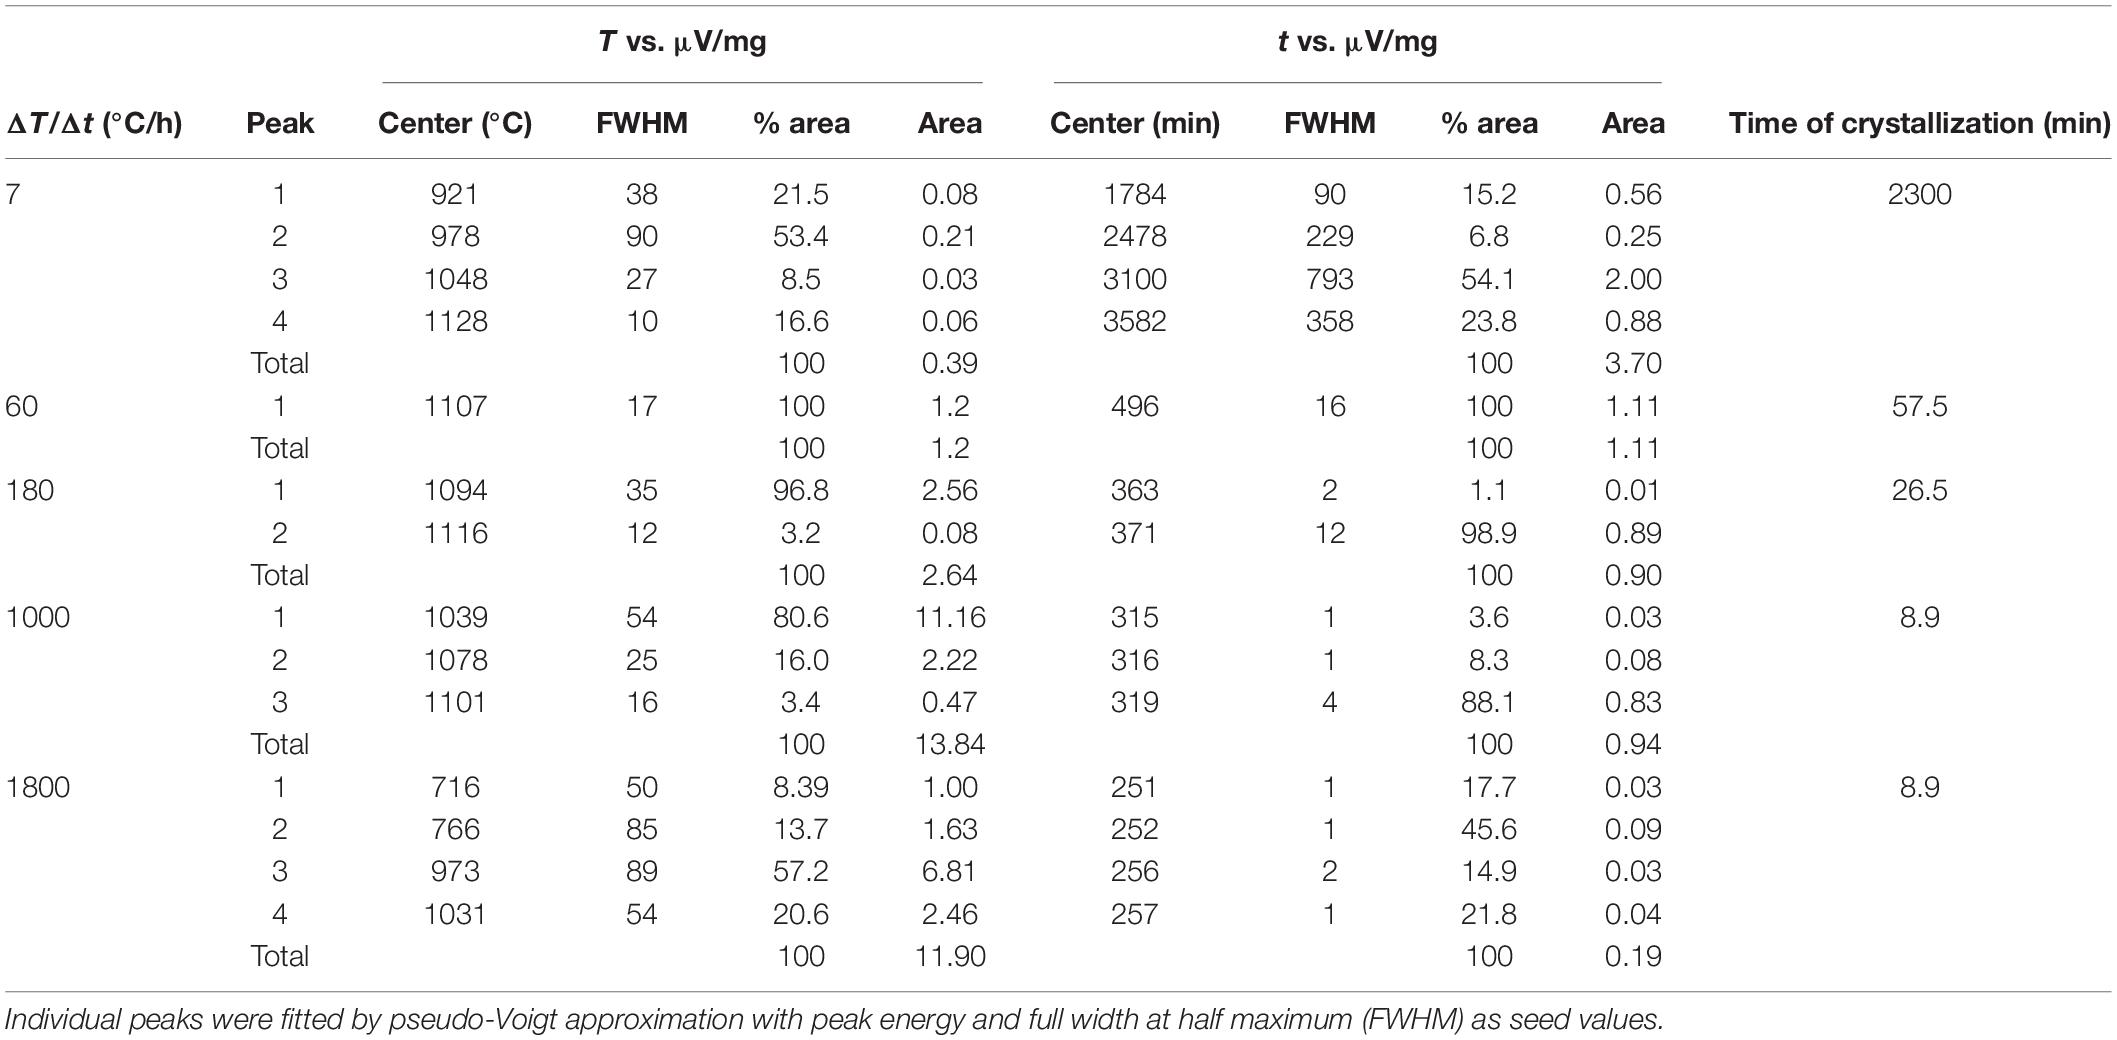
Table 3. Data from DSC spectra and calculated crystallization time.
At superliquidus conditions, there are no thermal peaks because the melt is fully relaxed (Supplementary Figures S1A–E), whilst one or more exothermic peaks occur at different temperatures as a function of the cooling paths (Figure 1 and Supplementary Figures S1A–E). At ΔT/Δt of 7°C/h, the DSC spectrum shows a first exothermic peak centered at 1129°C, followed by broadband composed of several exothermic peaks between 1062 and 911°C (Figure 1). At ΔT/Δt of 60°C/h, a unique asymmetric exothermic peak occurs at 1110°C (Figure 1). At ΔT/Δt of 180°C, a slightly asymmetric peak is centered at ca. 1095°C (Figure 1), whilst at 1000 and 1800°C/h the corresponding exothermic peaks are broad and composed of several components, which maximum values are in the thermal ranges of 1104–1040°C and 1034–960°C, respectively (Figure 1).
To accurately quantify the onset temperature of nucleation under the effect of cooling rate, the first peaks were fitted, as displayed in Figure 2A. DSC patterns as a function of time are reported in Figure 2B. On cooling, The high-T peaks occurring at ΔT/Δt of 7 and 60°C can be fitted with a single symmetric component, whereas those at ΔT/Δt of 180, 1000 and 1800°C/h are fitted with two, three and four components, respectively (Figure 2A); Table 2 lists these temperatures. The temperature of the onset of crystallization (Txi) has been determined by considering the temperature value at 10% of the maximum intensity of the first peak on cooling and related to crystallization. Txi progressively shifts toward lower values as ΔT/Δt increases (Figure 1 and Table 2). In particular, increasing the ΔT/Δt from 7 to 1800°C/h, decreases the value of Txi from 1141 to 1086°C, as reported in Table 2. The difference between averaged Tm and Txi corresponds to the degree of undercooling (ΔTi), listed in Table 2. Table 3 lists the quantitative attributes of all the fitted components from the DSC spectra.
Texture and Crystal-Chemistry
Figure 3 displays the textural features of the solidified DSC charges. These products contain crystals of spinel (sp), clinopyroxene (cpx), melilite (mel) and/or plagioclase (only at 7°C/h), and glass. Sp crystals display always equant and faceted, hopper shapes. Conversely, cpx at ΔT/Δt of 7°C/h are almost faceted and prismatic, frequently attaching on sp or pre-existing cpx crystals (Figure 3), while cpx obtained at ΔT/Δt ≥ 60°C/h show dendritic forms with fern-like elongated shapes. Mel crystallizes with either elongated H-shapes or razor blade-like aspects (Figure 3).
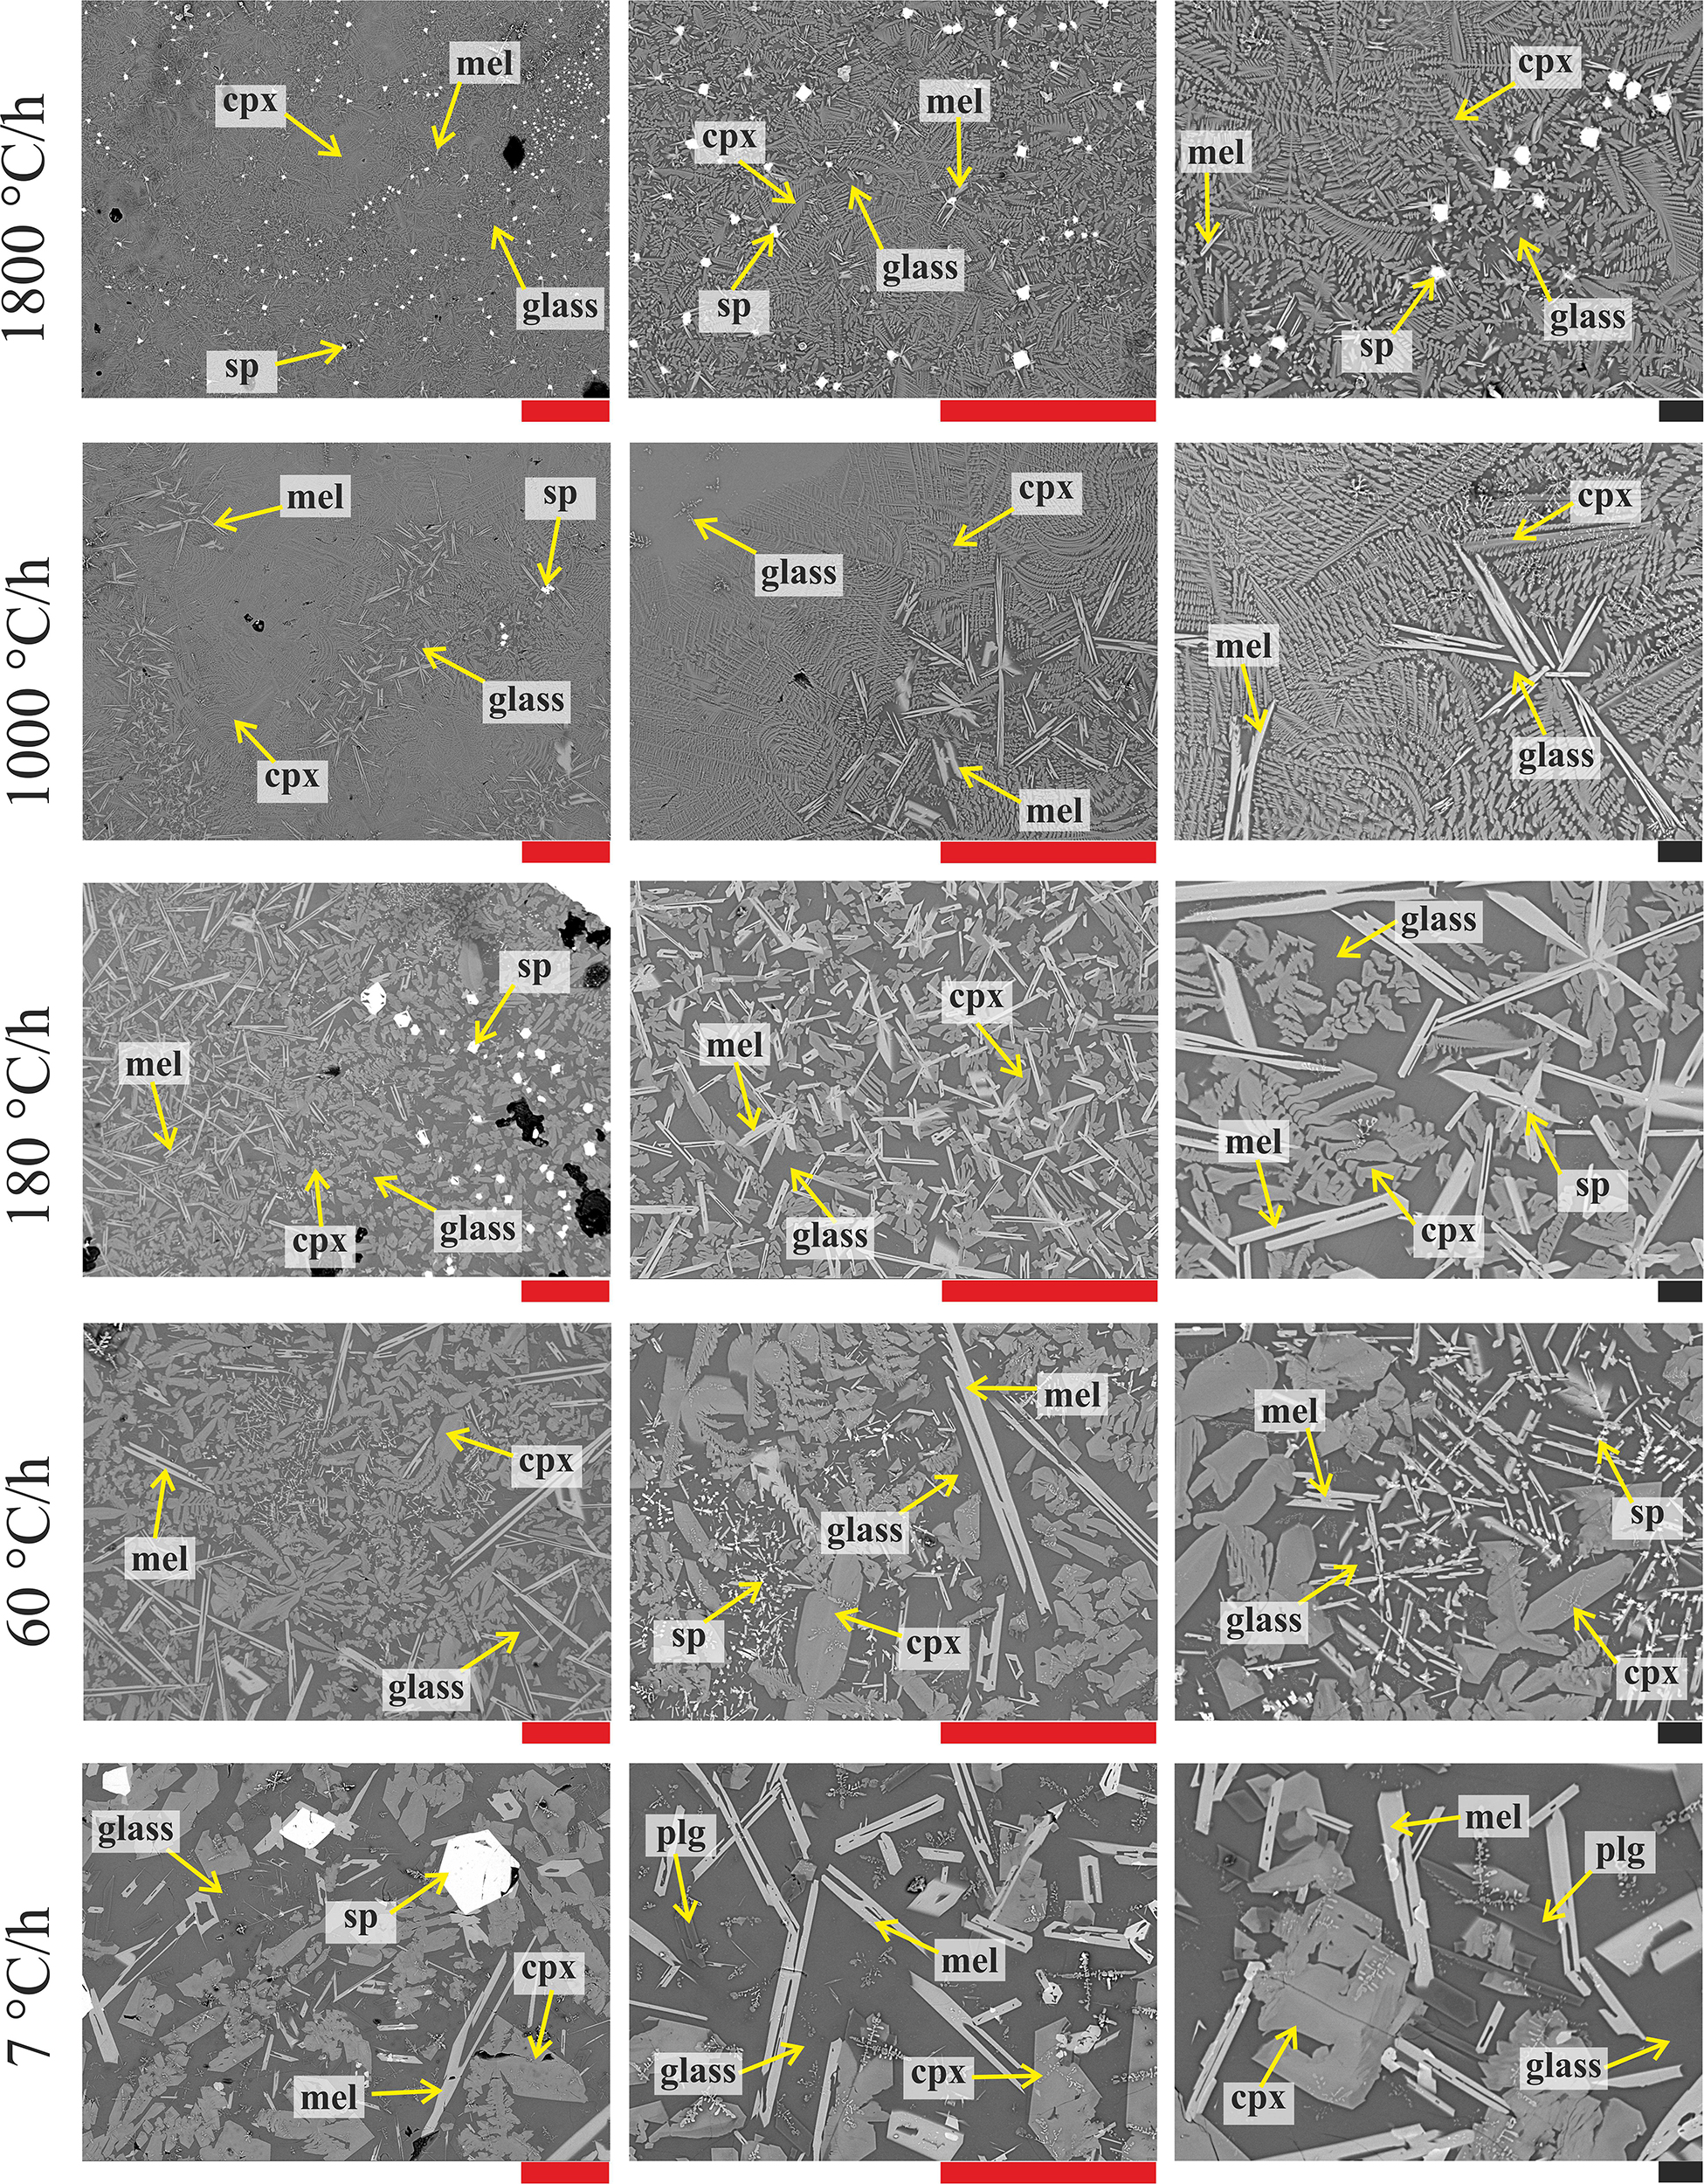
Figure 3. BS-SEM microphotographs of the DSC run products obtained at cooling rates of 7, 60, 180, 1000, and 1800°C/h (from bottom to top) and magnifications of 200, 500, and 1000X (from left to right). Red and black bars correspond to 100 and 10 μm, respectively.
Figure 4 and Table 4 report the quantitative abundance of phases. The amount of sp comprises a very low area% of between 0.1 and 1.9, while that of cpx increases from 32.1 to 47.3 area% as ΔT/Δt increases from 7 to 1800°C/h. The abundance of mel is also limited and changes from 5.3 to 8.9 and finally to 1.9 area%, following a broad and asymmetric Gaussian-like trend. Plg occurs only at ΔT/Δt of 7°C/h with an amount of 1.7 area%. Overall the whole glass content monotonically decreases with increasing ΔT/Δt (Table 4), reflecting the slight increase of the total crystal content (Figure 4 and Table 4).
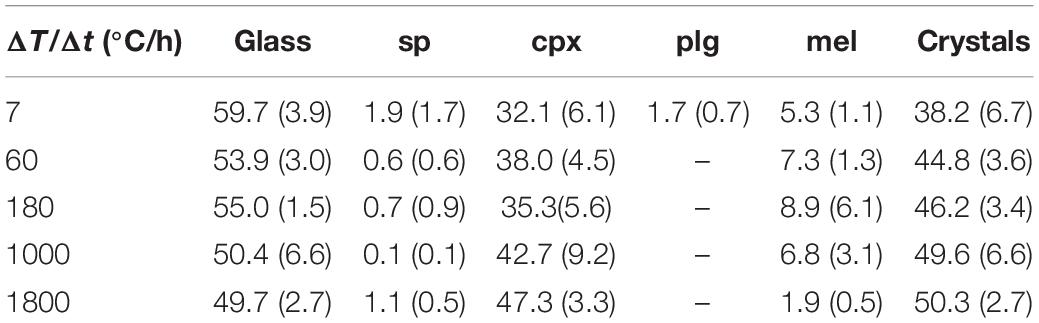
Table 4. Phase proportions (area%); standard deviations in parenthesis.
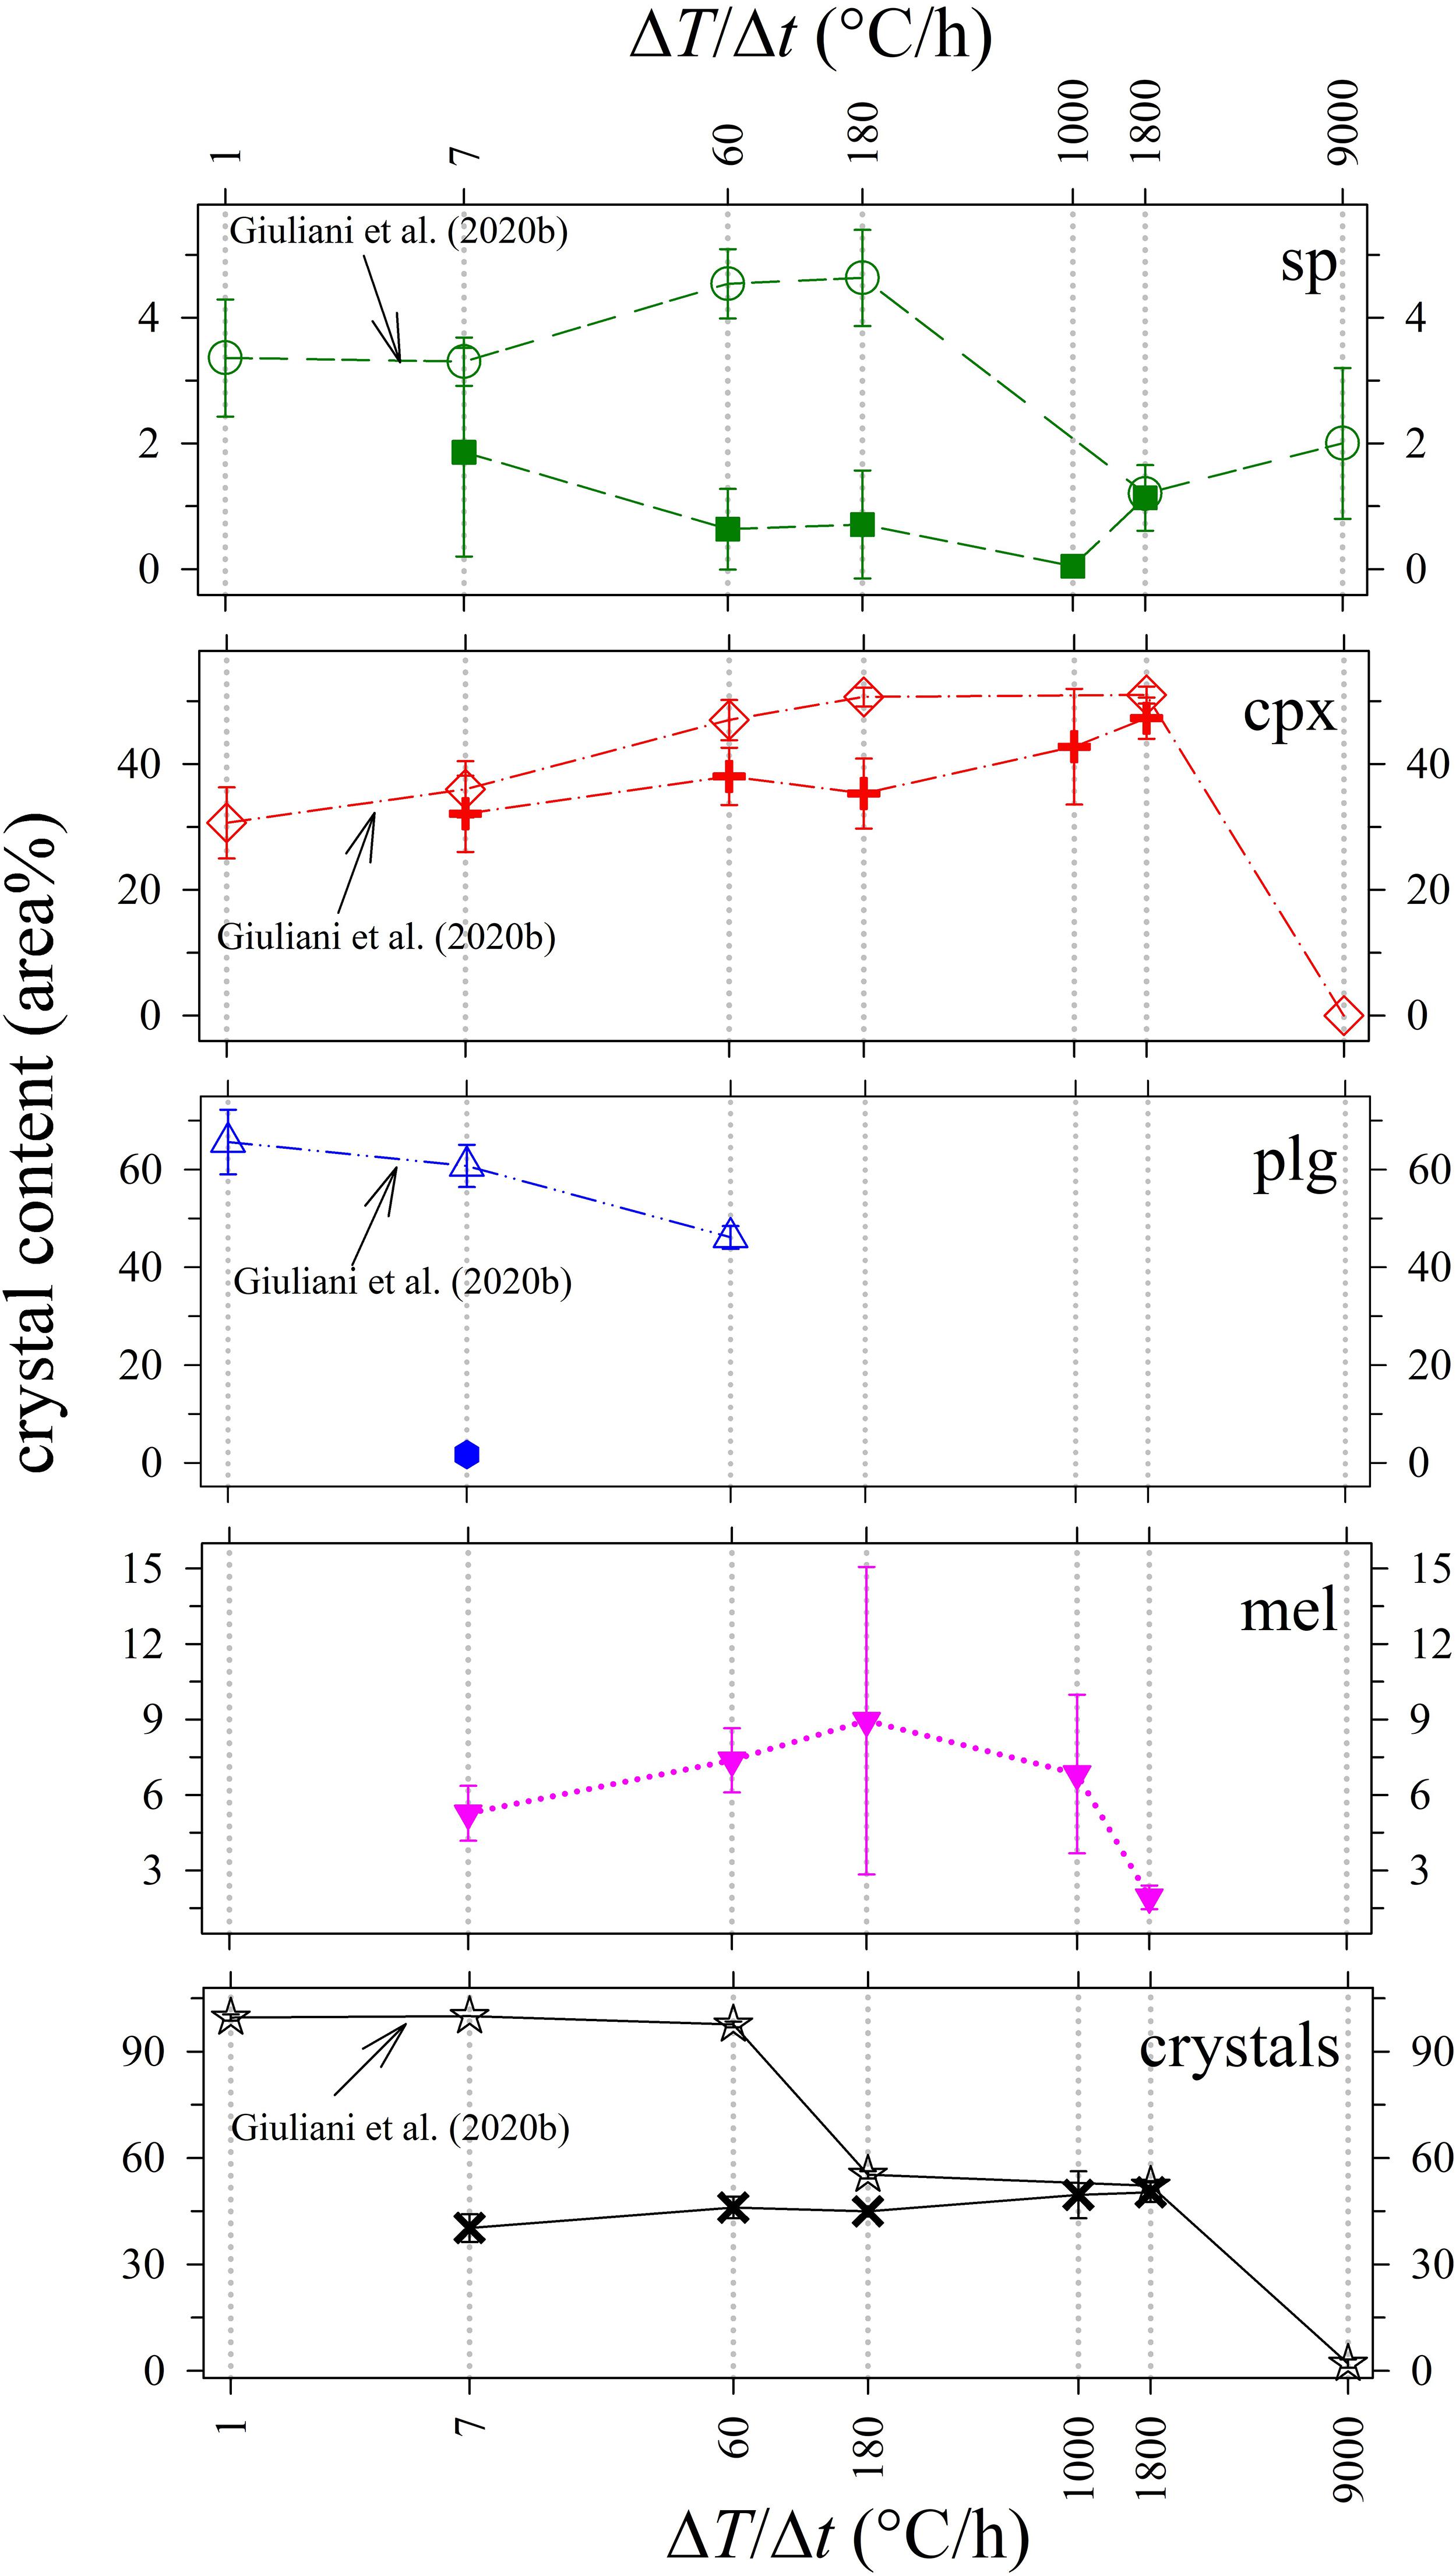
Figure 4. Crystal content (area%) vs ΔT/Δt (°C/h) of in situ DSC experiments compared with ex situ cooling rate experiments from Giuliani et al. (2020b).
The analyses of chemical attributes of phases are reported in Figure 5 and Supplementary Table S1. As the ΔT/Δt increases, all the major oxides of cpx, mel, and glass approach those of the starting composition. In particular, cpx records an increase in SiO2, Al2O3, and Na2O contents, and a decrease in MgO and CaO, while FeO remains almost constant. Intra-crystalline glass follows the opposite trends of cpx, whereas those of sp are limited (Figure 5). The relatively highest (>10 wt.%) chemical variations are recorded for mel: indeed, as the ΔT/Δt augments, SiO2 increases, and both FeO + MgO decrease, whilst Na2O + CaO are almost constant; Al2O3 follows an irregular decreasing trend (Figure 5).
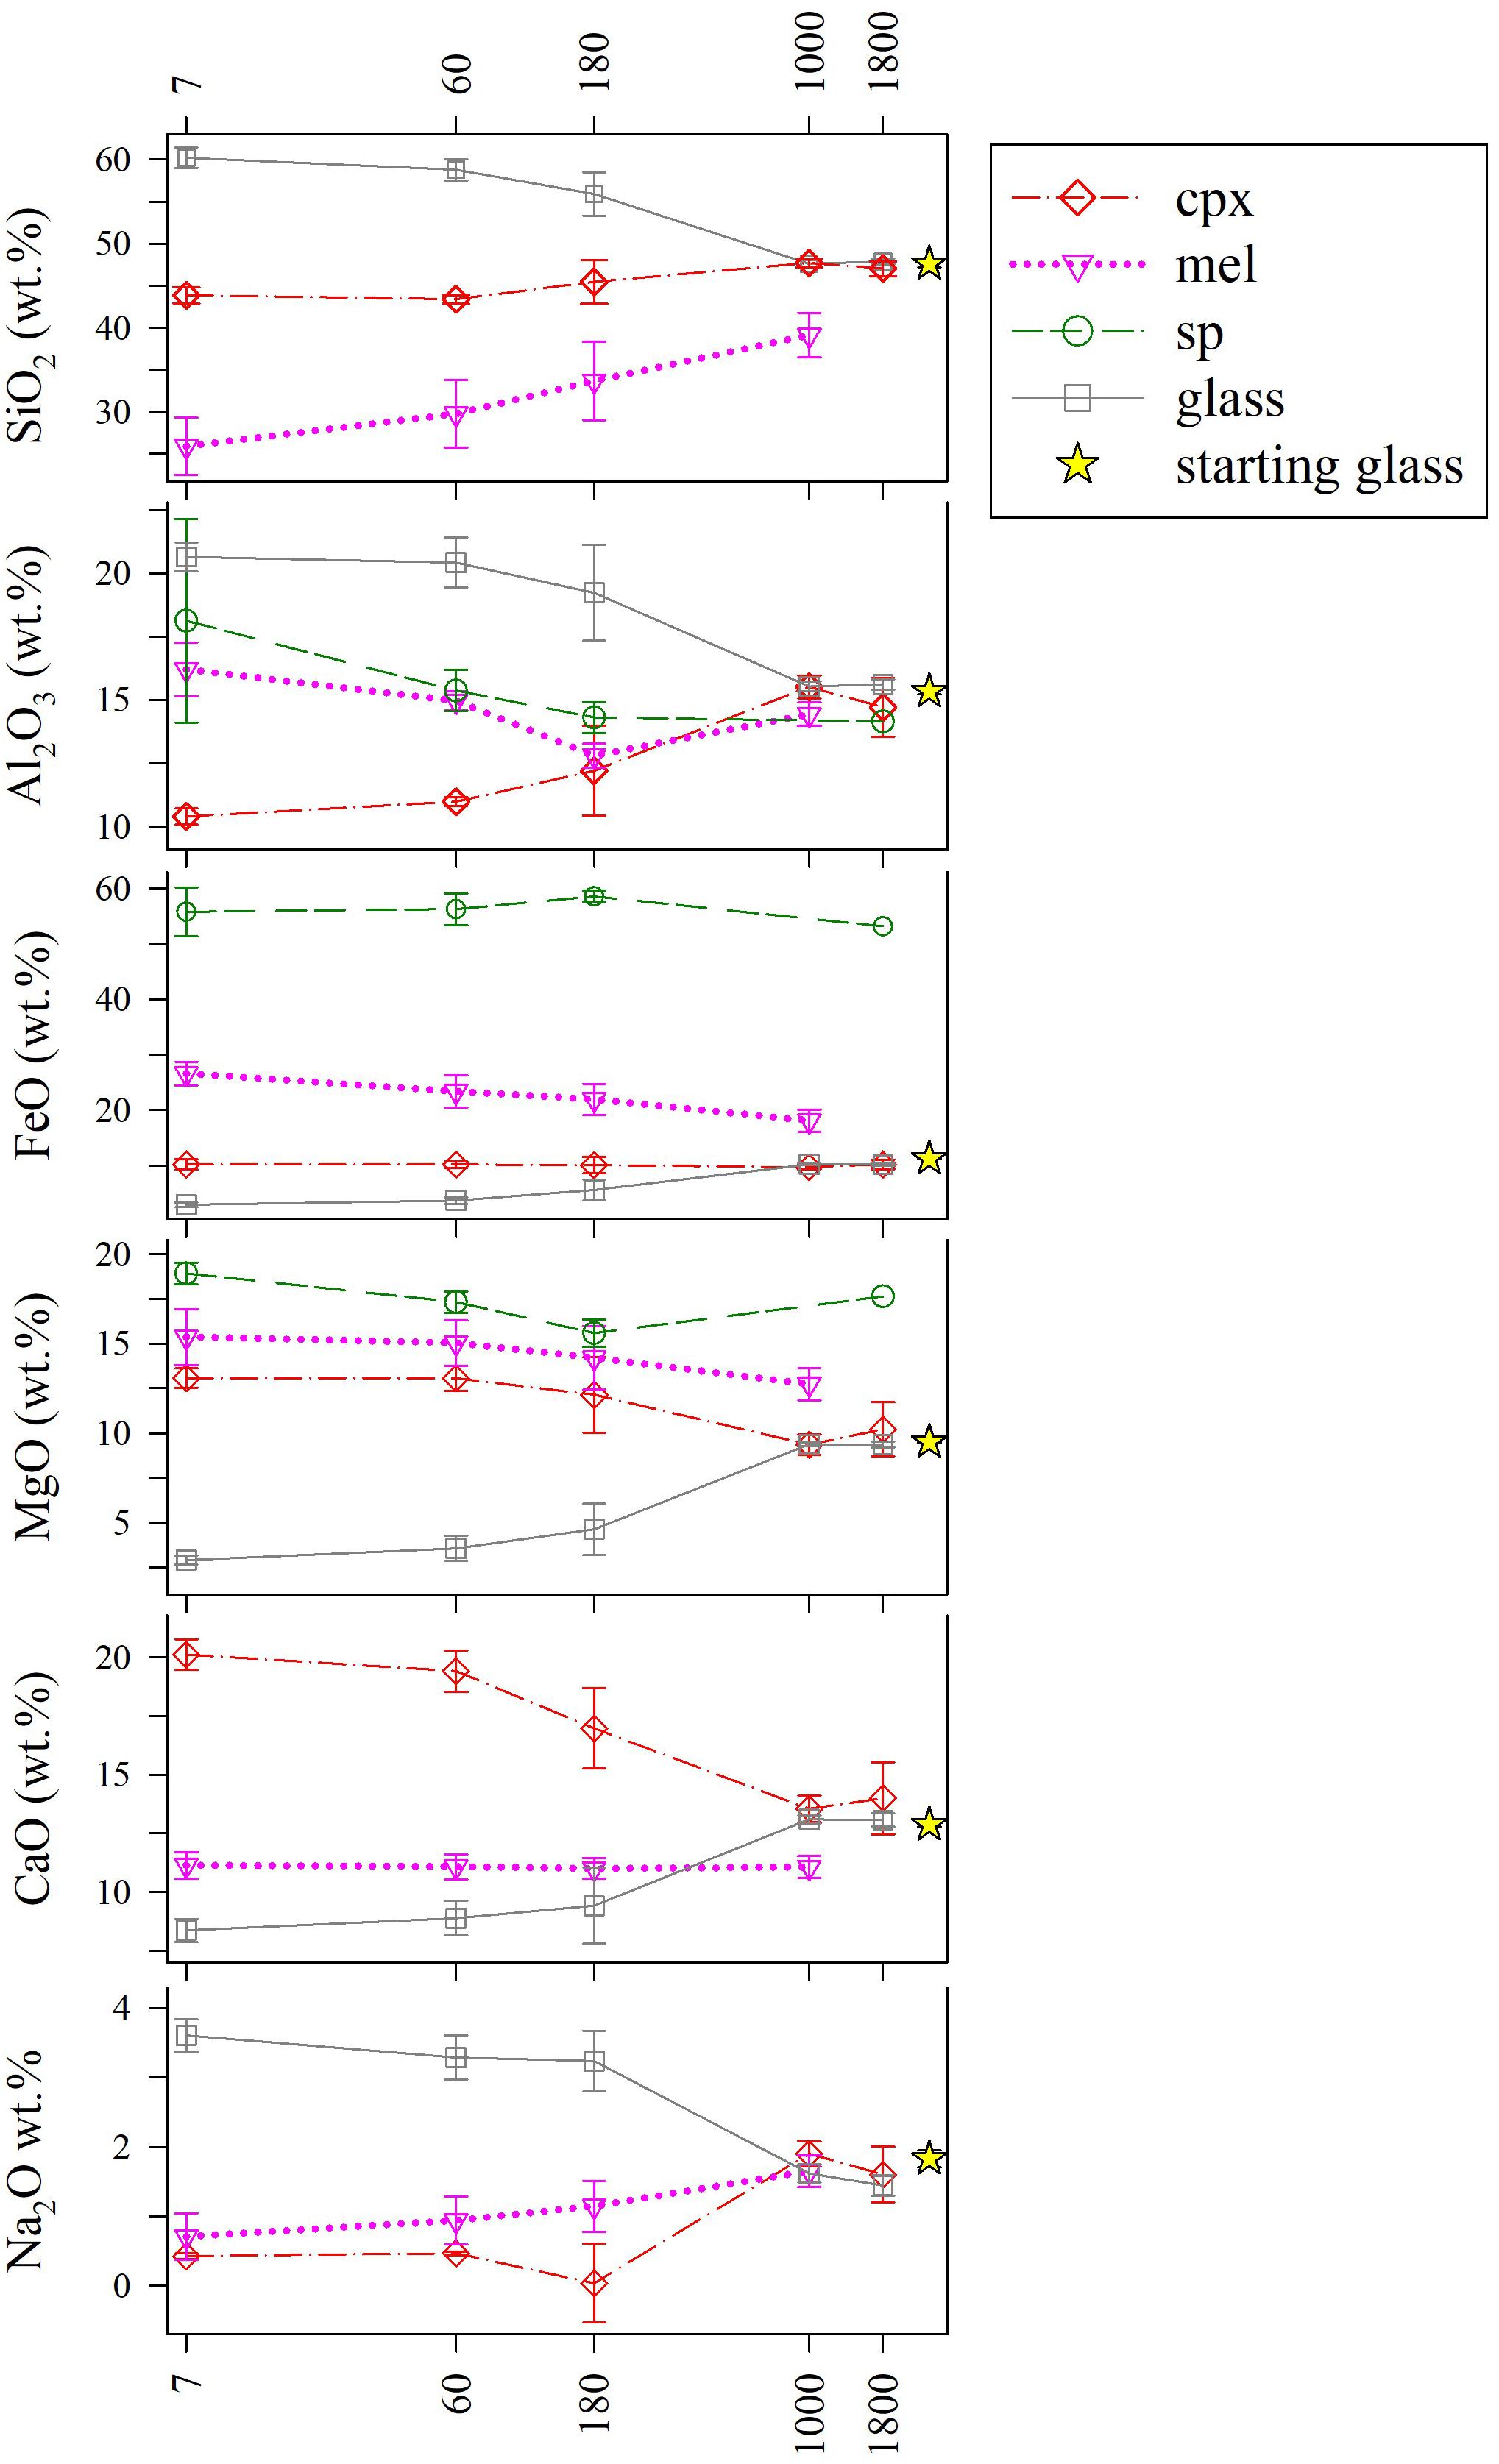
Figure 5. Chemical variations of major oxides (wt.%) in cpx, mel, sp, and intra-crystalline glass as a function of ΔT/Δt (°C/h). Average data are listed in Supplementary Table S1.
Discussion
Phase relations and crystal contents from our DSC experiments can be conveniently compared with those from previous ex situ cooling rate experiments conducted by Vetere et al. (2013, 2015) and further analyzed by Giuliani et al. (2020b), run at similar solidification conditions. As shown in Figure 4, the amount of sp in the DSC run products is low (0–2 area%), and comparable with 2–5 area% content quantified by Giuliani et al. (2020b). Also, the amount of cpx in DSC run products increases with increasing ΔT/Δt in a similar manner to that observed in Giuliani et al. (2020b). The cpx contents at ΔT/Δt of 7 and 1800°C/h are practically identical, whilst those at ΔT/Δt of 60 and 180°C/h differ by 5 and 10 area%, respectively (Figure 4). Therefore, the crystallization of sp and cpx is well comparable with the ex situ dynamic experiments run in furnaces.
By contrast, in DSC run products, mel is <10 area%, and plg is low to absent (Table 4 and Figure 4). The different amount of plg between the DSC experiments and those reported in Vetere et al. (2015) and Giuliani et al. (2020b) can be interpreted in the frame of the TTT diagrams (Lasaga, 1998; Shelby, 2005; Wang et al., 2012; Vetere et al., 2013). In a TTT diagram (t vs. T), the nucleation rate (I), the degree of undercooling (ΔT), and the time required to initiate nucleation of a crystalline phase (τ or induction time) are strictly related (Lasaga, 1998; Fokin et al., 2003, 2008; Roskosz et al., 2005; Iezzi et al., 2009). At the apex of the TTT curve, the nucleation rate is strongly variable and has its maximum value (Imax), while τ is minimum. For the basaltic composition investigated here, the ΔT is moderate at temperatures of 1000–1100°C (Vetere et al., 2013). When a ΔT/Δt trajectory is close to Imax, even small thermal (fluctuations and/or gradient) and/or mechanical (flowing and/or deformation) perturbations can produce significant changes of the nucleation of crystalline phases and their rate (Kirkpatrick, 1983; Vetere et al., 2013).
We hypothesize that during in situ DSC experiments the temperature oscillations were extremely low or even absent, indeed lower than those experienced by charges run by Vetere et al. (2013, 2015). This resulted in unfavorable conditions for the crystallization of a SiO2- and tetrahedral connected-rich crystal, like plg. Indeed, extremely stable thermal and/or mechanical conditions favor the metastable nucleation of mel, a sorosilicate with lower SiO2 amount, and poorly connected tetrahedra. It is a note of worth that mel solidified also in the B100 experimental charges solidified ex situ at ΔT/Δt > 60°C/h, by Vetere et al. (2013, 2015), although with a smaller content. These considerations attest that the plg phase is stable only at low ΔT/Δt, where kinetics conditions are moderate to low, in agreement with Lange et al. (1994), and is more reluctant to nucleate than mel (Kirkpatrick, 1983; Vetere et al., 2015). Thereby, mel oversteps plg due to its lower SiO2 content and degree of polymerization (Kirkpatrick, 1983; Lasaga, 1998; Zhang et al., 2003; Iezzi et al., 2009, 2014). On these bases, the common presence of plg in natural tholeiitic rocks could be also related to the presence of thermal and mechanical perturbations (Chakraborty, 1995; Lasaga, 1998; Vetere et al., 2013), while the rarity of mel in basaltic rocks (Deer et al., 1992) is due to the relatively high SiO2 content of these magmas and the inevitable presence of thermal and mechanical perturbations. All these hypotheses are corroborated by recent findings by Tripoli et al. (2019) and Kolzenburg et al. (2020) on the role of mechanical perturbations on nucleation in solidifying basaltic liquids. They reported that flowing and stress on solidifying basaltic melts promote gradients in chemical potential, enhance the diffusion rates, and, consequently, increasing the crystallization (nucleation and growth) rates and reduced the incubation time. This also favors the kinetic crystallization of metastable phases, rather than the thermodynamically favored ones (Tripoli et al., 2019).
Thereby, we suggest that in the DSC facility used in this study, contrarily to those observed in Giuliani et al. (2020b), the thermal and/or mechanical fluctuations were extremely low or even absent, disfavoring the chemical diffusion of elements. Such conditions did not favor the nucleation of plg, especially at moderate to high cooling conditions. In turn, mel nucleated under disequilibrium condition. Noteworthy, poor tetrahedral-connected cpx phases crystallized in the DSC apparatus and in Giuliani et al. (2020b) with similar behaviors (Figure 4).
Moreover, DSC experiments at ΔT/Δt of 1000 and 1800°C/h indicate also that cpx heterogeneously nucleates on sp, whereas mel develops around cpx-rich areas (Figure 3). Owing on these textural and chemical outcomes, the crystallization sequence in the analyzed basaltic composition is sp, cpx, mel, and ±plg, in line with the interpretation of Vetere et al. (2015) and Giuliani et al. (2020b). This also agrees with the observation that the oxide amounts of mel and glass are anti-correlated (Figure 5); hence mel metastably crystallizes in the melt left behind the growth of sp and cpx. Finally, being the mel amount in the DSC charges very low (<10 area%, Table 4), sp and cpx highly reproducible, the representativeness of these DSC experimental outcomes is reliable, especially at high T below the liquidus.
The crystal sizes of cpx, sp, and mel decrease as a function of ΔT/Δt (Table 5). As ΔT/Δt increases from 7 to 1800°C/h, the measured crystal size range decreases from 635-2 to 38-1 μm, from 89-1 to 7-1 μm, and from 359-1 to 14-1 μm for cpx, sp, and mel, respectively (Table 5). Notably, the crystal sizes measured for sp and cpx from in situ DSC experiments are also comparable to those quantified by ex situ cooling rate experiments analyzed by Giuliani et al. (2020b) (Figure 6).
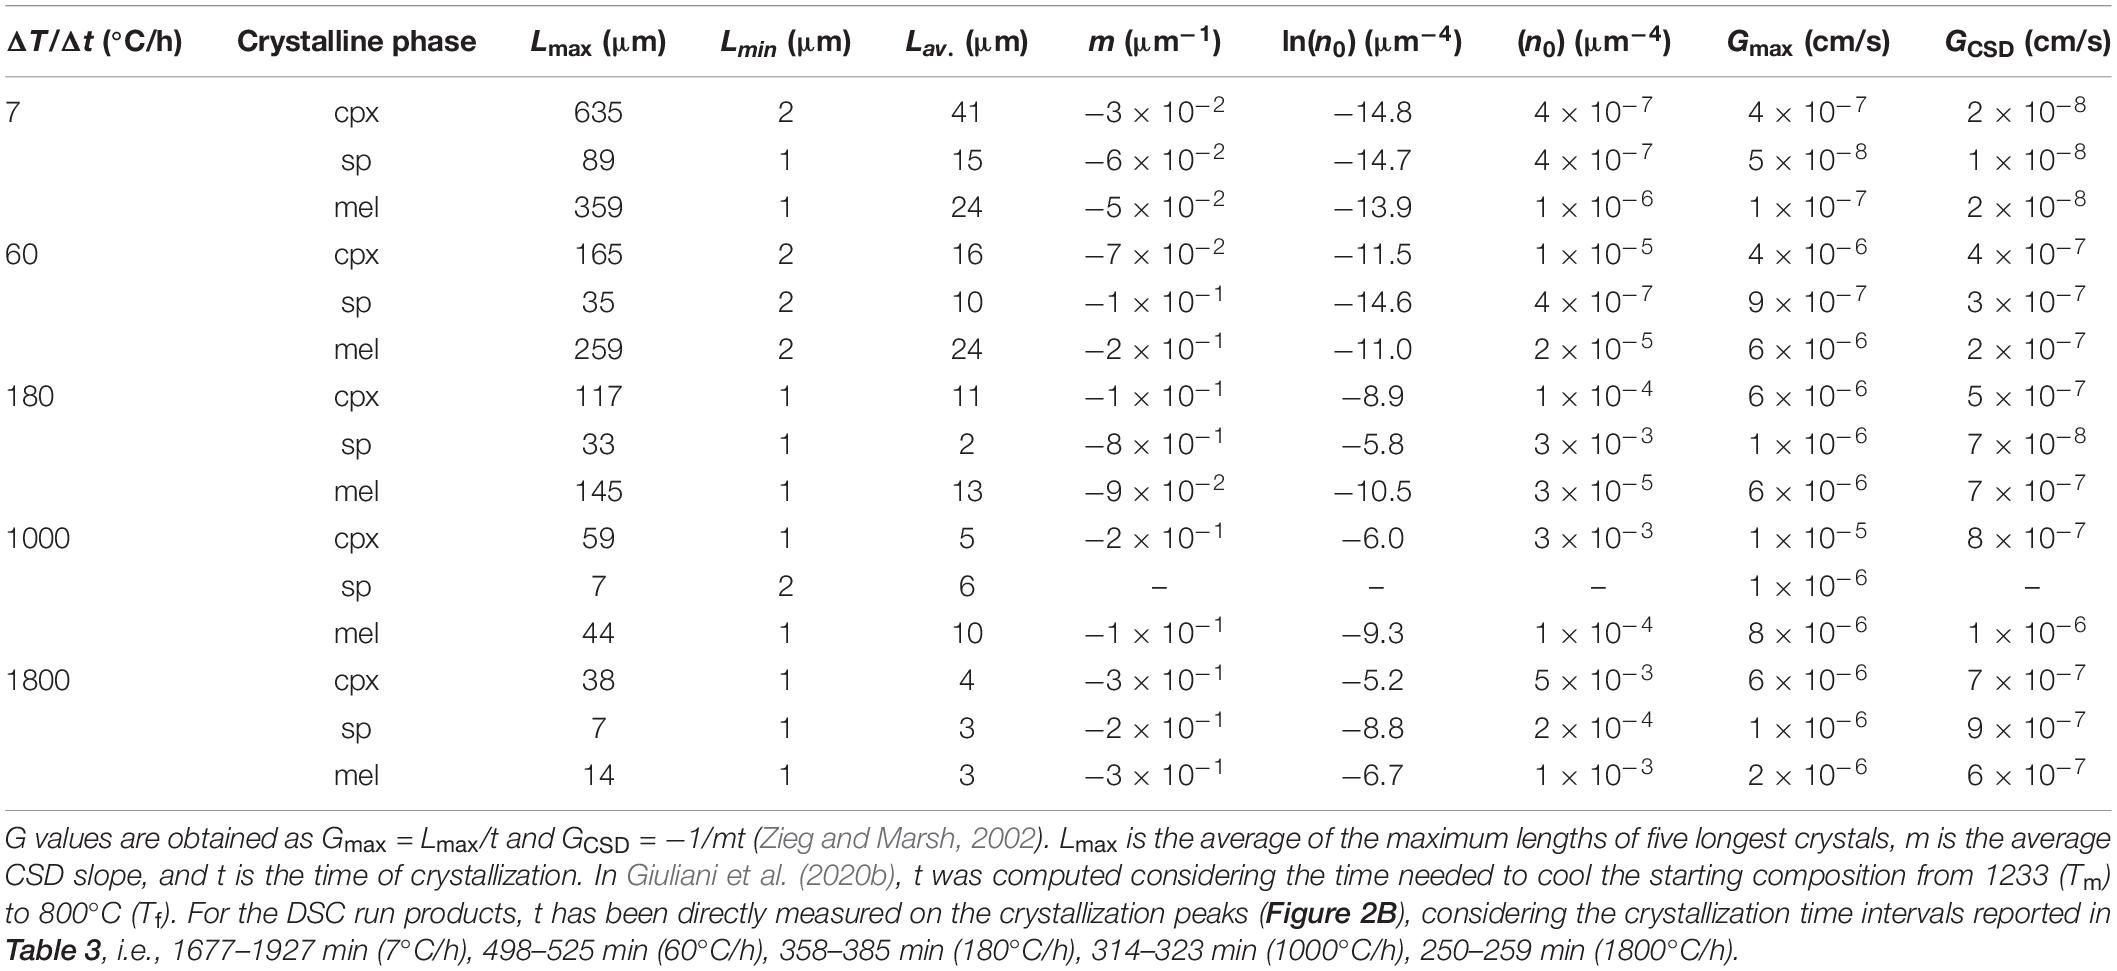
Table 5. 2D maximum (Lmax), minimum (Lmin) and averaged (Lav,) crystal lengths, CSDs parameters (m and n0), maximum (Gmax) and average (GCSD) growth rates.
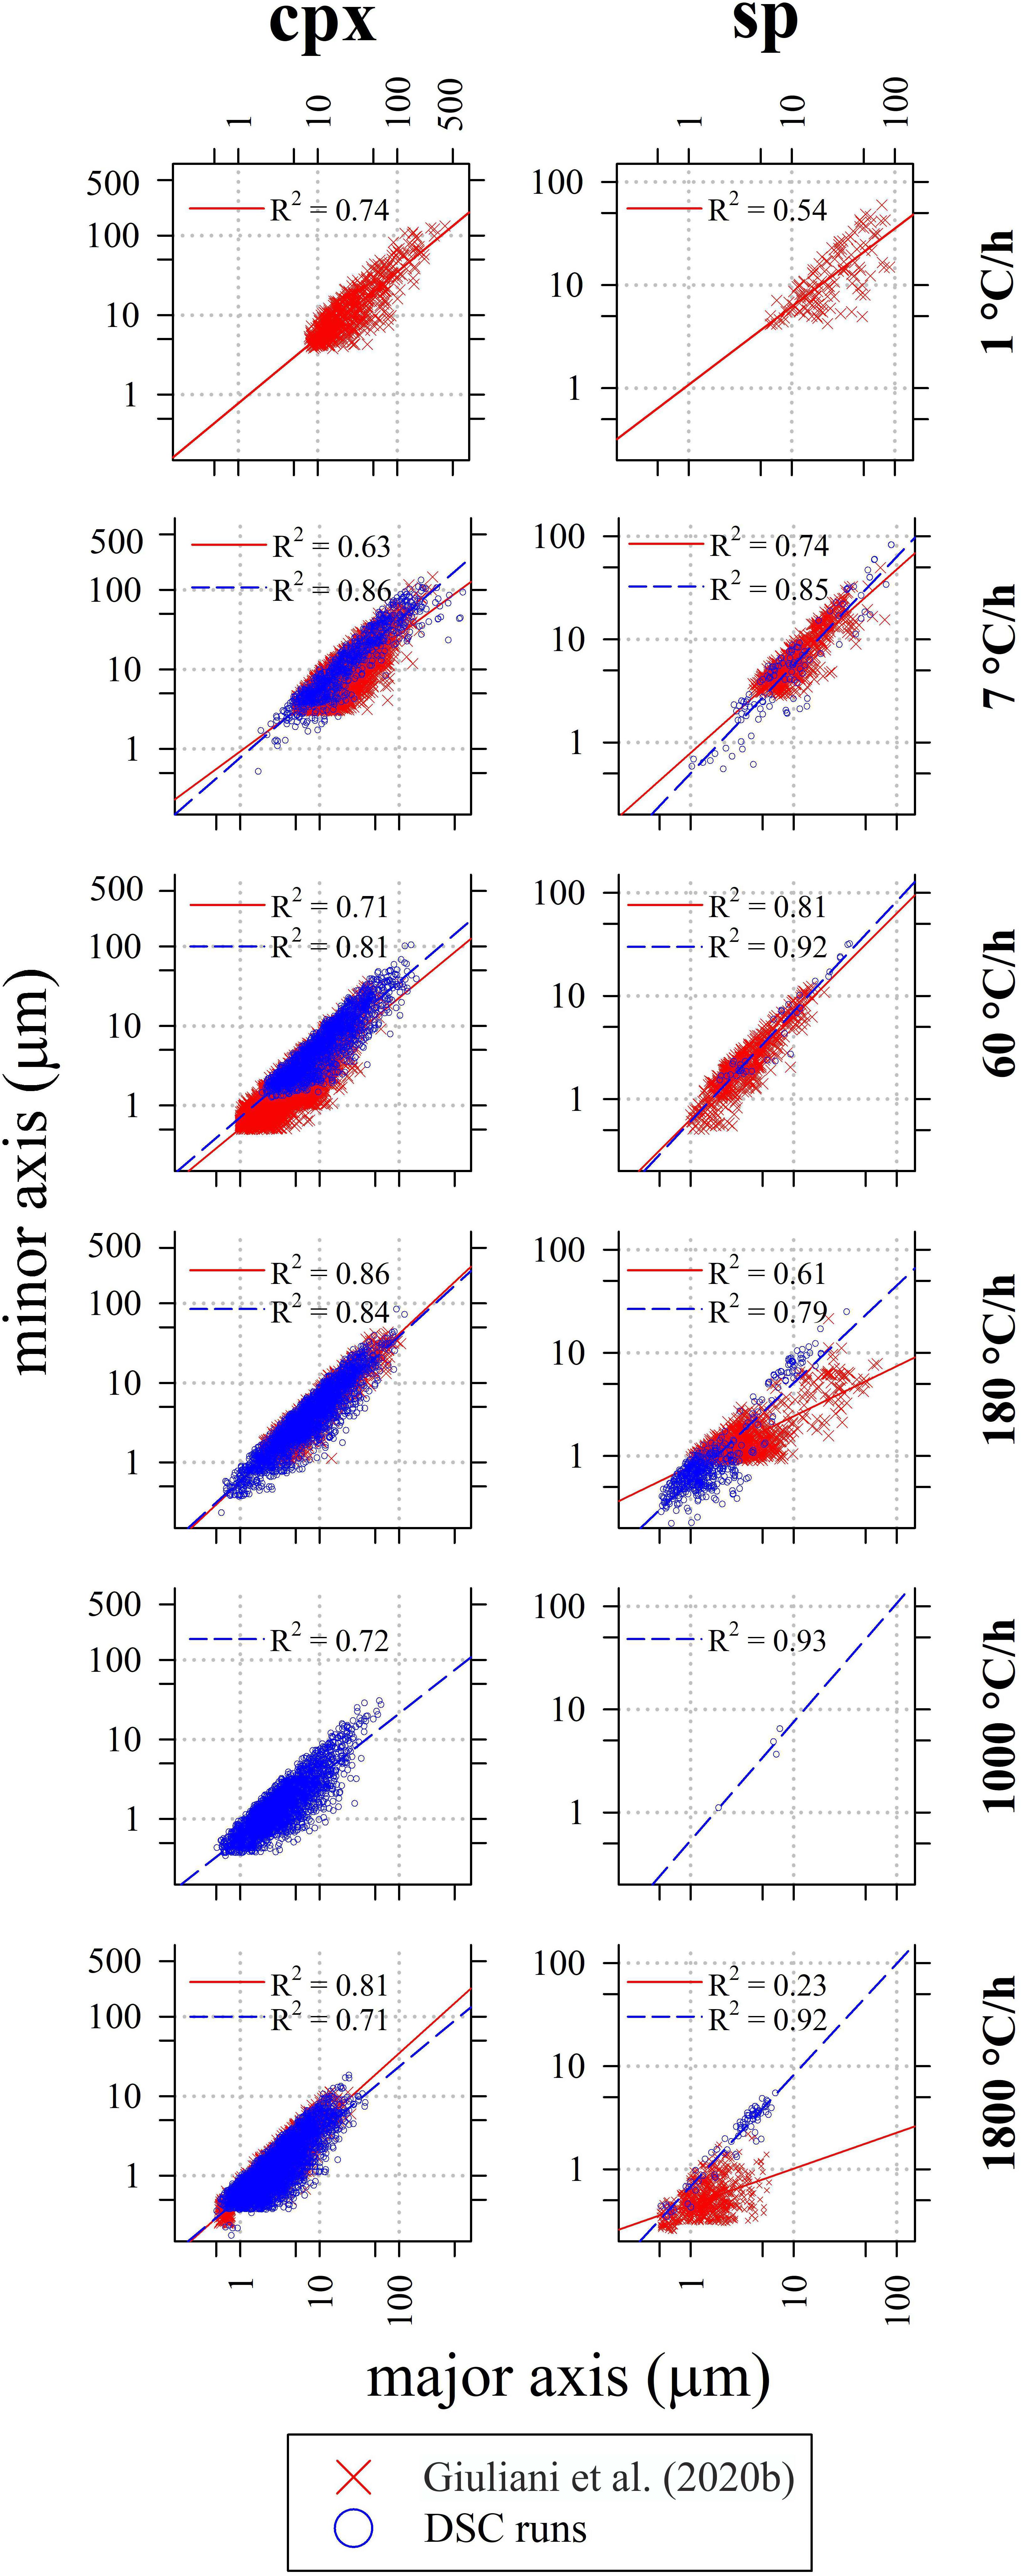
Figure 6. 2D – crystal size (major axis of the equal-area ellipse) and shape (slope of the linear regression) of cpx (left column) and sp (right column) from in situ DSC experiments as a function of ΔT/Δt. Data from Giuliani et al. (2020b) are also reported for comparison. The maximum, minimum, and average size for each experiment are listed in Table 5.
Crystal size distribution curves of cpx and sp are displayed in Figure 7 and compared with those reported in Giuliani et al. (2020b). These curves allow to make three-dimensional consideration about textures: they are computed using the 2D crystal sizes (maximum and minor axis), image area (μm2), crystal shape and phase abundances (area%); the stereological conversions are implemented in the software used to compute the CSDs (Higgins, 2006). Results show that with increasing ΔT/Δt, the slope (m) and crystal population density per size (n0, corresponding to the y-axis intercept) of cpx-CSD trajectories increase (Figure 7 and Table 5). These data well match with those reported in Giuliani et al. (2020b) for ΔT/Δt of 180 and 1800°C/h. Conversely, CSDs compared at ΔT/Δt of 7 and 60°C/h show lower crystal sizes for the experimental charges analyzed by Giuliani et al. (2020b) due to the significant crystallization of plg. CSD curves obtained for sp from DSC experiments do not show a clear evolutionary trend as a function of ΔT/Δt and they poorly match with data from Giuliani et al. (2020b) (Figure 7). Overall, cpx- and sp-CSD curves on the run-product cooled in the DSC at ΔT/Δt of 7 show both two log-linear segments with different slopes (Figure 7), accounting for multiple nucleation events and subsequent crystal growth by coarsening. The minimum slope corresponding to a maximum crystal size relates to the first nucleation event, further nucleation pulses at lower temperatures follow (Pupier et al., 2008; Giuliani et al., 2020b). The other CSDs instead show a nearly unique log-linear evolution (Figure 7).
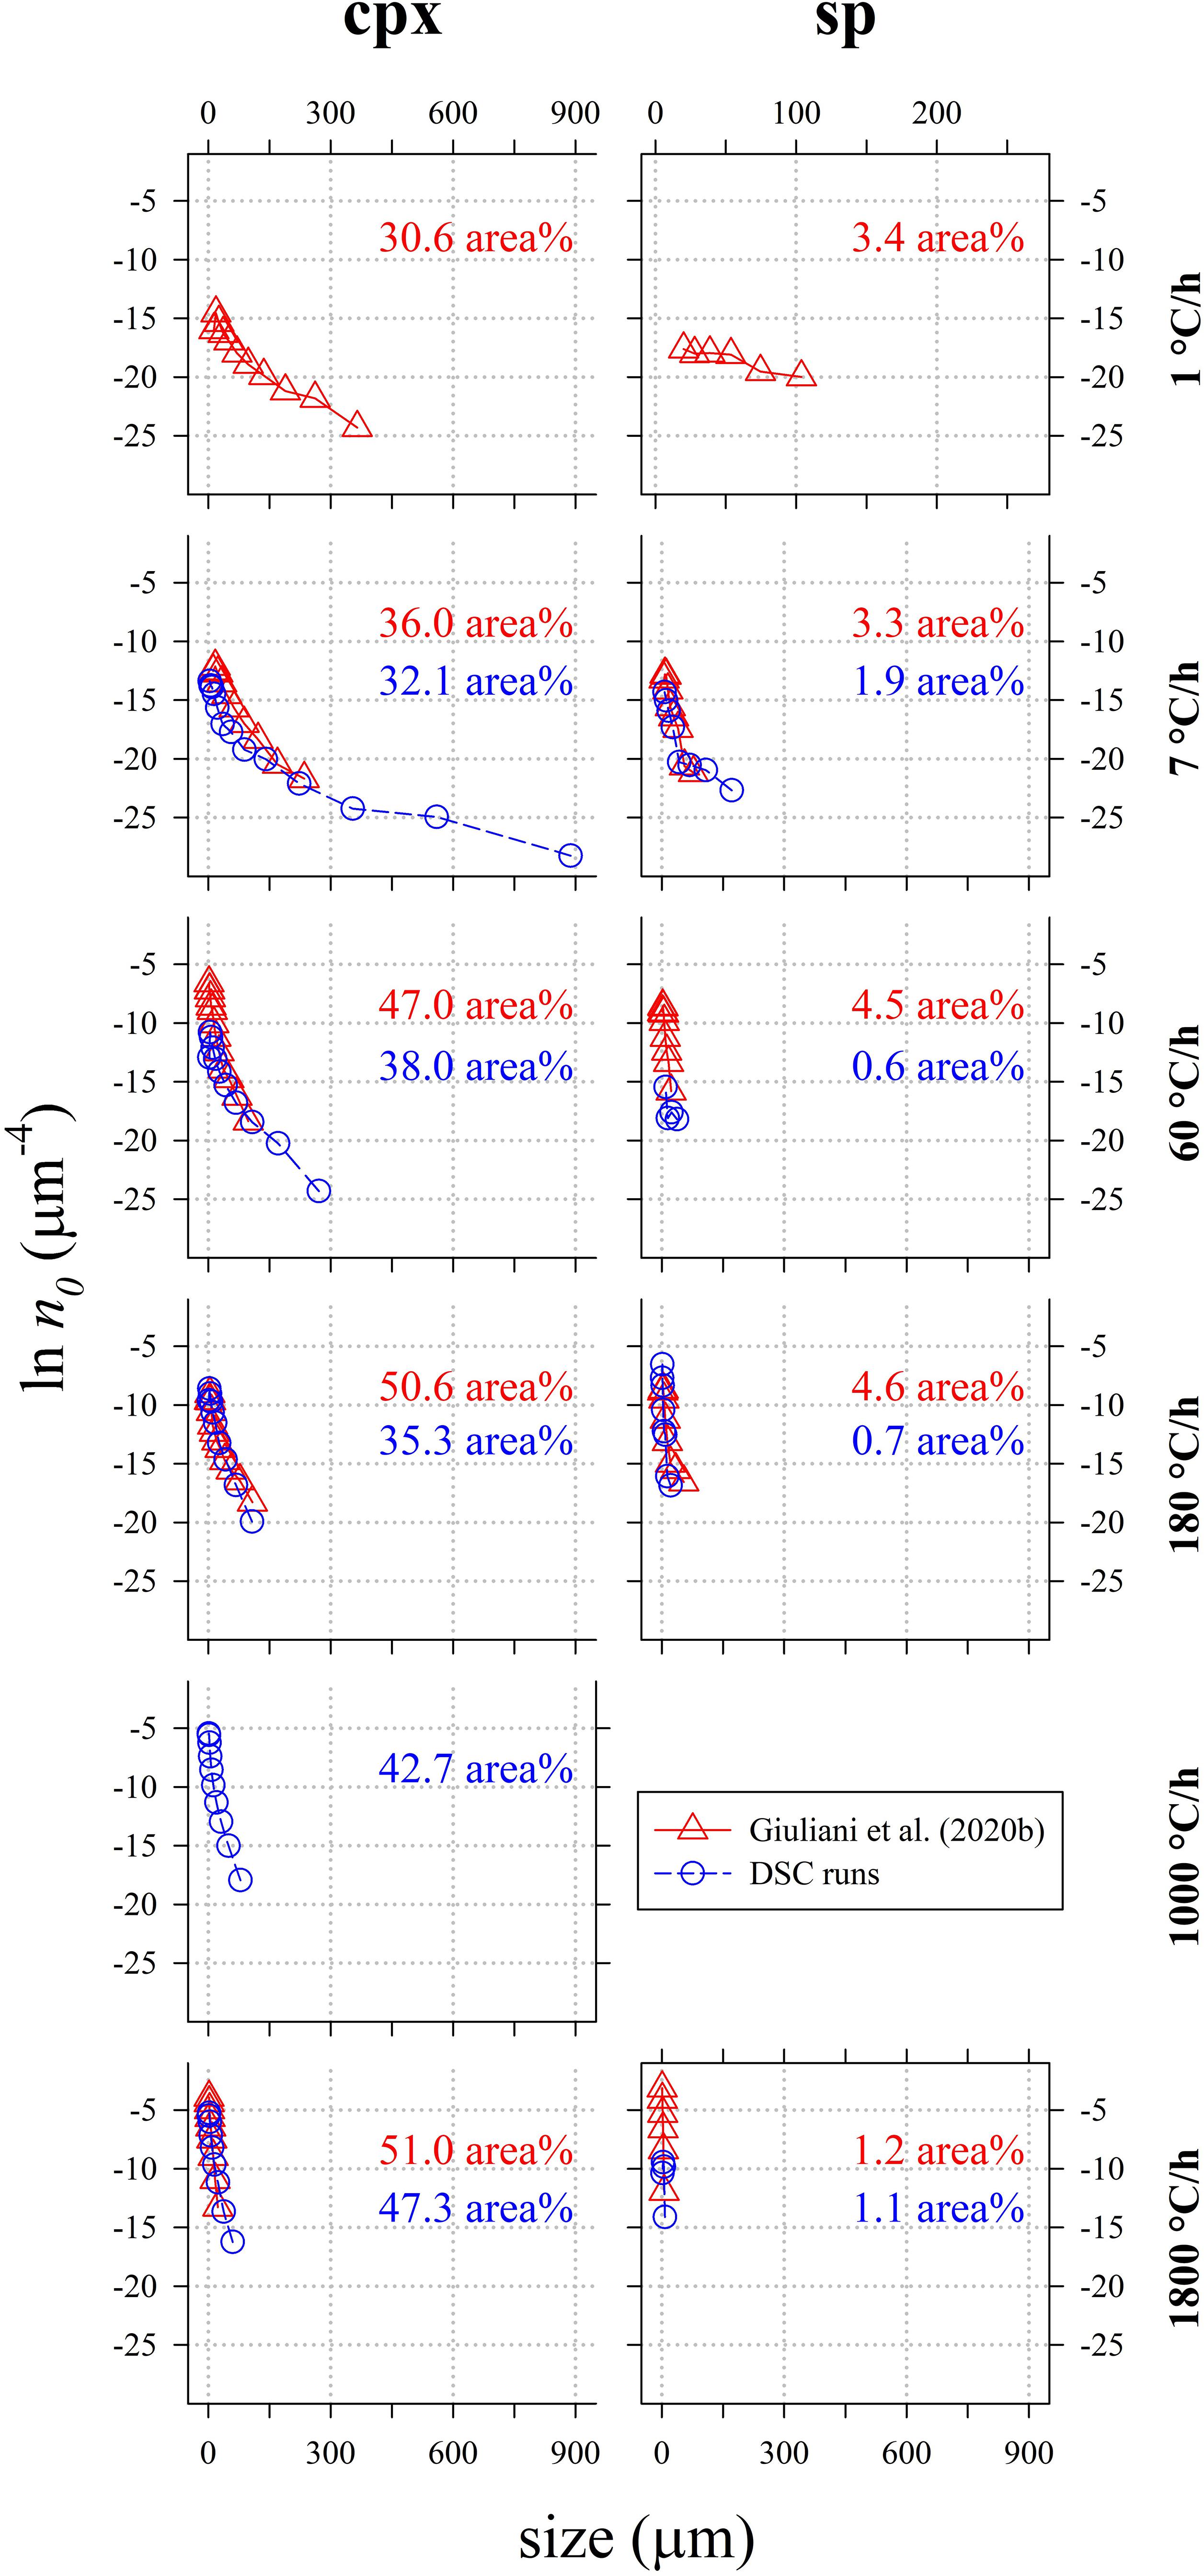
Figure 7. Crystal size distribution (CSD) of cpx computed by CSD Corrections (Higgins, 2000) and relative crystal content (area%). Data are listed in Tables 4, 5.
These considerations agree with the very rapid crystallization, on the order of minutes, measured in situ by Polacci et al. (2018) using X-ray tomography. They rapidly cooled a natural basalt from 1250°C (superliquidus condition) to 1170 and 1150°C (low to moderate ΔT), maintaining the final temperature for 4 h. During the annealing at 1150 and 1170°C, it is possible to identify at least three discrete nucleation events for sp and cpx. Also, Polacci et al. (2018) observed the heterogeneous crystallization of cpx on sp. Similarly, DSC spectra from this study display discrete exothermic peaks of crystallization (Figure 1 and Supplementary Figures S1B–E), except for the charges at 7°C/h, showing a complex and broad DSC multicomponent band at a relatively low thermal range (911–1062°C), that suggests the attainment of a continuous crystallization process (Figure 1 and Supplementary Figure S1A). In line with this, a long tail at large crystal sizes (>300 μm) along with low m and n0 values (Figure 7) characterize the CSD curve of this experiment. Possibly, the exothermic multicomponent band and the long CSD tail observed at ΔT/Δt of 7°C/h are both determined by crystal coarsening phenomena. It is thus possible to assume that nucleation occurs mainly by a rapid pulse during cooling and that mainly, at low rates, crystal coarsening becomes a dominant solidification process.
Calculation of the maximum growth rate (Gmax) uses the maximum lengths (Lmax) of five longest crystals (Burkhard, 2002; Hammer and Rutherford, 2002; Couch, 2003; Iezzi et al., 2011; Giuliani et al., 2020b). In particular, the average Lmax has been divided by the actual crystallization time (t) measured from the DSC spectra (Figures 1, 2B and Table 3). The average growth rate (GCSD) has been also determined by interpolating m (Table 5) with t, as GCSD = −1/mt (Zieg and Marsh, 2002; Giuliani et al., 2020b). The values of Gmax and GCSD from this study are reported in Table 5 and plotted in Figure 8, together with the Gmax and GCSD from Giuliani et al. (2020b). Both the Gs of cpx and sp obtained from DSC experiments are systematically higher than those measured by ex situ cooling rate experiments (Figure 8), due to a more accurate and reliable estimate of t from DSC spectra (Figures 1, 2B and Table 3). Generally, Gmax and GCSD increase as a function of ΔT/Δt, with the only exception of GCSD of sp derived at ΔT/Δt between 60 and 180°C/h (Figure 8).
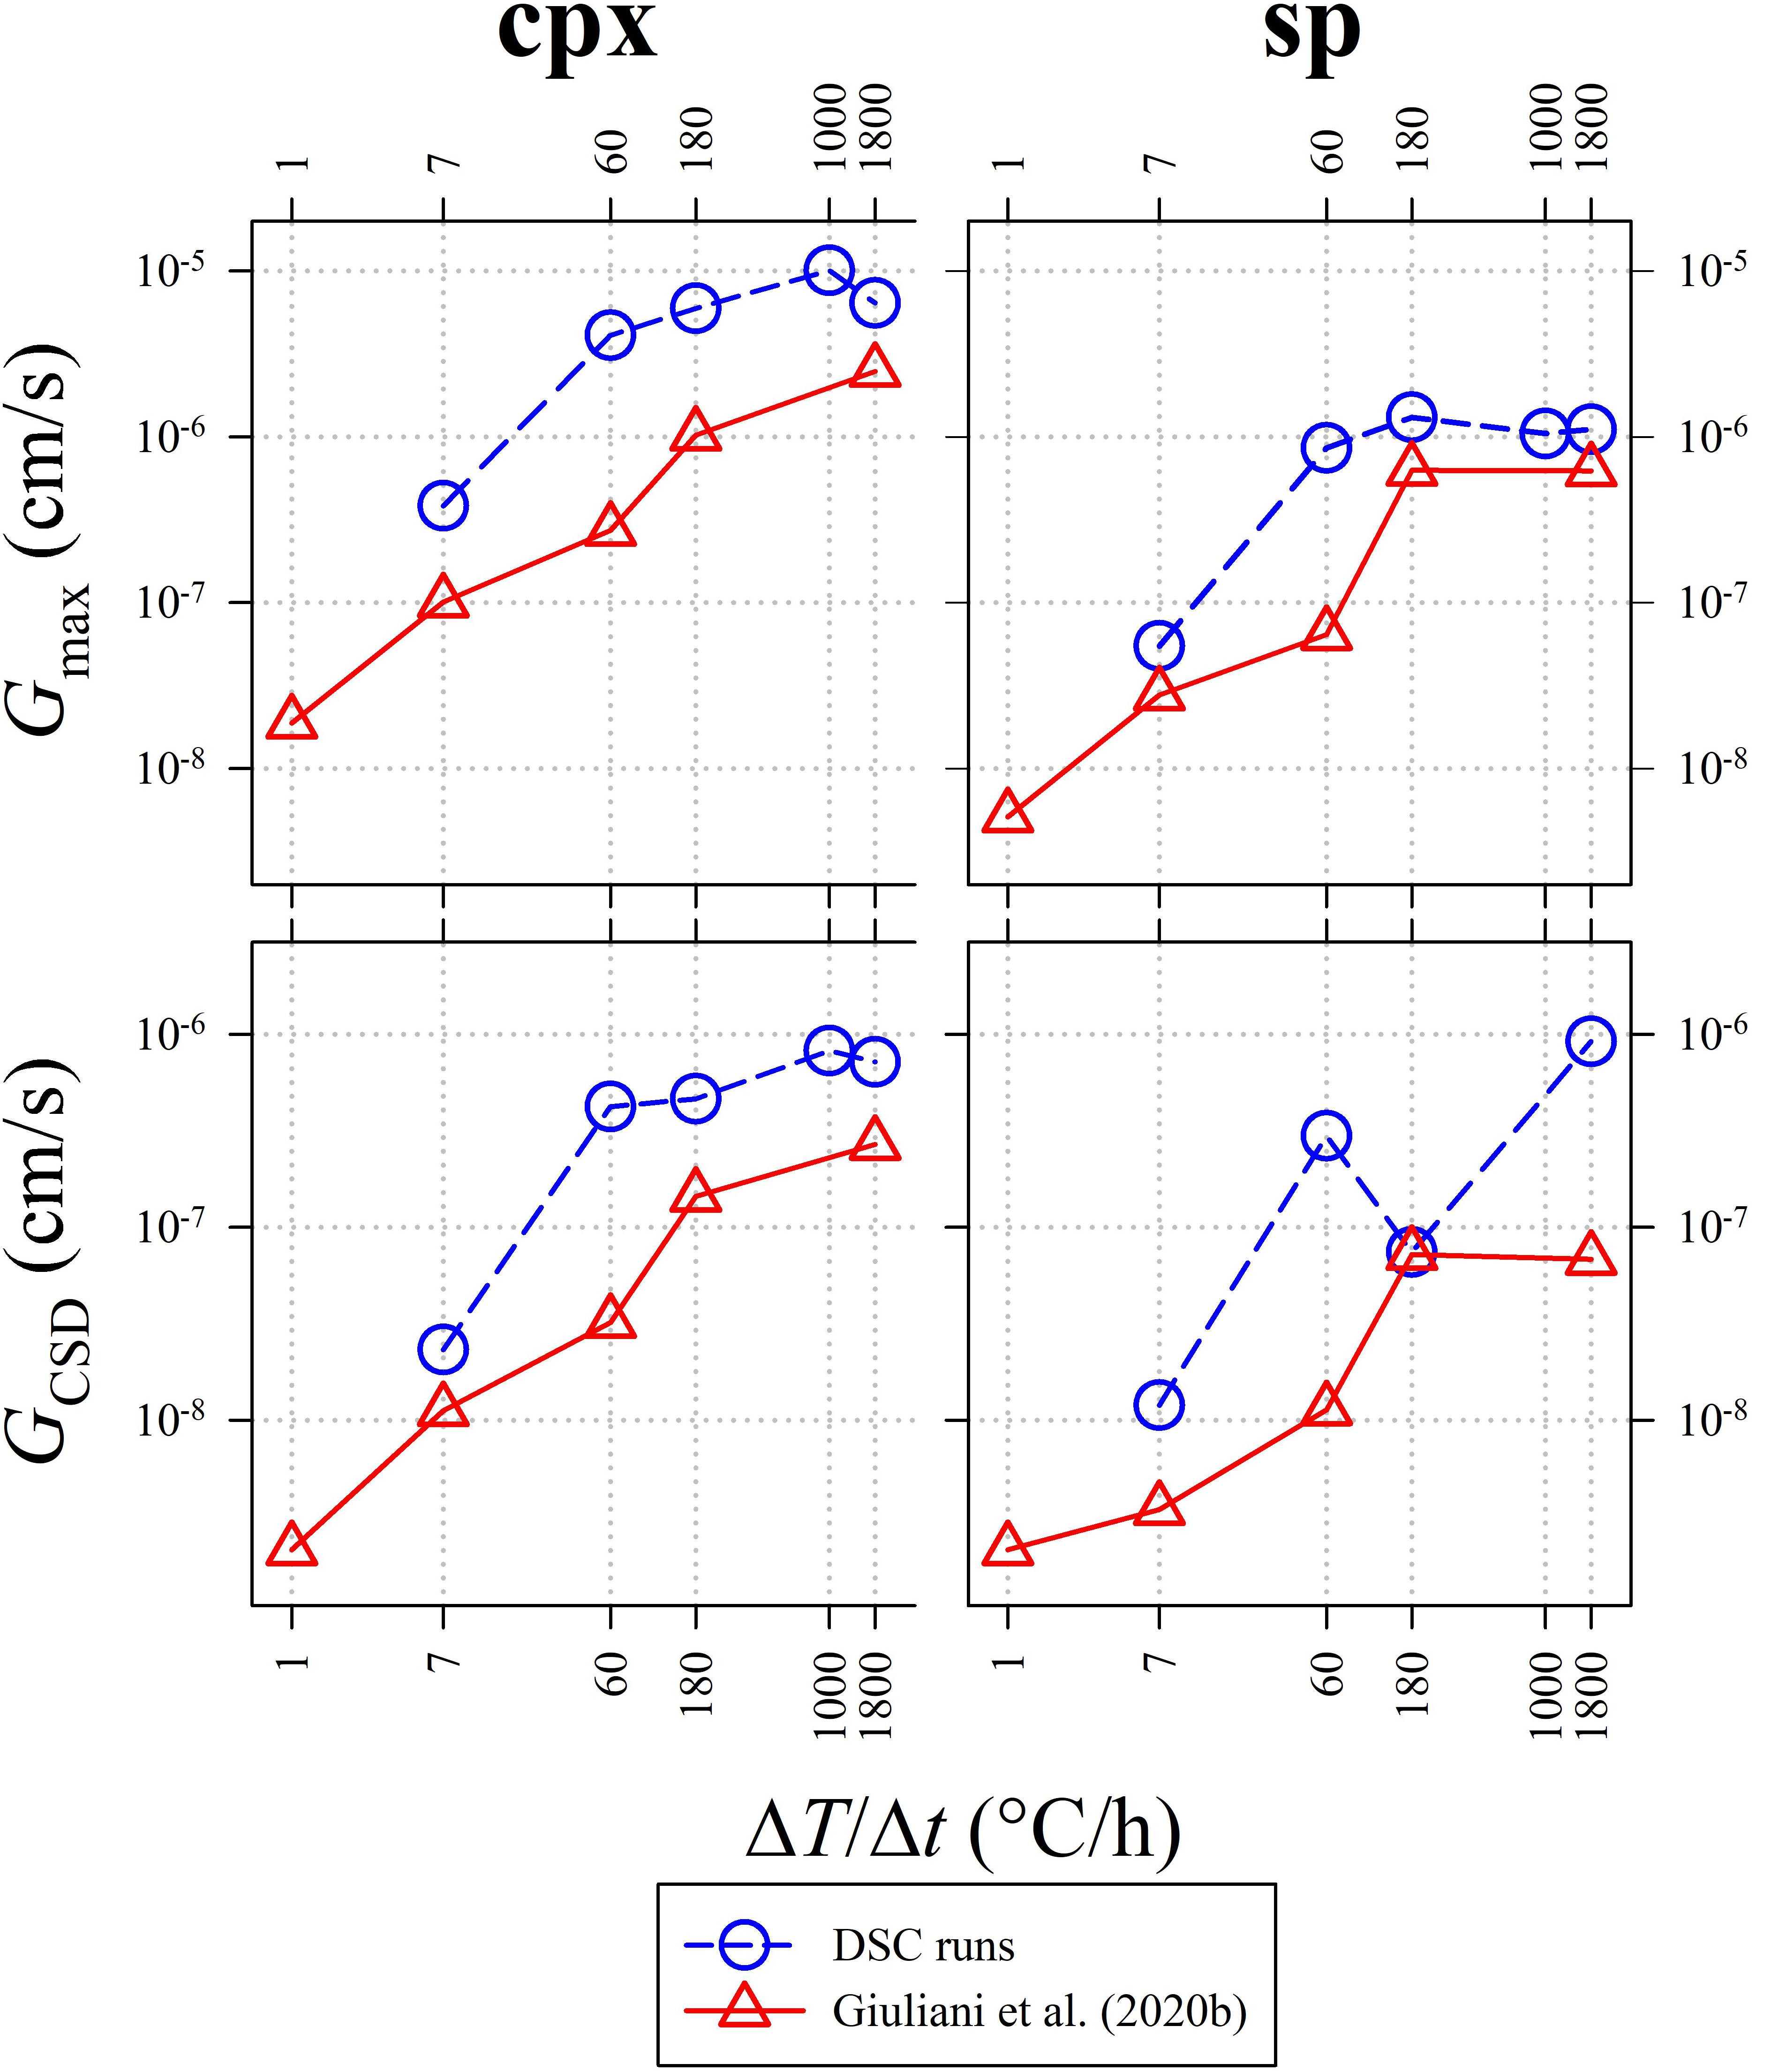
Figure 8. Variation of the maximum growth rate (Gmax; top) and the average CSD growth rate (GCSD; bottom). Data from DSC experiments (Table 5) are compared with those reported in Giuliani et al. (2020b).
The values of Txi (Table 2) vs. ΔT/Δt are reported in Figure 9, showing a decreasing exponential evolution that highlights the faster decrease of Txi at higher kinetic conditions, with respect to low ΔT/Δt. Results of data fitted using linear regression a high correlation too. Importantly, these experimental data and the fitting exponential equation have been used to reconstruct the uppermost portion of a TTT curve of the basaltic melt solidifying at ambient conditions (Figure 10). According to Vetere et al. (2015), a cooling rate of 9000°C/h prevents the crystallization (crystals < 2 area%) of a basaltic liquid. Since dynamic stress conditions in volcanic systems enhance the nucleation process (Kouchi et al., 1986; Vona and Romano, 2013; Kolzenburg et al., 2018a, b, 2020; Vetere et al., 2020), the TTT data from this study represent the conservative expression of a kinetic crystallization process governed by cooling rate.
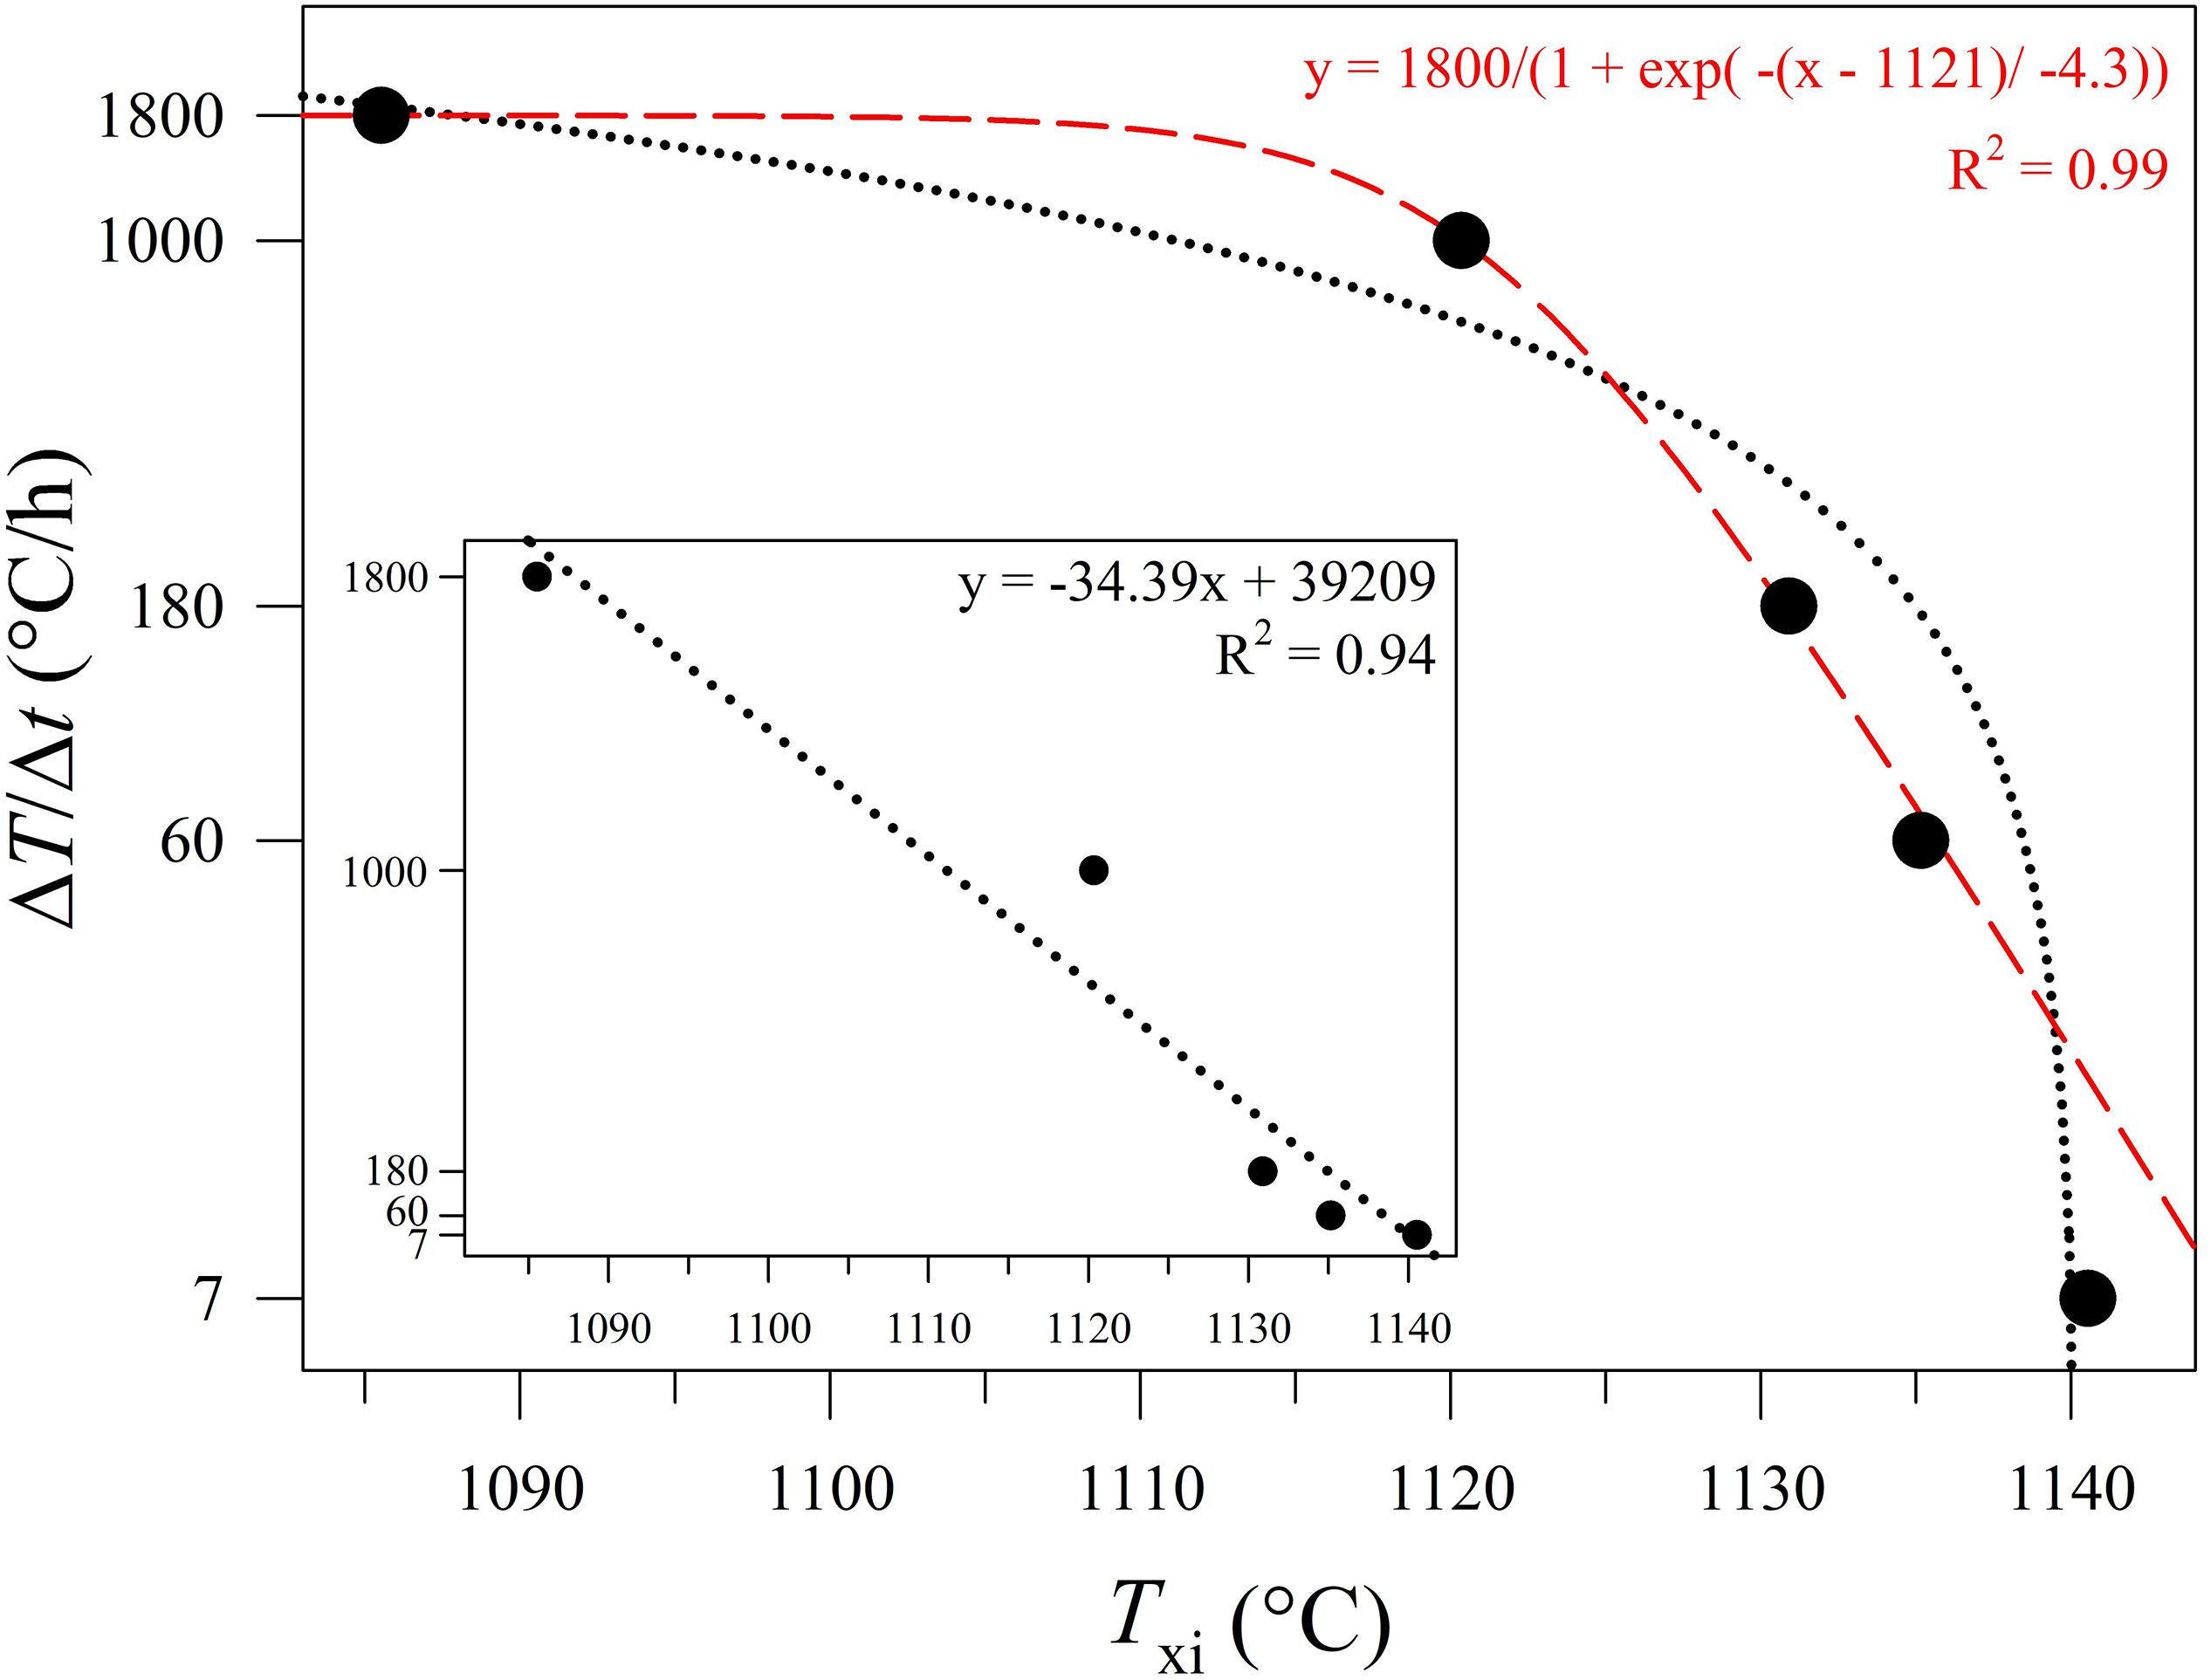
Figure 9. Txi versus ΔT/Δt (°C/h) according to data reported in Table 1, Figures 1, and Supplementary Figures S1A–E. As the cooling rate increase, the onset temperature of crystal nucleation decreases. The dotted black line refers to a linear regression fit. The dashed red line refers to an exponential regression fit.
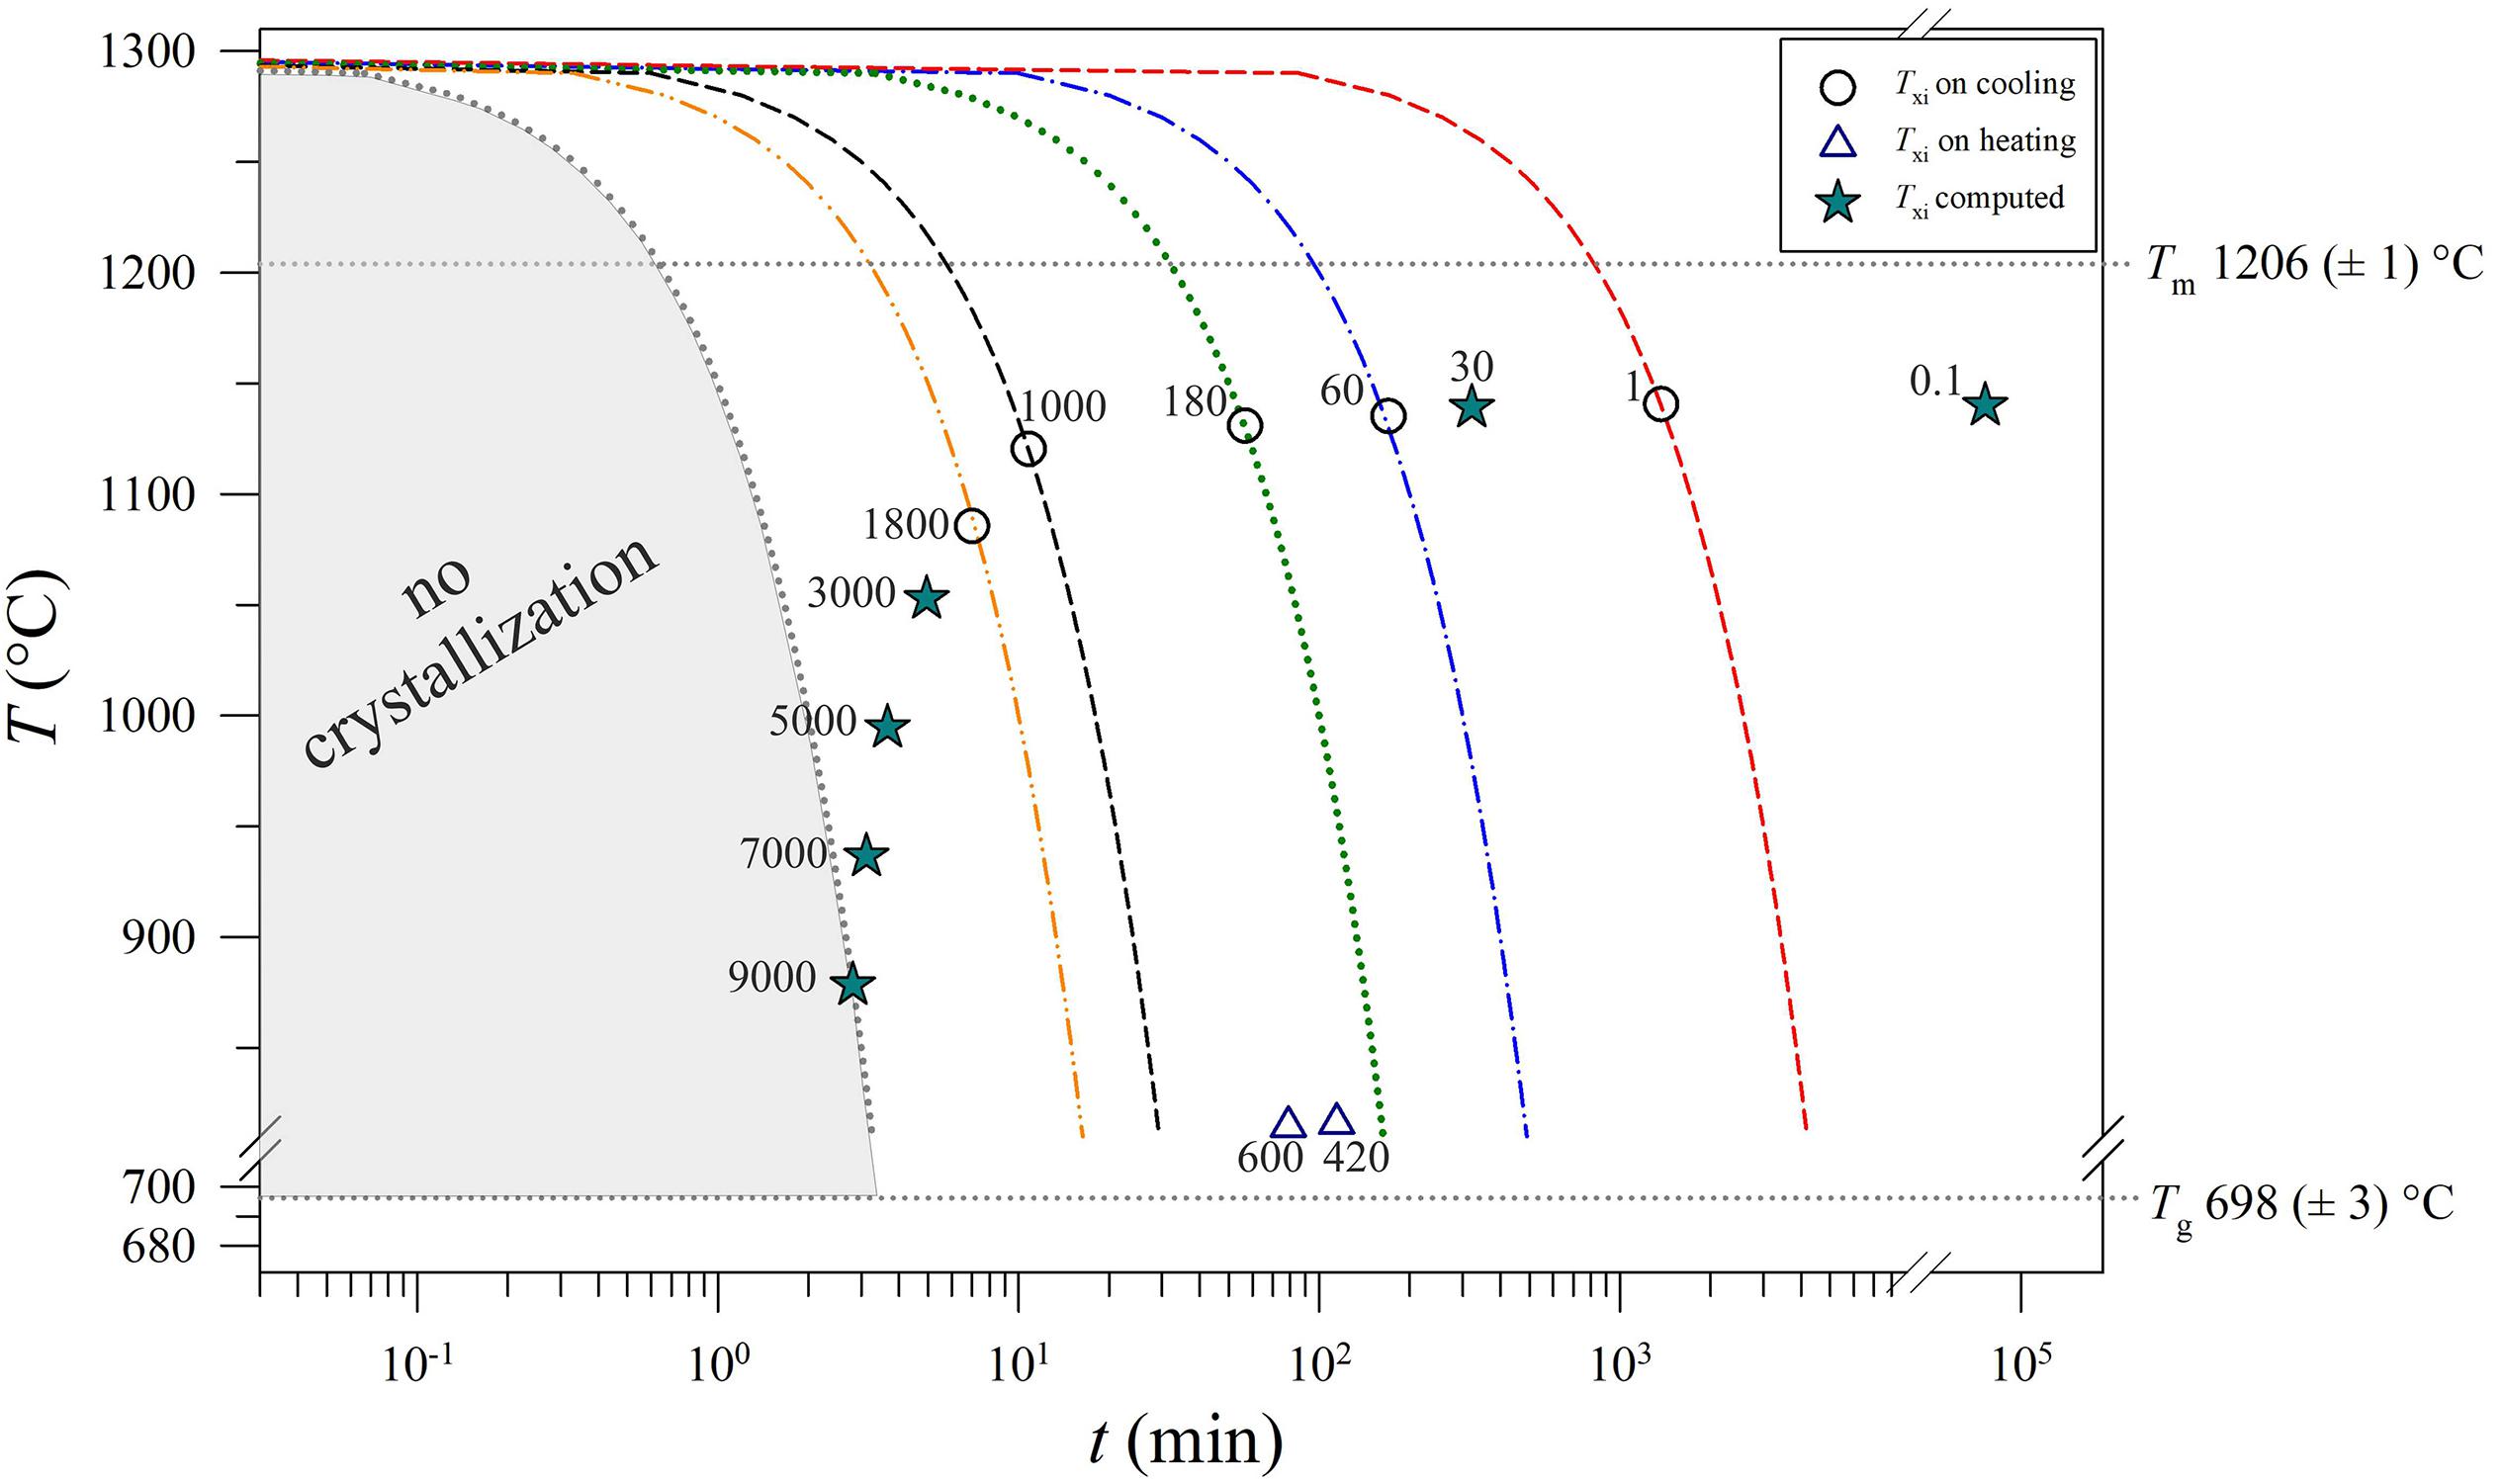
Figure 10. Thermal path and Txi versus t for each run product. The values of Tm and Tg were computed as the average of Tm and Tg (Table 2). The Txi trajectory reproduces the uppermost portion of a TTT curve. Circles: measured data. Stars: calculated data by the equations reported in Figure 9. Triangles: the temperatures computed using the heating rates from this study and Iezzi et al. (2017). All numbers into the plot are expressed in °C/h.
Conclusion
We present a complete and quantitative characterization of a basaltic melt solidifying from liquidus to solidus conditions, monitored in situ via DSC heating/cooling experiments, able to track the thermal evolution and crystallization path of the system. Direct measurement of the onset temperature of crystallization makes possible to define the nucleation and growth processes in an interval of 911–1129°C, at atmospheric pressure and fugacity of air. Textural analysis of cpx and sp shows that both m and n0 of CSDs increase with increasing ΔT/Δt, while the crystal size ranges decrease. These data point out that the sp nucleation favors those of cpx; at the slow kinetic condition, cpx formation happens by multiple nucleation events, followed by crystal coarsening.
The Txi depicts a decreasing exponential trend as a function of cooling rate; under low kinetic conditions, the onset of nucleation starts after a long time at high temperature (low ΔT), as expected from theory. The Txi values measured and/or computed using the founded analytical function define the uppermost part of a TTT-like trend, making it possible to quantitatively model the crystallization path of a basaltic melt solidifying at ambient conditions.
Data Availability Statement
All datasets generated for this study are included in the article/Supplementary Material.
Author Contributions
LG acquired BS-SEM images, performed the image analysis and, together with GI, organized the data in tables and figures, and wrote an early version of the manuscript. GI conceived the study. TH, MD, and AE carried out the DSC experiments. MN contributed to the BS-SEM acquisition. All the authors discussed together the data and their interpretation, as well as contributed to the attainment of this final version.
Funding
This study was funded by the “Fondi Ateneo of the University G. D’Annunzio”, PRIN (2009PZ47NA_003) project “Experimental determination of the glass-forming ability (GFA), nucleation and crystallization of natural silicate melts” and PRIN (2017J277S9_003) project “Time scales of solidification in magmas: Application to Volcanic Eruptions, Silicate Melts, Glasses, Glass-Ceramics” awarded to GI. Alexander von Humboldt foundation senior research grant to FV is also acknowledged.
Conflict of Interest
TH, MD, and AE were employed by the company Schott Glass North America.
The remaining authors declare that the research was conducted in the absence of any commercial or financial relationships that could be construed as a potential conflict of interest.
Acknowledgments
The authors thank the editor YX and the two reviewers. Most of this study was conducted during the Ph.D. of LG.
Supplementary Material
The Supplementary Material for this article can be found online at: https://www.frontiersin.org/articles/10.3389/feart.2020.00337/full#supplementary-material
References
Applegarth, L. J., Tuffen, H., James, M. R., and Pinkerton, H. (2013). Degassing-driven crystallisation in basalts. Earth Sci. Rev. 116, 1–16. doi: 10.1016/j.earscirev.2012.10.007
Armienti, P., Pareschi, M. T., Innocenti, F., and Pompilio, M. (1994). Effect of magma storage and ascent on kinetics of crystal growth. Contrib. Mineral. Petrol. 115, 402–414. doi: 10.1007/bf00320974
Arzilli, F., Agostini, C., Landi, P., Fortunati, A., Mancini, L., and Carroll, M. R. (2015). Plagioclase nucleation and growth kinetics in a hydrous basaltic melt by decompression experiments. Contrib. Mineral. Petrol. 170:55. doi: 10.1007/s00410-015-1205-1209
Arzilli, F., La Spina, G., Burton, M. R., Polacci, M., Le Gall, N., Hartley, M. E., et al. (2019). Magma fragmentation in highly explosive basaltic eruptions induced by rapid crystallization. Nat. Geosci. 12, 1023–1028. doi: 10.1038/s41561-019-0468-466
Baker, D. R., Brun, F., O’Shaughnessy, C., Mancini, L., Fife, J. L., and Rivers, M. (2013). A four-dimensional X-Ray tomographic microscopy study of bubble growth in basaltic foam. Nat. Commun. 3:1135. doi: 10.1038/ncomms2134
Burkhard, D. J. (2003). Thermal interaction between lava lobes. Bull. Volvanol. 65, 136–143. doi: 10.1007/s00445-002-0249-247
Burkhard, D. J. (2005). Nucleation and growth rates of pyroxene, plagioclase and Fe-Ti oxides in basalt under atmospheric conditions. Eur. J. Minral. 17, 675–685. doi: 10.1127/0935-1221/2005/0017-0675
Burkhard, D. J. M. (2001). Crystallization and oxidation of Kilauea basalt glass: processes during reheating experiments. J. Petrol. 42, 507–527. doi: 10.1093/petrology/42.3.507
Burkhard, D. J. M. (2002). Kinetics of crystallization: example of micro-crystallization in basalt lava. Contrib. Mineral. Petrol. 142, 724–737. doi: 10.1007/s00410-001-0321-x
Cashman, K. V. (1993). Relationship between plagioclase crystallization and cooling rate in basaltic melts. Contrib. Mineral. Petrol. 113, 126–142. doi: 10.1007/bf00320836
Castro, J. M., Beck, P., Tuffen, H., Nichols, A. R. L., Dingwell, B., and Martin, M. C. (2008). Timescales of spherulite crystallization in obsidian inferred from water concentration profiles. Am. Min. 93, 1816–1822. doi: 10.2138/am.2008.2904
Chakraborty, S. (1995). “Diffusion in silicate melts,” in Structure And Dynamics Of Silicate Melts. Review in Mineralogy and Geochemistry, eds J. F. Stebbins, D. B. Dingwell, and P. W. McMillan, (Cham: Springer), 441–497.
Couch, S. (2003). Experimental investigation of crystallization kinetics in a haplogranite system. Am. Min. 88, 1471–1485. doi: 10.2138/am-2003-1011
Deer, W. A., Howie, R. A., and Zussman, J. (1992). An Introduction To The Rock-Forming Minerals. Upper Saddle River, NJ: Prentice Hall.
Del Gaudio, P., Mollo, S., Ventura, G., Iezzi, G., Taddeucci, J., and Cavallo, A. (2010). Cooling rate-induced differentiation in anhydrous and hydrous basalts at 500 MPa: implications for the storage and transport of magmas in dykes. Chem. Geol. 270, 164–178. doi: 10.1016/j.chemgeo.2009.11.014
Fiege, A., Vetere, F., Iezzi, G., Simon, A., and Holtz, F. (2015). The roles of decompression rate and volatiles (H2O + Cl ± CO2 ± S) on crystallization in (trachy-) basaltic magma. Chem. Geol. 411, 310–322. doi: 10.1016/j.chemgeo.2015.07.016
Fokin, V. M., Yuritsyn, N. S., Zanotto, E. D., Schmelzer, J. W. P., and Cabral, A. A. (2008). Nucleation time-lag from nucleation and growth experiments in deeply undercooled glass-forming liquids. J. Non Crystal. Solids 354, 3785–3792. doi: 10.1016/j.jnoncrysol.2008.05.011
Fokin, V. M., Zanotto, E. D., and Schmelzer, J. W. P. (2003). Homogeneous nucleation versus glass transition temperature of silicate glasses. J. Non Crystal. Solids 321, 52–65. doi: 10.1016/S0022-3093(03)00089-89
Giuliani, L., Iezzi, G., and Mollo, S. (2020a). Dynamics of volcanic systems: physical and chemical models applied to equilibrium versus disequilibrium solidification of magmas. AGU Books 16, 373–418.
Giuliani, L., Iezzi, G., Vetere, F., Behrens, H., Mollo, S., Cauti, F., et al. (2020b). Evolution of textures, crystal size distributions and growth rates of plagioclase, clinopyroxene and spinel solidified at variable cooling rates from a mid-ocean ridge basaltic liquid. Earth Sci. Rev. 204:103165. doi: 10.1016/j.earscirev.2020.103165
Hammer, J. E. (2008). “Experimental studies of the kinetics and energetics of magma crystallization,” in Minerals, Inclusions and Volcanic Processes. Reviews in Mineralogy and Geochemistry, eds K. D. Putirka and F. J. Tepley, (Washington, DC: Mineralogical Society of America and Geochemical Society), 9–59. doi: 10.2138/rmg.2008.69.2
Hammer, J. E., and Rutherford, M. J. (2002). An experimental study of the kinetics of decompression-induced crystallization in silicic melt. J. Geophys. Res. 107:2021.
Higgins, M. D. (2000). Measurement of crystal size distributions. Am. Min. 85, 1105–1116. doi: 10.2138/am-2000-8-901
Higgins, M. D. (2006). Quantitative Textural Measurement In Igneous And Metamorphic Petrology. Cambridge: Cambridge University Press.
Iezzi, G., Elbrecht, A. L., Davis, M., Vetere, F., Misiti, V., Mollo, S., et al. (2017). Glass Stability (GS) of chemically complex (natural) sub-alkaline glasses. J. Non Crystal. Solids 477, 21–30. doi: 10.1016/j.jnoncrysol.2017.09.047
Iezzi, G., Mollo, S., Shaini, E., Cavallo, A., and Scarlato, P. (2014). The cooling kinetics of plagioclase revealed by electron microprobe mapping. Am. Min. 99, 898–907. doi: 10.2138/am.2014.4626
Iezzi, G., Mollo, S., Torresi, G., Ventura, G., Cavallo, A., and Scarlato, P. (2011). Experimental solidification of an andesitic melt by cooling. Chem. Geol. 283, 261–273. doi: 10.1016/j.chemgeo.2011.01.024
Iezzi, G., Mollo, S., and Ventura, G. (2009). “Solidification behavior of natural silicate melts and volcanological implications,” in Volcanoes: Formation, Eruptions And Modeling, eds N. Lewis and A. Moretti, (New York, NY: Nova publishers), 127–151.
Klein, L., Onorato, P. I. K., Uhlmann, D. R., and Hopper, R. W. (1975). Viscous flow, crystallization behavior and thermal histories of lunar breccias 70019 and 79155. Proc. Lunar. Sci. Conf. 4, 579–593.
Kolzenburg, S., Di Genova, D., Giordano, D., Hess, K. U., and Dingwell, D. B. (2018a). The effect of oxygen fugacity on the rheological evolution of crystallizing basaltic melts. Earth Planet. Sci. Lett. 487, 21–32. doi: 10.1016/j.epsl.2018.01.023
Kolzenburg, S., Giordano, D., Hess, K. U., and Dingwell, D. B. (2018b). Shear rate-dependent disequilibrium rheology and dynamics of basalt solidification. Geophys. Res. Lett. 45, 6466–6475. doi: 10.1029/2018GL077799
Kolzenburg, S., Giordano, D., Cimarelli, C., and Dingwell, D. B. (2016). In-situ thermal characterization of cooling/crystallizing lavas during rheology measurements and implications for lava flow emplacement. Geochim. Cosmochim. Acta 195, 244–258. doi: 10.1016/j.gca.2016.09.022
Kolzenburg, S., Hess, K. U., and Dingwell, D. B. (2020). Disequilibrium rheology and crystallization kinetics of basalts and implications for the Phlegrean volcanic District. Front. Earth Sci. 8:187. doi: 10.3389/feart.2020.00187
Kouchi, A., Tsuchiyama, A., and Sunagawa, I. (1986). Effect of stirring on crystallization kinetics of basalt: texture and element partitioning. Contrib. Min. Petrol. 93, 429–438. doi: 10.1007/bf00371713
Lange, R. A., Cashman, K. V., and Navrotsky, A. (1994). Direct measurements of latent heat during crystallization and melting of a ugandite and an olivine basalt. Contrib. Min. Petrol. 118, 169–181. doi: 10.1007/bf01052867
Lanzafame, G., Iezzi, G., Mancini, L., Lezzi, F., Mollo, S., and Ferlito, C. (2017). Solidification and turbulence (non-laminar) during magma ascent: insights from 2D and 3D analyses of bubbles and minerals in an Etnean dyke. J. Petrol. 58, 1511–1534. doi: 10.1093/petrology/egx063
Lanzafame, G., Mollo, S., Iezzi, G., Ferlito, C., and Ventura, G. (2013). Unravelling the solidification path of a pahoehoe “cicirara” lava from Mount Etna volcano. Bull. Volc. 75–4, 1–16. doi: 10.1007/s00445-013-0703-708
Lasaga, A. C. (1998). Kinetic theory in the Earth Sciences. New York, NY: Princenton university press.
Maumus, J., Bagdassarov, N., and Schmeling, H. (2005). Electrical conductivity and partial melting of mafic rocks under pressure. Geochim. Cosmochim. Acta 69, 4703–4718. doi: 10.1016/j.gca.2005.05.010
Mollo, S., and Hammer, J. E. (2017). “Dynamic crystallization in magmas,” in Mineral Reaction Kinetics: Microstructures, Textures, Chemical And Isotopic Signatures. EMU Notes in Mineralogy, eds W. Heinrich and R. Abart, (McLean: European Mineralogical Union), 1–46. doi: 10.1180/EMU-notes.16.12
Ni, H., Keppler, H., Walte, N., Schiavi, F., Chen, Y., Masotta, M., et al. (2014). In-situ observation of crystal growth in a basalt melt and development of crystal size distribution in igneous rocks. Contrib. Mineral. Petrol. 167:1003. doi: 10.1007/s00410-014-1003-9
Onorato, P. I. K., and Uhlmann, D. R. (1976). Nucleating heterogeneities and glass formation. J. Non Crystal. Solids 22, 367–378. doi: 10.1016/0022-3093(76)90066-1
Onorato, P. I. K., Uhlmann, D. R., and Hopper, R. W. (1980). A kinetic treatment of glass formation: IV. Crystallization on reheating a glass. J. Non Crystal. Solids 41, 189–200. doi: 10.1016/0022-3093(80)90164-7
Polacci, M., Arzilli, F., La Spina, G., Le Gall, N., Cai, B., Hartley, M. E., et al. (2018). Crystallization in basaltic magmas revealed via in situ 4D synchrotron X-ray microtomography. Sci. Rep. 8:8377. doi: 10.1038/s41598-018-26644-26646
Pupier, E., Duchene, S., and Toplis, M. J. (2008). Experimental quantification of plagioclase crystal size distribution during cooling of a basaltic liquid. Contrib. Mineral. Petrol. 155, 555–570. doi: 10.1007/s00410-007-0258-259
Ray, C. S., Reis, S. T., Brow, R. K., Höland, W., and Rheinberger, V. (2005). A new DTA method for measuring critical cooling rate for glass formation. J. Non Crystal. Solids 351, 1350–1358. doi: 10.1016/j.jnoncrysol.2005.03.029
Ray, C. S., Reis, S. T., Sen, S., and O’Dell, J. S. (2010). JSC-1A lunar soil simulant: characterization, glass formation, and selected glass properties. J. Non Crystal. Solids 356, 2369–2374. doi: 10.1016/j.jnoncrysol.2010.04.049
Rogez, J., Papin, S., Benigni, P., and Jousseaume, C. (2017). “Thermodynamic of the glassy and crystalline states-general kinetic to return to equilibrium,” in From Glass To Crystals. Nucleation, Growth And Phase Separation, From Research To Applications, eds D. R. Neuville, L. Cormier, D. Caurant, and L. Montagne, (France: EDP Sciences).
Roskosz, M., Toplis, M. J., and Richet, P. (2005). Experimental determination of crystal growth rates in highly supercooled aluminosilicate liquids. Implic. Rate Control. Process. Am. Min. 90, 1146–1156. doi: 10.2138/am.2005.1627
Scarlato, P., Poe, B. T., and Freda, C. (2004). High-pressure and high-temperature measurements of electrical conductivity in basaltic rocks from Mount Etna, Sicily, Italy. J. Geophys. Res. 109:B02210. doi: 10.1029/2003JB002666
Schiavi, F., Walte, N., and Keppler, H. (2009). First in-situ observation of crystallization processes in a basaltic-andesitic melt with the moissanite cell. Geology 37, 963–966. doi: 10.1130/G30087A.1
Sunagawa, I. (1992). In situ investigation of nucleation, growth and dissolution of silicate crystals at high temperatures. Annu. Rev. Earth. Planet. Sci. 20, 113–142. doi: 10.1146/annurev.ea.20.050192.000553
Tripoli, B., Manga, M., Mayeux, J., and Barnard, H. (2019). The effects of deformation on the early crystallization kinetics of basaltic magmas. Front. Earth. Sci. 7:250. doi: 10.3389/feart.2019.00250
Uhlmann, D. R., Klein, L., Onorato, P. I. K., and Hopper, R. W. (1975). The formation of lunar breccias: sintering and crystallization kinetics. Proc. Lunar Sci. Conf. 45, 693–705.
Uhlmann, D. R., Klein, L., Onorato, P. I. K., and Scherer, G. W. (1979). “A simplified model for glass formation,” in Proceedings of the Lunar and Planetary Science Conference, New York, NY.
Uhlmann, D. R., Yinnon, H., and Fang, C. H. (1981). “Simplified model evaluation of cooling rates for glass-containing lunar composition,” in Proceedings of the Lunar and Planetary Science Conference, Houston, TX.
Vetere, F., Iezzi, G., Behrens, H., Cavallo, A., Misiti, V., Dietrich, M., et al. (2013). Intrinsic solidification behavior of basaltic to rhyolitic melts: a cooling rate experimental study. Chem. Geol. 354, 233–242. doi: 10.1016/j.chemgeo.2013.06.007
Vetere, F., Iezzi, G., Behrens, H., Holtz, F., Ventura, G., Misiti, V., et al. (2015). Glass forming ability and crystallization behavior of sub-alkaline silicate melts. Earth Sci. Rev. 150, 25–44. doi: 10.1016/j.earscirev.2015.07.001
Vetere, F., Mazzeo, A., Perugini, D., and Holtz, F. (2020). Viscosity behaviour of silicate melts during cooling under variable shear rates. J. Non Crystal. Solids 477, 21–30.
Vona, A., and Romano, C. (2013). The effect of undercooling and deformation rates on the crystallization kinetics of Stromboli and Etna basalts. Contrib. Mineral. Petrol. 166, 491–509. doi: 10.1007/s00410-013-0887-880
Vona, A., Romano, C., Dingwell, D. B., and Giordano, D. (2011). The rheology of crystal-bearing basaltic magmas from Stromboli and Etna. Geochim. Cosmochim. Acta 75, 3214–3236. doi: 10.1016/j.gca.2011.03.031
Wang, L., Liu, B., Li, H., Yang, W., Ding, Y., Sinogeikin, S. V., et al. (2012). Long-range ordered carbon clusters: a crystalline material with amorphous building blocks. Science 337:825. doi: 10.1126/science.1220522
Weinberg, M. C., and Zanotto, E. (1989). Re-examination of the temperature dependence of the classical nucleation rate: homogeneous crystal nucleation in glass. J. Non Crystal. Solids 108, 99–108. doi: 10.1016/0022-3093(89)90337-2
Xu, Y., Shankland, T. J., and Poe, B. T. (2000). Laboratory-based electrical conductivity in the Earth’s mantle. J. Geophys. Res. 105, 895–827.
Zanatta, M., Cormier, L., Hennet, L., Petrillo, C., and Sacchetti, F. (2017). Real-time observation of the isothermal crystallization kinetics in a deeply supercooled liquid. Sci. Rep. 7:43671. doi: 10.1038/srep43671
Zhang, Y., Xu, Z., and Liu, Y. (2003). Viscosity of hydrous rhyolitic melts inferred from kinetic experiments, and a new viscosity model. Am. Min. 88, 1741–1752. doi: 10.2138/am-2003-11-1215
Zheng, Q., Zhang, Y., Montazerian, M., Gulbiten, O., Mauro, J. C., Zanotto, E. D., et al. (2019). Understanding glass through differential scanning calorimetry. Chem. Rev. 119, 7848–7939. doi: 10.1021/acs.chemrev.8b00510
Keywords: basalt, DSC, in situ crystallization, texture, TTT diagram
Citation: Giuliani L, Iezzi G, Hippeli T, Davis M, Elbrecht A, Vetere F, Nazzari M and Mollo S (2020) The Onset and Solidification Path of a Basaltic Melt by in situ Differential Scanning Calorimetry (DSC) and ex situ Investigations. Front. Earth Sci. 8:337. doi: 10.3389/feart.2020.00337
Received: 07 February 2020; Accepted: 20 July 2020;
Published: 04 August 2020.
Edited by:
Yigang Xu, Chinese Academy of Sciences, ChinaReviewed by:
Huaiwei Ni, University of Science and Technology of China, ChinaAlexandra Yang Yang, Chinese Academy of Sciences, China
Copyright © 2020 Giuliani, Iezzi, Hippeli, Davis, Elbrecht, Vetere, Nazzari and Mollo. This is an open-access article distributed under the terms of the Creative Commons Attribution License (CC BY). The use, distribution or reproduction in other forums is permitted, provided the original author(s) and the copyright owner(s) are credited and that the original publication in this journal is cited, in accordance with accepted academic practice. No use, distribution or reproduction is permitted which does not comply with these terms.
*Correspondence: Letizia Giuliani, bGV0aXppYS5naXVsaWFuaUB1bmljaC5pdA==