 Reyce Bogardus
 Christopher Maio
 Owen Mason
 Richard Buzard
 Andrew Mahoney
 Cary de Wit
- 1Arctic Coastal Geoscience Laboratory (ACGL), University of Alaska Fairbanks, Fairbanks, AK, United States
- 2Institute of Arctic and Alpine Research (INSTAAR), University of Colorado Boulder, Boulder, CO, United States
- 3Geophysical Institute, University of Alaska Fairbanks, Fairbanks, AK, United States
- 4Geography Program, University of Alaska Fairbanks, Fairbanks, AK, United States
During the winter of 2016, anomalous sea ice conditions and a powerful storm culminated in a destructive erosion event along the Chukchi Sea coastline of Cape Espenberg, Alaska. This event is commonly referred to as an “ice push” or “ivu,” the Inupiat word for an ice ridging event. In this article, we report the process and impact of this event by combining traditional ecological knowledge, news accounts, meteorological data, remote sensing, and ground surveys. The midwinter detachment of shorefast ice was caused by a low-pressure system and wind-driven swell that destabilized shorefast ice, while northerly winds developed an open-water lead offshore to the eventual impact area. These conditions preceded the impact of an extratropical cyclone on December 31, 2016, when powerful southerly winds and the second largest storm surge in Kotzebue Sound since at least 2003 led to the compressional failure of the ice cover under uniaxial loading perpendicular to the southern coastline of the Cape, resulting in the ice push event. Ice-pushed debris was shoved up to 6.2 m above mean high water, with ∼3.5 km of coastline experiencing net erosion. The largest accumulation of ice-pushed debris had a volume of 1,000 m3, and rose 3 + m above the surrounding ground surface even after roughly 6 months of melting. On low-lying areas, driftwood and other debris were deposited 130 m landward by the surge 5.0 m above mean high water, indicating the potential threat of such events to property, infrastructure, and, in this case, archeological sites and associated cultural resources. The anomalous environmental and sea ice conditions that preceded the ivu seem to suggest that such events may occur more frequently in a warmer Arctic.
Introduction
Contemporary warming in the Chukchi and Beaufort Seas is contributing toward coastal change in Alaska, especially related to the decline in pack and landfast ice (Mahoney, 2018; Vermaire et al., 2013). Synthetic aperture radar (SAR) indicates that landfast ice is forming later and disappearing earlier by approximately 1 week per decade along the Chukchi and Beaufort Sea coasts (Mahoney et al., 2014). The implications of which are important to consider, given that the increase in open water days leads to a greater likelihood of destructive coastal hazards, including ice push events (Mahoney et al., 2004).
These movements of sea ice onshore are termed “ice push,” “ice shove,” or “ice ride-up” events (Kovacs, 1984; Shapiro et al., 1984; Kovacs and Sodhi, 1988; Mahoney et al., 2004) and are referred to in this article generally as either “ivu” or “ice push” (Mason et al., 1997b). Documented impacts of these events include destruction of property and cultural resources (Kinsman and DeRaps, 2012) and impeding safe travel (Sodhi et al., 1983). There is also archeological evidence suggesting an ivu may have caused loss of life (Zimmerman and Aufderheide, 1984). An extensive survey of ice push events by Kovacs and Sodhi (1980) indicates they span a scale between what are called ice ride-ups and ice pile-ups. Ice ride-up events are characterized by largely intact sheets of ice advancing up the shoreface, sometimes hundreds of meters inland (Brower, 1960). However, ice pile-up events involve the build-up of fragmented blocks of sea ice incorporated with nearshore sediments and debris into elevated piles. Compared to ride-up events, they have a limited landward extent and are typically greater in elevation (Sodhi et al., 1983). Both processes often occur in combination, depending on the friction of the littoral zone, beach slope, and topography, as well as the integrity, or thickness, of the ice (Sodhi et al., 1983; Barker and Timco, 2016). Ice ride-up and pile-up events can occur throughout the year but are more common in the fall (October–November) or spring (May–June) when there are less stable ice conditions (Leffingwell, 1919; Kovacs and Sodhi, 1980). On local scales, the seasonal evolution of landfast ice formation, stabilization, and break-up is heavily influenced by both geographic setting and pronounced interannual variability (Mahoney et al., 2014).
The destabilization of shorefast ice is a complex interaction of many dynamic processes, including wind forces, currents, local sea-level change, and pack ice interaction (e.g., Gilbert and Glew, 1986; Gilbert, 1991; George et al., 2004; Mahoney et al., 2007; Jones et al., 2016). Once the landfast ice is destabilized along a given stretch of coastline, a number of physical processes must take place in order for an ice push to occur. Most importantly, landward momentum must be transferred to the ice at the shoreline such that resistive forces in the nearshore (e.g., gravity, friction) are overcome (Sodhi et al., 1983; Mahoney et al., 2004). This can be caused by stresses due to wind and/or current or a drifting ice floe with substantial kinetic energy (Christensen, 1994; Barker and Timco, 2017). The morphology of the coast may also concentrate momentum transfer at particular stretches of shoreline (Kovacs and Sodhi, 1980).
Because of the episodic occurrence of ivu and the remoteness of Arctic coastlines, they are selectively surveyed when they occur near natural resource and/or residential infrastructure in the region (Leffingwell, 1919; Barker and Timco, 2017). Accordingly, this article documents a significant ivu event (Figure 1) that occurred on a remote stretch of shoreline along the Chukchi Sea at Cape Espenberg, which advances the understanding of the occurrence and implications of these coastal hazards. Specific research objectives were as follows: (1) to map the spatial extent of the affected coastline and document its geomorphic impacts, (2) to determine the environmental conditions and chronology of events that led to the ivu, and (3) to contribute toward a better understanding of ice push events in regard to recent warming trends in the Arctic.
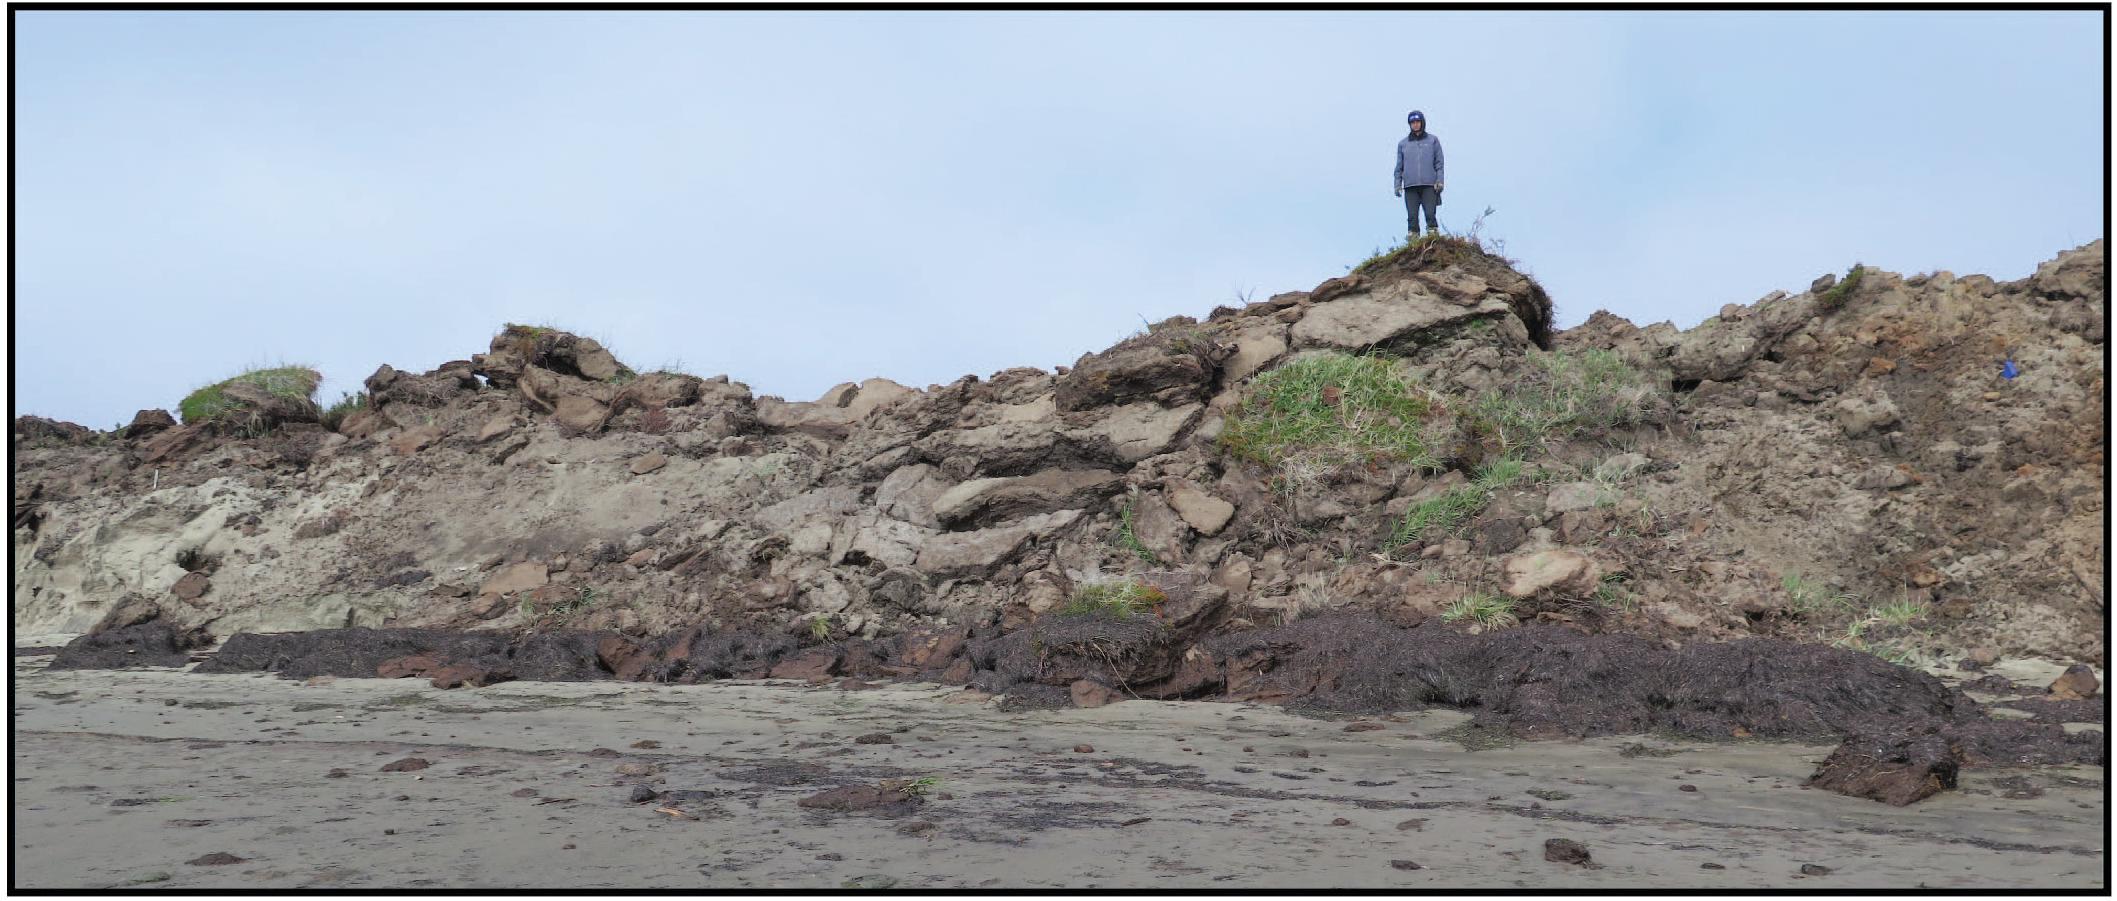
Figure 1. Remnants of the ivu along the eastern portion of coastline as observed on July 22, 2017, 7 months after its occurrence. The ivu eroded nearshore and bluff sediments placing them in large piles along the coastline. A member of the science party is shown for scale.
Study Site
The Cape Espenberg dune and beach ridge plain is a mainland-attached spit in a microtidal setting dominated by longshore currents that transport sediments along the Cape toward the northern tip of the Seward Peninsula (Figure 2). The site is part of the Bering Land Bridge National Preserve, managed by the National Park Service, and has a history of multidisciplinary research (National Park Service [NPS], 2020). Multiple stratigraphic and sedimentological investigations have been carried out at the site spanning over 25 years (Mason and Jordan, 1993; Mason et al., 1997a; Alix et al., 2017; Maio et al., 2017, 2018). The Cape has a mean annual temperature of about −5°C (23°F) (Stewart et al., 2013), favoring the development of permafrost 20–90 cm below the ground surface (Mason et al., 1997a; Hoffecker and Mason, 2010; Jones et al., 2012). There is persistent sea ice cover offshore between roughly November and May, which has been stable until recent decades (Mahoney et al., 2014). Annually, the shallow Espenberg Lagoon is among the first stretches of water to freeze within Kotzebue Sound (Mason et al., 1997a). The routes of cyclones that impact the area typically follow two tracks: (1) north/north–northeastward following the coast of Siberia; (2) northeastward, across the Aleutian Islands, into the Bering Sea and continuing northward through the central Bering Sea (Mesquita et al., 2010). These storms can produce winds up to 35 m s–1 (78 mph) with hurricane force gusts up to 45 m s–1 (100 mph), wind waves exceeding 10 m, and local surge plus wave water levels upward of 7 m (Sallenger, 1983; Kowalik, 1984; Johnson and Kowalik, 1986; Mason et al., 1996; Blier et al., 1997).
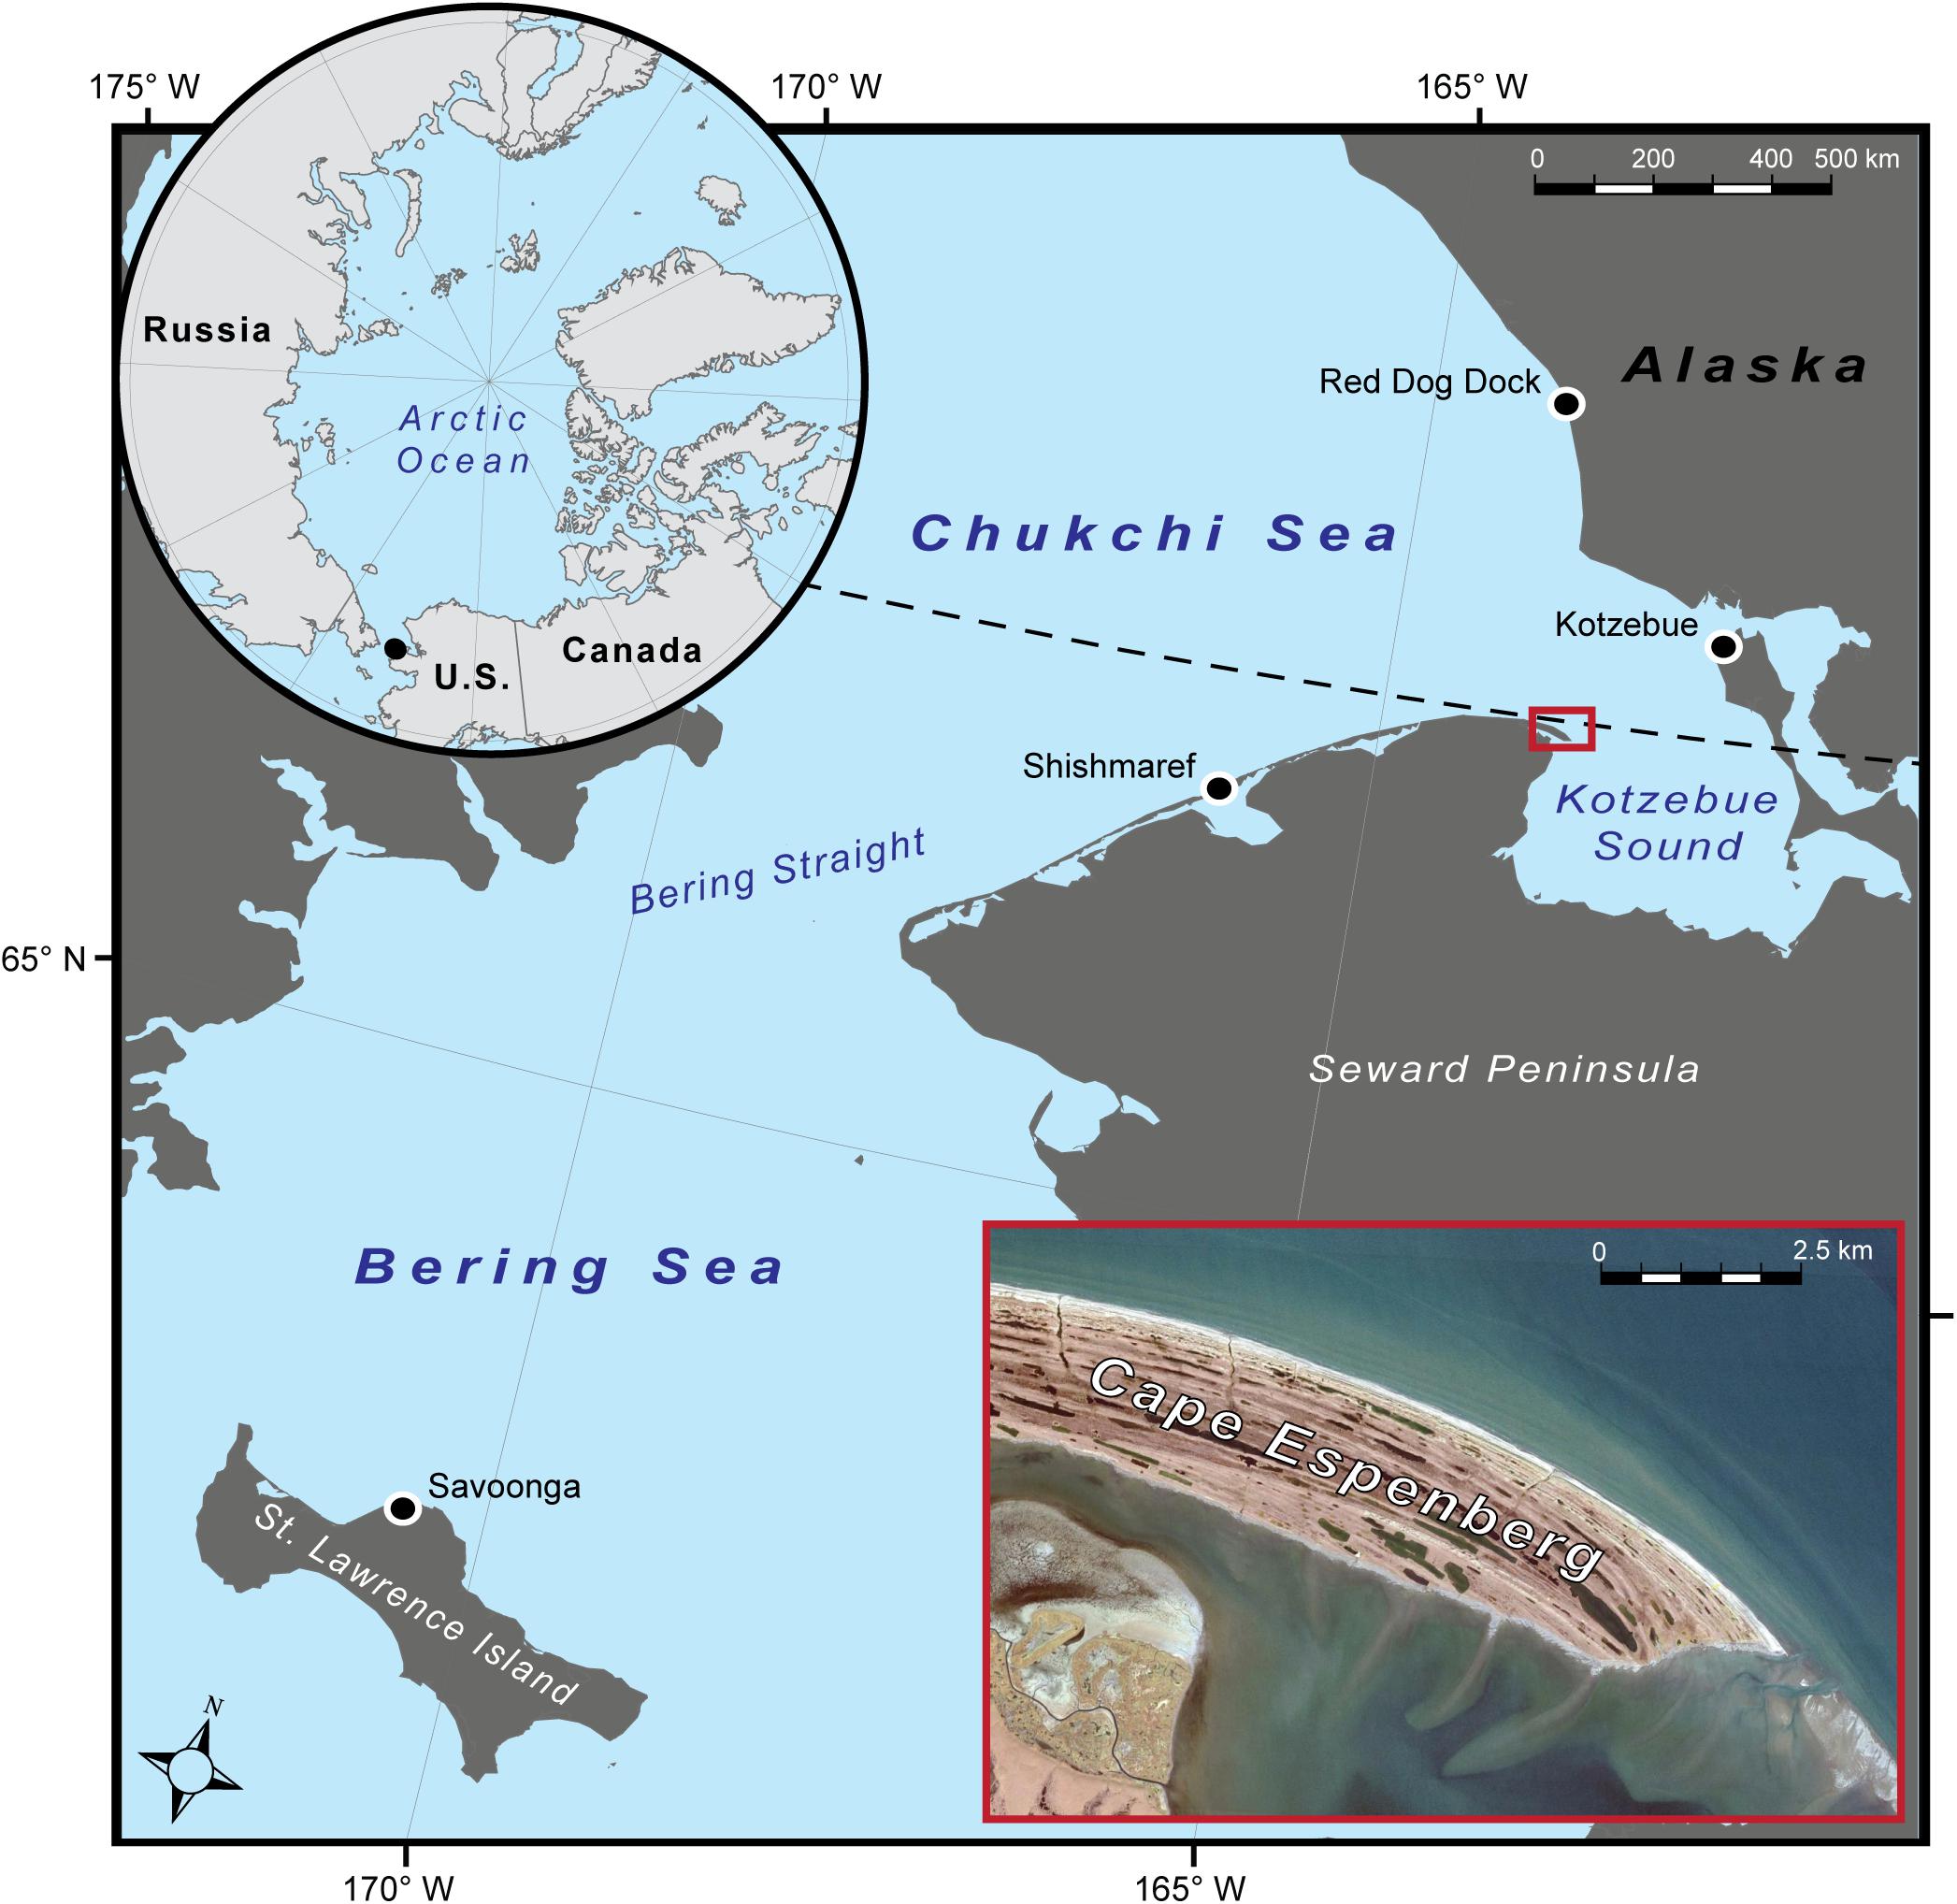
Figure 2. Map showing the Cape Espenberg barrier spit. The Cape is located along the Arctic Circle (dashed line) on the northern tip of the Seward Peninsula, Alaska (red box), within Kotzebue Sound.
Generally speaking, the Cape Espenberg barrier is composed of fine to medium sand with the fines being easily mobilized from the beach landward by northwesterly winds during the fall storm season (Mason and Jordan, 1993; Mason et al., 1997a). The study site area is divided into three sections including eastern, central, and western areas (Figure 3). The three sections were categorized based on clear differences in their morphology and the nature of geomorphic impacts imposed by the ice push event (Figure 3). The eastern section is marked by bluffs 3–5 m in height, alternating between cross-shore dune ridges and lower elevation swales that primarily consist of unconsolidated wind-blown sand, fronted by a very shallow offshore tidal flat (<1 m water depth for at least 2 km seaward) (Mason et al., 1997a). The central area is also fronted by shallow water (<1 m) and lacks the higher elevation beach ridges of the eastern and western sections. This lower elevation trough has only a few low relief dune ridges, with most of the area covered by a marsh and series of small ponds (Mason et al., 1997a). The sediment stratigraphy in the central area generally includes marine sand capped by 10–70 cm of marsh peat (Alix et al., 2017). Along the western section, there are greater offshore water depths (≤3 m) and a considerably steeper bluff face, which runs alongshore the Cape’s dune ridges in places truncating these high relief features. There are much older and more developed soil horizons in the western section, with the upper 50–90 cm being primarily composed of organic rich peat with an underlying matrix of wind-blown sand and silt (Mason et al., 1997a; Alix et al., 2017). The active layer at this location loosely corresponds to this organic (peat) to inorganic (sand and silt) stratigraphic horizon (Mason et al., 1997a).
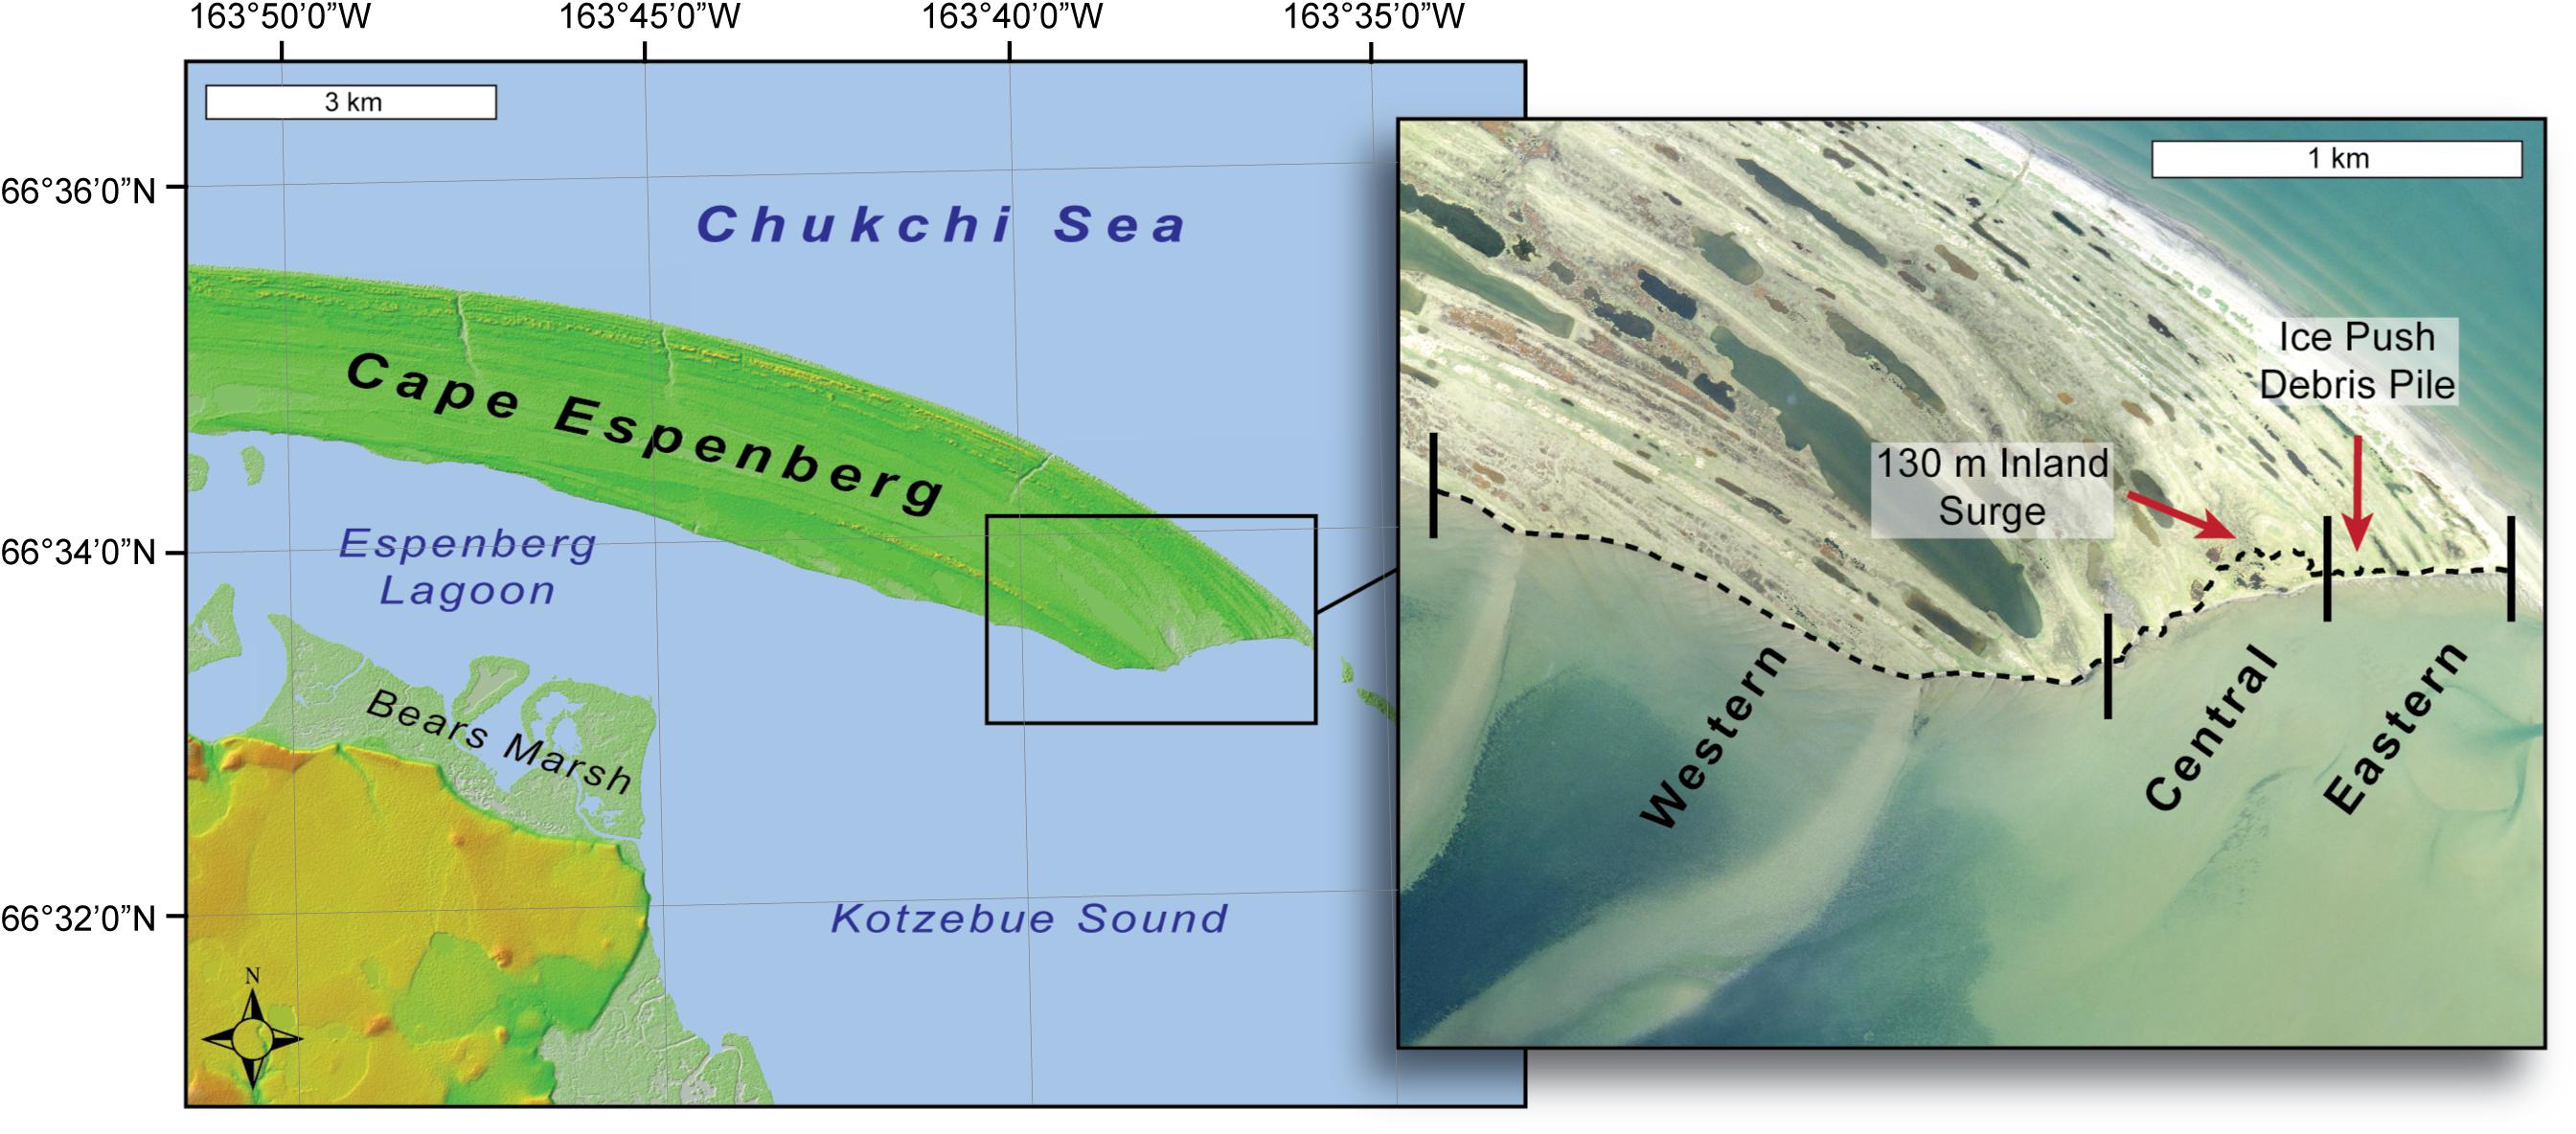
Figure 3. Map showing the area impacted by the 2017 Cape Espenberg ivu. The map on the left uses elevation data from the ArcticDEM, created by the Polar Geospatial Center from DigitalGlobe, Inc., imagery (Porter et al., 2018). The insert map on the right shows the surveyed, spatial extent of the impacted coastline (dashed line) and denotes the Eastern, Central, and Western sections discussed in the text with vertical black lines. The 1,000 m3 ice-push debris pile that impacted cultural resources and the maximum inland extent of the storm surge is marked with the red arrows.
Materials and Methods
To identify the specific timing of the ivu event and place it in the context of locally observed coastal processes, we utilized a combination of ground surveys; traditional ecological knowledge; news reports; and meteorological, water level, and SAR data. Field work and mapping were conducted in July 2017. This involved photographing and surveying the linear and vertical extent of the ivu deposits. The research team also interviewed a local environmental knowledge holder from the Alaska Native community of Shishmaref, to provide a longer-term context for sea ice–related disturbances in the area. Following the field work, we obtained remotely sensed sea ice data, local news accounts, and meteorological data and held discussions with National Weather Service (NWS) meteorologists to elucidate when and how this event occurred.
Ground Survey and Tidal Datum
The inland extent of the storm surge and volume of the main ice push feature was quantified using a Real-Time Kinematic Global Navigation Satellite System (RTK-GNSS) (Figure 3). To determine the maximum inland extent and area of the ice push, continuous rover data (1-s intervals) were collected along the well-defined wrack line and/or sediment deposits overlaying terrestrial vegetation. A gridded survey was carried out to calculate the volume of the largest ice-shoved debris pile, located within the eastern section. Empirical Bayesian kriging was used to interpolate the 4,234 postprocessed elevation points over the 3,429 m2 area, equating to an average sampling density of 1.2 points per m2. The interpolated elevation surface was then compared to a 20 cm2 resolution 2016 Digital Surface Model provided by Fairbanks FODAR (Fairbanks FODAR, 2020). To relate survey elevations to local mean high water (MHW), a tidal datum was produced by JOA Surveys, LLC (Joa Surveys LLC, 2020) based on 3 weeks of HOBO water-level data collected during the 2017 field work season. The National Oceanic and Atmospheric Administration (NOAA) tide station at the Red Dog Dock (9491094) was used as the control (National Oceanic and Atmospheric Administration [NOAA], 2020). In addition to the elevation data, more than 300 photographs were taken to document the physical remnants and impacts of the ivu, and a thaw depth probe was used along the stretch of impacted coastline to verify active layer thickness. Sediment type and relative grain size were noted as was the presence of marine debris such as shells, driftwood, and eelgrass. Additional photographs were taken to capture morphological changes that had occurred since the event, including drainage patterns and thermokarst features.
Shoreline Change Analysis
To quantify shoreline change caused by the ivu, the vegetation line (vegline) was selected as the shoreline indicator as it is easily discernable on the ground and in aerial imagery, and there is no inherent error due to tidal fluctuations and/or swash action as is the case with other indicators such as the high water line (Pajak and Leatherman, 2002; Boak and Turner, 2005; Buzard et al., submitted). Along the south-facing tip of Cape Espenberg, the vegline closely corresponds to the bluff edge, and a loss of vegetation often correlates to erosion, especially when it is related to individual storm events (e.g., Boak and Turner, 2005; Maio et al., 2012). A drawback in using the vegline for remote-sensing analyses is that there is a lag time between beach accretion and the seaward expansion of insipient vegetation (e.g., Boak and Turner, 2005; Keijsers et al., 2015; Buzard et al., submitted), although this phenomenon is accounted for in our case, given that the 2017 vegline was derived from the ground surveys and is supplemented with field observations and photographs.
To create a 2017 vegline, the feature was surveyed with the RTK-GNSS during the summer 2017 field work (e.g., Zarillo et al., 2008). The 2016 vegline was manually delineated within a geographic information system over a 10 cm2 orthorectified aerial mosaic collected in August 2016 (Fairbanks FODAR, 2020). Net shoreline movement (NSM) (total distance of shoreline movement) was calculated using the USGS Digital Shoreline Analysis System (DSAS) by casting cross-shore virtual transects at 5 m intervals between the 2016 and 2017 veglines (Himmelstoss et al., 2018). Error estimates in NSM values were calculated using the “square root of the sum of squares” method considering the digitizing uncertainty with regard to the 2016 orthomosaic (10 cm), as well as horizontal movements of the GNSS receiver antenna during the 2017 survey (up to 25 cm) (Ruggiero et al., 2013; Weaver et al., 2015). The same uncertainty range (± 0.27) is used for each transect, given that our analysis used veglines from only two dates and that the sources of uncertainty listed above were not spatially variable. DSAS analysis was only carried for the central and eastern sections, as the western stretch was not included in the extent of the 2016 aerial imagery. Observations along the western stretch are based off field surveys and photography, as described below. Because of the lack of any significant (>1 m) surge events between when the Cape Espenberg coast became ice-free and when the RTK survey was carried out (National Oceanic and Atmospheric Administration [NOAA], 2016), it is assumed that the calculated shoreline change is primarily attributable to the 2016 ice push event.
SAR Analysis
Satellite-derived copolarized vertical transmission and reception (VV) and horizontal transmission and reception (HH) SAR data (Table 1) from the Alaska Satellite Facility’s data portal1 (Alaska Satellite Facility [ASF], 2019) was used to analyze sea ice conditions in Kotzebue Sound from the time of first ice formation until after the ice push event at Cape Espenberg (Figure 4). We distinguished ice from open water based on backscatter signatures in the C-band (5.6 cm wavelength), using the principles described and illustrated by Jackson and Apel (2004). Because ice and ocean surfaces can exhibit similar backscatter magnitudes depending on wind conditions and ice type, we based our analysis on the geometry and textures of features in the imagery and their relationship to the coastline, rather than the values of individual pixels. Landfast ice was distinguished by its adjacency to the shoreline and lack of discernible motion between consecutive SAR scenes, which ranged between 2 and 15 days (e.g., Mahoney et al., 2014). Ridges and rubble piles were recognized as curvilinear features with high backscatter in both HH and VV caused by multiple surfaces oriented toward the SAR sensor (Onstott and Carsey, 1992; Jackson and Apel, 2004). Cracks in the ice were identified as high backscatter features when the exposed ice faces on the far side of the cracks were oriented perpendicular to the sensor relative to the orbit or view direction of the SAR satellite (Jackson and Apel, 2004; Dammann et al., 2018).
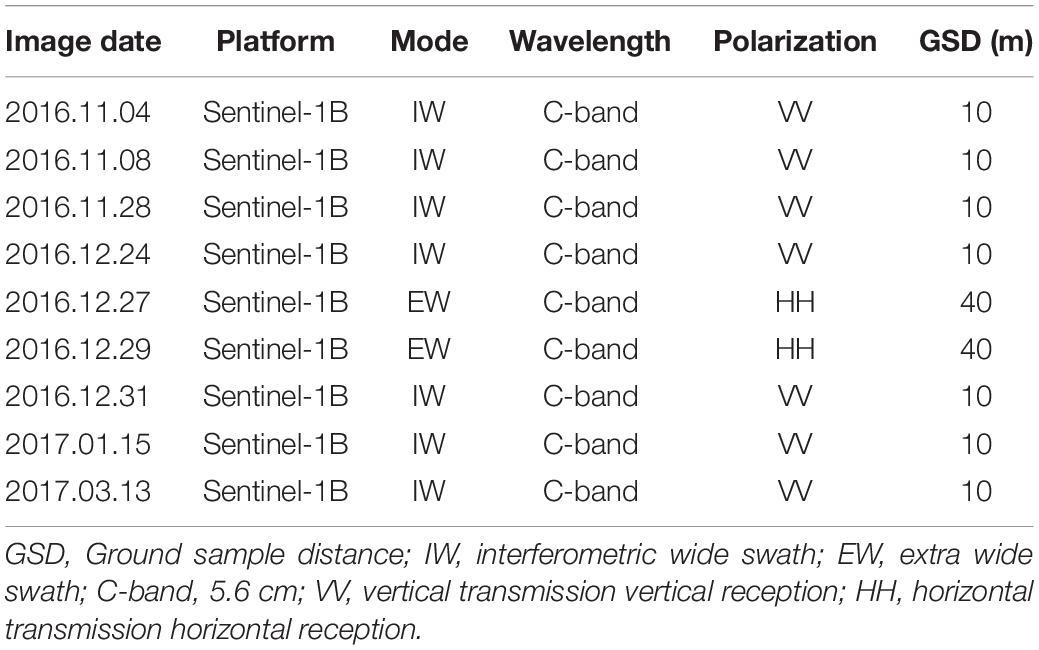
Table 1. Selected synthetic aperture radar datasets used to identify changes to sea ice conditions around the time of the ivu.
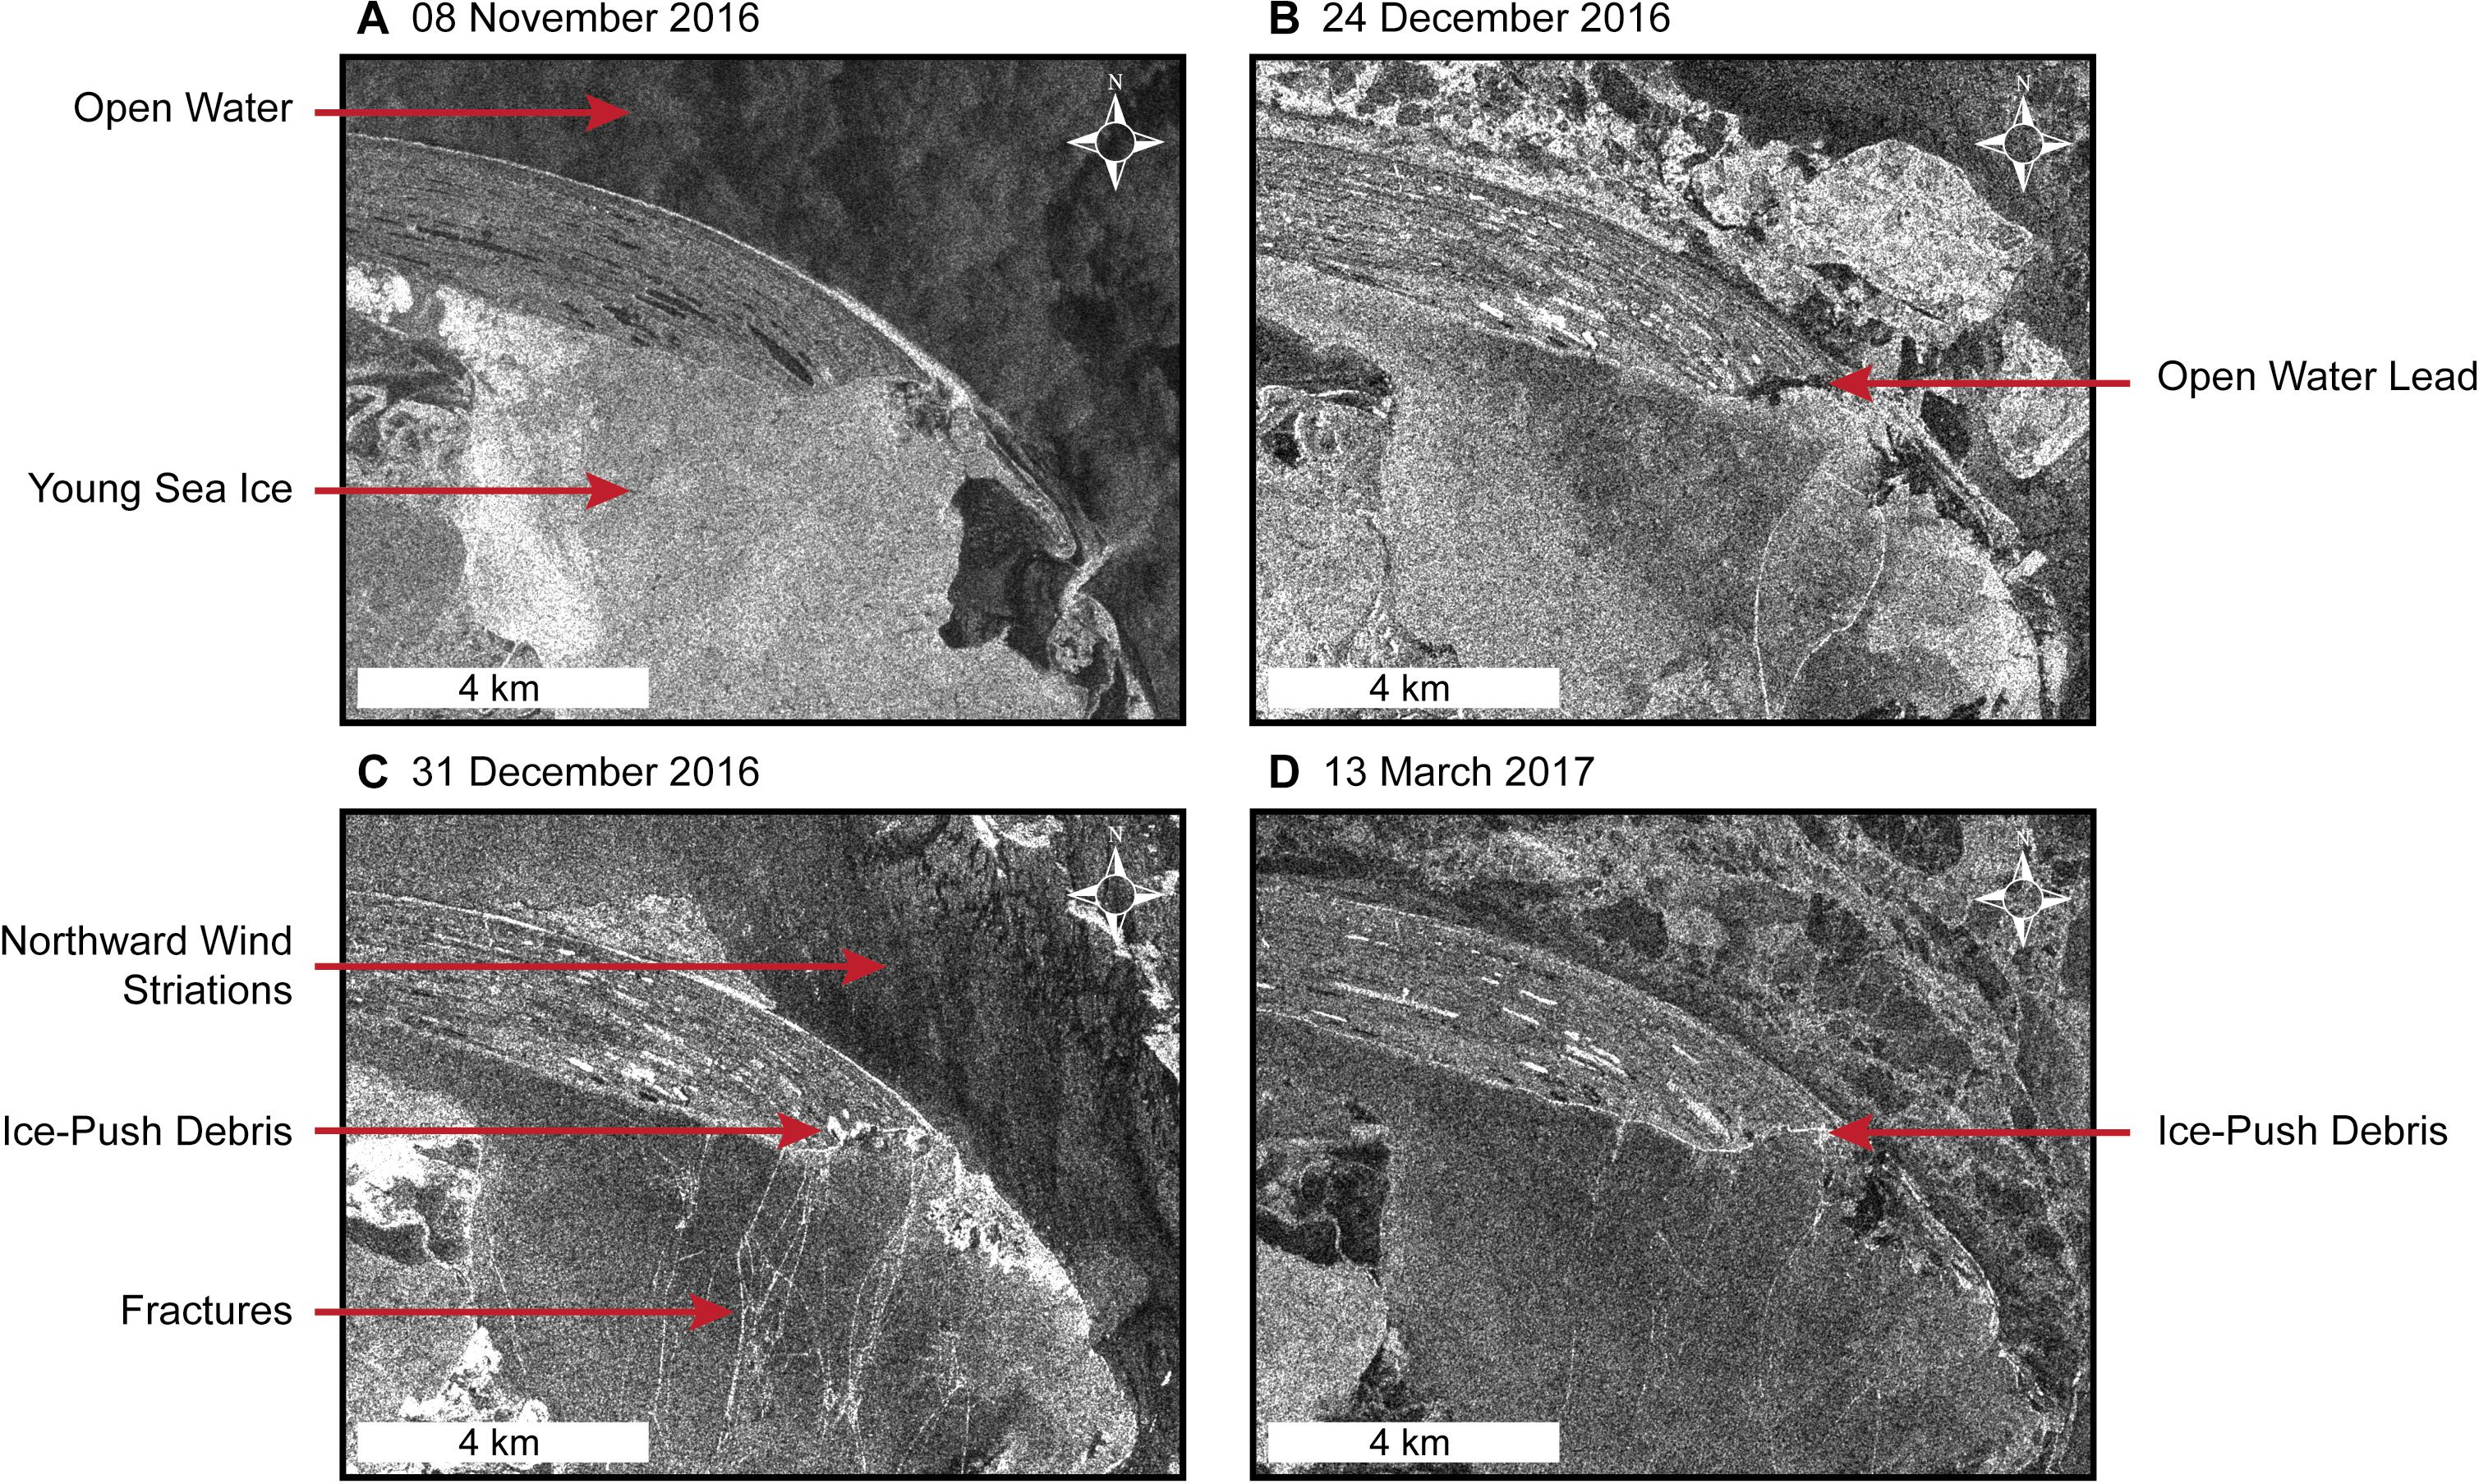
Figure 4. Wide swath VV-polarized C-band synthetic aperture radar (SAR) data of the Cape Espenberg area. Backscatter intensity (unitless) is stretched over a continuous 16-bit black (low) to white (high) color gradient. A standard deviation (n = 2) and gamma stretch (0.832) has also been applied to highlight relative differences in backscatter intensity. (A) On November 8, open water is observed along the outer coastline, while within the Espenberg Lagoon the first sea ice of the season begins to form. (B) On 24 December, an open-water lead is visible along the affected coastline on the southern tip of Cape Espenberg, as well as bright linear features in the sea ice within the lagoon. (C) On 31 December, wind striations indicate a northward wind direction, whereas ice push debris is clearly visible (white areas) in the area landward of the open-water lead shown in (B). Large ice fractures are also visible indicating the direction of ice movement. (D) On March 13, ice push debris is still visible approximately 6 weeks after deposition.
Water-Level Data
Water-level data for NOAA tide station 9491094 at the Red Dog Dock, 115 km to the north of Cape Espenberg (Figure 2), were compiled from NOAA’s Tides and Currents web viewer2. The Red Dog Dock station is the closest to Cape Espenberg and has been the only continuously operating, vertically referenced water-level sensor in Kotzebue Sound since it was installed in August 2003 (National Oceanic and Atmospheric Administration [NOAA], 2020). The station also provided further control for the tidal datum computed from the 3 week HOBO water level survey collected for this study. Water-level elevations at 6 min intervals were plotted relative to MHW between 1 October 2016 and 31 January 2017 in order to show the extent of surge during the 31 December storm relative to the rest of the 2016 storm season (Figure 5). To provide context to this event, the 31 December water-level extent was also compared with the entire operating history of the station over the last 17 years.
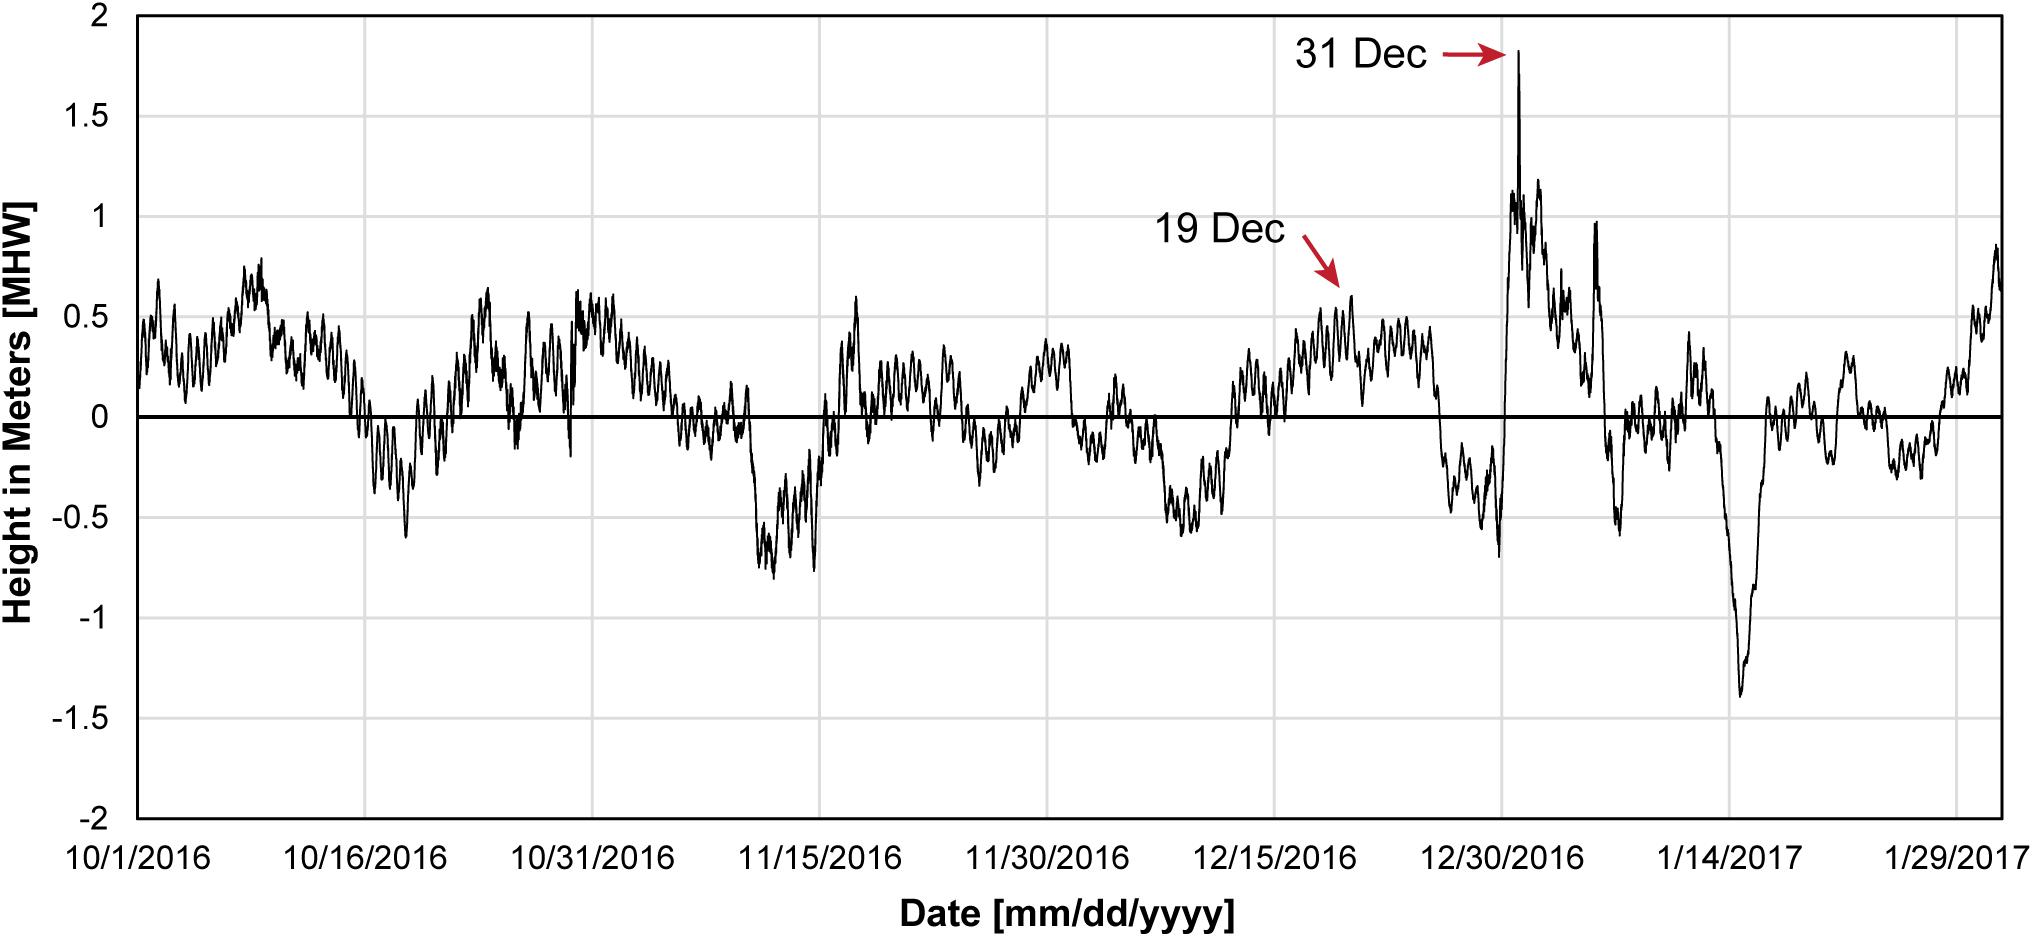
Figure 5. Water-level data for NOAA tide station 9491094 at the Red Dog Dock, located 115 km to the north of Cape Espenberg, between 1 October 2016 and 31 January 2017. Water levels are shown in meters relative to mean high water (MHW), the average of all the high water heights at the station observed over the current national tidal datum epoch (NTDE) (1983–2001). The 31st December surge is the second largest recorded since the station began operation in August 2003 (National Oceanic and Atmospheric Administration [NOAA], 2020).
Given the distance between Cape Espenberg and the Red Dog Dock, it is difficult to verify the timing and magnitude of the storm surge at Cape Espenberg. However, it has been well documented that debris line elevations provide an accurate estimate for total water levels, which include all individual components that contribute to water level: wave setup, wave run-up, barometric bulge, and astronomical tide (Sallenger, 1983; Blier et al., 1997). At Cape Espenberg, the surveyed debris line served as a proxy for the total water levels from the storm event (Blier et al., 1997).
Meteorological Data
To contextualize the oceanographic and meteorological conditions that forced the onshore movement of sea ice at Cape Espenberg, mean sea-level pressure (MSLP) and wind direction and speed (Figures 6, 7) were obtained from the ERA-5 atmospheric reanalysis provided by the European Centre for Medium-Range Weather Forecasts3 (Copernicus Climate Change Service (C3S), 2017). MSLP plots were derived by contouring sea-level atmospheric pressure at 2 hPa intervals over an area bounded between 68.7077° to 63.3131° N and −177.5301° to −161.5125°W. To represent atmospheric structure and dynamics between 18 December 2016 and 1 January 2017, a single time each day (23:00 Zulu time) was selected for visualization. Wind rose diagrams were derived by making daily histograms from the combined hourly zonal and meridional wind vector components at 10 m altitude of one ERA-5 cell at the Cape (66.5500°N, −163.6400°W) over the same timeframe. Daily temperature observations recorded by the NWS meteorological station at Ralph Wien Memorial Airport (PAOT) in Kotzebue, AK (66.9°N, 162.59°W), between 1 December 2016 and 31 January 2017 were compiled using Weather Underground’s web viewer4.
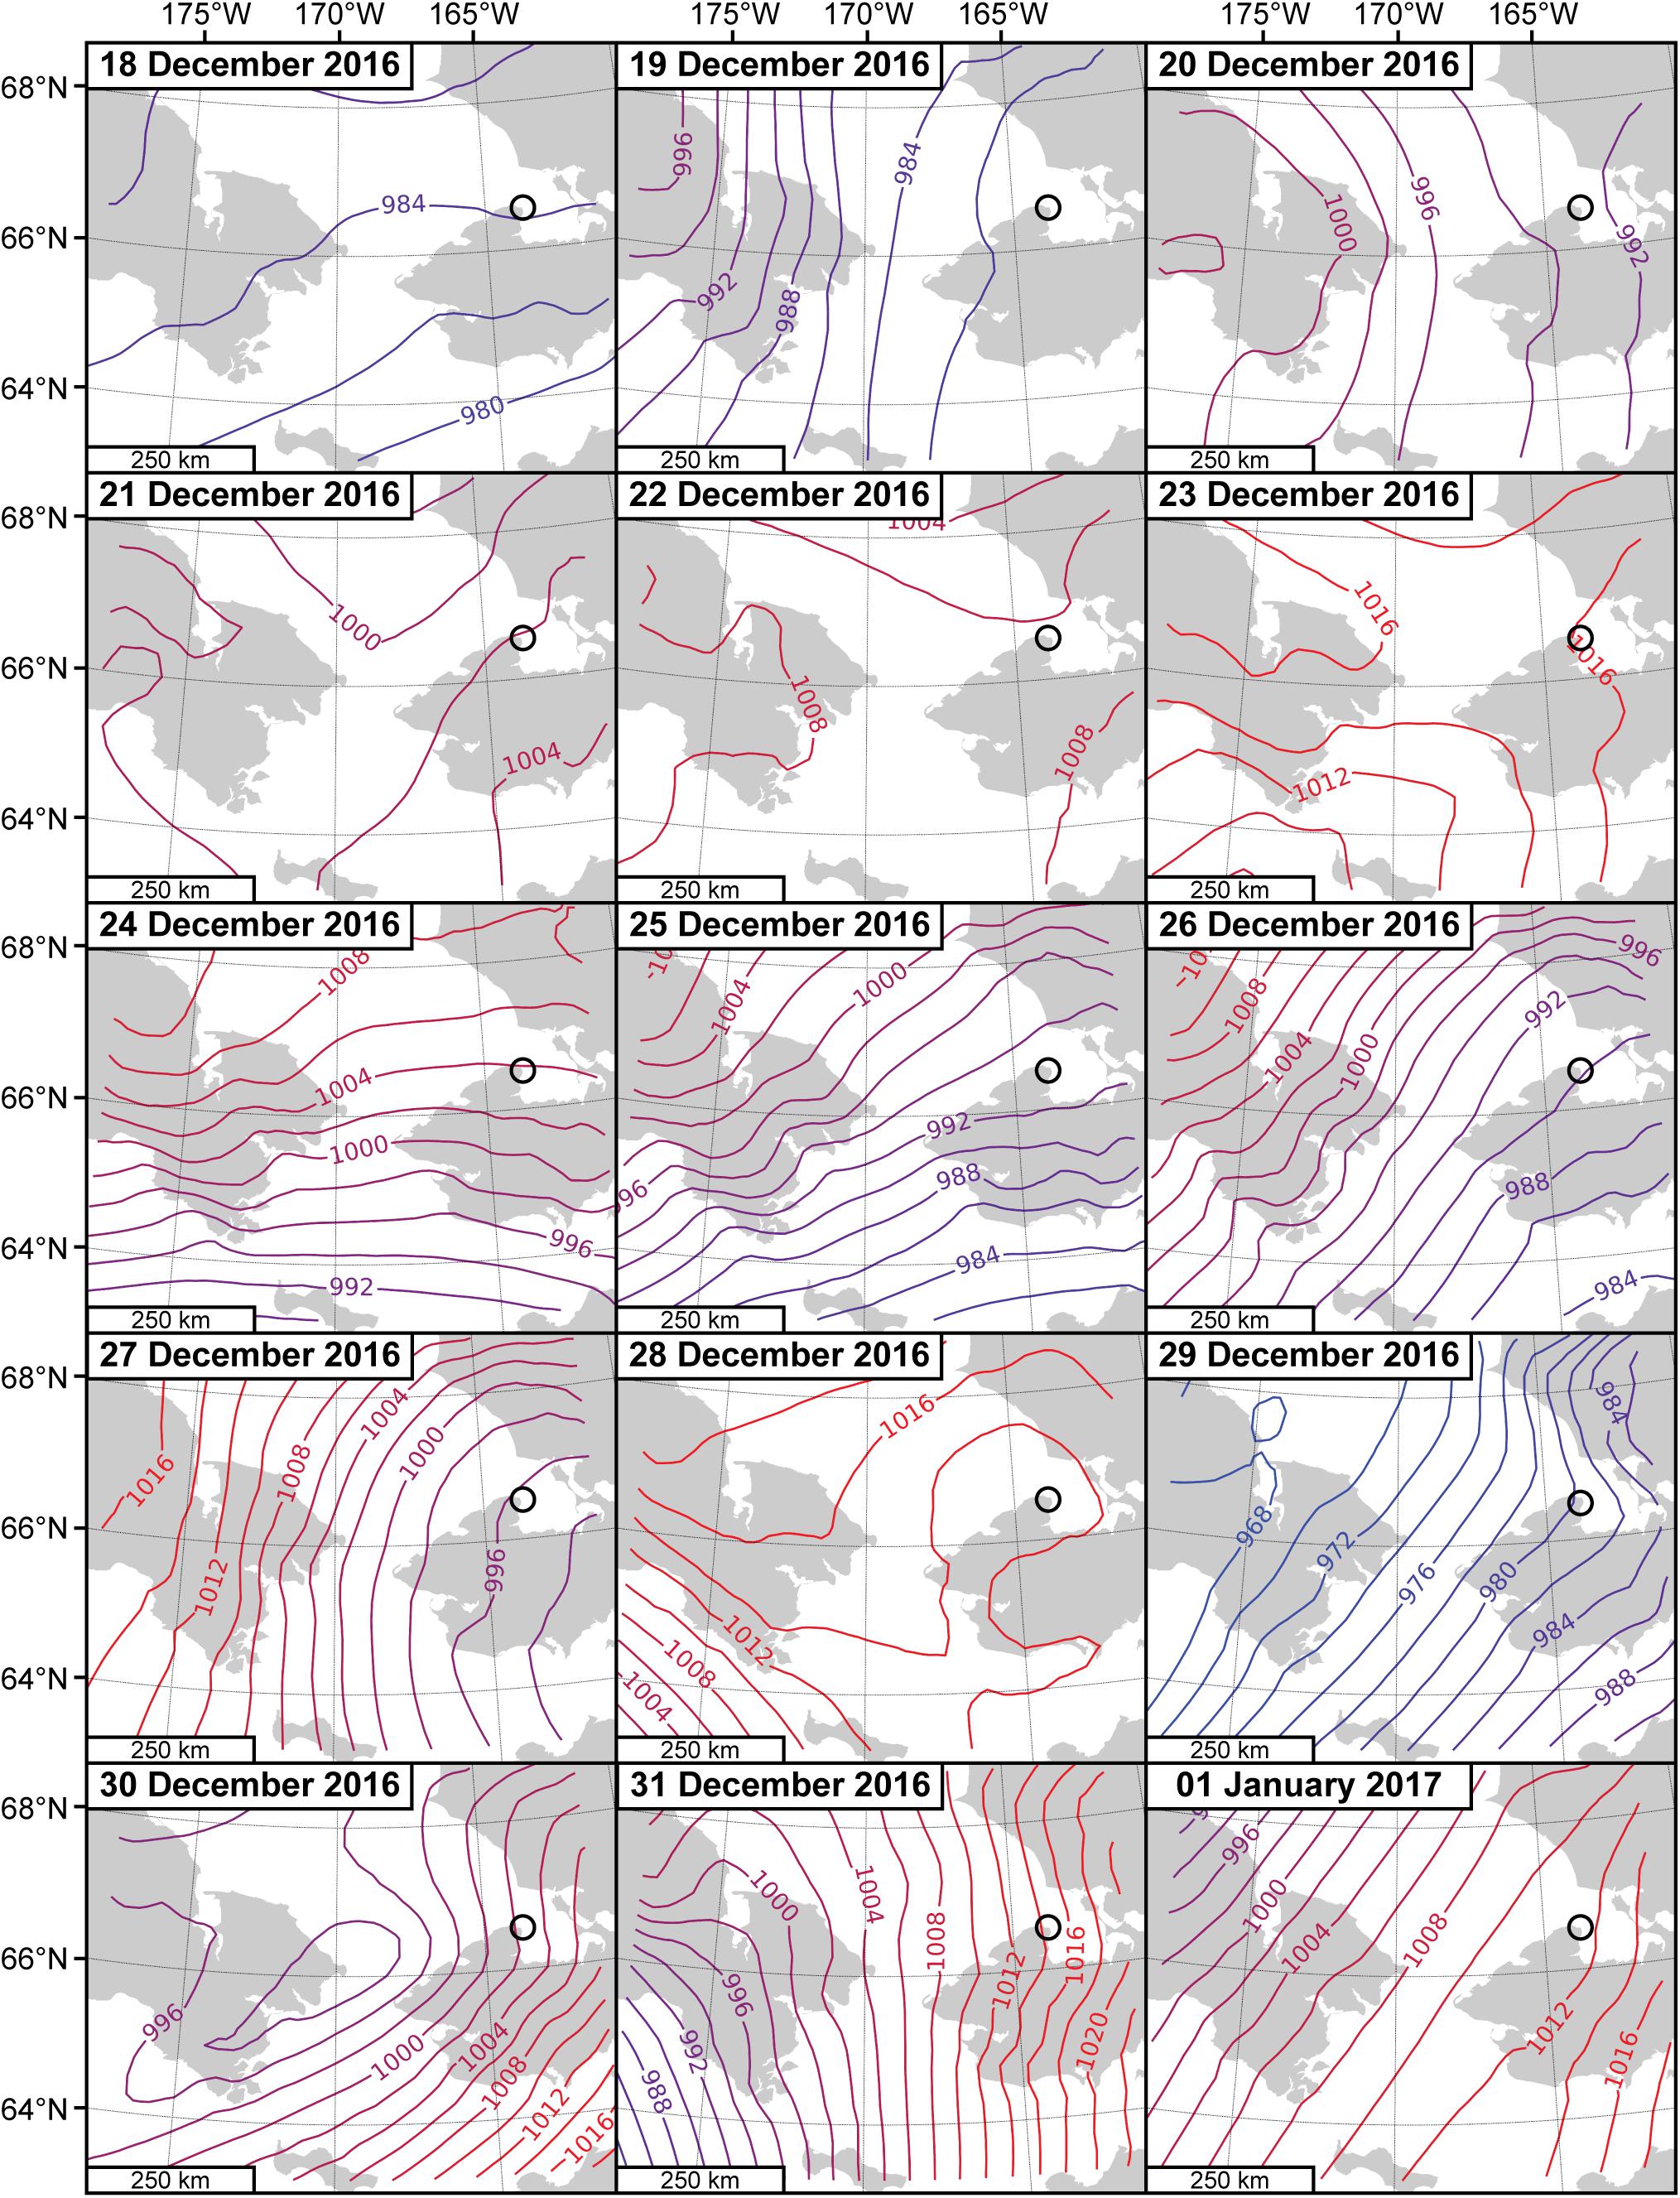
Figure 6. Mean sea-level pressure (MSLP) contour maps derived from the ERA-5 atmospheric reanalysis provided by the European Centre for Medium-Range Weather Forecasts (ECMWF). MSLP is shown in hectopascals (hPa) at 2 hPa intervals between 18 December 2016 and 1 January 2017 (23:00 Zulu time each day). Lower pressure values are shown in cooler (blue) colors, whereas higher pressures are shown in hotter (red) colors. The location of Cape Espenberg is identified with the black circle. Notice the low pressures observed on both 19 December and 29 December that were major factors in the destabilization of shorefast ice and passage of the severe winter storm on 31 December.
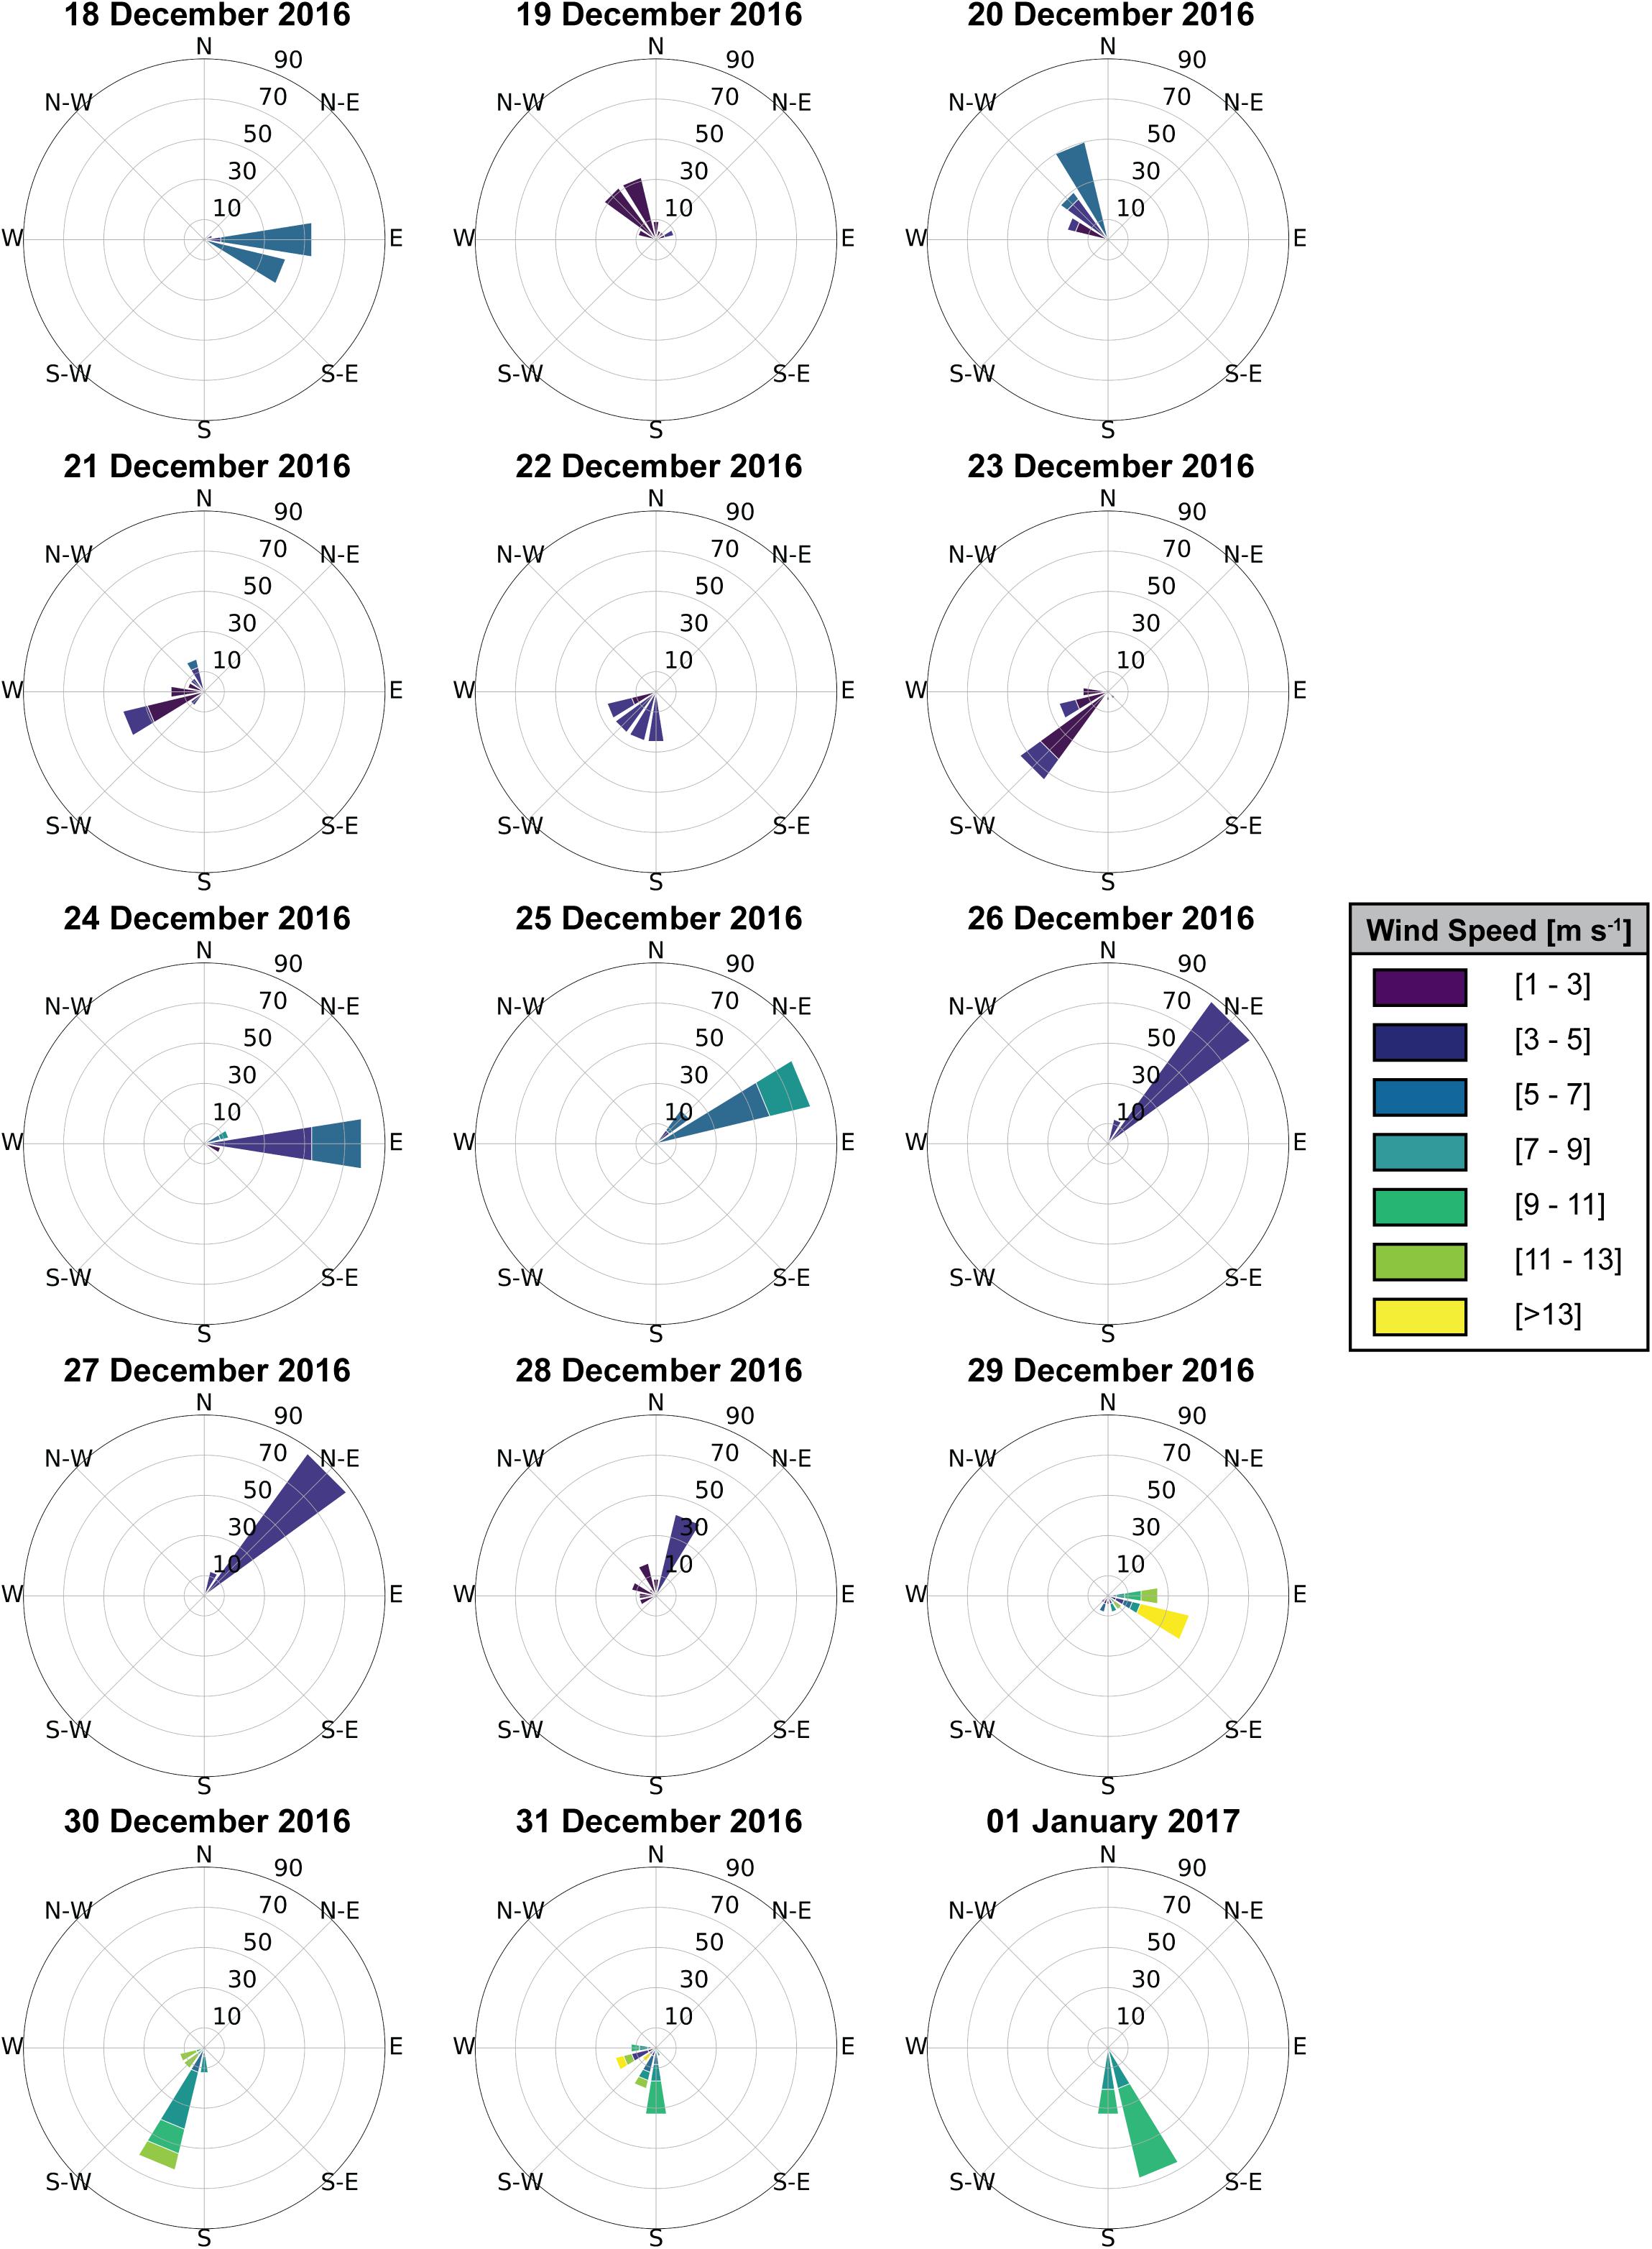
Figure 7. Wind rose diagrams derived from the ERA-5 atmospheric reanalysis provided by the European Centre for Medium-Range Weather Forecasts (ECMWF) between 18 December 2016, and 1 January 2017. Wind at 10 m altitude from one ERA-5 cell at the Cape (66.5500°N, –163.6400°W) is shown. The circular format of the wind rose shows the direction the winds blew from and the length of each “spoke” around the circle shows how often the wind blew from that direction (here we use a fixed scale up to 90%). The different colors of each spoke provide details on the speed, in m s– 1, of the wind toward each direction. Notice the northwesterly winds on 19 and 20 December, which accompanied the low-pressure system and developed the open-water lead south of the Cape. Easterly and/or northeasterly winds between 24 and 29 December kept the ice pack within Kotzebue Sound pushed up against the western shore, south of the Cape. Southerly winds between 30 December and 1 January, combined with significant surge, resulted in the ice push event at Cape Espenberg.
Traditional Ecological Knowledge
Traditional ecological knowledge was provided by Mr. Fred Goodhope, an Inupiat elder from Shishmaref, a community 70 km south of the impacted area (Figure 2). Mr. Goodhope, whose family has herded reindeer and gathered subsistence resources in the area for a generation, is an ongoing collaborator with scientists working at the Cape Espenberg archeological site. He has visited the Cape regularly over the last 50 years, as it is considered a sacred burial ground for his ancestors. For this study, we visited the disturbed coastline with Mr. Goodhope and held an unstructured oral discussion to determine any precedence on the timing and magnitude of the event.
Results
Chronology of the Ice Push Event
Continuous sea ice first appeared along the shallow shores of Kotzebue Sound by 8 November (Table 2 and Figure 4A). Over the next several weeks, the ice south of Cape Espenberg became landfast, whereas highly mobile pack ice developed in the central Sound by 28 November. The newly formed landfast ice was grounded based on its continuous position as observed over multiple SAR scenes. The shallow waters (<3 m water depth) immediately south of Cape Espenberg were among the first of the offshore areas to freeze up (Figure 4A).
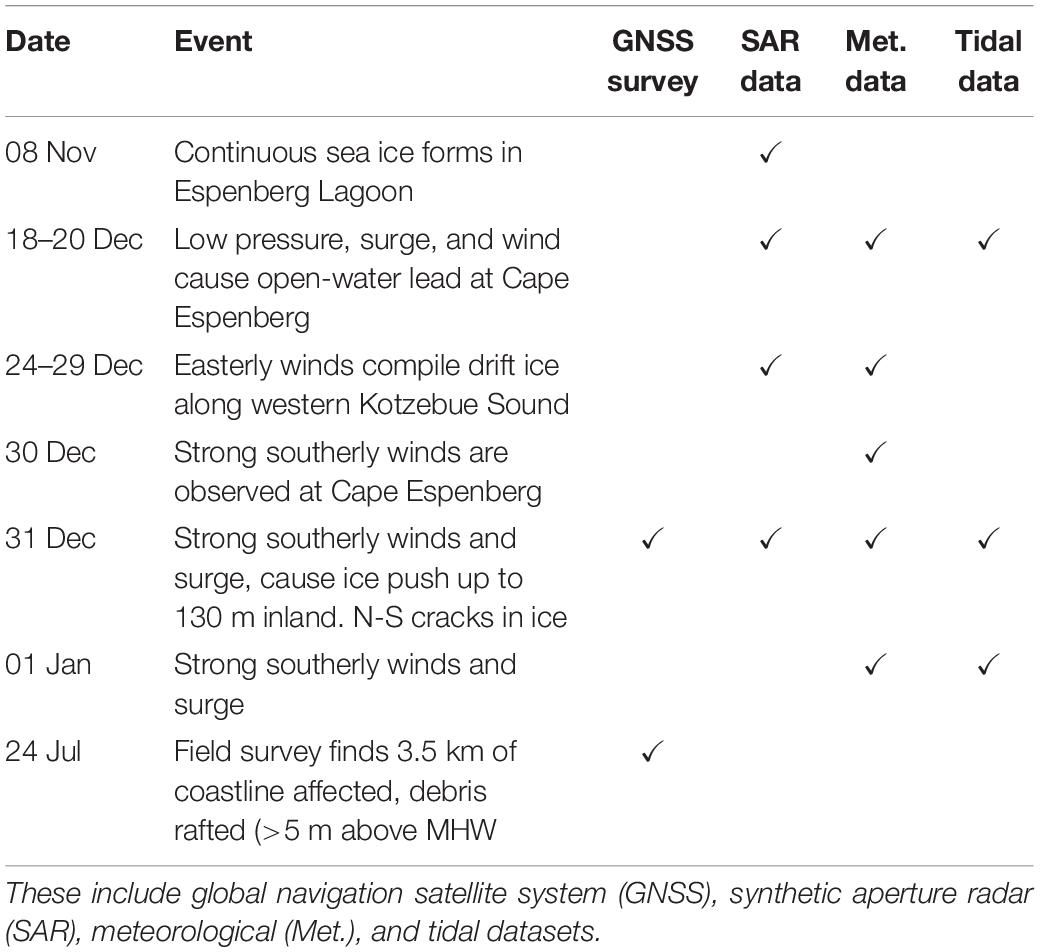
Table 2. Chronology of events and supporting datasets.
A low-pressure system (980 hPa) moved into the eastern Chukchi coastline between 18 and 20 December (Figure 6). SAR imagery before and after these dates show that the low-pressure system, coupled with the northerly wind regime (Figure 7), floated (Figure 5) and transported nearshore ice away from the southern coastline at Cape Espenberg, forming an open-water lead along its southern tip (Figure 4B). This mote-like feature is still apparent in the SAR scenes up to 29 December, just prior to the ice push event (Figure 4B). In the same SAR scene, there is also open water with highly mobile sea ice within Kotzebue Sound. Predominant easterly winds between 24 and 29 December kept the fragmented ice floe within the Sound packed against the landfast ice that had formed along the western mainland shoreline (Figure 7).
During the 31 December storm event, NWS and public accounts from local media reported major storm surges and hurricane force wind gusts throughout northwestern Alaska (i.e., Alaska Dispatch News, 2017; Arctic Sounder, 2019). At Kotzebue, the NWS meteorological station (PAOT) recorded high winds of up to 20 m s–1 (45 mph), with maximum wind gusts of up to 27 m s–1 (60 mph) (National Oceanic and Atmospheric Administration [NOAA], 2016). The worst damage was reported in Savoonga (Figure 2), an Alaska Native Village on St. Lawrence Island, where several roofs were ripped off, windows were blown out, and rain flooded into homes through openings around foundations attributed to recent permafrost collapse (Alaska Dispatch News, 2017). A Savoonga resident noted the absence of sea ice in the northern Bering Sea around St. Lawrence Island and reported that the storm had the biggest impacts on the local coastline and infrastructure that he could remember in the past 57 years (Alaska Dispatch News, 2017).
As the storm continued moving northeast and approached Kotzebue Sound on 31 December 2016, weather station PAOT recorded temperatures exceeding 2°C (36°F), which tied previous records from 1982, 2013, 2015, and 2017 for the warmest temperature recorded in December for Kotzebue (National Oceanic and Atmospheric Administration [NOAA], 2016). The SAR image from that day shows a region of open water on the ocean-side northern coastline of the Cape with strong southerly winds apparent (Figure 4C) and several new cracks in the continuous sea ice south of the Cape (Figure 4C) that did not appear in the earlier scenes (i.e., Onstott and Carsey, 1992; Jackson and Apel, 2004). The cracks were caused by compressional failure of the ice cover under uniaxial force perpendicular to the southern coastline of the Cape and are aligned approximately north–south up to 6 km long and 1 km apart (Figure 4C). The onshore winds (Figure 7) and storm surge (Figure 5) on 31 December 2016 pushed the unfastened ice sheet north along these slip planes into the tip of Cape Espenberg where the open-water lead present in the 24 December SAR scene occurred. This open-water lead provided accommodation space, which lessened resistive forces and predisposed stress release along this stretch of coastline (e.g., Gilbert and Glew, 1986; Mahoney et al., 2004). A bright radar signature confirmed the presence of ice on top of the beach ridges at the tip of Cape Espenberg directly landward of the previously open stretch of water. This new relief feature matched the surveyed extent of the impacted coastline and is clearly visible on the landscape in SAR scenes through the winter and spring (Figure 4D).
Geomorphic Impacts
The geomorphic impacts of the ivu were first reported after an archeological crew that had been working on the spit in summer 2016 returned in late spring of 2017. They observed extensive erosional scarps with substantial piles of sand, ice, and other marine debris perched atop their field sites. Earlier in the spring, a local air taxi pilot had also observed anomalous “house-sized” piles of sand and ice while passing the site, noting clear disturbances along the 3.5 km tip of Cape Espenberg. Mr. Goodhope reported seeing similar features during his time in Shishmaref, Kotzebue, and Nome, but had never observed an ivu of this magnitude at this location. Mr. Goodhope’s account did not provide the specific date of the event, but instead placed it within a range between mid-November 2016 (when sea ice first formed off of Shishmaref) and March 2017 when he passed by on a snow machine. These local testimonies helped to constrain the date of the event and its geomorphic impacts along an otherwise remote stretch of coastline.
The results of the field surveys and observations document the impacts of block erosion, surge-driven marine flooding, impounding of storm surge and sea ice melt waters, and the landward deposition of eroded material (Figures 8–11). Clear differences in geomorphic impacts, related to variability in coastline topography and stratigraphic characteristics, were apparent between the eastern, central, and western portions of the Cape’s shore (Figure 3) (e.g., Sodhi et al., 1983; Barker and Timco, 2016). Geomorphic impacts, by section, are discussed below using field observations as well as the results from the shoreline change analysis.
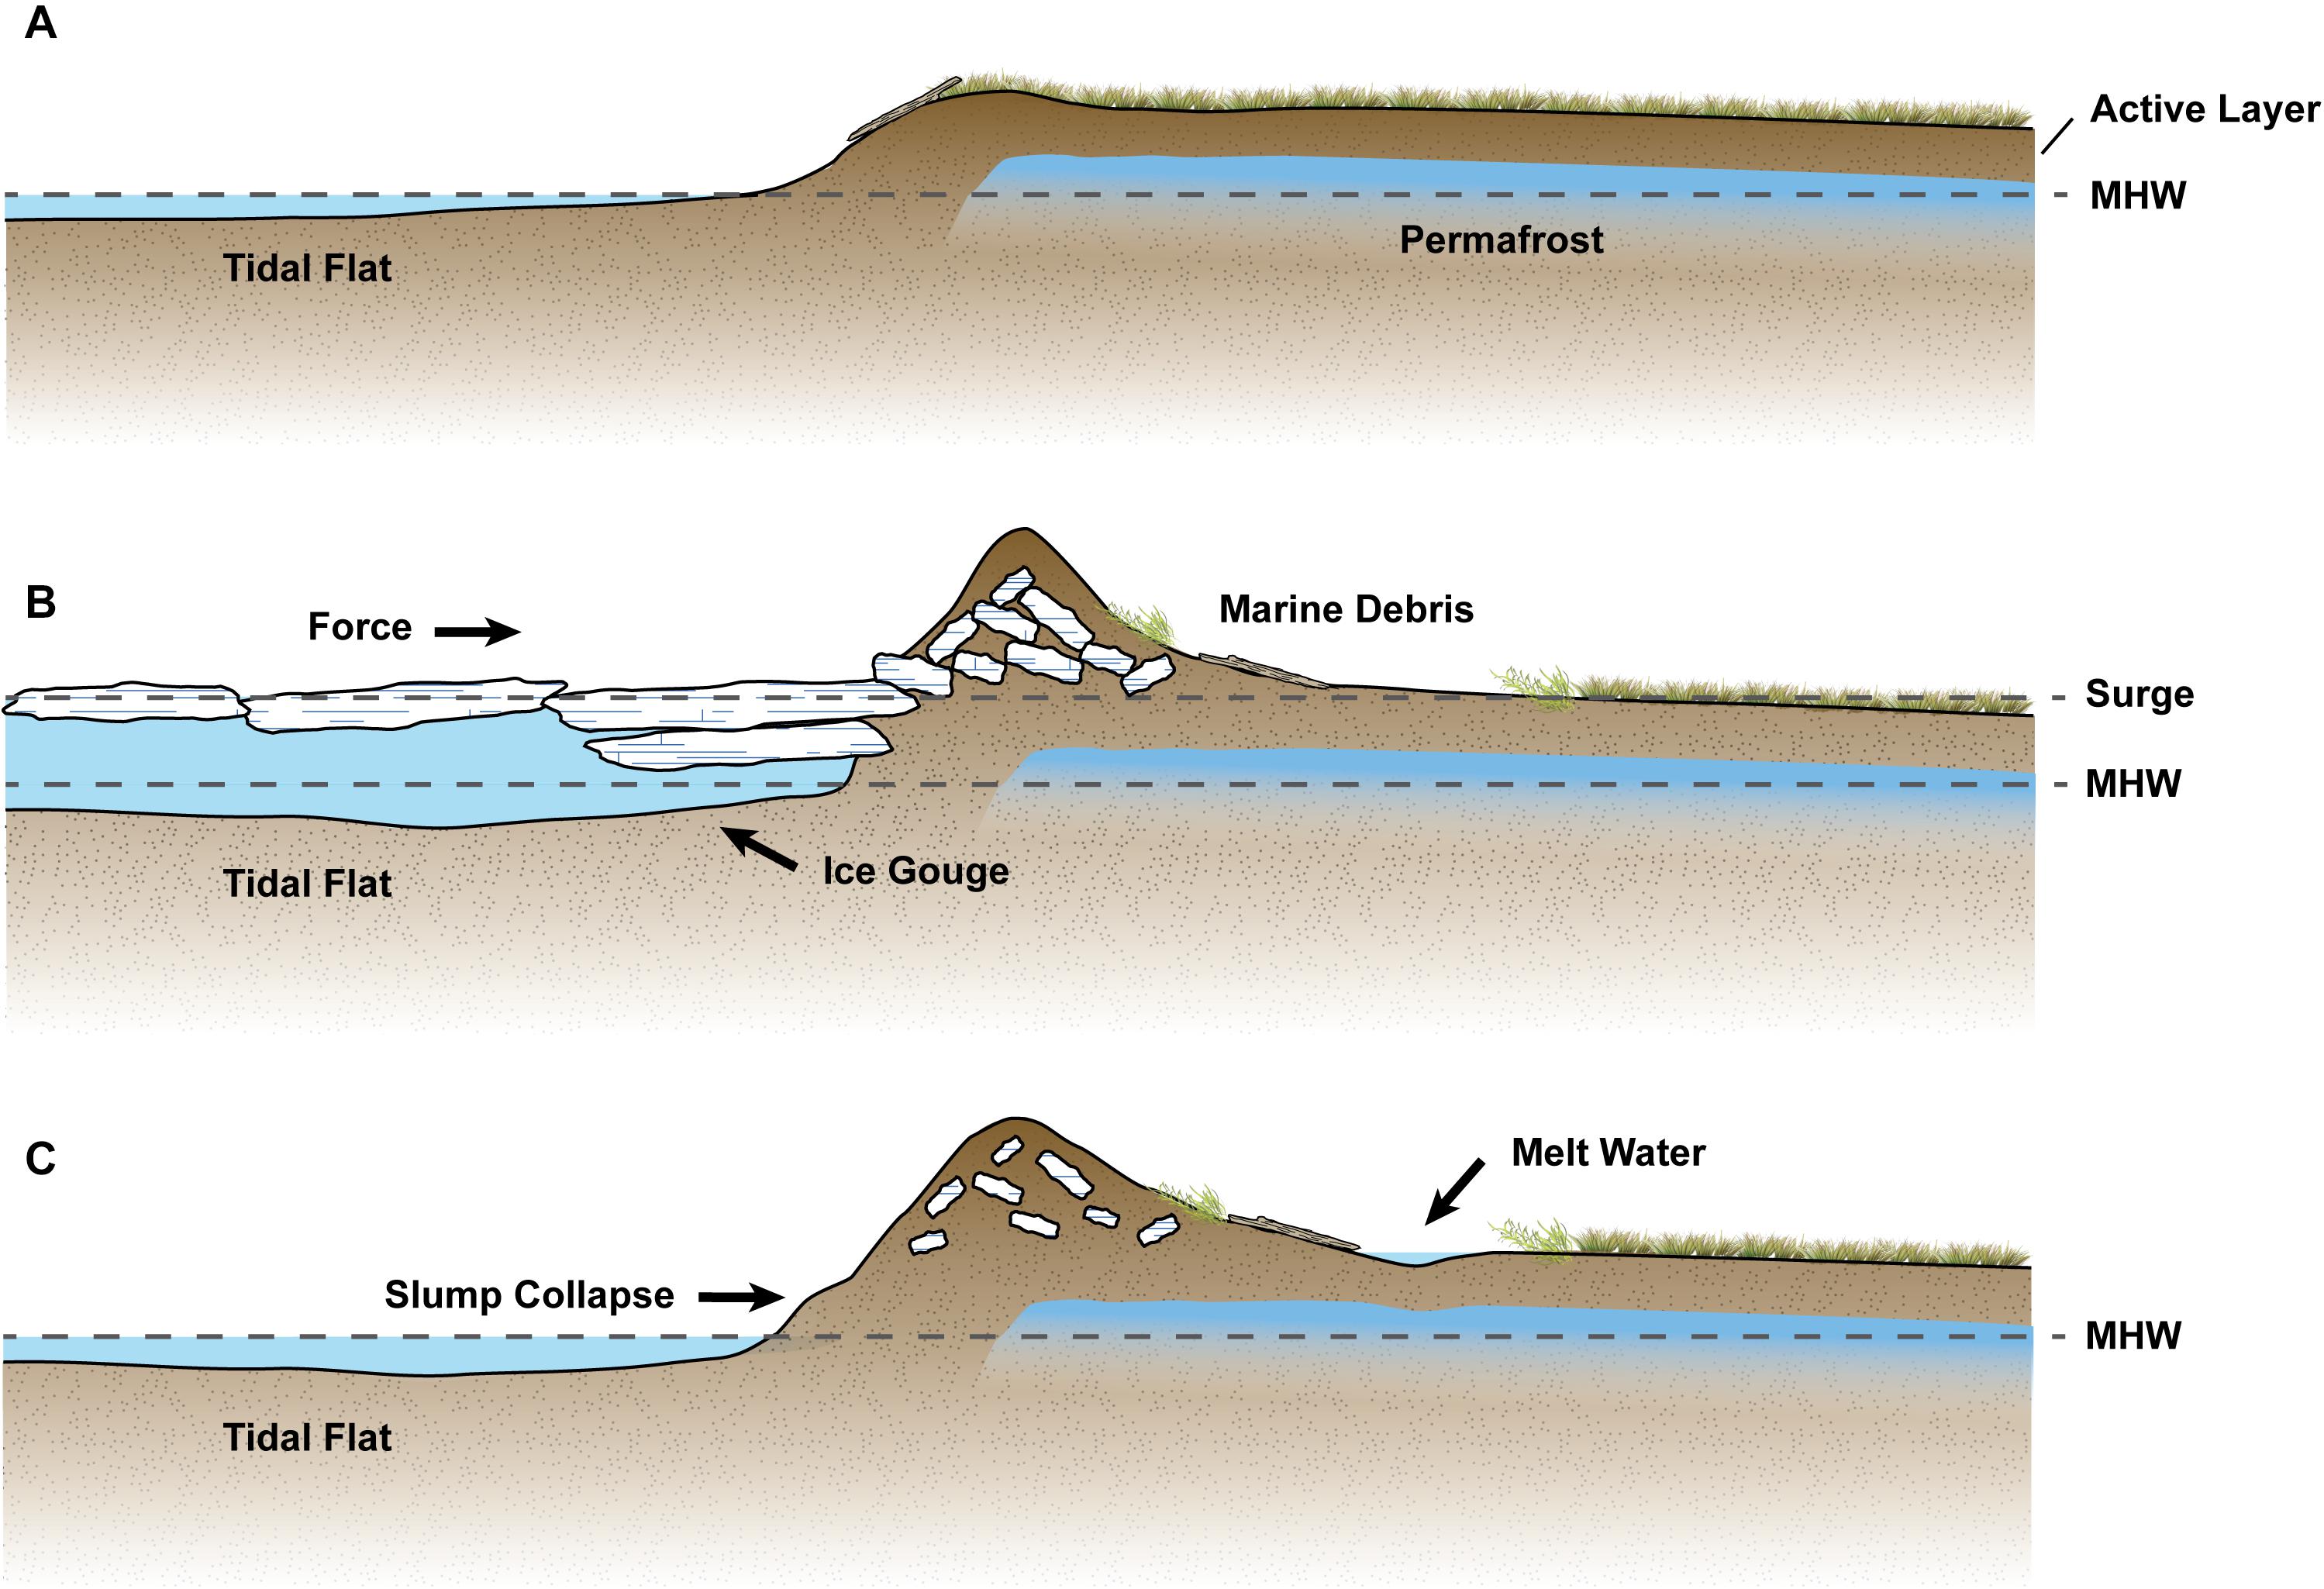
Figure 8. Conceptual diagram showing the before (A), during (B), and after (C) cross-sections of the Eastern portion of the coastline (Figure 3). Key features are annotated with the arrows. (A) Undisturbed coastline prior to the ivu depicting bluff consisting primarily of unconsolidated wind-blown sand. (B) During the event, ice, sediments, and other marine debris were piled on top of the bluff. (C) Ivu debris pile as it was surveyed and documented 5 months after the ice push. MHW, mean high water.
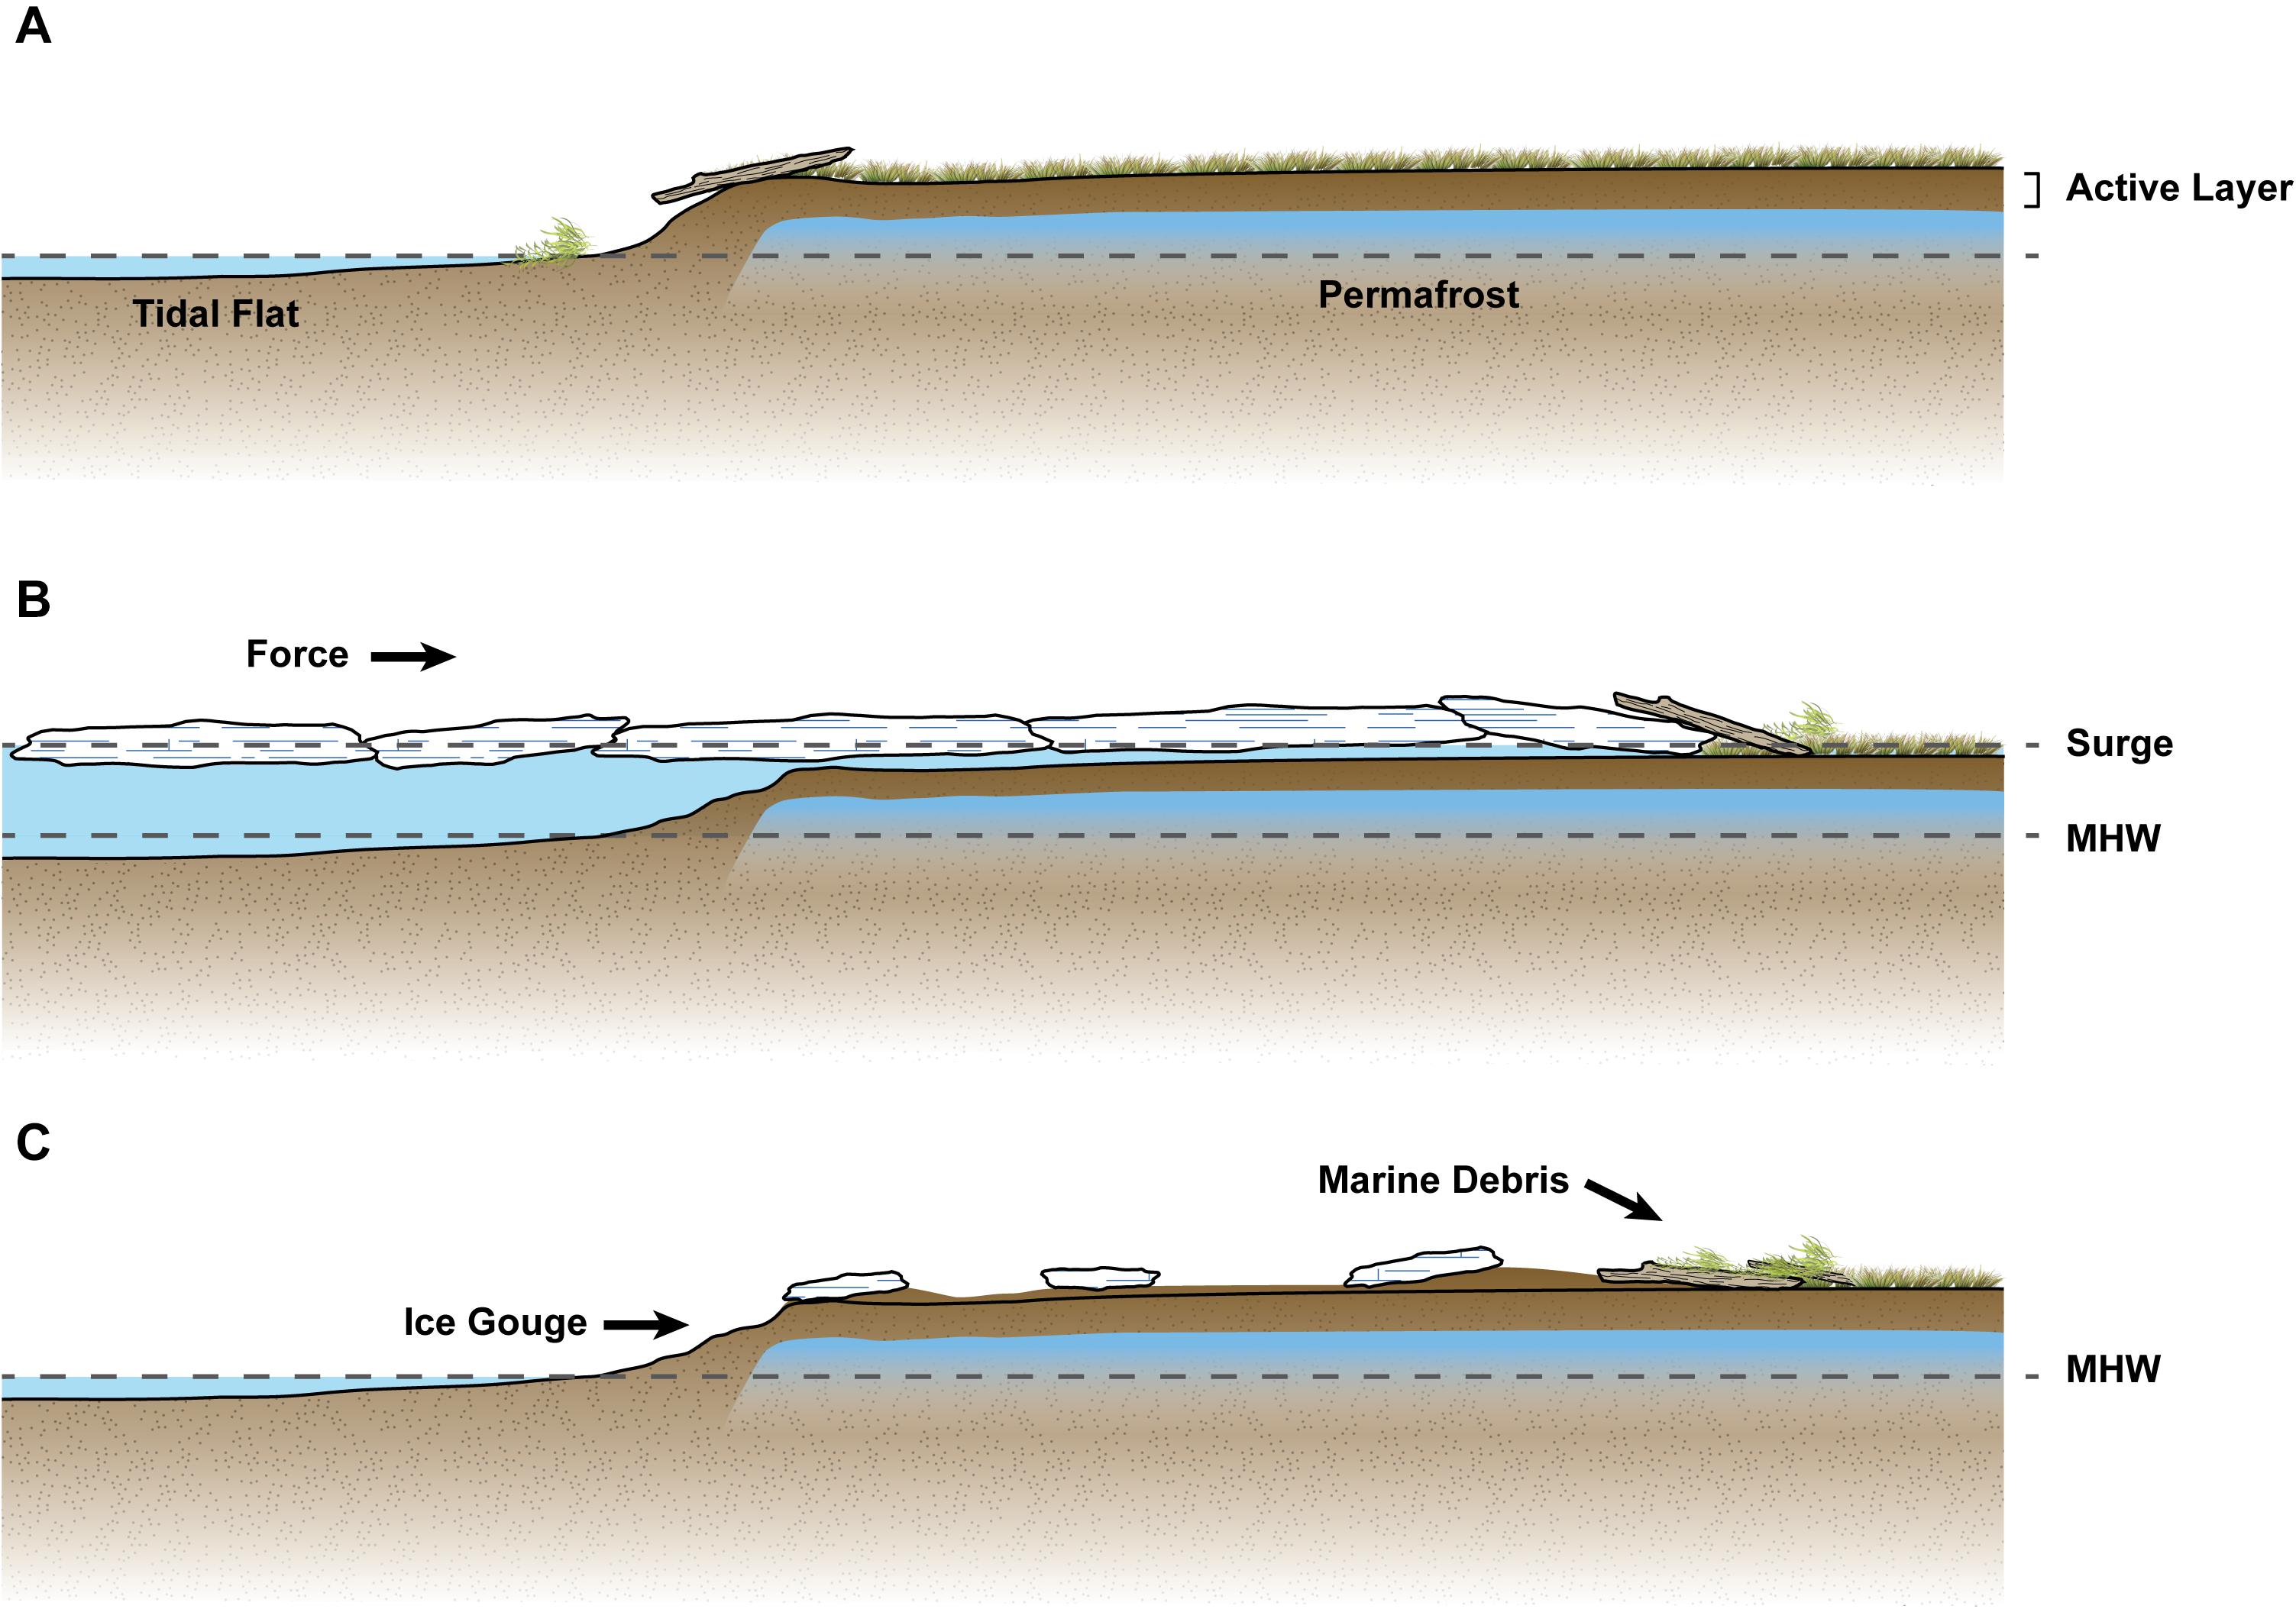
Figure 9. Conceptual diagram showing the before (A), during (B), and after (C) cross-sections of the Central portion of coastline (Figure 3). Key features are annotated with the arrows. (A) Undisturbed coastline prior to the ivu depicting lower elevation trough and marsh. (B) Given the lower elevation of the central area, there was an ice ride-up where ice was floated or pushed inland by the storm surge waters but did not leave the distinct debris piles as observed along the Eastern and Western sections. (C) After the event, a clear wrack line marking the maximum inland extent of the event (130 m). MHW, mean high water.
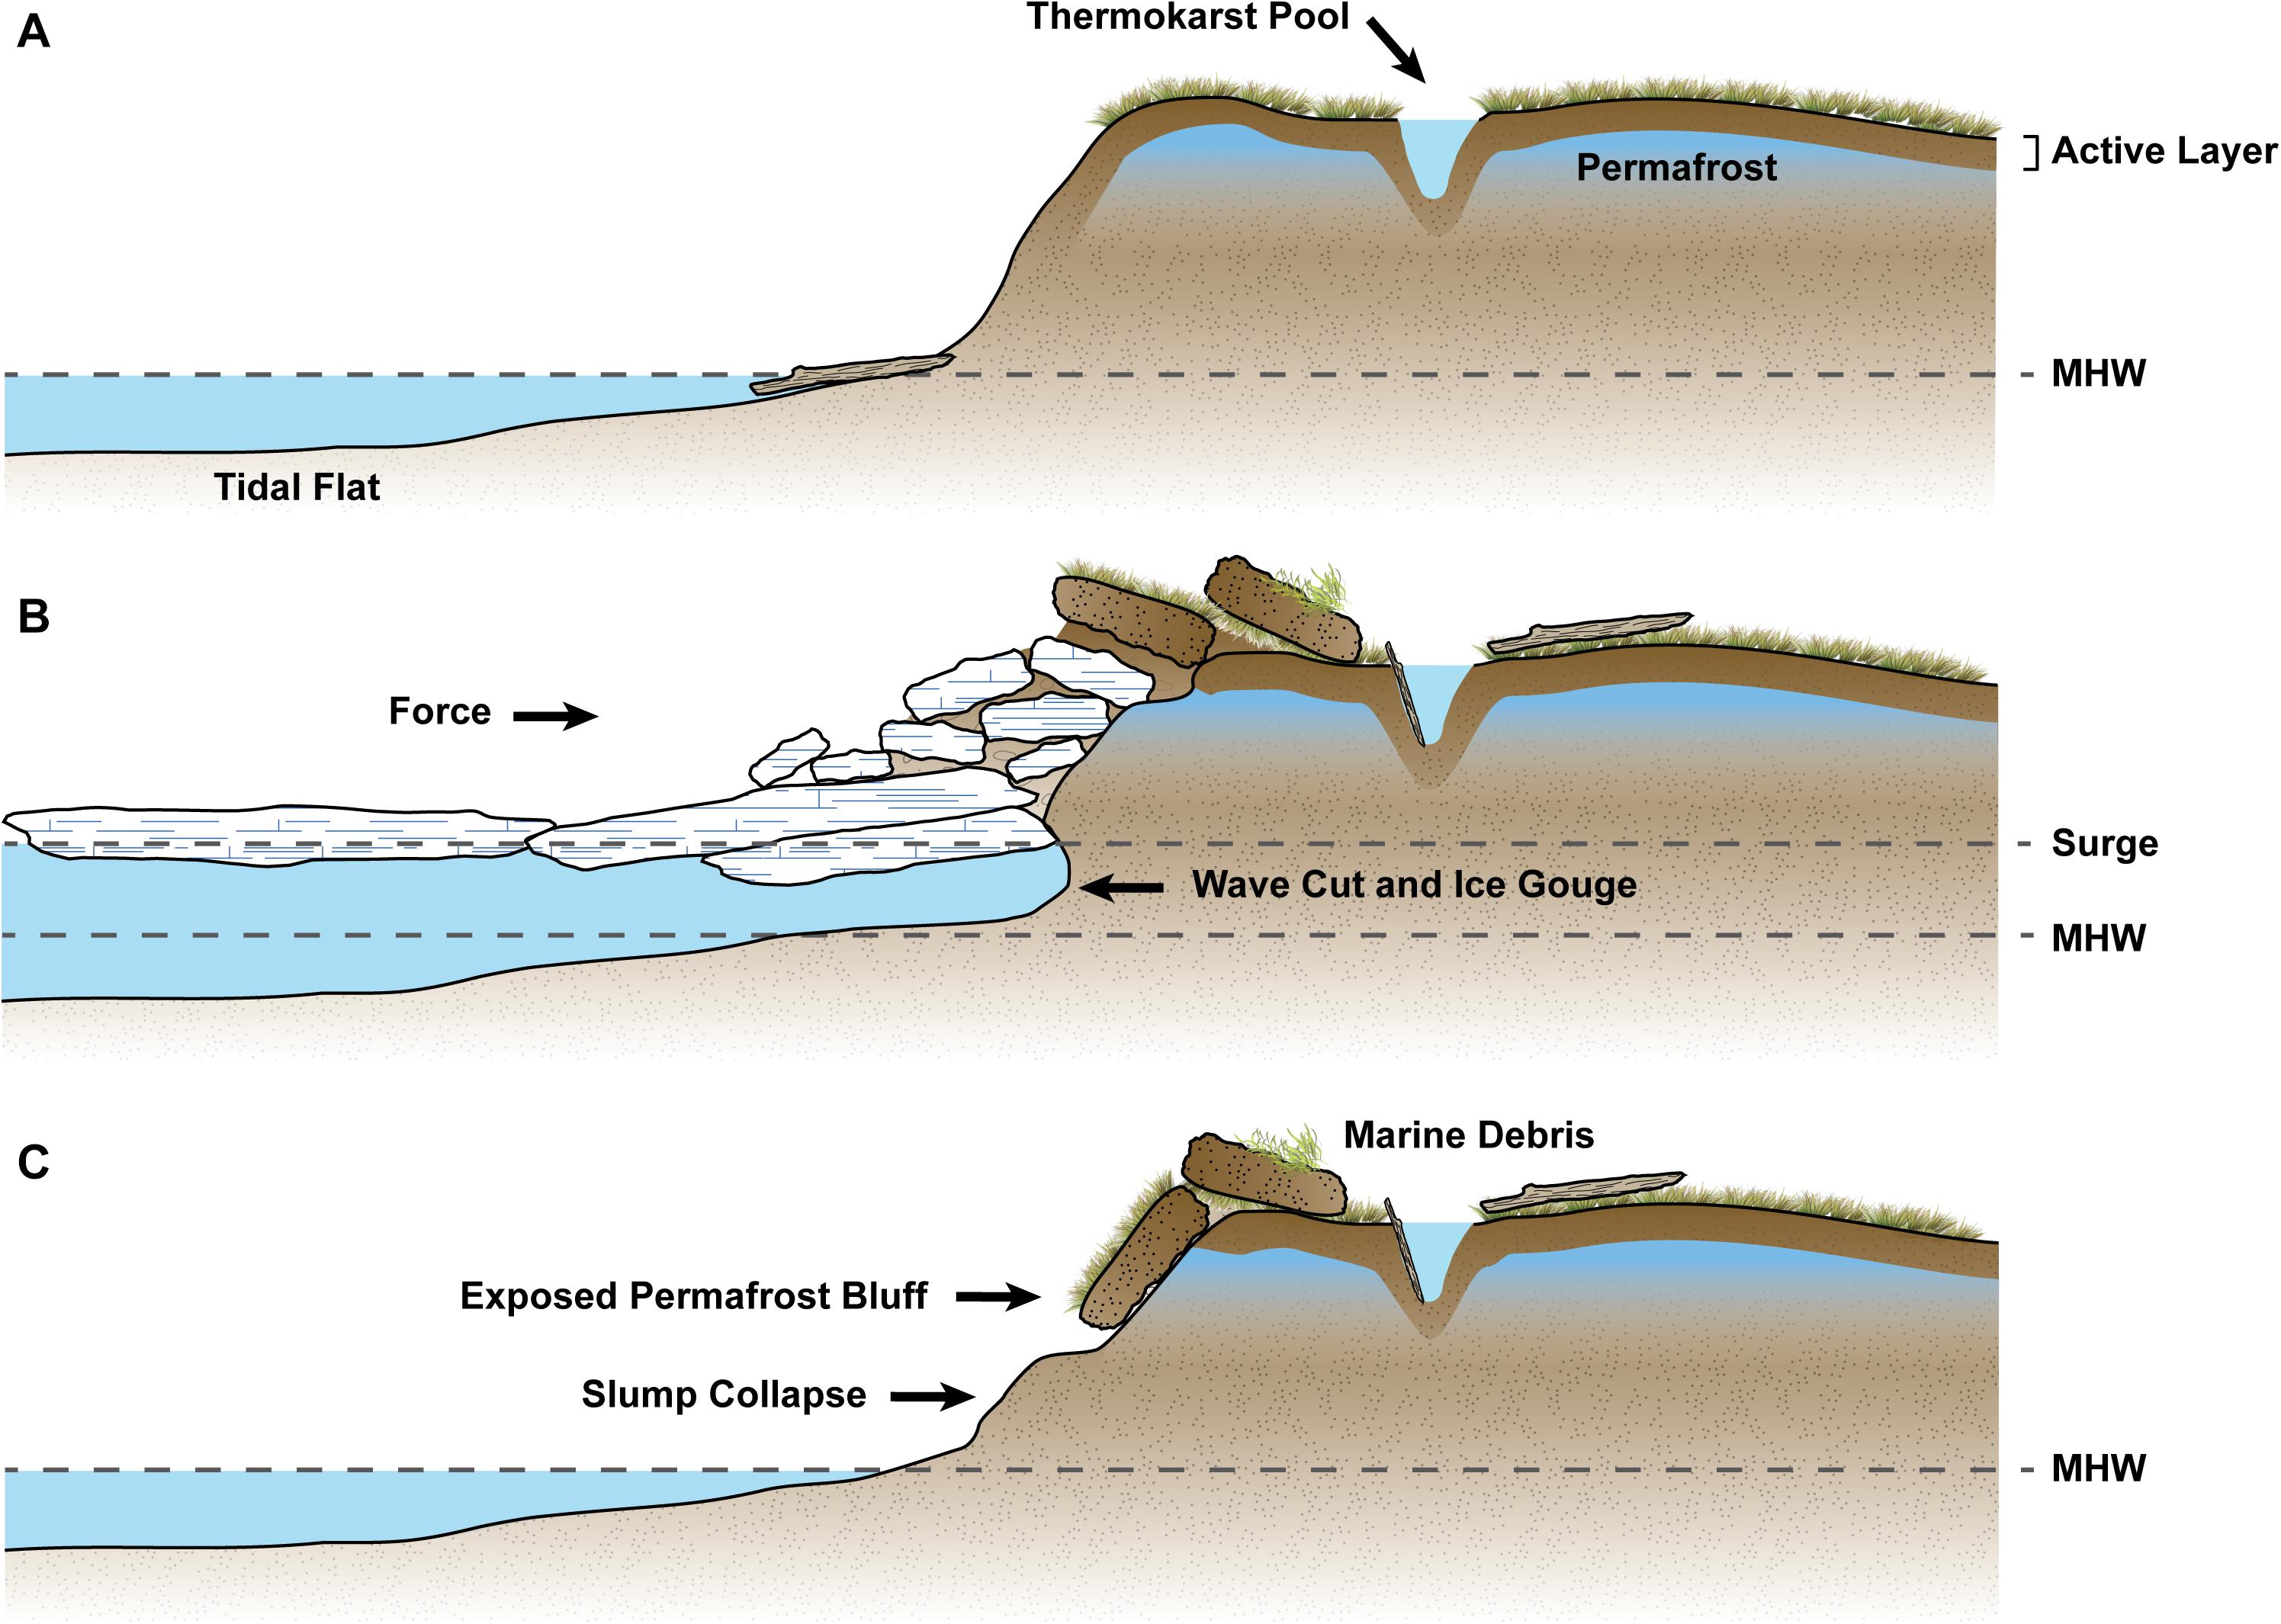
Figure 10. Conceptual diagram showing the before (A), during (B), and after (C) cross-sections of the Western portion of coastline (Figure 3). Key features are annotated with arrows. (A) Prior to the event, there were shore parallel thermokarst cracks approximately 10 m inland from the bluff edge. Note the steeper bluff face and deeper offshore water when compared to the Eastern section (Figure 8). (B) During the event, ice was shoved into the steep bluff face gouging the bluff toe and sheering off large blocks of sediment along the bottom of the active layer. Notice how the lateral abrasion from the ice push leads to the exposure of permafrost at the bluff, compounding further erosion. (C) After the ice push, it was evident that the bluff face had slumped onto the beach with the large sediment blocks and thermokarst features remaining along the top of the bluff (Figures 11E,F). MHW, mean high water.
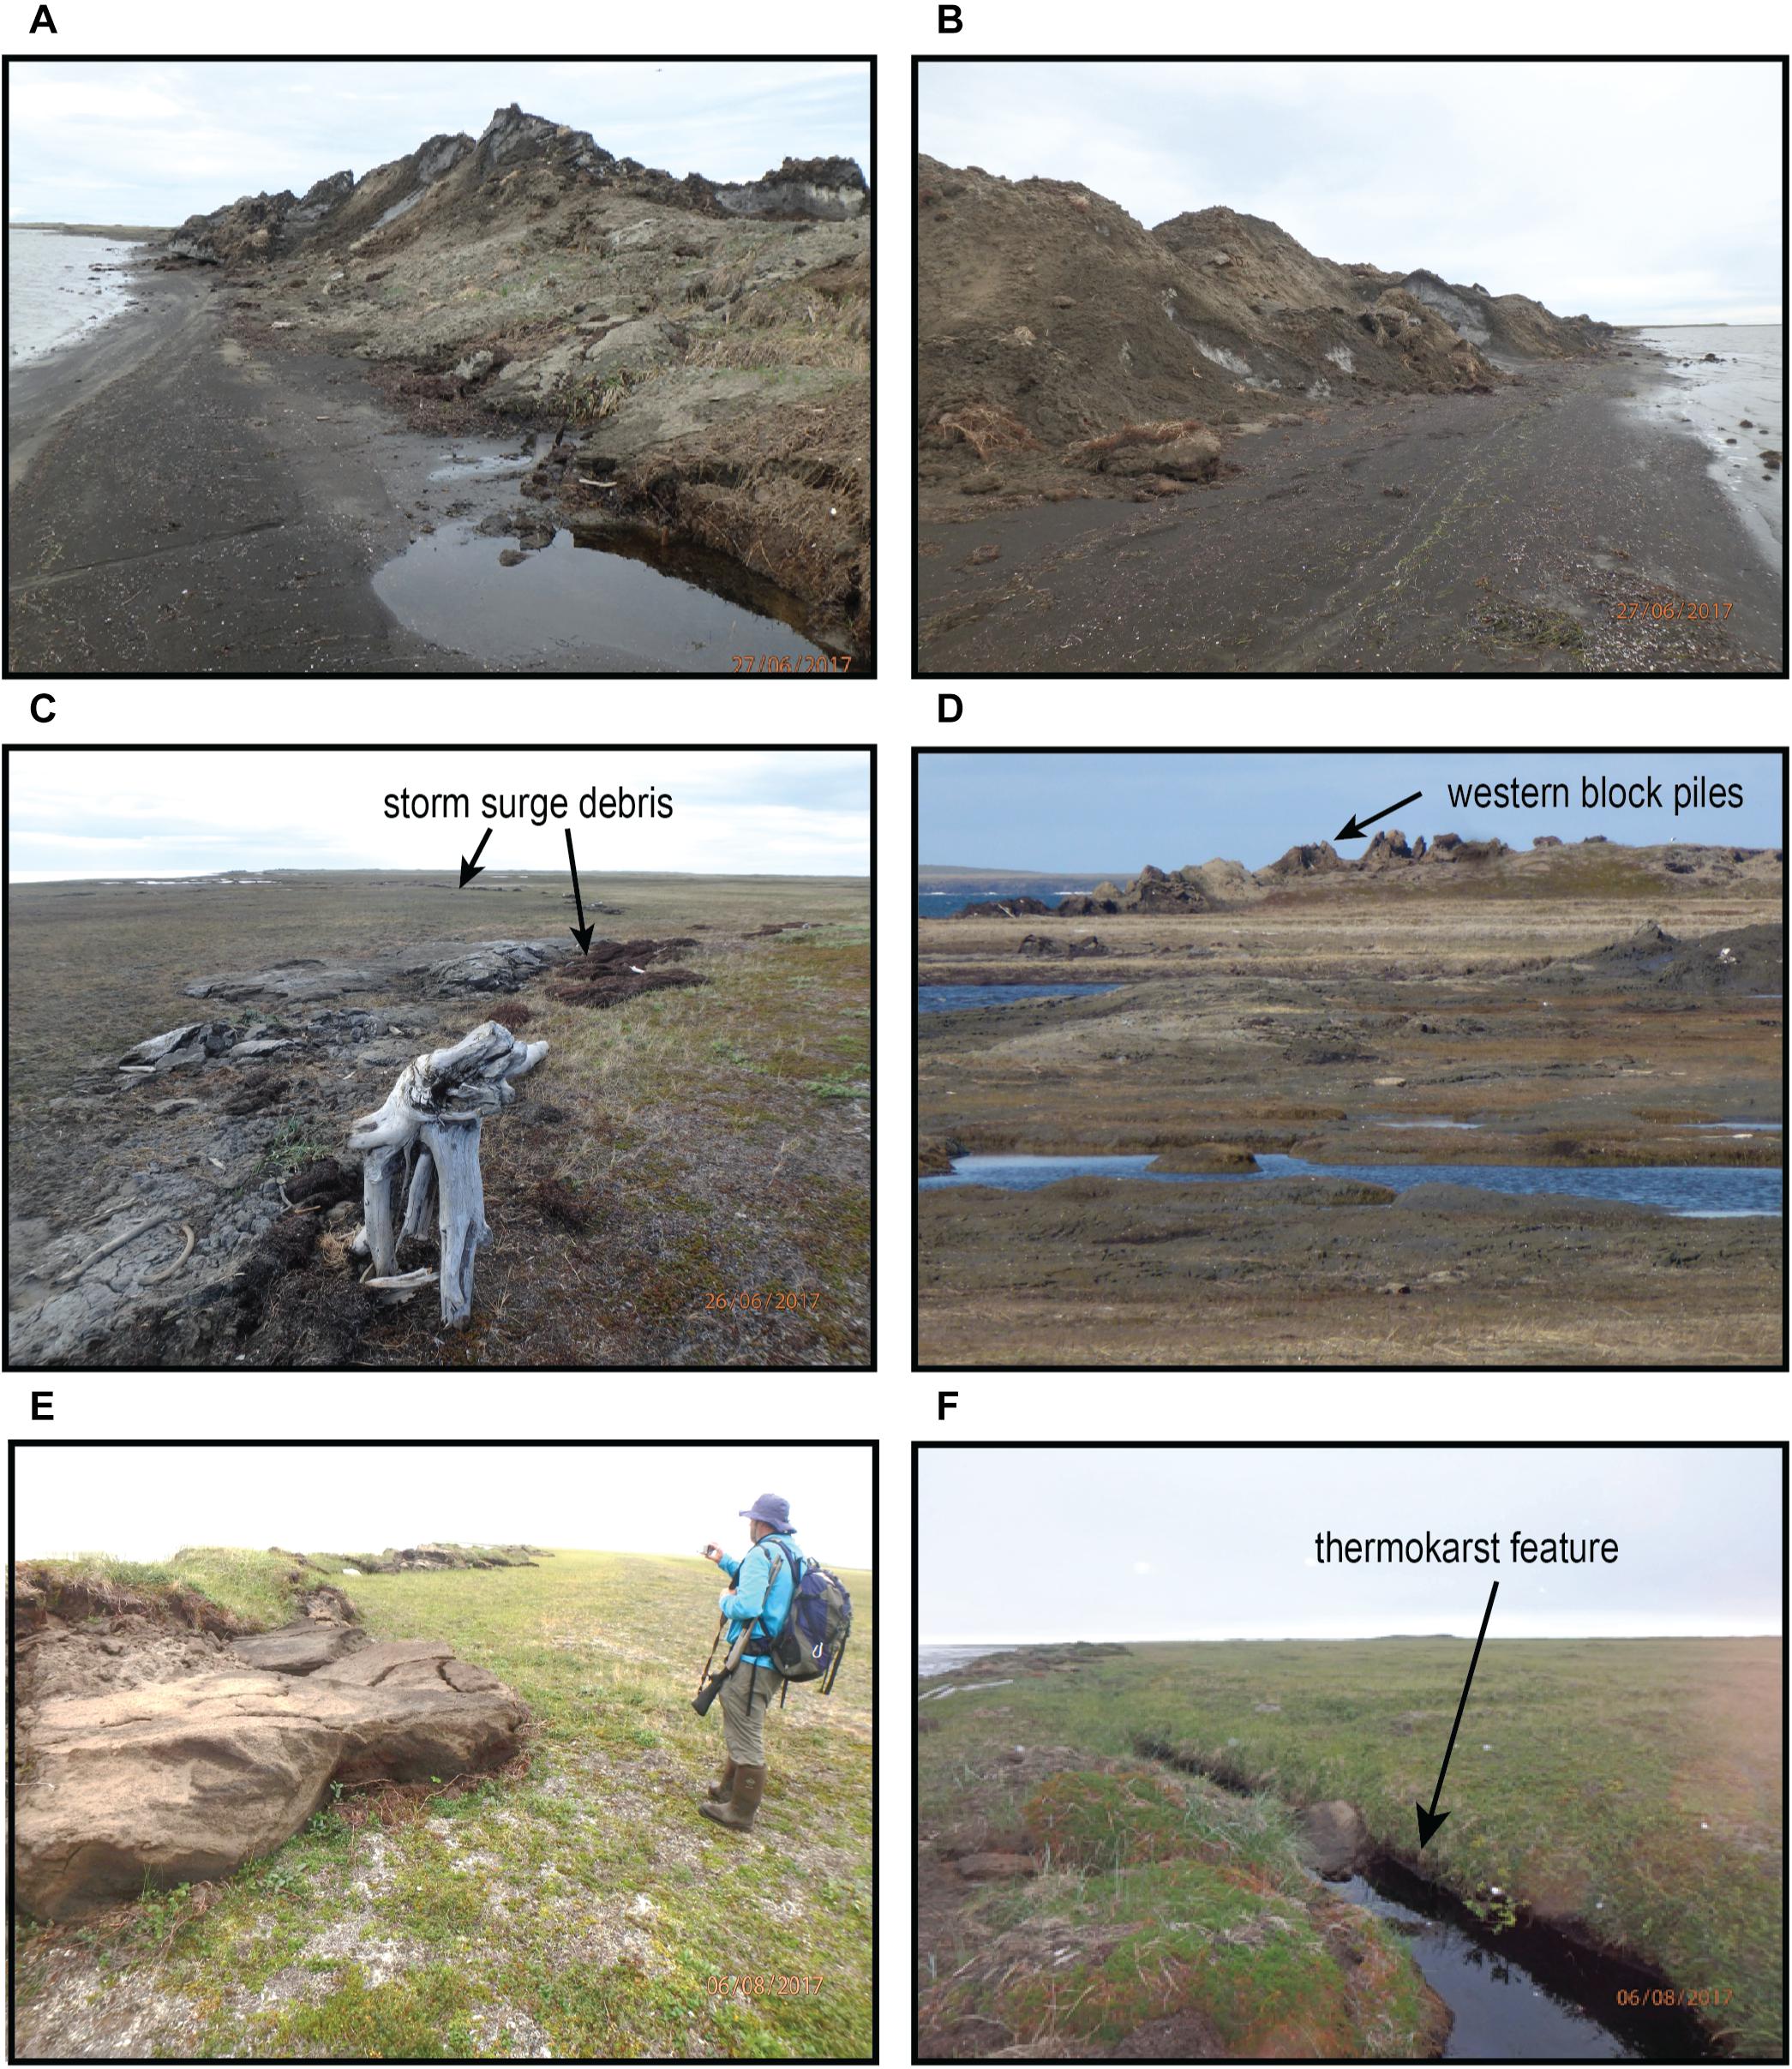
Figure 11. Photographs of ivu impacts along the eastern, central, and western portions of Cape Espenberg (Figure 3). (A) Photo taken from the foreshore looking east with small erosional scarp and large ice pile-up debris. (B) Looking west toward the tip of the cape with ice blocks and eroded sediments shown. (C) Storm surge debris line in central low-lying area adjacent to archeological site. (D) Photo looking east across central low-lying swale with large piles of sediment blocks along western coastline. (E) Along this western portion of the coastline, large blocks of bluff material were cast landwards. (F) Parallel to the impacted western coastline, 20–50 m longshore parallel thermoerosional cracks were observed filled with water and ivu debris.
Geomorphic Impacts: Eastern
The greatest amount of ice pile up material was along the southeastern tip of the Cape (Figures 1, 11A,B). The main ice push feature along this stretch was made up of ice blocks as large as ∼50 cm3 mixed with sand, shells, driftwood, and other marine debris with melt water pools and channels present (Figures 11A,B). It was concentrated over a 30 × 200 m area in close proximity to the active archeological site. Based on the survey data, this deposit had a volume of 1,000 m3 (Figure 3). The elevation of the pile was 6.2 m (MHW) and rose 3 m above the surrounding land surface at the time of the survey (>6 months after its formation). This unconsolidated relief feature had a greater number of ice blocks, but lacked the well-defined organic-rich stratigraphic structure observed in the more western deposits (Figure 8). The primarily sand and silt sediment matrix of the debris pile originated from both the wind-blown sands of the eroded bluff face and nearshore tidal flats made evident by the presence of marine shells.
The DSAS analysis for the eastern section revealed variable patterns of shoreline change predominately controlled by the alternating dune ridges and troughs alongshore. The eastern stretch had an average NSM of −1.6 ± 0.27 m, with highly variable values ranging between 1.4 and −18 ± 0.27 m. The larger piles of eroded material corresponded to sections of the shoreline with a steeper bluff face (cross-shore dune ridges), which were subject to significant abrasion by rafted sea ice during the 31 December storm (Figures 11A,B). The greatest amount of erosion (18 m) was observed seaward of the 1,000 m3 ice shove feature mentioned previously. Although this analysis identified that there were three locations with positive NSM, field observations and photographs from this area document a clear erosional scarp along the entire coastline with marine debris and overwash deposits across the bluff edge. Two of the locations that observed positive NSM fell within the uncertainty range of the analysis (± 0.27 m) and were therefore considered negligible (0 m). The third location that observed positive NSM (1.4 m) had still been reworked by the ice push event, but deposits of unconsolidated material intermixed with vegetation made identification of the vegline uncertain at this location. This positive NSM of the vegline could also be attributed to the growth of new vegetation seaward of the erosional scarp.
Geomorphic Impacts: Central
The low-lying central section had an average NSM of −0.9 ± 0.27 m, with values ranging between −0.1 and −2.5 ± 0.27 m. It is inferred that the upper range of NSM in the central section (−0.1 m) is negligible (0 m), as it falls within the uncertainty range of the shoreline change analysis. Analogous to the eastern section, the entire central coastline also appeared disturbed and truncated. Overwash sand and marine debris were deposited up to 130 m inland (Figures 9, 11C). This maximum inland extent of the surge in the central low-lying swale was delineated by the well-defined rack line (Figure 11C). In this area, the storm surge covered an area of 37,000 m2 and extended 130 m inland (Figure 3), terminating just 60 m from the archeological site. The maximum elevation of the storm debris line was surveyed at 5.0 m above MHW providing an accurate estimate for the maximum elevation reached by storm water.
Geomorphic Impacts: Western
Along the older and more ice rich (Mason et al., 1997a) beach ridge complex to the west, the ivu impacts were considerably different (Figures 10, 11E). The ice push appears to have detached and transported fragmented sections of the active layer upwards and inland. These roughly 2 × 4 × 1 m sediment blocks were deposited on top of the dune ridge as high as 5.0 m above MHW, with some blocks being completely flipped on end (Figures 11D,E). When surveyed, these blocks were intact with well-defined soil horizons unlike the unconsolidated debris piles observed along the eastern section. While the bluff showed disturbance up to 10–15 m inland over the 1 km stretch, it was evident, from the lack of a defined marine debris line as observed along the eastern and central stretches of coastline, that the storm surge did not reach as far inland along the western ridge.
As previously stated, DSAS analysis was not carried out along the western stretch because of it falling outside the extent of the 2016 orthomosaic, but based on field photographs and observations, it is estimated that this section experienced approximately 2–4 m of erosion with more uniform patterns of disturbance compared to the other two sections. During the field campaign, cross-shore melt run-off channels and shore-parallel thermokarst crevices were also observed and photographed (Figure 11F). The presence of marine debris (e.g., shells, drift wood, marine algae) within these channels and crevices at the time of the ground survey indicates an input of marine water at these locations. Field observations also revealed slumping of the disturbed bluff face and exposure of ice-rich permafrost.
Discussion
Ivu of varying degrees are fairly common along Arctic coastlines during seasonally driven periods of destabilized landfast sea ice conditions (Kovacs and Sodhi, 1980, 1988; Kovacs, 1984; Mahoney et al., 2004). However, local observers have never seen an ivu occur at Cape Espenberg, and there are few recent scientific accounts of their occurrence in the region, especially in late December. To address this gap in knowledge, this article documents a significant ivu event (Figure 1) that occurred on a remote stretch of shoreline along the Chukchi Sea at Cape Espenberg to advance the understanding of the occurrence and implications of these coastal hazards. These novel results serve to highlight the environmental conditions that lead to destructive ivu, its geomorphic impacts, and potential linkages between this event and regional trends in sea ice decline.
Spatial Extent and Geomorphic Impacts
Upon mapping and noting the characteristics of disturbance along the 3.5 km stretch, it became evident that the variability in foreshore and backshore morphology between the three sections (e.g., beach slope, insipient dune crest elevation, etc.) played a major role in controlling the degree of disturbance. Specifically, the orientation of dune ridges along the Cape relative to the affected coastline resulted in the differing geomorphic impacts between the eastern and central sections compared to the western section. The western section’s coastline runs parallel to the dune ridges and is likely why the nature of disturbance and erosion was uniform along this stretch. Conversely, the eastern and central sections run perpendicular to the dune ridges and explain the highly variable nature of geomorphic impacts and erosion along these two sections. This agrees with previous studies that identify coastal morphology as a first-order controller on the nature and extent of coastal change (e.g., Manson et al., 2005; Overduin et al., 2014; Farquharson et al., 2018). Similarly, the shoreline configuration seems to have played a role in controlling where the ice push occurred (e.g., Wagner, 1970; Zagórski et al., 2015). In other words, the sea ice within the lagoon was constrained by the mainland to the west and offshore bars to the east, which concentrated stress release to the north when forced with southerly winds. These constraining features are made evident in SAR scenes preceding the ice push event, as they delineate the shallow waters south of the spit where sea ice began forming in early November (Figure 4A). These two factors, combined with the differing substrates along the three sections (see Study Site), likely explain the spatial patterns of erosion quantified by the shoreline change analysis (i.e., Barnhart et al., 2014).
The largest NSM (18 m of erosion) identified by the shoreline change analysis occurred along the eastern section, coming within meters of an active archeological site containing the remains of 1,000-year-old driftwood houses and irreplaceable artifactual records (Alix et al., 2017). Although it is important to reiterate that the elevations, erosion rates, and volumetric change statistics reported in the sections above were measured 6 months after the ice push occurred, with this in mind, the volume and height of the debris pile are surely underestimated, as roughly 2.5 months of melting had occurred preceding the field campaign (National Oceanic and Atmospheric Administration [NOAA], 2016). This melting was made evident by the presence of melt water pools and channels along the affected coastline, predominately in the western and eastern sections. The western section had large blocks ripped from the bluff face and cast upward and landward onto the ridge crest, exposing subsurface permafrost along the bluff (Figure 11). Marine debris along the western ridge crest flooded existing thermokarst features and indicates that storm water, likely from wave run-up, reached this elevation (5 m MHW). These impacts have likely led to a further destabilization of bluff structure and the acceleration of erosion rates at this location (e.g., Jones et al., 2009; Jorgenson and Ely, 2001; Fritz et al., 2017). A repeat survey is needed to quantify the extent to which exposed permafrost has exacerbated secondary erosion.
The substantial forces behind these geomorphic impacts demonstrate the potential threat of such events to property, infrastructure, archeological sites, and cultural resources. Regionally speaking, the widespread damage to infrastructure from the 31 December storm was mainly caused by storm surge and/or hurricane-force winds, rather than ice push, as was predominantly the case at Cape Espenberg (Alaska Dispatch News, 2017; Arctic Sounder, 2019), although the major drivers of infrastructural damage from the 31 December storm differed with geographic setting. In Kotzebue, substantial winds caused power outages and damaged multiple buildings, whereas further south in Norton Sound, storm surge led to some of the highest sea levels observed in living memory for the month of December (Arctic Sounder, 2019). St. Lawrence Island took a direct hit from the storm. Damage from storm surge flooding and wind was reported to have occurred at 25 homes on the island, with one house being completely ripped in half and another being blown off its foundation (Arctic Sounder, 2019). Gambell, located on the northwest side of the island, saw its runway flooded and had more infrastructural damage than any other location (Arctic Sounder, 2019). The wind-turbine power plant in Gambell also had to be shut down, due to wind gusts reportedly exceeding 55 m s–1 (125 mph) (Alaska Dispatch News, 2017). Unfortunately, few empirical data regarding coastal change and other damage were collected. This point exemplifies the contribution of this study and the need of increased meteorological and water-level instrumentation in the region.
Chronology and Environmental Conditions
The SAR and meteorological data were especially helpful in interpreting the quasi-daily changes in sea ice and weather conditions that culminated in the ivu. This portion of the analysis made it apparent that the ivu at Cape Espenberg was made possible through a “perfect alignment” of sea ice dynamics, atmospheric forcing, and geomorphic setting. Identifying these preceding conditions to an ice push event at a given location is particularly useful to inform sea ice modeling and forecasting, given that ice push events are so episodic in nature (Mahoney et al., 2004). Additionally, although ivu events have been recorded at all times during the ice season, additional mechanisms must be active to incur an ice push event during the colder months (Mahoney et al., 2004), as was the case at Cape Espenberg. Thus, lead-up conditions are discussed in further detail below.
In the days preceding the arrival of the first low-pressure system on 18 December, temperatures rose from −23 to −3°C between 09 and 17 December as recorded at NWS meteorological station PAOT at Kotzebue airport (National Oceanic and Atmospheric Administration [NOAA], 2016). It is likely that this increase in temperature resulted in thermal cracking and weakening of the landfast sea ice due to differential thermal expansion (e.g., Cox, 1983; Johnson and Metzner, 1990). After this rise in temperature, a low-pressure system moved over the Cape between 18 and 20 December, contributing to the 0.6 m (MHW) water level observed at the Red Dog Dock on 19 December due to the inverse barometer effect (Ponte, 2006; National Oceanic and Atmospheric Administration [NOAA], 2020). In fact, the water level observed on 19 December was the highest that had occurred since 17 November (0.6 m MHW) and before the 31 December storm surge (1.9 m MHW) (National Oceanic and Atmospheric Administration [NOAA], 2020). These factors, combined with the northerly winds observed between 19 and 20 December, likely destabilized the landfast ice directly south of the Cape, resulting in the open-water lead and, possibly, the bright curvilinear features evident in the 24 December SAR scene (Figure 4B).
Another precursor to the ice push event was the expanse of open water in the Bering and Chukchi Seas as the 31 December storm moved to the northeast along its track. This factor likely contributed to the extreme nature of the storm in terms of wind, surge, and resultant infrastructural damage (Wicks, 2015; Alaska Dispatch News, 2017; Arctic Sounder, 2019). Storms of this or greater magnitude are projected to become more common in the region (Sepp and Jaagus, 2011). Recent atmospheric studies in the Arctic report an increase in the frequency and intensity of storm activity, generally attributed to regional warming and enhanced thermal contrast between the land and sea along the Arctic Frontal Zone (Zhang et al., 2004; Sepp and Jaagus, 2011; Day and Hodges, 2018). Specifically, a study by Sepp and Jaagus (2011) found that the trend in the annual total number of cyclones in the Arctic shows an increase of 55.8 cyclones over the period 1948–2002 and that the greatest increase in the frequency of cyclones was during the winter. There was a significant increase in the frequency of cyclones that specifically moved into the Arctic basin through the Bering Strait, as was the case for the 31 December storm (Sepp and Jaagus, 2011). Moreover, the same study identified that the sea-level pressure of Arctic cyclones showed a significant decreasing trend of 2.5 hPa (stronger storms) over the same study period. These findings align with other atmospheric studies on cyclone intensity and frequency in the region (McCabe et al., 2001; Atkinson, 2005; Vermaire et al., 2013). A lack of continuous, long−term data extending beyond a few decades has made it difficult to adequately assess these trends and project any future impacts (Manson and Solomon, 2007; Vermaire et al., 2013).
Potential Linkages to Arctic Warming
Taken individually, the factors that culminated in the ivu (e.g., midwinter breakout event, low sea ice extent in Bering Sea, storm surge, hurricane force winds, etc.) do not necessarily seem anomalous. However, the culmination of these forces at the end of December suggests a linkage between this event and the decrease in local and regional sea ice extent associated with a warming Arctic. One of the key factors that contributed to the 31 December ice push event was the midwinter breakout of landfast ice around the tip of Cape Espenberg, which has been a rare phenomenon until recent decades (Mahoney et al., 2014). Historically, most ice push events are constrained to the late fall or spring when warmer temperatures result in ice being less stable (Mahoney et al., 2004). During these shoulder seasons, areas of open water directly adjacent to the beach may form a condition that has been shown to increase the likelihood of ice push given the reduction of resistive forces in the nearshore (i.e., Mahoney et al., 2004). For this reason, the formation of the open-water lead along the affected coastline of Cape Espenberg around 24 December (Figure 4) corresponding to both a low-pressure system and close to freezing temperatures increased the likelihood that an ice push could occur at that location. Recently, these midwinter breakout events have been occurring more frequently in northwestern Alaska and are predicted to occur throughout the winter season in the future (Fienup-Riordan and Rearden, 2010; Dammann et al., 2016). This point is made all the more relevant, given the temperature during the 31 December storm tied 1982, 2013, 2015, and 2017 as the warmest temperature recorded in December for Kotzebue (National Oceanic and Atmospheric Administration [NOAA], 2016). If these historically rare breakouts become a normal occurrence, the chance of ivu will likely increase.
Another factor that contributed to the ivu was the lack of continuous sea ice in the Northern Bering Sea prior to the event, which directly contributed to the 1.9 m (MHW) storm surge (observed minus predicted water level) measured on 31 December at the Red Dog Dock, the highest recorded surge in the month of December and second highest overall in the station’s 17-year operating history (Wicks, 2015). As a testament to the extreme nature of the 31 December surge at Red Dog Dock, it exceeded that of the notoriously destructive November 2011 storm (1.46 m MHW), which impacted the entire western Alaska coastline (Herndon, 2011; Wicks, 2015; National Oceanic and Atmospheric Administration [NOAA], 2020) and caused widespread coastal inundation, destroying critical infrastructure such as airports and sewage treatment facilities (Herndon, 2011; Terenzi et al., 2014; Buzard et al., submitted). The surge on 31 December was considerably higher at Cape Espenberg with the combined surge and wave run-up height measured at 5 m MHW. This decline in the duration and extent of sea ice in the Bering and Chukchi Seas has been well-documented in the literature (e.g., Douglas, 2010; Mahoney, 2018; Overland et al., 2018; Petty et al., 2018; Walsh et al., 2018; Thoman et al., 2020). According to the Alaska Ocean Observatory Network (AOOS) Sea Ice Atlas, sea ice concentration at the mouth of Kotzebue Sound (67.00°N 164.50°W) in December 2016 was the 17th lowest over the entire 168-year record for the month of December (Alaska Ocean Observing System [AOOS], 2014; Figure 12). Recent analyses of historical sea ice trends show that sea ice duration has declined, on average, 1 day per year since 1980 and that the seaward edge of the landfast ice around the mouth of Kotzebue Sound now lies over 30 km closer to shore than it did during the late 1970s (Mahoney et al., 2014; Farquharson et al., 2018). The negative trends in sea ice extent and duration are leading to a greater number of days with longer fetch distances (Farquharson et al., 2018). These findings, which equate to 2 additional months of open water in 2018 compared with 1979, are in line with comparable decadal changes in the length of the landfast sea ice season elsewhere on the Chukchi coast (Mahoney et al., 2014) and highlight the potential for increased open-water fetch and significant surge events in the future. Coastal permafrost erosion in the region has also accelerated in response to the increase in open water, which increases wave impact hours and thermoerosional processes (Farquharson et al., 2018; Jones et al., 2018). Thus, the same sea ice conditions that contributed to the ice push event at Cape Espenberg have likely exacerbated thermoerosion along the affected coastline, especially along the western stretch where the ice-rich permafrost along the bluff was exposed (Mason et al., 1997a).
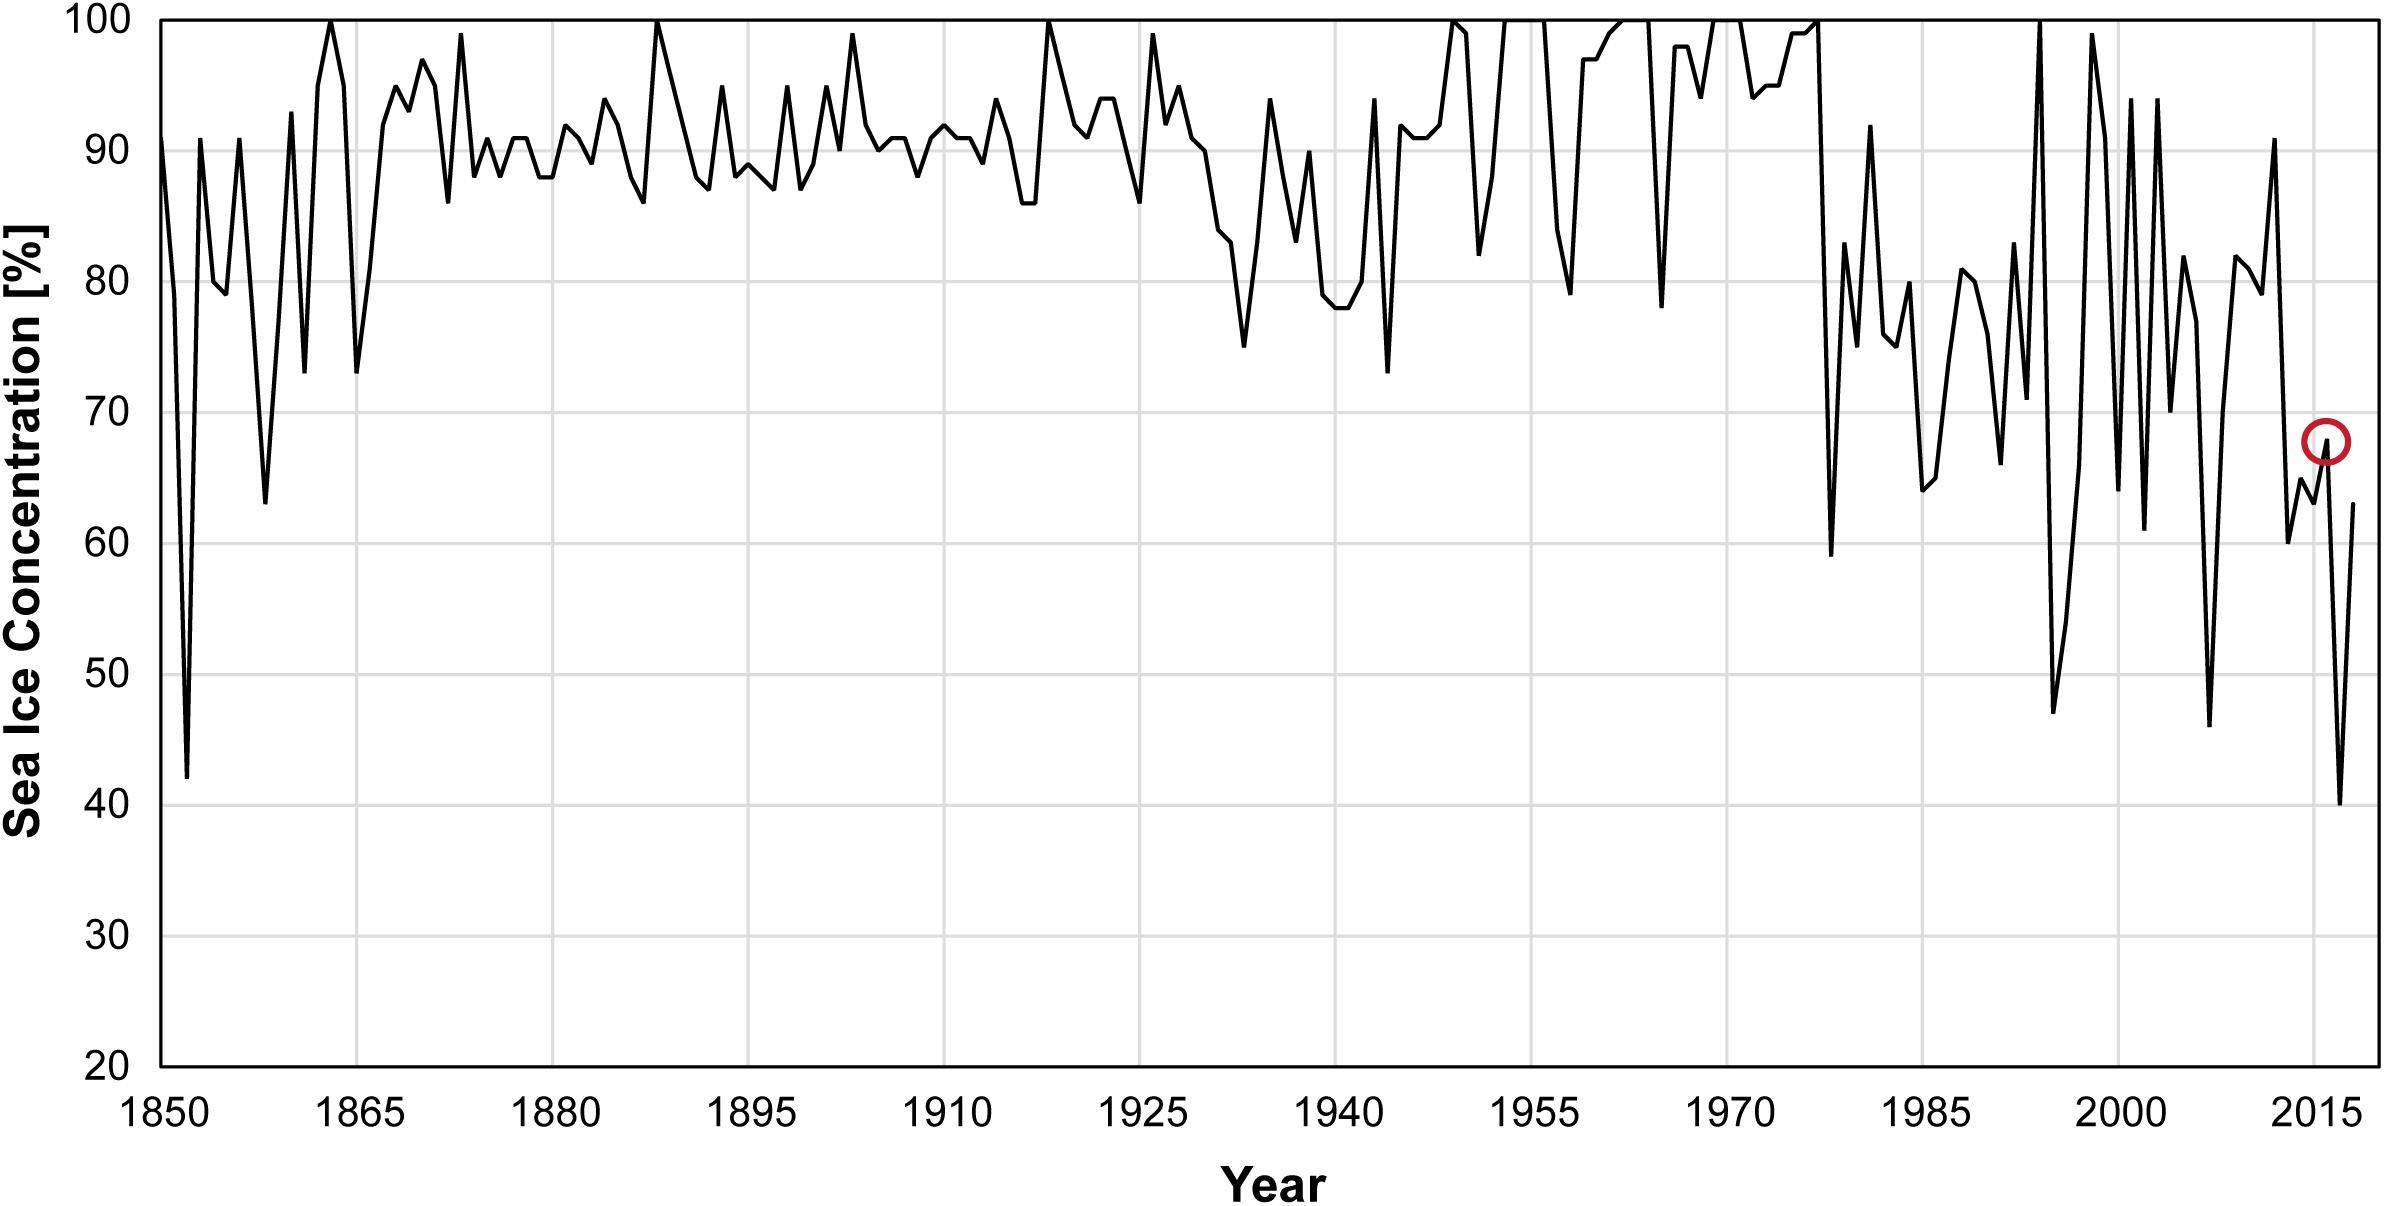
Figure 12. Sea ice concentration compiled from the Alaska Ocean Observatory Network (AOOS) Sea Ice Atlas for the month of December between 1850 and 2018 at the mouth of Kotzebue Sound (67.00°N, -164.50°W). (0–30%) Open Water to very open drift, (30–90%) open drift to close pack, (90–100%) very close pack to compact. December 2016 (noted by the red circle) represents the 17th lowest December sea ice concentration over the entire 168-year record (Alaska Ocean Observing System [AOOS], 2014).
Conclusion
In winter 2016, anomalous sea ice conditions and an extreme midwinter storm culminated in a powerful ivu along the coastline of Cape Espenberg. The ice push event was reconstructed by using ground surveys; traditional ecological knowledge; news reports; and meteorological, water level, and SAR data. Between 18 and 20 December, a low-pressure system coupled with offshore winds destabilized the shorefast ice, which led to the formation of an open-water lead along the impacted coastline. On 31 December, an extreme storm tracked through the Bering Strait and into Kotzebue Sound leading to a significant storm surge brought about by open water and long fetch distances in the Northern Bering Sea. The strong onshore winds and storm surge pushed the unfastened ice sheet in Kotzebue Sound northward onto the exposed tip of the Cape. The ice push affected ∼3.5 km of coastline and was predominantly an ice pile-up, with some ice ride-up occurring in the low-lying central areas. Additionally, along the western section, the exposure of ice-rich permafrost along the bluff and flooding of existing thermokarst features by storm surge may enhance bluff destabilization at this location. The anomalous local and regional sea ice conditions documented by this study are characteristic of wider trends in the region. If temperatures continue to rise in the Arctic along with the number of open water days, coastal hazards such as ivu may become more common in the future.
Data Availability Statement
The datasets generated for this study are available on request to the corresponding author.
Author Contributions
CM and RBo led field work activities and the design and execution of the manuscript. RBo processed and interpreted project data and created visualizations. OM contributed field observations, photographs, and expert interpretations of the event and also provided background information and context regarding the geomorphic evolution of Cape Espenberg as well as the occurrence of ice push events in northwestern Alaska. RBu processed and interpreted remotely sensed sea ice data and contributed to related sections in the manuscript. AM provided expert consultation on the use of SAR data and other components of the manuscript related to sea ice dynamics. CW contributed editorial expertise and ensured clear scientific communication throughout the writing of the manuscript. All authors contributed to the article and approved the submitted version.
Funding
The project was funded by the National Science Foundation, Arctic Social Science Program – Grants # ARC-1523160 to Drs. Claire Alix, OM, and Nancy Bigelow at the University of Alaska Fairbanks.
Conflict of Interest
The authors declare that the research was conducted in the absence of any commercial or financial relationships that could be construed as a potential conflict of interest.
Acknowledgments
We would like to express our gratitude to Sarah Thunberg, UAF MSc student, for providing the data and scripts to make the atmospheric plots included in this manuscript. We would also like to thank Mr. Fred Goodhope for his observations and discussions regarding the ivu event. Dr. Alix facilitated all field work activities and provided photographs for this paper. We also thank Dr. Nancy Bigelow for her extensive work in the field and lab. We also acknowledge the contributions made by the entire Cape Espenberg research and support team. Edward Plumb and Jonathan Chriest from the NWS were gracious with their time and provided first hand meteorological information regarding the storm event. Detailed comments and feedback from two reviewers greatly improved this manuscript. Nathan Wardwell of JOA Surveys assisted with the production of the tidal datum. Matt Nolan of Fairbanks Fodar provided the digital surface model used in coastal change detection. Figure 3 DEM provided by the Polar Geospatial Center under NSF-OPP awards 1043681, 1559691, and 1542736. We would like to thank the National Science Foundation PerCSNet project, NSF-OISE 1927553, for the support of this publication. We also thank the University of Alaska Fairbanks Vice Chancellor of Research office for financially supporting this publication.
Footnotes
- ^ https://search.asf.alaska.edu/#/
- ^ https://tidesandcurrents.noaa.gov/stationhome.html?id=9491094
- ^ https://cds.climate.copernicus.eu/cdsapp#!/dataset/reanalysis-era5-single-levels?tab=form
- ^ https://www.wunderground.com/weather/us/ak/kotzebue/PAOT
References
Alaska Dispatch News (2017). Winter Storm in Savoonga Draws Experts in Weather Emergencies. Available online at: https://www.adn.com/alaska-news/2017/01/05/winter-storm-in-savoonga-draws-experts-in-weather-emergencies/ (accessed June 1, 2019).
Alaska Ocean Observing System [AOOS] (2014). Data from: Historical Sea Ice Atlas: Alaska Sea Ice, Mid-1800s to the Present. Fairbanks: University of Alaska.
Alaska Satellite Facility [ASF] (2019). Available online at: https://search.asf.alaska.edu/#/ (accessed November 24, 2019).
Alix, C., Mason, O. K., Norman, L., Grieve-Rawson, S., Bigelow, N. H., Lincoln, A., et al. (2017). “The cape espenberg birnirk Project-A report on the 2016 field season of archaeology, geomorphology and anthropology,” in Proceedings of the 44th Annual Meeting Alaska Anthropological Association Fairbanks.
Arctic Sounder (2019). Winter Storm Lams Western Alaska Coast. Available online at: http://www.thearcticsounder.com/article/1701winter_storm_slams_western_alaska_coast (accessed June 1, 2019).
Atkinson, D. E. (2005). Observed storminess patterns and trends in the circum-Arctic coastal regime. Geo Mar. Lett. 25, 98–109. doi: 10.1007/s00367-004-0191-0
Barker, A., and Timco, G. (2016). Beaufort Sea rubble fields: characteristics and implications for nearshore petroleum operations. Cold Regions Sci. Technol. 121, 66–83. doi: 10.1016/j.coldregions.2015.09.016
Barker, A., and Timco, G. W. (2017). Maximum pile-up heights for grounded ice rubble. Cold Regions Sci. Technol. 135, 62–75. doi: 10.1016/j.coldregions.2016.12.001
Barnhart, K. R., Overeem, I., and Anderson, R. S. (2014). The effect of changing sea ice on the physical vulnerability of Arctic coasts. Cryosphere 8, 1777–1799. doi: 10.5194/tc-8-1777-2014
Blier, W., Keefe, S., Shaffer, W. A., and Kim, S. C. (1997). Storm surges in the region of western Alaska. Monthly Weather Rev. 125, 3094–3108. doi: 10.1175/1520-0493(1997)125<3094:ssitro>2.0.co;2
Boak, E. H., and Turner, I. L. (2005). Shoreline definition and detection: a review. J. Coast. Res. 21, 688–703. doi: 10.2112/03-0071.1
Brower, C. D. (1960). Fifty Years Below Zero: A Lifetime of Adventure in the Far North. New York, NY: DoodMead Co.
Christensen, F. T. (1994). Ice ride-up and pile-up on shores and coastal structures. J. Coast. Res. 10, 681–701.
Copernicus Climate Change Service (C3S) (2017). Data from: ERA5 Fifth generation of ECMWF Atmospheric Reanalyses of the Global Climate. Available online at: https://cds.climate.copernicus.eu/cdsapp#!/home (accessed May 8, 2020).
Cox, G. F. (1983). Thermal expansion of saline ice. J. Glaciol. 29, 425–432. doi: 10.3189/S0022143000030343
Dammann, D. O., Eicken, H., Mahoney, A. R., Meyer, F. J., Freymueller, J. T., and Kaufman, A. M. (2018). Evaluating landfast sea ice stress and fracture in support of operations on sea ice using SAR interferometry. Cold Regions Sci. Technol. 149, 51–64. doi: 10.1016/j.coldregions.2018.02.001
Dammann, D. O., Eicken, H., Meyer, F. J., and Mahoney, A. R. (2016). Assessing small-scale deformation and stability of landfast sea ice on seasonal timescales through L-band SAR interferometry and inverse modeling. Remote Sens. Environ. 187, 492–504. doi: 10.1016/j.rse.2016.10.032
Day, J. J., and Hodges, K. I. (2018). Growing land-sea temperature contrast and the intensification of Arctic cyclones. Geophys. Res. Lett. 45, 3673–3681. doi: 10.1029/2018GL077587
Douglas, D. C. (2010). Arctic Sea Ice Decline: Projected Changes in Timing and Extent of Sea Ice in the Bering and Chukchi Seas. U.S. Geological Survey Open-File Report 2010-1176. Reston: U.S. Geological Survey.
Fairbanks FODAR (2020). Available online at: https://fairbanksfodar.com/ (accessed June 1, 2020).
Farquharson, L. M., Mann, D. H., Swanson, D. K., Jones, B. M., Buzard, R. M., and Jordan, J. W. (2018). Temporal and spatial variability in coastline response to declining sea-ice in northwest Alaska. Mar. Geol. 404, 71–83. doi: 10.1016/j.margeo.2018.07.007
Fienup-Riordan, A., and Rearden, A. (2010). “The ice is always changing: yup’ik understandings of sea ice, past and present,” in SIKU: Knowing Our Ice, eds I. Krupnik, C. Aporta, S. Gearheard, G. Laidler, and L. Kielsen Holm (Dordrecht: Springer), 295–320. doi: 10.1007/978-90-481-8587-0_13
Fritz, M., Vonk, J. E., and Lantuit, H. (2017). Collapsing Arctic coastlines. Nat. Clim. Change 7, 6–7. doi: 10.1038/nclimate3188
George, J. C., Huntington, H. P., Brewster, K., Eicken, H., Norton, D. W., and Glenn, R. (2004). Observations on shorefast ice dynamics in Arctic Alaska and the responses of the Iñupiat hunting community. Arctic 57, 363–374.
Gilbert, R. (1991). Ice pile-up on shores in northwestern Lake Ontario during winter 1990. Géographie Phys. Quatern. 45, 241–244. doi: 10.7202/032863ar
Gilbert, R., and Glew, J. R. (1986). A wind-driven ice-push event in Eastern Lake Ontario. J. Great Lakes Res. 12, 326–331. doi: 10.1016/S0380-1330(86)71733-4
Herndon, R. (2011). Storm Data and unusual weather phenomena with late reports and corrections. NatL. Clim. Data Center 53, 1–184.
Himmelstoss, E. A., Henderson, R. E., Kratzmann, M. G., and Farris, A. S. (2018). Digital Shoreline Analysis System (DSAS) version 5.0 user guide (No. 2018-1179). Reston: US Geological Survey.
Hoffecker, J. F., and Mason, O. K. (2010). Human Response to Climate Change at Cape Espenberg: AD 800e1400. Field Investigations at Cape Espenberg. Available online at: https://instaar.colorado.edu/uploads/publications/cape-espenberg-2010-preliminary-report-to-nps.pdf (accessed May 5, 2020).
Jackson, C. R., and Apel, J. R. (2004). Synthetic Aperture Radar: Marine User’s Manual. Washington, DC: U.S. Department of Commerce.
Joa Surveys LLC (2020). Available online at: https://joasurveys.com/services/tidal-datum-services/ (accessed June 1, 2020).
Johnson, J. B, and Metzner, R. C. (1990). Thermal expansion coefficients for sea ice. J. Glaciol. 36, 343–349. doi: 10.3189/002214390793701327
Johnson, W. R., and Kowalik, Z. (1986). Modeling of storm surges in the Bering Sea and Norton Sound. J. Geophys. Res. Oceans 91, 5119–5128. doi: 10.1029/JC091iC04p05119
Jones, B. M., Arp, C. D., Beck, R. A., Grosse, G., Webster, J. M., and Urban, F. E. (2009). Erosional history of Cape Halkett and contemporary monitoring of bluff retreat, Beaufort Sea coast, Alaska. Polar Geography 32, 129–142. doi: 10.1080/10889370903486449
Jones, B. M., Bull, D. L., Farquharson, L. M., Buzard, R. M., Arp, C. D., Grosse, G., et al. (2018). A decade of annual permafrost coastal observations indicate changes in the Arctic System. Environ. Res. Lett. 13, 1–13. doi: 10.1088/1748-9326/aae471
Jones, J., Eicken, H., Mahoney, A., Rohith, M., Kambhamettu, C., Fukamachi, Y., et al. (2016). Landfast sea ice breakouts: stabilizing ice features, oceanic and atmospheric forcing at Barrow, Alaska. Cont. Shelf Res. 126, 50–63. doi: 10.1016/j.csr.2016.07.015
Jones, M. C., Grosse, G., Jones, B. M., and Walter Anthony, K. (2012). Peat accumulation in drained thermokarst lake basins in continuous, ice-rich permafrost, northern Seward Peninsula, Alaska. J. Geophys. Res. Biogeosci. 117:G001766.
Jorgenson, T., and Ely, C. (2001). Topography and flooding of coastal ecosystems on the Yukon-Kuskokwim Delta, Alaska: implications for sea-level rise. J. Coast. Res. 17, 124–136.
Keijsers, J. G. S., De Groot, A. V., and Riksen, M. J. P. M. (2015). Vegetation and sedimentation on coastal foredunes. Geomorphology 228, 723–734. doi: 10.1016/j.geomorph.2014.10.027
Kinsman, N. E. M., and DeRaps, M. R. (2012). Coastal hazard field investigations in response to the November 2011 Bering Sea storm DGGS RI 2012-2 v. 1.1.
Kovacs, A. (1984). Shore Ice Ride-Up and Pile-Up Features. Part 2. Alaska’s Beaufort Sea Coast–1983 and 1984 (No. CRREL-84-26. Hanover, NH: Cold Regions Research And Engineering Lab.
Kovacs, A., and Sodhi, D. S. (1980). Shore ice pile-up and ride-up: field observations, models, theoretical analyses. Cold Regions Sci. Technol. 2, 210–288. doi: 10.1016/0165-232X(80)90076-2
Kovacs, A., and Sodhi, D. S. (1988). “Onshore ice pile-up and ride-up: observations and theoretical assessment,” in Arctic Coastal Processes and Slope Protection Design, eds A. T. Chen and C. B. Leidersdorf (Reston: ASCE), 108–142.
Kowalik, Z. (1984). Storm surges in the Beaufort and Chukchi seas. J. Geophys. Res. Oceans 89, 10570–10578. doi: 10.1029/JC089iC06p10570
Leffingwell, E. (1919). The Canning River region, northern Alaska, U.S. Geological Survey Professional paper 109. Reston: U.S. Geological Survey.
Mahoney, A., Eicken, H., Shapiro, L., and Grenfell, T. C. (2004). Ice motion and driving forces during a spring ice shove on the Alaskan Chukchi coast. J. Glaciol. 50, 195–207. doi: 10.3189/172756504781830141
Mahoney, A. R. (2018). Landfast Sea Ice in a Changing Arctic, in Arctic Report Card 2018. Silver Spring, MD: NOAA.
Mahoney, A. R., Eicken, H., Gaylord, A. G., and Gens, R. (2014). Landfast sea ice extent in the Chukchi and Beaufort Seas: the annual cycle and decadal variability. Cold Regions Sci. Technol. 103, 41–56. doi: 10.1016/j.coldregions.2014.03.003
Mahoney, A. R., Eicken, H., and Shapiro, L. (2007). How fast is landfast sea ice? A study of the attachment and detachment of nearshore ice at Barrow, Alaska. Cold Regions Sci. Technol. 47, 233–255. doi: 10.1016/j.coldregions.2006.09.005
Maio, C. V., Bigelow, N., and Combs, E. (2017). “Sand, peat, and sediment cores: addressing unanswered questions at Cape Espenberg to provide environmental context to the Birnirk-Thule transition,” in Proceedings of the 44th Annual Meeting of the Alaska Anthropological Association, February 27th – March 2nd, 2017 Fairbanks.
Maio, C. V., Bogardus, R. C., Bigelow, N. H., Buzard, R. M., and Roberts, J. W. (2018). “A 3000-year sediment proxy record of extreme storm surges, chukchi coastline, Alaska,” in Proceedings of the AGU Fall Meeting Abstracts 2018. Abstract retrieved from the SAO/NASA Astrophysics Data System Washington, DC.
Maio, C. V., Gontz, A. M., Tenenbaum, D. E., and Berkland, E. P. (2012). Coastal hazard vulnerability assessment of sensitive historical sites on Rainsford Island, Boston Harbor, Massachusetts. J. Coast. Res. 28, 20–33. doi: 10.2112/JCOASTRES-D-10-00104.1
Manson, G. K., and Solomon, S. M. (2007). Past and future forcing of Beaufort Sea coastal change. Atmos. Ocean 45, 107–122. doi: 10.3137/ao.450204
Manson, G. K., Solomon, S. M., Forbes, D. L., Atkinson, D. E., and Craymer, M. (2005). Spatial variability of factors influencing coastal change in the western Canadian Arctic. Geo Mar. Lett. 25, 138–145. doi: 10.1007/s00367-004-0195-9
Mason, O. K., Hopkins, D. M., and Plug, L. (1997a). Chronology and paleoclimate of storm-induced erosion and episodic dune growth across Cape Espenberg Spit, Alaska, USA. J. Coast. Res. 13, 770–797.
Mason, O. K., and Jordan, J. W. (1993). Heightened North Pacific storminess during synchronous late Holocene erosion of Northwest Alaska beach ridges. Quatern. Res. 40, 55–69. doi: 10.1006/qres.1993.1056
Mason, O. K., Neal, W. J., Pilkey, O. H., Bullock, J., Fathauer, T., and Pilkey, D. (1997b). Living with the Coast of Alaska. Durham: Duke University Press.
Mason, O. K., Salmon, D. K., and Ludwig, S. L. (1996). The periodicity of storm surges in the Bering Sea from 1898 to 1993, based on newspaper accounts. Clim. Change 34, 109–123. doi: 10.1007/BF00139256
McCabe, G. J., Clark, M. P., and Serreze, M. C. (2001). Trends in Northern Hemisphere surface cyclone frequency and intensity. J. Clim. 14, 2763–2768. doi: 10.1175/1520-0442(2001)014<2763:tinhsc>2.0.co;2
Mesquita, M. S., Atkinson, D. E., and Hodges, K. I. (2010). Characteristics and variability of storm tracks in the North Pacific, Bering Sea, and Alaska. J. Clim. 23, 294–311. doi: 10.1175/2009JCLI3019.1
National Oceanic and Atmospheric Administration [NOAA] (2016). Data from: National Weather Service (NWS) Station PAOT, Kotzebue. Silver Spring, MD: NOAA.
National Oceanic and Atmospheric Administration [NOAA] (2020). Data from: Water Levels - NOAA Tides, and Currents. Silver Spring, MD: NOAA.
National Park Service [NPS] (2020). Available online at: https://www.nps.gov/bela/learn/historyculture/cape-espenburg.html (accessed May 12, 2020).
Onstott, R. G., and Carsey, F. D. (1992). SAR and scatterometer signatures of sea ice. Microwave Remote Sens. Sea Ice 68, 73–104. doi: 10.1029/gm068p0073
Overduin, P. P., Strzelecki, M. C., Grigoriev, M. N., Couture, N., Lantuit, H., St-Hilaire-Gravel, D., et al. (2014). Coastal changes in the Arctic. Geol. Soc. 388, 103–129. doi: 10.1144/SP388.13
Overland, J. E., Wang, M., and Ballinger, T. J. (2018). Recent increased warming of the Alaskan marine Arctic due to midlatitude linkages. Adv. Atmos. Sci. 35, 75–84. doi: 10.1007/s00376-017-7026-1
Pajak, M. J., and Leatherman, S. (2002). The high water line as shoreline indicator. J. Coast. Res. 18, 329–337.
Petty, A. A., Stroeve, J. C., Holland, P. R., Boisvert, L. N., Bliss, A. C., Kimura, N., et al. (2018). The Arctic sea ice cover of 2016: a year of record-low highs and higher-than-expected lows. Cryosphere 12, 433–452. doi: 10.5194/tc-12-433-2018
Ponte, R. M. (2006). Low-frequency sea level variability and the inverted barometer effect. J. Atmos. Ocean. Technol. 23, 619–629. doi: 10.1175/JTECH1864.1
Porter, C., Morin, P., Howat, I., Noh, M., Bates, B., Peterman, K., et al. (2018). Data from: “ArcticDEM” Harvard Dataverse, V1. Minneapolis, MN: University of Minnesota.
Ruggiero, P., Kratzmann, M. G., Himmelstoss, E. A., Reid, D., Allan, J., and Kaminsky, G. (2013). National Assessment of Shoreline Change: Historical Shoreline Change Along the Pacific Northwest Coast. Reston: US Geological Survey.
Sallenger, A. H. (1983). Measurements of Debris-Line Elevations and Beach Profiles Following A Major Storm; Northern Bering Sea Coast of Alaska (No. 83-394). Reston: US Geological Survey.
Sepp, M., and Jaagus, J. (2011). Changes in the activity and tracks of Arctic cyclones. Clim. Change 105, 577–595. doi: 10.1007/s10584-010-9893-7
Shapiro, L. H., Metzner, R. C., Hanson, A., and Johnson, J. B. (1984). “Fast ice sheet deformation during ice-push and shore ice ride-up,” in the Alaskan Beaufort Sea, eds E. Reimnitz, P. W. Barnes, and D. M. Schell (Cambridge, MA: Academic Press), 137–157. doi: 10.1016/b978-0-12-079030-2.50013-7
Sodhi, D. S., Hirayama, K., Haynes, F. D., and Kato, K. (1983). Experiments on ice ride-up and pile-up. Ann. Glaciol. 4, 266–270. doi: 10.3189/S0260305500005589
Stewart, B. C., Kunkel, K. E., Stevens, L. E., Sun, L., and Walsh, J. E. (2013). Regional Climate Trends and Scenarios for the US National Climate Assessment: Part 7. Climate of Alaska. Silver Spring, MD: NOAA. NOAA Technical Report NESDIS.
Terenzi, J., Jorgenson, M. T., Ely, C. R., and Giguère, N. (2014). Storm-surge flooding on the Yukon-Kuskokwim delta, Alaska. Arctic 360–374. doi: 10.14430/arctic4403
Thoman, R. L., Bhatt, U. S., Bieniek, P. A., Brettschneider, B. R., Brubaker, M., Danielson, S. L., et al. (2020). The record low bering sea ice extent in 2018: context, impacts, and an assessment of the role of anthropogenic climate change. Bull. Am. Meteorol. Soc. 101, S53–S55. doi: 10.1175/BAMS-D-19-0175.1
Vermaire, J. C., Pisaric, M., Thienpont, J. R., Mustaphi, C. J., Kokelj, S. V., and Smol, J. P. (2013). Arctic climate warming and sea ice declines lead to increased storm surge activity. Geophys. Res. Lett. 40, 1386–1390. doi: 10.1002/grl.50191
Wagner, W. P. (1970). Ice movement and shoreline modification, Lake Champlain, Vermont. Geol. Soc. Am. Bull. 81, 117–126.
Walsh, J. E., Thoman, R. L., Bhatt, U. S., Bieniek, P. A., Brettschneider, B., Brubaker, M., et al. (2018). The high latitude marine heat wave of 2016 and its impacts on Alaska. Bull. Am. Meteorol. Soc. 99, S39–S43. doi: 10.1175/BAMS-D-17-0105
Weaver, S. A., Ucar, Z., Bettinger, P., and Merry, K. (2015). How a GNSS receiver is held may affect static horizontal position accuracy. PLoS One 10:e0124696. doi: 10.1371/journal.pone.0124696
Wicks, A. J. (2015). Coastal Storm Surge Identification, Classification, and Evaluation at Red Dog Dock, Alaska, 2004-2014. dissertation/master’s thesis, University of Victoria Victoria, BC.
Zagórski, P., Rodzik, J., Moskalik, M., Strzelecki, M., Lim, M., Błaszczyk, M., et al. (2015). Multidecadal (1960–2011) shoreline changes in Isbjørnhamna (Hornsund, Svalbard). Polish Polar Res. 36, 369–390. doi: 10.1515/popore-2015-0019
Zarillo, G. A., Kelley, J., and Larson, V. (2008). A GIS Based Tool for Extracting Shoreline Positions from Aerial Imagery (BeachTools) revised (No. ERDC/CHL-CHETN-IV-73). Vicksburg, MS: Engineer Research And Development Center Vicksburg Ms Coastal And Hydraulics Lab.
Zhang, X., Walsh, J. E., Zhang, J., Bhatt, U. S., and Ikeda, M. (2004). Climatology and interannual variability of Arctic cyclone activity: 1948–2002. J. Clim. 17, 2300–2317. doi: 10.1175/1520-0442(2004)017<2300:caivoa>2.0.co;2
Keywords: Cape Espenberg, sea ice, Kotzebue Sound, Arctic, storm surge, erosion, climate change, ivu
Citation: Bogardus R, Maio C, Mason O, Buzard R, Mahoney A and de Wit C (2020) Mid-Winter Breakout of Landfast Sea Ice and Major Storm Leads to Significant Ice Push Event Along Chukchi Sea Coastline. Front. Earth Sci. 8:344. doi: 10.3389/feart.2020.00344
Received: 17 December 2019; Accepted: 24 July 2020;
Published: 27 August 2020.
Edited by:
Annett Bartsch, b.geos, AustriaReviewed by:
Aleksey Maslakov, Lomonosov Moscow State University, RussiaGeorge Tanski, Vrije Universiteit Amsterdam, Netherlands
Copyright © 2020 Bogardus, Maio, Mason, Buzard, Mahoney and de Wit. This is an open-access article distributed under the terms of the Creative Commons Attribution License (CC BY). The use, distribution or reproduction in other forums is permitted, provided the original author(s) and the copyright owner(s) are credited and that the original publication in this journal is cited, in accordance with accepted academic practice. No use, distribution or reproduction is permitted which does not comply with these terms.
*Correspondence: Reyce Bogardus, cmNib2dhcmR1c0BhbGFza2EuZWR1; Christopher Maio, Y3ZtYWlvQGFsYXNrYS5lZHU=