 Ching-Chou Fu
 Lou-Chuang Lee1
 Dimitar Ouzounov
 Jyh-Cherng Jan
- 1Institute of Earth Sciences, Academia Sinica, Taipei, Taiwan
- 2Schmid College of Science and Technology, Physics, Computational Science and Engineering, Chapman University, Orange, CA, United States
- 3Marine Meteorology Center, Central Weather Bureau, Taipei, Taiwan
This paper proposes an analysis method, using the National Oceanic and Atmospheric Administration satellite data, to trace variations in outgoing longwave radiation (OLR) for finding the precursors of earthquakes. The significance of these observations is investigated using data sets of recent M ≥6.0 earthquakes around the Taiwan area from 2009 to 2019. We suggest that the precursory signal could be an EIndex anomaly (EA) in the form of substantial thermal releases distributed near the epicenter. The consecutive appearances of OLR EAs are observed as precursors 2–15 days before significant earthquakes, and we refer to this as a pre-earthquake OLR EIndex anomaly (POEA). We interpret these thermal sources as possibly originating from electromagnetics together with gas emissions associated with pre-seismic processes. This study highlights the potential of OLR anomalous changes in earthquake precursor studies, at least in the Taiwan region.
Introduction
Outgoing long-wave radiation (OLR) is energy emitted from Earth in the form of electromagnetic radiation, which passes out of the atmosphere and into space in the form of thermal radiation. The flux of energy transport by OLR can be measured by a satellite. OLR is primarily sensitive to near-surface and atmospheric temperatures, the humidity of the air, and the presence of clouds, which are related to the intensity of convective activity as well as the latitude and altitude dependence of the variability (Kane and Buriti, 1997; Ouzounov et al., 2007; Graham et al., 2011).
Analysis of the thermal anomaly phenomenon using satellite techniques for monitoring seismically active regions has been carried out since the 1980s (Gorny et al., 1988). Many studies have reported that thermal anomalous space-time transients were detected in the OLR or thermal infrared radiation (TIR) before and/or during the earthquake preparation stage (Tronin, 1996, 2000; Tramutoli et al., 2001, 2005, 2009, 2013; Di Bello et al., 2004; Ouzounov and Freund, 2004; Ouzounov et al., 2006, 2007; Pulinets et al., 2006; Genzano et al., 2007, 2009, 2010, 2015; Pulinets and Dunajeck, 2007; Aliano et al., 2008a, b; Pergola et al., 2010; Xiong et al., 2010, 2013, 2015; Pulinets and Ouzounov, 2011; Jing et al., 2012; Lisi et al., 2015; Xiong and Shen, 2017; Khalili et al., 2019, 2020). The main mechanisms proposed for the temperature increase are (1) the emission of diffuse gases (e.g., radon and CO2) leading to a local greenhouse effect or near-ground air ionization to release heat (Tronin, 2002; Pulinets et al., 2006; Tramutoli et al., 2009, 2013; Koll and Cronin, 2018) and (2) positive hole charge or the excitation of an electric field from the stressed rock resulting in infrared emission and energy flow (Ouzounov and Freund, 2004; Freund, 2007a, b; Freund et al., 2007).
Taiwan is located on the Pacific seismic belt, where earthquake activity is intense. Many large earthquakes have occurred in Taiwan and caused seismic disasters in the past hundred years as a result of the continuous collision between the Philippine Sea Plate and the Eurasian Plate at a rate of 82 mm/yr to the north-west (Yu et al., 1997). For example, the ML7.3 Chi-Chi earthquake in 1999 killed more than 2400 people and had a substantial impact on Taiwan.
Identifying earthquake precursors has often been considered a useful method to mitigate seismic disasters. In the past few decades, a wide variety of earthquake precursors have been investigated for Taiwan, including gas and fluid geochemical changes (Liu et al., 1985; Song et al., 2003, 2006; Chyi et al., 2005; Fu et al., 2005, 2008, 2009, 2017a,b,c; Yang et al., 2005, 2006; Kuo et al., 2006, 2010; Walia et al., 2009, 2013; Kumar et al., 2015; Fu and Lee, 2018), gamma-ray monitoring (Fu et al., 2015, 2019), groundwater levels (Chia et al., 2001; Wang et al., 2001; Lai et al., 2010; Chen et al., 2013b, 2015c), borehole strain changes (Liu et al., 2009; Canitano et al., 2015, 2017; Hsu et al., 2015), seismicity changes (Chen et al., 2005, 2006; Wu and Chiao, 2006; Wu and Chen, 2007; Wu et al., 2008; Lin, 2009; Kawamura et al., 2014), tidal variations (Lin et al., 2003; Chen et al., 2012), GPS observations (Chen et al., 2013c, 2015b), lightning activity (Liu et al., 2015), geo-electromagnetic observations (Tsai et al., 2004, 2006; Yen et al., 2004, 2009; Chen et al., 2011, 2012, 2013a, 2015a, b), and seismo-ionospheric anomalies (Liu et al., 2000, 2001, 2004, 2006, 2010; Chen et al., 2004).
Previous studies have applied remote-sensing techniques to survey thermal anomalies in Taiwan (Wu et al., 2006; Liu et al., 2007; Pulinets and Ouzounov, 2011; Genzano et al., 2015; Chan and Chang, 2018; Chan et al., 2018, 2020). It is worth mentioning that a significant sequence of TIR anomalies was observed 2 weeks before the Chi-Chi earthquake and close to its epicenter. Previous studies have also proposed that the observed TIR anomalies were related to earthquakes with M >4 that occurred around Taiwan from 1995 to 2002 (Genzano et al., 2015).
These studies provide the opportunity to explore OLR/TIR variations related to energy radiating from underground toward the atmosphere as a result of rock deformation and geodynamic processes in the Taiwan area. However, most of the above-referenced studies have been limited by a lack of sufficient earthquake events with OLR results (M ≥ 6) to further investigate the potential of detecting significant earthquakes in Taiwan. Nevertheless, these potential precursory phenomena for Taiwan may provide an opportunity to better understand the physical and chemical processes before earthquakes, which would be crucial for exploring the theoretical mechanism of lithosphere–atmosphere–ionosphere coupling (LAIC) (Pulinets and Ouzounov, 2011; Kuo et al., 2011, 2014).
This paper aims to describe the characteristics of the OLR monitoring system, process the data, and systematically assess the feasibility of using the OLR method to find precursors prior to the M ≥6 earthquakes that occurred over 2009–2019 around Taiwan (Figure 1). We also interpret the observed precursors of OLR and a possible pre-earthquake generation process by comparing the results with multiple observations.
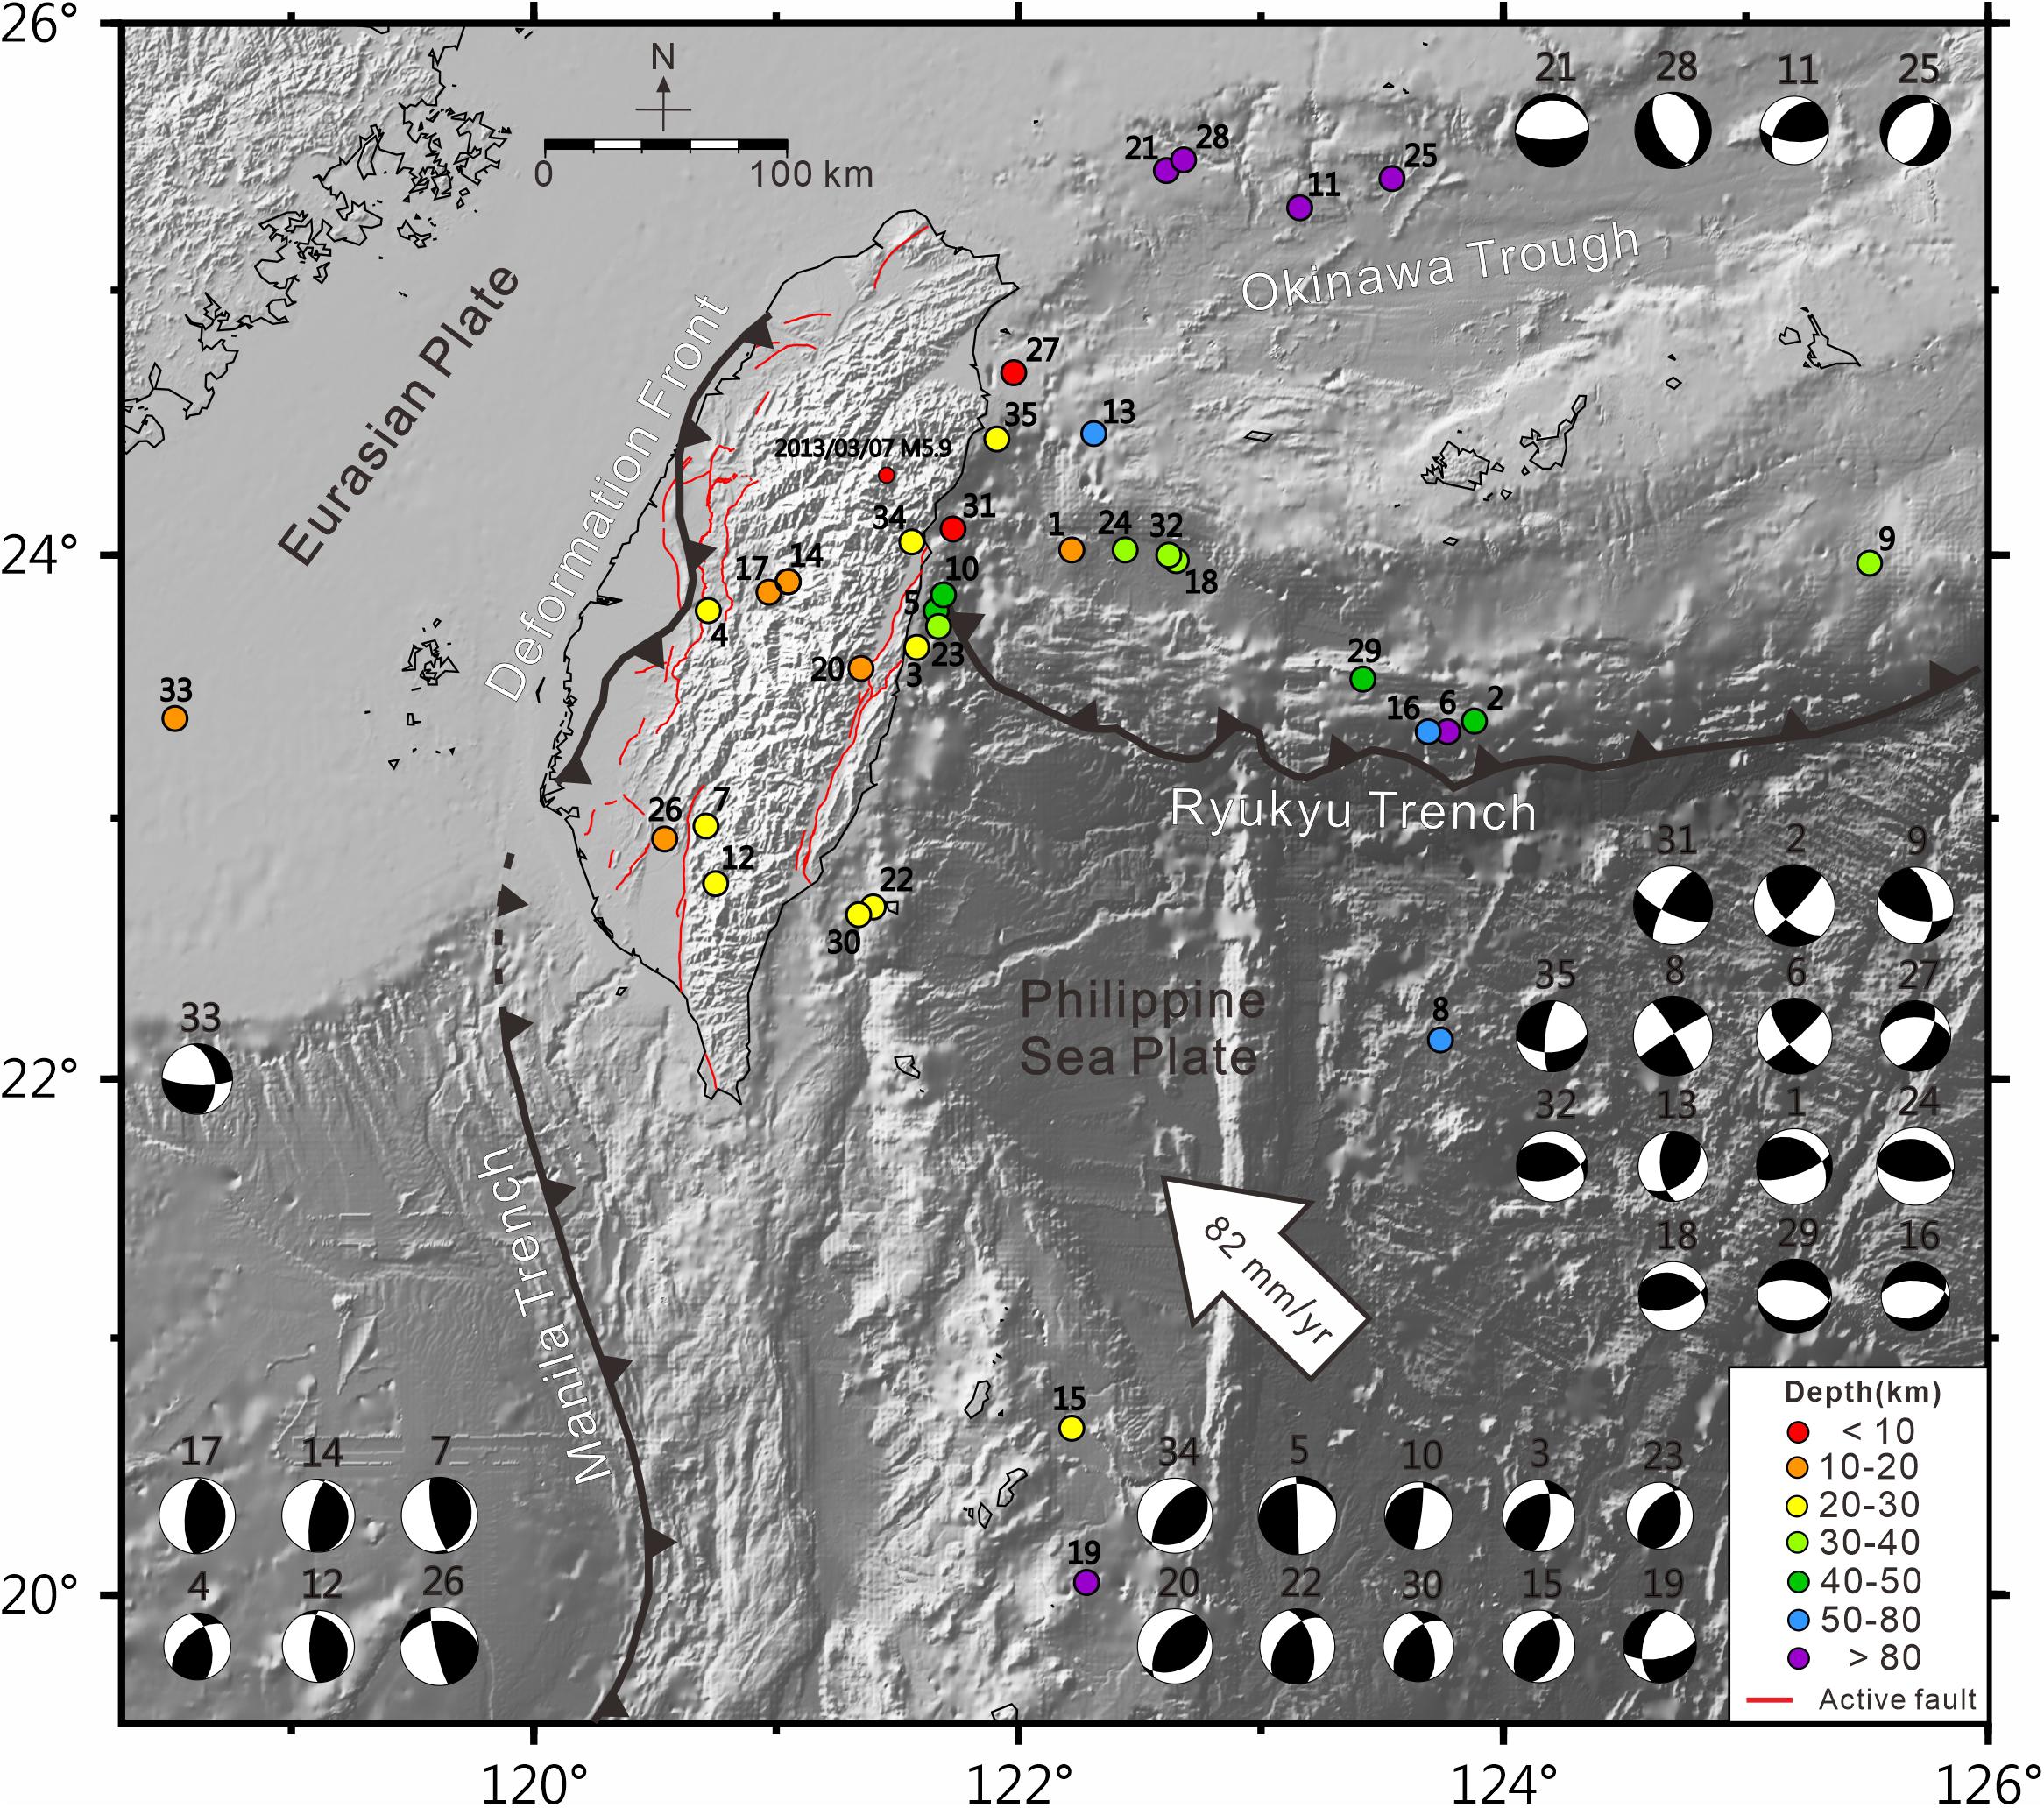
Figure 1. A regional map and the principal tectonic structures around Taiwan showing the Philippine Sea Plate moving northwest at ∼82 mm/yr toward the Eurasian Plate (Yu et al., 1997). The circles represent M ≥6 earthquake epicenters from 2009 to 2019 with the colors corresponding to different focal depths. These earthquakes are labeled and listed in Table 1. The red lines indicate the active faults of Taiwan.
Materials and Methods
The OLR data used in this study are daily measurements from the Advanced Very-High-Resolution Radiometer (AVHRR) polar orbiters NOAA-18, obtained from the NOAA Climate Prediction Center website.1 To compute the daily zonal OLR anomaly over the Taiwan area, we use a daily mean with a 1° × 1° spatial resolution in both longitude and latitude, as shown in Figure 2.
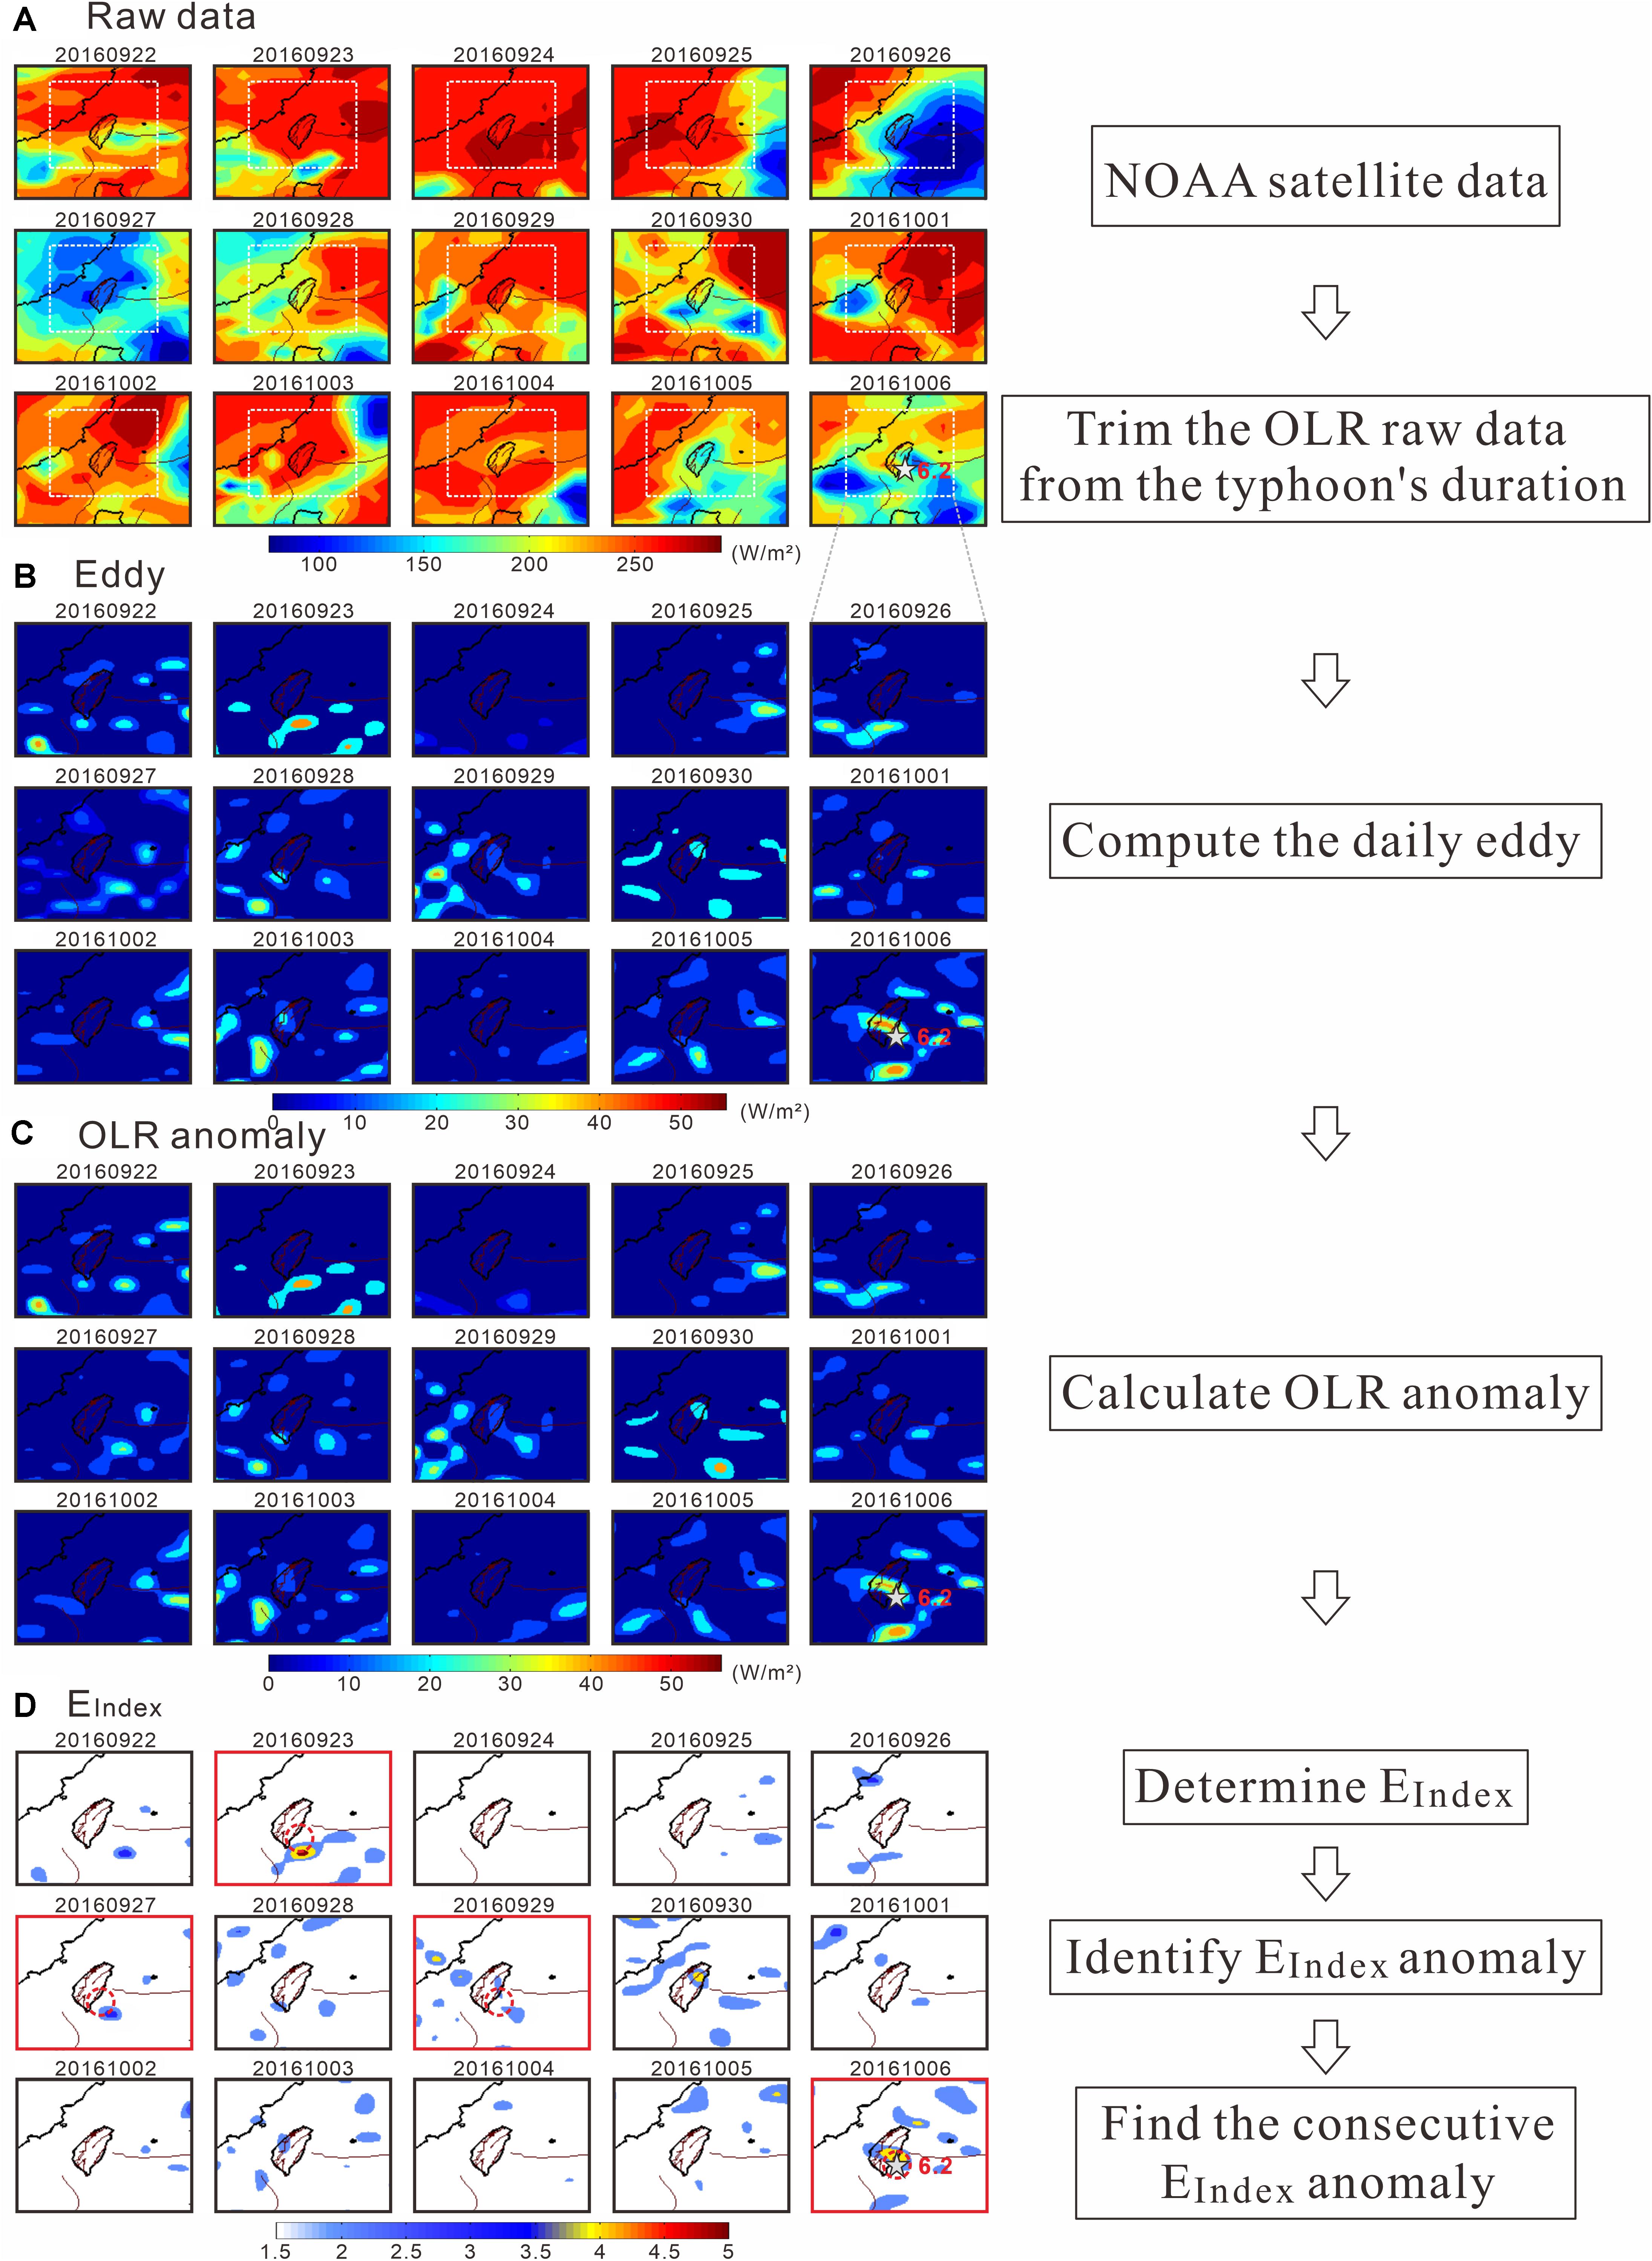
Figure 2. Flowchart of the methodology and procedure for extracting EIndex from OLR daytime data observed by the NASA-18 satellite during the period from Sept. 22 to Oct. 6, 2016: (A) the raw data of the OLR, (B) eddy, (C) OLR anomaly, and (D) EIndex. The epicenter of the M6.0 2016/10/06 earthquake is marked with a gray star. This shows an example of the abnormal EIndex anomaly (EA) within the epicenter’s vicinity with a red circle for September 23, 27, 29, and October 6 for Event 30 in southwest Taiwan.
Taiwan is located in the Pacific Ocean and has a subtropical climate, and it is frequently impacted by typhoons. Increasing sea surface temperatures can effectively increase the surface latent heat flux during the typhoon season, which means that the heavy precipitation and strong convective flow of a typhoon can induce a region of extreme negative OLR anomalies (Liebmann and Smith, 1996; Lee et al., 2006; Susskind et al., 2012; Hatchett, 2018). The latitude and altitude effects on OLR variations around the study area can be ignored, owing to the narrow latitude range and smooth topography, except in the Central Range of Taiwan. To acquire non-cloud satellite data at the time of a typhoon is difficult because of bad weather condition. In other words, the effect of the continuous presence of clouds during typhoons is strong, but the sporadic presence of clouds may be slight for data analysis. Therefore, we directly removed the OLR raw data during typhoons to diminish the contributions by typhoons to OLR variations.
It is important to note that OLR raw data were acquired twice for each location and at the same time of day (daytime and nighttime) under the similar background conditions to reduce the variability of signals due to the daily variation of temperature and humidity and the vegetation and cloud coverage. The local grid value of the OLR is subtracted from the spatial variation of the 1-year mean value as the daily eddy. The current day value (the current daily eddy) is deducted from the average value of 16 days preceding the observation day as the OLR anomaly. A standardized anomaly, EIndex, can be determined, computed from the OLR anomaly divided by a standard deviation τi,j. In this study, when EIndex is observed to have consecutive abnormal changes in some specific area in a short period, it may then be considered as a possible precursor for identifying seismic events. Seismic data are acquired from the earthquake catalogs of the Central Weather Bureau and United States Geological Survey. There are 35 seismic events with magnitudes greater than 6.0 during 2009–2019 around the Taiwan area (Figure 1) and the variation in EIndex on the nearest grid-point adjacent to the epicenter of the earthquake was selected for further investigation.
The data processing method for extracting EIndex from daytime and nighttime OLR data connected with the earthquakes is summarized in Figure 2. The procedure of data analysis uses the following equations:
where Si,j is the OLR value of the target grid-point, as defined in Figure 2A, Wi,j is the number of the surrounding grid points around the target point, and is the yearly average. By subtracting the weighted yearly average from the four surrounding grid points for removing the regional mean, S∗(Xi,j,t) can be obtained as the daily eddy (shown in Figure 2B):
where S∗(xi,j,t) is the current daily eddy and is the 16-day average daily eddy fields excluding the current day. OLR(t)A indicates a residual value of the eddy as the OLR anomaly (Figure 2C) that can be determined as the difference between the current eddy and the average eddy of the 16 days preceding the observation day:
where EIndex is defined by the OLR anomaly divided by the standard deviation of τi,j. EIndex can then represent the maximum change in OLR values for specific spatial locations and predefined times as an indicator of abnormality (shown in Figure 2D). This methodology follows a similar analysis process to that described in detail by Ouzounov et al. (2007) and Pulinets and Ouzounov (2011).
Results
Figure 3 shows the daytime and nighttime variations of EIndex for each significant earthquake. The threshold values were determined to be when the EIndex value exceeded 2, which is called the EIndex anomaly (EA) to identify each seismic event’s precursor (Figure 1 and Table 1). The earthquake preparation is considered to be a continuous process, as shown in Figure 2D, and we propose that the consecutive appearances of EAs around the epicentral area are a precursor to an earthquake. Based on this scenario, the EQ-1 event in Figure 3 shows an example of the temporal variations of precursory EAs. Here, red and blue dots are the daily variations in the daytime and nighttime EAs, respectively. In this study, we propose that at least three appearances of EAs found within 4 days over the epicentral area before significant seismic events (M ≥ 6) be the criteria for earthquake precursory anomalies, and we refer to this as a pre-earthquake OLR EIndex anomaly (POEA). The EAs are observed on July 5, July 7, and July 8, 2009, in the daytime and nighttime results, respectively, which means there are a total of six EAs within 4 days (6, 7, and 9 days in the daytime and 6, 7, and 9 days in the nighttime before the 2009/07/14 M6.0 earthquake, respectively). Similarly, precursors in the OLR usually indicate significant and anomalous variability associated with significant earthquakes lasting more than 1 day and repeating at the same local time (Jing et al., 2013; Tramutoli et al., 2013; Genzano et al., 2015; Ouzounov et al., 2015, 2018).
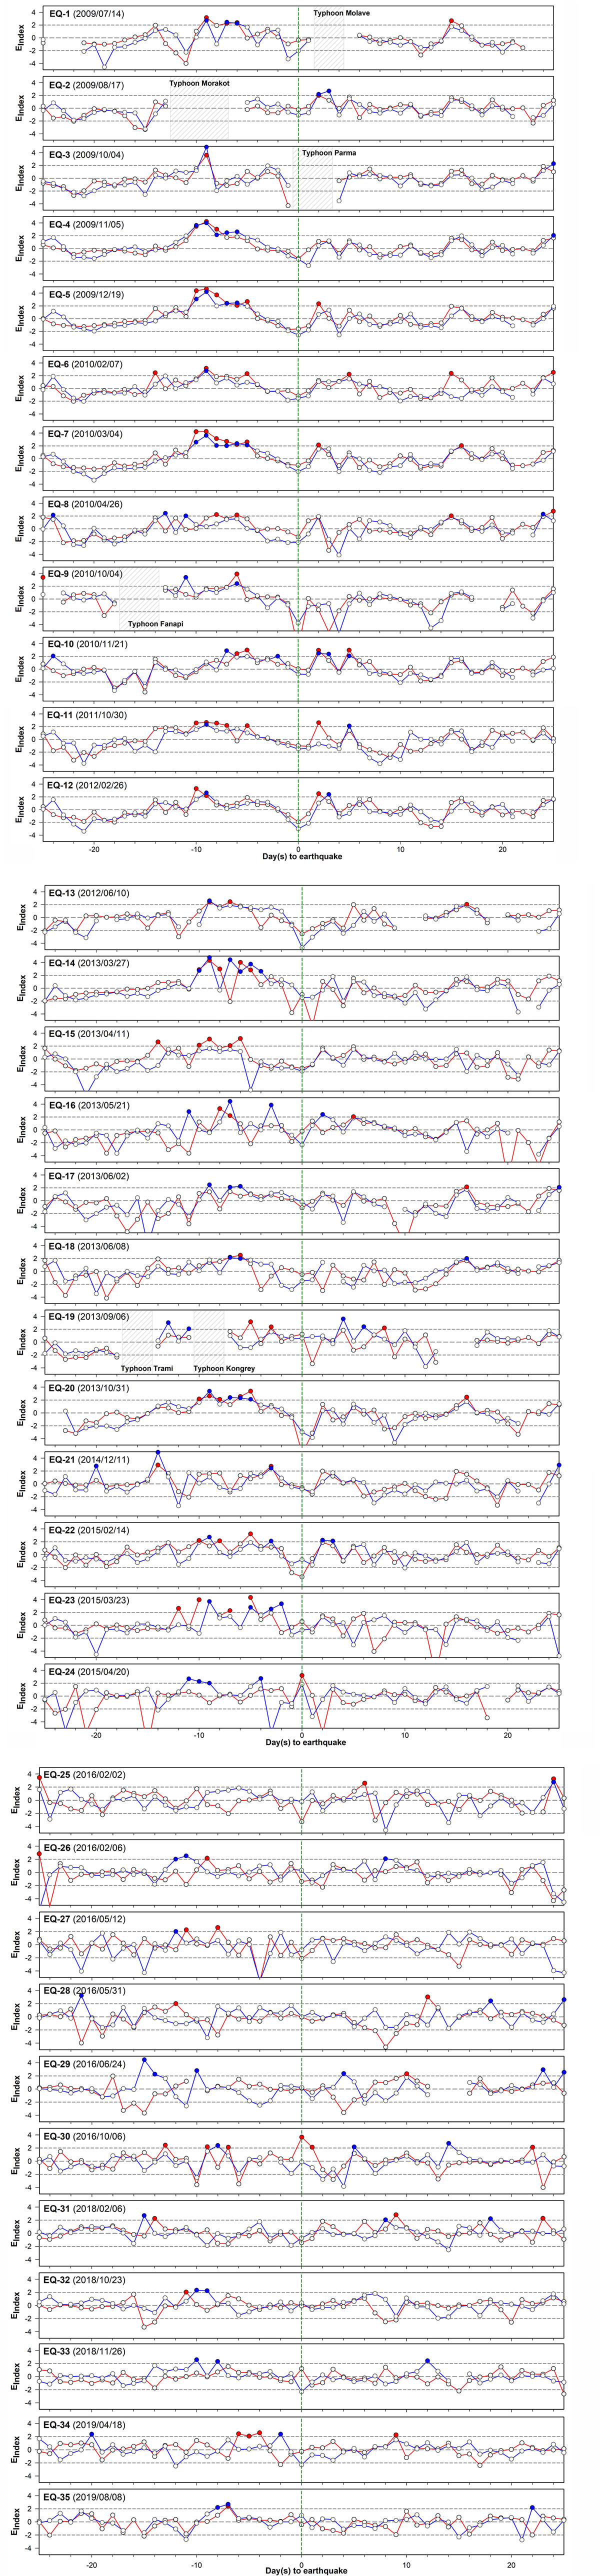
Figure 3. Time-series of daily OLR EIndex values associated with M ≥6 earthquakes over the epicenter area from 2009 to 2019 around Taiwan. The red and blue lines indicate the daily EIndex variations in the daytime and nighttime, respectively, within 25 days before and after the earthquake. The earthquake’s anomalous days are considered to be when the increasing EIndex value is greater than the threshold value (EIndex ≥ 2), as given by the red and blue dots. The occurrence of an earthquake is marked with the green dashed line. The shaded region indicates typhoon period. The relevant earthquakes are marked by the numbers shown in Figure 1 and listed in Table 1.
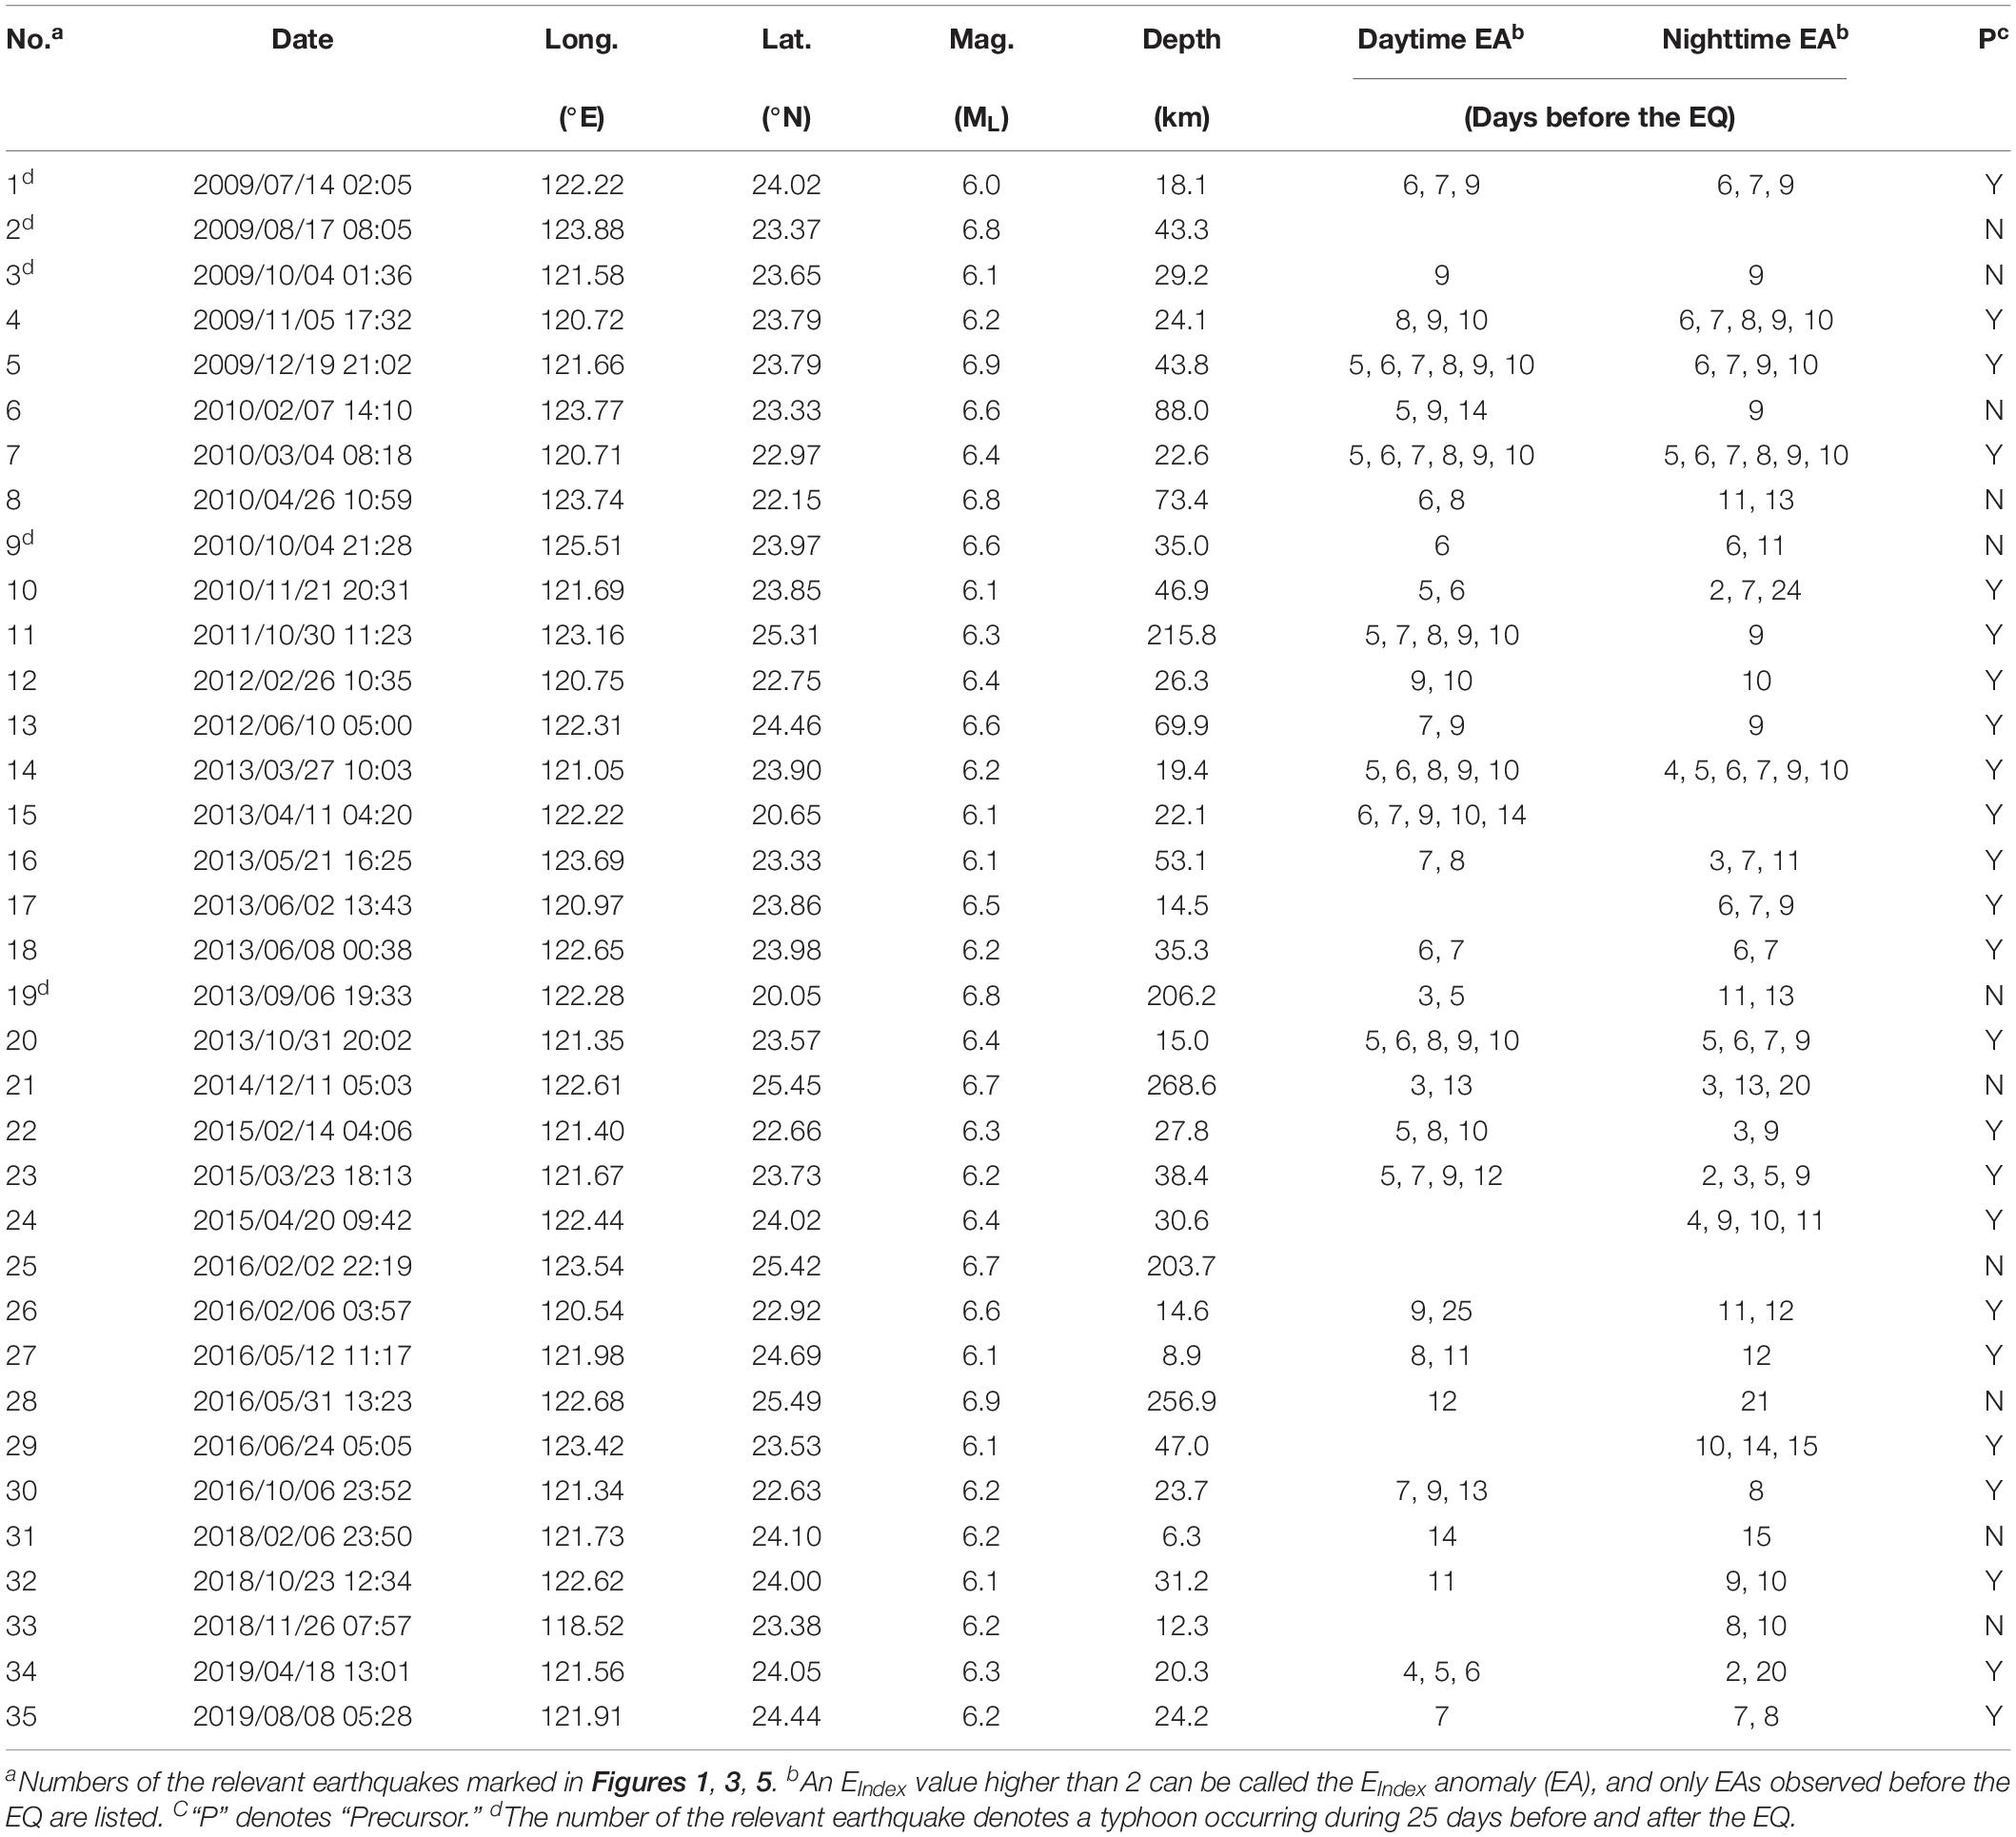
Table 1. Catalog of OLR EIndex anomalies (EA) and related earthquakes occurring around Taiwan from 2009 to 2019.
Discussion
Figure 3 presents the temporal evolution of the propagation characteristics of the EA to the earthquake, which may be related to the POEA. Comparing the rates of anomaly occurrences in the daytime and nighttime and 35 earthquakes with M ≥6 during 2009–2019 shows that the POEA quite often occurred ∼2–15 days before the earthquakes, except for 11 of the 35 selected seismic events (EQ-2, EQ-3, EQ-6, EQ-8, EQ-9, EQ-19, EQ-21, EQ-25, EQ-28, EQ-31, and EQ-33 in Figure 3 and Table 1). In other words, the progressive POEA accompanying the relevant earthquake can be termed as the precursory event (PE). It is worth noting that, for all of the cases, significant EAs are much weaker and fewer after the earthquake occurrence (Figure 3).
The Influence of Typhoons
The disturbance to OLR EIndex variations seems to be caused by the occurrence of a typhoon before but not after the earthquake. There is no frequent appearance of EA before the EQ-2, EQ-3, EQ-9, and EQ-19 events during the occurrence of a typhoon before the earthquake. Similarly, Liu et al. (2007) pointed out that high-temperature anomalies from a satellite observation could not be identified because of the influence of the typhoons. In contrast, a continuous anomalous EIndex is observed as the POEA before the EQ-1 event; in this case, a typhoon occurs later than the earthquake. This is because the OLR raw data for the typhoon period were already removed before the data analysis so that the anomaly cannot be recognized without the complete results. The anomalous EIndex signals might be present in the OLR raw data; however, the influence of the typhoon cannot entirely be eliminated by using the data processing method of this study. This example illustrates the potential of this methodology for finding a POEA during the occurrence of a typhoon over the earthquake period, as shown in Figure 3. When excluding four events during the occurrence of a typhoon before an earthquake, 24 out of 31 such earthquakes show the POEA (an ∼77% success rate).
Influence of the Focal Depth of the Earthquake
An earthquake’s focal depth appears to be a significant parameter that affects EIndex variations. Earthquakes with a hypocenter depth greater than 70 km, such as EQ-6, EQ-8, EQ-19, EQ-21, EQ-25, and EQ-28, have no precursors of the abnormal EIndex anomaly, except for the EQ-11 event. It is worth noting that the POEA can be observed for EQ-11, but not for EQ-21, EQ-25, and EQ-28 in similar tectonic settings (Figure 1), which might be attributed to the different focal mechanism. However, no further discussion can be made as only one case of this has been observed.
Positive hole charge carriers are proposed as a physical mechanism for the buildup of surface charges over stressed rock to transport energy from the Earth’s crust to the surface. This hypothesis is used to explain the pre-earthquake thermal anomalies, by generating electric fields strong enough to ionize the air (Ouzounov and Freund, 2004; Freund et al., 2007) and drive current flow upward in the atmosphere and into the ionosphere (Freund, 2007a, b; Kuo et al., 2011). Alternatively, gases (e.g., radon, carbon dioxide, and methane) emitted along the fault zones over the epicenter area is another hypothesized mechanism for the ionization of the near-surface air for increased air temperature and latent heat flux (Tronin, 2002; Pulinets et al., 2006; Ouzounov et al., 2007; Tramutoli et al., 2009, 2013; Pulinets and Ouzounov, 2011). Changes in gas emissions may be attributed to near- or far-field earthquakes and strain-induced changes in permeability within the earthquake’s preparation zone (Walia et al., 2009, 2013; Fu et al., 2015, 2017b, 2019).
Earthquakes occurring at a focal depth of greater than 70 km are classified as intermediate-focus earthquakes, suggesting that they are located lower than the crust–mantle boundary of Taiwan (Ustaszewski et al., 2012). The strength of the rock in the upper mantle is ductile and decreases with depth as the temperature increases, and has no substantial brittle strengths to cause microfractures and activate p-hole charge carriers. Furthermore, above 700°C, the activated charge carriers may be consumed by a reaction with CH4 from olivine crystal through oxidative coupling in the deep region (Chen and Molnar, 1983; Hadi et al., 2012). That might be why the POEA is rarely observed before earthquakes with large focal depths. Similarly, Xiong and Shen (2017) pointed out that TIR anomalies are not easily observed during the earthquakes with depth larger than 60 km and Ho et al. (2018) reported that the precursory ion density and velocity anomalies associated with surface charges are small before and after earthquakes with a depth greater than 70 km. These observations correspond to the results of previous studies, indicating that the depth of earthquakes can play a significant role in earthquake-related effects (Rodger et al., 1999; Fu et al., 2017b).
Relationship Between OLR EIndex Variations and Seismicity
Presented here are a few examples of the abnormal POEA, along with different types of observations in Taiwan. The 2010/03/04 M6.4 Jiashian Earthquake (EQ-7) occurred in southern Taiwan. Significant changes in soil radon concentrations along the fault zones over the epicenter were observed ∼14 days before EQ-7, followed by the appearance of the POEA from satellite data and the crust with surface movement based on GPS residual displacement nearly 10 days before the event (Chen et al., 2013c; Fu and Lee, 2018). Similarly, the reoccurrence of a significant increase in soil radon concentrations was found ∼2 weeks before the 2020/02/06 M6.6 Meinong earthquake (EQ-26) in southern Taiwan, and a substantial POEA occurred following the radon anomalies 9–12 days before the EQ-26 event (Fu et al., 2017a). Furthermore, Chen et al. (2015a) reported that the high-conductivity materials were enhanced ∼12–13 days before the M6.2 2013/03/27 Nantou earthquake (EQ-14) and were followed by significant changes in the POEA ∼4–10 days before the same event. In contrast to the anomalies observed in the lithosphere and atmosphere, the substantial precursory changes in the ionosphere often appear 1 day and 1–5 days before M ≥6.0 and M ≥5.0 earthquakes, respectively (Liu et al., 2000, 2006). Those observations would support a constant and positive relationship with the pre-earthquake generation process and be associated with the model for the LAIC (Pulinets and Ouzounov, 2011; Kuo et al., 2014).
Most precursory phenomena in previous studies of earthquake precursors in Taiwan have been fragmentary, especially for atmospheric OLR investigations using satellite techniques. The mechanism of the earthquake generation process and the reasons for the OLR anomalies are not well-understood. According to the mechanisms and previous results described above, we propose a possible mechanism based on the previous observations together with the results of this study (e.g., multi-precursors before EQ-7, EQ-14, and EQ-26). Gases spread out along the fault zones together with the positive hole charge carriers, generated by the amount of gases degassed from compressed rock and the magnetic enhancements of high-conductivity materials around the earthquake preparation zone emanating to the surface, which is caused by changes in rock permeability and conductivities due to pre-earthquake stress accumulation. The ionization of the near-surface air and latent heat exchange is related to gas emissions and the upward flow of current with the positive hole charge carriers, respectively, leading to an increase in air temperature and intensive outgoing longwave radiation. The time sequence of anomalous changes between the lithospheric and atmospheric observations explain the appearances of the precursory OLR anomalies in the epicentral areas before earthquakes with M ≥6 around the Taiwan area. Then, the influence on the total electron content (TEC) leads to substantial ionospheric perturbations, followed by the contributions of the lithosphere-atmosphere before the impending earthquake. Hence, the significant relationship between different types of observations between the lithosphere, atmosphere, and ionosphere can be validated in Taiwan. Similar models have also been proposed by Freund (2007a; 2007b), Pulinets and Ouzounov (2011), and Tramutoli et al. (2013). Multi-parameter monitoring data could reveal multiple pre-earthquake signals that could provide a possible explanation of the origin of thermal fluctuations before earthquakes and support the LAIC’s theoretical mechanism.
When the EA occurrence is present within a specific day in the daytime and the nighttime before and after an earthquake, we count one for a certain day to the relevant PE. Figure 4 shows all PEs to display the proportion of the number of total EAs during the observation period. It can be seen that the occurrence of EAs mainly appears from 5 to 10 days before the earthquake, regardless of being in the daytime or the nighttime. This provides a useful precursory index for OLR monitoring of the impending significant seismic activity, at least in the Taiwan area. The dependent relationship between the number of total precursory EAs and the magnitude of each PE is shown in Figure 5. A weak correlation (R2 = 0.05) is obtained between these variables, suggesting that the number of precursory EAs does not reflect the magnitude of the earthquake. The amounts of EAs may not be used to estimate the magnitude of an earthquake for neither inland nor offshore earthquakes.
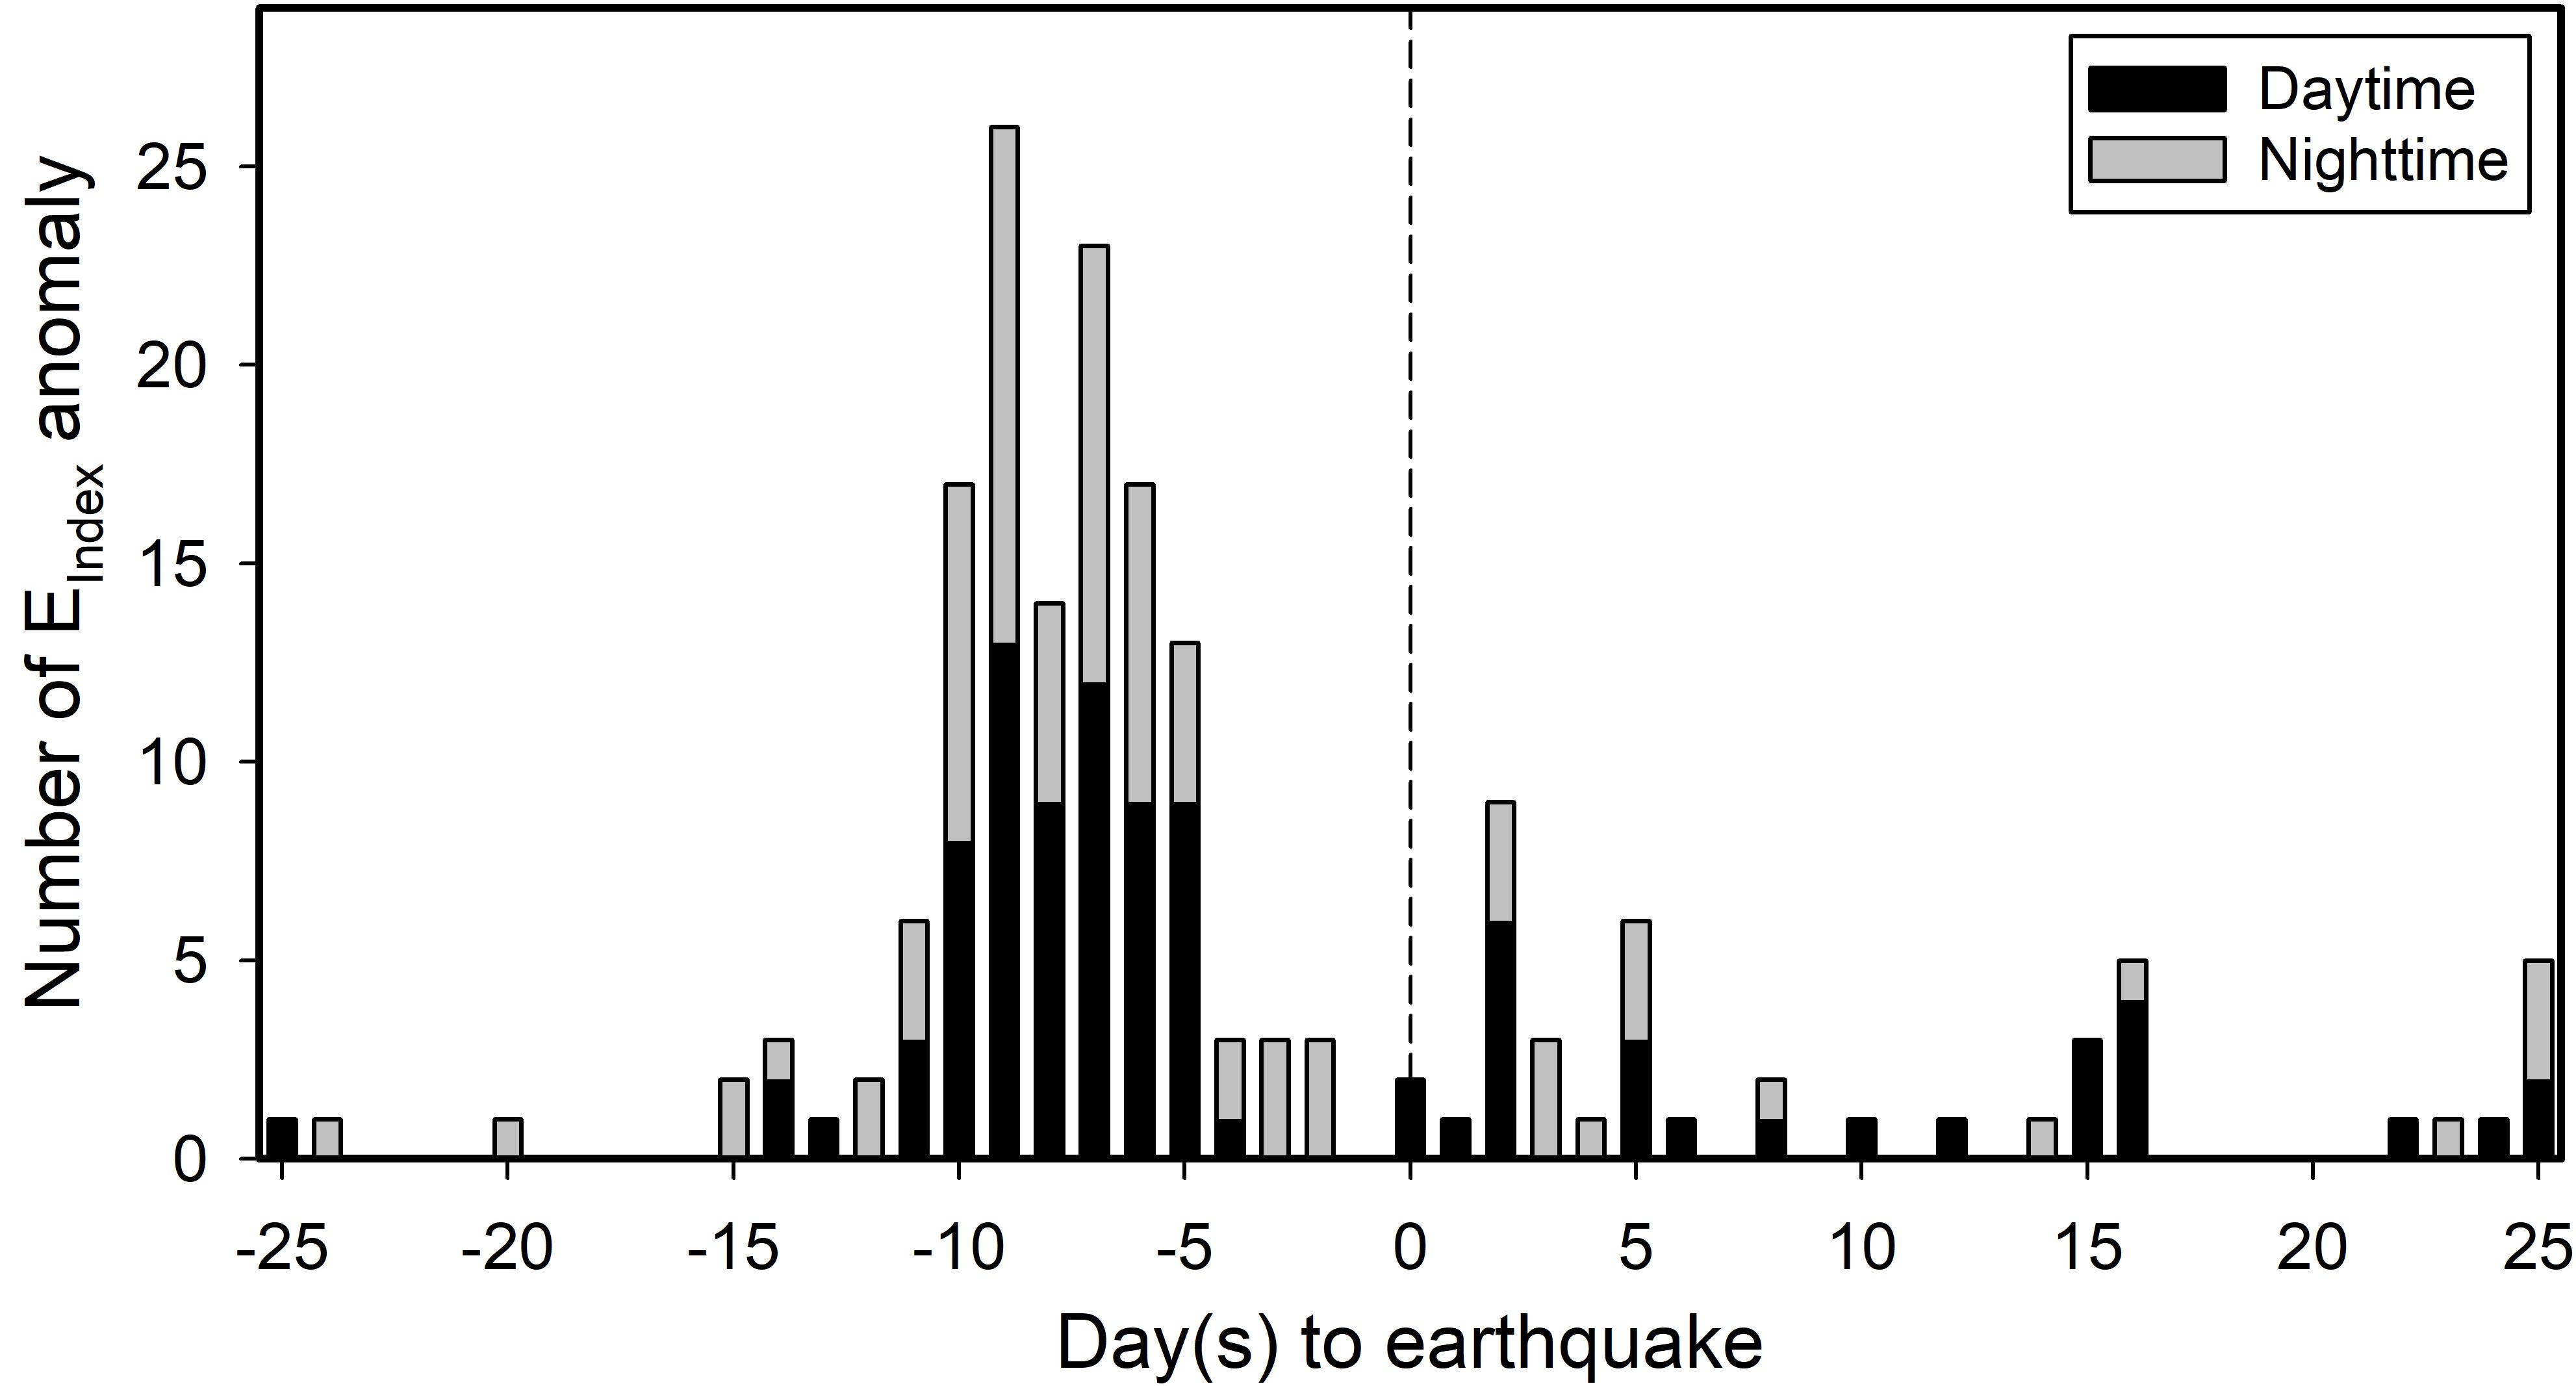
Figure 4. Temporal profile of daily OLR EIndex anomalies (EA) associated with each precursory event within 25 days before and after the earthquake. The black and gray bars denote the EAs in the daytime and the nighttime, respectively.
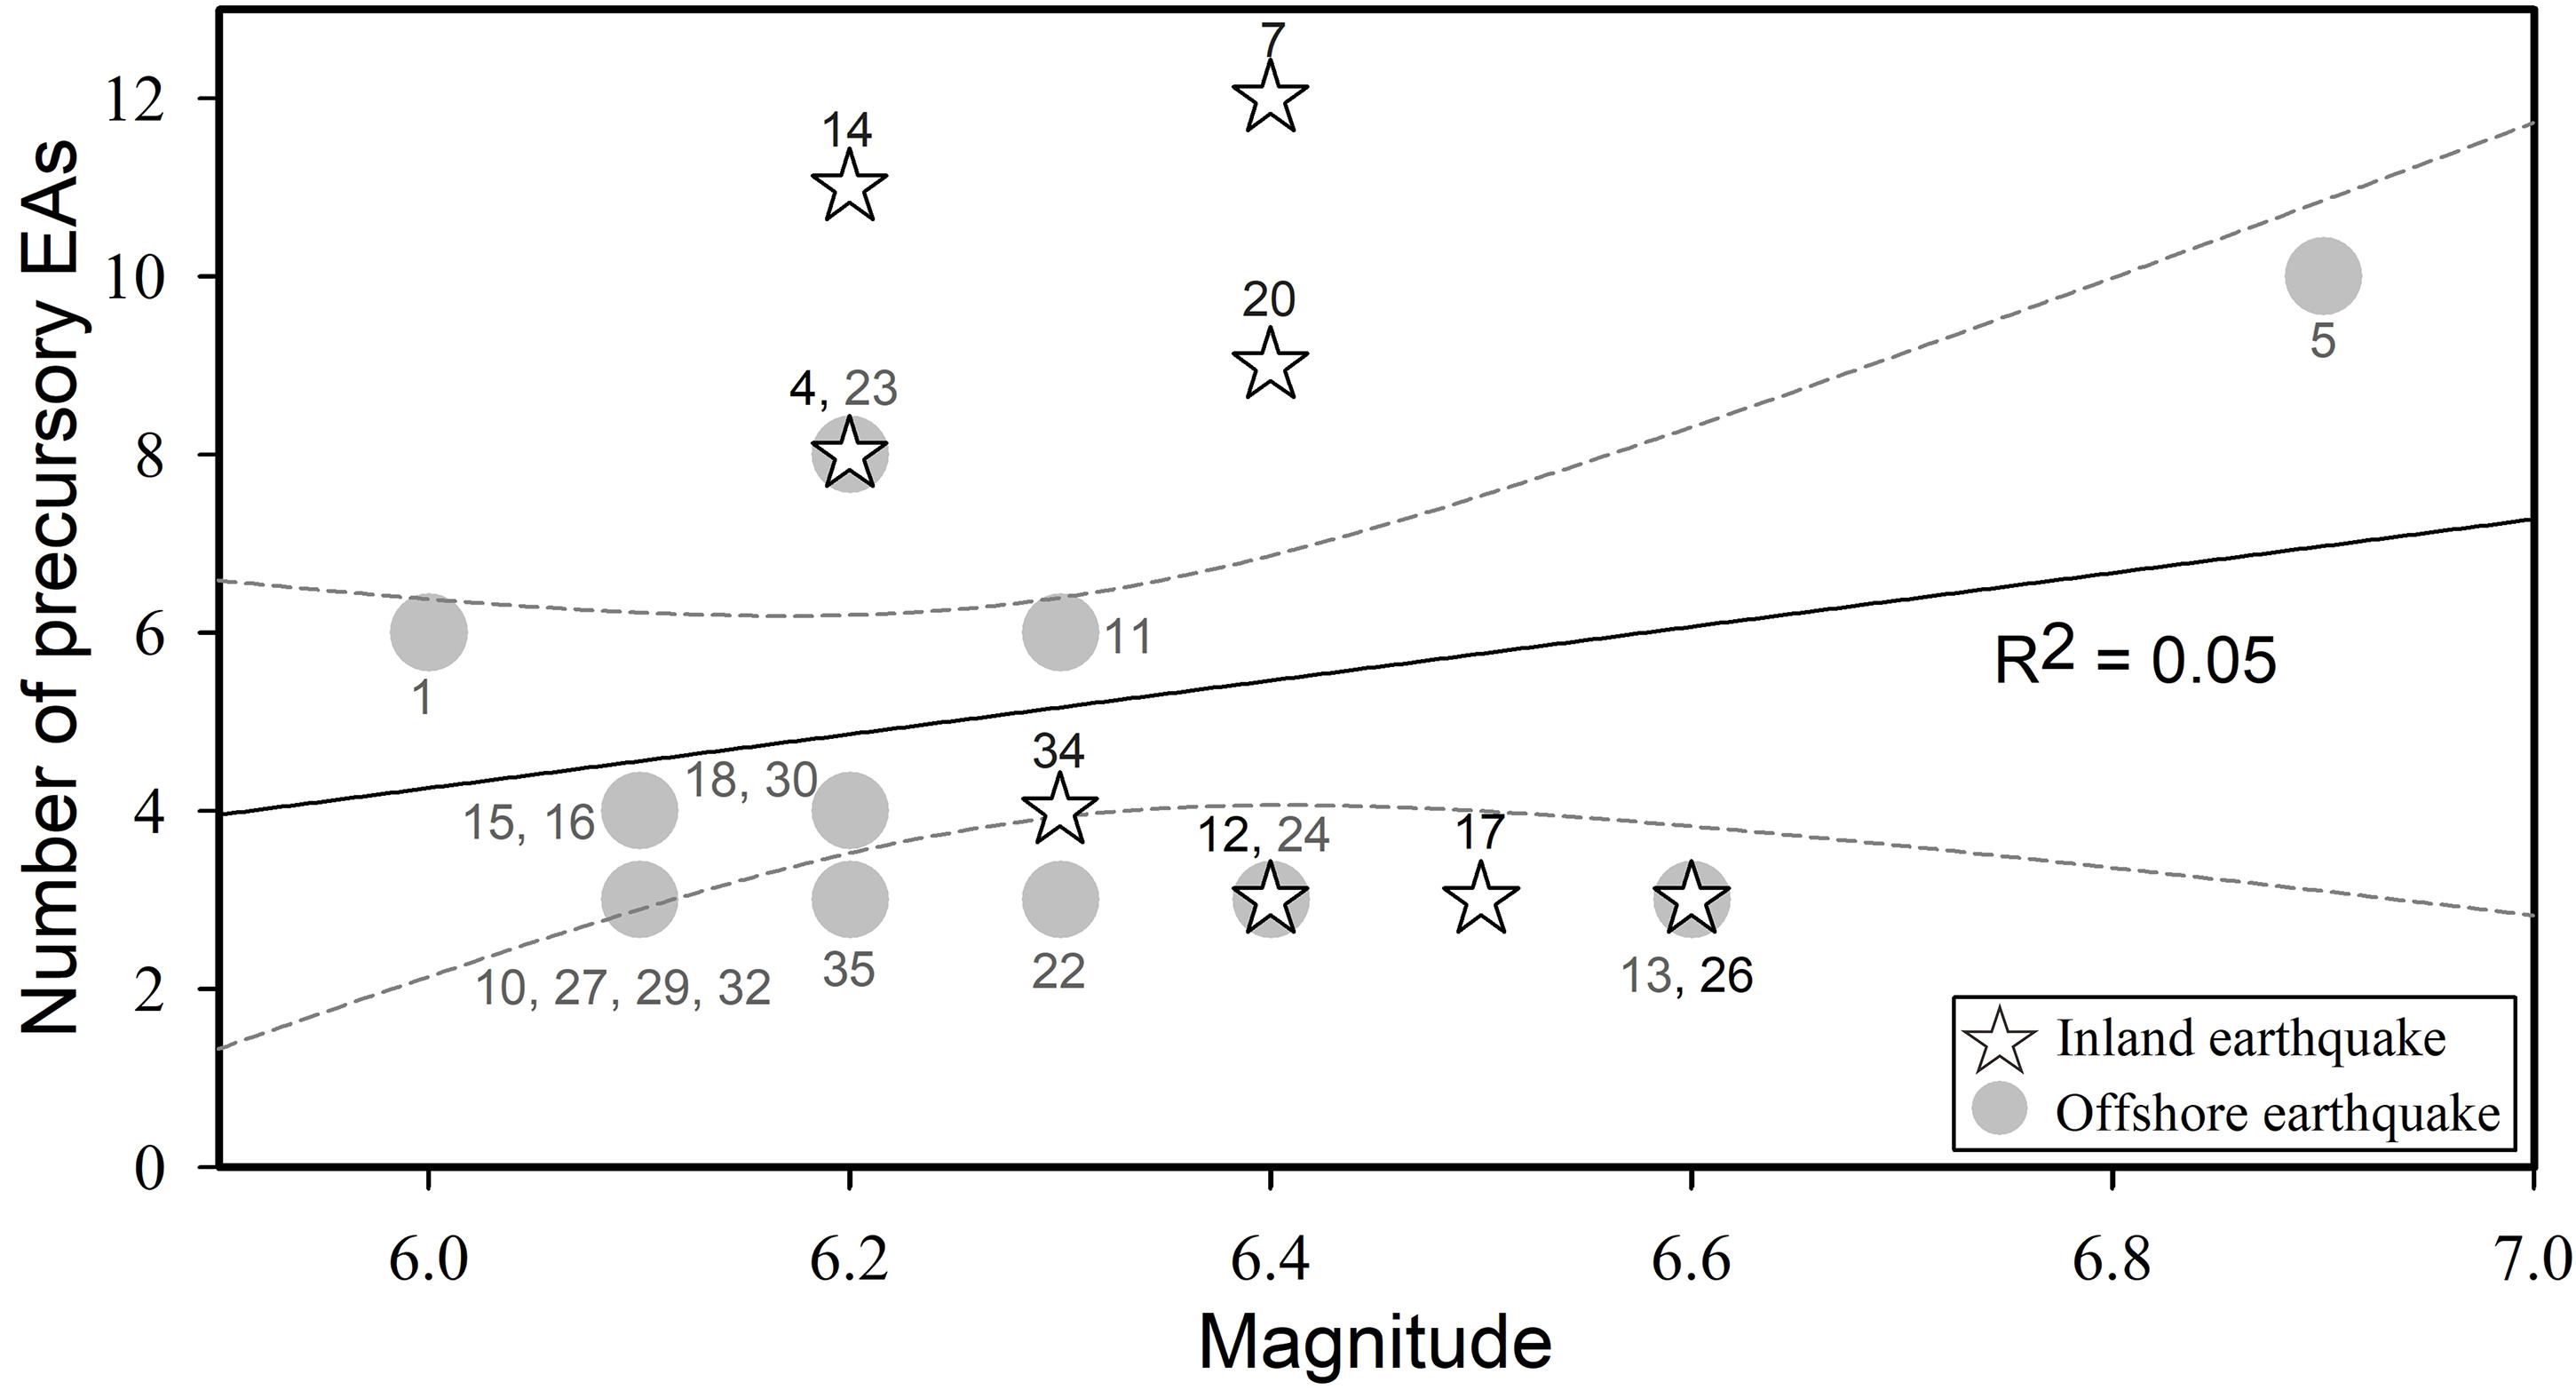
Figure 5. Variation diagrams showing the relationship between earthquake magnitude and distribution of the number of total precursory EIndex anomalies. Solid and open symbols denote the inland and offshore earthquakes with the associated anomalous OLR EIndex. Dashed lines indicate the 95% confidence interval of the data set.
A confutation test was performed to verify the appearance or absence of the POEA before or after significant earthquakes over the same area (Di Bello et al., 2004; Genzano et al., 2009; Tramutoli et al., 2013; Xiong et al., 2013; Lisi et al., 2015; Khalili et al., 2019). As shown in Figure 6, most of the POEAs were only observed once within 90 days before and 25 days after the related earthquake, except for eight of the 35 selected seismic events (EQ-5, EQ-7, EQ-14, EQ-16, EQ-17, EQ-18, EQ-24, and EQ-30). However, only a few sporadic EAs appeared only in 1 day, which did not approach the anomalous criteria of this study. It is important to note that a POEA observed during the 2013/02/23-2/27 event may relate the 2013/03/07 M5.9 earthquake (marked by a black arrow) as a true positive occurring in the same grid of the EQ-14. The POEA occurring 27–31 days before EQ-3 may be considered as a false positive as opposed to most POEAs that appear 2–15 days prior to the significant earthquakes. Therefore, excluding a POEA related to the M5.9 event in the time series of the EQ-14, only a few false positives (∼23%) appear in the absence of the strong earthquake (M ≥ 6), by considering the unperturbed period within 90–25 days before the event as shown by the dashed rectangle in Figure 6.
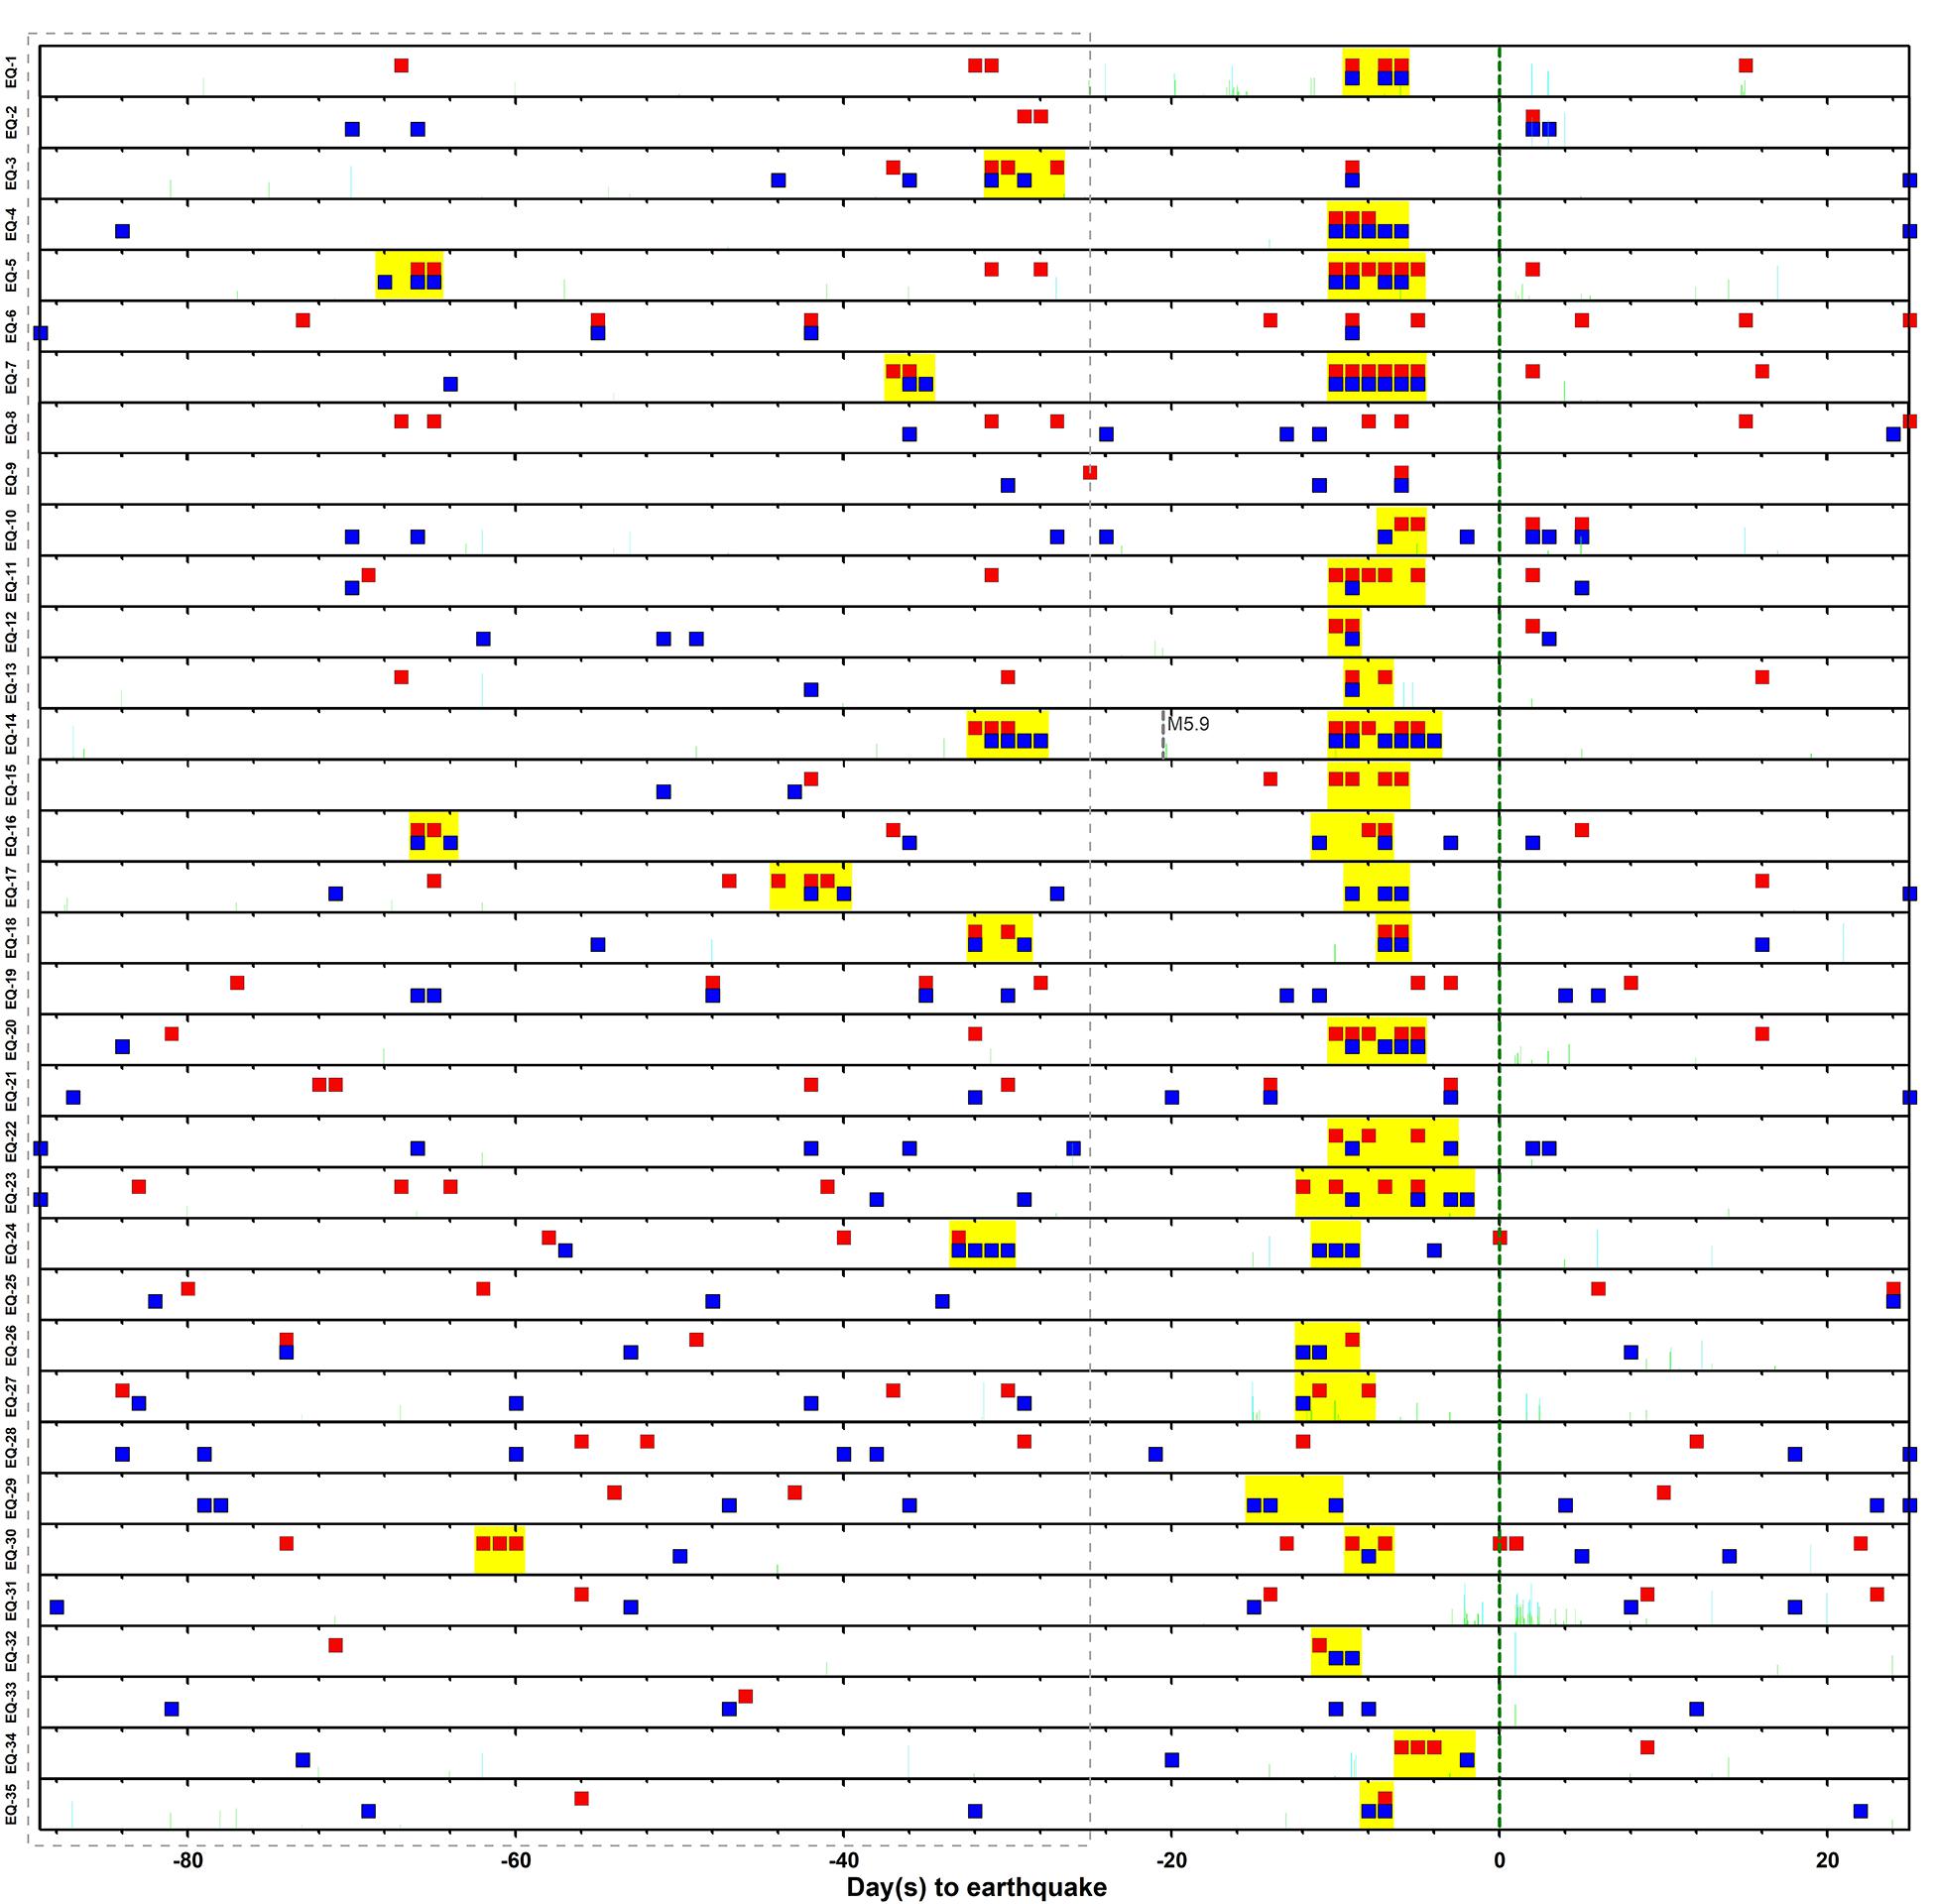
Figure 6. Time-series of daily OLR EIndex anomalies (EA) associated with the M ≥6 earthquakes from 2009 to 2019 around Taiwan for a confutation test over the same area. The red and blue squares indicate the daily EAs in the daytime and the nighttime, respectively, within 90 days before and 25 days after the earthquake. When at least three EAs are found within 4 days, this is referred to as a POEA (marked by the yellow highlighting). The occurrence of the strong earthquakes (M ≥ 6) and the 2013/03/07 M5.9 earthquake are marked with the green and gray dashed lines, respectively. The occurrence of the earthquakes with the magnitude between 5–6 and 4–5 are denoted by light-blue line and light-green line, respectively. The unperturbed period without the strong earthquakes during 90–25 days before the event is marked by the gray dashed rectangle.
Based on the observations from the present study, the consecutive POEAs generally appear several days over the epicenter before a strong earthquake. This can be utilized to trace the appearance of EAs around Taiwan using the spatial-temporal monitoring of OLR observations. Currently, an automatic-process monitoring system has been established in Taiwan to routinely monitor variations in OLR. As mentioned above, substantial POEAs can be observed, followed by an increase in radon concentrations, before significant seismic activities in Taiwan. The appearance of the significant POEAs could be further compared with soil radon observations along fault zones around Taiwan (Walia et al., 2013; Fu et al., 2015, 2017a, 2019), which can be validated and used to evaluate the potential mechanism of the coupling processes between the lithosphere and atmosphere before significant earthquakes.
Conclusion
In the present study, we applied a satellite technique to outgoing longwave radiation (OLR) variations in order to search for the precursors of M ≥6.0 earthquakes over 2009–2019. The major findings of this study are listed below:
(1) The results showed that most precursors, as shown by the pre-earthquake OLR EIndex anomaly, mainly appeared 5–10 days before significant earthquakes.
(2) There is a weak correlation between the number of EIndex anomalies and the earthquake’s magnitude, indicating that the increasing intensity of OLR anomalies is not associated with increased magnitude.
(3) The effects of the focal depth and typhoon events are proposed as critical factors that affect OLR variations for earthquake precursor studies, as when an earthquake has a hypocenter depth greater than 70 km and a typhoon occurs before the earthquake, consecutive EIndex anomalies are rarely observed.
(4) A high percentage of earthquakes (∼77%) with pre-earthquake OLR anomalies are consistently observed when the possible factor of a typhoon’s occurrence is removed.
(5) We proposed a potential mechanism to interpret the pre-earthquake generation process, suggesting the existence of multiple responses triggered by coupling processes between the lithosphere, atmosphere, and ionosphere through OLR anomalies by combining different types of observations.
(6) Therefore, our studies provide a useful indicator for exploring earthquake precursors, especially in the Taiwan region.
Data Availability Statement
The datasets generated for this study are available on request from the corresponding author and from the NOAA Climate Prediction Center website (http://www.cdc.noaa.gov/).
Author Contributions
C-CF organized and wrote the manuscript. L-CL provided the concepts of the manuscript. DO and J-CJ assisted in improving the data processing. All authors contributed to the article and approved the submitted version.
Funding
The research was supported by Grants MOST 108-2116-M-002-025 and MOST 108-2116-M-001-024 through the Ministry of Science and Technology (MOST) and MOTC-CWB-108-E-01 from the Central Weather Bureau of Taiwan.
Conflict of Interest
The authors declare that the research was conducted in the absence of any commercial or financial relationships that could be construed as a potential conflict of interest.
Acknowledgments
We thank Mr. Peng-Kang Wang and Kuo-Hang Chen for help with data collection and preliminary analysis. We would like to thank Uni-edit (www.uni-edit.net) for editing and proofreading this manuscript. The TEC contribution number for this article is 00163. We are also thankful to the editor and reviewers and the referee for their valuable comments and suggestions, which helped us to improve the manuscript.
Footnotes
References
Aliano, C., Corrado, R., Filizzola, C., Genzano, N., Pergola, N., and Tramutoli, V. (2008a). Robust TIR satellite techniques for monitoring earthquake active regions: limits, main achievements and perspectives. Ann. Geophys. 51, 303–317.
Aliano, C., Corrado, R., Filizzola, C., Pergola, N., and Tramutoli, V. (2008b). Robust satellite techniques (RST) for the thermal monitoring of earthquake prone areas: the case of Umbria-Marche October, 1997 seismic events. Ann. Geophys. 51, 451–459.
Canitano, A., Hsu, Y. J., Lee, H. M., Linde, A. T., and Sacks, S. (2015). Near-field strain observations of the October 2013 Ruisui, Taiwan, earthquake: source parameters and limits of very-short term strain detection. Earth Planets Space 67:125. doi: 10.1186/s40623-015-0284-1
Canitano, A., Hsu, Y. J., Lee, H. M., Linde, A. T., and Sacks, S. (2017). A first modeling of dynamic and static crustal strain field from near-field dilatation measurements: example of the 2013 MwMw 6.2 Ruisui earthquake. Taiwan. J. Geod. 91, 1–8. doi: 10.1007/s00190-016-0933-6
Chan, H. P., and Chang, C. P. (2018). Exploring and monitoring geothermal and volcanic activity using satellite thermal infrared data in TVG, Taiwan. Terr. Atmos. Ocean. Sci. 29, 387–404. doi: 10.3319/TAO.2018.01.22.01
Chan, H. P., Chang, C. P., and Dao, P. D. (2018). Geothermal anomaly mapping using landsat ETM+ data in ilan plain, Northeastern Taiwan. Pure Appl. Geophys. 175, 303–323. doi: 10.1007/s00024-017-1690-z
Chan, H. P., Chang, C. P., Lin, T. H., Blackett, M., Kuo-Chen, H., and Lin, A. T. S. (2020). The potential of satellite remote sensing for monitoring the onset of volcanic activity on Taipei’s doorstep. Int. J. Remote Sens. 41, 1372–1388. doi: 10.1080/01431161.2019.1667549
Chen, C. C., Rundle, J. B., Holliday, J. R., Nanjo, K. Z., Turcotte, D. L., Li, S. C., et al. (2005). The 1999 Chi-Chi, Taiwan earthquake as a typical example of seismic activation and quiescence. Geophys. Res. Lett. 32:L22315. doi: 10.1029/2005GL023991
Chen, C. C., Rundle, J. B., Li, H. C., Holliday, J. R., Nanjo, K. Z., Turcotte, D. L., et al. (2006). From tornadoes to earthquakes: forecast verification for binary events applied to the 1999 Chi-Chi, Taiwan, earthquake. Terr. Atmos. Ocean. Sci. 17, 503–516.
Chen, C. H., Hsu, H. L., Wen, S., Yeh, T. K., Chang, F. Y., Wang, C. H., et al. (2013a). Evaluation of seismo-electric anomalies using magnetic data in Taiwan. Nat. Hazards Earth Syst. Sci. 13, 1–8.
Chen, C. H., Wang, C. H., Wen, S., Yeh, T. K., Lin, C. H., Liu, J. Y., et al. (2013b). Anomalous frequency characteristics of groundwater level before major earthquakes in Taiwan. Hydrol. Earth Syst. Sci. 17, 1693–1703. doi: 10.5194/hess-17-1693-2013
Chen, C. H., Wen, S., Yeh, T. K., Wang, C. H., Yen, H. Y., Liu, J. Y., et al. (2013c). Observation of surface displacements from GPS analyses before and after the Jiashian earthquake (M = 6.4) in Taiwan. J. Asian Earth Sci. 62, 662–671. doi: 10.1016/j.jseaes.2012.11.016
Chen, C. H., Lin, C. H., Hsu, H. L., Wang, C. H., Lee, L. C., Han, P., et al. (2015a). Evaluating the March 27, 2013 M6.2 earthquake hypocenter using momentary high conductivity materials. Terr. Atmos. Ocean Sci. 26, 1–9.
Chen, C. H., Lin, C. H., Wang, C. H., Liu, J. Y., Yeh, T. K., Yen, H. Y., et al. (2015b). Potential relationships between seismo-deformation and seismo-conductivity anomalies. J. Asian Earth Sci. 114, 327–337. doi: 10.1016/j.jseaes.2015.03.023
Chen, C. H., Tang, C. C., Cheng, K. C., Wang, C. H., Wen, S., Lin, C. H., et al. (2015c). Groundwater-strain coupling before the 1999 Mw 7.6 Taiwan Chi-Chi earthquake. J. Hydrol. 524, 378–384. doi: 10.1016/j.jhydrol.2015.03.006
Chen, H. J., Chen, C. Y., Tseng, J. H., and Wang, J. H. (2012). Effect of tidal triggering on seismicity in Taiwan revealed by the empirical mode decomposition method. Nat. Hazards Earth Syst. Sci. 12, 2193–2202. doi: 10.5194/nhess-12-2193-2012
Chen, K. J., Chiu, B., Wang, J. S., Lee, C. Y., Lin, C. H., and Chao, K. (2011). Geomagnetic anomaly at Lunping before the 1999 Chi-Chi earthquake (Mw = 7.6) in Taiwan. Nat. Hazards 58, 1233–1252. doi: 10.1007/s11069-011-9726-7
Chen, W. P., and Molnar, P. (1983). Focal depths of intracontinental and intraplate earthquakes and their implications for the thermal and mechanical properties of the lithosphere. J. Geophys. Res. Solid Earth 88, 4183–4214. doi: 10.1029/JB088iB05p04183
Chen, Y. I., Liu, J. Y., Tsai, Y. B., and Chen, C. S. (2004). Statistical tests for pre-earthquake ionospheric anomaly. Terr. Atmos. Ocean Sci. 15, 385–396.
Chia, Y., Wang, Y. S., Chiu, J. J., and Lin, C. W. (2001). Changes of groundwater level due to the 1999 Chi-Chi earthquake in the Choshui River alluvial fan in Taiwan. Bull. Seismol. Soc. Am. 91, 1062–1068. doi: 10.1785/0120000726
Chyi, L. L., Quick, T. J., Yang, T. F., and Chen, C. H. (2005). Soil gas radon spectra and earthquakes. Terr. Atmos. Ocean. Sci. 16, 763–774.
Di Bello, G., Filizzola, C., Lacava, T., Marchese, F., Pergola, N., Pietrapertosa, C., et al. (2004). Robust satellite techniques for volcanic and seismic hazards monitoring. Ann. Geophys. 47, 49–64.
Freund, F. (2007a). Pre-earthquake signals – part I: deviatoric stresses turn rocks into a source of electric currents. Nat. Hazards Earth Syst. Sci. 7, 535–541. doi: 10.5194/nhess-7-535-2007
Freund, F. (2007b). Pre-earthquake signals – part II: flow of battery currents in the crust. Nat. Hazards Earth Syst. Sci. 7, 543–548. doi: 10.5194/nhess-7-543-2007
Freund, F., Takeuchi, A., Lau, B., Al-Manaseer, A., Fu, C., Bryant, N. A., et al. (2007). Stimulated infrared emission from rocks: assessing a stress indicator. eEarth 2, 7–16. doi: 10.5194/ee-2-7-2007
Fu, C. C., and Lee, L. C. (2018). “Continuous monitoring of fluid and gas geochemistry for seismic study in Taiwan,” in Pre-Earthquake Processes: A Multidisciplinary Approach to Earthquake Prediction Studies, eds D. Ouzounov, S. Pulinets, K. Hattori, and P. Taylor, (Hoboken, NJ: John Wiley and Sons, Inc. Press), 199–218.
Fu, C. C., Lee, L. C., Yang, T. F., Lin, C. H., Chen, C. H., Walia, V., et al. (2019). Gamma ray and radon anomalies in northern Taiwan as a possible preearthquake indicator around the plate boundary. Geofluids 2019:14. doi: 10.1155/2019/4734513
Fu, C. C., Walia, V., Yang, T. F., Lee, L. C., Liu, T. K., Chen, C. H., et al. (2017a). Preseismic anomalies in soil-gas radon associated with 2016 M6.6 meinong earthquake, Southern Taiwan. Terr. Atmos. Ocean. Sci. 28, 787–798. doi: 10.3319/tao.2017.03.22.01
Fu, C. C., Yang, T. F., Chen, C. H., Lee, L. C., Wu, Y. M., Liu, T. K., et al. (2017b). Spatial and temporal anomalies of soil gas in northern Taiwan and its tectonic and seismic implications. J. Asian Earth Sci. 149, 64–77. doi: 10.1016/j.jseaes.2017.02.032
Fu, C. C., Yang, T. F., Tsai, M. C., Lee, L. C., Liu, T. K., Walia, V., et al. (2017c). Exploring the relationship between soil degassing and seismic activity by continuous radon monitoring in the Longitudinal Valley of eastern Taiwan. Chem. Geol. 469, 163–175. doi: 10.1016/j.chemgeo.2016.12.042
Fu, C. C., Wang, P. K., Lee, L. C., Lin, C. H., Chang, W. Y., Giuliani, G., et al. (2015). Temporal variation of gamma rays as a possible precursor of earthquake in the Longitudinal Valley of eastern Taiwan. J. Asian Earth Sci. 114, 362–372. doi: 10.1016/j.jseaes.2015.04.035
Fu, C. C., Yang, T. F., Du, J., Walia, V., Liu, T. K., Chen, Y. G., et al. (2008). Variations of helium and radon concentrations in soil gases from an active fault zone in southern Taiwan. Radiat. Meas. 43, 348–352.
Fu, C. C., Yang, T. F., Walia, V., and Chen, C. H. (2005). Reconnaissance of soil gas composition over the buried fault and fracture zone in southern Taiwan. Geochem. J. 39, 427–439. doi: 10.2343/geochemj.39.427
Fu, C. C., Yang, T. F., Walia, V., Liu, T. K., Lin, S. J., Chen, C.-H., et al. (2009). Variations of soil-gas composition around the active Chihshang Fault in a plate suture zone, eastern Taiwan. Radiat. Meas. 44, 940–944. doi: 10.1016/j.radmeas.2009.10.095
Genzano, N., Aliano, C., Corrado, R., Filizzola, C., Lisi, M., Mazzeo, G., et al. (2009). RST analysis of MSG-SEVIRI TIR radiances at the time of the Abruzzo 6 April 2009 earthquake. Nat. Hazards Earth Syst. Sci. 9, 2073–2084. doi: 10.5194/nhess-9-2073-2009
Genzano, N., Aliano, C., Filizzola, C., Pergola, N., and Tramutoli, V. (2007). Robust satellite technique for monitoring seismically active areas: the case of Bhuj-Gujarat earthquake. Tectonophysics 431, 197–210. doi: 10.1016/j.tecto.2006.04.024
Genzano, N., Corrado, R., Coviello, I., Grimaldi, C. S., Filizzola, C., Lacava, T., et al. (2010). “A multi-sensors analysis of RST-based thermal anomalies in the case of the Abruzzo earthquake,” in Proceedings of the 2010 IEEE Int. Geosci. Remote Sens. Symp. (Piscataway, NJ: IEEE). 761–764.
Genzano, N., Filizzola, C., Paciello, R., Pergola, N., and Tramutoli, V. (2015). Robust Satellite Techniques (RST) for monitoring earthquake prone areas by satellite TIR observations: the case of 1999 Chi-Chi earthquake (Taiwan). J Asian Earth Sci. 114, 289–298. doi: 10.1016/j.jseaes.2015.02.010
Gorny, V. I., Salman, A. G., Tronin, A. A., and Shilin, B. B. (1988). The Earth outgoing IR radiation as an indicator of seismic activity. Proc. Acad. Sci. USSR 301, 67–69.
Graham, E., Sarazin, M., and Matzler, C. (2011). Using re-analysis model data (“FriOWL”) to analyse climate trends related to astroclimatology of Paranal and La Silla. Rev. Mex. Astron. Astrofís. (Ser Conf). 41, 12–15.
Hadi, N. I., Freund, M. M., and Freund, F. (2012). Electrical conductivity of rocks and dominant charge carriers: the paradox of thermally activated positive holes. J. Earth Sci. Climate Change 3:128. doi: 10.4172/2157-7617.1000128
Hatchett, B. J. (2018). Snow level characteristics and impacts of a spring typhoon-originating atmospheric river in the sierra nevada. U S A. Atmosphere (Basel). 9:233. doi: 10.3390/atmos9060233
Ho, Y.-Y., Jhuang, H.-K., Lee, L.-C., and Liu, J. Y. (2018). Ionospheric density and velocity anomalies before M≥6.5 earthquakes observed by DEMETER satellite. J. Asian Earth Sci. 166, 210–222. doi: 10.1016/j.jseaes.2018.07.022
Hsu, Y. J., Chang, Y. S., Liu, C. C., Lee, H. M., Linde, A. T., Sacks, S., et al. (2015). Revisiting borehole strain, typhoons, and slow earthquakes using quantitative estimates of precipitation-induced strain changes. J. Geophys. Res. 120, 4556–4571. doi: 10.1002/2014JB011807
Jing, F., Shen, X. H., Kang, C. L., and Xion, G. P. (2013). Variations of multi-parameter observed in atmosphere related to earthquake. Nat. Hazards Earth Syst. Sci. 13, 27–33. doi: 10.5194/nhess-13-27-2013
Jing, F., Shen, X. H., Kang, C. L., Xiong, P., and Sun, K. (2012). Variation of outgoing longwave radiation around the time of New Zealand Earthquake M7.1. Adv. Earth Sci. 27, 979–986.
Kane, R. P., and Buriti, R. A. (1997). Latitude and altitude dependence of the interannual variability and trends of atmospheric temperatures. Pure Appl. Geophys. 149, 775–792. doi: 10.1007/s000240050052
Kawamura, M., Chen, C. C., and Wu, Y. M. (2014). Seismicity change revealed by ETAS, PI, and Z-value methods: a case study of the 2013 Nantou, Taiwan earthquake. Tectonophysics 634, 139–155. doi: 10.1016/j.tecto.2014.07.028
Khalili, M., Abdollahi Eskandar, S. S., and Alavi Panah, S. K. (2020). Thermal anomalies detection before Saravan earthquake (April 16th, 2013, MW = 7.8) using time series method, satellite, and meteorological data. J. Earth Syst. Sci. 129:5. doi: 10.1007/s12040-019-1286-3
Khalili, M., Alavi Panah, S. K., and Abdollahi Eskandar, S. S. (2019). Using Robust Satellite Technique (RST) to determine thermal anomalies before a strong earthquake: a case study of the Saravan earthquake (April 16th, 2013. M w = 7.8, Iran). J. Asian Earth Sci. 173, 70–78. doi: 10.1016/j.jseaes.2019.01.009
Koll, D. D., and Cronin, T. W. (2018). Earth’s outgoing longwave radiation linear due to H2O greenhouse effect. Proc. Natl. Acad. Sci. U S A. 115, 10293–10298. doi: 10.1073/pnas.1809868115
Kumar, A., Walia, V., Arora, B. R., Yang, T. F., Lin, S. J., Fu, C. C., et al. (2015). Identifications and removal of diurnal and semidiurnal variations in radon time series data of Hsinhua monitoring station in SW Taiwan using singular spectrum analysis. Nat. Hazards 79, 317–330. doi: 10.1007/s11069-015-1844-1
Kuo, C. L., Huba, J. D., Joyce, G., and Lee, L. C. (2011). Ionosphere plasma bubbles and density variations induced by pre-earthquake rock currents and associated surface charges. J. Geophys. Res. 116:A10317. doi: 10.1029/2011ja016628
Kuo, C. L., Lee, L. C., and Huba, J. D. (2014). An improved coupling model for the lithosphere-atmosphere-ionosphere system. J. Geophys. Res. Space Physics. 119, 3189–3205. doi: 10.1002/2013ja019392
Kuo, M. C. T., Fan, K., Kuochen, H., and Chen, W. (2006). A mechanism for anomalous decline in radon precursory to an earthquake. Ground Water 44, 642–647.
Kuo, T., Su, C., Chang, C., Lin, C., Cheng, W., Liang, H., et al. (2010). Application of recurrent radon precursors for forecasting large earthquakes (Mw > 6.0) near Antung. Taiwan. Radiat. Meas. 45, 1049–1054. doi: 10.1016/j.radmeas.2010.08.009
Lai, W. C., Hsu, K. C., Shieh, C. L., Lee, Y. P., Chung, K. C., Koizumi, N., et al. (2010). Evaluation of the effects of ground shaking and static volumetric strain change on earthquake-related groundwater level changes in Taiwan. Earth Planets Space 62, 391–400. doi: 10.5047/eps.2009.12.008
Lee, C. S., Lin, Y. L., and Cheung, K. K. W. (2006). Tropical cyclone formations in the South China Sea associated with the Mei-Yu front. Mon. Wea. Rev. 134, 2670–2687. doi: 10.1175/mwr3221.1
Liebmann, B., and Smith, C. A. (1996). Description of a complete (Interpolated) outgoing longwave radiation dataset. Bull. Amer. Meteor. Soc. 77, 1275–1277.
Lin, C. H. (2009). Foreshock characteristics in Taiwan: potential earthquake warning. J. Asian Earth Sci. 34, 655–662. doi: 10.1016/j.jseaes.2008.09.006
Lin, C. H., Chen, Y. I., Liu, J. Y., Chen, L. J., and Yeh, Y. H. (2003). Earthquake clustering relative to lunar phases in Taiwan. Terr. Atmos. Ocean. Sci. 14, 289–298.
Lisi, M., Filizzola, C., Genzano, N., Paciello, R., Pergola, N., and Tramutoli, V. (2015). Reducing atmospheric noise in RST analysis of TIR satellite radiances for earthquakes prone areas satellite monitoring. Phys. Chem. Earth Sci. 8, 87–97. doi: 10.1016/j.pce.2015.07.013
Liu, C. C., Linde, A. T., and Sacks, I. S. (2009). Slow earthquakes triggered by typhoons. Nature 459, 833–836. doi: 10.1038/nature08042
Liu, J. Y., Chen, Y. I., and Chuo, Y. J. (2006). A statistical investigation of pre-earthquake ionospheric anomaly. J. Geophys. Res. 111:A05304.
Liu, J. Y., Chen, Y. I., Chuo, Y. J., and Tsai, H. F. (2001). Variations of ionospheric total electron content during the Chi-Chi earthquake. Geophys. Res. Lett. 28, 1383–1386. doi: 10.1029/2000GL012511
Liu, J. Y., Chen, Y. I., Huang, C. H., Ho, Y. Y., and Chen, C. H. (2015). A statistical study of lightning activities and M = 5.0 earthquakes in Taiwan during 1993-2004. Surv. Geophys. 36, 851–859. doi: 10.1007/s10712-015-9342-2
Liu, J. Y., Chen, Y. I., Pulinets, S. A., Tsai, Y. B., and Chuo, Y. J. (2000). Seismo-ionospheric signatures prior to M = 6.0 Taiwan earthquakes. Geophys. Res. Lett. 27, 3113–3116. doi: 10.1029/2000GL011395
Liu, J. Y., Chuo, Y., Shan, S., Tsai, Y., Chen, Y., Pulinets, S., et al. (2004). Pre-earthquake ionospheric anomalies registered by continuous GPS TEC measurements. Ann. Geophys. 22, 1585–1593. doi: 10.5194/angeo-22-1585-2004
Liu, J. Y., Tsai, H. F., Lin, C. H., Kamogawa, M., Chen, Y. I., Huang, B. S., et al. (2010). Coseismic ionospheric disturbances triggered by the Chi-Chi earthquake. J. Geophys. Res. 115, A08303. doi: 10.1029/2009ja014943
Liu, K. K., Yui, T. F., Yeh, Y. H., Tsai, Y. B., and Teng, T. (1985). Variations of radon content in ground waters and possible correlation with seismic activities in northern Taiwan. Pure Appl. Geophys. 122, 231–244. doi: 10.1007/bf00874596
Liu, S., Yang, D., Ma, B., Wu, L., Li, J., and Dong, Y. (2007). “On the features and mechanism of satellite infrared anomaly before earthquakes in Taiwan region,” in Proceedings of the International Geoscience and Remote Sensing Symposium (IGARSS), (Barcelona: IEEE), 3719–3722.
Ouzounov, D., Bryant, N., Logan, T., Pulinets, S., and Taylor, P. (2006). Satellite thermal IR phenomena associated with some of the major earthquakes in 1999-2003. Phys. Chem. Earth 31, 154–163. doi: 10.1016/j.pce.2006.02.036
Ouzounov, D., and Freund, F. (2004). Mid-infrared emission prior to strong earthquakes analyzed by remote sensing data. Adv. Space Res. 33, 268–273. doi: 10.1016/s0273-1177(03)00486-1
Ouzounov, D., Liu, D., Kang, C. L., Cervone, G., Kafatos, M., and Taylor, P. (2007). Outgoing long wave radiation variability from IR satellite data prior to major earthquakes. Tectonophysics 431, 211–220. doi: 10.1016/j.tecto.2006.05.042
Ouzounov, D., Pulinets, S., and Davidenko, D. (2015). “Revealing pre-earthquake signatures in atmosphere and ionosphere associated with 2015 M7.8 and M7.3 events in Nepal: Preliminary results,” in Proceedings of the Conference: 2nd International Workshop on Earthquake Preparation Process: Observation, Validation, Modeling, Forecasting (IWEP2 2015, (Chiba).
Ouzounov, D., Pulinets, S., Kafatos, M., and Taylor, P. (2018). “Thermal radiation anomalies associated with major earthquakes,” in Pre-Earthquake Processes: A Multidisciplinary Approach to Earthquake Prediction Studies, eds D. Ouzounov, S. Pulinets, K. Hattori, and P. Taylor, (Hoboken, NJ: John Wiley and Sons, Inc. Press), 259–274. doi: 10.1002/9781119156949.ch15
Pergola, N., Aliano, C., Coviello, I., Filizzola, C., Genzano, N., Lacava, T., et al. (2010). Using RST approach and EOS-MODIS radiances for monitoring seismically active regions: a study on the 6 April 2009 Abruzzo earthquake. Nat. Hazards Earth Syst. Sci. 10, 239–249.
Pulinets, S., and Ouzounov, D. (2011). Lithosphere-Atmosphere-Ionosphere Coupling (LAIC) model-An unified concept for earthquake precursors validation. J. Asian Earth Sci. 41, 371–382. doi: 10.1016/j.jseaes.2010.03.005
Pulinets, S. A., and Dunajeck, M. A. (2007). Specific variations of air temperature and relative humidity around the time of Michoacan earthquake M8.1 September 19, 1985 as a possible indicator of interaction between tectonic plates. Tectonophysics 431, 221–230. doi: 10.1016/j.tecto.2006.05.044
Pulinets, S. A., Ouzounov, D., Karelin, A. V., Boyarchuk, K. A., and Pokhmelnykh, L. A. (2006). The physical nature of the thermal anomalies observed before strong earthquake. Phys. Chem. Earth 31, 143–153. doi: 10.1016/j.pce.2006.02.042
Rodger, C. J., Dowden, R. L., and Thomson, N. R. (1999). “Observations of electromagnetic activity associated with earthquakes by low-altitude satellites,” in Atmospheric and Ionospheric Electromagnetic Phenomena Associated with Earthquakes, ed. M. Hayakawa, (Tokyo: Terra Sci. Publ), 697–710.
Song, S. R., Ku, W. Y., Chen, Y. L., Lin, Y. C., Liu, C. M., Kuo, L. W., et al. (2003). Groundwater chemical anomaly before and after the Chi-Chi earthquake in Taiwan. Terr. Atmos. Oceanic Sci. 14, 311–320.
Song, S. R., Ku, W. Y., Chen, Y. L., Liu, C. M., Chan, P. S., Chen, Y. G., et al. (2006). Hydrogeochemical anomalies in the springs of the Chiayi area in west-central Taiwan as likely precursors to earthquakes. Pure Appl. Geophys. 163, 675–691. doi: 10.1007/3-7643-7584-1_5
Susskind, J., Molnar, G., Iredell, L., and Loeb, N. (2012). Interannual variability of outgoing longwave radiation as observed by AIRS and CERES. J. Geophys. Res. 117:D23107. doi: 10.1029/2012JD017997
Tramutoli, V., Aliano, C., Corrado, R., Filizzola, C., Genoano, N., Lisi, M., et al. (2013). On the possible origin of thermal infrared radiation (TIR) anomalies in earthquake-prone areas observed using robust satellite techniques (RST). Chem. Geol. 339, 157–168. doi: 10.1016/j.chemgeo.2012.10.042
Tramutoli, V., Aliano, C., Corrado, R., Filizzola, C., Genzano, N., Lisi, M., et al. (2009). Abrupt change in greenhouse gases emission rate as a possible genetic model of TIR anomalies observed from satellite in Earthquake active regions. Proc. ISRSE 2009, 567–570.
Tramutoli, V., Cuomo, V., Filizzola, C., Pergola, N., and Pietrapertosa, C. (2005). Assessing the potential of thermal infrared satellite surveys for monitoring seismically active areas: the case of Kocaeli (Izmit) earthquake, August 17, 1999. Remote Sens. Environ. 96, 409–426. doi: 10.1016/j.rse.2005.04.006
Tramutoli, V., Di Bello, G., Pergola, N., and Piscitelli, S. (2001). Robust satellite techniques for remote sensing of seismically active areas. Ann. Geofis. 44, 295–312.
Tronin, A. A. (1996). Satellite thermal survey—a new tool for the study of seismoactive regions. Int. J. Remote Sens. 17, 1439–1455. doi: 10.1080/01431169608948716
Tronin, A. A. (2000). Thermal IR satellite sensor data application for earthquake research in China. Int. J. Remote Sens. 21, 3169–3177. doi: 10.1080/01431160050145054
Tronin, A. A. (2002). “Atmosphere-lithosphere coupling: thermal anomalies on the Earth surface in seismic processes”, in Seismo-Electromagnetics: Lithosphere-Atmosphere-Ionosphere Coupling, eds M. Hayakawa, and O. A. Molchanov, (Tokyo: Terra Scientific Publ), 173–176.
Tsai, Y. B., Liu, J. Y., Ma, K. F., Yen, H. Y., Chen, K. S., Chen, Y. I., et al. (2004). Preliminary results of the iSTEP program on integrated search for Taiwan earthquake precursors. Terr. Atmos. Ocean Sci. 15, 545–562.
Tsai, Y. B., Liu, J. Y., Ma, K. F., Yen, H. Y., Chen, K. S., Chen, Y. I., et al. (2006). Precursory phenomena associated with the Chi-Chi earthquake in Taiwan as identified under the iSTEP program. Phys. Chem. Earth 31, 365–377. doi: 10.1016/j.pce.2006.02.035
Ustaszewski, K., Wu, Y. M., Suppe, J., Huang, H. H., Chang, C. H., and Carena, S. (2012). Crust-mantle boundaries in the Taiwan - Luzon arc-continent collision system determined from local earthquake tomography and 1D models: implications for the mode of subduction polarity reversal. Tectonophysics 578, 31–49. doi: 10.1016/j.tecto.2011.12.029
Walia, V., Lin, S. J., Hong, W. L., Fu, C. C., Yang, T. F., Wen, K. L., et al. (2009). Continuous temporal soil-gas composition variation for earthquake precursory studies along Hsincheng and Hsinhua faults in Taiwan. Radiat. Meas. 44, 934–939. doi: 10.1016/j.radmeas.2009.10.010
Walia, V., Yang, T. F., Lin, S. J., Kumar, A., Fu, C. C., Chiu, J. M., et al. (2013). Temporal variation of soil gas compositions for earthquake surveillance in Taiwan. Radiat. Meas. 50, 154–159. doi: 10.1016/j.radmeas.2012.11.007
Wang, C. Y., Cheng, I. H., Chin, C. V., and Yu, S. B. (2001). Coseismic hydrologic response of an alluvial fan to the 1999 Chi-Chi earthquake. Taiwan. Geol. 29, 831–834.
Wu, L., Liu, S., and Wu, Y. W. (2006). “The experiment evidences for tectonic earthquake forecasting based on anomaly analysis on satellite infrared image,” in Proceedings of the International Geoscience and Remote Sensing Symposium (IGARSS), (Denver, CO: IEEE), 2158–2162.
Wu, Y. M., and Chen, C. C. (2007). Seismic reversal pattern for the 1999 Chi-Chi, Taiwan, Mw7.6 earthquake. Tectonophysics 429, 125–132. doi: 10.1016/j.tecto.2006.09.015
Wu, Y. M., Chen, C. C., and Rundle, J. B. (2008). Detecting precursory earthquake migration patterns using the pattern informatics method. Geophys. Res. Lett. 35, L19304. doi: 10.1029/2008GL035215
Wu, Y. M., and Chiao, L. Y. (2006). Seismic quiescence before the 1999 Chi-Chi. Taiwan, Mw7.6 earthquake. Bull. Seism. Soc. Am. 96, 321–327. doi: 10.1785/0120050069
Xiong, P., Gu, X. F., Bi, Y. X., Shen, X. H., Meng, Q. Y., Zhao, L. M., et al. (2013). Detecting seismic IR anomalies in bi-angular advanced along-track scanning radiometer data. Nat. Hazards Earth Syst. Sci. 13, 2065–2074. doi: 10.5194/nhess-13-2065-2013
Xiong, P., and Shen, X. (2017). Outgoing longwave radiation anomalies analysis associated with different types of seismic activity. Adv. Space Res. 59, 1408–1415. doi: 10.1016/j.asr.2016.12.011
Xiong, P., Shen, X. H., Bi, Y. X., Kang, C. L., Chen, L. Z., Jing, F., et al. (2010). Study of outgoing longwave radiation anomalies associated with Haiti earthquake. Nat. Hazards Earth Syst. Sci. 10, 2169–2178. doi: 10.5194/nhess-10-2169-2010
Xiong, P., Shen, X. H., Gu, X. F., Meng, Q. Y., Zhao, L. M., Zhao, Y. H., et al. (2015). Seismic infrared anomalies detection in the case of the Wenchuan earthquake using bi-angular advanced along-track scanning radiometer data. Ann. Geophys. 58, S0217. doi: 10.4401/ag-6706
Yang, T. F., Fu, C. C., Walia, V., Chen, C. H., Chyi, L. L., Liu, T. K., et al. (2006). Seismo-geochemical variations in SW Taiwan: multi-parameter automatic gas monitoring results. Pure Appl. Geophys. 163, 693–709. doi: 10.1007/3-7643-7584-1_6
Yang, T. F., Walia, V., Chyi, L. L., Fu, C. C., Chen, C. H., Liu, T. K., et al. (2005). Variations of soil radon and thoron concentrations in a fault zone and prospective earthquakes in SW Taiwan. Radiat. Meas. 40, 496–502. doi: 10.1016/j.radmeas.2005.05.017
Yen, H. Y., Chen, C. H., Hsieh, H. H., Lin, C. R., Yeh, Y. H., Tsai, Y. B., et al. (2009). Magnetic survey of Taiwan and its preliminary interpretations. Terr. Atmos. Ocean Sci. 20, 309–314.
Yen, H. Y., Chen, C. H., Yeh, Y. H., Liu, J. Y., Lin, C. R., and Tsai, Y. B. (2004). Geomagnetic fluctuations during the 1999 Chi-Chi earthquake in Taiwan. Earth Planets Space. 56, 39–45. doi: 10.1186/bf03352489
Keywords: National Oceanic and Atmospheric Administration, outgoing longwave radiation, pre-earthquake OLR EIndex anomaly, earthquake precursor, Taiwan
Citation: Fu C-C, Lee L-C, Ouzounov D and Jan J-C (2020) Earth’s Outgoing Longwave Radiation Variability Prior to M ≥6.0 Earthquakes in the Taiwan Area During 2009–2019. Front. Earth Sci. 8:364. doi: 10.3389/feart.2020.00364
Received: 07 June 2020; Accepted: 07 August 2020;
Published: 02 September 2020.
Edited by:
Giovanni Martinelli, National Institute of Geophysics and Volcanology, ItalyReviewed by:
Nicola Genzano, University of Basilicata, ItalyMarzieh Khalili, Shiraz University, Iran
Copyright © 2020 Fu, Lee, Ouzounov and Jan. This is an open-access article distributed under the terms of the Creative Commons Attribution License (CC BY). The use, distribution or reproduction in other forums is permitted, provided the original author(s) and the copyright owner(s) are credited and that the original publication in this journal is cited, in accordance with accepted academic practice. No use, distribution or reproduction is permitted which does not comply with these terms.
*Correspondence: Ching-Chou Fu, Y2NmdUBlYXJ0aC5zaW5pY2EuZWR1LnR3