 Alia L. Khan1,2*
 Karl Rittger3
 Peng Xian4
 Joseph M. Katich5,6
 Richard L. Armstrong2
 Rijan B. Kayastha7
 Jacob L. Dana8
 Diane M. McKnight3
- 1Department of Environmental Sciences, Huxley College of the Environment, Western Washington University, Bellingham, WA, United States
- 2National Snow and Ice Data Center, Cooperative Institute for Research in Environmental Sciences, University of Colorado Boulder, Boulder, CO, United States
- 3Institute of Arctic and Alpine Research, University of Colorado Boulder, Boulder, CO, United States
- 4Naval Research Laboratory, Marine Meteorology Division, Monterey, CA, United States
- 5Chemical Sciences Laboratory, National Oceanic and Atmospheric Administration (NOAA), Boulder, CO, United States
- 6Cooperative Institute for Research in Environmental Sciences, University of Colorado Boulder, Boulder, CO, United States
- 7Himalayan Cryosphere, Climate and Disaster Research Center (HiCCDRC), Kathmandu University, Dhulikhel, Nepal
- 8Dana Consulting, LLC, Boulder, CO, United States
When deposited on snow and ice, light absorbing impurities (LAIs) such as dust and black carbon (BC) reduce surface albedo and enhance melt. BC comes from incomplete combustion of fossil fuels and biomass. Local and regional sources of BC exist in High Mountain Asia, such as dry-dung burning for heat and fuel, which occurs in close proximity to snow and glaciers. Local dust or dust transported from the Indo-Gangetic Plain is also present. In the Ganges River Basin, meltwater is dominated by seasonal snow, yet relatively few observations of impurities in seasonal snow exist. To understand sources of impurities and their concentrations for seasonal snow on land, we evaluated multiple lines of evidence to scale up from ground-based measurements in the Dudh Koshi River Basin, a remote headwater basin within the Khumbu Region of Nepal. We obtained ground-based in-situ observations of refractory black carbon (rBC) measured by Single Particle Soot Photometer (SP2), including size distributions in snow on land. We interpreted these results in the context of concurrent Moderate Imaging Spectroradiometer (MODIS) satellite observations and speciated aerosol optical depth derived from reanalysis products modeled with the Navy Aerosol Analysis Prediction System global aerosol model. We collected snow samples, mostly in the Gokyo Valley, at varying distances from local tea houses along a 2000 meters above sea level (m a.s.l.) elevation transect from 3250 to 5299 m a.s.l. rBC concentrations ranged from 3.9 to 76.8 μg-rBC/L-H2O. Although previous data do not exist at these lower elevations, our findings are higher than previous surface snow results at higher elevations in the nearby Khumbu Valley. In general, rBC concentrations were lower in fresh snow than aged snow; concurrent MODIS satellite observations of snow albedo also show smaller impacts from LAIs in visible wavelengths in fresh snow. In aged snow samples, rBC decreased with elevation, as did concurrent MODIS albedo observations. rBC-particle size distributions also shifted to a larger mode for aged snow samples. Results from the Navy Aerosol Analysis Prediction System model indicate anthropogenic and biogenic fine aerosols from biofuel (dry-dung burning) are the primary aerosol species in the atmosphere for the study period, at ∼thrice the concentration of dust and smoke.
Introduction
At the headwaters of the Ganges basin, melt from seasonal snow on land, which can be distinguished from melt of exposed glacier ice or snow on ice, has been found to be the dominant source of meltwater contributions above 2000 meters above sea level (m a.s.l.) (e.g., Figure 3; Armstrong et al., 2018). Armstrong et al. (2018) found that snow on land contributes discharge volumes of 12.5 km3 at 3000–4000 m a.s.l., 22.1 km3 at 4000–5000 m a.s.l. and 30.7 km3 at 5000–6000 m a.s.l. Further, relative to snow on ice melt and exposed glacier ice melt, snow on land contributes 61% melt at 5000–6000 m a.s.l., 91% at 4000–5000 m a.s.l. and 100% from 4000 to 1000 m a.s.l. (Armstrong et al., 2018). However, other recently published studies also show that local basin hypsometry plays an important role in high elevation meltwater contributions (Mimeau et al., 2019). Therefore, contributions of snow on land, snow on ice, and exposed glacier ice may vary from basin to basin at high elevations. The physical and chemical properties of snow are important drivers of albedo and melt, which in turn impact the water cycle. Due to the large snow-covered land area at these elevations, the chemistry of the snowmelt is an important contribution to downstream water quality.
A potential influence on the melting of snow on land in this region is the deposition of light absorbing impurities (LAIs), such as from black carbon (BC) (Xu et al., 2009) and dust from the Indo-Gangetic Plain (Prasad et al., 2007). BC is a light absorbing aerosol produced as a byproduct of incomplete combustion of biomass and fossil fuels (Goldberg, 1985). When deposited on the surface of snow and ice, BC reduces surface albedo and enhances snow and ice melt. Numerous methods to detect BC exist. In this study we focus on refractory BC (rBC) measured by Single Particle Soot Photometer (SP2) (Petzold et al., 2013).
Previous studies in the Ganges basin have documented the presence of rBC in the Khumbu Valley. Concentrations in surface snow ranged from 1.8 to 19.7 μg-rBC/L-H2O at the Nepal Climate Observatory Pyramid Station at 5079 m a.s.l. and other nearby glaciers (Lim et al., 2014), 3–23 μg-rBC/L-H2O at the Nepal Climate Observatory (Kaspari et al., 2014) and a few up to 70 μg-rBC/L-H2O at the Nepal Climate Observatory (Jacobi et al., 2015). Average rBC concentrations across integrated snow pit samples on Mera Peak ranged from 180 μg-rBC/L-H2O at Mera La, 24.4 at Mera High Camp and 1.0 at Mera Col (Kaspari et al., 2014). Furthermore, average rBC concentrations from an ice core were 1.5 μg-rBC/L-H2O on the Rongbuk Glacier, on the Northern slope of the Himalayas (Kaspari et al., 2011). Whereas the average level of rBC from a 19.8 m firn core collected on the southern side of the Himalayas from Mera Peak that spanned 1999–2010 was 7.43 ± 15.07 μgL–1, with a maximin of 116.83 μgL–1 (Ginot et al., 2014). Ginot et al. (2014) also found a higher mean concentration during the inter-monsoon season (13.50 ± 20.00 μgL–1) and a lower mean concentration in the monsoon season (2.15 ± 3.45 μgL–1).
Burning of dry-dung for household fuel and cook fires is a common practice in Nepal (Jayarathne et al., 2016), India (Raj et al., 2016), and Tibet (Xiao et al., 2015). These sources of BC, along with garbage and crop residue burning (Jayarathne et al., 2016) are harmful for both indoor and outdoor air quality (Fullerton et al., 2008). For example, inhalation and exposure to yak-dung burning in high-elevation tea houses has been shown to lead to respiratory impairment (Kanaan et al., 2016). Domestic wildfires and regional wildfires also transport wildfire-derived smoke to the region (Matin et al., 2017) and biofuel burning has previously been considered to account for 50 to 90% of carbonaceous emissions (Gustaffsson et al., 2009). Burning of dried yak-dung is the primary fuel and heat source in the region (Jayarathne et al., 2016). A previous study suggested these local sources of particulates remain in the valley with pristine air aloft (Davidson et al., 1981). Li et al. (2016) found that atmospheric aerosol BC sources on the Southern slope of the Himalayas contained equal contributions from fossil fuel (46 ± 11%) and biomass (54 ± 11%) combustion that were consistent with BC source fingerprints from the Indo-Gangetic Plain, whereas BC in the remote northern Tibetan Plateau was predominantly derived from fossil fuel combustion (66 ± 16%), consistent with Chinese sources and fossil fuel contributions. However, BC concentrations analyzed with a thermal optical transmittance method from snowpits on glaciers on the Northern slope of the Himalayas were suggested to be from internal Tibetan sources, such as yak dung combustion (Li et al., 2016). Atmospheric aerosol measurements of BC have also been collected at the Nepal Climate Observatory from 2006 to 2011 and were shown to have a mean value of 208 ± 374 ng/m3 (± standard deviation) with a well-defined seasonal cycle with maxima during pre-monsoon and minima during the summer monsoon Marinoni et al., 2013). Furthermore, “acute” pollution events were found to mostly occur in the pre-monsoon period when O3 diurnal variability was strongly related to the transport of polluted air-mass rich in BC, which led to dramatic increases of BC (352%) (Marinoni et al., 2013).
In this study we explore the concentration and size distributions in the winter dry season of rBC measured by SP2 in seasonal snow that remained frozen until just prior to analysis. rBC was characterized in the Gokyo Valley, which is one valley west of the Khumbu Valley studied by Kaspari et al. (2014) and Jacobi et al. (2015). Some samples were also collected at lower elevations of the Khumbu Valley. Although BC’s role in reducing surface albedo has been documented, uncertainties remain in the flux and deposition of BC, the concentrations in snow, and the resulting impacts on surface radiative forcing in the Ganges basin, as well as the greater Himalayan region. For the rBC method, snow samples must remain frozen until just prior to analysis. Previous studies have shown losses in rBC concentrations of up to 20% for samples stored in glass vials at 25°C and polypropylene vials at 2°C and up to 30–80% in samples stored in polypropylene vials at 25°C. These losses are due to particles adsorbing to the sides of containers or agglomerating to larger sizes outside of the SP2 detection range, when thawed prior to analysis (Wendl et al., 2014). Samples that were refrozen and thawed after the first melt have resulted in BC losses of up to 60% (Wendl et al., 2014). Obtaining, preserving and transporting in-situ snow samples from this region of the world is extremely challenging due to physical access constraints and electricity demands. As a result, previously published studies from this region are based on samples that melted during transit. Lim et al. (2014) found samples from the Khumbu had larger size distributions of rBC particles than snow samples from Greenland, the French Alps, the Caucasus, and the Himalayas. However, the result was inconclusive because the samples had melted well before analysis. Thus, they could not confirm whether this was natural or if the larger sizes originated from the transportation at room temperature and long-term storage. BC particle sizes have been demonstrated to be larger in snow than the atmosphere, partly due to the removal processes from the atmosphere (Schwarz et al., 2013). This complex process is difficult to model and is a large source of uncertainty for calculating the overall radiative forcing of BC-in-snow on the global climate (e.g., Bond et al., 2013).
Here we use multiple lines of evidence to understand the primary sources, concentrations and impacts on surface albedo, from LAIs in snow in the Dudh Koshi River Basin, a remote headwater catchment in the Khumbu Region of Nepal. Given the difficulty of collecting, preserving and transporting in-situ snow samples, we focused on the relationship between ground-based measurements and the spatial trends in earth-observing satellite remote sensing observations from the Moderate Resolution Imaging Spectroradiometer (MODIS). In this study, we explore the snow-covered area with the MODIS Snow Covered Area and Grain size algorithm (MODSCAG) (Painter et al., 2009) and the radiative forcing derived from the MODIS Dust and Radiative Forcing (MODDRFS) algorithm (Painter et al., 2012). Furthermore, to investigate atmospheric aerosol patterns at the time of sampling and potential LAI sources, aerosol optical depth (was retrieved from MODIS and then modeled by the global Navy Analysis Prediction System Model (NAAPS) to produce speciated aerosol optical depth that is characterized as anthropogenic and biogenic fine aerosols, biomass burning smoke, dust, and marine sea salt (Lynch et al., 2016). Our findings suggest that dry-dung burning, as opposed to wildfires or fossil fuel combustion, could be the primary source of BC to low elevation snow packs in the study site. However, it should be noted that these multiple lines of evidence are a first attempt to compare across spatial scales, ranging from ground based rBC snow observations at individual points to 500 m scale MODSCAG and MODDRFS and 1/3° pixel area of the NAAPS model of speciated aerosol optical depth. These results give us insight into the strengths and weaknesses of potential up-scaling across differing approaches to estimate LAI concentrations and sources at higher elevations, such as above 5500 m a.s.l., that may be less accessible to ground sampling.
Materials and Methods
Site Description
The Gokyo Valley lies within the Dudh Koshi River Basin, which is an alpine headwater catchment on the southern slopes of the Himalayas that flows to the Sapta Koshi and ultimately the Ganges River (Figure 1). The Dudh Koshi River Basin encompasses both the Gokyo Valley with the Ngozumba Glacier and the Khumbu Valley with the Khumbu Glacier. Furthermore, snowmelt contributes to streams used for drinking water. Lastly, dried yak-dung is the primary source of fuel in households in this region.
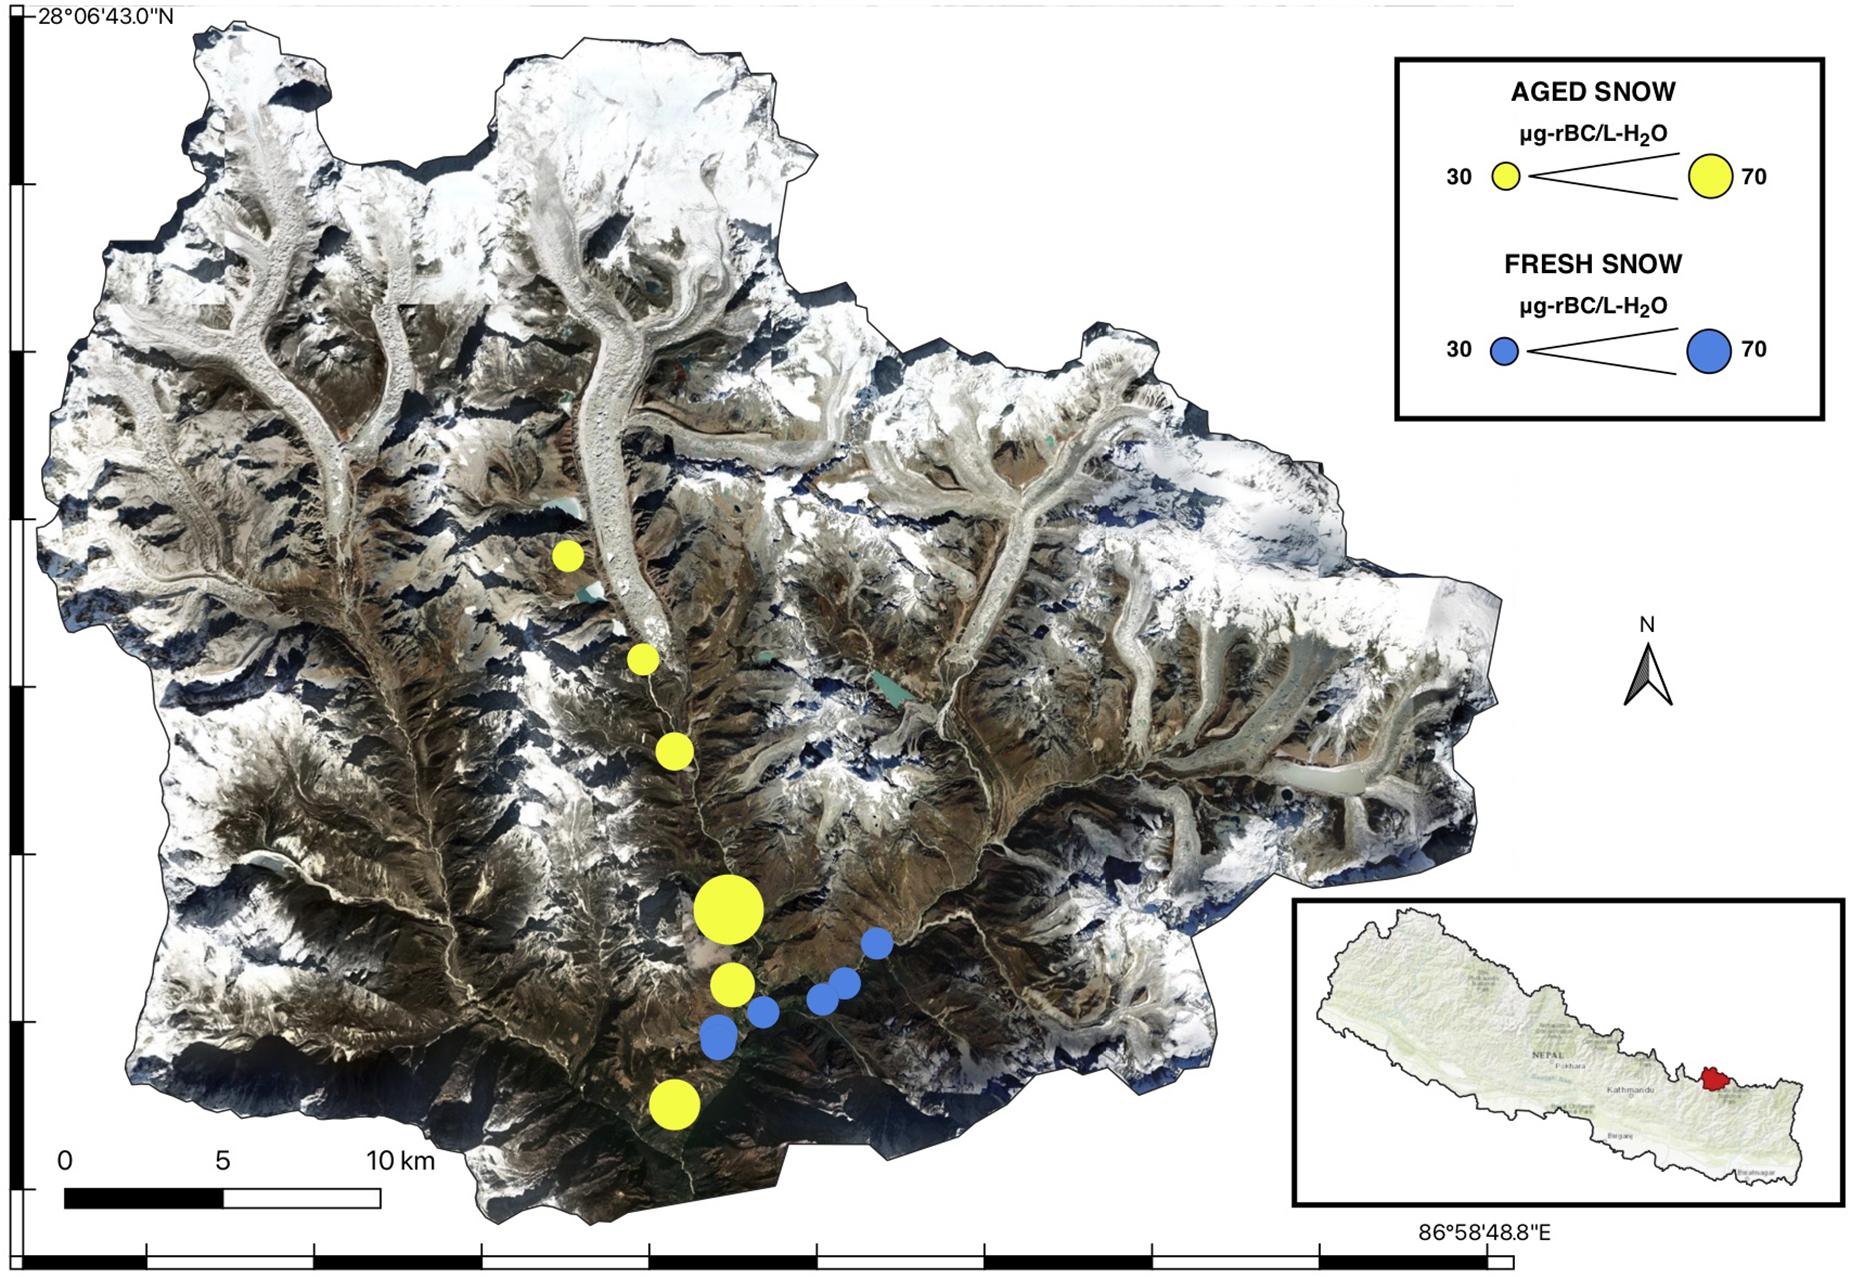
Figure 1. Refractory black carbon (rBC) concentrations at sample locations in the Dudh Koshi River Basin.
Snow Sample Collection
Surface snow samples (<5 cm) were collected with nitrile gloves and a sterile scoop over one season in the winter of 2016 along a 2000 m a.s.l. elevation transect from just above Namche Bazaar at 3550 m a.s.l. and Phunki Thanga at 3250 m a.s.l. to Gokyo Ri at 5299 m a.s.l. One set of snow samples was collected in pre-cleaned glass bottles and kept frozen in the field by packing the samples in snow within vacuum-sealed stainless steel thermoses, which were kept frozen before samples were collected, as well as after. They were then shipped frozen to Boulder, CO for rBC analysis as described in section “Refractory Black Carbon Analysis.” The second set of snow samples were collected in sealed sterile bags and melted in the field in pots of warm water. A subset of well-mixed sample from the sterile bag was filtered in the field on 0.7 μm Glass Fiber Filters into two sets of bottles. One set of bottles were pre-cleaned glass amber bottles; the filtrate was later analyzed for total organic carbon and dissolved organic carbon. The other set of bottles were acid-rinsed plastic Nalgene bottles; the filtrate was later analyzed for major and minor ions, as well as trace elements as described in section “Dissolved Organic Carbon, Total Organic Carbon and Trace Element Analysis.”
Snow samples were classified as either fresh snow (i.e., snow that had fallen within 24 h before sampling) or aged snow (>24 h old). More than 10 cm of fresh snow was deposited while the team was in the field on February 8th, 2016. The top 5 cm of snow was collected. Although there was almost no snow left on the ground in the locations sampled for fresh snow, careful sampling of the top 5 cm was conducted, confirming that there was no potential for the collection of aged snow, in the fresh snow samples. The fresh snow blanketed the ground, whereas the aged snow, was collected from snow patches of remaining snow. The SP2 is less sensitive to interference of materials other than BC (Kondo et al., 2011), we assume there was not interference from other LAIs in the aged snow samples. Total snow depth and snow density were not recorded in the field.
Refractory Black Carbon Analysis
After collection, snow samples for rBC analysis were left outside in a shaded area to stay frozen in the field. They were stored in a freezer in Kathmandu and then shipped frozen during their transport to the Institute of Arctic and Alpine Research (INSTAAR) in Boulder, Colorado. They were then transferred to the Earth System Research Laboratory at the National Oceanic and Atmospheric Administration (NOAA) for rBC analysis. No thaw was apparent in the samples.
rBC mass mixing ratios (MMR) were analyzed by SP2 at NOAA in Boulder, CO as per methods described in Schwarz et al. (2013); Katich et al. (2017), and Khan et al. (2019). In short, snow samples were melted for the first time just prior to analysis and then immediately aerosolized with a calibrated CETAC Marin-5 nebulizer that was interfaced with the SP2. The SP2 was calibrated with fullerene soot (Alfa Aesar, Woodbridge, Massachusetts, Lot F12S011), which is the best known proxy for rBC found in the atmosphere. In comparison to other BC measurement techniques, the SP2 is less sensitive to interference of materials other than BC (Kondo et al., 2011), has a low detection limit of 0.01 μg L–1, requires a small sample volume (<1–2 mL), provides fast analysis (<10 min) (Lim et al., 2014) and produces particle mass size distributions (Slowik et al., 2007).
An attempt was made to extend the detection limit of the SP2 to as large as 1.5 μm, as previous snow measurements have indicated the potential for large mass contributions from particles that are larger than is typically found in the atmosphere (Schwarz et al., 2013). However, a detector failure ultimately limited the upper detection limit of the mass equivalent diameter to 0.6 μm. A sample’s final rBC MMR is determined by comparing its average mass-flux per unit time seen by the SP2 to that of a carefully prepared fullerene concentration standard. A lognormal fit to each sample’s rBC mass-size distributions was used to estimate the amount of rBC beyond the upper limit of detection, and the measured rBC concentrations were scaled appropriately. A reasonable lognormal fit was achieved for all samples. It should be noted that this method fails to account for the possibility of a secondary, larger rBC modes as well as the occasional large rBC particles that could potentially be significant from a mass standpoint. Thus, it is prudent to view the concentrations as lower bounds rather than absolute concentrations. Suspensions of polystyrene latex spheres ranging in size from 220 to 3000 nm diameter were used to characterize size-dependent nebulization efficiency and confirmed a low sensitivity to particle size over this range our detection range, which is consistent with other findings from concentric pneumatic nebulizers (Lim et al., 2014; Wendl et al., 2014; Mori et al., 2016; Katich et al., 2017). Thus, no size correction was applied for nebulizer size dependence.
The nebulization system was rinsed with deionized water between each snow sample to reduce line contamination. rBC fullerene soot samples from a carefully prepared concentration standard were run between every four snow samples for verification that the nebulization/transmission efficiency was not changing. Two hundred and twenty nanometer polystyrene latex spheres were run every eight samples to verify laser power was consistent and the polystyrene latex spheres concentration standard also provides an additional method for nebulizer aerosolization/transmission efficiency. The nebulization system was rinsed with deionized water between each snow sample until no background contamination from the previous sample was evident. Measurements of rBC concentrations in water blanks were also interspersed between samples. The purpose is twofold; first, this allows us to bound our lower limit for rBC concentration measurements. Second, it provides a target concentration to allow our system to settle to before introducing a new sample. These blanks had an average of 0.26 μg/L, which is nearly an order of magnitude lower than the cleanest sample’s rBC concentration.
Dissolved Organic Carbon, Total Organic Carbon, and Trace Element Analysis
The samples in glass and plastic bottles were shipped to INSTAAR in Boulder, CO. There they were analyzed for dissolved organic carbon and total organic carbon concentrations on a Schimadzu TOC-V-CSN. The samples in plastic bottles were analyzed for major cations (Ca, Fe, Na, K) by ICP-OES, as well as major anions (F, Cl, NO3, PO4, SO4) by ICP-MS.
MODIS Snow Cover Fraction and Dust Radiative Forcing
Frequent cloud cover persists in this region making remote sensing observations challenging. For this study we created spatially and temporally complete daily snow cover fraction and dust radiative forcing data using MODIS-Terra inputs. Snow cover fraction was first estimated using MODSCAG (Painter et al., 2009) that relies on a spectral mixture analysis using all land bands from the MOD09GA v006 surface reflectance products. MODIS data is processed at the native resolution of ∼463 m. The MOD09GA product is listed as a nominal 500 m. The MODSCAG algorithm more accurately maps snow than standard MODIS products that use 2 bands (Hall et al., 2002) especially during accumulation and ablation (Rittger et al., 2013). The impact of dust on the visible albedo (Δvis) is calculated as the difference between clean snow spectra, based on grain size, and the satellite observed snow spectra, which is LAI affected. Δvis was estimated using the MODDRFS algorithm (Painter et al., 2012). Therefore, a larger Δvis suggests a larger influence from LAIs on the visible wavelengths.
We gap filled both snow cover fraction and Δvis weighting by the satellite view zenith angle to account for viewing geometry (Dozier et al., 2008). We used additional data products from MODSCAG including fractional vegetation and fractional rock to improve cloud filtering, as well as vegetation height maps to account for snow cover obscured by the canopy (Raleigh et al., 2013; Rittger et al., 2019). Snow cover maps using this method have a RMSE of 20% in the winter likely due to cloud cover, which is spectrally similar to mixed snow and rock. This method can detect snow 98% of the time to correctly capture snow melt out (Rittger et al., 2019). In addition to snow cover fraction and Δvis we derived total snow cover days from the snow cover fraction. Snow covered days are calculated by summing the number of days with snow cover in each pixel for an entire year.
Aerosol Transport Modeling
The NAAPS is a global aerosol transport model, providing aerosol forecasts and analyses at 1/3° latitude/longitude resolution and 42 vertical levels below 100 hPa (Lynch et al., 2016). The NAAPS model characterizes anthropogenic and biogenic fine particles, biomass burning smoke, dust, and marine sea salt aerosols. The total aerosol optical depth is constrained through assimilation of retrievals of aerosol optical depth from the MODIS on Aqua and Terra (Zhang and Reid, 2006). The NAAPS model has been used in a wide range of scientific studies and applications, including aerosol life cycle, climatology, interactions of aerosols with the atmosphere, ocean and cryosphere (e.g., Reid et al., 2012; Xian et al., 2013; Khan et al., 2017a, b, 2019; Markowicz et al., 2017; Ross et al., 2018). In this study, black/organic carbon was separated from sulfate in the anthropogenic and biogenic fine particles (the two are combined by default), so that black/organic carbon concentration and aerosol optical depth due to biofuel and other anthropogenic (e.g., fossil fuel) emission can be exclusively simulated. Black/organic carbon emission from biofuel, which includes dung burning, is adopted from Bond et al. (2013). Biofuel emission contribution is estimated to contribute over 60% to BC and 80% to OC emissions over the Indian subcontinent (Bond et al., 2013).
Smoke from open biomass burning is determined from satellite based near-real time thermal anomaly data (Reid et al., 2009), which include orbital corrections for MODIS-based emissions and regional tunings. The relative magnitude of biomass burning smoke aerosol optical depth vs. black/organic carbon aerosol optical depth provides information on the relative impact of biomass burning vs. biofuel emissions on the rBC measurements sampled in the region.
Results and Discussion
rBC and Snow Chemistry Concentrations
rBC concentrations ranged from 3.9 to 76.8 μg-rBC/L-H2O (Table 1) with an overall average of 21.6 μg-rBC/L-H2O. In general, rBC concentrations decreased with increasing elevation (Figure 1). As mentioned earlier, previously reported rBC concentrations from the region represent lower bounds on concentrations due to melting well before analysis. Furthermore, it is difficult to provide a fully consistent story between our data and previously published results, given the many confounding variables and underlying factors that could lead to differences in the rBC concentrations. For example, (a) annual variation (b) seasonal variation, (c) age of snow, (d) difference in snow melt processes, (e) the uncertainty of the measurement method and (f) the fact that the samples in both Kaspari et al. (2014) and Jacobi et al. (2015) were thawed well before analysis. However, despite our samples having experienced no melt prior to analysis, we measure similar concentrations to previously reported results (Table 2) of surface snow from the nearby pyramid station (0.1–70 μg-rBC L-H2O) with a mean and median concentration of 10 and 1.5 μg-rBC/L-H2O (Jacobi et al., 2015). In general, the average rBC concentration in our fresh snow samples (10.1 μg-rBC/L-H2O) had lower concentrations than the aged snow samples (33.1 μg-rBC/L-H2O). This was confirmed by a one-tailed t-test (p = 0.03). Jacobi et al. (2015) also found lower average concentrations in fresh snow (5 μg-rBC/L-H2O) than aged snow (15 μg-rBC/L-H2O). Since the samples in Jacobi et al. (2015) represent lower bounds on concentrations due to storage of melted samples well before analysis, the real values could be higher than our observed concentrations. Similarly, fresh snow samples collected at Pyramid Station in 2009 from Kaspari et al. (2014) were also melted in transit and were corrected for nebulizer loss based on Aquadag standards, but not for particle loss during storage. Therefore, the real values observed in Kaspari et al. (2014) may actually be higher than our observations, despite our rBC concentrations being in a similar range. The same study explored integrated snow profiles at three locations on Mera Peak of found that impurities had become concentrated in large ice lenses (Kaspari et al., 2014) and were much lower in an ice core on the Khumbu Glacier (1.5 μg-rBC/L-H2O) (Kaspari et al., 2011).
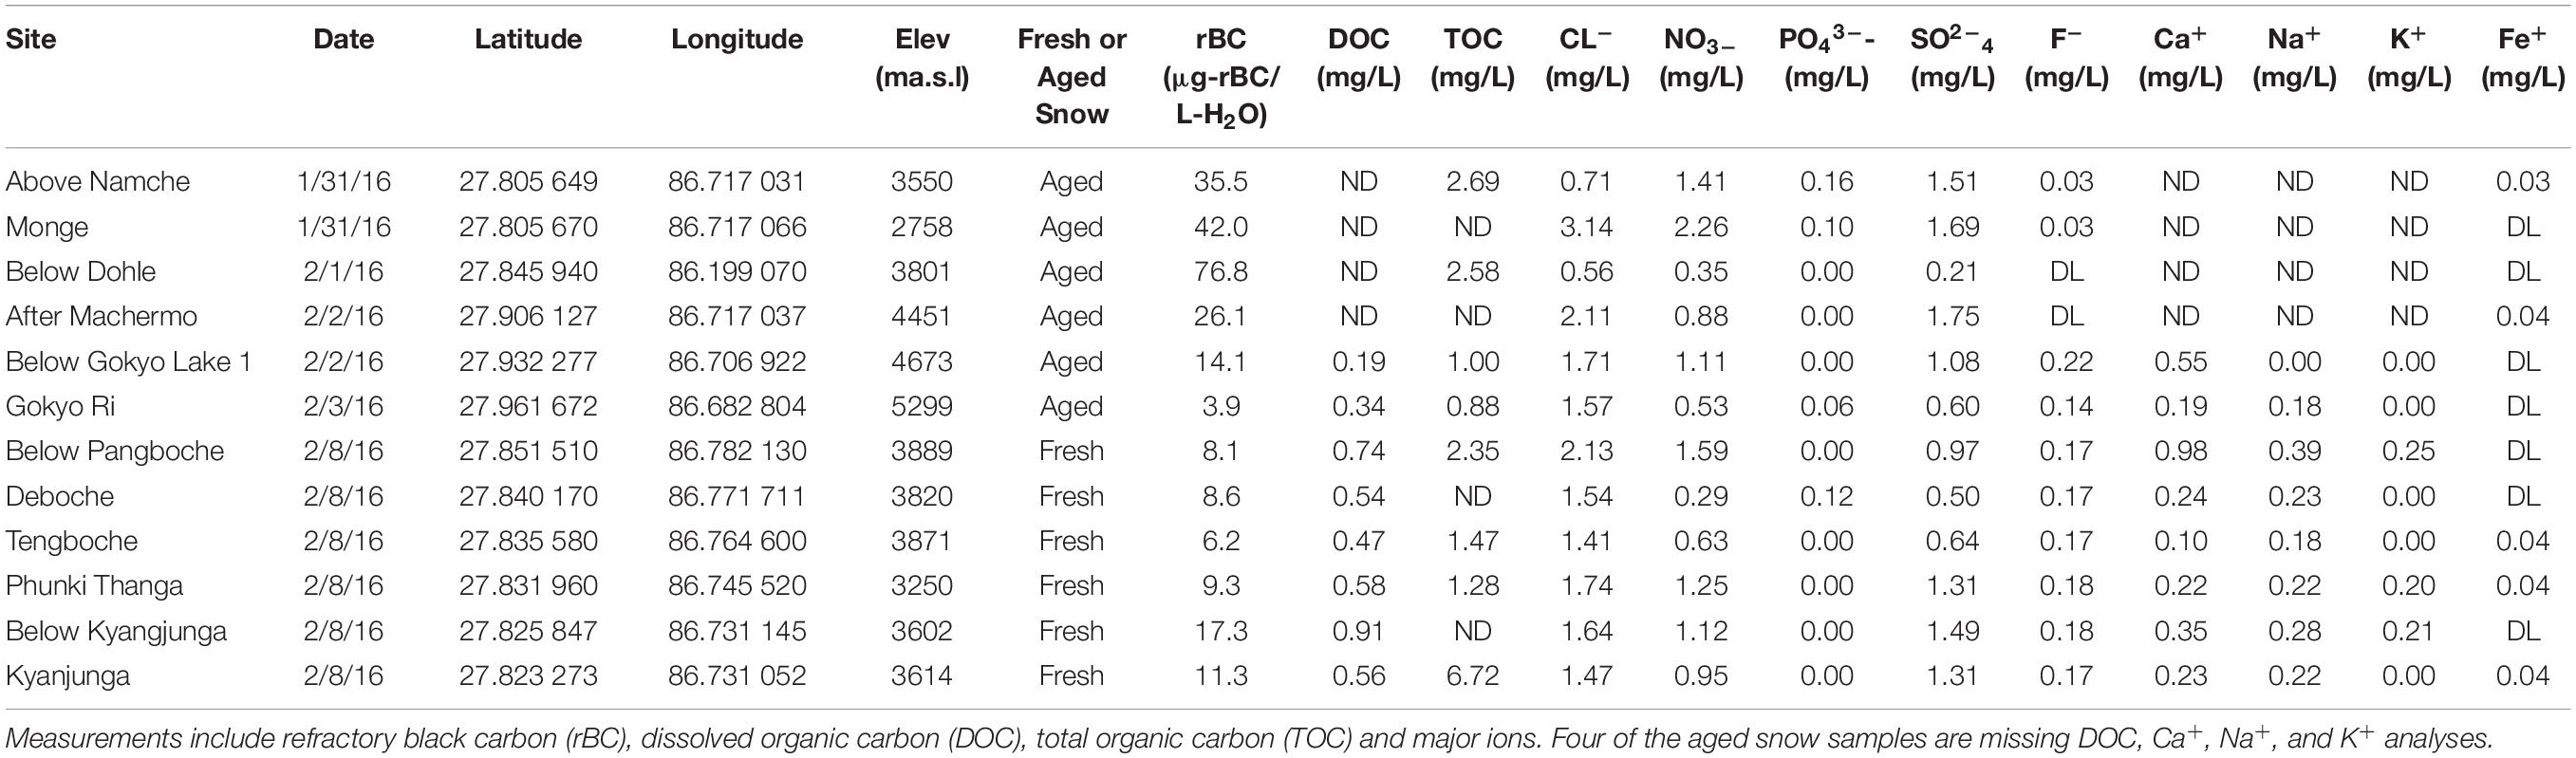
Table 1. Snow chemistry concentrations from this study of snow on land in the Gokyo Valley.
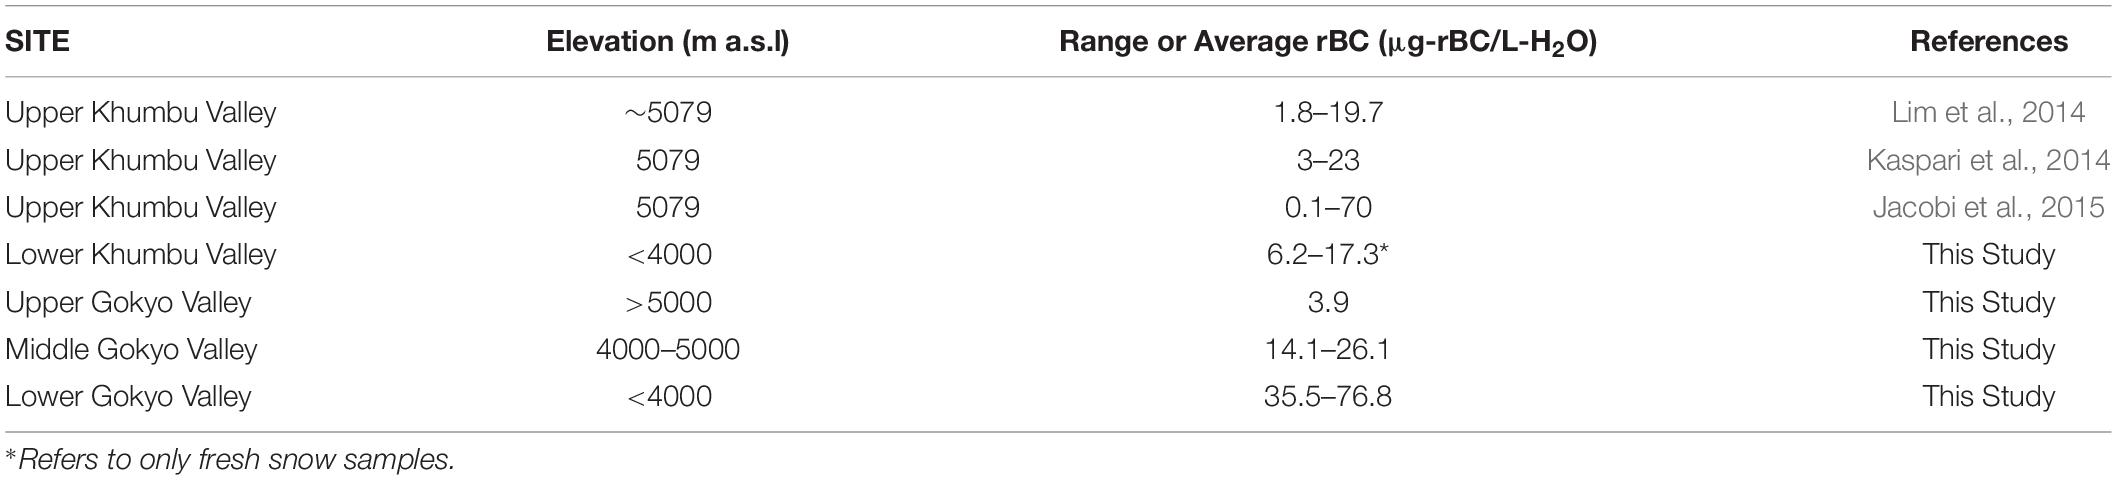
Table 2. Refractory black carbon (rBC) concentrations from this study of snow on land in the Gokyo Valley compared to previously published rBC concentrations in surface snow from the nearby Khumbu Valley at Pyramid Station.
Our results showed a moderate correlation between rBC concentrations and decreasing elevation for the aged snow samples (r2 = 0.420 and r2 = 0.927 when excluding the outlier), (elevation, rBC concentration), Lower Gokyo Valley (<4000 m a.s.l., 51.4 μg-rBC/L-H2O), Middle Gokyo Valley (4000 to 5000 m a.s.l., 20.1 μg-rBC/L-H2O), Upper Gokyo Valley (>5000 m a.s.l., 3.9 μg-rBC/L-H2O). However, it was only a small sample set, n = 6 (Supplementary Figure S1). This pattern of low concentrations at higher elevations has previously been observed across an elevation transect on Mera Peak (Kaspari et al., 2014), from Mera La (5400 m a.s.l., 180 μg-rBC/L-H2O), Mera High Camp (5800 m a.s.l., 24.4 μg-rBC/L-H2O), and Mera Col (6400 m a.s.l., 1.0 μg-rBC/L-H2O). Snow samples from Jacobi et al. (2015) were collected at 5079, 5700, and 5700 m a.s.l. The samples collected in this study were collected at lower elevation than previously reported studies, with the exception of Gokyo Ri at 5299 m a.s.l. Therefore, this study provides new information on rBC data at lower elevation in the region. Our rBC size distribution findings show a slight shift to a larger mode of particle sizes for the aged snow samples (Figure 2), which has not been documented in any previous rBC study of in-situ snow samples. This could be due to aggregation of BC-particles during freeze-thaw processes or due to the collection of larger BC particles over time from local sources. This shift in modal diameter is evident even within our detection limit of 0.6 μm.
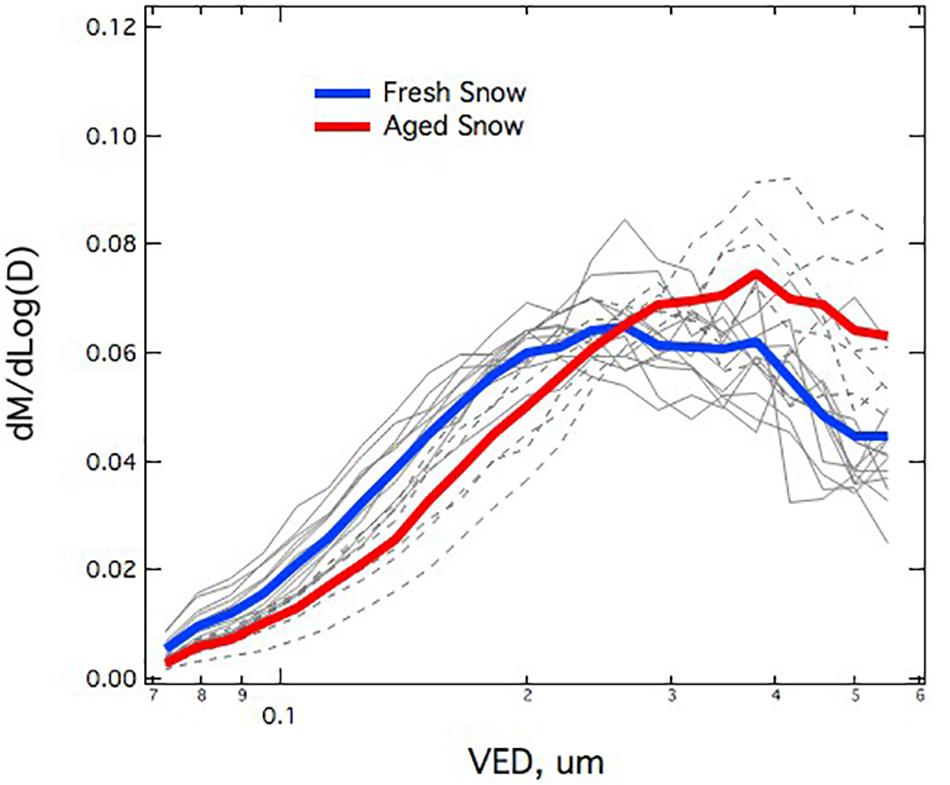
Figure 2. Average size distributions of refractory black carbon (rBC) in fresh (n = 6) and aged (n = 6) snow on land samples from the Gokyo Valley, Nepal. The solid gray lines represent the size distributions of all fresh snow samples and the dotted lines represent all aged snow samples. The blue line is the fresh snow sample average and the red line is the aged sample average.
In contrast to the rBC pattern with elevation in aged snow samples, total organic carbon, dissolved organic carbon and trace elements showed no trend with elevation in concentration and location. The low values of Ca and Fe could suggest that dust was not a large factor in these samples because these solutes could be leached from mineral dust. The difference from Kaspari et al. (2014), which reported dust as the dominant light absorber in the snow, is likely due to the difference in the types of samples, as well as the elevation. For example, the samples in this study are surface samples from seasonal snow at lower elevations, whereas the large Fe concentrations reported in Kaspari et al. (2014) were integrated samples from snow pit profiles.
MODIS Snow Cover Fraction and Visible Albedo
The spatially and temporally complete MODSCAG snow cover fraction (Figures 3A,C) tracks the overall observed accumulation and melt trends seen while sampling as evidenced by the greater extent of fresh snow on February 8, 2016 concurrent with fresh snow rBC sampling. However, the small aged snow patches sampled on the ground were not large enough to be captured in the remote sensing data from February 3, 2016. This could be due to the frequent cloud cover in this region that leads to snow and cloud confusion and necessitates the use of a persistence filter and an elevation filter. As a result, MODDRFS is unable to account for small nuances in the changes in snow cover or enable a direct comparison of rBC observations in patchy snow. For this reason, we used data for the areas where snow is most persistent, adding certainty to our satellite analysis beneath the clouds. To show the ability of remote sensing to track snow cover fraction and the impact of dust and BC on the snow pack, we looked at general trends with elevation and chose February 3 (aged snow) and February 8 (fresh snow) which corresponded best to in-situ observations (Table 1).
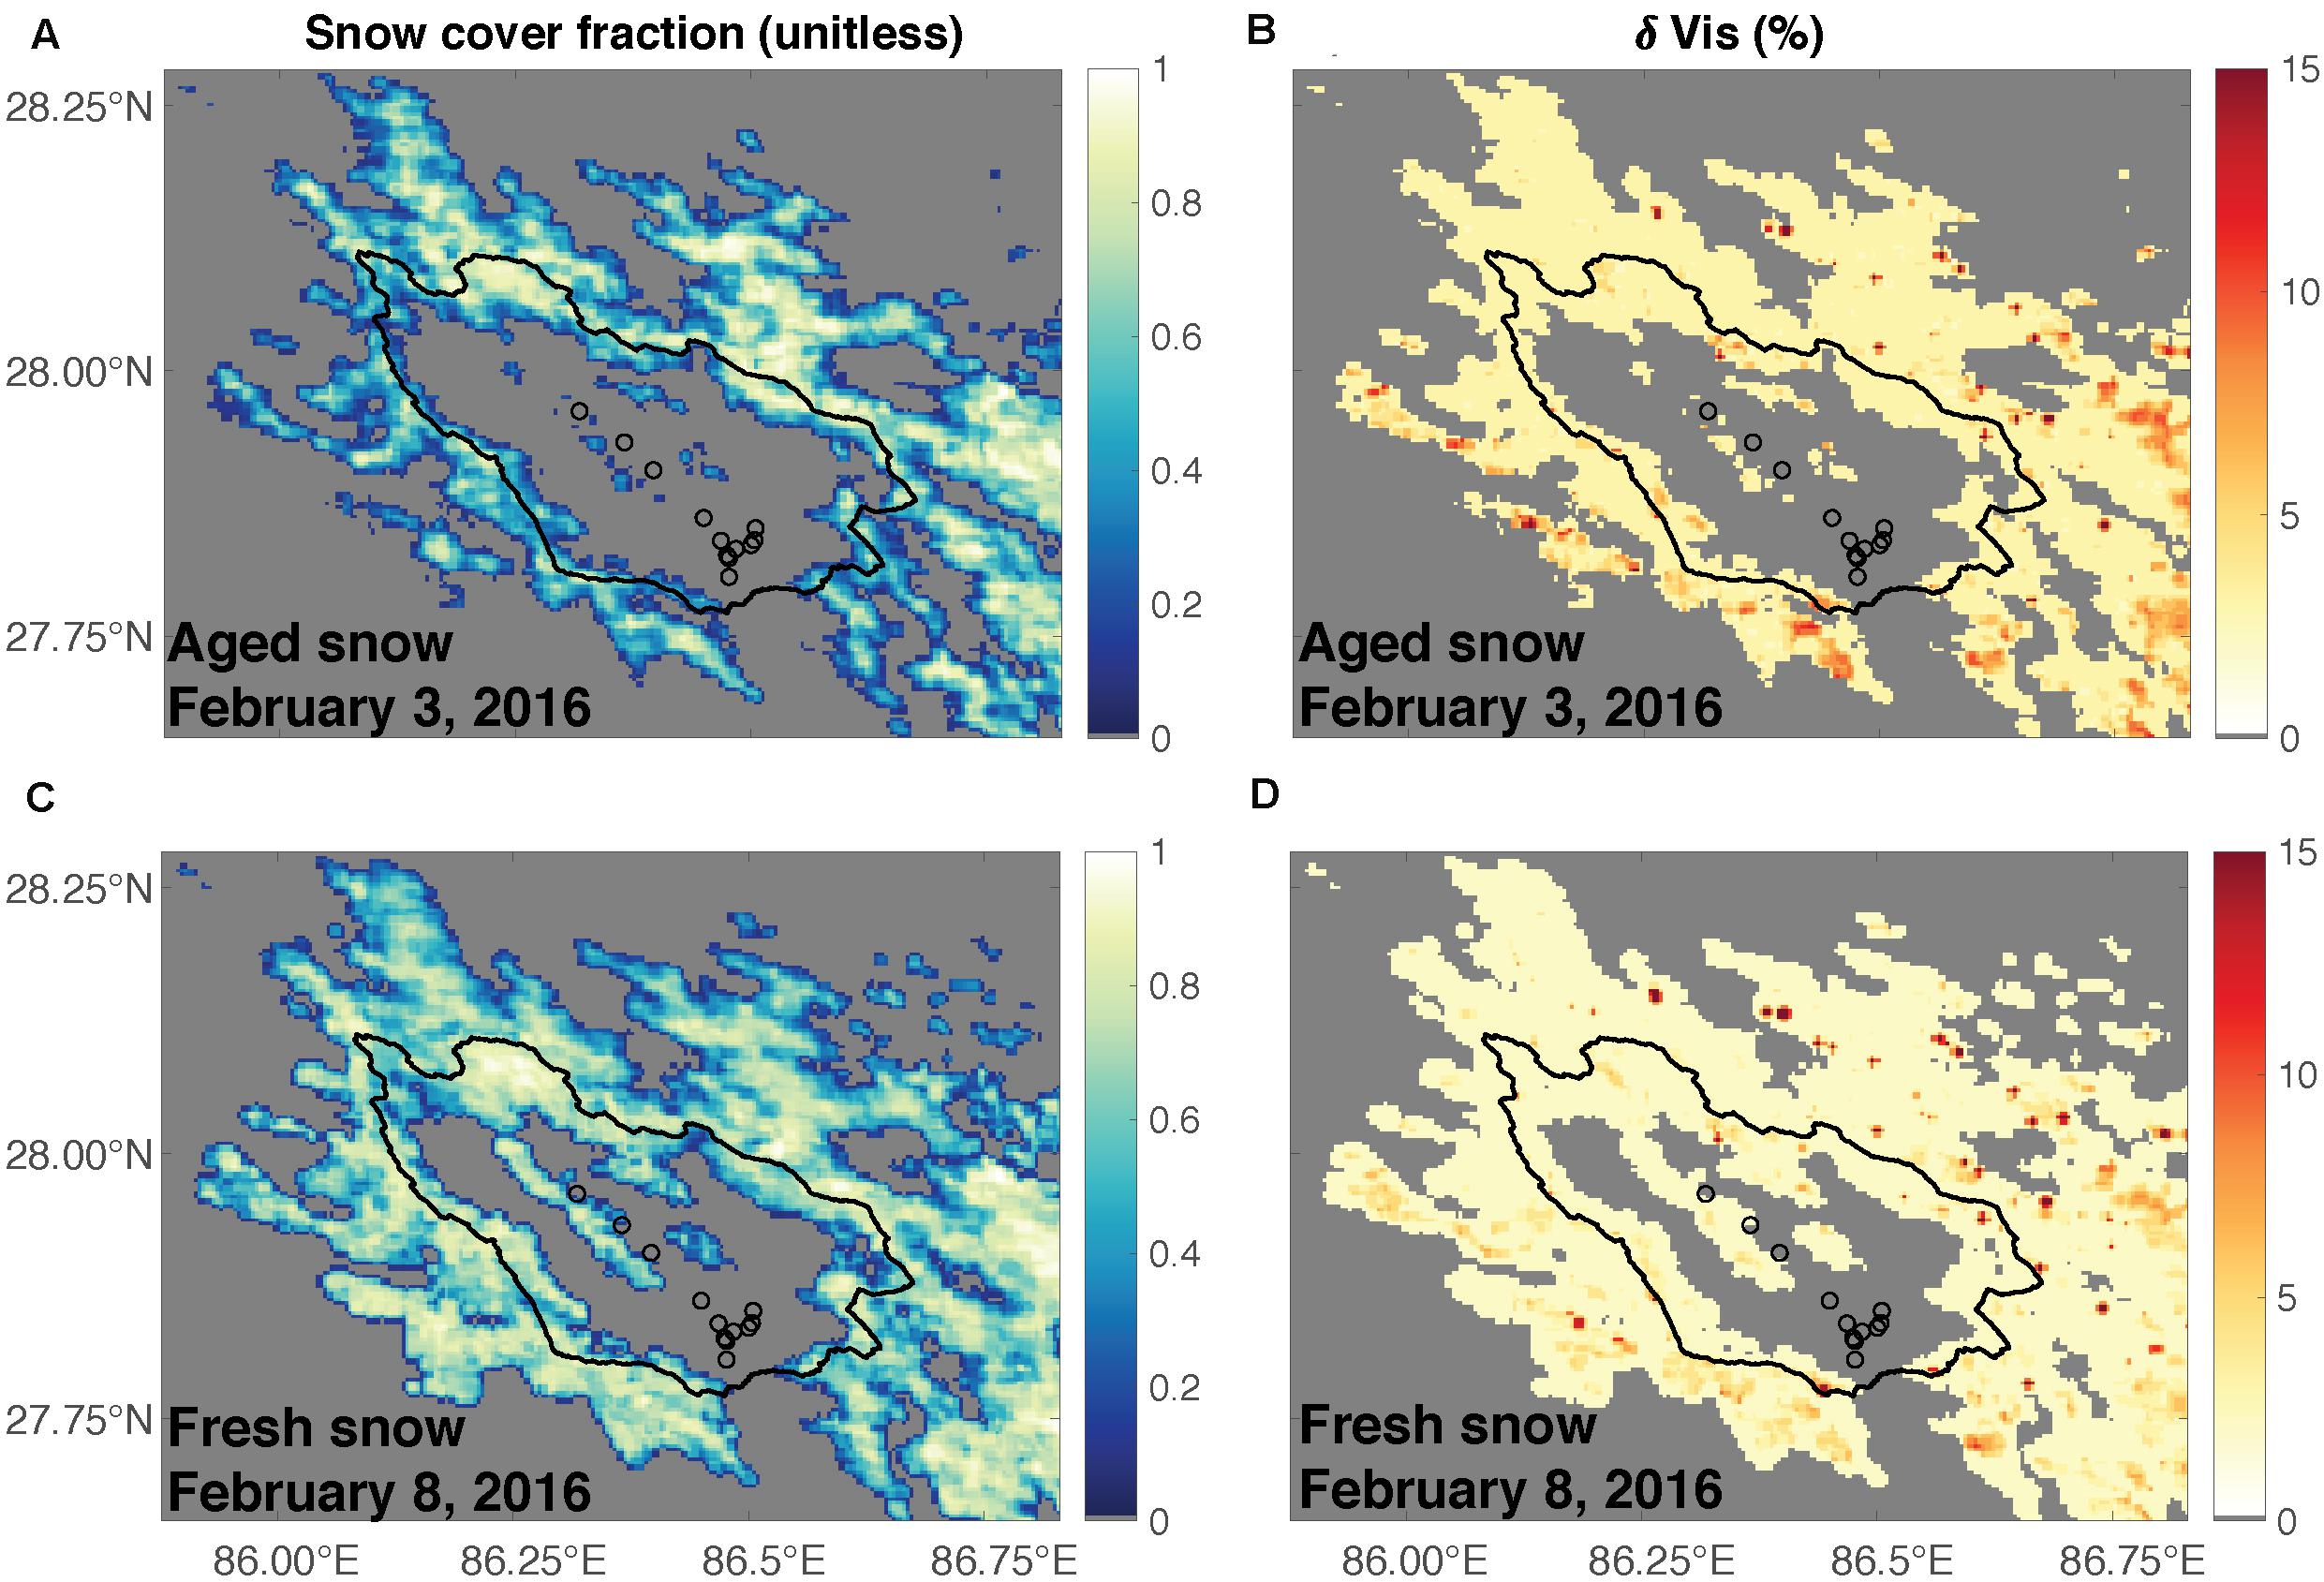
Figure 3. Snow covered area from spatially and temporally complete MODIS Snow Covered Area and Grain size algorithm (MODSCAG) (A,C), Δvis from spatially and temporally complete MODIS Dust and Radiative Forcing algorithm (MODDRFS) (B,D) for February 3 (aged snow) and February 8 (fresh snow). Latitude and longitude are shown on the x and y axis, respectively. The dots represent sampling locations and the solid line represents the watershed for the headwaters of the Dudh Koshi River.
The spatially and temporally complete MODDRFS Δvis (Figures 3B,D) appears to track with snow fall and snow age patterns. Higher Δvis suggests a higher impact on the albedo in the visible wavelengths from impurities, such as dust and BC, resulting in a lower albedo in the visible range. Whereas, a lower Δvis suggests a higher albedo in the visible wavelengths and therefore “cleaner” snow. The spatially and temporally complete MODDRFS Δvis results showed aged snow on February 3, 2016 had a higher Δvis than new snow on February 8, 2016, which is the general pattern observed in the rBC concentrations, with higher rBC concentrations observed on February 3, 2016.
NAAPS Model
Results from the NAAPS model show large sources of aerosols in Eastern India towards the end of January (Figures 4A–C) and in West India (Figure 4D) across the study period from 2016-01-20 to 2016-02-07. The source areas (red) of black/organic carbon aerosol optical depth (Figure 4) made their way up to the study region around 2016-01-27 (Figure 3B). We analyzed data for the 1/3° pixel covering the Dudh Koshi River Basin shown in Figure 5A using the native MODIS sinusoidal projection, as well as snow covered area and Δvis from MODIS within the 1/3° NAAPS pixel (Figure 5B). The NAAPS speciated aerosol optical depth results suggest there was about three times the amount of anthropogenic and biogenic fine particles aerosols from biofuel (dry-dung burning) relative to BC-smoke from wildfires at the time of our ground-sampling (Figure 5C). There were also two prominent spikes in anthropogenic and biogenic fine particles in the study region during the study period on 2016-01-27 and 2016-01-31 (Figures 4, 5C).
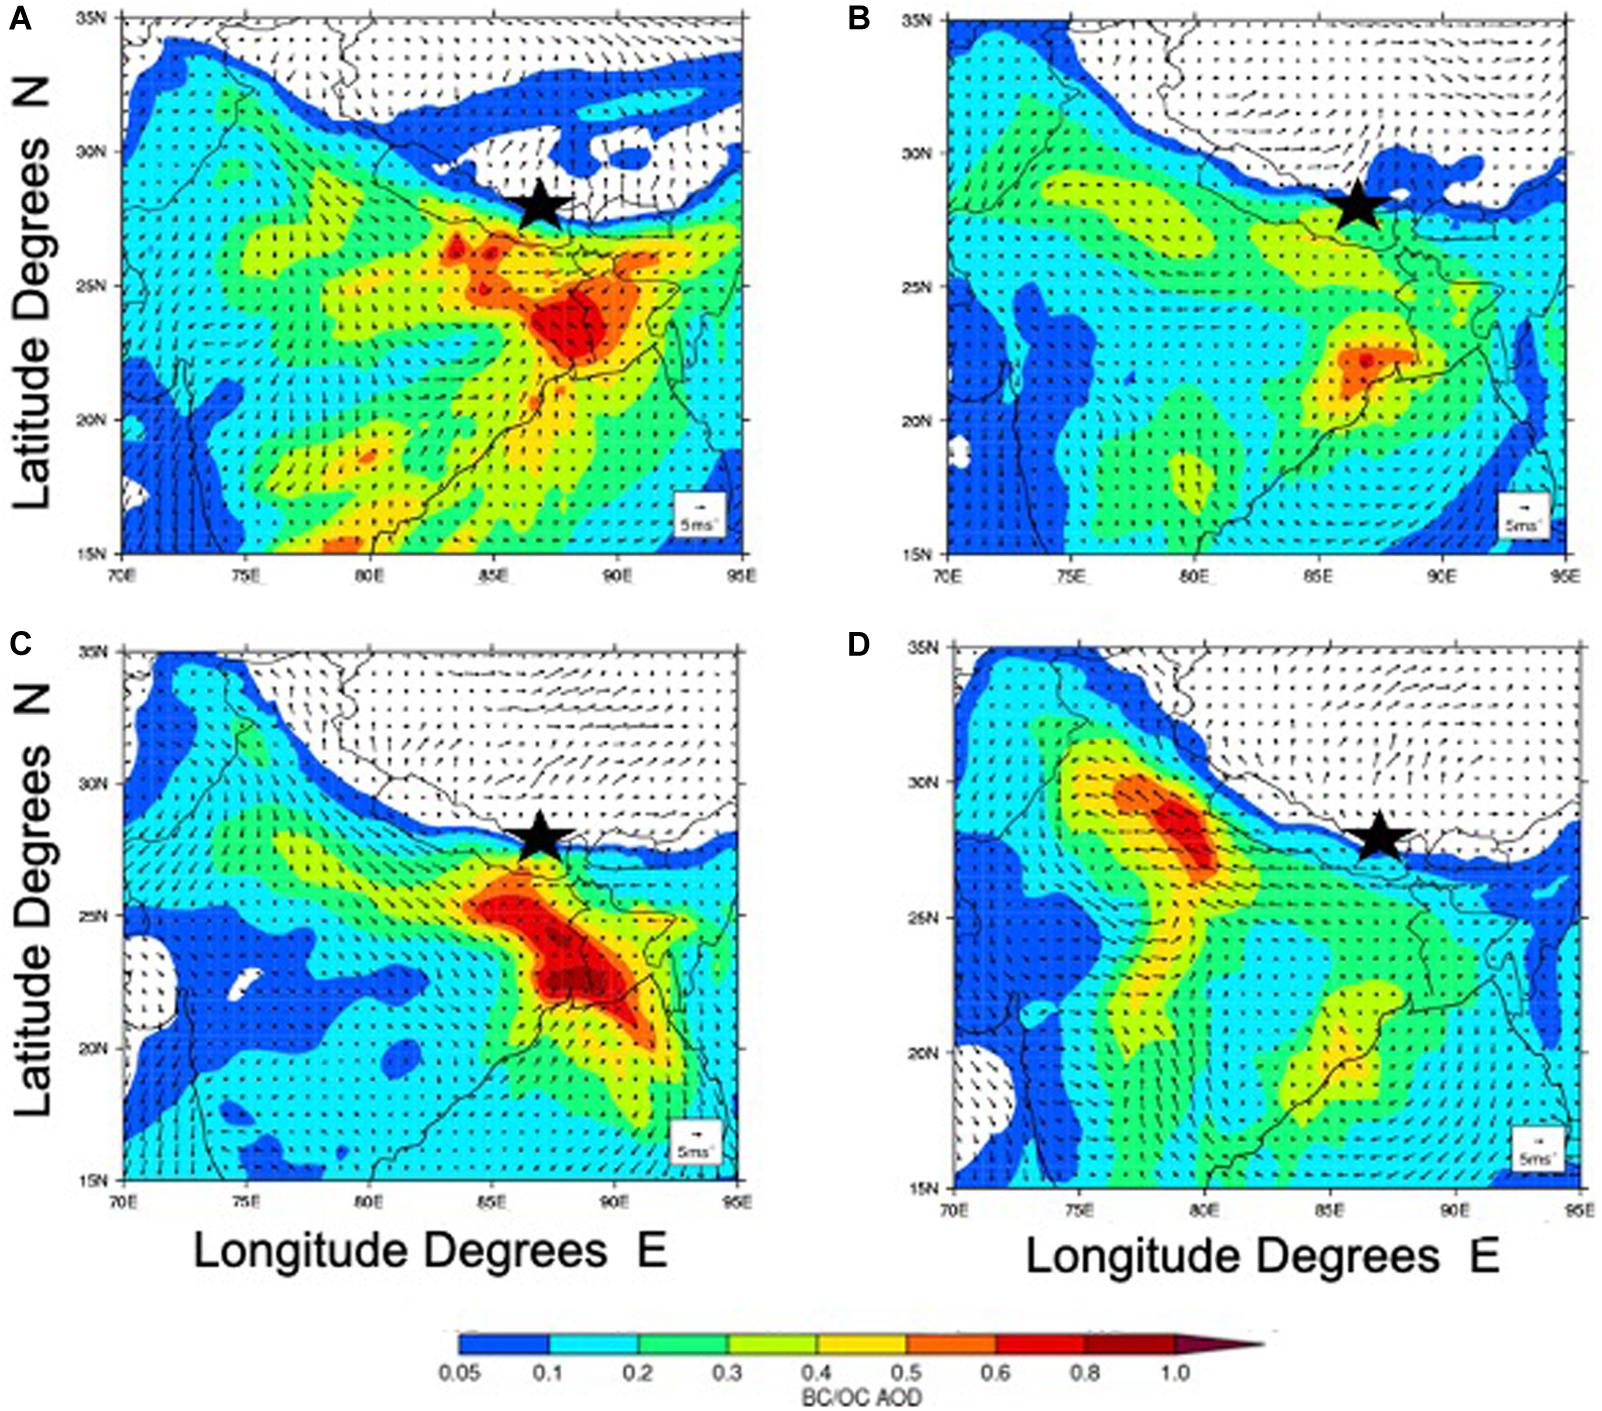
Figure 4. NAAPS Model Results of Black Carbon/Organic Carbon (BC/OC) Aerosol Optical Depth (AOD) and 850 hPa wind (vectors) over South Asia over the study period. (A) 20 January 2016, (B) 27 January 2016, (C) 31 January 2016, and (D) 07 February 2016. The Dudh Koshi River Basin is denoted with a *Aerosol optical depth is unitless.
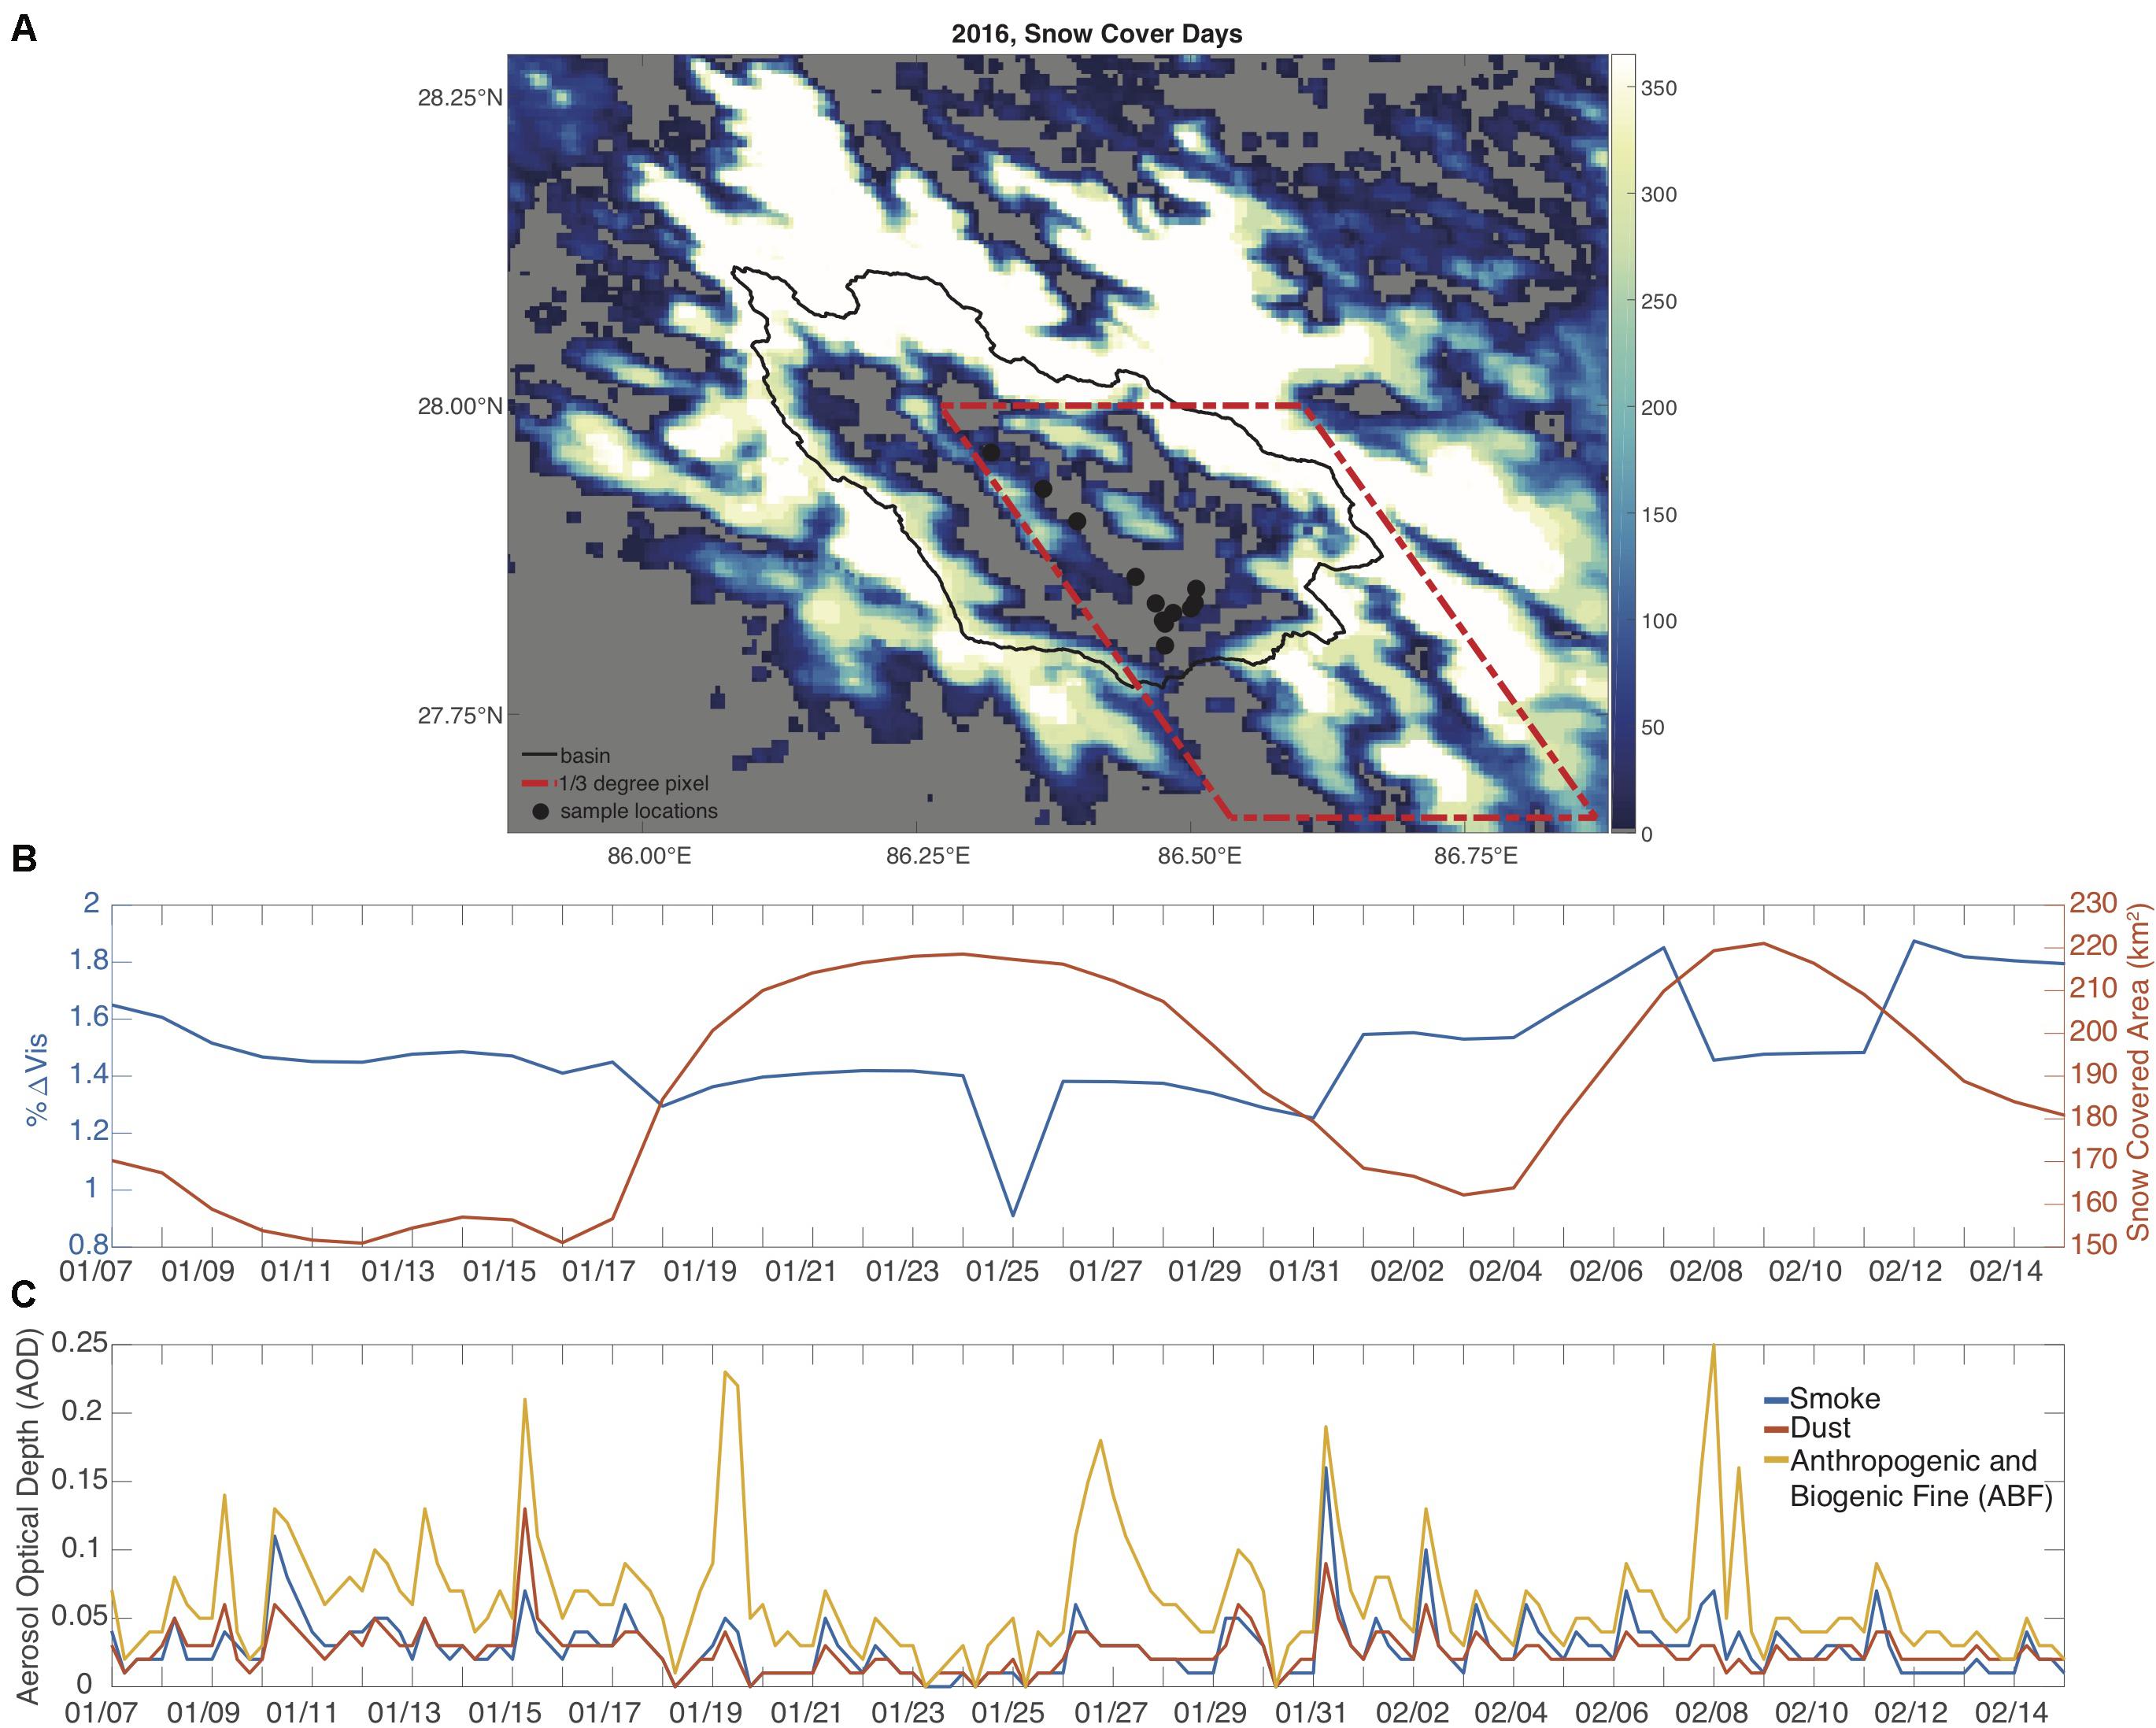
Figure 5. (A) Map of snow cover fraction on 8 February 2016 with location of the Dudh Koshi River Basin, samples locations and corresponding Navy Aerosol Analysis Prediction System model (NAAPS) 1/3° pixel, which is used for (C). (B) Snow covered area and Δvis during the sampling period (C) NAAPS Speciated Aerosol Optical Depth across a 1/3° MODIS gridded area of the study region during the sampling period. Snowfall events occurred on 18 January and 5 February 2016.
These model outputs follow previous emission estimates where anthropogenic and biogenic fine particles have been found to contribute 50–90% of carbonaceous aerosols in the region (Gustaffsson et al., 2009). As mentioned earlier, burning of dried yak dung is common in local tea houses. Further, burning of dried dung is also common across South Asia. Therefore, it is hard to tease out local yak-dung burning from regional sources of dried dung burning in the anthropogenic and biogenic fine particles at the 1/3° resolution of NAAPS or from the rBC method. Thus, the rBC concentrations measured in our samples could be a mixture of local and regional anthropogenic and biogenic fine particles. However, the anthropogenic and biogenic fine particles events that occurred between snowfall events likely provided additional dry deposition of BC and influenced the higher rBC loadings in the aged snow samples (Table 1 and Figure 1). During this time there was no new snowfall and thus the snowpack accumulated aeolian deposition of all LAIs, including both BC and mineral dust. Although these conclusions seem intuitive, it has been rarely corroborated across both observations and modeling.
MODIS-Snow Observations and NAAPS Global Aerosol Modeling
In general, due to smoothing and the algorithms used to process the MODIS-snow albedo data, it is hard to discern high temporal resolution trends between the Δvis and snow covered area in Figure 5A as compared to the six-hourly resolution of aerosol optical depth from NAAPS in Figure 5B. However, the Δvis appears to slightly increase between snowfalls 2016-01-31 and 2016-02-07 and very slightly decrease during snowfalls from 18 to 31 January 2016 and 08 to 11 February 2016. There was also a slight modal shift to larger rBC size distributions in the aged snow samples relative to the fresh snow samples. When comparing snow covered area and aerosol optical depth, the aerosol optical depth spikes in smoke and anthropogenic and biogenic fine particles may be associated with the weather system that brought the new snowfall.
Summary and Conclusion
Although the interpretation of these findings is inherently tentative, we show that there is future potential for up-scaling from ground rBC-snow observations to MODIS-snow albedo products and a global aerosol model in High Mountain Asia. For example, more ground observations over a larger spatial area and elevation gradient would be useful for comparing with MODIS data, which has a fairly course pixel resolution. Additionally, comparison with finer-resolution remote sensing products would also be useful. These first results of rBC from lower elevation seasonal snow in Nepal span a 2000 m a.s.l. elevation transect from ∼3000 to 5000 m a.s.l. Our rBC-concentrations from fresh snow surface samples at lower elevations, <4000 m a.s.l. of the Khumbu Valley, where previous data does not exist, were slightly higher (6.2–17.3 μg-rBC/L-H2O) than previous fresh snow surface samples (average 5 μg-rBC/L-H2O) from Jacobi et al. (2015) at the Nepal Climate Observatory, which is also at a higher elevation of 5079 m a.s.l. However, as mentioned in section “rBC and Snow Chemistry Concentrations,” it is difficult to provide a robust comparison between our data and previously published results given the many confounding variables and underlying factors that could lead to differences in the rBC concentrations. For example, annual and seasonal variation, the age and physical properties of the snow sampled in all studies, the uncertainty of the measurement method and the fact that the samples in both Kaspari et al. (2014) and Jacobi et al. (2015) were thawed well before analysis. There is a paucity of data in the region and a strong need for more ground observations to provide eventual model validation. Our results, from samples that span across lower elevations than previous studies, are also the first published data set of rBC from the Himalayas that remained frozen until just prior to analysis.
Based on the NAAPS global aerosol modeling results, anthropogenic and biogenic fine particles appear to be the largest source of BC in the atmosphere at the time of snow sampling. Additionally, we document a modal shift in size distributions of rBC in aged snow vs. fresh snow, which has not been shown in previous rBC snow studies. However, the remote sensing and modeling approaches used are too coarse to provide direct-detailed comparison of albedo and BC atmospheric sources at individual sampling sites. Additionally, cloud cover in monsoon affected regions makes remote sensing analysis challenging. Furthermore, at lower elevation where the snow is ephemeral, lasting only a few days, the snow pack is not optically thick and is likely more influenced by the albedo of the underlying ground than the impurity concentrations themselves.
Melt from snow on land has been found to be the dominant source of meltwater contributions above 2000 m a.s.l. in the Ganges basin, rather than glacier ice. The total snow melt contribution at lower elevations is the sum of melt at that elevation and all elevations above. As a result, the chemistry of the snow on land will also have more influence on drinking water quality than the chemistry of glacier ice. Earlier melt could also have a cascading impact on ecology, water management and agriculture due to changes in groundwater storage and runoff. Due to the higher rBC concentrations at lower elevations, BC has a greater potential to influence melt dynamics of the snow on land at lower elevation. In the future, changes to LAI and BC deposition may impact meltwater dynamics as well as downstream chemistry and water quality.
Data Availability Statement
All datasets generated for this study are included in the article/Supplementary Material.
Author Contributions
AK conceived of study, conducted field sampling, analytical sample processing, data analysis, and manuscript writing. KR conducted the MODIS remote sensing processing and contributed to Figures 3, 5. PX conducted the NAAPS modeling and contributed to Figure 4. JK provided rBC analytical support and data processing. RA secured funding and provided advising. RK provided local knowledge and support. JD assisted with field sampling and Figure 1 development. DM provided advising. All authors contributed to drafting, writing, and editing the manuscript.
Funding
Funding for this work for AK, KR, and RA came from the US Agency for International Development, Contributions to High Asian Run-off from Ice and Snow project. Additional support for AK came from the National Science Foundation, Award number (NSF Award: DGE-1144083), the University of Colorado Department of Civil Environmental and Architectural Engineering Dissertation Completion Grant, and the CU-Boulder Mortenson Center for Engineering in Developing Communities. Additional support for KR came from the 2016 NASA HiMAT and 2017 NASA GEO Award 80NSSC18K0427. PX is supported by the Office of Naval Research Code 322.
Conflict of Interest
JD was employed by company Dana Consulting, LLC.
The remaining authors declare that the research was conducted in the absence of any commercial or financial relationships that could be construed as a potential conflict of interest.
Supplementary Material
The Supplementary Material for this article can be found online at: https://www.frontiersin.org/articles/10.3389/feart.2020.00371/full#supplementary-material
References
Armstrong, R. L., Rittger, K., Brodzik, M. J., Racoviteanu, A., Barrett, A. P., Khalsa, S.-J., et al. (2018). Runoff from glacier ice and seasonal snow in High Asia: separating melt water sources in river flow. Reg. Environ. Change 19, 1249–1261. doi: 10.1007/s10113-018-1429-0
Bond, T. C., Doherty, S. J., Fahey, D. W., Forster, P. M., Berntsen, T., Deangelo, B. J., et al. (2013). Bounding the role of black carbon in the climate system: a scientific assessment. J. Geophys. Res. Atmos. 118, 5380–5552. doi: 10.1002/jgrd.50171
Davidson, C. I., Grimm, T. C., and Nasta, M. A. (1981). Airborne lead and other elements derived from local fires in the Himalayas. Science 214, 1344–1346. doi: 10.1126/science.214.4527.1344
Dozier, J., Painter, T. H., Rittger, K., and Frew, J. E. (2008). Time-space continuity of daily maps of fractional snow cover and albedo from MODIS. Adv. Water Resourc. 31, 1515–1526. doi: 10.1016/j.advwatres.2008.08.011
Fullerton, D. G., Bruce, N., and Gordon, S. B. (2008). Indoor air pollution from biomass fuel smoke is a major health concern in the developing world. Trans. R. Soc. Trop. Med. Hyg. 102, 843–851. doi: 10.1016/j.trstmh.2008.05.028
Ginot, P., Dumont, M., Lim, S., Patris, N., Taupin, J. D., Wagnon, P., et al. (2014). A 10 year record of black carbon and dust from a Mera Peak ice core (Nepal): variability and potential impact on melting of Himalayan glaciers. Cryosphere 8, 1479–1496. doi: 10.5194/tc-8-1479-2014
Gustaffsson, O., Krusa, M., Zencak, Z., Sheesley, R. J., Granat, L., Engstrom, E., et al. (2009). Brown Clouds over South Asia : biomass or fossil fuel combustion? Science 84, 495–499. doi: 10.1126/science.1164857
Hall, D. K., Riggs, G. A., Salomonson, V. V., DiGirolamo, N. E., and Bayr, K. J. (2002). MODIS snow-cover products. Remote Sens. Environ. 83, 181–194. doi: 10.1016/S0034-4257(02)00095-0
Jacobi, H.-W., Lim, S., Ménégoz, M., Ginot, P., Laj, P., Bonasoni, P., et al. (2015). Black carbon in snow in the upper Himalayan Khumbu Valley, Nepal: observations and modeling of the impact on snow albedo, melting, and radiative forcing. Cryosphere 9, 5035–5076. doi: 10.5194/tc-9-1685-2015
Jayarathne, T., Stockwell, C. E., Bhave, P. V., Praveen, P. S., Rathnayake, C. M., Islam, Md. R., et al. (2016). Nepal ambient monitoring and source testing experiment (NAMaSTE): emissions of trace gases and light-absorbing carbon from wood and dung cooking fires, garbage and crop residue burning, brick kilns, and other sources. Atmos. Chem. Phys. 16, 11043–11081. doi: 10.5194/acp-18-2259-2018
Kanaan, N. C., Pomeranz, D., and Shaheen, M. (2016). Dung lung: reactive airway disease syndrome from yak-dung biomass fuel smoke. Emerg. Med. 48, 547–550. doi: 10.12788/emed.2016.0075
Kaspari, S., Painter, T. H., Gysel, M., and Schwikowski, M. (2014). Seasonal and elevational variations of black carbon and dust in snow and ice in the Solu-Khumbu, Nepal and estimated radiative forcings. Atmos. Chem. Phys. 13, 33491–33521. doi: 10.5194/acp-14-8089-2014
Kaspari, S. D., Schwikowski, M., Gysel, M., Flanner, M. G., Kang, S., Hou, S., et al. (2011). Recent increase in black carbon concentrations from a Mt. Everest ice core spanning 1860-2000 AD. Geophys. Res. Lett. 38:L04703. doi: 10.1029/2010GL046096
Katich, J. M., Perring, A. E., and Schwarz, J. P. (2017). Optimized detection of particulates from liquid samples in the aerosol phase: focus on black carbon. Aerosol Sci. Technol. 51, 543–553. doi: 10.1080/02786826.2017.1280597
Khan, A. L., Dierssen, H., Schwarz, J. P., Schmitt, C., Chlus, A., Hermanson, M., et al. (2017a). Impacts of coal dust from an active mine on the spectral reflectance of Arctic surface snow in Svalbard, Norway. J. Geophys. Res. Atmos. 122, 1767–1778. doi: 10.1002/2016JD025757
Khan, A. L., Wagner, S., Jaffe, R., Xian, P., Williams, M., Armstrong, R., et al. (2017b). Dissolved black carbon in the global cryosphere: concentrations and chemical signatures. Geophys. Res. Lett. 44, 6226–6234. doi: 10.1002/2017GL073485
Khan, A. L., Klein, A. G., Katich, J. M., and Xian, P. (2019). Local emissions and regional wildfires influence refractory black carbon observations near palmer station, Antarctica. Front. Earth Sci. 7:49. doi: 10.3389/feart.2019.00049
Kondo, Y., Sahu, L., Moteki, N., Khan, F., Takegawa, N., Liu, X., et al. (2011). Consistency and traceability of black carbon measurements made by laser-induced incandescence, thermal-optical transmittance, and filter-based photo-absorption techniques. Aerosol Sci. Technol. 45, 295–312. doi: 10.1080/02786826.2010.533215
Li, C., Bosch, C., Kang, S., Andersson, A., Chen, P., Zhang, Q., et al. (2016). Sources of black carbon to the Himalayan – Tibetan Plateau glaciers. Nat. Commun. 7:12574. doi: 10.1038/ncomms12574
Lim, S., Faïn, X., Zanatta, M., Cozic, J., Jaffrezo, J.-L., Ginot, P., et al. (2014). Refractory black carbon mass concentrations in snow and ice: method evaluation and inter-comparison with elemental carbon measurement. Atmos. Meas. Tech. 7, 3307–3324. doi: 10.5194/amt-7-3307-2014
Lynch, P., Reid, J. S., Westphal, D. L., Zhang, J., Hogan, T. F., Hyer, E. J., et al. (2016). An 11-year global gridded aerosol optical thickness reanalysis (v1. 0) for atmospheric and climate sciences. Geoscient. Model Dev. 9, 1489–1522. doi: 10.5194/gmd-9-1489-2016
Marinoni, A., Cristofanelli, P., Laj, P., Duchi, R., Putero, D., Calzolari, F., et al. (2013). High black carbon and ozone concentrations during pollution transport in the Himalayas: five years of continuous observations at NCO-P global GAW station. J. Environ. Sci. 25, 1618–1625. doi: 10.1016/S1001-0742(12)60242-3
Markowicz, K. M., Lisok, L., and Xian, P. (2017). Simulations of the effect of intensive biomass burning in July 2015 on Arctic radiative forcing. Atmos. Environ. 171, 248–260. doi: 10.1016/j.atmosenv.2017.10.015
Matin, M. A., Chitale, V. S., Murthy, M. S. R., Uddin, K., Bajracharya, B., and Pradhan, S. (2017). Understanding forest fire patterns and risk in Nepal using remote sensing, geographic information system and historical fire data. Int. J. Wildl. Fire 26, 276–286. doi: 10.1071/wf16056
Mimeau, L., Esteves, M., Zin, I., Jacobi, H. W., Brun, F., Wagnon, P., et al. (2019). Quantification of different flow components in a high-altitude glacierized catchment (Dudh Koshi, Himalaya): some cryospheric-related issues. Hydrol. Earth Syst. Sci. 23, 3969–3996. doi: 10.5194/hess-23-3969-2019
Mori, T., Moteki, N., Ohata, S., Koike, M., Goto, K., Miyazaki, Y., et al. (2016). Improved technique for measuring the size distribution of black carbon particles in liquid water. Aerosol Sci. Technol. 50, 242–254. doi: 10.1080/02786826.2016.1147644
Painter, T. H., Bryant, A. C., and Skiles, S. M. (2012). Radiative forcing by light absorbing impurities in snow from MODIS surface reflectance data. Geophys. Res. Lett. 39:L17502. doi: 10.1029/2012GL052457
Painter, T. H., Rittger, K., McKenzie, C., Slaughter, P., Davis, R. E., and Dozier, J. (2009). Retrieval of subpixel snow covered area, grain size, and albedo from MODIS. Remote Sens. Environ. 113, 868–879. doi: 10.1016/J.Rse.2009.01.001
Petzold, A., Ogren, J. A., Fiebig, M., Laj, P., Li, S. M., Baltensperger, U., et al. (2013). Recommendations for reporting black carbon measurements. Atmos. Chem. Phys. 13, 8365–8379. doi: 10.5194/acp-13-8365-2013
Prasad, A. K., Singh, S., Chauhan, S. S., Srivastava, M. K., Singh, R. P., and Singh, R. (2007). Aerosol radiative forcing over the Indo-Gangetic plains during major dust storms. Atmos. Environ. 41, 6289–6301. doi: 10.1016/j.atmosenv.2007.03.060
Raj, M. L., Ajay, S. N., Lina, L., Sachchida, N. T., Anu, R., Michael, H. B., et al. (2016). Municipal solid waste and dung cake burning: discoloring the Taj Mahal and human health impacts in Agra. Environ. Res. Lett. 11:104009. doi: 10.1088/1748-9326/11/10/104009
Raleigh, M. S., Rittger, K., Moore, C. E., Henn, B., Lutz, J. A., and Lundquist, J. D. (2013). Ground-based testing of MODIS fractional snow cover in subalpine meadows and forests of the Sierra Nevada. Remote Sens. Environ. 128, 44–57. doi: 10.1016/j.rse.2012.09.016
Reid, J. S., Hyer, E. J., Prins, E. M., Westphal, D. L., Zhang, J., Wang, J., et al. (2009). Global monitoring and forecasting of biomass-burning smoke : description of and lessons from the fire locating and modeling of burning emissions (FLAMBE) program. IIEE J. Select. Top. Appl. Earth Observ. Remote Sens. 2, 144–162. doi: 10.1109/jstars.2009.2027443
Reid, J. S., Xian, P., Hyer, E. J., Flatau, M. K., Ramirez, E. M., Turk, F. J., et al. (2012). Multi-scale meteorological conceptual analysis of observed active fire hotspot activity and smoke optical depth in the Maritime Continent. Atmos. Chem. Phys. 12, 2117–2147. doi: 10.5194/acp-12-2117-201
Rittger, K., Painter, T. H., and Dozier, J. (2013). Assessment of methods for mapping snow cover from MODIS. Adv. Water Resour. 51, 367–380. doi: 10.1016/j.advwatres.2012.03.002
Rittger, K., Raleigh, M. S., Dozier, J., Hill, A., Lutz, J. A., and Painter, T. H. (2019). Canopy adjustment and improved cloud detection for remotely sensed snow cover mapping. Water Resour. Res. 56:e2019WR024914. doi: 10.1029/2019WR024914
Ross, A. D., Holz, R. E., Quinn, G., Reid, J. S., Xian, P., Turk, F. J., et al. (2018). Exploring the first aerosol indirect effect over Southeast Asia using a 10-year collocated MODIS, CALIOP, and model dataset. Atmos. Chem. Phys. 18, 12747–12764. doi: 10.5194/acp-18-12747-2018
Schwarz, J. P., Gao, R. S., Perring, A. E., Spackman, J. R., and Fahey, D. W. (2013). Black carbon aerosol size in snow. Sci. Rep. 3:1356. doi: 10.1038/srep01356
Slowik, J. G., Cross, E. S., Han, J.-H., Davidovits, P., Onasch, T. B., Jayne, J. T., et al. (2007). An inter-comparison of instruments measuring black carbon content of soot particles. Aerosol Sci. Technol. 41, 295–314. doi: 10.1080/02786820701197078
Wendl, I. A., Menking, J. A., Färber, R., Gysel, M., Kaspari, S. D., Laborde, M. J. G., et al. (2014). Optimized method for black carbon analysis in ice and snow using the single particle soot photometer. Atmos. Meas. Tech. 7, 2667–2681. doi: 10.5194/amt-7-2667-2014
Xian, P., Reid, J. S., Atwood, S. A., Johnson, R. S., Hyer, E. J., Westphal, D. L., et al. (2013). Smoke aerosol transport patterns over the Maritime Continent. Atmos. Res. 122, 469–485. doi: 10.1016/j.atmosres.2012.05.006
Xiao, Q., Saikawa, E., Yokelson, R. J., Chen, P., Li, C., and Kang, S. (2015). Indoor air pollution from burning yak dung as a household fuel in Tibet. Atmos. Environ. 102, 406–412. doi: 10.1016/j.atmosenv.2014.11.060
Xu, B., Cao, J., Hansen, J., Yao, T., Joswia, D. R., Wang, N., et al. (2009). Black soot and the survival of Tibetan glaciers. Proc. Natl. Acad. Sci. U.S.A. 106, 22114–22118. doi: 10.1073/pnas.0910444106
Keywords: black carbon, snow, yak-dung, burning, Nepal
Citation: Khan AL, Rittger K, Xian P, Katich JM, Armstrong RL, Kayastha RB, Dana JL and McKnight DM (2020) Biofuel Burning Influences Refractory Black Carbon Concentrations in Seasonal Snow at Lower Elevations of the Dudh Koshi River Basin of Nepal. Front. Earth Sci. 8:371. doi: 10.3389/feart.2020.00371
Received: 04 June 2019; Accepted: 10 August 2020;
Published: 16 September 2020.
Edited by:
Anthony Arendt, University of Washington, United StatesReviewed by:
Jonas Svensson, Finnish Meteorological Institute, FinlandRyan Landon Crumley, Oregon State University, United States
Copyright © 2020 Khan, Rittger, Xian, Katich, Armstrong, Kayastha, Dana and McKnight. This is an open-access article distributed under the terms of the Creative Commons Attribution License (CC BY). The use, distribution or reproduction in other forums is permitted, provided the original author(s) and the copyright owner(s) are credited and that the original publication in this journal is cited, in accordance with accepted academic practice. No use, distribution or reproduction is permitted which does not comply with these terms.
*Correspondence: Alia L. Khan, YWxpYS5raGFuQHd3dS5lZHU=; YWxpYS5raGFuQGNvbG9yYWRvLmVkdQ==