 Elaine T. Spiller1*
 Robert L. Wolpert2
 Sarah E. Ogburn3
 Eliza S. Calder4
 James O. Berger2
 Abani K. Patra5
 E. Bruce Pitman6
- 1Department of Mathematical and Statistical Sciences, Marquette University, Milwaukee, WI, United States
- 2Department of Statistical Science, Duke University, Durham, NC, United States
- 3United States Geological Survey (USGS)/United States Agency for International Development (USAID) Volcano Disaster Assistance Program, Cascades Volcano Observatory, Vancouver, WA, United States
- 4School of Geosciences, University of Edinburgh, Edinburgh, United Kingdom
- 5Departments of Mathematics and Computer Science, and Director, Data Intensive Studies Center (DISC), Tufts University, Medford, MA, United States
- 6Department of Materials Design and Innovation, University at Buffalo, Buffalo, NY, United States
Effective volcanic hazard management in regions where populations live in close proximity to persistent volcanic activity involves understanding the dynamic nature of hazards, and associated risk. Emphasis until now has been placed on identification and forecasting of the escalation phase of activity, in order to provide adequate warning of what might be to come. However, understanding eruption hiatus and post-eruption unrest hazards, or how to quantify residual hazard after the end of an eruption, is also important and often key to timely post-eruption recovery. Unfortunately, in many cases when the level of activity lessens, the hazards, although reduced, do not necessarily cease altogether. This is due to both the imprecise nature of determination of the “end” of an eruptive phase as well as to the possibility that post-eruption hazardous processes may continue to occur. An example of the latter is continued dome collapse hazard from lava domes which have ceased to grow, or sector collapse of parts of volcanic edifices, including lava dome complexes. We present a new probabilistic model for forecasting pyroclastic density currents (PDCs) from lava dome collapse that takes into account the heavy-tailed distribution of the lengths of eruptive phases, the periods of quiescence, and the forecast window of interest. In the hazard analysis, we also consider probabilistic scenario models describing the flow’s volume and initial direction. Further, with the use of statistical emulators, we combine these models with physics-based simulations of PDCs at Soufrière Hills Volcano to produce a series of probabilistic hazard maps for flow inundation over 5, 10, and 20 year periods. The development and application of this assessment approach is the first of its kind for the quantification of periods of diminished volcanic activity. As such, it offers evidence-based guidance for dome collapse hazards that can be used to inform decision-making around provisions of access and reoccupation in areas around volcanoes that are becoming less active over time.
Introduction and Motivation
The ability for communities around volcanoes to recover from volcanic unrest hinge on well-judged and timely decisions about land use, as well as access to some areas around volcanoes for reasons of work, attending personal property, and/or potential reoccupation. However, identifying and defining, as such, “the end” of an eruption is notoriously difficult (Siebert et al., 2011; Ogburn et al., 2015). Furthermore, hazard assessments that account for diminishing activity, cessation in eruptive activity and/or the establishment of new post-eruption background activity levels are hard to develop given that the processes involved are poorly understood, and are necessarily characterized by high uncertainties. To our knowledge no such hazard assessments have been carried out for any eruptions so far.
This work is motivated by the need for reassessing the hazards from the Soufrière Hills Volcano (SHV), Montserrat, given the now extended state of quiescence of the volcano since 2010.
Recent Eruptive History at Soufrière Hills Volcano
The eruption has been characterized throughout by alternating periods of active lava dome extrusion (months–years), punctuated by sequences of Vulcanian explosions (up to VEI 3) (Wadge et al., 2014b). The last phase of dome growth ended on February 11, 2010 after an explosion removed about 20% of the
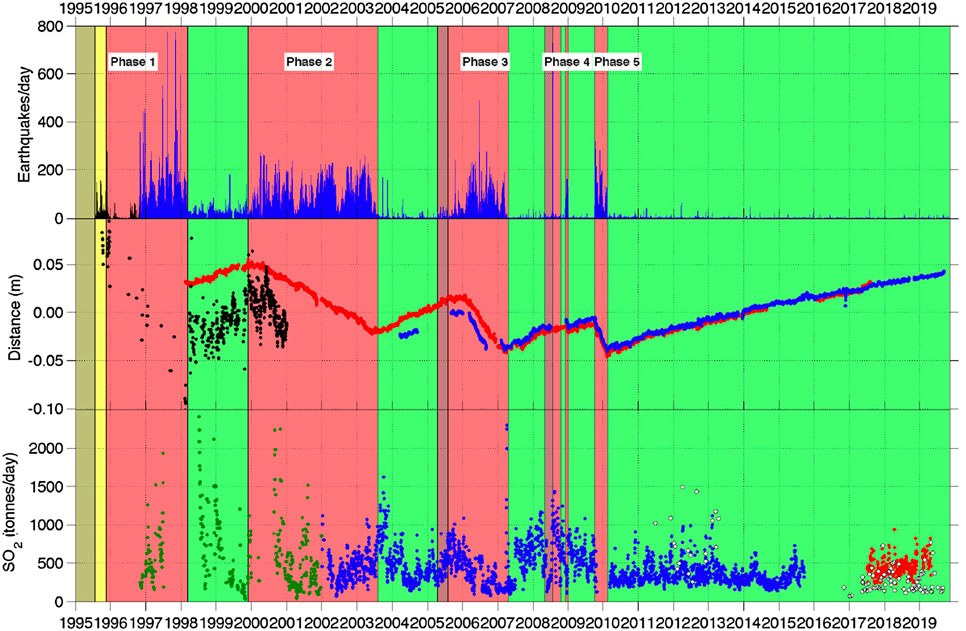
FIGURE 1. Seismic, Global Positioning System (GPS), and SO2 monitoring data for the period January 1, 1995–November 7, 2019. Extrusive phases and pauses are in shown red and green, respectively. Top: Number of seismic events detected by the seismic system. Middle: Radial ground displacement of continuous GPS (cGPS) stations MVO1 (red) and GERD (blue) smoothed with 7-days running mean filter, Black: GPS Height of HARR. Bottom: Measured daily SO2 flux, filtered with 7-days running median filter. Green: Correlation Spectrometer (COSPEC), Blue: Differential Optical Absorption Spectroscopy (DOAS), White: Traverse data, Red: new DOAS network (Adapted from MVO activity report; MVO OFR 18-02-draft).
In this work we try to address the issue of hazard assessment, specifically tuned for the current situation within this long hiatus period or potentially (still to be shown) post-eruption scenario. We focus specifically on hazards associated with lava dome collapse as these are recognized to be a key high-impact hazard that could still occur with little or no warning. We recognize that in the case of a re-start of eruptive activity, other precursory activity might be the first to manifest—such as ash venting or explosive activity. This work does not address the question of forecasting which events are most likely to occur, either during a continued hiatus period or after a re-start. Instead we address the question of how likely are dome collapse hazards to occur and, if so, where and when.
The broader rationale for this hazard assessment is provided by the following risk management questions which are currently being considered on island: To what extent is it safe to work in, visit, or re-inhabit the flanks of the Soufrière Hills Volcano and surrounding area in the south of Montserrat? And, in balancing the long term continued exposure (albeit now to very low levels of activity) with short-term development gains; for example, by supporting the extractive (sand mining) and tourist industries which might be key to the island’s economic recovery: To what extent are re-investments in this area possible and prudent? Ultimately these questions are for civil protection authorities, the Government of Montserrat, and the Montserrat Volcano Observatory to consider but they also weigh on the Scientific Advisory Committee (SAC) of the UK Government’s Foreign and Commonwealth Office Montserrat. It is under that auspice that this work is undertaken.
It is noted that the conditions and mechanisms for PDC generation are different now from those during the main eruptive period. During periods of active lava dome extrusion, the first-order control on PDC generation is by lava dome extrusion and associated dome instability and collapse (Calder et al., 2002). In the absence of dome growth during pauses, a long hiatus (such as the current one), or post-eruption unrest, other collapse mechanisms can come into play. Lava domes can collapse years, decades, or millennia after volcanic activity is over, triggered by bouts of intense rainfall, new seismic activity, and/or weakening by hydrothermal activity and structural instabilities (Ball et al., 2013; Harnett et al., 2019). Post-eruption collapses of lava domes, or more extensive parts of volcanic edifices are known as sector collapses and they generate debris avalanches. There is substantial evidence across the Lesser Antilles volcanic arc (e.g., Boudon et al., 2007; Sampler et al., 2008) and elsewhere, for the generation of modest to extensive debris avalanches sourced from collapses of lava dome complexes. At the volcano-scale these can be considered “extreme events,” and as such, for any given volcano, there is little data to constrain the frequency of occurrence and anticipated time-scale post-eruption until one of these post-eruption events might occur. One can consider the different types of collapse events on a spectrum where debris avalanches represent the larger volume, lower recurrence rate collapses, and where typical dome-collapse PDCs during eruptions are the smaller volume, higher frequency events. Our consideration of “collapses” in this work, implicitly considers this spectrum of plausible scenarios.
We use the catalog of previous collapse events at SHV, and how that has changed over time, to inform our analysis. Over the course of the SHV eruption more than 900 PDCs with runout over 1 km were produced. Most PDCs were the result of dome collapse events, but column-collapse PDCs were also common. Dome-collapse PDCs show a first-order correlation with periods of dome growth as seen in Figure 2, and there is a known association between high dome-extrusion rates and frequent dome-collapses (Calder et al., 2002; Wadge et al., 2010). Calder et al. (2002) also noted that many larger-volume collapses were associated with periods of elevated dome extrusion, intense seismicity, and/or deformation cycles. Lava extrusion mechanically destabilizes growing domes by increasing internal shear stress, increasing loading on support structures, and by over-steepening dome structures (Calder et al., 2002; Pallister et al., 2013). High extrusion rates are also frequently associated with gas pressurization (Voight and Elsworth, 2000) and explosive activity that can cause dome-collapse events or produce column-collapse PDCs. The dominant mechanisms controlling the size and frequency of dome-collapse PDCs during dome growth thus include the volume of the dome, the extrusion rate, and associated explosive activity that can cause large, violent dome-collapse events. The collapses from this period are dominantly gravitationally induced dome collapse events, but a number of other causes contribute (Calder et al., 2002). The slope of the cumulative count of PDCs in Figure 2 episodically steepens and shallows, reflecting intervals of higher and lower rates of PDC production associated with dome growth phases. Wolpert (2018) estimate the annual rate to range between a high level of roughly 260 events/year and a low level of about 30 events/year, based on evidence from the period 1995–2012. Including the quiescent period from 2013 to 2020 (in which no PDCs were recorded) reduces the estimated low-frequency PDC expected annual rate to roughly 17 event/year. Even this reduced rate, however, is inconsistent with the current behavior—the probability of a PDC gap of seven or more years is almost zero for a Poisson model with rate as high as 17/year. This indicates that a different model is required to explain the current hiatus in PDC activity. That is, with respect to dome collapse events, the activity levels during this extended pause is significantly quieter than that during the previous pauses. A Poisson model will still fit the data well, but the annual rate must be much lower (below 0.20/year or so) for a seven year PDC gap to be plausible. We now take this into account in our forward modeling for future collapse hazards.
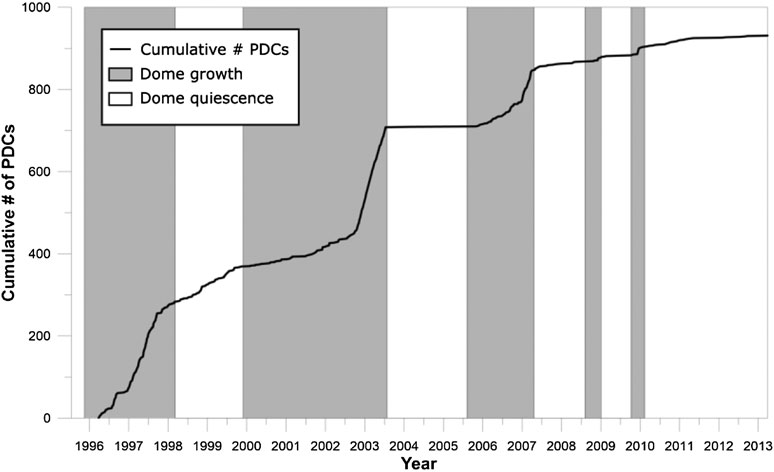
FIGURE 2. Cumulative number of recorded, dome-collapse PDCs, beginning July 18, 1995 and ending with the last recorded PDC on March 28, 2013. Data are from FlowDat (Ogburn and Calder, 2012; Ogburn and Calder, 2017).
The work developed here presents a defensible, evidence-based approach to PDC forecasting, in a post-eruption context, which accounts for attendant uncertainties and assesses specifically the threat posed by inundation of infrequent post-eruption-unrest flows that could affect southern Montserrat. To do so, we develop a new statistical model for forecasting the probability of post-eruption-unrest flows occurring over the next s years, for a range of possible forecast periods. The model is based on considering a very low-frequency background level of activity that is balanced with the chance that activity has already completely ceased or will cease at some point in the future (Wolpert et al., 2016). More precisely, PDC events are modeled using a homogeneous Poisson process with constant expected rate λ events per year up to an uncertain time T at which the eruption ends. The absence of observed PDC events prior to the present time t suggests that either the eruption has already ended, i.e., that
Post-Eruptive Pyroclastic Density Currents and Debris Avalanches
Currently, neither lava dome growth nor explosive activity has occurred at SHV since February 11, 2010, and no PDCs have been produced since 2013. However, the large lava dome remaining at the summit means that dome-collapse PDCs can still be generated. While frequency-volume statistics exist for dome-collapse PDCs during eruptions, only very sparse information exists for PDC-generating collapses of inactive lava domes (e.g., Ball et al., 2015; Harnett et al., 2019). However, collapses during low to no eruptive activity do occur, both from the collapse of still hot lava domes to produce PDCs and from collapse of unstable, older domes and volcanic flanks to produce colder debris avalanches and rockfalls.
Statistical analysis of rockfall activity at SHV led Calder et al. (2002) to suggest that, during periods of low dome extrusion or pauses in dome growth, external forces, such as extreme rainfall, seismic activity, and talus apron erosion more strongly control failure of lava domes. For example, following heavy rainfall, the July 3, 1998 dome collapse removed 20% of a
Dome growth also contributes to the instability of adjacent hydrothermally altered volcanic edifices, which may remain unstable and prone to failure in the form of debris avalanches for decades after dome growth has ceased. Hydrothermal alteration and partial flank and talus collapse triggered the December 26, 1997 debris avalanche at SHV. Though this collapse did occur during active dome-growth, evidence suggests (Ball et al., 2013; Ball et al., 2015; Harnett et al., 2019) that dome and flank collapses caused by instability due to hydrothermal alteration pose a significant, and difficult to anticipate hazard. For example, debris avalanches of lava domes have occurred at La Soufrière, Guadeloupe (Salaün et al., 2011); Cerro Chascon-Runtu Jarita Complex, Bolivia (Watts et al., 1999); and Las Derrumbadas Dome Complex, Mexico (Capra et al., 2002).
Several mechanisms are known to generate post-eruptive PDCs and/or debris avalanches:
Rainfall-Triggered Collapses of Lava Domes
Especially heavy rainfall occurred before and during the SHV collapse of July 3, 1998 (Norton et al., 2002), and this has been recognized elsewhere as an important collapse-triggering mechanism (Mastin, 1994; Yamasato et al., 1998; Ratdomopurbo and Poupinet, 2000; Voight, 2000; Matthews et al., 2002; Barclay et al., 2006). Although rainfall-triggered collapses may also occur during active growth periods, they are likely to represent a more important forcing mechanism during the months to years following cessation of extrusion. Barclay et al. (2006) examined rainfall and PDC data between 1998 and 2003 and found that, given a rainfall event of more than 20 mm, the probability of producing a multiple dome-collapse PDC episode increased by up to 9.2%. In fact, several of the largest dome-collapses at SHV were associated with extreme rainfall events (Matthews et al., 2002; Barclay et al., 2006).
Sector Collapse Associated With Hydrothermally Altered Systems
Lava domes and lava dome complex volcanoes, with mature hydrothermal systems are frequently associated with sector collapses (Vallance et al., 1995; Capra et al., 2002; Clavero et al., 2004). Lava dome and/or flank failures are often attributed to hydrothermally altered and weakened edifices [e.g., Mount Rainier in the United States (Reid et al., 2001); Casita volcano in Nicaragua (Opfergelt et al., 2006); and Santa María volcano (Ball et al., 2013)].
Two pertinent examples are the 1998 debris flow at Casita in Nicaragua (Sheridan et al., 1998; Voight et al., 2002; Opfergelt et al., 2006) and the 1997 debris avalanche at Soufrière Hills, Montserrat (Sparks et al., 2002; Voight et al., 2002). At Casita, an ∼8 ka dacite lava dome complex, a
Volcanic Island Flank Collapses
Large scale flank collapses are recurring processes in the Lesser Antilles volcanic arc (Deplus et al., 2001; Le Friant et al., 2004; Boudon et al., 2007; Sampler et al., 2008). Horseshoe-shaped structures within Dominica, Saint Lucia and Martinique consistently open toward the Grenada basin. The recurrence rate of flank collapse events in the Lesser Antilles may be linked to tectonic activity, and/or magma production rate, with intervals as high as
Downward Propagation of Cooling Fractures
At Mount St. Helens, this appeared to be the most likely mechanism that caused dome collapse-explosions in 1989–1991 that were associated with rainfall (Mastin, 1994).
Few forecasting models exist for eruption durations (Sparks and Aspinall, 2004; Wolpert et al., 2016); this in part is difficult because the definition of “end” for the catologue of long-duration eruptions is not very precise. It could refer to the end of any activity, such as dome collapse PDCs or post-eruption debris avalanches [which we can broadly consider as a spectrum from small to large mass flow events which can defensibly be modeled by flow simulators like TITAN2D (Patra et al., 2005)]. Likewise, as we define level of activity we do not distinguish among different types of collapse events, but merely focus on their average frequency or recurrence rate. As we will see, precise knowledge of the activity rate is not needed, as for any forecast window we can find the most conservative frequency (i.e., the one leading to the highest forecast probability) to find an upper bound on the probability of a collapse event whatever the actual frequency might be.
Methodology
Probabilistic hazard forecasting and analysis as we present here hinge on probabilistic modeling of aleatory scenarios, and combining those scenario models with physical models. A road block for that combination is the computational burden of exercising physical models for Monte Carlo calculations. As such, we advocate utilizing statistical emulators of computationally expensive simulators to overcome that burden, an approach that we have developed since 2009. In the section titled Forecasting and Planning With Dynamic Probabilistic Hazard Maps, we present a summary of our previously published statistical emulator methodology for efficient hazard calculations and walk through the process we advocate for creating probabilistic hazard maps. [Detailed descriptions of emulator-based probabilistic hazard methodology are available in Spiller et al. (2014) and Bayarri et al. (2015)]. In the section titled Forecasting With a Chance of Ending, we expand upon the previous approaches for the specific application to the current activity level, a protracted hiatus in eruptive activity, or a potentially post-eruption scenario. To do so, we present a new probabilistic model that balances a low-level of potential volcanic activity with the possibility that the eruptive phase has actually ended. In the section titled Quantifying Uncertainty in Hazard Forecasts, we describe how to quantify epistemic uncertainties associated with probabilistic (aleatoric) scenario descriptions.
As before (Spiller et al., 2014; Bayarri et al., 2015), we explore potential inundation footprints by future PDCs as modeled by TITAN2D. The TITAN2D computational environment simulates large, dry mass flows over terrain. TITAN2D solves depth-averaged mass and momentum conservation equations (Patra et al., 2005). A digital elevation model (DEM) provides a local coordinate system, yielding normal, down-slope, and cross-slope directions. A fixed mass of material is released with sampled dissipation parameters (internal and basal friction angles). Simulations were performed on a 1 m 2010 LiDAR-based digital elevation model with a vertical resolution of 15 cm m−2 (Cole et al., 2010; Scientific Advisory Committee of the Montserrat Volcano Observatory, 2011) obtained from the MVO. The original DEM was smoothed to 10 m grid spacing to eliminate spurious features at high spatial frequency which can degrade the flow simulations.
Forecasting with a Chance of Ending
Sparks and Aspinall (2004) fit a generalized Pareto probability distribution to data consisting of the recorded durations of a subset of 137 dome-building eruptions taken from the Smithsonian Institution Global Volcanism Program Volcanoes of the World database (Simkin and Siebert, 1994) (note that all the distributions used in this work are described in Appendix 1). In this model the probability that the duration τ of an eruption exceeds any time
for some constants
Wolpert (2018) constructed and fit a dynamic model for volcanic activity in which the activity level λ (measured in expected PDCs per year) and preferred (i.e., most likely) direction could change over time. The best fit activity level function alternated between two values: a high activity of
During the seven-year period from March 2013 through March 2020 there have been no PDC events large enough to be reflected in these models (the threshold was a volume of
Two possibilities remain: that SHV remains active, but at a much lower rate λ (perhaps once in a decade, or once in a century); or that PDC generation from the 1995 eruption has ended. In this work we explore variations on those two possibilities.
Results
Three Possibilities
probability of no PDC occurring over the time frame including t years since the last recorded PDC and s years of forecast can be broken down into three cases:
(1) Eruptive activity may have ceased sometime between the last recorded PDC and time t, and hence we will see no PDCs through the forecast window.
(2) Eruptive activity may cease at some point during the forecast period, and until that time we get “lucky” that no PDC happens to occur.
(3) Eruptive activity may not cease until after the forecast window, and we get “lucky” that no PDC happens to occur during the forecast window.
We explore several cases for different activity levels, λ, and visualize the probability of PDCs occurring (or not) through a series of figures.
The thick solid lines in Figures 3A–C (see Eq. 3 for their derivation) indicate the forecast probability of at least one PDC at SHV in the next s years, as a function of s, for
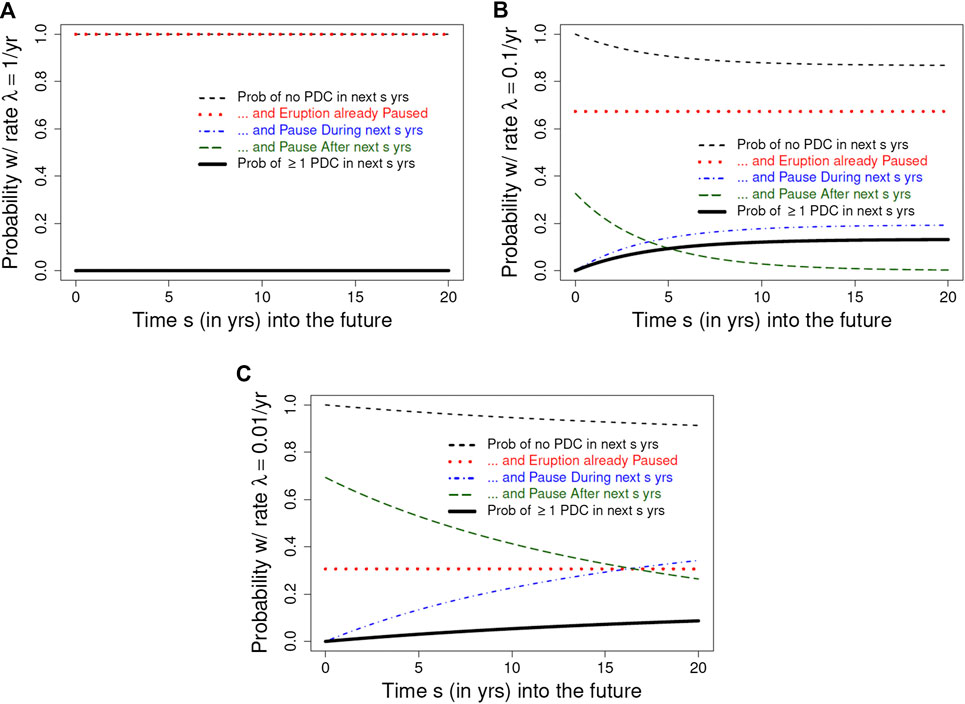
FIGURE 3. Solid black curve shows forecast probability (nearly zero) of at least one PDC in s years, for
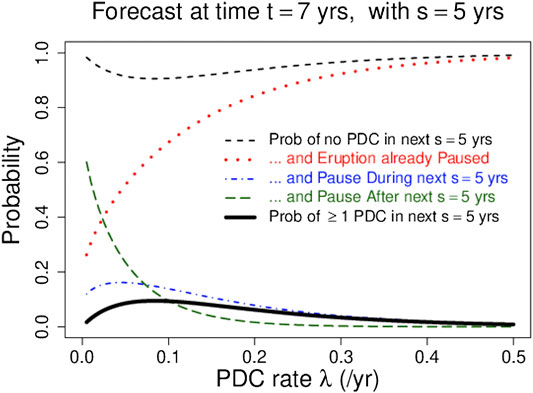
FIGURE 4. Solid black curve shows forecast probability of at least one PDC in
The Model Behind the Plots
Let us begin by measuring time starting at the onset of eruption, and take the recorded event times of PDC events with volume exceeding
(where the notation
with normalizing constant (to ensure that
Here the function
The values of
At any time
where each integrand is the product of the conditional probability of no PDC in s years (given the uncertain value of T) and the conditional pdf for T. The first of these three terms, shown as a red dotted curve in Figures 3A–C, covers the range
As time passes without additional PDCs, the forecast probability that the 1995 SHV eruption has paused or ended will rise, and the forecast probabilities of future events will fall. Figure 5 shows the forecast probability that SHV has paused or ended as a function of the time t since the last PDC, for
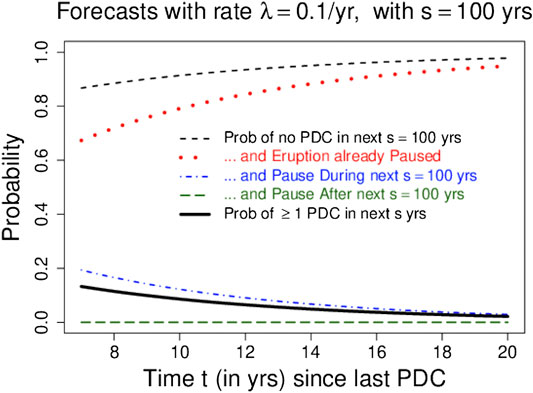
FIGURE 5. Solid black curve shows forecast probability of at least one PDC in
Forecasting and Planning With Dynamic Probabilistic Hazard Maps
Now that we have probabilistic forecasts of future flow events occurring at SHV, one may ask:
If a flow event happens at SHV, what locations might be affected?
It is still useful to think of this question probabilistically, as the flow scenario—flow volume, valleys affected, hot vs. cold flows etc. — are governed by aleatoric uncertainty.
Many locations surrounding SHV have not been inundated by any flows to date, or by just one or two of the several hundred on record since 1995. This does not, however, imply that these locations are immune from inundation by future flows. To study the effect of future flows we will rely on flow simulations [in this work using TITAN2D, see (Patra et al., 2005)] at scenarios consistent with activity at SHV in a probabilistic sense. That is, we can probe scenarios that have some reasonable probability of occurring and exercise TITAN2D at those scenarios to approximate which locations would be inundated by such flows. The approach taken in this work follows (Bayarri et al., 2009; Spiller et al., 2014; Bayarri et al., 2015) and for clarity we summarize important aspects of those contributions in the next subsection.
Probabilities of Pyroclastic Density Current Inundations and Emulator-Based Calculations
Bayarri et al. (2009) explored this question of potential PDC inundation under the assumption that PDC event times follow a stationary Poisson point process [Note, one can consider non-stationary models of event timing in a similar fashion, but for purposes of elucidating our approach, we will follow (Bayarri et al., 2009)]. Let us further consider the case where the aleatory uncertainty in volume and initial angle is described by a probability density function (pdf),
where
From a practical standpoint, evaluating the indicator function is a significant barrier to calculating Eq. 5. Maximum simulated flow height
To overcome this obstacle, Spiller et al. (2014) and Bayarri et al. (2015) built statistical models of the physical model of flowing mass. Specifically they fit Gaussian process (GP) emulators to TITAN2D output at each location
where
Dynamic Probabilistic Pyroclastic Density Current Inundation Forecast Maps
To address the motivating question—of the extent to which the area surrounding the flanks of SHV in southern Montserrat could be impacted by PDC hazards—we now seek not just a probability of a PDC occurring in the next s years, but the probability of a PDC occurring that is big enough, and oriented close enough toward a specific location
We now consider various probabilistic scenarios for flow volume and initial orientation. In Wolpert (2018), motivated by the near-linearity of a log-log plot of the number of observed PDCs of volume exceeding v vs. v, we fit a Pareto probability distribution to PDC volumes at SHV,
where the uncertain “shape” parameter
Note that Eq. 6 depends on the choice of the shape parameter
We create dynamic probabilistic hazard maps by repeating the calculation in Eq. 6 for every location on the map (in the maps presented here, we do this for each point on a
Results
Choice of appropriate forecast timescale should be linked directly to the types of decisions that need to be made. Decisions around short-term access to sites of interest—for example, tourist access or sand mining, both of which have significant economic and livelihood implications—could be based on short-term, annual, forecasts. Such forecasts can be updated to reflect the extending time frame of relative quiescence, and should provide a defensible quantification of background hazard level for visitors. We would recommend this approach over using a longer-term forecast map in this context. Alternatively, for decisions such as investment in infrastructure and longer term development, a time scale consistent with a return on the investment might be more appropriate. In these circumstances it might be more appropriate to use 5 or even 20 years forecast maps.
Figure 6 assumes a uniform probability density function for
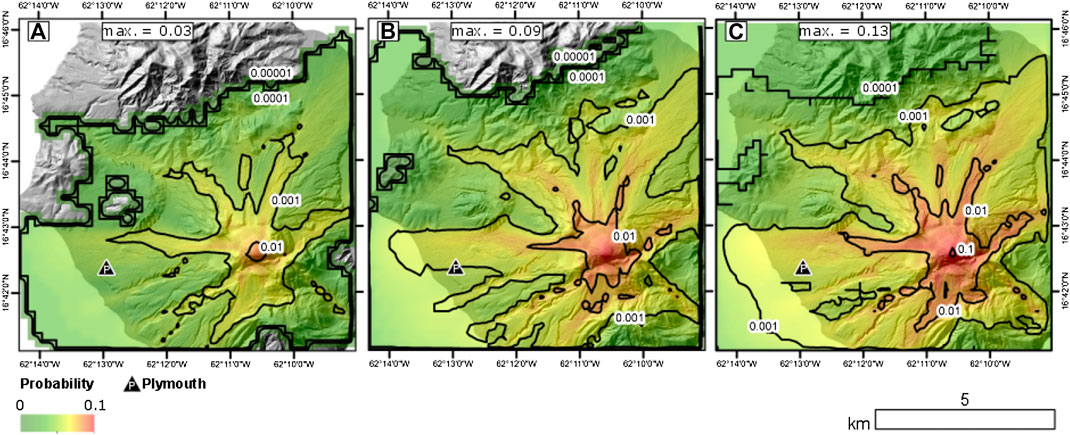
FIGURE 6. Probability of PDC inundation forecasts plotted on a
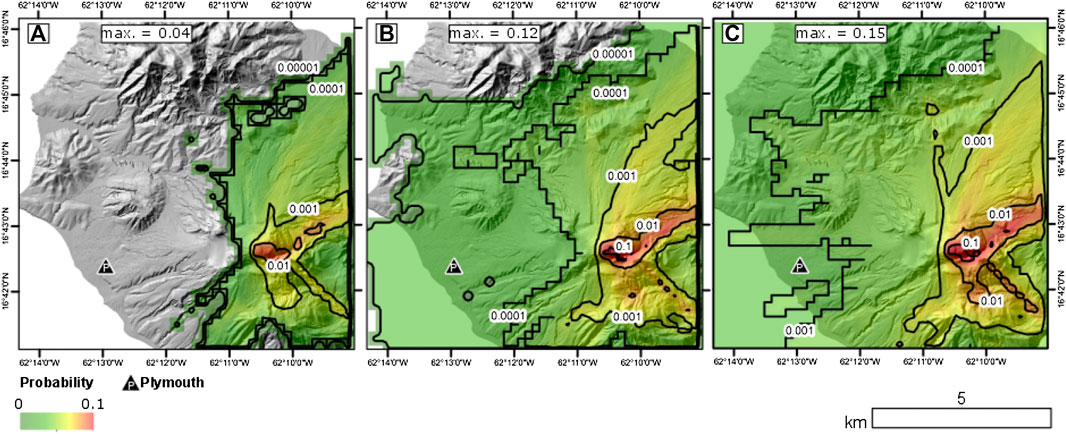
FIGURE 7. Probability of PDC inundation forecasts plotted on a
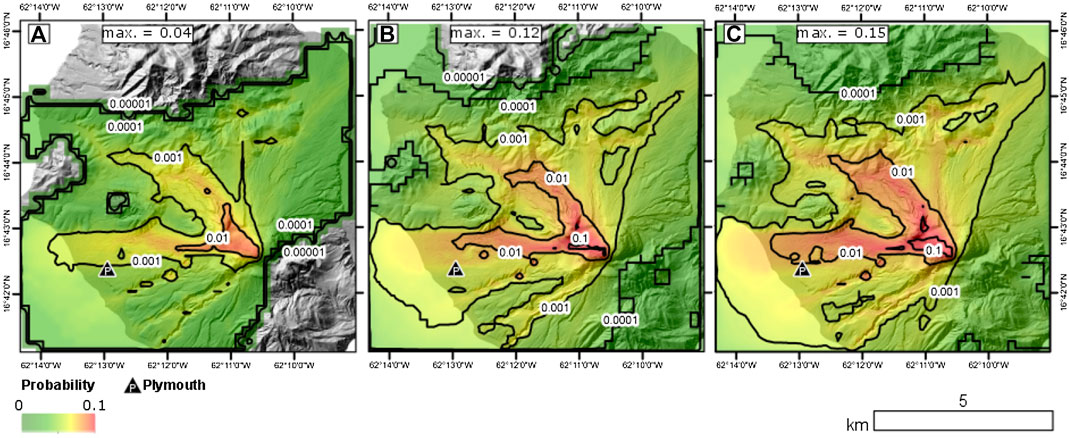
FIGURE 8. Probability of PDC inundation forecasts plotted on a
Quantifying Uncertainty in Hazard Forecasts
Equation 3 presents the probability of no PDC in the next s years starting t years after the eruption onset, for a specific value of the uncertain parameter vector
Results
Here we explore the effects of epistemic uncertainty on both forecasting the probability of a PDC occurring and on the probability of a PDC inundating a particular location. Figure 9A shows a scatter plot of samples from
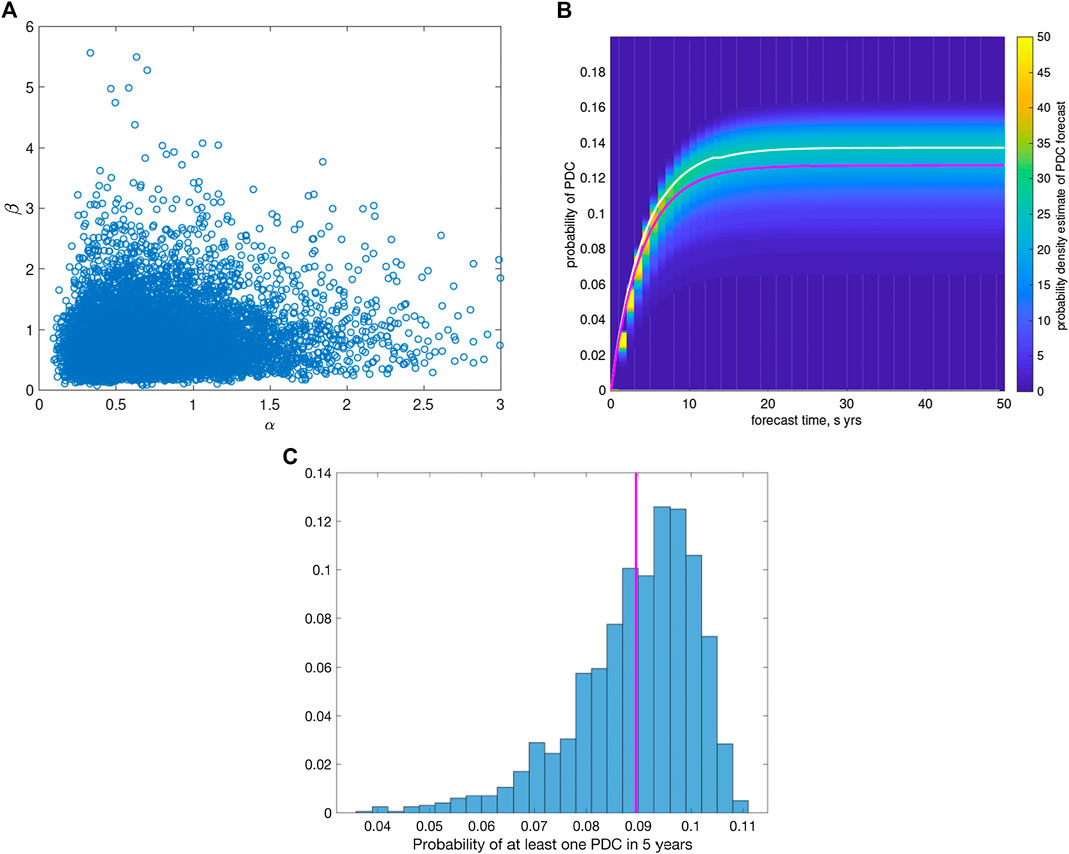
FIGURE 9. Top Left (A): a scatter plot of posterior Monte Carlo samples from
To understand how epistemic uncertainty affects the forecast of inundation probabilities, we will focus on forecasts for the Plymouth area, take
Just as in the flow forecasting case, we calculate the probability of a flow inundating Plymouth by sampling
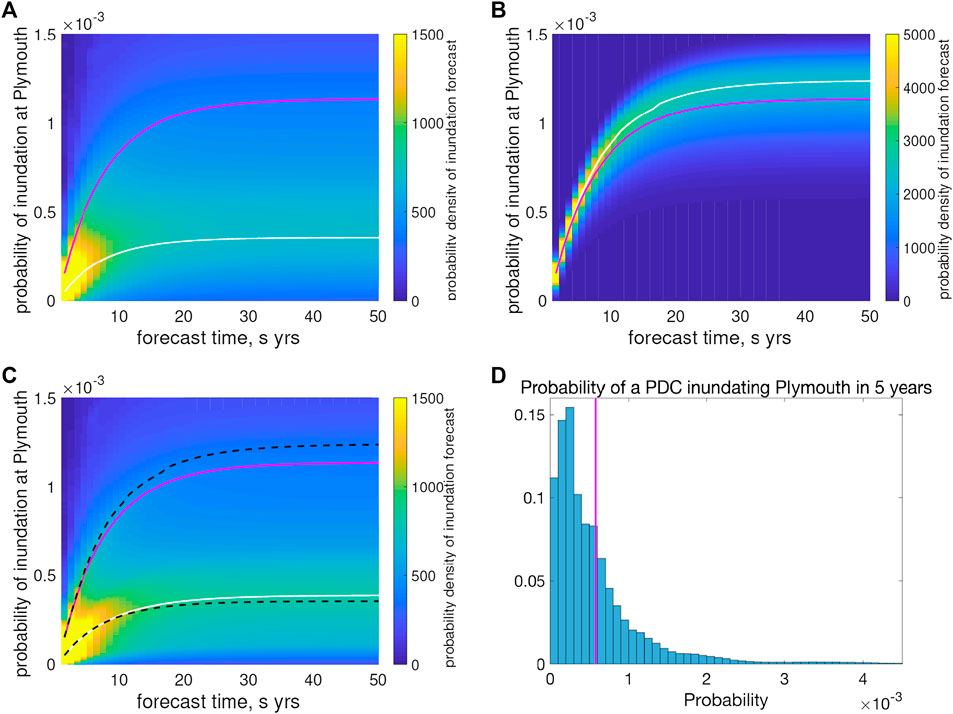
FIGURE 10. Probability density function estimates (in color) of forecast inundation probabilities at Plymouth (left axis) as they evolve in forecast time s (bottom axis). In (A) uncertainty in these estimates reflects only uncertainty in the posterior probability distribution for the flow volume V. In (B) uncertainty in these estimates reflects only uncertainty in the posterior probability distribution for T, the eruption duration. In (C) uncertainty in these estimates reflects uncertainty in both the posterior probability distribution for the eruption duration T and the flow volume V. Evidently the dominant uncertainty is that in V. In all cases, the pink curve represents the mean of the probability density function estimates, and the white curves represent the mode of the mode of the posterior distribution of the inundation forecasts. In Panel (C) the modes from (A) and (B) are plotted as black dashed curves for reference (Note, color scales are truncated for visualization). Panel (D) shows histogram of posterior pdf for probability of inundation of Plymouth within next
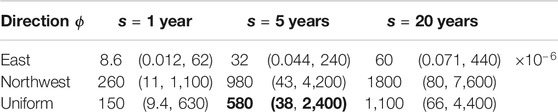
TABLE 1. Numbers in the table (note division by one million on the left) are mean probabilities of inundating Plymouth within s years for flows with initial direction
To explore the effect of epistemic uncertainties in the volume model vs. those in the duration model, we take
Discussion
In this work, we present an evidence-based approach for probabilistic hazard assessment that combines available data on flow events from SHV, statistical modeling, and flow simulations while also accounting for attendant uncertainties. We develop and apply this methodology to assess threats posed by inundation from infrequent, possibly post-eruption unrest flows that could affect the flanks of SHV and parts of southern Montserrat. To do so, we consider a very low-frequency background level of activity that is balanced with the chance that the activity has completely ceased or will cease at some point in the future. Under these assumptions, we can forecast the probability of a post-eruption unrest flow occurring over the next s years, for a range of possible values of s. We then combine this model with simulation-based strategies to glean understanding about how different probabilistic scenarios (e.g., flow volume, initial direction) would impact hazard assessment at specific locations of interest on the flanks of SHV.
This work provides direct information on which relevant stakeholders and/or decision-makers could base practical decisions about managing risk including decisions about livelihoods, and to some extent reoccupation and development around the SHV Montserrat. The context for doing this is that lava domes can remain unstable, or become unstable by various mechanisms during eruptive pauses, or even post eruption. Here we assess collapse hazards related to both rare pyroclastic density currents from an inactive lava dome to debris avalanches from flank or sector collapse. Wisdom gained from other Lesser Antilles lava dome complexes indicate that such events are infrequent but are “highly plausible geological scenarios, whose risks must be taken into account” (Boudon et al., 2007). Our approach provides a means for decision-support by helping to address questions regarding the risk associated with short-term accessibility as well as long-term land-use planning, and infrastructure investments. This method is being used by MVO and SAC to determine the residual level of hazard and associated risk around the volcano and to develop a new micro-zonation hazard map for the island, but it could also be used to address questions of risk around still active volcanoes elsewhere.
Of note, the probabilities of inundation for 1 year forecast windows as determined by this method are also in line with those determined independently through the expert estimates and the expert elicitation process undertaken during SAC meetings (Scientific Advisory Committee of the Montserrat Volcano Observatory, 2011; Scientific Advisory Committee of the Montserrat Volcano Observatory, 2019). Although this cannot be considered a validation as the two assessment methods are so different, it is reassuring that the differing methodologies offer similar forecast probabilities.
In its own right, this new statistical method for forecasting the probability of a post-eruption-unrest flows is a potentially powerful approach that could readily be applied to other volcanoes. This model provides a robust and defensible approach for long term hazard assessment as it treats both the eruption duration and flow frequency as uncertain. The model combines a heavy-tailed duration model introduced in Wolpert et al. (2016), based on an extensive record of dome collapse PDC producing volcanoes worldwide, with a low-level background frequency of activity. Results of the model indicate that the background frequency need not be constrained or inferred by volcano or episode specific data, but instead that a conservative “worst-case” frequency can be found, and that rate only varies with the period of quiescence (t in the model) for the volcano under study and the forecast period s. For the current situation at SHV, the conservative frequency is roughly one PDC event in 10 years.
Further, with the use of statistical emulators, this low-frequency model can readily be folded into a simulation-based probabilistic hazard mapping approach as presented here. With this approach, one can efficiently develop a suite of probabilistic hazard maps under different aleatoric scenario models as there is no need for further time-consuming flow simulations. Additionally, the emulator-based strategy for developing probabilistic hazard maps allows one to explore the effect of epistemic uncertainties. Specifically, at SHV, this has allowed us to compare the uncertain “tail” effects for both the eruption duration and flow volumes, each of which follows a heavy-tailed distribution. To this end, we compared histograms of forecast probabilities whose spread occurs as a result of uncertainty in fitting those probabilistic models.
Although the probabilistic models for flow volume, as well as DEMs, are volcano specific, the general combined statistical-simulation modeling approach is entirely transferable to PDC hazard assessment at other volcanoes worldwide. It is also entirely adaptable for use and application to other geohazards (tephra, tsunamis, etc.).
Conclusion
In summary, we presented a new statistical model for assessing pyroclastic density current (PDC) hazards during conditions of post-eruption-unrest and have combined that with flow simulations to develop a probabilistic hazard assessment and uncertainty quantification for rare, but plausible dome and edifice collapses during periods of quiescence at Soufrière Hills Volcano (SHV), Montserrat. The primary takeaways include:
(1) We introduced a new statistical model for forecasting the probability of post-eruption flow events that is a potentially powerful approach that could readily be applied to other volcanoes.
(2) We combined multiple probabilistic models describing aleatory uncertainty with flow simulations by utilizing statistical emulators. As such, we can rapidly create probabilistic hazard maps for a number of scenarios of interest.
(3) This approach enables efficient uncertainty quantification of both aleatoric and epistemic uncertainties associated with a probabilistic hazard forecast.
(4) We focused on PDC hazard assessment over timescales of 1, 5, and 20 years at SHV. Assuming a uniform distribution of a flow’s initial direction, over 1 year the probability of inundation at Plymouth is
(5) This approach has the potential to be transferable to other locations, other hazards, and different times scales. Of course details—data collection, aleatoric modeling, hazard process simulations, etc.—are specific to the hazard and location, but building a flexible framework for rapid probabilistic hazard assessment utilizing statistical emulators is a compelling and widely applicable approach to hazard assessment that can help inform decision making.
Data Availability Statement
The raw data supporting the conclusions of this article will be made available by the authors, without undue reservation, to any qualified researcher. Additionally, the data are available at the following locations: 1) DomeHaz data are available in spreadsheet snapshot format at Ogburn et al. (2012). DomeHaz: Dome-forming eruptions database v2.4 (https://vhub.org/groups/domedatabase). 2) FlowDat data are available in spreadsheet snapshot format at: Ogburn and Calder (2012). FlowDat: Mass flow database v2.2 (https://vhub.org/groups/massflowdatabase).
Author Contributions
ES: overall project management, co-developer of our dynamic modeling framework, led code development efforts. RW: stochastic modeling of PDC events and eruption durations, co-developer of our dynamic modeling framework, assisted in code development. SO: volcanology and geology expertise, data acquisition and curation, figure generation. EC: motivated project; volcanology expertise, deep familiarity with SHV eruption, interaction with stakeholders (MVO). JB: statistical modeling and uncertainty quantification expertise. AP: high-performance computer expertise, co-developer of TITAN2D flow simulator. EP: granular flow expert, co-developer of TITAN2D flow simulator.
Funding
US National Science Foundation grants DMS-1821289-1821311-1821338, DMS-1621853-1622403-1622467, DMS-1638521, and SES-1521855 covered travel expenses, PhD student support, and some researchers’ compensation. UK NRC grants EP/K032208/1 and NERC Standard Grant NE/R011001/1 covered some travel and subsistence. Duke University will contribute some Open Access publication fees through their CODA program.
Conflict of Interest
The authors declare that the research was conducted in the absence of any commercial or financial relationships that could be construed as a potential conflict of interest.
Acknowledgments
Any opinions, findings, and conclusions or recommendations expressed in this material are those of the authors and do not necessarily reflect the views of the NSF. ES would like to thank the Isaac Newton Institute for Mathematical Studies, Cambridge, United Kingdom, for support and hospitality during the program Mathematical and statistical challenges in landscape decision making where work on this paper was undertaken. The authors would like to thank MVO scientists, in particular Paul Cole, Victoria Miller, and Graham Ryan, for discussions which have helped to direct this work. The authors would further like to thank the reviewers including Larry Mastin who performed a U.S. Geological Survey internal review.
Appendix 1: Distributions
This short appendix describes the probability distributions used in this work.
Generalized Pareto
The
for parameters
with parameter
this is simply our
Pareto
A close relative of the Generalized Pareto is the Pareto distribution
It is a special case of the three-parameter
Poisson
The
for a single parameter
The process is called “homogeneous” if
where
Circular Distributions
We consider two possible distributions for the initial angle ϕ (measured in degrees counter-clockwize from due east, from the interval
• Uniform on
This indicates that flows in all directions are equally likely.
• Point mass at a specific value
These are both limiting special cases of von Mizes distribution, a flexible family of circular distributions used to model angles and defined in Wolpert et al., 2018. We discuss these angular distributions in the subsection entitled Dynamic probabilistic Pyroclastic Density Current Inundation Forecast Maps.
Multivariate Normal
The
References
Abramowitz, M., and Stegun, I. A. (Editors) (1964). Handbook of mathematical functions with formulas, graphs, and mathematical tables, Washington, DC: National Bureau of Standards, 1046.
Ball, J. L., Calder, E. S., Hubbard, B. E., and Bernstein, M. L. (2013). An assessment of hydrothermal alteration in the Santiaguito lava dome complex, Guatemala: implications for dome collapse hazards. Bull. Volcanol. 75, 676. doi:10.1007/s00445-012-0676-z
Ball, J. L., Stauffer, P. H., Calder, E. S., and Valentine, G. A. (2015). The hydrothermal alteration of cooling lava domes. Bull. Volcanol. 77, 102. doi:10.1007/s00445-015-0986-z
Barclay, J., Johnstone, J. E., and Matthews, A. J. (2006). Meteorological monitoring of an active volcano: implications for eruption prediction. J. Volcanol. Geoth. Res. 150, 339–358. doi:10.1016/j.jvolgeores.2005.07.020
Bayarri, M. J., Berger, J. O., Calder, E. S., Dalbey, K., Lunagómez, S., Patra, A. K., et al. (2009). Using statistical and computer models to quantify volcanic hazards. Technometrics 51, 402–413. doi:10.1198/TECH.2009.08018
Bayarri, M. J., Berger, J. O., Calder, E. S., Patra, A. K., Pitman, E. B., Spiller, E. T., et al. (2015). Probabilistic quantification of hazards: a methodology using small ensembles of physics-based simulations and statistical surrogates. Int. J. Uncertainty Quantif. 5, 297–325. doi:10.1615/Int.J.UncertaintyQuantification.2015011451
Boudon, G., Le Friant, A., Komorowski, J.-C., Deplus, C., and Semet, M. P. (2007). Volcano flank instability in the Lesser Antilles Arc: diversity of scale, processes, and temporal recurrence. J. Geophys. Res. 112, B08205. doi:10.1029/2006JB004674
Calder, E. S., Luckett, R., Sparks, R. S. J., and Voight, B. (2002). Mechanisms of lava dome instability and generation of rockfalls and pyroclastic flows at Soufrière Hills Volcano, Montserrat. Geol. Soc. London Mem. 21, 173–190. doi:10.1144/GSL.MEM.2002.021.01.08
Capra, L., Macı́as, J. L., Scott, K. M., Abrams, M., and Garduño-Monroy, V. H. (2002). Debris avalanches and debris flows transformed from collapses in the Trans-Mexican Volcanic Belt, Mexico - behavior, and implications for hazard assessment. J. Volcanol. Geoth. Res. 113, 81–110. doi:10.1016/S0377-0273(01)00252-9
Clavero, J. E., Sparks, R. S. J., Pringle, M. S., Polanco, E., and Gardeweg, M. C. (2004). Evolution and volcanic hazards of Taapaca Volcanic Complex, Central Andes of Northern Chile. J. Geol. Soc. London. 161, 603–618. doi:10.1144/0016-764902-065
Cole, P. D., Bass, V. A., Christopher, T. E., Eligon, C., Murrell, C., Odbert, H. M., et al. (2010). Report No.: OFR 10-02a. Report to the scientific advisory committee on volcanic sctivity at Soufrière Hills Volcano, Montserrat: Report on activity between 28 February 2010 and 31 October 2010, 50.
Cole, P. D., Neri, A., and Baxter, P. J. (2015). “Hazards from pyroclastic density currents,” in The encyclopedia of volcanoes. New York, NY: Elsevier, 943–956. doi:10.1016/B978-0-12-385938-9.00054-7.
Deplus, C., Le Friant, A., Boudon, G., Komorowski, J.-C., Villemant, B., Harford, C., et al. (2001). Submarine evidence for large-scale debris avalanches in the Lesser Antilles Arc. Earth Planet Sci. Lett. 192, 145–157. doi:10.1016/S0012-821X(01)00444-7
Druitt, T. H., and Kokelaar, B. P. (Editors) (2002). The eruption of Soufrière Hills Volcano, Montserrat from 1995 to 1999. Geol. Soc. London Mem. 21, 71–91, doi:10.1144/GSL.MEM.2002.021
Elsworth, D., Voight, B., Thompson, G., and Young, S. R. (2004). Thermal-hydrologic mechanism for rainfall-triggered collapse of lava domes. Geology. 32, 969. doi:10.1130/G20730.1.
Harnett, C. E., Thomas, M. E., Calder, E. S., Ebmeier, S. K., Telford, A., Murphy, W., et al. (2019). Presentation and analysis of a worldwide database for lava dome collapse events: the Global Archive of Dome Instabilities (GLADIS). Bull. Volcanol., 81 (3), 1–17. doi:10.1007/s00445-019-1276-y
Kerle, N. (2002). Volume estimation of the 1998 flank collapse at Casita volcano, Nicaragua: a comparison of photogrammetric and conventional techniques. Earth Surf. Process. Landforms. 27, 759–772. doi:10.1002/esp.351
Le Friant, A., Harford, C. L., Deplus, C., Boudon, G., Sparks, R. S. J., Herd, R. A., et al. (2004). Geomorphological evolution of Montserrat (West Indies): importance of flank collapse and erosional processes. J. Geol. Soc. London. 161, 147–160. doi:10.1144/0016-764903-017
Mastin, L. G. (1994). Explosive tephra emissions at Mount St. Helens, 1989-1991: the violent escape of magmatic gas following storms? Geol. Soc. Am. Bull. 106, 175–185. doi:10.1130/0016-7606(1994)106<0175:eteams>2.3.co;2
Matthews, A. J., Barclay, J., Carn, S., Thompson, G., Alexander, J., Herd, R., et al. (2002). Rainfall-induced volcanic activity on Montserrat. Geophys. Res. Lett. 29, 1644. doi:10.1029/2002GL014863
Norton, G. E., Watts, R. B., Voight, B., Mattioli, G. S., Herd, R. A., Young, S. R., et al. (2002). Pyroclastic flow and explosive activity at Soufrière Hills Volcano, Montserrat, during a period of virtually no magma extrusion (March 1998 to November 1999). Geol. Soc. London Mem. 14, 467–481. doi:10.1144/GSL.MEM.2002.021.01.21
Ogburn, S. E., and Calder, E. S. (2012). FlowDat–Mass flow database. Available at: https://vhub.org/groups/massflowdatabase.
Ogburn, S. E., and Calder, E. S. (2017). The relative effectiveness of empirical and physical models for simulating the dense undercurrent of pyroclastic flows under different emplacement conditions. Front. Earth Sci. 5, 83. doi:10.3389/feart.2017.00083
Ogburn, S. E., Loughlin, S. C., and Calder, E. S. (2015). The association of lava dome growth with major explosive activity (VEI ≥ 4): DomeHaz, a global dataset. Bull. Volcanol. 77, 40. doi:10.1007/s00445-015-0919-x
Ogburn, S. E., Loughlin, S. C., and Calder, E. S. (2012). DomeHaz: Dome-forming eruptions database. Available at: https://vhub.org/groups/domedatabase.
Opfergelt, S., Delmelle, P., Boivin, P., and Delvaux, B. (2006). The 1998 debris avalanche at Casita volcano, Nicaragua: investigation of the role of hydrothermal smectite in promoting slope instability. Geophys. Res. Lett. 33, L15305. doi:10.1029/2006gl026661
Pallister, J. S., Schneider, D. J., Griswold, J. P., Keeler, R. H., Burton, W. C., Noyles, C., et al. (2013). Merapi 2010 eruption-chronology and extrusion rates monitored with satellite radar and used in eruption forecasting. J. Volcanol. Geoth. Res. 261, 144–152. doi:10.1016/j.jvolgeores.2012.07.012
Patra, A. K., Bauer, A. C., Nichita, C. C., Pitman, E. B., Sheridan, M. F., Bursik, M., et al. (2005). Parallel adaptive numerical simulation of dry avalanches over natural terrain. J. Volcanol. Geoth. Res. 139 (1–2), 1–21. doi:10.1016/j.jvolgeores.2004.06.014
Rasmussen, C. E., and Williams, C. K. I. (2006). Gaussian processes for machine learning. Adaptative computation and machine learning series. Boston, MA: The MIT Press, 266.
Ratdomopurbo, A., and Poupinet, G. (2000). An overview of the seismicity of Merapi volcano (Java, Indonesia), 1983-1994. J. Volcanol. Geoth. Res. 100, 193–214. doi:10.1016/S0377-0273(00)00137-2
Reid, M. E., Sisson, T. W., and Brien, D. L. (2001). Volcano collapse promoted by hydrothermal alteration and edifice shape, Mount Rainier, Washington. Geology 29, 779–782. doi:10.1130/0091-7613(2001)029<0779:vcpbha>2.0.co;2
Salaün, A., Villemant, B., Gérard, M., Komorowski, J.-C., and Michel, A. (2011). Hydrothermal alteration in andesitic volcanoes: trace element redistribution in active and ancient hydrothermal systems of Guadeloupe (lesser Antilles). J. Geochem. Explor. 111, 59–83. doi:10.1016/j.gexplo.2011.06.004
Sampler, A., Quidelleur, X., Boudon, G., Le Friant, A., and Komorowski, J.-C. (2008). Radiometric dating of three large volume flank collapses in the lesser antilles arc. J. Volcanol. Geoth. Res. 176, 485–492. doi:10.1016/j.jvolgeores.2008.04.018
Santner, T. J., Williams, B. J., and Notz, W. I. (2018). The design and analysis of computer experiments. 2nd Edn. New York, NY: Springer-Verlag, 436, doi:10.1007/978-1-4939-8847-1
Scientific Advisory Committee of the Montserrat Volcano Observatory (2011). Assessment of the hazards and risks associated with the Soufrière Hills Volcano, Montserrat: 16th report of the scientific advisory committee on Montserrat volcanic activity. Technical report, MVO. November 14–16, 2011, Montserrat Volcano Observatory.
Scientific Advisory Committee of the Montserrat Volcano Observatory (2019). Assessment of the hazards and risks associated with the Soufrière Hills Volcano, Montserrat: 24th report of the scientific advisory committee on Montserrat volcanic activity. Technical report, MVO.
Sheridan, M. F., Bonnard, C., Carreno, R., Siebe, C., Strauch, W., Navarro, M., et al. (1998). Report on the 30 October 1998 rock fall/avalanche and breakout flow of Casita Volcano, Nicaragua, triggered by Hurricane Mitch. Landslide News., 12, 2–4.
Siebert, L., Simkin, T., and Kimberly, P. (2011). Volcanoes of the world. 3rd Edn. Oakland, CA: University of California Press, 568.
Simkin, T., and Siebert, L. (1994). Volcanoes of the world: a regional directory, gazetteer, and chronology of volcanism during the last 10,000 years. 2nd Edn. Tucson, AZ: Geoscience Press, 349.
Sparks, R. S. J., and Aspinall, W. P. (2004). “Volcanic activity: frontiers and challenges in forecasting, prediction and risk assessment,” in The state of the planet: frontiers and challenges in geophysics, volume 19 of IUGG monograph. Editors R. S. J. Sparks, and C. J. Hawkesworth, New York, NY: AGU, 359–373. doi:10.1029/150GM28. Geophysical Monograph 150
Sparks, R. S. J., Barclay, J., Calder, E. S., Herd, R. A., Komorowski, J.-C., et al. (2002). Generation of a debris avalanche and violent pyroclastic density current on 26 December (Boxing Day) 1997 at Soufrière Hills Volcano, Montserrat. Geol. Soc. London Mem. 21, 409–434. doi:10.1144/gsl.mem.2002.021.01.18
Spiller, E. T., Bayarri, M. J., Berger, J. O., Calder, E. S., Patra, A. K., Pitman, E. B., et al. (2014). Automating emulator construction for geophysical hazard maps. SIAM/ASA J. Uncertain. Quantif. 2, 126–152. doi:10.1137/120899285
Stinton, A. J., Cole, P. D., Stewart, R. C., Odbert, H. M., and Smith, P. (2014). The 11 February 2010 partial dome collapse at Soufrière Hills Volcano, Montserrat. Geol. Soc. London Mem. 29, 133–152. doi:10.1144/M39.7
Vallance, J. W., Siebert, L., Rose, W. I., Girón, J. R., and Banks, N. G. (1995). Edifice collapse and related hazards in Guatemala. J. Volcanol. Geoth. Res. 66, 337–355. doi:10.1016/0377-0273(94)00076-S
Voight, B. (2000). Structural stability of andesite volcanoes and lava domes. Philos. Trans. R. Soc. London Ser. A 358, 1663–1703. doi:10.1098/rsta.2000.0609
Voight, B., and Elsworth, D. (2000). Instability and collapse of hazardous gas-pressurized lava domes. Geophys. Res. Lett. 27(1), 1–4. doi:10.1029/1999GL008389
Voight, B., Komorowski, J.-C., Norton, G. E., Belousov, A. B., Belousova, M., Boudon, G., et al. (2002). The 26 December (Boxing Day) 1997 sector collapse and debris avalanche at Soufrière Hills Volcano, Montserrat, Geol. Soc. London Mem. 21, 363–407. doi:10.1144/GSL.MEM.2002.021.01.17
Wadge, G., Herd, R., Ryan, G., Calder, E. S., and Komorowski, J.-C. (2010). Lava production at Soufrière Hills Volcano, Montserrat: 1995-2009. Geophys. Res. Lett., 37, L00E03. doi:10.1029/2009GL041466
Wadge, G., Robertson, R. E. A., and Voight, B. (Editors) (2014a). The eruption of Soufri`ere Hills Volcano, Montserrat from 2000 to 2010. London, UK: Geological Society, 501.
Wadge, G., Voight, B., Cole, P. D., Loughlin, S. C., and Robertson, R. E. A. (2014b). The eruption of Soufrière Hills Volcano, Montserrat from 2000 to 2010. Geol. Soc. London Mem. 39, 1–40. doi:10.1144/M39.1
Watts, R. B., De Silva, S. L., Jimenez de Rios, G., and Croudace, I. (1999). Effusive eruption of viscous silicic magma triggered and driven by recharge: a case study of the Cerro Chascon-Runtu Jarita Dome Complex in Southwest Bolivia. Bull. Volcanol. 61, 241–264. doi:10.1007/s004450050274
Welch, W. J., Buck, R. J., Sacks, J., Wynn, H. P., Mitchell, T. J., and Morris, M. D. (1992). Screening, predicting, and computer experiments. Technometrics 34, 15–25. doi:10.2307/1269548
Wolpert, R. L., Ogburn, S. E., and Calder, E. S. (2016). The longevity of lava dome eruptions. J. Geophys. Res. Solid Earth. 121, 676–686. doi:10.1002/2015JB012435
Wolpert, R. L., Spiller, E. T., and Calder, E. S. (2018). Dynamic statistical models for pyroclastic density current generation at Soufrière Hills Volcano. Front. Earth Sci. 6, 55. doi:10.3389/feart.2018.00055
Keywords: pyroclastic density current, uncertainty quantification, hazard assessment, non-stationarity, Bayesian analysis
Citation: Spiller ET, Wolpert RL, Ogburn SE, Calder ES, Berger JO, Patra AK and Pitman EB (2020) Volcanic Hazard Assessment for an Eruption Hiatus, or Post-eruption Unrest Context: Modeling Continued Dome Collapse Hazards for Soufrière Hills Volcano. Front. Earth Sci. 8:535567. doi: 10.3389/feart.2020.535567
Received: 16 February 2020; Accepted: 21 August 2020;
Published: 16 December 2020.
Edited by:
Conrad Daniel Lindholm, Norsar, NorwayReviewed by:
Joern Lauterjung, German Research Centre for Geosciences, GermanyHugo Delgado Granados, National Autonomous University of Mexico, Mexico
Copyright ©2020 Spiller, Wolpert, Ogburn, Calder, Berger, Patra and Pitman. This is an open-access article distributed under the terms of the Creative Commons Attribution License (CC BY). The use, distribution or reproduction in other forums is permitted, provided the original author(s) and the copyright owner(s) are credited and that the original publication in this journal is cited, in accordance with accepted academic practice. No use, distribution or reproduction is permitted which does not comply with these terms.
*Correspondence: Elaine T. Spiller, ZWxhaW5lLnNwaWxsZXJAbWFycXVldHRlLmVkdQ==