 Andrew Mitchell
 Scott McDougall1
 Jordan Aaron
- 1Department of Earth, Ocean and Atmospheric Sciences, The University of British Columbia, Vancouver, BC, Canada
- 2ETH Zürich, Zürich, Switzerland
- 3Westrek Geotechnical Services Ltd., Squamish, BC, Canada
Rock avalanches can trigger destructive associated hazards following the initial collapse and fragmentation of a rock slope failure. One of these associated hazards occurs when the material derived from the initial collapse of the source zone impacts and mobilizes a mass flow composed of sediment from along the travel path. These mass flows can be grouped into radial impact areas that occur on relatively flat, open terrain (typically a floodplain), and more linear impact areas that occur in channelized terrain. Rock avalanche-generated sediment mass flows are an important consideration because they can significantly increase the area impacted by an event, thereby increasing the hazard area, especially in valley bottoms where there are likely more elements at risk. Existing runout prediction methods do not consistently account for the increase in the impact area from rock avalanche-generated sediment mass flows. Thus, there is a need for a simple data-supported method for estimating the extent of mass flow impacts resulting from an initial rock avalanche event with sediments along the potential travel path. This paper presents data from 32 rock avalanches and 23 rock avalanche-generated sediment mass flows from around the world, described using a consistent set of quantitative and qualitative attributes. A wide range of mass flow impacts were observed, with the sediment mass flow impact area or runout length exceeding the impact of the coarse, rocky debris in some cases. The area and length impacted by the coarse, rocky debris is estimated using multiple linear regressions considering the event volume and topographic features. The sediment mass flow dataset is used as input to develop an exponential distribution of the area or runout length of the sediment mass flow over that of the coarse, rocky debris. A decision tree framework is presented for estimating the extent of potential rock avalanches and potential rock avalanche-generated sediment mass flows for hazard and risk analysis, which is demonstrated by comparing the stochastic empirical predictions to those from numerical runout modeling.
Introduction
Rock avalanches are mass flows that can initiate complex hazard cascades. They are defined by their dominant characteristics: high velocity flow-like motion of a large volume (typically greater than 1 million m3) of fragmenting rock that can travel several kilometers and run up opposing valley slopes (Hermanns, 2013; Hungr et al., 2014). A range of associated hazards must also be considered when making predictions about the potential impacts of a rock avalanche, such as air blasts (e.g., Mathews and McTaggart, 1978; Zhuang et al., 2019) and floods caused by landslide dam impoundment and/or breach (e.g., Evans et al., 2011). A particularly destructive associated hazard involves the mobilization of surficial material from the travel path. When rock avalanches encounter sediments, open water or snow/ice along their path, a relatively fluid and mobile flow of these materials can be generated that extends beyond the margins of the coarse rocky flow. We refer to this process generally as a rock avalanche-generated mass flow (Figure 1). This paper specifically focuses on mass flows involving sediments.
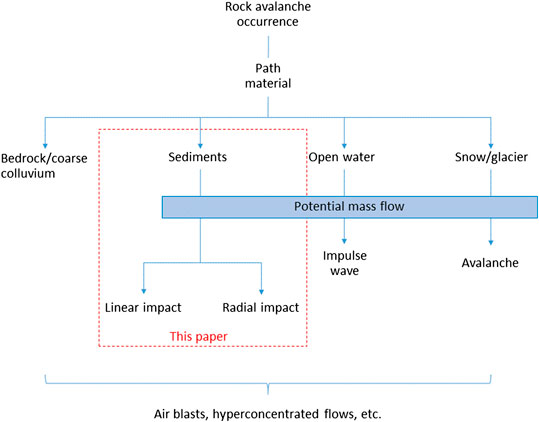
FIGURE 1. Potential mass flows generated by rock avalanches. Note that multiple types of mass flows are possible in a single event (e.g., Bussmann and Anselmetti, 2010), depending on the nature and distribution of materials along the path.
One of the factors that can influence the mobility and impact area of rock avalanches is the mobilization of path sediments. In their report on the 1903 Frank Slide, McConnell and Brock (1904) described extensive “mud flats” fringing the deposit, derived primarily from alluvium that was “splashed” out of the valley floor. Heim (1932) observed similar zones (now often referred to as splash zones) surrounding rock avalanche deposits in the Alps, which he likened to the lateral moraines of a glacier and attributed to a “snowplow” style mechanism. Abele (1997) linked the apparent high mobility of some of these features, including the far-reaching Bonaduz Gravel deposits associated with the Flims rockslide, to the mechanism of rapid undrained loading of saturated path sediments. Other workers have expounded on this hypothesis (e.g., Hungr and Evans, 2004; Orwin et al., 2004; McDougall and Hungr, 2005; Crosta et al., 2009) and a large number of supporting case studies have been presented (see case study compilation and associated references later in this paper). Some laboratory flume and centrifuge experiments have also been carried out that shed further light on this mechanism (e.g., Steers, 2018; Furuya et al., 2019).
While these types of mass flows can be highly destructive, evidence of their presence is not as well preserved in the geomorphic and stratigraphic record as that of the coarse rocky debris. In their reexamination of the Frank Slide, Cruden and Hungr (1986) noted dense vegetation cover in the relatively fine-grained splash zones described by McConnell and Brock (1904). Another striking example of this sort of masking over time can be seen at the site of the 1965 Hope Slide (Figure 2). Panel A in Figure 2 shows the northern distal splash zone of the 1965 Hope Slide (southwestern British Columbia) deposit. Panels B and C in Figure 2 show aerial views of the site in 1965 and 2019, respectively; the splash zone is entirely overgrown in the 2019 imagery.
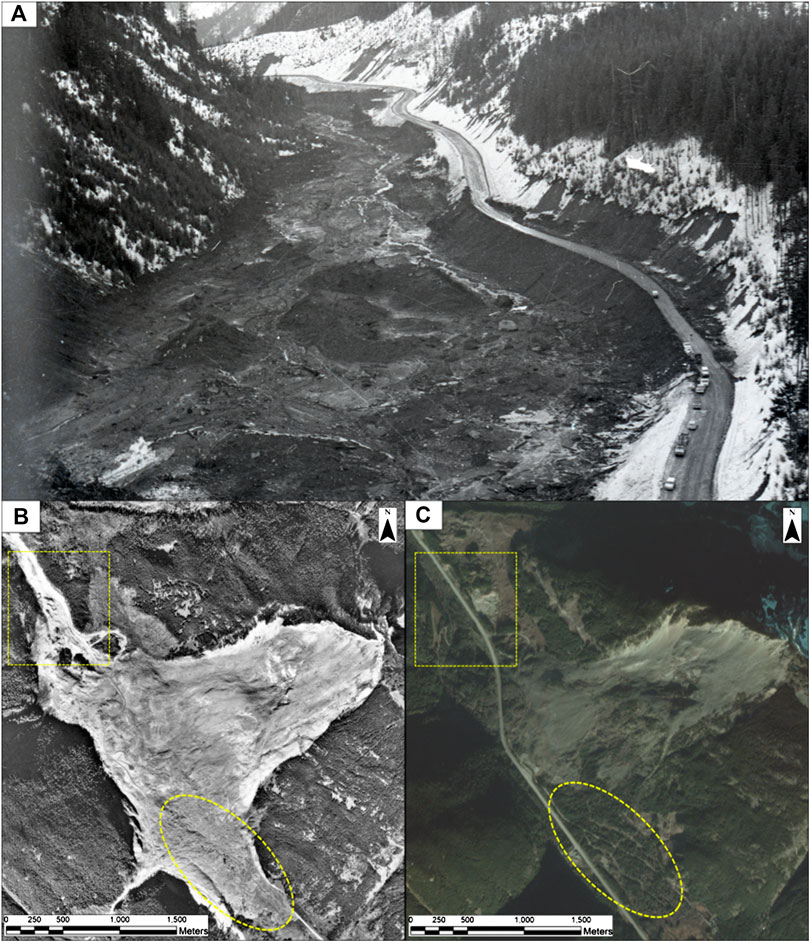
FIGURE 2. (A) Rock avalanche-generated mass flow impact area (splash zone) at the northern margin of the Hope Slide [photo taken shortly after the event in January 1965, courtesy of British Columbia Ministry of Transportation and Infrastructure (BC MoTI)], (B) orthorectified airphoto of the impact area from 1965, and (C) orthorectified satellite image of the same area from 2019 (Planet, 2020). The approximate area shown in Panel (A) is indicated by the yellow rectangles in Panels (B) and (C). The yellow oval highlights the revegetation of the Zone 2 impact area at the southern margin of the deposit.
Since the evidence for rock avalanche-generated mass flows can be subtle and short-lived, it has led to inconsistencies in the ways that rock avalanche runout lengths and impact areas are measured. For example, the commonly used concept of the fahrböschung, or angle of reach, defined as the ratio of the difference in elevation from the highest point on the scarp to the toe of the deposit (H) to the horizontal path distance between those points (L), has long been used as a metric of rock avalanche mobility, and has been shown to be related to the volume of the rock avalanche (see Mitchell et al., 2020 for a summary). Inconsistencies in the inclusion or exclusion of rock-avalanche generated mass flows when assessing H and L can lead to multiple authors assessing different angle of reach values for the same cases.
This inconsistency is problematic when assessing rock avalanche hazard and risk because many empirical and numerical runout prediction methods that are used for this purpose (e.g., McDougall, 2017) are based on statistical analyses or model calibration approaches that implicitly rely on consistent case study data. Runout prediction methods that use case study datasets that include prehistoric events where distal mass flow impacts were not recognized, or datasets that are based exclusively on the mapped extents of coarse rocky deposits (e.g., Mitchell et al., 2020), may underestimate potential rock avalanche impacts unless suitable adjustments are made to the predictions. Furthermore, there is little information currently available in order to make a well constrained estimate of the likelihood of a mass flow occurring due to a rock avalanche.
To help address this issue, the objectives of this study were to:
• Highlight the importance of mass flows in rock avalanche hazard and risk assessment;
• Develop a consistent methodology for describing key quantitative and qualitative attributes of rock avalanche-generated mass flows involving sediments;
• Compile a dataset of case studies using the new methodology;
• Develop a probabilistic hazard assessment framework and preliminary statistical relationships to predict mass flow likelihood, impact areas and runout lengths.
A hypothetical mass flow runout prediction case is used to demonstrate the application of the new methodology.
Methodology
Definitions
To describe rock avalanche and associated sediment mass flow characteristics, we define three impact zones, as shown below. These zones can be identified based on their sedimentology, emplacement mechanism and relationship to the initial failed mass, and are based on concepts originally presented by Abele (1997) and Hungr and Evans (2004).
• Zone 1 Impact Area: The spatial area impacted by coarse, rocky debris. This area extends from the source, through the transport zone to the distal extent of continuous fragmented rock debris (Figure 3). In cases where a rock avalanche overrides sediments, the Zone 1 impact area may include continuous coarse debris rafted on top of the sediments. Typically, the Zone 1 impact area is all that is observable in aerial or satellite imagery of prehistoric events.
• Zone 2 Impact Area: The spatial area impacted by a rapid to extremely rapid (Hungr et al., 2014) mass flow generated by a rock avalanche impact (Figure 3). Zone 2 impacts occur coincidently with the deposition of the Zone 1 material; essentially they are different parts of the same event. In cases where a rock avalanche encounters sediments, the Zone 2 impact area may include discontinuous coarse debris rafted on top of the sediments, but these isolated blocks are considered a minor portion of the flow. Rock avalanches may also encounter coarse colluvium that is entrained into the flow, however these impacts will generally be indistinguishable from the Zone 1 impact area.
• Zone 3 Impact Area: The spatial area impacted as a result of a rock avalanche, but not triggered by the emplacement of fragmented rock debris and may be separated from the Zone 1 and Zone 2 impacts in time. For example, they may include the formation of a landslide dammed lake or aggradation/erosion of a downstream channel. These impacts may occur suddenly (e.g., through breach of a landslide dam) or over the course of many years.
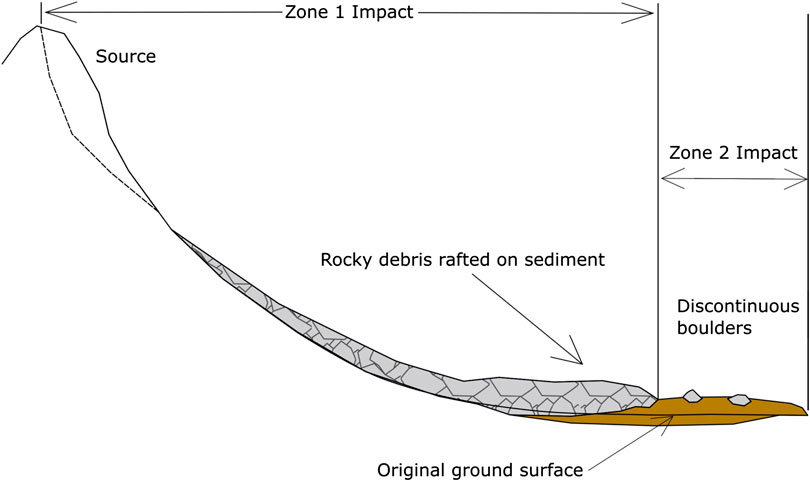
FIGURE 3. Definition sketch showing Zone 1 and Zone 2 impacts from a rock avalanche.
Zone 2 impacts can be further subdivided into end-member events that have a radial impact zone (Figure 4A) or a linear impact zone (Figure 4B). Often mass flows have elements of the idealized radial and linear impact zones shown in Figure 4, which are examined in the Hypothetical Example and Summary and Discussion sections. Linear impact zones are sometimes referred to as debris flows or debris avalanches (Hungr et al., 2014). The special term rockslide-debris avalanche was previously proposed for events with an entrainment ratio (ratio between entrained volume and initial failure volume) greater than 0.25 (Hungr and Evans, 2004).
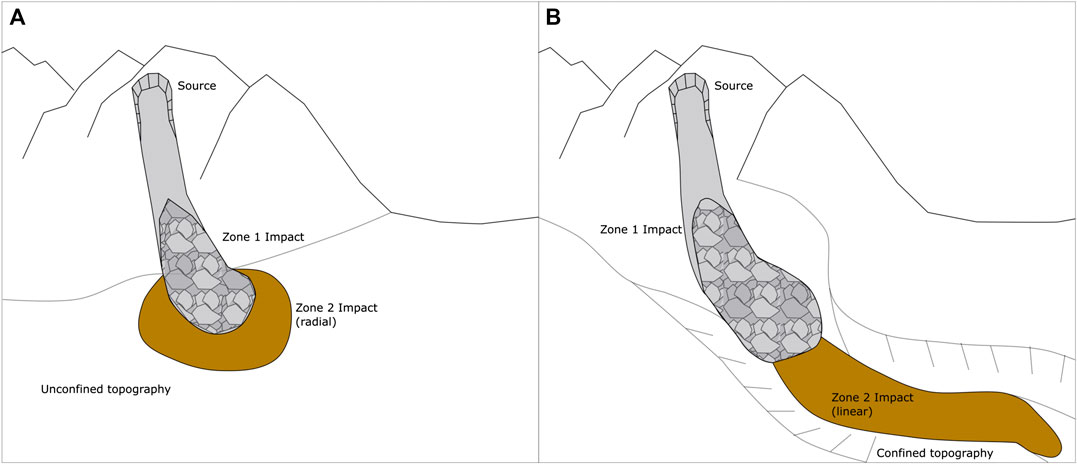
FIGURE 4. Definition sketch showing (A) a radial Zone 2 impact zone, and (B) a linear Zone 2 impact zone.
As shown in Figure 1, mass flows involving water or snow and ice may also be generated by rock avalanches. Air blasts could also be considered a form of mass flow, just one involving a low density, low viscosity fluid. These impacts could be considered as part of Zone 2, however, the focus of this study is on mass flows primarily involving sediments. Likewise, systematic descriptions of Zone 3 impacts are beyond the scope of the present study; the definition of Zone 3 is included above for completeness, its relationship to landslide dam work referenced later in this paper, and for the potential future expansion of the general hazard assessment approach we propose.
Two “type case” examples are provided to illustrate the typical behavior of radial and linear rock avalanche-generated mass flows: the Hope Slide (Figures 2, 5) and the McAuley Creek rock avalanche (Figure 6), respectively.
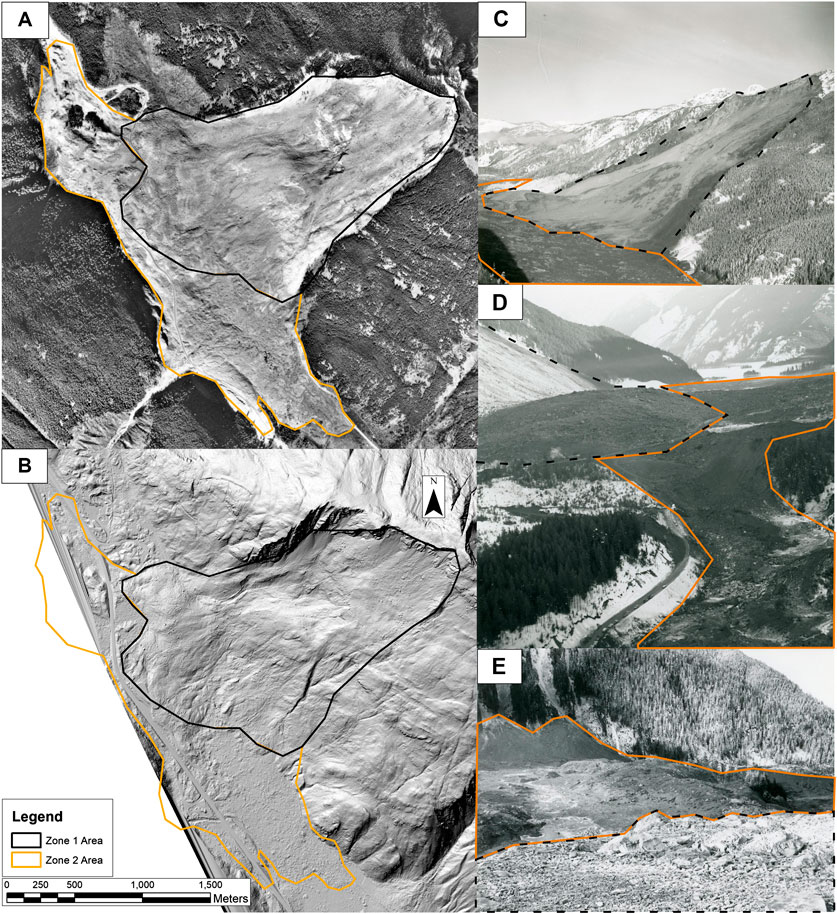
FIGURE 5. Hope Slide (A) ortho image generated from aerial photographs taken in 1965, (B) bare-earth lidar hillshade from 2014 (data courtesy of BC MoTI), (C) oblique view of the slide, (D) oblique view of the west margin of the deposit area, and (E) view of the south side of the debris field showing the transition from Zone 1 to Zone 2 deposits (photos C through E courtesy of BC MoTI).
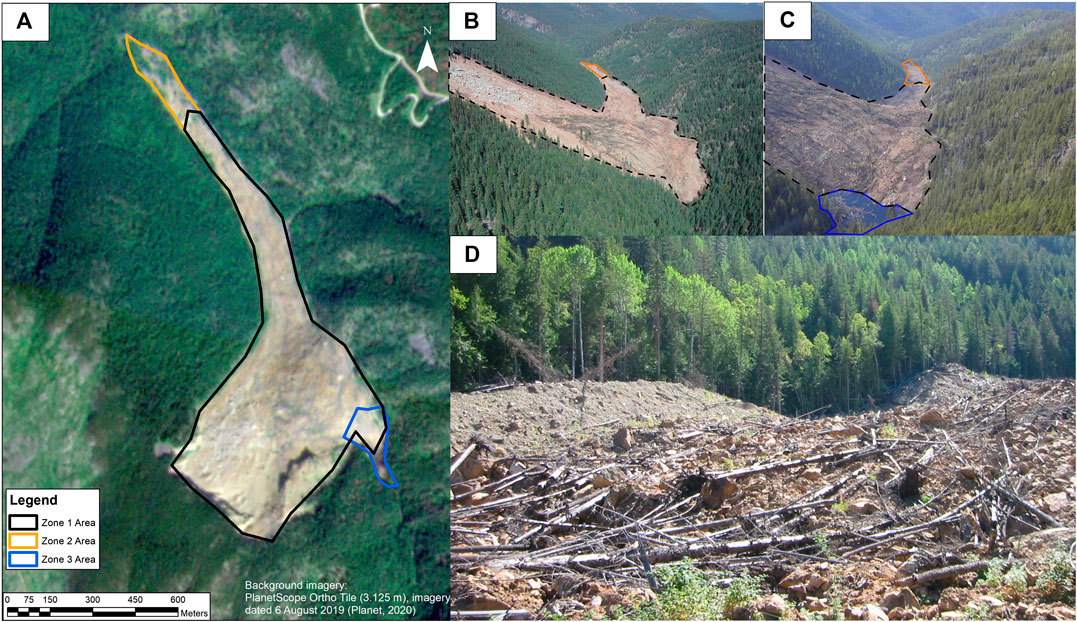
FIGURE 6. McAuley Creek rock avalanche (A) impact area delineations on a satellite image from August 6, 2019 (Planet, 2020), (B) oblique view of the main deposition area with the tongue of more mobile material extending into the background from August 21, 2002 (photo courtesy Réjean Couture), (C) oblique view of the deposit area showing the transient landslide dammed lake from June 10, 2002 (photo courtesy Scott Paddington), and (D) a photo of the north margin of the deposit near the transition from what was mapped as Zone 1 and Zone 2.
Hope Slide–Radial Impact Type Case
The Hope Slide occurred on January 9, 1965 in the Cascade Mountains of southwestern British Columbia and was described in detail by Mathews and McTaggart (1978). The event originated with a mass of rock releasing on a steeply dipping felsite sheet. The rock then fragmented and impacted the valley floor, burying approximately 3 km of BC Highway 3 and causing four fatalities (Figures 5A,C). The coarse rock avalanche debris deposited primarily at the base of the source slope, creating a series of irregular curved ridges near the middle of the deposit and irregular mounds elsewhere. The coarse debris was fringed by what was described as mud-rich debris (Figures 5B,D,E). Evidence of an air-blast was also noted, such as snow being dislodged from the branches of trees or the snow being covered by air-borne sediment, primarily near the mid-line of the landslide along the main direction of travel (Mathews and McTaggart, 1978).
The broad valley relative to the size of the Zone 1 deposit led to the formation of a radial fringe of sediment-rich debris in the Zone 2 area. However, the event did exhibit some characteristics of a linear Zone 2 impact, such as the opposite wall of the valley limiting the spread of debris to the west. A “mud flow” extending 5 km down the Nicolum River was also described by Mathews and McTaggart (1978). This area was not included in the estimate of the Zone 2 area given in Table 2, as it is not visible in the available imagery and we did not want to introduce inconsistency in the mapping methodology, described in detail in the Dataset Compilation section. While this flow was contained in the channel of the river, it did cause a bridge to become blocked, resulting in flow over Highway 3 at that location (Mathews and McTaggart, 1978). Further discussion on the applicable spatial resolution of this technique is included in the Summary and Discussion.
Since the event in 1965, vegetation has re-established over the Zone 2 impact area and Highway 3 has been reconstructed (Figure 2). Although much of the visual evidence has been lost in that 55-year period, there is evidence of the Zone 2 impact in the lidar hillshade image, where a rougher surface is visible relative to the surrounding valley floor (Figure 5B).
McAuley Creek–Linear Impact Type Case
The McAuley Creek rock avalanche occurred in an uninhabited area of southern British Columbia in late May or early June 2002 and was described in detail by Brideau et al. (2012). The basal failure surface and lateral release surfaces are thought to have developed from faults and shear bands present in the rock. The coarse rock avalanche debris deposited primarily at the base of the source slope, with the material thinning toward the distal edge of the deposit, and a more mobile lobe of material extending down the McAuley Creek valley (Figures 6A,B) (Brideau et al., 2012). The coarse debris formed a landslide dam that created a small, temporary lake upstream of the coarse deposit area (Figure 6C). The area the slide overran was a mature forest and many displaced trees were visible on the surface of the deposit (Figure 6D). Review of photographs from field investigations following the event showed there were progressively fewer large boulders in the deposit, and the surface texture visible in the aerial imagery became less rough toward the distal end of the flow. Vegetation regrowth visible in the 2019 satellite imagery (Figure 6A) was also used to help distinguish the transition from a primarily coarse, rocky deposit where slower vegetation regrowth is expected, to the finer sediment deposits where faster regrowth is expected.
The narrow valley relative to the size of the deposit and the formation of a linear lobe of sediment and organic-rich debris led to this event being classified as confined in the Zone 2 area. The lake visible in Figure 6C, but not in the 2019 imagery (Figure 6A), is an example of a transitory Zone 3 impact.
Dataset Compilation
A dataset of 32 historical and prehistoric rock avalanche events was compiled in order to derive statistical relationships to predict the length and area of Zone 2 (see subsequent sections for further details of this methodology). The cases included in this study were compiled from a literature review of rock avalanche case histories that overran sediments for a significant portion of their travel length (as opposed to bedrock or glacial ice/snow). Where available, pre- and post-event satellite images, aerial photographs, lidar topography, and published maps of deposits were used in the mapping. Published references were used to obtain information on the event volumes, source characteristics, substrate characteristics and deposit descriptions. Visible changes in deposit material and surface texture, along with published information, were used to determine if a Zone 2 impact was present, and if so, to map its extent. This dataset included a subset of cases where there is no strong evidence of a mass flow. The literature review attempted to collect all English language peer-reviewed case histories of events after 2010 to provide an unbiased sample for the estimation of the likelihood of a mass flow occurring given a rock avalanche occurring with sediment in the travel path. The cases without mass flow generation from before 2010 were described when there was sufficient information in the literature and air or satellite photos from a short time after the event to confidently determine there was not a mass flow associated with the rock avalanche. Cases of any age with insufficient data for detailed descriptions or mapping were excluded from the dataset.
Pre- and post-event satellite images of rock avalanches that occurred after 2010 were obtained from RapidEye (5 m pixel size) or PlanetScope (3.25 m pixel size) orthorectified images (Planet, 2020). DigitalGlobe satellite imagery was also accessed for all cases to examine recent land cover. The ASTER GDEM v2 was used for all elevations. For cases where the event pre-dated satellite imagery and aerial photographs were available, orthorectified images were generated using Agisoft Metashape v1.5 software (Agisoft, 2019). Where detailed deposit maps were available in the literature, they were used to aid in the mapping. Lidar imagery was available for some cases, for which it was also used for geomorphic interpretation of the different deposit zones.
The quantitative and qualitative attributes used in this study to describe the Zone 1 impact areas are consistent with the terms used in Mitchell et al. (2020). The attributes used to describe the Zone 1 and Zone 2 impact areas are shown in Table 1. For laterally confined events, the travel distance and fall height were mapped along the flow path, and for unconfined events the maximum distance was measured perpendicular to the margin of the Zone 1 deposit. There is some uncertainty in both the spatial extent of the deposits and the boundary between different deposit zones. This uncertainty is mainly controlled by the quality of available imagery and how soon after the event the imagery was collected. To qualitatively describe the degree of confidence in the mapped attributes, three spatial uncertainty classes were defined (ranging from well to poorly constrained), as shown in Table 1.
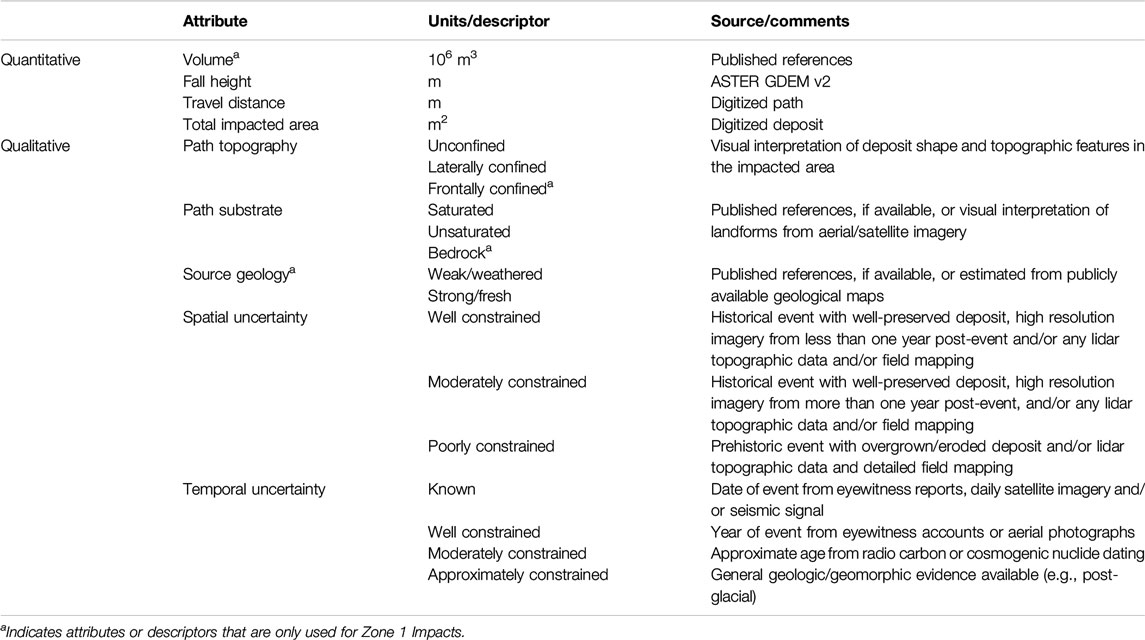
TABLE 1. Attributes used to describe the Zone 1 and Zone 2 impact areas for events in the dataset.
Hazard Assessment Framework
A statistical methodology for predicting the Zone 2 impact area has been developed based on the compiled rock avalanche dataset. As shown in Figure 7, the occurrence of a Zone 2 impact area of a given size is conditional on a number of factors described below, such as the Zone 1 impact area, and the probability of generating a mass flow given that a rock avalanche has occurred. Typically, a range of potential outcomes is examined, and continuous random variables are discretized using values chosen as representative for a range of probabilities. While the continuous random variables could theoretically be used, creating hazard maps and other practical tools for risk communication requires discrete values. This range of outcomes is represented as an event tree in Figure 7.
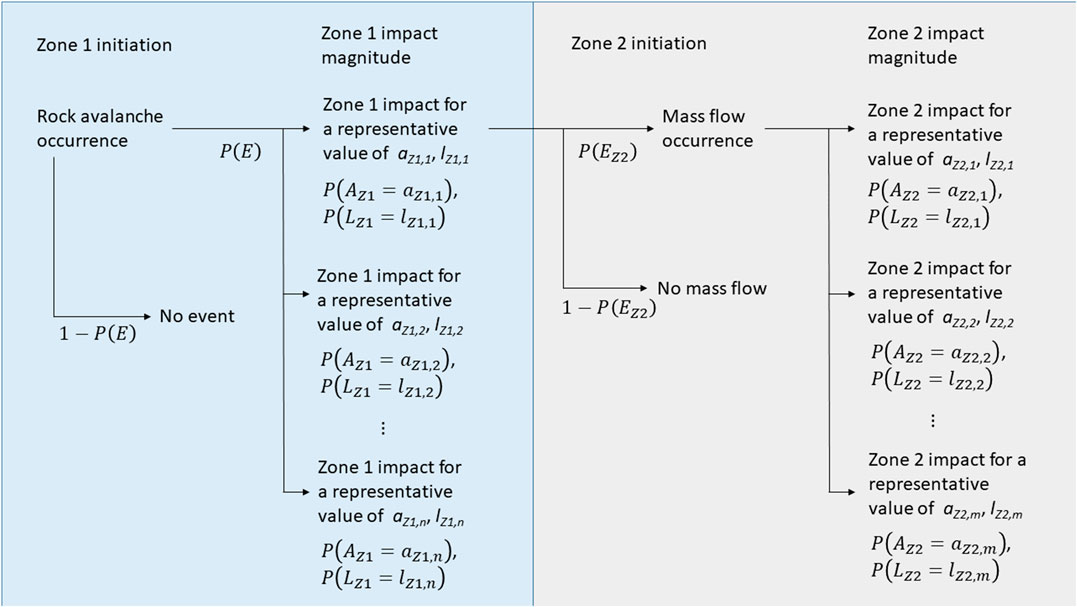
FIGURE 7. Event tree for the estimation of Zone 2 impact area magnitudes. Note that only the top branch of the event tree is expanded. Terms shown are defined in the text.
The event tree analysis requires the values of Zone 1 and Zone 2 impact areas (AZ1 and AZ2) span the range of potential outcomes. The range of potential areas can be binned so each representative value, aZ1,i and aZ2,j is within one of the bins. For each of the n × m branches of the event tree shown in Figure 7, given a failure volume, v, and a runout path that encounters sediments, the probability of a certain representative Zone 2 impact area, aZ2, being within a range of Zone 2 areas is:
where P(E) is the probability of a rock avalanche event with a volume of V = v occurring; P(aZ1,i|E) is the probability of a certain Zone 1 impact area, aZ1,i being within the range of the ith bin of the plausible range of Zone 1 impact areas, given the rock avalanche occurs; P(EZ2|E, aZ1) is the probability of a mass flow occurring given the rock avalanche occurs and has a certain value of aZ1; and, P(aZ2,j|E, aZ1,i, EZ2) is the probability of a certain Zone 2 impact area, aZ2,j, being within the range of the jth bin of the plausible range of Zone 2 impact areas, given the rock avalanche occurs and has a certain value of aZ1, and given a mass flow occurs.
An equivalent formulation for the probability of a certain Zone 2 runout distance, lZ2, can be made by substituting lZ1 and lZ2 for all values of aZ1 and aZ2 in Equation 1. The choice of the number of representative values for the areas and lengths at which probabilities are estimated will depend on the desired granularity of the analysis, with more values providing more refined estimates, at the expense of increasing the number of branches on the event tree. The choice of values may also be informed by the locations of elements at risk (e.g., refining the estimates where smaller changes in runout length and impact area have a greater effect on the risk).
The methods used to estimate the above terms, with the exception of P(E), are given in the following section.
Statistical Methods
The approach taken in this study is to work from an estimate of the Zone 1 impact area to estimate the potential Zone 2 impact area. The estimates of Zone 1 impacts are made using multiple linear regression of the dataset. The linear regression on a logarithmic transform of the variables is equivalent to a power law, which is consistent with previous research on rock avalanche impact area (e.g., Li, 1983; Hungr and Evans, 1993; Griswold and Iverson, 2008). The regression model for the Zone 1 impact area is:
where AZ1, HZ1 are the Zone 1 total impact area and fall height, respectively; V is the event volume, in 106 m3; β0, β1, β2 are the regression coefficients; and, ε is the error term, assumed to be normally distributed with zero mean, ε ∼ N(0, σ2).
The runout length is also estimated using multiple linear regression of the dataset. The path topography in the Zone 1 area was considered as an indicator variable, consistent with Mitchell et al. (2020). The regression model for Zone 1 runout is:
Where: LZ1 is the Zone 1 runout length; C is an indicator variable with a value of 1 if the Zone 1 path topography is laterally confined, 0 otherwise; and, All other terms are as defined before.
For hazard and risk assessment purposes, it is often useful to calculate runout exceedance probabilities (either as a runout length or an impact area). This can be achieved by expressing the results of the multiple linear regression in the form of survival functions. Assuming that the models in Eqs 2 and 3 capture the range of potential outcomes of future events, and using the normally distributed error term, ε, the linear regressions can be rearranged as:
Where:
The probability of a certain representative value of Zone 1 impact area or runout length, e.g., P(aZ1,i|E) in Eq. 1, can be found by calculating the difference between the probability of exceedance for the minimum and maximum value of the bin in which the representative value belongs. For example, if a Zone 1 impact area of 150,000 m2 is selected as the representative value for the range from 100,000 to 200,000 m2, then P(aZ1 = 150,000|E) = P(AZ1≥ 100,000|…) − P(AZ1≥ 200,000|…).
The next consideration is whether or not a rock avalanche-generated mass flow will occur. As part of compiling the dataset for this study, a literature review was conducted to find cases of rock avalanches that likely encountered sediments during the time in which we have high quality satellite imagery, to evaluate the surface conditions post-event. As a preliminary estimate of the probability of mass flow occurrence,
The estimates of
Where: λ is the scale parameter.
This equation can also be expressed as a survival function (Liu, 2012), which provides the probability of a ratio of Zone 2 to Zone 1 area, AZ1/AZ2, exceeding a given value, aZ2/aZ1. The survival function has the form:
Estimates for the Zone 2 runout distance can be obtained by substituting LZ1, LZ2, lZ1 and lZ2 for all AZ1, AZ2, aZ1 and aZ2 in 6 and 7.
As with the Zone 1 impact estimation, the probability of a certain representative value can be estimated by calculating the difference between the minimum and maximum value of the bin in which the representative value belongs.
Results
Dataset
Zone 1 and Zone 2 impacts were mapped, and descriptive attributes were assigned to 32 cases. A summary of the quantitative attributes is provided in Table 2. The complete dataset with measurements and attributes for all events is included as Supplementary Material. Additional references and data sources for each event are also provided in the Supplementary Material, and shapefiles for each of the mapped deposits are available through the DesignSafe-CI repository (https://www.designsafe-ci.org/data/browser/public/designsafe.storage.published//PRJ-2830).
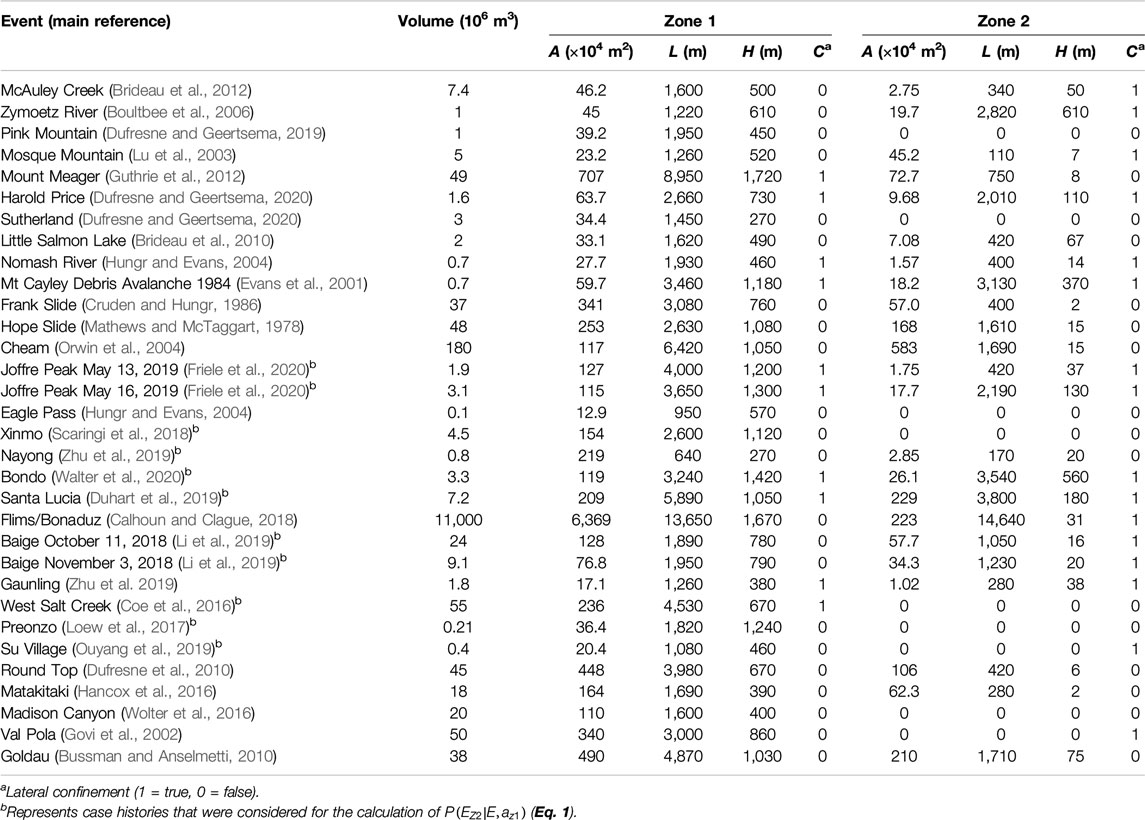
TABLE 2. Summary of case histories.
The spatial extents of Zone 2 impacts vary widely, with impact areas ranging from unobservable at scale of imagery available to 2.23 m2 × 107 m2, and runout lengths up to 14,600 m. In one case (Santa Lucia) the Zone 2 impact area exceeds the Zone 1 impact, and in three cases (Zymoetz River, Bondo, and Flims) the Zone 2 runout length exceeds the Zone 1 runout. These observations highlight how considering only the impacts within Zone 1 could significantly underestimate the spatial extent of the hazard associated with a rock avalanche.
Statistical Analysis
The linear regression results for Zone 1 impact area and runout length are summarized in Table 3. The multiple linear regression for area predicted from volume and fall height (Figure 8A) shows a stronger association relative to the regression only using volume as the predictor, so the multiple linear regression results are used in the following analysis. The regression model for the Zone 1 runout distance (Figure 8B) shows a strong association between the runout distance, volume, fall height and whether or not the topography is laterally confined. These results are consistent with those reported in Mitchell et al. (2020). The effect of topographic confinement on the Zone 1 impact area was tested, but the uncertainty on the estimate was too high to be used for the regression equation (see Supplementary Material).
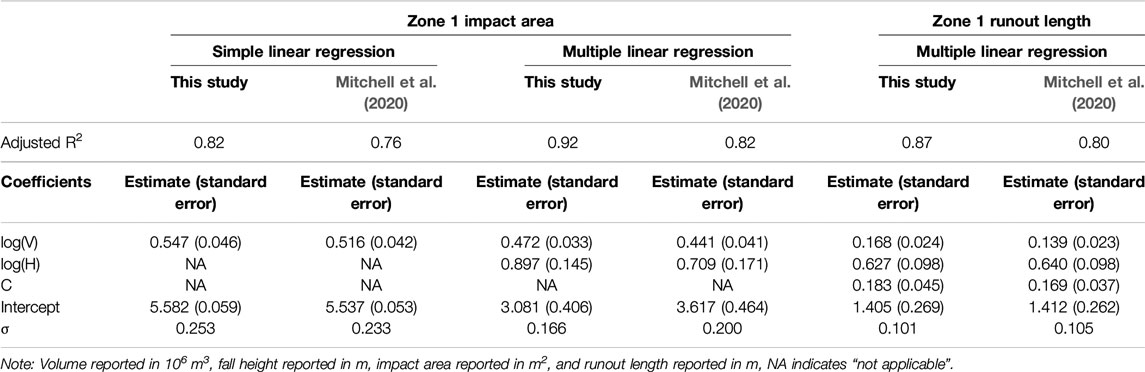
TABLE 3. Regression summary for Zone 1 impact area and runout and comparison to the estimates from Mitchell et al. (2020).
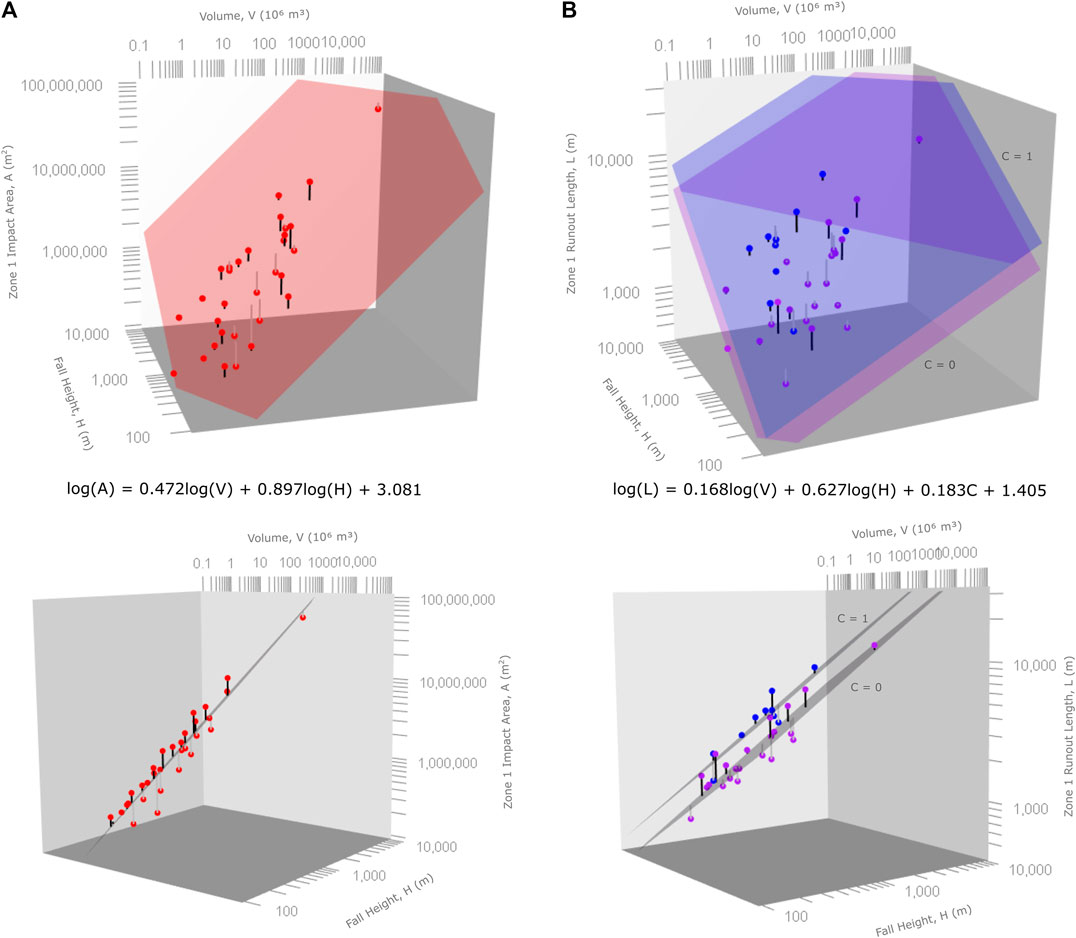
FIGURE 8. Regression plots for (A) Zone 1 total impact area as a function of volume and fall height, plotted to show the variation in the measurements (top), and rotated to show the magnitude of the residuals (bottom), and (B) Zone 1 runout length as a function of volume, fall height, and lateral confinement, where C = 1 denotes laterally confined and C = 0 denotes laterally unconfined path topography, plotted to show the variation in the measurements (top), and rotated to show the magnitude of the residuals (bottom).
In the rock avalanche dataset, 13 events that ran out over sediment deposits were identified since 2010 that have satellite imagery and event descriptions (cases marked b in Table 2). These events were used for the preliminary assessment of the probability of a rock avalanche generating a mass flow of sediment,
The ratios of Zone 2 area to Zone 1 area and Zone 2 runout length to Zone 1 runout length were calculated for all cases where a Zone 2 impact was mapped. The ratios between Zone 2 and Zone 1 impact areas range from 0.01 to 1.1, and the runout length ratios range from 0.08 to 2.3 (Figure 9). An exponential function was fitted to the data for the impact area and runout length ratios. Results of the KS tests are included in the Supplementary Material to confirm the applicability of the exponential function. The exponential survival functions of the Zone 2 to Zone 1 relationships are shown in Figures 9A,B for the impact area and runout length ratios, respectively. The calculated probabilities for the distributions fitted to the data are relatively insensitive to the choice of distribution, except for small Zone 2/Zone 1 ratios. An exponential distribution has been used at this time as it is the simplest distribution that fits the data, and exponential distributions have been used previously to represent other natural geological processes/features, such as bed thickness (Straub et al., 2012) and joint spacing (Rives et al., 1992). As new data are added to this dataset in the future, the choice of distribution should be re-examined.
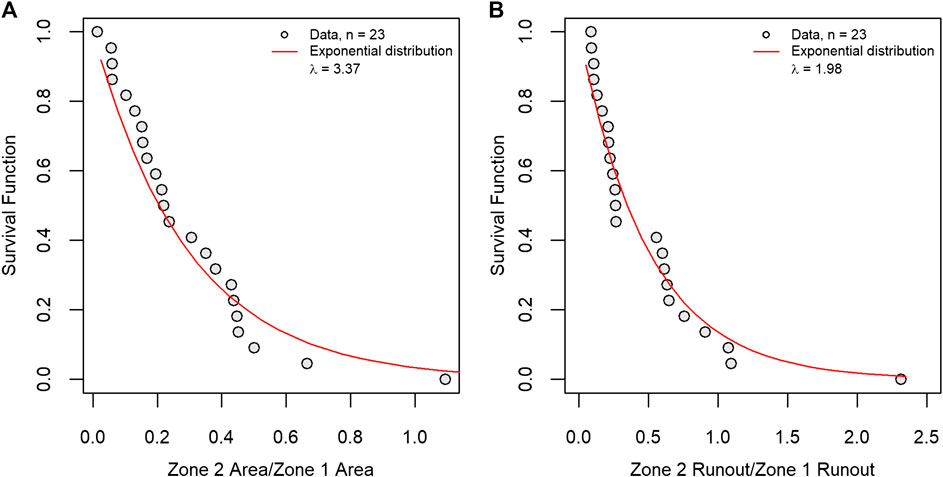
FIGURE 9. (A) Relationship between Zone 2 and Zone 1 areas for events where a mass flow was observed, and survival function for the Zone 2 over Zone 1 areas, (B) relationship between Zone 2 and Zone 1 runout distance for events where a mass flow was observed, and survival function for the Zone 2 over Zone 1 runout lengths.
The data were also used to examine the potential effects of the descriptive topographic attributes on the Zone 2 impact area and runout distance. No strong associations could be found between the topography and either the impact area or runout distance within this dataset, however the number of data are limited (n = 14 and n = 9 for laterally confined and unconfined topography, respectively), and as such these results should be treated with caution. Details of the statistical comparisons are provided in the Supplementary Material, along with a cross validation to determine if any single case significantly affects the fitted distributions. As new data are added to the dataset it may be possible to fit separate distributions based on the descriptive attributes.
Hypothetical Example
The application of the methodology presented in this paper for predicting potential impact areas is demonstrated here using a hypothetical case. The same case, a hypothetical rock avalanche site in Canada, was used for a numerical runout model benchmarking exercise in 2018 (Pastor et al., 2018). The potential rock avalanche scenario modeled had a volume of 8.3 m3 × 106 m3, the relief between the crest of the source zone and the valley bottom is approximately 1,380 m, and the valley bottom has potentially saturated fluvial and glaciofluvial deposits (Pastor et al., 2018).
The probabilities of the Zone 1 impact area of the event exceeding any value in a range of plausible impact areas were estimated using Eq. 4, the coefficients from Table 3, and the volume and fall height given above. Estimates of the probability of exceedance associated with a range of Zone 1 areas are shown in Figure 10A. From this information, representative values of the Zone 1 impact area can be selected, for example, points B, C, and D on Figure 10A, and using Eq. 7, the probability of exceedance for the Zone 2 impact areas associated with these representative Zone 1 impact areas can be estimated (Figures 10B–D).
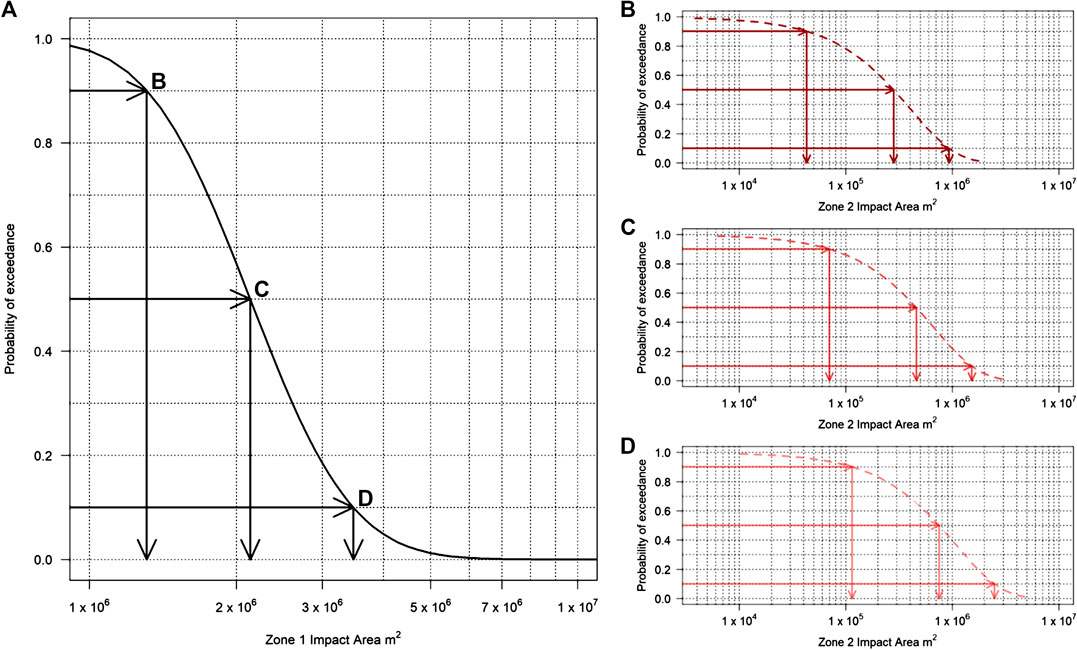
FIGURE 10. Estimated probabilities of exceedance for a range of potential Zone 1 and Zone 2 impact areas for the hypothetical case, where points B, C, and D indicate representative Zone 1 impact areas for which Zone 2 impacts are estimated.
The estimates shown in Figure 10 can be used with the decision tree shown in Figure 7 to calculate the probabilities of each Zone 1 and Zone 2 impact area scenario. For demonstration purposes, a conservative assumption can be made that the probability of the rock avalanche occurring and the probability of a mass flow being generated are 1. If the values for the Zone 1 and Zone 2 impact areas at the 0.9, 0.5 and 0.1 probability of exceedance levels shown in Figure 10 are used as representative values for events with probabilities within the ranges of 1–0.8, 0.8–0.2, and 0.2–0, respectively, probabilities can be calculated for each branch on the decision tree, as shown in Table 4.
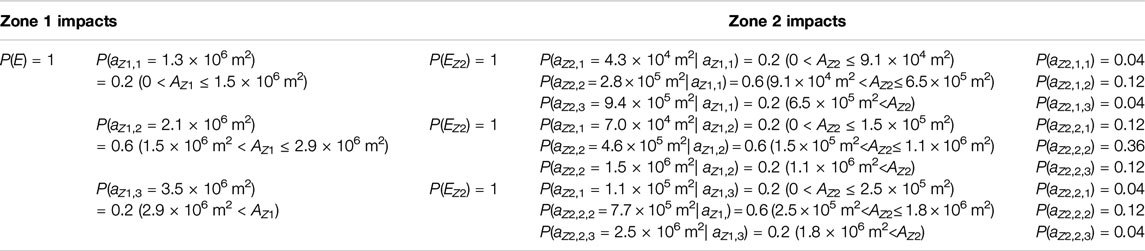
TABLE 4. Summary of event tree calculation. Ranges of values corresponding to each representative value are given in brackets.
The estimated areas shown in Table 4 can be mapped onto the topography by using the calculated representative values and by estimating the deposit width based on a geomorphic interpretation of the runout path. For example, considering the branch ending at aZ2,2,2 in Table 4, the predicted Zone 1 area is 2.1 m2 × 106 m2. Since the topography below the source area is primarily unconfined, one can infer the deposit will spread laterally from the source, however a ridge along the upper part of the path on the west side of the travel path would limit spreading in that direction. For the purpose of this example, it was assumed that the widest point on the deposit would be approximately 50% greater than the source width, and the downslope end of the deposit would form a semi-circle, as shown in Figure 11A. For the prediction of potential Zone 2 impacts, a key question would be whether or not the flow could become channelized. Although the Zone 2 data could not be grouped by confined or unconfined cases (i.e., the topography was not a good predictor of the total Zone 2 impact area), the distribution of that area could vary substantially. For example, continuing along the branch ending at aZ2,2,2 in Table 4, if the predicted Zone 2 impact area of 4.6 m2 × 105 m2 is distributed as a radial fringe around an approximately 1.2 km distance along the floodplain (Figure 11A), it would map as a 300 m wide area. Conversely, if the flow were to follow the approximately 70 m–200 m wide river (flowing to the right on Figure 11A), the impact area would extend approximately 4 km downstream (flowing beyond the extents of the topography shown in Figure 11A).
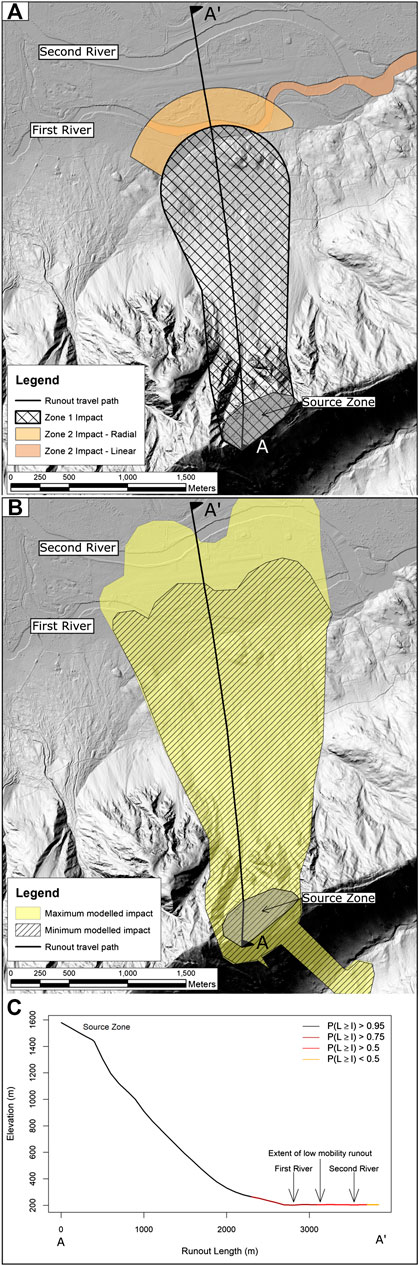
FIGURE 11. (A) Interpreted Zone 1 and Zone 2 impact areas, with alternative Zone 2 impact areas considering radial or linear cases. (B) Topography of potential rock avalanche area with the maximum and minimum mobility cases from numerical modeling (Mitchell et al., 2018) and (C) the runout profile used for the empirical analysis, showing the probability of runout exceedance results along the travel path.
Another application of these predictions is in the evaluation of numerical model results. This hypothetical benchmarking example was modeled using the Dan3D numerical model (Mitchell et al., 2018). The model was run using a range of rheological parameters sampled from a dataset of back-analyzed cases to represent a range of potential mobilities (Aaron and McDougall, 2019). The predicted impact areas from these model runs, shown in Figure 11B ranged from 4.1 m2 × 106 m2 to 5.2 × 10⁶ m2 (Mitchell et al., 2018). These areas correspond to probabilities of exceedance of 0.04 and 0.01, respectively, for the Zone 1 impact area using Equation 4. The impact area near the source was also greater than would be expected due to the assumption of the slide mass instantaneously fluidizing, leading to rapid spreading and some of the material descending into a neighboring valley, also increasing the modeled impact area.
The prediction of the Zone 1 runout length (Figure 11C) shows the probability of the event reaching the end of the “low mobility” numerical model result being approximately 0.7, and the probability of the event reaching the “high mobility” numerical model result being approximately 0.4. These probabilities are significantly higher than those from the area prediction, which is interpreted to be related to the fact that this hypothetical case study had an anomalously large fall height for a case without topographic confinement, compared to the other cases in the database. This issue is examined further in the Summary and Discussion section.
Summary and Discussion
The spatial extents of impacts from rock avalanches can be amplified by mass flows of sediments along their travel path. These mass flows tend to have a finer texture than the deposit from the initial rock slope failure, so the evidence of their impacts is generally not as well preserved in the geomorphic and stratigraphic record (e.g., Figure 2). The impacts of these mass flows have not always been rigorously documented in the literature, and a consistent set of terminology and descriptive attributes has not been used to describe them. We have introduced a three-zone system to classify the different types of impacts resulting from a rock avalanche. Zone 1 refers to coarse rocky, debris, Zone 2 refers to mass flows associated with the immediate impact from the rock avalanche, and Zone 3 refers to impacts associated with a rock avalanche, but not generated directly from the impact, such as the formation of landslide dammed lakes or downstream channel aggradation/erosion as a result of the rock avalanche. The definition of a distinct mass flow impact area is a unique feature of this system, and the three-zone system provides the basis for the general rock avalanche hazard assessment system we propose. This work is complementary to recent work on landslide dams (a Zone 3 impact in our classification system), where researchers have described global datasets of landslide dams with consistent attributes (Fan et al., 2020; Oppikofer et al., 2020).
One of the outcomes of this study is a preliminary estimate of the likelihood of a sediment mass flow occurring. Sediment mass flows were generated in 9 of 13 cases from the post-2010 dataset, but given the limited size of this subset of cases, this preliminary result should be treated with caution. More generally, mass flow events of sediment, water or snow/ice are shown in Figure 1 as distinct branches, however, these phenomena exist on a spectrum, with events potentially running out over multiple path materials (e.g., relatively small amounts of snow in the Hope Slide event, as described by Mathews and McTaggart, 1978), or multiple hazards occurring in a chain (e.g., the mass flow of the Goldau rock avalanche triggering a displacement wave in Lake Lauerz, as described by Bussman and Anselmetti, 2010). Within the hazard assessment framework proposed in this paper, the occurrence of a mass flow is assumed to be binary (Eq. 1). This may in reality be a more nuanced factor, where the degree of saturation, available surface or ground water, and velocity of the rock avalanche debris may result in substantial material entrainment and transformation into a mass flow (e.g., Hungr and Evans, 2004). The effect of slide impact velocity, a key consideration for the formation of landslide-generated impulse waves (e.g., Heller and Hager, 2010; Evers et al., 2019), is another potential area of future investigation. Other factors that could be investigated further are the depth of sediments (analogous to the still water depth for landslide-generated impulse waves, e.g., Heller and Hager, 2010) and the geotechnical properties of the sediment. Future work involving numerical modeling (e.g., Crosta et al., 2009) or physical modeling (e.g., Steers, 2018; Furuya et al., 2019) could help to better understand the mechanics of this process, and what distinguishes events without entrainment, with entrainment, and with entrainment and generation of a mass flow. The insights on physical controls for mass flow generation from physical and numerical modeling could help guide future field investigations by highlighting key information to be gathered in the field.
A classification system for the description of the Zone 2 impact area, which results from sediment mass flows, is proposed based on imagery, topography and field mapping (Table 1). This allows for a consistent mapping methodology to be applied across all cases. The attributes chosen to describe the events are meant to be simple, yet provide a meaningful division of the events. One challenge with this approach is determining a “representative” descriptor for each event, as there may be multiple descriptors that are applicable. For example, there were elements of confined and unconfined topography in the Hope Slide case, meaning judgment was required to determine which descriptor was most applicable to that case. As it will often be the case that multiple descriptors could apply, this application of judgment will be required by landslide practitioners.
Modern satellite imagery presents an opportunity to map future events systematically and track the changes within the different impact zones over time. With this approach, there are limitations to what can be seen from aerial or satellite imagery. This issue was highlighted by the 2019 Joffre Peak case described by Friele et al. (2020), in which the extent of the Zone 2 area estimated from the post-event PlanetScope ortho imagery was different from that observed during field mapping. This discrepancy was because there were areas where the mass flow of saturated sediments and organic material did not entirely remove the trees present in the impact area, meaning the full impact could not be observed clearly in the satellite images. This also demonstrates the variability in the intensity of Zone 2 impacts; whereas the vulnerability of an element at risk to a Zone 1 impact is generally assumed to be 1, the impact intensity may be more relevant to Zone 2 impacts. It is possible that mass flows were generated in more cases than reported here, however, the areal extent of the impacts was not observable with the resolution of imagery available (generally 3–5 m pixel sizes for satellite imagery). Hyperconcentrated flows that remain confined within a channel downstream of the Zone 1 and/or Zone 2 impact areas are especially challenging to identify from imagery. The methods for predicting Zone 2 impacts in this paper are relevant for impacts on the order of tens of meters or greater. The 2017 Bondo event highlights the limitations on the temporal resolution of this data, with several events occurring in quick succession following the main rock avalanche (Walter et al., 2020). The deposit area mapped from the first clear imagery following the event is in fact the accumulation of several events, meaning in this case we have somewhat over-estimated the Zone 2 impact area.
All cases were used to fit regression models to the observations of Zone 1 total impact area and runout length. The resulting regression models were consistent with the regression models for a dataset of 51 rock avalanches from the Canadian Cordillera (Mitchell et al., 2020). It should be noted that 14 of the cases included in the present dataset were also included in the Mitchell et al. (2020) dataset, however, the fact that the cases added for this analysis did not cause a statistically significant change in the regression coefficients (see Table 3) suggests that the regression methodology is generally applicable to rock avalanche runout. The relationship between total impacted area and debris volume found for this dataset (Table 3) shows a positive correlation with a strong linear association. The slope of the best-fit regression line for the simple area-volume relationship differs from previously published relationships that assume a slope of 2/3 for the regression analysis (based on geometric scaling relationships described by Hungr and Evans (1993) and Griswold and Iverson (2008). However, the geometric scaling relationships were developed using the deposit area as opposed to the total impacted area used in this study and, as a result, the assumptions used for the geometric scaling are not valid in the present case. Adding fall height as an additional independent predictor variable produced a stronger statistical relationship (Eq. 2; Table 3), consistent with the relationship for runout length.
Zone 2 impact areas were related to the Zone 1 impact areas for the statistical analysis using exponential functions fitted to the ratios of Zone 2 to Zone 1 impact area and runout length. With the data available, the descriptive attributes were not found to have a strong effect on the relationships, which may be in part due to the limited size of the dataset. Additional well constrained cases, especially cases that have well described substrate conditions, may allow for more refined predictions using more attributes. With additional well described case histories both the choice of distribution, and the potential to fit separate distributions for subsets of the dataset to incorporate descriptive attributes, should be re-examined. This is consistent with the findings of Mitchell et al. (2020), where the Zone 1 runout length was not found to be strongly influenced by substrate type, but more data may allow for these weaker effects to be quantified.
The application of the empirical runout prediction methods here requires geomorphic interpretation of the potential travel path for a rock avalanche and mass flow. To estimate the Zone 1 impacts, features such as topographic confinement, ridges or other barriers to flow need to be considered when selecting flow paths and expected deposit distributions for a given area estimate. Geomorphic mapping will also be required to evaluate if sediments are present to potentially form a mass flow. The analysis shown in Figure 10 assumes a mass flow could occur at any of the representative values for the Zone 1 area estimates, however, evaluation of the potential travel path may reveal a minimum Zone 1 impact before a substantial volume of sediments would be encountered. Even in the absence of a strong statistical association between the Zone 2 confinement and impact area or runout length, the potential for a mass flow to have elements of confinement, even in generally unconfined topography, should be considered in a forward analysis. In the hypothetical example presented, when considering the spatial extent of the impacts, a practitioner would likely consider both a potential radial impact onto the flood plain and a linear impact following the river channel, and recognize that even if the impact zone is primarily radial, there could be downstream impacts extending kilometers beyond the distal end of the coarse, rocky debris, as an intermediate case between those shown on Figure 11A.
The potential for flooding resulting from a landslide dam, the potential for the breach of that dam (e.g., Fan et al., 2020; Oppikoffer et al., 2020), and downstream river bed aggradation/erosion could also be expected, and would result in a Zone 3 impact area.
The empirical-statistical analysis presented in this paper can also be used to evaluate numerical modeling results. The predictions from numerical models are subject to three main sources of uncertainty: the simplifications in the representation of the physical processes that are inherent in the model, errors in measurements of properties used for model definition or calibration, and the uncertainty regarding the parameters used in the model. One application of the empirical analysis presented here is evaluating the plausibility of sets of model parameters, considering the limitations of both the empirical and numerical analyses, for example, the calibration cases used for the regression and numerical models and the effects of model assumptions (e.g., instantaneous fluidization) on the results. Coupling the empirical and numerical analysis can also help constrain some of the uncertainties around the analyses. The empirical runout predictions for the hypothetical example suggest that the runout distance could be plausibly much further than the numerical model results indicate, however, the impact area estimates suggest that the numerical model results indicate cases with a low probability of exceedance. Our interpretation is that the combination of the high valley relief joining a low angle floodplain is unusual relative to the cases included in the dataset; most cases with similar fall heights entered more confined, gently sloping valleys, leading to narrower, longer deposits (e.g., Mount Meager, Joffre Peak, Bondo; Table 2). The numerical modeling helps by explicitly considering the 3D topography in the model to simulate the energy loss and spreading when the material encounters the valley bottom. It also provides insights on the likelihood of the flow becoming channelized. In this case, with the low incision of the rivers and the nearly 90° angle at which the flow intersects them, the presence of the rivers does little to affect the direction of the flow, which could lead to a higher likelihood being assigned to a radial impact as opposed to a linear one. The interpretation required to assess and synthesize the results of these analyses again highlights the continued importance of sound professional judgment.
Finally, it should be noted that the first term in Eq. 1, the probability of a rock avalanche occurring, is likely the biggest source of uncertainty in the entire hazard assessment framework presented (e.g., Oppikofer et al., 2018). This study has not addressed that uncertainty, and it remains an extremely important area for future research.
Conclusions
The potential for rock avalanches to generate mass flows of sediments has been recognized for a long time, but quantitative methods to estimate the impacts of these events have been lacking. We have proposed a methodology for consistently describing rock avalanches and the mass flows resulting from them, and compiled a dataset using the new methodology. The compiled data show that the impacts from mass sediment flows can have an even greater extent than the area impacted by coarse, rocky debris. The impact zone definitions presented in this work provide a framework for the consistent description and cataloging of rock avalanche events, particularly those that result in mass flows of sediment. Physical and numerical modeling may provide additional insights on the controlling factors for mass flow generation, which would in turn help guide refinements to the descriptive attributes defined in this study. Describing future events in a similarly consistent manner will allow for more refined estimates of the impact probabilities, and potentially reveal the effects of the qualitative factors. The development of a universal database of rock avalanche case histories is therefore an important subject of ongoing work.
A probabilistic hazard assessment framework has been presented and preliminary statistical relationships have been developed for the quantitative, probabilistic prediction of rock avalanche-generated mass flow likelihood, impact areas and runout distances. We propose survival functions developed from multiple linear regression for predicting Zone 1 impact areas and runout lengths, and survival functions developed from exponential distributions to predict the Zone 2 impact areas and runout lengths associated with a given Zone 1 prediction. The methodology uses an event tree approach to discretize the continuous survival functions associated with Zone 1 and Zone 2 impact areas to provide predictions that span the range of plausible impact areas for an event, while discrete predictions can be used to produce hazard area estimates or compare to numerical runout model results. The application of these relationships is appropriate for high-level screening exercises, and professional judgment is required in defining scenarios to be examined, such as when to consider potential channelized or unconfined flows. Future research will also be required to better define the probability of a rock avalanche occurring, as opposed to ongoing slow deformation or a rockslide that does not fail en masse, after a potential source zone is identified.
Data Availability Statement
All datasets presented in this study are included in the article/Supplementary Material. The mapping datasets generated for this study can be in the DesignSafe-CI repository: https://www.designsafe-ci.org/data/browser/public/designsafe.storage.published/PRJ-2830.
Author Contributions
AM led the preparation of the study, including compiling the dataset, developing the hazard assessment framework, developing and performing the statistical analysis, performing the hypothetical analysis, and drafting the manuscript. SM conceived the study and assisted with literature review and drafting the manuscript. JA assisted with compiling the dataset, developing the hazard assessment framework and statistical analysis, and drafting the manuscript. MB assisted with compiling the dataset, developing the hazard assessment framework, and drafting the manuscript.
Funding
We acknowledge the support of the Natural Sciences and Engineering Research Council of Canada (NSERC), funding reference number PGSD3—516701–2018.
Conflict of Interest
MB is employed by Westrek Geotechnical Services Ltd.
The remaining authors declare that the research was conducted in the absence of any commercial or financial relationships that could be construed as a potential conflict of interest.
The reviewer TO declared a past co-authorship with one of the authors MB to the handling Editor.
Acknowledgments
The authors would like to acknowledge the assistance of Natalia Nolde in reviewing the statistical methods section. We would also like to thank Scott Cosman and the BC Ministry of Transportation and Infrastructure for providing lidar data and imagery from the Hope Slide, and Réjean Couture and Scott Paddington for providing photos of the McAuley Creek rock avalanche. The authors have also benefited from conversations with Matthias Jakob and Matthieu Sturzenegger on the subjects discussed in this paper. The authors would also like to thank two reviewers whose constructive comments have improved the quality of the final manuscript.
Supplementary Material
The Supplementary Material for this article can be found online at: https://www.frontiersin.org/articles/10.3389/feart.2020.543937/full#supplementary-material
References
Aaron, J., and McDougall, S. (2019). Rock avalanche mobility: the role of path material. Eng. Geol. 257, 105126. doi:10.1016/j.enggeo.2019.05.003
Abele, G. (1997). Rockslide movement supported by the mobilization of groundwater-saturated valley floor sediments. Z. Geomorphol. 41 (1), 1–20.
Boultbee, N., Stead, D., Schwab, J., and Geertsema, M. (2006). The Zymoetz River rock avalanche, June 2002, British Columbia, Canada. Eng. Geol. 83 (1), 76–93. doi:10.1016/j.enggeo.2005.06.038
Brideau, M.-A., McDougall, S., Stead, D., Evans, S. G., Couture, R., and Turner, K. (2012). Three-dimensional distinct element modelling and dynamic runout analysis of a landslide in gneissic rock, British Columbia, Canada. Bull. Eng. Geol. Environ. 71 (3), 467–486. doi:10.1007/s10064-012-0417-8
Brideau, M.-A., Stead, D., Lipovsky, P., Jaboyedoff, M., Hopkinson, C., Demuth, M., et al. (2010). “Preliminary description and slope stability analyses of the 2008 Little Salmon Lake and 2007 Mt. Steele landslides, Yukon,” in Yukon exploration and geology 2009. Editors K. E. MacFarlane, L. H. Weston, and L. R. Blackburn (Whitehorse, Canada: Yukon Geological Survey), 119–133.
Bussmann, F., and Anselmetti, F. S. (2010). Rossberg landslide history and flood chronology as recorded in Lake Lauerz sediments (Central Switzerland). Swiss J. Geosci. 103 (1), 43–59. doi:10.1007/s00015-010-0001-9
Calhoun, N. C., and Clague, J. J. (2018). Distinguishing between debris flows and hyperconcentrated flows: an example from the eastern Swiss Alps. Earth Surf. Process. Landforms 43 (6), 1280–1294. doi:10.1002/esp.4313
Coe, J., Baum, R. L., Allstadt, K. E., Kochevar, B. F., Schmitt, R. G., Morgan, M., et al. (2016). Rock-avalanche dynamics revealed by large-scale field mapping and seismic signals at a highly mobile avalanche in the West Salt Creek valley, western Colorado. Geosphere 12 (2), 604–631. doi:10.1130/ges01265.1
Crosta, G. B., Imposimato, S., and Roddeman, D. (2009). Numerical modelling of entrainment/deposition in rock and debris-avalanches. Eng. Geol. 109 (1–2), 135–145. doi:10.1016/j.enggeo.2008.10.004
Cruden, D. M., and Hungr, O. (1986). The debris of the Frank Slide and theories of rockslide-avalanche mobility. Can. J. Earth Sci. 23 (3), 425–432. doi:10.1139/e86-044
Dufresne, A., Davies, T., and McSaveney, M. J. (2010). Influence of runout-path material on emplacement of the round top rock avalanche, New Zealand. Earth Surf. Process. Landforms 35 (2), 190–201. doi:10.1002/esp.1900.
Dufresne, A., and Geertsema, M. (2020). Rock slide-debris avalanches: flow transformation and hummock formation, examples from British Columbia. Landslides 17 (1), 15–32. doi:10.1007/s10346-019-01280-x
Duhart, P., Sepúlveda, V., Garrido, N., Mella, M., Quiroz, D., Fernández, J., et al. (2019). “The Santa Lucía landslide disaster, Chaitén-Chile: origin and effects,” in Proceedings of the 7th international conference on debris-flow hazards mitigation, Golden, CO, June 10–13, 2019 [abstract].
Evans, S. G., Delaney, K. B., Hermanns, R. L., Strom, A., and Scarascia-Mugnozza, G. (2011). “The formation and behaviour of natural and artificial rockslide dams; implications for engineering performance and hazard management,” in Natural and artificial rockslide dams. Editors S. G. Evans, R. L. Hermanns, A. Strom, and G. Scarascia-Mugnozza (Berlin, Heidelberg: Springer), Vol. 1–75.
Evans, S. G., Hungr, O., and Clague, J. J. (2001). Dynamics of the 1984 rock avalanche and associated distal debris flow on Mount Cayley, British Columbia, Canada; implications for landslide hazard assessment on dissected volcanoes. Eng. Geol. 61 (1), 29–51. doi:10.1016/s0013-7952(00)00118-6
Evers, F. M., Heller, V., Fuchs, H., Hager, W. H., and Boes, R. M. (2019). Landslide-generated impulse waves in reservoirs, basics and computation. 2nd Edn. Bern, Switzerland: Swiss Federal Office of Energy SFOE, VAW Mitteilung 254.
Fan, X., Dufresne, A., Siva Subramanian, S., Strom, A., Hermanns, R., Tacconi Stefanelli, C. et al.(2020). The formation and impact of landslide dams - state of the art. Earth Sci. Rev. 203, 103116. doi:10.1016/j.earscirev.2020.103116
Friele, P., Millard, T. H., Mitchell, A., Allstadt, K. E., Menounos, B., Geertsema, M. et al.(2020). Observations on the May 2019 Joffre Peak landslides, British Columbia. Landslides 17 (4), 913–930. doi:10.1007/s10346-019-01332-2.
Furuya, G., Hasegawa, M., and Wang, G. (2019). “Experimental study on squeezing-out phenomenon by landslide mass loading,” in Proceedings of the 4th regional symposium on landslides in the adriatic-Balkan region, Sarajevo, Bosnia, October 23–25 2019, Paper 31.
Govi, M., Gullà, G., and Nicoletti, P. G. (2002). “Val pola rock avalanche of July 28, 1987, valtellina (Central Italian Alps),” in Catastrophic landslides: effects, occurrence, and mechanisms. Editors S.G. Evans and J.V. DeGraff (Boulder, Colorado: Geological Society of America), Vol. 15, 71–89.
Griswold, J. P., and Iverson, R. M., (2008). Report 2007-5276. Mobility statistics and automated hazard mapping for debris flows and rock avalanches (version 1.1. April 2014): U.S. Reston, VA: Geological Survey Scientific Investigation.
Guthrie, R. H., Friele, P., Allstadt, K., Roberts, N., Evans, S. G., Delaney, K. B., et al. (2012). The 6 August 2010 Mount Meager rock slide-debris flow, Coast Mountains, British Columbia: characteristics, dynamics, and implications for hazard and risk assessment. Nat. Hazards Earth Syst. Sci. 12 (5), 1277–1294. doi:10.5194/nhess-12-1277-2012
Hancox, G. T., Ries, W. F., Parker, R. N., and Rosser, B. (2016). Science Report 2015/042. Landslides caused by the MS 7.8 Murchison earthquake of 17 June 1929 in northwest south island, New Zealand. GNS science, Te pu Ao.
Heim, A. (1932). Landslides and human lives (Bergstürz and menschenleben), Translated by: Skermer, N. Vancouver, Canada: Bi-Tech Publishers.
Heller, V., and Hager, W. H. (2010). Impulse product parameter in landslide generated impulse waves. J. Waterw. Port, Coast. Ocean Eng. 136 (3), 145–155. doi:10.1061/(asce)ww.1943-5460.0000037
Hermanns, R. L. (2013). “Rock avalanche (sturzstrom),” in Encyclopedia of natural hazards. Editor P. Bobrowsky, Dordrecht, Netherlands, Springer.
Hungr, O., and Evans, S. G. (2004). Entrainment of debris in rock avalanches: an analysis of a long run-out mechanism. Geol. Soc. Am. Bull. 116 (9), 1240–1252. doi:10.1130/b25362.1
Hungr, O., and Evans, S. (1993). Geological survey of Canada open file report 2598. The failure behavior of large rockslides in mountainous regions.
Hungr, O., Leroueil, S., and Picarelli, L. (2014). The Varnes classification of landslide types, an update. Landslides 11 (2), 167–194. doi:10.1007/s10346-013-0436-y
Li, H.-b., Qi, S.-c., Chen, H., Liao, H.-m., Cui, Y.-f., and Zhou, J.-w. (2019). Mass movement and formation process analysis of the two sequential landslide dam events in Jinsha River, Southwest China. Landslides, 16 (11), 2247–2258. doi:10.1007/s10346-019-01254-z
Li, T. (1983). A mathematical model for predicting the extent of a major rockfall. Z. Geomorphol. 24, 473–482.
Loew, S., Gschwind, S., Gischig, V., Keller-Signer, A., and Valenti, G. (2017). Monitoring and early warning of the 2012 Preonzo catastrophic rockslope failure. Landslides 14 (1): 141–154. doi:10.1007/s10346-016-0701-y
Lu, Z., Rollerson, T., and Geertsema, M. (2003). “The mosque mountain rockslide, sustut watershed,” in 3rd Canadian Conference on Geotechnique and Natural Hazards, Northern British Columbia, Canada, June 8–10, 2003, 325.
Mathews, W. H., and McTaggart, K. C. (1978). “Hope rockslides, British Columbia, Canada,” in Rockslides and avalanches, volume 1 natural phenomena. Developments in Geotechnical Engineering. Editor B. Voight (New York, NY: Elsevier), Vol. 14, 259–275.
McConnell, R. G., and Brock, R. W. (1904). “Report on the great landslide at Frank, Alberta,” in Part VIII, annual report, 1903, department of the interior dominion of Canada, Study Edition. Editor D.M. Cruden (Edmonton, Canada: Edmonton Geological Society).
McDougall, S. (2017). 2014 Canadian Geotechnical Colloquium: landslide runout analysis - current practice and challenges. Can. Geotech. J. 54 (5), 605–620. doi:10.1139/cgj-2016-0104
McDougall, S., and Hungr, O. (2005). Dynamic modelling of entrainment in rapid landslides. Can. Geotech. J. 42 (5): 1437–1448. doi:10.1139/t05-064
Mitchell, A., McDougall, S., Nolde, N., Brideau, M.-A., Whittall, J., and Aaron, J. B. (2020). Rock avalanche runout prediction using stochastic analysis of a regional dataset. Landslides 17 (4): 777–792. doi:10.1007/s10346-019-01331-3
Mitchell, A. D., McDougall, S. D., and Aaron, J. B. (2018). “Benchmarking exercise: Dan3D with objective calibration methods,” in Proceedings of the second JTC1 workshop, triggering and propagation of rapid flow-like landslides, Hong Kong, 3–5 December 2018. doi:10.5772/intechopen.75123
Oppikofer, T., Hermanns, R., Jaboyedoff, M., Brideau, M.-A., Jakob, M., and Sturzenegger, M. (2018). “Comparison between three rock slope hazard assessment methodologies using a case study from Norway,” in Proceedings of Geohazards 7 Conference. Canmore, Canada, 8, Paper 205.
Oppikofer, T., Hermanns, R., Jakobsen, V. U., Böhme, M., Nicolet, P., and Penna, I. (2020). Forecasting dam height and stability of dams formed by rock slope failures in Norway. Nat. Hazards Earth Syst. Sci. doi:10.5194/nhess-2020-135
Orwin, J. F., Clague, J. J., and Gerath, R. F. (2004). The cheam rock avalanche, fraser valley, British Columbia, Canada. Landslides 1 (4), 289–298. doi:10.1007/s10346-004-0036-y
Ouyang, C., An, H., Zhou, S., Wang, Z., Su, P., Wang, D., et al. (2019). Insights from the failure and dynamic characteristics of two sequential landslides at Baige village along the Jinsha River, China. Landslides 16 (7), 1397–1414. doi:10.1007/s10346-019-01177-9
Pastor, M., Soga, K., McDougall, S., and Kwan, J. S. H. (2018). “Review of benchmarking exercise on landslide runout analysis 2018,” in Proceedings of the second JTC1 workshop, triggering and propagation of rapid flow-like landslides, Hong Kong, 3–5 December 2018.
Planet (2020). “Planet application program interface,” in Space for life on earth. San Francisco, CA: Planet Labs.
R Core Team (2020). R: a language and environment for statistical computing, Vienna, Austria: R Foundation for Statistical Computing.
Rives, T., Razack, M., Petit, J.-P., and Rawnsley, K. D. (1992). Joint spacing: analogue and numerical simulations. J. Struct. Geol. 14 (8–9), 925–937. doi:10.1016/0191-8141(92)90024-q
Scaringi, G., Fan, X., Xu, Q., Liu, C., Ouyang, C., Domènech, G., et al. (2018). Some considerations on the use of numerical methods to simulate past landslides and possible new failures: the case of the recent Xinmo landslide (Sichuan, China). Landslides 15 (7), 1359–1375. doi:10.1007/s10346-018-0953-9
Steers, L. (2018). Static liquefaction of loose granular landslides. MSc thesis. Kingston (ON): Queen’s University.
Straub, K. M., Ganti, V., Paola, C., and Foufoula-Georgiou, E. (2012). Prevalence of exponential bed thickness distributions in the stratigraphic record: experiments and theory. J. Geophys. Res. 117 (F2): F020.3. doi:10.1029/2011JF002034.
Walter, F., Amann, F., Kos, A., Kenner, R., Phillips, M., de Preux, A., et al. (2020). Direct observations of a three million cubic meter rock-slope collapse with almost immediate initiation of ensuing debris flows. Geomorphology 351, 106933. doi:10.1016/j.geomorph.2019.106933
Wolter, A., Gischig, V., Stead, D., and Clague, J. J. (2016). Investigation of geomorphic and seismic effects on the 1959 Madison Canyon, Montana, landslide using an integrated field, engineering geomorphology mapping, and numerical modelling approach. Rock Mech. Rock Eng. 49 (6), 2479–2501. doi:10.1007/s00603-015-0889-5
Zhu, Y., Xu, S., Zhuang, Y., Dai, X., Lv, G., and Xing, A. (2019). Characteristics and runout behaviour of the disastrous 28 August 2017 rock avalanche in Nayong, Guizhou, China. Eng. Geol. 259, 105154. doi:10.1016/j.enggeo.2019.105154
Keywords: rock avalanche, runout, regression, stochastic prediction, mass flow, splash zone
Citation: Mitchell A, McDougall S, Aaron J and Brideau M-A (2020) Rock Avalanche-Generated Sediment Mass Flows: Definitions and Hazard. Front. Earth Sci. 8:543937. doi: 10.3389/feart.2020.543937
Received: 18 March 2020; Accepted: 31 August 2020;
Published: 30 September 2020.
Edited by:
Reginald Leonhard Hermanns, Geological Survey of Norway, NorwayReviewed by:
Thierry Oppikofer, Geological Survey of Norway, NorwayTim Davies, University of Canterbury, New Zealand
Copyright © 2020 Mitchell, McDougall, Aaron and Brideau. This is an open-access article distributed under the terms of the Creative Commons Attribution License (CC BY). The use, distribution or reproduction in other forums is permitted, provided the original author(s) and the copyright owner(s) are credited and that the original publication in this journal is cited, in accordance with accepted academic practice. No use, distribution or reproduction is permitted which does not comply with these terms.
*Correspondence: Andrew Mitchell, YW1pdGNoZWxsQGVvYXMudWJjLmNh