 Jie Zhang
 Zheng Sheng
 Yantong Ma
 Yang He1,2
- 1College of Meteorology and Oceanography, National University of Defense Technology, Changsha, China
- 2Collaborative Innovation Center on Forecast and Evaluation of Meteorological Disasters, Nanjing University of Information Science and Technology, Nanjing, China
There were continuous positive Arctic Oscillation index (AOI) and large-scale weather and climate anomalies in the Northern Hemisphere in the winter and spring of 2019/2020, and the relationship between these anomalies is an important issue for subseasonal to seasonal (S2S) predictability. This study shows that an AOI event with splitting characteristics occurred in the Northern Hemisphere and that there was a gap between the periods in event, which has not been observed in any of the 12 previous positive AOI events. The 3 stages of upward propagating planetary wave (UPPW) variation caused the gap between the periods. First, in early November, the westerly flow from the troposphere to the stratosphere weakened, resulting in persistent weak UPPWs that allowed a strong polar vortex to form. Then, the two strong UPPWs in January and early February caused the original westerlies to decelerate and induced warming in the lower stratosphere. However, the UPPWs caused only moderate changes in the geopotential height and temperature due to the strong polar vortex that had formed in the previous stage. This moderate AOI decline resulted in the conditions that divided the positive event into two periods. Finally, the low-level westerlies became stronger and strengthened the UPPWs into the stable stratosphere, which ended the second positive AOI period in late March. The role of zonal circulation anomalies (ZCA) in the upper stratosphere as metrics of and intermediates in UPPW-AO interactions is revealed in this study. The typical ZCA development mode was identified by statistical analysis and a composite treatment based on eight historical positive AOI events. In this mode, when strong UPPWs occur and lead to the consequent propagation of the ZCA from the stratosphere to the troposphere, the geopotential height field in the lower troposphere changes away from a typical AO mode; eventually, the AOI becomes abnormal. The temperature anomaly and ZCA produced in the two positive AOI periods during the winter and spring of 2019/2020 led to increasing precipitation in the eastern polar region, northern Asia, and areas along 60°N latitude.
Introduction
In the winter and spring of 2019/2020, the Northern Hemisphere stratospheric polar vortex was extremely strong, cold, and persistent, which led to record ozone depletion in the Arctic, abnormal warm weather in the midlatitudes, and the highest Arctic Oscillation index (AOI) in history. From January to March 2020, two strong positive AOI periods occurred (Kim et al., 2020; Lawrence et al., 2020), and the AOI reached its highest value in February, which led to a poleward shift in the zonal-average midlatitude jet, the shrinkage of the polar vortex region, and the strengthening of the polar vortex. These circulation and polar vortex anomalies had obvious impacts on the climate anomalies of the winter and spring of 2019/2020. As the results show, these two periods induced obvious precipitation anomalies in polar regions and high latitudes, with severe drought occurring throughout Greenland, central Baffin Island, and western China and heavy rainfall occurring in northern Eurasia. This study uses the reanalysis data from CPC, NNR, and CMAP to show the two positive AOI periods in the Northern Hemisphere caused by circulation anomalies, i.e., the variation in the westerlies and the consequent violent UPPW amplitude changes during the winter and spring of 2019/2020. Special issues focusing on “The Exceptional Arctic Stratospheric Polar Vortex in 2019/2020: Causes and Consequences” were proposed by scientists in Geophysical Research Letters (GRL) and the Journal of Geophysical Research (JGR): atmospheres. Consequently, the cause and influence of the Arctic Oscillation anomaly in 2020 are in urgent need of the study.
The Arctic Oscillation (AO) is the dominant mode of atmospheric circulation variability in the extratropical region of the Northern Hemisphere in boreal winter, and the most common feature is the oscillation phenomenon of reversed sea level pressure (SLP) anomalies in the high and midlatitude regions (Thompson and Wallace, 1998; Baldwin and Dunkerton, 1999; Ambaum et al., 2001). Recent studies have shown that positive (negative) pressure anomalies in polar regions tend to occur with a corresponding zonal negative (positive) pressure anomaly area along the midlatitude region of the Northern Hemisphere; thus, the AO is usually referred to as the near-surface mean sea level pressure (MSLP) pattern related to the northern annular modes (NAMs) (Baldwin et al., 2003; Hill et al., 2011; Lin et al., 2012).
Observational and modeling results have provided evidence of stratosphere-troposphere coupling across many time scales (Rind and Lacis, 1993; Feng et al., 2013; Feng et al., 2017; Hu et al., 2017). However, anomalies in the lowermost stratosphere have nonlocal dynamical effects that are too weak to account for the magnitude of the observed surface pressure changes (Haynes et al., 1991), while the influence of stratospheric winds on the downward reflection of planetary scale waves originating in the troposphere remains uncertain (Sheng et al., 2020).
Through interactions with synoptic-scale waves, which have wavelengths from 1,000 to 5,000 km, the anomalies of stratosphere winds could be amplified to affect tropospheric circulations and inducing surface pressure changes corresponding to the AO (Haynes and Shepherd, 1989; Lorenz and Hartmann, 2003; Zhao et al., 2019). These synoptic scale waves can extend several kilometres into the stratosphere, be affected and modulated by stratospheric wind anomalies, and transmit these anomalies downward to the troposphere (Domeisen et al., 2013; Yu et al., 2018a; He et al., 2020). After receiving, amplifying, and transferring the stratospheric wind anomalies to the troposphere, the synoptic scale waves finally affect the atmosphere and ocean (Haynes and Shepherd, 1989).
Consequently, the AO is an important part of the stratosphere-troposphere coupling period that receives the amplified signal of the stratospheric anomaly and transmits it to the troposphere and ocean in extratropical regions of the Northern Hemisphere.
The negative (positive) phase of the stratospheric AO corresponds to a weaker (stronger) and warmer (colder) stratospheric polar vortex with larger (smaller) amplitudes of wave flow surrounding the polar region (Kuroda, 2002; Baldwin et al., 2003).
Strong negative AOI periods are usually accompanied by strong upward propagating planetary waves (UPPWs), which perturb the stratospheric polar vortex, cause sudden stratosphere warming events (SSWs), and serve as a potential source of subseasonal to seasonal (S2S) predictability of surface weather and climate (Taguchi, 2018; Domeisen et al., 2020b; Rao et al., 2020b; Minami and Takaya, 2020; Taguchi, 2020). The sharp and large temperature increases in the polar stratosphere, which lead to a largely distorted and even broken-down polar vortex, are called SSWs (Taguchi, 2020). Previous studies have shown the importance of predicting negative phases of the AO, which are associated with extreme cold conditions over Eurasia and North America in the boreal winter. Moreover, SSW can impact various socioeconomic sectors. Consequently, the accurate prediction of the negative AO-related conditions with a long lead time has received considerable attention in the literature (Taguchi, 2017; Rao et al., 2019a; Domeisen et al., 2020a; Afargan-Gerstman and Domeisen, 2020; Ma et al., 2020; Minami and Takaya, 2020). Recent research found that the negative stratospheric annular mode associated with an SSW can cause sustained impacts on surface climate via the excitation of the negative tropospheric southern or NAMs (Baldwin and Dunkerton, 2001; Baldwin et al., 2003; Sigmond et al., 2013; Domeisen, 2019; Rao et al., 2020a; Rao et al., 2020b; Department of Industry, S., Energy and Resources, Australian Government, 2020). Producing reliable predictions of SSWs is of primary importance due to the major role the stratosphere plays in the S2S predictability of the extratropical climate (Rao et al., 2019b; Domeisen et al., 2020b; Taguchi, 2020).
However, the positive phases of the AO have also been shown to warm midlatitude continental interiors and drastically reduce the Arctic Ocean’s ice cover (Gillett et al., 2002; Darby et al., 2012; Limoges et al., 2020). In addition, a positive bias in the AO pattern is associated with stratospheric cooling and increased levels of greenhouse gases (GHGs) (Sewall and Sloan, 2001; Kim et al., 2020). Considering the current trend in climate warming, it is necessary to gain more accurate predictions of the positive AO-related conditions. When the AO is positive, pressures are lower than normal over the polar cap and higher at low latitudes, resulting in stronger midlatitude westerlies, especially across the Atlantic Ocean. Northern Europe and much of the United States are warmer and wetter than average, and southern Europe is drier than the average (Zhou et al., 2002). At the Earth’s surface, the AO is characterized by the downward propagation of extratropical anomalies (Kodera et al., 1990; Coughlin and Tung, 2005), acting as a medium of stratosphere-troposphere coupling and therefore affecting the weather in the troposphere (Rind et al., 2005; Kolstad and Charlton-Perez, 2011; Yu et al., 2018b; Mai et al., 2020).
Large weather and climate anomalies in the Northern Hemisphere in the winter of 2019/2020 have been considered to be closely related to the significant negative anomalies in the AO during this winter. Consequently, a detailed discussion of the causes and consequences of these two strong positive AOI periods (Sections Geopotential Height Field and Temperature Variability and The Role of Planetary Waves in the Development of Positive Arctic Oscillation Index Periods) and a formal statistical analysis based on eight historical positive AOI periods (Section The Splitting Characteristics of the Positive Arctic Oscillation Index Event in the Winter and Spring of 2019/2020) were conducted to show the influence of positive AOI periods in winter on atmospheric circulation and climate anomalies in the Northern Hemisphere. The results provide a better understanding of the evolution periods and possible influence pathways of these anomalies and provide a certain scientific basis for understanding the occurrence and prediction of positive AOI periods (Xie et al., 2017a; Yu et al., 2019).
Data and Data Processing Methods
The daily (monthly) anomaly defined here is the difference between the original value and the daily (monthly) perennial climate average value of each grid. In addition, the monthly and daily AOIs are from the United States Climate Prediction Center (CPC).
The AOI used here is defined using the daily or monthly 1,000 hPa geopotential height anomaly (GHA) from latitudes 20°N to 90°N. The anomalies are projected onto the AO loading pattern, which is defined as the first leading mode of an empirical orthogonal function (EOF) analysis of the monthly mean 1,000 hPa geopotential height during the 1979–2000 period. The year-round monthly mean anomaly data are used to obtain the loading pattern of the AO. Finally, the time series is then normalized with the monthly mean index’s standard deviation.
To analyze the AO in the mid and high latitudes of the Northern Hemisphere and its effects on circulation, air temperatures, geopotential heights, and both zonal and meridional circulation patterns were derived from global daily and monthly NCEP/NCAR reanalysis 1 (NNR) data (Kalnay et al., 1996) spanning from January 1948 to May 2020 with a horizontal resolution of 2.5° × 2.5° and a vertical atmosphere structure stratified into 17 levels from 1,000 to 10 hPa (∼32 km).
When studying the characteristics of planetary waves, the method of using the Eliassen–Palm (EP) flux to diagnose planetary wave activity is commonly used (Edmon et al., 1980 and Chen et al., 2003). The eddy forcing of the zonal mean flow, represented as divergence due to planetary waves, is calculated by the quasi-geostrophic form of the EP flux in spherical geometry (Matsuno, 1970; Kodera et al., 2008; Nishii et al., 2009; Birner and Albers, 2017). The definitions of the EP flux and its divergence are
where
NCEP/NCAR reanalysis data provide rich atmospheric information with a temporal coverage since 1948, although the accuracy fluctuates with time due to the different satellite remote sensing data used at different times in data assimilation. Previous validation tests of NCEP/NCAR data have shown that the data before 1968 are generally considered to be unreliable because of the lack of satellite observations before 1968 and the different daily averaging methods applied over the 1948–1957 period (Yang et al., 2002Inoue and Matsumoto, 2004). However, the CPC AOI is based on the NCEP/NCAR reanalysis; thus, the NCEP/NCAR reanalysis is used for consistency in this study. The data from 1948 to 2020 are only used to calculate the mean value of the climate state in this study, and the selected historical positive AOI periods are all from 1970 to 2020.
The precipitation data used in this study are derived from CPC Merged Analysis of Precipitation (CMAP) data (Xie and Arkin, 1997), which provide monthly precipitation values spanning January 1979–September 2020. The CMAP data were constructed by merging gauge and satellite estimates (Yin et al., 2004; Li et al., 2015). The satellite retrievals include Geostationary Operational Environmental Satellite (GOES) precipitation index (GPI), outgoing longwave radiation (OLR), special sensor microwave/imager (SSM/I) scattering and SSM/I emission, precipitation index (OPI), and microwave sounding unit (MSU) data (Xie and Arkin, 1997; Li et al., 2015). The spatial coverage of the CMAP data is within 88.75°N– 88.75°S, 1.25°E–358.75°E, divided into 144 × 72 global grids, of which the horizontal resolution is 2.5° in latitude and longitude (Xie and Arkin, 1997; Xie et al., 2007; Chen et al., 2008; Negrón Juárez et al., 2009).
Analysis of the Positive Arctic Oscillation Index Event From January to March 2020
Development of Positive Arctic Oscillation Index Events
The yearly average AOIs in 2020 in January, February, and March were higher than previous values, and February exhibited the highest value over the past 50 years, 3.42 (Figure 1A). It is noteworthy that the daily average AOI on February 21 was the first to exceed six on record (Figure 1B).
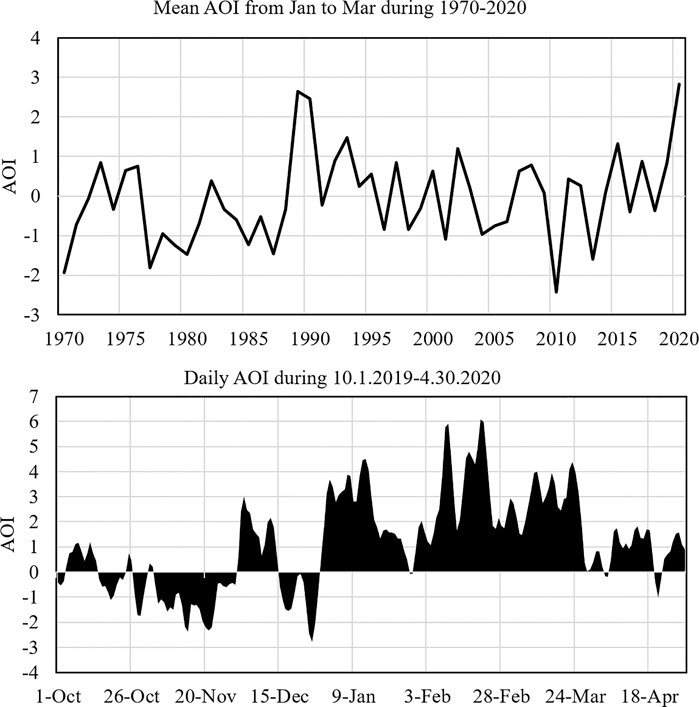
FIGURE 1. (A) Mean AOI from January to March during 1970–2020. (B) Daily AOI from October 1, 2019 to April 30, 2020.
In this study, the positive AOI events are defined by the strength and duration of the AOI: a positive AOI event has maximum AOI exceeding four and an average exceeding 1.5 and has a time span exceeding 30 days.
The positive AOI event in the winter and spring of 2019/2020 was characterized according to the above criteria. The entire event was divided into two positive AOI periods. The first positive anomaly period occurred in December and ended in January, and the second occurred in January and ended in March (Figure 9M). The two periods exhibited completely different characteristics. In the first period, the AOI changed rapidly from negative to positive and reached its first peak value of 3.68 on January 1, 2020; thereafter, the AOI fluctuated and reached its third and strongest peak value of 4.51 on January 13. Then, the AOI weakened gradually and finally ended with a negative value on January 28, though the first period ended on January 22 according to the calculations. The second period occurred in late February and developed over a longer time scale with a stronger intensity than the first. The AOI increased slowly at first and then accelerated, which led to the peak of 5.91 on February 10, then declined rapidly and finally increased again, reaching its highest peak value of 6.07 on February 21, which is the highest daily AOI ever recorded.
Geopotential Height Field and Temperature Variability
The AO corresponds to a reversal of the spatial trend in the geopotential height field between high and midlatitudes, which is closely connected with the temperature field. Thus, we compare the variability in these two fields with the tendency of the AOI to determine a relationship between them.
The difference in the zonal-average temperature and geopotential height between 60 and 90°N at 20 hPa (Figure 2A) shows a persistent strong negative GHA and temperature anomalies from December 2019 to mid-March 2020 except for two steep spikes that occurred from January 16 to February 14, which increased the GHA and temperature anomalies but was unable to reverse the meridional gradient and break the polar vortex. The spikes occurred in the gap between two positive AOI periods; when the AOI decreased, the weak positive value became negative on January 28 and 29 (Figure 1B). The sudden spikes in the gap could be explained by two UPPW events on January 14 and February 1 (Figure 2B), during which UPPWs were brought up through the tropopause and arrived in the stratosphere of mid and high latitudes (Figures 2C and 2E). However, it should be highlighted that the enhancement of UPPWs did not cause the occurrence of SSW events, of which the breakdown of the polar vortex and reversal of the meridional temperature gradient is typical (Matsuno, 1971) but only heated the polar region of the stratosphere where the polar vortices were originally strong. The UPPWs dissipated and resulted in a reverse trend in the stratospheric circumpolar jet, thus reducing the intensity of the polar vortex and expanding the polar vortex. This weakening of the polar vortex enhanced the meridional circulation while decelerating the zonal circulation, which led to observable troughs and ridges that appeared at midlatitudes. The enhanced meridional circulation accelerated air exchanges between polar regions and warmer lower latitude areas, leading to increases in polar temperatures by nearly 30 K in a few days, which could not match the intensity of the SSWs but was certainly the direct cause of the termination of the first positive AOI period. This can be seen in Figure 1B where the two UPPW events caused a sudden decrease in the AOI in mid-January. However, this influence soon dissipated with the AOI increasing again, and the second positive AOI period began. The cause of the rapid dissipation of the influence is discussed in detail in Section The Role of Planetary Waves in the Development of Positive Arctic Oscillation Index Periods.
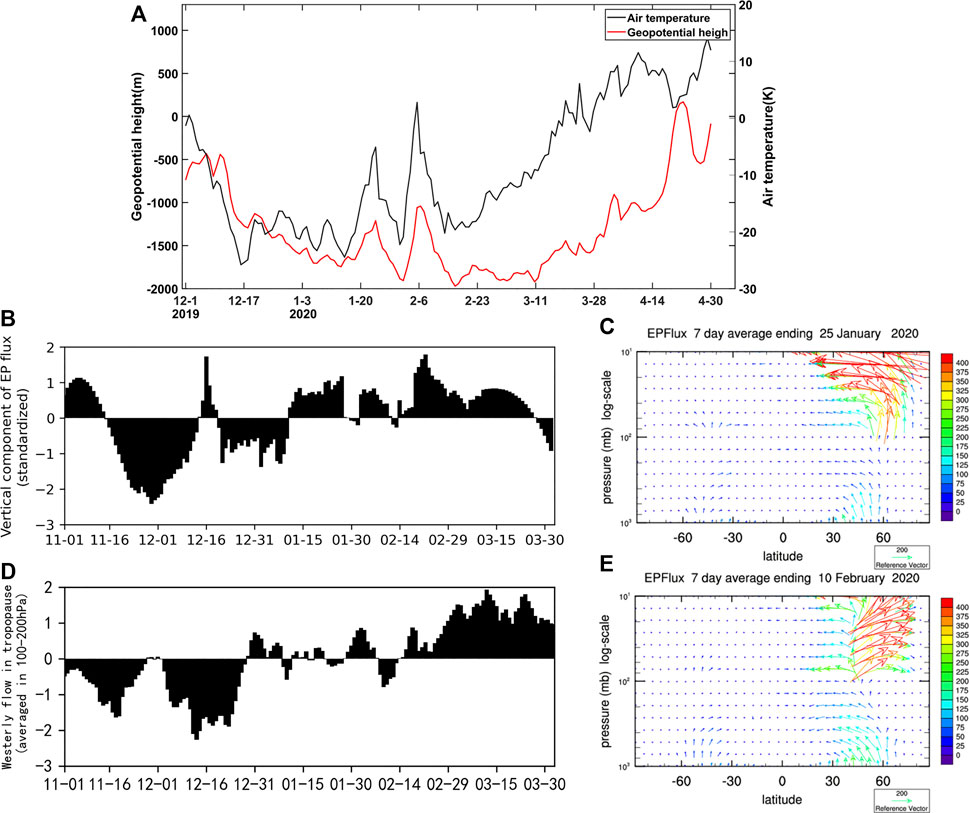
FIGURE 2. (A) The difference in the zonal-average at 20 hPa temperature and geopotential height at 90°N and 60°N. (B) Mean daily vertical component of the 1–3 zonal waves’ EP flux north of 60°N at 10–200 hPa (standardized). (C) Global vertical profile of the EP flux for January 19–January 25, 2020. (D) Mean daily westerly flow at the tropopause between 100 and 200 hPa (standardized). (E) Global vertical profile of the EP flux for February 14–February 20, 2020.
The GHA shows the same characteristics from January 2020 to March 2020, during which the strong negative GHA dominated the polar regions and high latitudes, while the strong positive GHA dominated the North Atlantic and North Pacific in the midlatitudes. In January, the contrast between the positive and negative GHAs in the mid and high latitudes was relatively weak, and the positive anomaly areas were distributed in clusters (Figure 3A). In February and March, both the positive and negative GHAs were enhanced, while the positive developed into a zonal distribution (Figure 3B); thus, the contrast between the positive and negative GHAs in the mid and high latitudes in the second period in February and March became stronger than that of the first period in January, which was consistent with the results of a previous analysis of the monthly average AOI variability during the two positive AOI periods from January to March (Figure 1B).
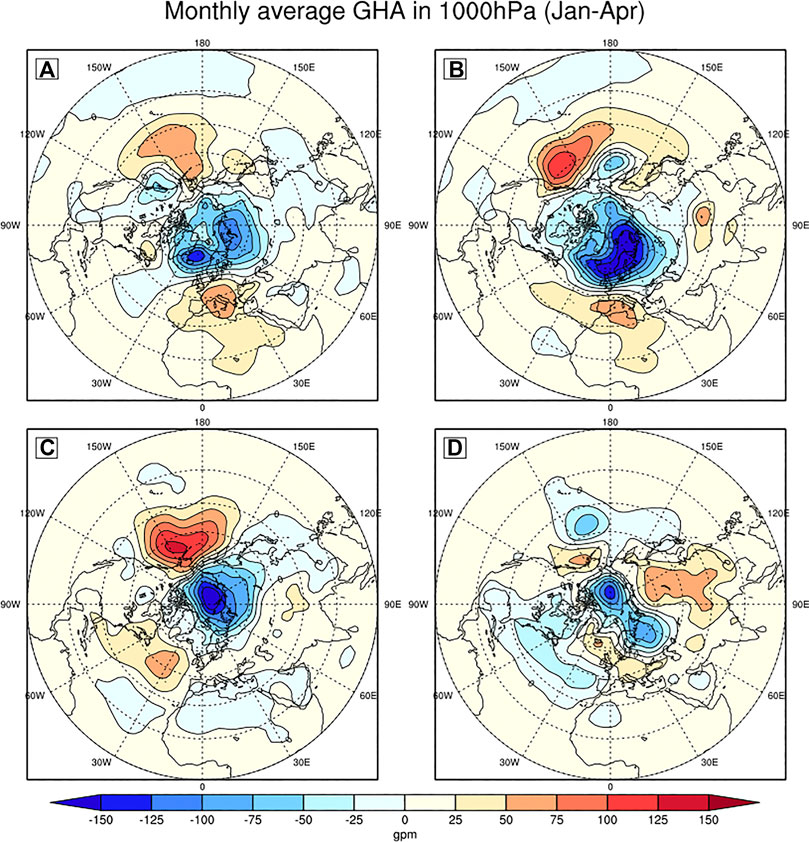
FIGURE 3. Monthly average GHA distribution in (A) January 2020, (B) February 2020, (C) March 2020, and (D) April 2020 in the Northern Hemisphere at 1,000 hPa.
The GHA distribution was clearly indicative of a positive AOI period. From January to April, the AOI first increased and then decreased, with the highest peak in February (Figure 1B). The GHA distribution was largely unchanged from January to April, and the polar vortex boundary withdrew gradually to latitudes north of the 60th parallel, which caused the typical GHA feature of the positive AOI period, i.e., a strong negative GHA center restricted to high latitudes and the positive GHA in the midlatitudes (Figures 3A–C). In April, the typical GHA feature of the positive AOI period broke as the AOI decreased (Figure 3D).
The Role of Planetary Waves in the Development of Positive Arctic Oscillation Index Periods
Previous studies have suggested that quasistationary planetary waves in winter, which are mainly excited by the dynamic forcing of the Earth’s terrain and the thermal forcing generated by the land distribution, can extend up to the stratosphere with the westerlies (Charney and Drazin, 1961; Lin et al., 2012; Garfinkel et al., 2020) and exert certain effects on the stratospheric circulation through the interaction of current flow and wave. Standardized values of the vertical component time series of mean latitudinal 1–3 waves’ EP flux north of 60°N at 10–200 hPa (Figure 2B) show variability in the planetary waves reaching the stratosphere. In the case of the one to three waves, planetary waves entering the stratosphere had oscillations on a monthly time scale. The positive peaks in late January, early February, late February, and March represented relatively strong UPPWs in stratosphere, which corresponded well with the rise in the geopotential height and air temperature difference between 60 N and 90°N at 20 hPa (Figure 2A). It should be noted that the end of the first positive AOI period and two spikes representing sudden geopotential height increases and warming in the polar stratosphere were caused by two relatively strong UPPWs in late January and early February. The UPPWs can be clearly seen in Figures 2C and 2E, in which the EP flux in the mid and high latitudes exhibited an obvious upward propagating trend at 10–100 hPa.
The westerlies enhanced the UPPWs from the troposphere to the stratosphere, and the mechanism by which the positive AOI period occurred was through these planetary waves, which can be represented by three stages of UPPW variation (weak-strong-stable).
First, in early November, the tropospheric westerlies weakened (Figure 2D), resulting in weak UPPW propagation (Figure 2B). The weakening of the UPPWs from mid-November to mid-January enhanced the polar vortex, and as a result, a persistent negative geopotential height anomaly appeared in the upper stratosphere (Figure 2A). This persistent (two months) low intensity (after standardization: −2.5) UPPW situation allowed the stratospheric circulation to recover from the weak polar vortex situation and gradually formed a strong polar vortex under the effect of radiative balance. The strong polar vortex led to the following results. The first result was the high AOI in the beginning of the first positive AOI period. The second result was the continuous existence of negative potential height and temperature anomalies in the stratosphere during and after the two UPPW events (the first UPPW event: January 17–25; the second UPPW event: February 1–6) because of the counteraction between the strong polar vortex and the UPPWs. The third result was the positive AOI situation in the subsequent planetary wave transport period (February 14–March 26) after the UPPWs.
Then, there were two relatively strong UPPWs in January and early February; the heat flux emitted by broken UPPW caused the westerlies in the stratosphere to decelerate and the stratosphere to warm up. However, the strong polar vortex that formed in the previous stage limited the UPPW effectiveness. Thus, the UPPWs were not able to trigger a reversal in the gradient of the geopotential height and temperature before it diminished but caused quantitative changes. If the original polar vortex was weak, the upper westerlies could have been converted from the normal westerlies to easterlies by sufficiently strong UPPWs when the polar region temperature increased dramatically and the SSW event occurred (Andrews et al., 1987).
Finally, the lower westerlies developed upward and carried substantial UPPWs into the stable stratosphere, which weakened the polar vortex again, heated and increased the GHA in the stratosphere (Figure 2A), and ended the second positive AOI period. It can be clearly seen from Figures 4A and 4B that the temperature anomaly and GHA in the mid and upper stratosphere developed to a maximum negative peak around March 5 and then increased gradually when the polar vortex was weakened under the effect of broken UPPW.
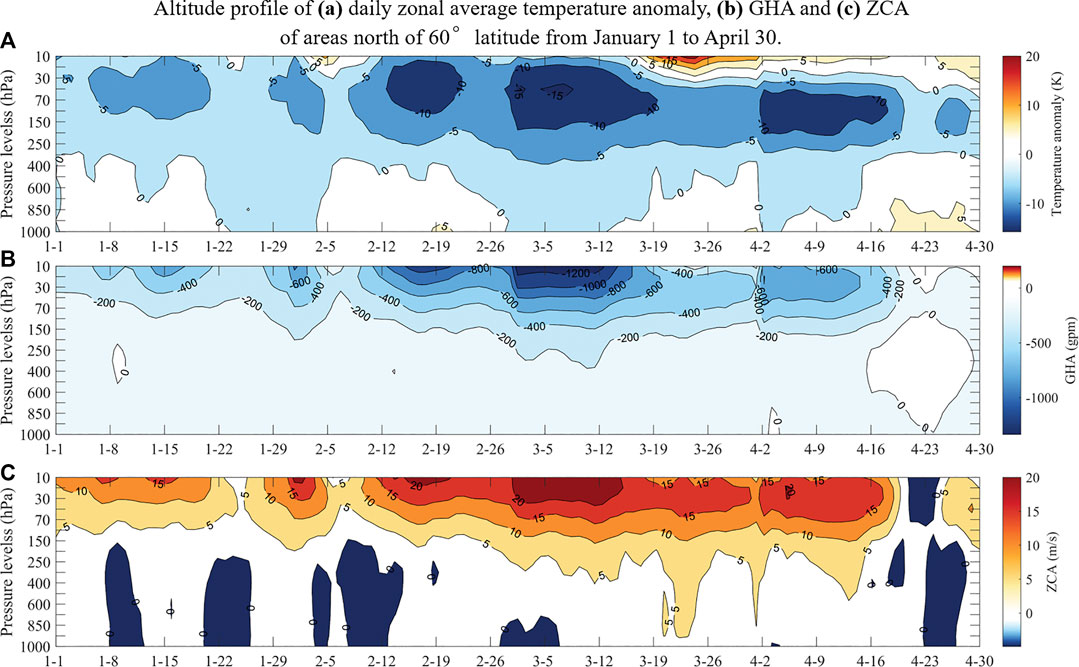
FIGURE 4. Vertical profiles of the (A) daily zonal-average temperature anomaly, (B) GHA, and (C) ZCA for areas north of 60°N latitude from January 1 to April 30.
The strong positive AOI periods are notable because of their long-lasting formation time, and the weak stage of UPPWs from mid-November to mid-January provided the polar vortex nearly 2 months to recover, which is unusual. Prior to this, the positive AOI period in early 1989 had the longest weak UPPW stage, which had a negative vertical EP flux for 50 days from the beginning of December to the middle of January. This long formation time provided the strong positive AOI period more time to reach a more stable stage to affect the climate and cope with the UPPWs, which made the AOI period extremely strong and persistent in this year. Although the UPPWs were strong, they could not effectively weaken the polar vortex or the spatial trend in the geopotential height field. Consequently, the UPPWs did not trigger a reversal in the gradient of the geopotential height and temperature before they diminished (Figure 2A), but quantitative changes did occur. Moreover, the formation of positive AOI periods is complex. They can be caused by the development of the stratospheric polar vortex during the weak UPPW stage, combined action of the El Niño-Southern Oscillation (ENSO) cycle and climate warming (detailed in Section The Splitting Characteristics of the Positive Arctic Oscillation Index Event in the Winter and Spring of 2019/2020), or by a change in the stratospheric circulation itself. However, the westerlies combined with the consequent UPPWs provided the main reason for the AO anomalies in 2020.
Analysis of the Cause of the Arctic Oscillation Anomaly Formation
Vertical Variability in the Atmosphere Corresponding to Arctic Oscillation Anomaly Formation
According to the above analysis of the AO anomalies, the positive AOI event could be divided into two periods. The first occurred in late December and January and was accompanied by a weak temperature anomaly, GHA, and zonal circulation anomaly (ZCA) in the upper stratosphere (Figures 4A, B, and D). The second occurred in February and March and was accompanied by a persistent strong positive AOI period in the upper stratosphere and its downward development. Due to UPPWs, there was a sudden reversal at the end of January. The vertical cross-section of the daily zonal-average GHA and zonal wind anomaly of areas north of 60° latitude from January 1 to April 30 represented the characteristics of the AO development (Figures 4B and 4D). Both the geopotential height and the zonal wind showed relatively weak anomalies in January, stronger anomalies in February and March, and a sudden decline in the anomalies in the stratosphere at the end of April. The distributions of the GHA and zonal wind anomaly were obviously similar in the stratosphere where the negative GHA area corresponded with the positive zonal wind anomaly region. The stronger the negative GHA is in the stratosphere, the larger the contrast between the negative GHA at high latitudes and the positive GHA at midlatitudes is, the higher the intensity of the positive AO anomaly is, and the stronger the zonal wind anomaly is. Compared with the GHA and zonal wind anomaly, the temperature anomaly in areas north of 60° latitude from January 1 to April 30 exhibited the same variability but with a lower altitude for the anomaly center (Figure 4D), indicating that the temperature variability was closely related to the AO anomaly period. According to the analysis of the geopotential height, zonal wind, and temperature, the anomaly source of these two positive AOI periods was at the top of the stratosphere, and the downward development of the anomaly caused the consistent variability in the troposphere and stratosphere. The anomaly source was so strong in control of the stratosphere in March that a small perturbation of temperature on March 20 dissipated quickly. The meridional wind was weak during the positive phase of the AO. The small positive meridional wind anomaly existed both at the top and bottom of the stratosphere (Figure 4C); however, this is difficult to analyze because the meridional wind anomaly and the atmospheric perturbation exhibited similar intensities. It should be noted that not all AO periods first appear in the stratosphere because tropospheric feedbacks can also play an important role in AO development.
In summary, the second positive AOI period was stronger than the first, with quantitative differences including a more powerful temperature anomaly and GHA center in the stratosphere (Figures 4A and 4B) and qualitative differences in the development of the ZCA, which was so powerful in the stratosphere that it propagated downward into the lower troposphere in March (Figure 4D). It should be mentioned that the strong positive AOI period is completely different from the weak positive AOI period. The division criteria for determining a positive AOI period from normal variability in the AOI has been defined in Data and Data Processing Methods. The substandard positive AOI period in April (Figure 1B), which was too transient and with low intensity, did not form a typical positive AOI mode in the GHA field (Figure 3D) similar to the previous positive AOI periods (Figures 3B and 3C) and maintain control of the stratosphere (Figures 4A, B, and D in late April).
Zonal Influence of the Arctic Oscillation Anomaly on Atmospheric Layers
The monthly mean latitude-altitude profile of the zonal-average GHA from December 2019 to May 2020 shows a strong negative GHA in the stratosphere in high latitude areas, and the polar region moved downward beginning in December and dissipated in May, which caused a consistent negative GHA from the troposphere to the stratosphere at high latitudes; this occurred with a positive anomaly oscillation of the AO and a corresponding positive GHA over mid and low latitudes. A positive GHA appeared in the stratosphere at midlatitudes in January (Figure 5B). This positive GHA developed gradually in the troposphere at high latitudes (Figure 5E) and counteracted the negative anomaly in May (Figure 5F). The positive GHA centers in the midlatitudes appeared mainly between the tropopause and mid-stratosphere where the positive AO anomaly was strongest, as previously mentioned. The negative GHA at high latitudes from January to March (Figures 5B–D) dominated all of the high latitudes from the bottom of the troposphere to the top of the stratosphere, forming a stable characteristic of a positive AO anomaly with a positive GHA in the midlatitudes.
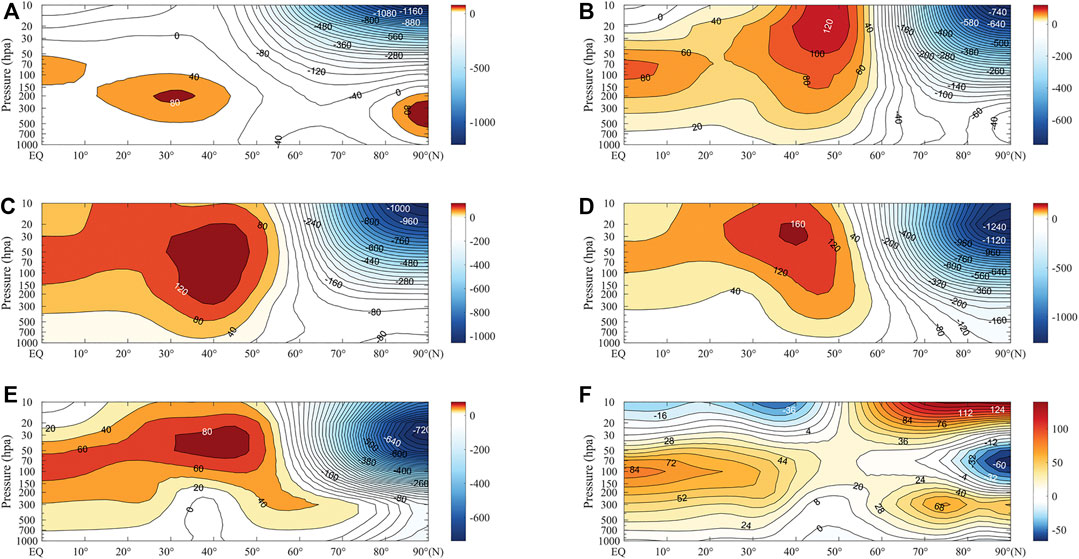
FIGURE 5. Monthly vertical profiles of the zonal-average GHA in the Northern Hemisphere in (A) December 2019, (B) January 2020, (C) February 2020, (D) March 2020, (E) April 2020, and (F) May 2020.
Similar results are shown in the monthly mean latitude-altitude profile of the zonal-average temperature anomaly from December 2019 to May 2020 (Figure 6) where the temperature in the stratosphere of the high latitudes exhibited a strong negative anomaly but at lower altitudes than the GHA. The strong negative temperature anomaly center had been developing downward slowly since December due to the obstruction of the positive temperature anomaly in the lower troposphere but finally encompassed the high latitudes from the bottom of the troposphere to the mid-stratosphere in March (Figure 6D). In contrast, the negative GHA at high latitudes, which formed a typical characteristic of a positive AOI period, occurred with a positive GHA in the midlatitudes (Figures 5B–D), corresponding with the prior GHA distribution in the Northern Hemisphere (Figures 3A–C). The scale of the temperature anomaly contrast in February and March was obviously larger than that in January (Figures 6B–D), which led to the second positive anomaly period being stronger than the first (Figure 1B). The strong positive temperature anomaly formed near the top of the stratosphere at high latitudes in March (Figure 6D) and moved downward to suppress the negative temperature anomaly area toward the bottom of the troposphere (Figures 6D–F). This phenomenon was very easy to detect in May, when another positive temperature anomaly center formed in the troposphere at high latitudes and counteracted the negative anomaly center in stratosphere, which led to a very dense isoline zone of the temperature anomaly at high latitudes near 300 hPa (Figure 6F). The strong negative temperature anomaly that appeared at the top of the stratosphere in the mid and low latitudes, together with the positive temperature anomaly at the top of the stratosphere at high latitudes, started to form the characteristic of a negative AO anomaly, which was opposite to that of the lower layers.
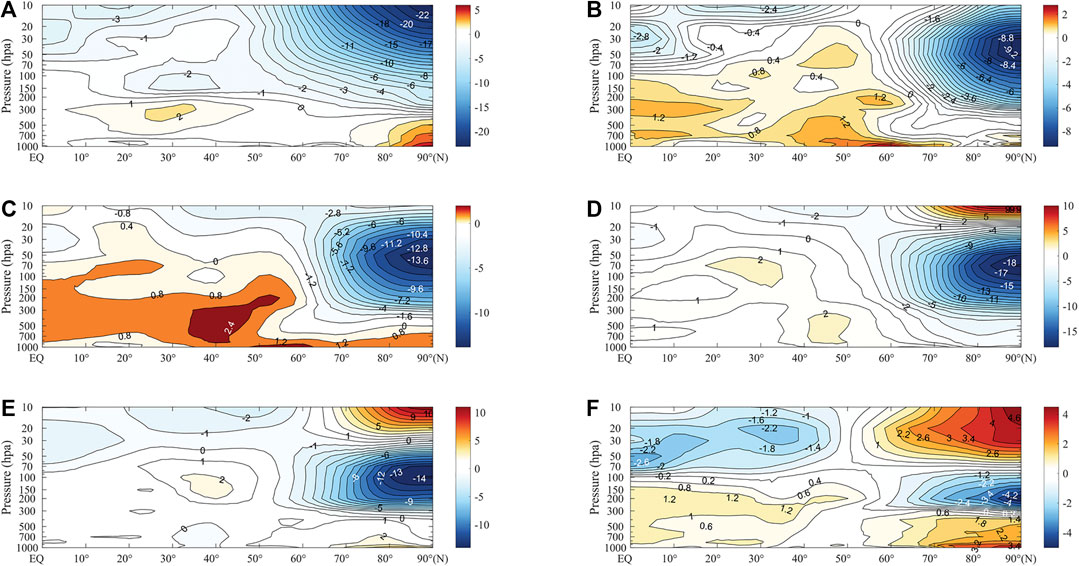
FIGURE 6. Monthly vertical profile of the zonal-average temperature in the Northern Hemisphere in (A) December 2019, (B) January 2020, (C) February 2020, (D) March 2020, (E) April 2020, and (F) May 2020.
Analysis of the Circulation Influence on the Arctic Oscillation Based on Eight Historical Periods
Here, eight positive AOI periods were selected to determine the circulation influence on the AO by contrasting the zonal and meridional circulation anomaly variabilities in each period.
The development of positive AOI periods is similar to previous studies (Limpasuvan et al., 2005; Kuroda, 2008; Birner and Albers, 2017), which is marked by anomalously low wave activity and descending westerly anomalies over the depth of the polar stratosphere in the incipient stage and rapid weakening of the circumpolar wind in the end (Limpasuvan et al., 2005). But the role of ZCA as an indicator and intermediate product of the UPPW-AO interaction has not been fully revealed in the previous studies, which is the focus of this section.
The eight positive AOI periods, which were typical and continuous, were selected from 1970 to present. The months in which the periods occurred were January 1989, February 1990, February 1997, March 2011, November 2011, November 2013, November 2015, and February 2019. The daily time series of the AOI and average vertical cross-section of the corresponding zonal and meridional circulation anomalies between 60 and 90°N at 17 levels (from 1,000 hPa to 10 hPa) during the eight periods show that obvious strong positive zonal circulation anomalies appeared in the mid and upper stratosphere when a positive AOI anomaly occurred (Figure 7). This phenomenon was extremely evident in 1989, 1997, and 2013, when a strong and long-lasting positive ZCA appeared with an obvious downward trend, and a positive AOI anomaly appeared at the same time. The positive ZCA showed a powerful downward trend when the AOI reached its peak (Figures 7C1 and 7D1, January 14–16, 1989; Figures 7C2 and 7D2, February 25–27, 1990; Figures 7C3 and 7D3, March 8–10, 1997; and Figures 7C4 and 7D4, March 21, 2011), which indicated the typical ZCA development mode. In the typical ZCA development mode, the positive ZCA sourced from the upper stratosphere developed toward the stratosphere in the strong positive phase of the AO, then weakened and finally substituted by negative ZCA centers in the following negative phase of the AO. This typical development mode of the ZCA in positive AOI periods can be clearly seen in the composite picture of the eight historical periods (Figures 7A and 7B). The composite data were calculated by averaging the ZCA variability over all eight periods.
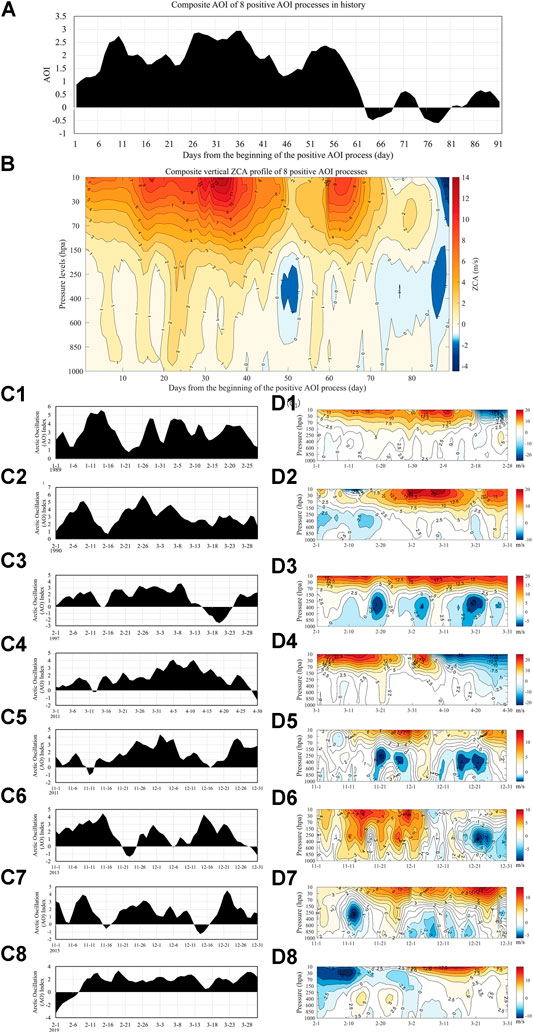
FIGURE 7. (A) Composite AOI within the following 90 days after the start of eight historical positive AOI events. (B) Composite vertical ZCA profile within the following 90 days after the start of these eight positive AOI events. (C1–C8) Daily AOIs for the eight positive AOI events. (D1–D8) Vertical ZCA profiles for the eight positive AOI events.
Formal statistical analysis was performed to determine the relationship between the ZCA and the AOI using the concept of division analysis. In the eight historical periods described above, all 480 days were used to conduct this statistical analysis. The ZCA and AOI were averaged daily, from which 480 samples were obtained. The four divided districts of the scatter diagrams were distinguished according to the following rules:
Because the sample size of district A far outweighed that of district D and had 15 times as many points as that of district D for 10–30 hPa and 10–1,000 hPa (Figures 8B and 8C), the positive AOI periods always coexisted with a positive ZCA. In addition, strong positive ZCA centers accumulated in the upper stratosphere because the average ZCA between 10 hPa and30 hPa was up to 2 times larger than those at 10–1,000 hPa under the same positive AOI (Figure 8A), while the sample distribution at 10–30 hPa (Figure 8C) in the four districts was generally the same as that for 10–1,000 hPa (Figure 8B). In summary, the positive ZCA in the upper stratosphere played a major contribution in the selected positive AOI periods. It is noteworthy that the negative ZCA in the 10–30 hPa samples was also larger than that for 10–1,000 hPa under the same negative AOI, which means that upper level abnormal changes in the zonal circulation occurred over a larger scale than at lower levels. Consistent with the results of climate simulations, the strong upper level westerly variability in the Northern Hemisphere caused a powerful disturbance in the upper level circulation (Charney and Drazin, 1961; Shuwen and Jun 2013), which was represented by a large ZCA during the positive AOI periods. This large ZCA in the upper stratosphere caused downward ZCA propagation, thus changing the geopotential height field in the lower troposphere (Baldwin and Dunkerton, 1999). The consequent GHA finally induced variability in the AOI.
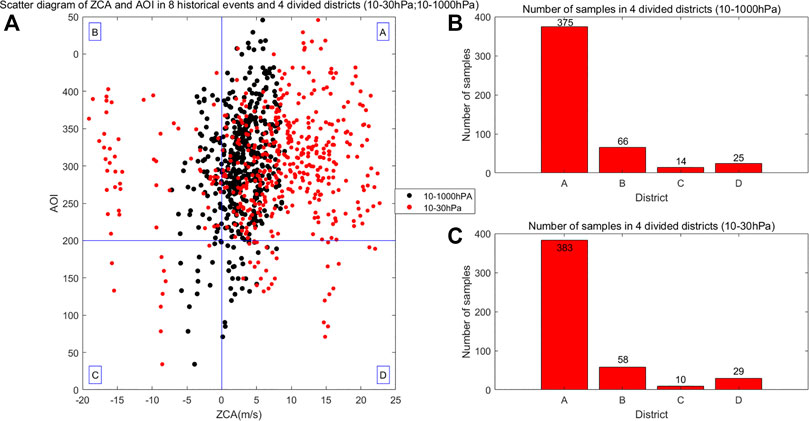
FIGURE 8. (A) Scatter diagram of the ZCA and AOI for eight historical events and four divided districts (10–30 hPa; 10–1,000 hPa). (B) Number of samples in the four divided districts at 10–1,000 hPa. (C) Number of samples in the four divided districts at 10–30 hPa.
The Splitting Characteristics of the Positive Arctic Oscillation Index Event in the Winter and Spring of 2019/2020
Before the winter and spring of 2019/2020, 12 positive AOI events had occurred (according to the standard for positive AOI events described in Section Development of Positive Arctic Oscillation Index Events). None of these events exhibited a gap, i.e., a small break (often shorter than 3 days) between two positive AOI events (Figures 9A–l). However, the events in the winter and spring of 2019/2020 were separated by a gap (Figure 9M). The first positive AOI event ended on January 22, 2020, and the second positive AOI event began on January 25, 2020; the gap occurred on January 23 and 24. The formation of this gap was detailed in Section The Role of Planetary Waves in the Development of Positive Arctic Oscillation Index Periods. Such gaps are rare because the UPPW needs to occur at the same time as the appropriate polar vortex. If the polar vortex is too weak, the positive AOI event will end due to the influence of the UPPW. If the polar vortex is too strong, the UPPW cannot have an impact of the sufficient scale to cause a gap in the event. In addition, even if the polar vortex is appropriate, the gap will not develop without the UPPW. In conclusion, a gap in a positive AOI event is very unlikely and has been observed only once, in the winter and spring of 2019/2020.
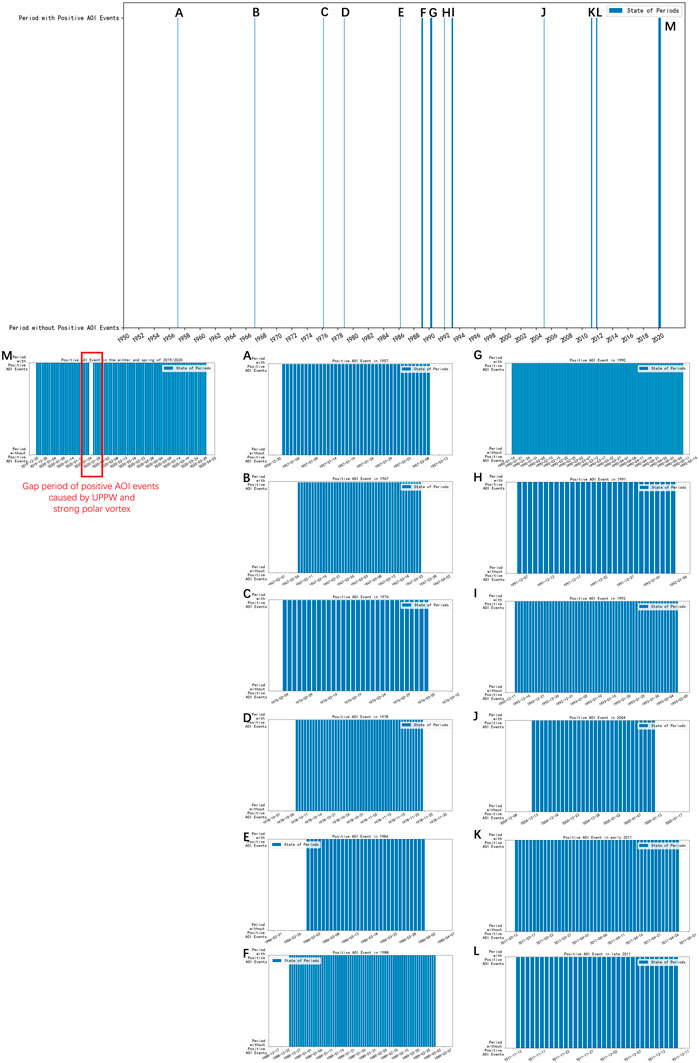
FIGURE 9. Positive AOI event days (calculated according to the standard in Section Development of Positive Arctic Oscillation Index Events) in (A) 1957, (B) 1967, (C) 1976, (D) 1978, (E) 1986, (F) 1988, (G) 1990, (H) 1991, (I) 1992, (J) 2004, (K) early 2011, (l) late 2011, and (M) the winter and spring of 2019/2020.
Analysis of the Influence of the Positive Arctic Oscillation Index Event in the Winter and Spring of 2019/2020
Interannual Influence
Previous studies had shown that the AO is the mode that explains the largest amount of variance at interannual timescales in the Northern Hemisphere, which means that positive AOI periods are an important indicator of temperature and precipitation variation in the Northern Hemisphere (Thompson and Wallace, 1998; Daoyi and Shaowu, 2003). Correspondingly, global climate change may affect these periods. Consequently, the large scale climate anomaly from January to March 2020 was inevitably connected with the strong positive AOI periods. In this section, the connection between positive AOI periods and climate is discussed.
In general, positive AOI periods correspond to a poleward shift in the zonal-average mid-latitude jet, the shrinkage of the polar vortex region, and the strengthening of the polar vortex. When positive AOI periods occur in the Northern Hemisphere, the zonal circulation is dominant, with a zonal flow field. The cold air is restricted to the polar region without large-scale movement; thus, the air mass exchange between the cold air and warm air is weak, and the trough-ridge system cannot develop normally in the midlatitudes, leading to less precipitation in these areas (Xie et al., 2017b). However, the relationship is dependent on the region of interest. Scientists have also found negative AO phases that led to lower precipitation in Europe (the 2018 and 2019 SSWs) (Rao et al., 2020a).
It can be seen from Figure 10B that the ZCA was in strong control of the Northern Hemisphere. The dominance of the ZCA corresponded with the dominance of the zonal circulation (Figure 4C). The dominance of the zonal circulation weakened the trough and ridge system in the midlatitudes, restricted the polar vortex in the polar region and high latitudes (Figure 10B), and prevented air exchange between the polar region and the high latitudes from January to March. Consequently, the strong temperature anomaly (maximum: 8 K, minimum: −4 K) was concentrated in northern Eurasia and over the entire Arctic Ocean (Figure 10A), while relatively weaker temperature anomalies (±3 K) occurred over the mid and low latitudes (Hu et al., 2014).
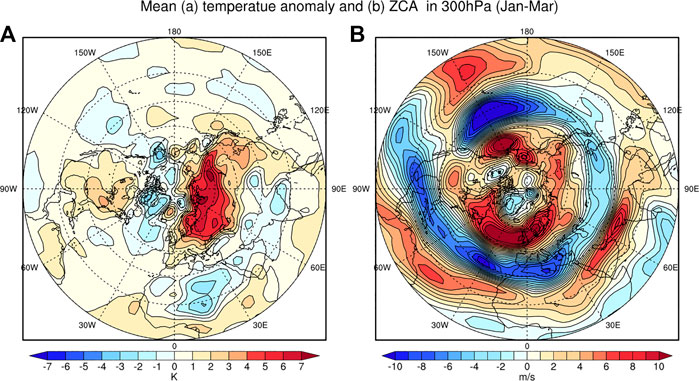
FIGURE 10. (A) Average temperature anomaly at 300 hPa in the Northern Hemisphere from January to March 2020. (B) Average ZCA at 300 hPa in the Northern Hemisphere from January to March 2020.
The precipitation distribution in the Northern Hemisphere exhibited anomalies concentrated in the polar region and high latitudes where the circulation and temperature anomaly centers mentioned above were mainly distributed. The strong polar vortex during the positive AOI periods (Figures 3–6) caused more precipitation in northern Asia and the eastern polar region. Precipitation in the eastern polar region increased sharply due to the positive temperature anomaly there (Figure 10A).
The precipitation anomaly distribution (Figure 11C) coincided substantially with that of the temperature anomaly (Figure 10A), which likely occurred because warm (cold) air leads to ascending (descending) motion and more (less) precipitation. The cold, dry air from polar regions controlled northern North America, while warm air dominated over northern Asia (temperature distribution in Figure 10A). The former induced a local negative precipitation anomaly with weak meridional air exchange, while the latter induced a local positive precipitation anomaly. The winter and spring of 2019/2020 is relatively dry compared with the historical average, so the increased precipitation centers were obvious, mainly distributed in northern Asia.
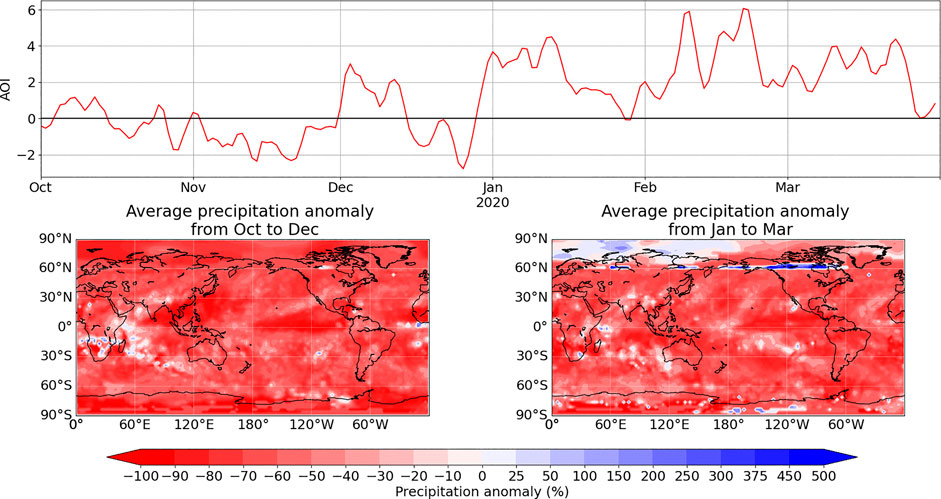
FIGURE 11. (A) AOI from October 1, 2019, to March 31, 2020. (B) Average global precipitation anomaly from October to December. (C) Average global precipitation anomaly from January to March.
Seasonal Influence
The global precipitation from October 2019 to March 2020 was generally low compared with the historical average value (1970–2020) for the same period (Figures 11B and 11C). Under the influence of the positive AOI event, the precipitation in the high latitudes and polar region showed obvious changes. Compared with that from October to December, the precipitation in the eastern region and boundary line of the polar region increased greatly from January to March (Figures 11B and 11C), when the positive AOI event occurred (Figure 11A). The precipitation anomaly was caused mainly by the positive temperature anomaly in the eastern polar region (Figure 10A), which was produced by the strong ZCA that the restricted polar region’s air exchanges with the outside (Figure 10B). Notably, there were strong precipitation anomalies along 60°N latitude (Figure 11C), which was the boundary of the polar vortex (Figure 3). The strong positive precipitation anomalies may have been caused by the encounter of air masses, both of which had substantial differences in temperature and water vapor content to the other.
Conclusion
Based on the analysis of the AOI and related atmospheric components, there were two positive AOI periods in the winter and spring of 2019/2020. The two periods were part of a large positive AOI event. The event split into two events because the appropriate polar vortex and UPPW variation conditions occurred; such a split is rare and has not been observed in any of the 12 positive AOI events (except this one) in history.
The three stages of UPPW variation caused the two positive AOI periods in the winter and spring of 2019/2020. Previous studies have focused on the influence of high-intensity UPPWs, for instance, the negative AOIs and SSWs. However, our studies have shown that with an appropriate polar vortex, a relatively low-intensity UPPW can also have an influence, i.e., creating the gap in the positive AOI event. The UPPWs had substantial impacts on the geopotential height and temperature in polar regions, although they did not cause a reversal in the gradients of the geopotential height and temperature before they diminished (Figure 2A). Consequently, the UPPWs did not necessarily lead to negative AOIs or SSWs when the original polar vortex was too strong to be reversed; instead, UPPWs merely caused the gap during which the AOI decreased to a smaller but still positive value because the waves were not strong enough to induce a negative AOI period. This gap formed the boundary between the two positive AOI periods.
The ZCA in the upper stratosphere is rarely studied. The role of ZCA as an indicator and intermediate product of the UPPW-AO interaction has not been revealed; previous studies have focused mainly on the enhancement of ZCA at different pressure levels in the polar regions during positive AOI periods (Sewall and Sloan, 2001; Darby et al., 2012; Kim et al., 2020; Lawrence et al., 2020; Limoges et al., 2020). As the intermediate product of UPPWs acting on the polar vortex, ZCA was an accurate indicator of the UPPW influence on stratospheric circulation patterns during positive AOI periods, especially when the meridional circulation was weak enough to be ignored.
The strong ZCA and weak meridional circulation in the mid and high latitudes (from 45° to 70°) led to weakened ridge-trough systems. This circulation condition inhibited the air exchange between the polar region and lower latitudes, which caused the strong negative temperature anomaly in the polar region and the moderate positive temperature anomaly in the mid and high latitudes. In addition, the precipitation in northern North America, northern Eurasia, all of Greenland, central Baffin Island, and western China showed anomalies from January to March 2020. The positive AOI event in this year caused the temperature anomaly and ZCA that led to more precipitation in the western polar region and northern Eurasia and extremely reduced precipitation throughout the eastern polar region, Greenland, central Baffin Island, northern Africa, and northern China. This is consistent with previous research showing large observed surface temperature and precipitation anomalies during the positive phase of the AO (Darby et al., 2012; Kim et al., 2020; Lawrence et al., 2020).
The circulation anomalies and consequent climate changes in the Northern Hemisphere were caused by UPPW variations in the two positive AOI periods in the winter and spring of 2019/2020. This study mainly focused on the circulation and planetary waves in the stratosphere of the Northern Hemisphere, based on which the characteristics and causes of the positive AOI periods in the winter and spring of 2019/2020 were analyzed. In addition, the influence of these two positive AOI periods on climate variability in the Northern Hemisphere was also analyzed to provide methods for enhancing S2S predictability (Taguchi, 2018; Rao et al., 2019a; Rao et al., 2020a; Domeisen et al., 2020b; Rao et al., 2020b; Ma et al., 2020; Minami and Takaya, 2020).
Data Availability Statement
The datasets [NCEP/NCAR Reanalysis 1] for this study can be found in the [https://psl.noaa.gov/data/gridded/data.ncep.reanalysis.html]. The datasets [CPC Monthly and Daily AO index] for this study can be found in the [https://www.cpc.ncep.noaa.gov/products/precip/CWlink/daily_ao_index/ao.shtml].
Author Contributions
Conceptualization, JZ and YM; Data curation, JZ and YM; Formal analysis, JZ, YM and XZ; Funding acquisition, ZS and YH; Investigation, JZ and MH; Methodology, JZ and YH; Project administration, ZS; Resources, MH; Supervision, ZS and MH; Validation, JZ; Visualization, JZ and MH; Writing–original draft, JZ; and Writing – review and editing, ZS.
Funding
This work was supported by the National Natural Science Foundation of China (Grant nos. 41875045, 41576171, and 41775039).
Conflicts of Interest
The authors declare that the research was conducted in the absence of any commercial or financial relationships that could be construed as a potential conflict of interest.The reviewer (JR) declared a shared affiliation with several of the authors, (JZ, ZS, YH, XZ), to the handling editor at the time of review.
References
Afargan-Gerstman, H., and Domeisen, D. I. V. (2020). Pacific modulation of the North atlantic storm track response to sudden stratospheric warming events. Geophys. Res. Lett. 47 (2), e2019GL085007. doi:10.1029/2019gl085007
Ambaum, M. H. P., Hoskins, B. J., and Stephenson, D. B. (2001). Arctic oscillation or North Atlantic oscillation?. J. Clim. 14 (16), 3495–3507. doi:10.1175/1520-0442(2001)014<3495:AOONAO>2.0.CO;2
Andrews, D. G., Holton, J. R., and Leovy, C. B. (1987). Middle atmosphere dynamics. Oxford, United Kingdom: Elsevier Science.
Baldwin, M. P., and Dunkerton, T. J. (2001). Stratospheric harbingers of anomalous weather regimes. Science 294 (5542), 581–584. doi:10.1126/science.1063315
Baldwin, M. P., Thompson, D. W., Shuckburgh, E. F., Norton, W. A., and Gillett, N. P. (2003). Atmospheric science. Weather from the stratosphere?. Science 301 (5631), 317–319. doi:10.1126/science.1085688.
Baldwin, M. P., and Dunkerton, T. J. (1999). Propagation of the arctic oscillation from the stratosphere to the troposphere. J. Geophys. Res.: Atmos. 104 (D24), 30937–30946
Birner, T., and Albers, J. R. (2017). Sudden stratospheric warmings and anomalous upward wave activity flux. SOLA. 13A, 8–12. doi:10.2151/sola.13A-002
Charney, J. G., and Drazin, P. G. (1961). Propagation of planetary-scale disturbances from the lower into the upper atmosphere. J. Geophys. Res. 66 (1), 83–109. doi:10.1029/JZ066i001p00083
Chen, M., Shi, W., Xie, P., Silva, V. B., Kousky, V. E., Wayne Higgins, R., et al. (2008). Assessing objective techniques for gauge‐based analyses of global daily precipitation. J. Geophys. Res.: Atmosphere 113 (D4), 1–2. doi:10.1029/2007JD009132
Chen, W., Takahashi, M., and Graf, H. F. (2003). Interannual variations of stationary planetary wave activity in the northern winter troposphere and stratosphere and their relations to NAM and SST. J. Geophys. Res.: Atmosphere 108 (D24), 1–3 and 13–14. doi:10.1029/2003JD003834
Coughlin, K., and Tung, K. K. (2005). Tropospheric wave response to decelerated stratosphere seen as downward propagation in northern annular mode. J. Geophys. Res.: Atmosphere 110 (D1), 1, 8, 9. doi:10.1029/2004jd004661
Daoyi, G., and Shaowu, W. (2003). Influence of arctic oscillation on winter climate over China. J. Geogr. Sci. 13 (2), 208–216. doi:10.1007/BF02837460
Darby, D. A., Ortiz, J. D., Grosch, C. E., and Lund, S. P. (2012). 1,500-year cycle in the Arctic Oscillation identified in Holocene Arctic sea-ice drift. Nat. Geosci. 5 (12), 897–900. doi:10.1038/ngeo1629
Department of Industry, S., Energy and Resources, Australian Government (2020). Estimating greenhouse gas emissions from bushfires in Australia’s temperate forests: focus on 2019-20, Canberra, Australia: Department of Industry, Energy and Resources.
Domeisen, D., Afargan-Gerstman, H, Baehr, J., Dobrynin, M., Grams, C., Hitchcock, P., et al. (2020a). “Prospects for predicting the type and timing of the surface response after stratospheric events,” in EGU general assembly conference abstracts, Vienna, Austria, May 3–8, 2020 [abstract], 7862.
Domeisen, D. I. V., Butler, A. H., Charlton-Perez, A. J., Ayarzagüena, B., Baldwin, M. P., Dunn-Sigouin, E., et al. (2020b). The role of the stratosphere in subseasonal to seasonal prediction: 2. Predictability arising from stratosphere-troposphere coupling. J. Geophys. Res.: Atmosphere 125 (2), e2019JD030923. doi:10.1029/2019jd030923
Domeisen, D. I. (2019). Estimating the frequency of sudden stratospheric warming events from surface observations of the North Atlantic Oscillation. J. Geophys. Res.: Atmosphere 124 (6), 3180–3194. doi:10.1029/2018JD030077
Domeisen, D. I., Sun, L., and Chen, G. (2013). The role of synoptic eddies in the tropospheric response to stratospheric variability. Geophys. Res. Lett. 40 (18), 4933–4937.
Edmon, H., Hoskins, B., and McIntyre, M. (1980). Eliassen-Palm cross sections for the troposphere. J. Atmos. Sci. 37 (12), 2600–2616.
Feng, W., Kaifler, B., Marsh, D. R., H?Ffner, J., Hoppe, U. P., Williams, B. P., et al. (2017). Impacts of a sudden stratospheric warming on the mesospheric metal layers. J. Atmos. Sol. Terr. Phys. 125, 162–171. doi:10.1016/j.jastp.2017.02.004
Feng, W., Marsh, D. R., Chipperfield, M. P., Janches, D., H?Ffner, J., Yi, F., et al. (2013). A global atmospheric model of meteoric iron. J. Geophys. Res.: Atmos. 118 (16), 9456–9474. doi:10.1002/jgrd.50708
Garfinkel, C. I., White, I., Gerber, E. P., Jucker, M., and Erez, M. (2020). The building blocks of Northern Hemisphere wintertime stationary waves. J. Clim. 33 (13), 5611–5633. doi:10.1175/JCLI-D-19-0181.1
Gillett, N. P., Allen, M. R., McDonald, R. E., Senior, C. A., Shindell, D. T., and Schmidt, G. A. (2002). How linear is the Arctic Oscillation response to greenhouse gases?. J. Geophys. Res.: Atmosphere 107 (D3), ACL 1-1–ACL 1-7. doi:10.1029/2001JD000589
Haynes, P. H., McIntyre, M. E., Shepherd, T. G., Marks, C. J., and Shine, K. P. (1991). On the “downward control” of extratropical diabatic circulations by eddy-induced mean zonal forces. J. Atmos. Sci. 48 (4), 651–678. doi:10.1175/1520-0469(1991)048<0651:Otcoed>2.0.Co.2
Haynes, P. H., and Shepherd, T. G. (1989). The importance of surface pressure changes in the response of the atmosphere to zonally-symmetric thermal and mechanical forcing. Q. J. R. Meteorol. Soc. 115 (490), 1181–1208. doi:10.1002/qj.49711549002
He, Y., Sheng, Z., and He, M. (2020). The interaction between the turbulence and gravity wave observed in the middle stratosphere based on the round-trip intelligent sounding system. Geo. Res. Lett. 47 (15), e2020GL088837. doi:10.1029/2020GL088837
Hill, D. J., Csank, A. Z., Dolan, A. M., and Lunt, D. J. (2011). Pliocene climate variability: northern Annular Mode in models and tree-ring data. Palaeogeogr. Palaeoclimatol. Palaeoecol. 309 (1), 118–127. doi:10.1016/j.palaeo.2011.04.003
Hu, D., Guo, Y., Wang, F., Xu, Q., Li, Y., Sang, W., et al. (2017). Brewer–dobson circulation: recent-past and near-future trends simulated by chemistry-climate models. Advances in Meteorology 2017, 2913895. doi:10.1155/2017/2913895
Hu, D., Tian, W., Xie, F., Shu, J., and Dhomse, S. (2014). Effects of meridional sea surface temperature changes on stratospheric temperature and circulation. Adv. Atmos. Sci. 31 (4), 888–900. doi:10.1007/s00376-013-3152-6
Inoue, T., and Matsumoto, J. (2004). A comparison of summer sea level pressure over east Eurasia between NCEP-NCAR reanalysis and ERA-40 for the period 1960-99. JMSJ Ser.II. 82 (3), 951–958. doi:10.2151/jmsj.2004.951
Kalnay, E., Kanamitsu, M., Kistler, R., Collins, W., Deaven, D., Gandin, L., et al. (1996). The NCEP/NCAR 40-year reanalysis Project. Bull. Am. Meteorol. Soc. 77 (3), 437–472. doi:10.1175/1520-0477(1996)077<0437:Tnyrp>2.0.Co.2
Kim, J. S., Kug, J. S., Jeong, S. J., Park, H., and Schaepman-Strub, G. (2020). Extensive fires in southeastern Siberian permafrost linked to preceding Arctic Oscillation. Sci Adv. 6 (2), eaax3308. doi:10.1126/sciadv.aax3308
Kodera, K., Mukougawa, H., and Itoh, S. (2008). Tropospheric impact of reflected planetary waves from the stratosphere. Geophys. Res. Lett. 35 (16). doi:10.1029/2008gl034575
Kodera, K., Yamazaki, K., Chiba, M., and Shibata, K. (1990). Downward propagation of upper stratospheric mean zonal wind perturbation to the troposphere. Geophys. Res. Lett. 17 (9), 1263–1266. doi:10.1029/GL017i009p01263
Kolstad, E. W., and Charlton-Perez, A. J. (2011). Observed and simulated precursors of stratospheric polar vortex anomalies in the Northern Hemisphere. Clim. Dynam. 37 (7), 1443–1456. doi:10.1007/s00382-010-0919-7
Kuroda, Y. (2008). Effect of stratospheric sudden warming and vortex intensification on the tropospheric climate. J. Geophys. Res.: Atmosphere 113 (D15). doi:10.1029/2007JD009550
Kuroda, Y. (2002). Relationship between the polar-night jet oscillation and the annular mode. Geophys. Res. Lett. 29 (8), 132–131. doi:10.1029/2001gl013933
Lawrence, Z., Perlwitz, J., Butler, A., Manney, G., Newman, P., Lee, S., et al. (2020). The remarkably strong arctic stratospheric polar vortex of winter 2020: links to record-breaking arctic oscillation and ozone loss. JGR Atoms. 125 (22), e2020JD033271. doi:10.1029/2020JD033271
Li, X., Zhai, G., Gao, S., and Shen, X. (2015). Decadal trends of global precipitation in the recent 30 years. Atmos. Sci. Lett. 16 (1), 22–26. doi:10.1002/asl2.514
Limoges, A., Weckström, K., Ribeiro, S., Georgiadis, E., Hansen, K. E., Martinez, P., et al. (2020). Learning from the past: impact of the Arctic Oscillation on sea ice and marine productivity off northwest Greenland over the last 9000 years. Global Change Biol. 26 (12), 6767–6786. doi:10.1111/gcb.15334
Limpasuvan, V., Hartmann, D. L., Thompson, D. W., Jeev, K., and Yung, Y. L. (2005). Stratosphere‐troposphere evolution during polar vortex intensification. J. Geophys. Res.: Atmosphere 110 (D24), 1, 2, 10, 11. doi:10.1029/2005JD006302
Lin, L. I., Chongyin, L. I., and Song, J. (2012). Arctic Oscillation anomaly in winter 2009/2010 and its impacts on weather and climate. Sci. China Earth Sci. 055 (4), 567–579. doi:10.1007/s11430-011-4329-4
Lorenz, D. J., and Hartmann, D. L. (2003). Eddy–zonal flow feedback in the northern Hemisphere winter. J. Clim. 16 (8), 1212–1227. doi:10.1175/1520-0442(2003)16<1212:Effitn>2.0.Co.2
Ma, J., Chen, W., Nath, D., and Lan, X. (2020). Modulation by ENSO of the relationship between stratospheric sudden warming and the madden‐julian oscillation. Geophys. Res. Lett. 47, e2020GL088894. doi:10.1029/2020GL088894
Mai, Y., Sheng, Z., Shi, H., Liao, Q., and Zhang, W. (2020). Spatiotemporal distribution of atmospheric ducts in Alaska and its relationship with the arctic vortex. Int. J. Antenn. Propag. 2020, 9673289. doi:10.1155/2020/9673289
Matsuno, T. (1971). A dynamical model of the stratospheric sudden warming. J. Atmos. Sci. 28 (8), 1479–1494. doi:10.1175/1520-0469(1971)028<1479:Admots>2.0.Co.2
Matsuno, T. (1970). Vertical propagation of stationary planetary waves in the winter northern Hemisphere. J. Atmos. Sci. 27 (6), 871–883. doi:10.1175/1520-0469(1970)027<0871:Vpospw>2.0.Co.2
Minami, A., and Takaya, Y. (2020). Enhanced northern Hemisphere correlation skill of subseasonal predictions in the strong negative phase of the arctic oscillation. J. Geophys. Res.: Atmosphere 125, e2019JD031268. doi:10.1029/2019JD031268
Negrón Juárez, R. I., Li, W., Fu, R., Fernandes, K., and de Oliveira Cardoso, A. (2009). Comparison of precipitation datasets over the tropical South American and African continents. J. Hydrometeorol. 10 (1), 289–299. doi:10.1175/2008JHM1023.1
Nishii, K., Nakamura, H., and Miyasaka, T. (2009). Modulations in the planetary wave field induced by upward-propagating Rossby wave packets prior to stratospheric sudden warming events: a case-study. Q. J. R. Meteorol. Soc. 135 (638), 39–52. doi:10.1002/qj.359
Rao, J., Garfinkel, C. I., Chen, H., and White, I. P. (2019a). The 2019 New Year stratospheric sudden warming and its real‐time predictions in multiple S2S models. J. Geophys. Res.: Atmosphere 124 (21), 11155–11174. doi:10.1029/2019JD030826
Rao, J., Ren, R., Chen, H., Liu, X., Yu, Y., Hu, J., et al. (2019b). Predictability of stratospheric sudden warmings in the Beijing Climate Center forecast system with statistical error corrections. J. Geophys. Res.: Atmosphere 124 (15), 8385–8400. doi:10.1029/2019JD030900
Rao, J., Garfinkel, C. I., and White, I. P. (2020a). Predicting the downward and surface influence of the february 2018 and january 2019 sudden stratospheric warming events in subseasonal to seasonal (S2S) models. J. Geophys. Res.: Atmos. 125 (2), e2019JD031919. doi:10.1029/2019jd031919
Rao, J., Garfinkel, C. I., White, I. P., and Schwartz, C. (2020b). The southern Hemisphere minor sudden stratospheric warming in september 2019 and its predictions in S2S models. J. Geophys. Res.: Atmosphere 125 (14), e2020JD032723. doi:10.1029/2020jd032723
Rind, D., and Lacis, A. (1993). The role of the stratosphere in climate change. Surv. Geophys. 14 (2), 133–165.
Rind, D., Perlwitz, J., and Lonergan, P. (2005). AO/NAO response to climate change: 1. Respective influences of stratospheric and tropospheric climate changes. J. Geophys. Res.: Atmosphere 110 (D12), 1, 2. doi:10.1029/2004jd005103
Sewall, J., and Sloan, L. (2001). Equable Paleogene climates: the result of a stable, positive Arctic Oscillation?. Geophys. Res. Lett. 28, 3693–3695. doi:10.1029/2001GL013776
Sheng, Z., Zhou, L., and He, Y. (2020). Retrieval and analysis of the strongest mixed layer in the troposphere. Atmosphere 11 (3), 264. doi:10.3390/atmos11030264
Shuwen, Y., and Jun, N. (2013). Interannual and interdecadal variations of the upper level zonal circulation. ence Edu. Arti. Coll. doi:10.1002/qj.49710343705
Sigmond, M., Scinocca, J., Kharin, V., and Shepherd, T. (2013). Enhanced seasonal forecast skill following stratospheric sudden warmings. Nat. Geosci. 6 (2), 98–102. doi:10.1038/ngeo1698
Taguchi, M. (2020). Verification of subseasonal-to-seasonal forecasts for major stratospheric sudden warmings in northern winter from 1998/99 to 2012/13. Adv. Atmos. Sci. 37 (3), 250–258. doi:10.1007/s00376-019-9195-6
Taguchi, M. (2017). A study of different frequencies of major stratospheric sudden warmings in CMIP5 historical simulations. J. Geophys. Res.: Atmos. 122 (10), 5144–5156. doi:10.1002/2016jd025826
Taguchi, M. (2018). Comparison of subseasonal‐to‐seasonal model forecasts for major stratospheric sudden warmings. J. Geophys. Res.: Atmos. 123 (18), 10231–10247. doi:10.1029/2018JD028755
Thompson, D. W. J., and Wallace, J. M. (1998). The Arctic oscillation signature in the wintertime geopotential height and temperature fields. Geophys. Res. Lett. 25 (9), 1297–1300. doi:10.1029/98GL00950
Xie, P., and Arkin, P. A. (1997). Global precipitation: a 17-year monthly analysis based on gauge observations, satellite estimates, and numerical model outputs. Bull. Am. Meteorol. Soc. 78 (11), 2539–2558.
Xie, F., Li, J., Zhang, J., Tian, W., Hu, Y., Zhao, S., et al. (2017a). Variations in North Pacific sea surface temperature caused by Arctic stratospheric ozone anomalies. Environ. Res. Lett. 12 (11), 114023. doi:10.1088/1748-9326/aa9005
Xie, F., Zhang, J., Sang, W., Li, Y., Qi, Y., Sun, C., et al. (2017b). Delayed effect of Arctic stratospheric ozone on tropical rainfall. Atmos. Sci. Lett. 18 (10), 409–416. doi:10.1002/asl.783
Xie, P., Arkin, P. A., and Janowiak, J. E. (2007). “CMAP: the CPC merged analysis of precipitation,” in Measuring precipitation from space: EURAINSAT and the future. Editors V. Levizzani, P. Bauer, and F. J. Turk (Dordrecht: Springer Netherlands), 319–328.
Yang, S., Lau, K.-M., and Kim, K.-M. (2002). Variations of the east asian jet stream and asian–pacific–American winter climate anomalies. J. Clim. 15 (3), 306–325. doi:10.1175/1520-0442(2002)015<0306:Voteaj>2.0.Co.2
Yin, X., Gruber, A., and Arkin, P. (2004). Comparison of the GPCP and CMAP merged gauge–satellite monthly precipitation products for the period 1979–2001. J. Hydrometeorol. 5 (6), 1207–1222. doi:10.1175/JHM-392.1
Yu, Y., Cai, M., and Ren, R. (2018a). A stochastic model with a low-frequency amplification feedback for the stratospheric northern annular mode. Clim. Dynam. 50 (9), 3757–3773. doi:10.1007/s00382-017-3843-2
Yu, Y., Cai, M., Shi, C., and Ren, R. (2018b). On the linkage among strong stratospheric mass circulation, stratospheric sudden warming, and cold weather events. Mon. Weather Rev. 146 (9), 2717–2739. doi:10.1175/mwr-d-18-0110.1
Yu, Y., Cai, M., Shi, C., Yan, R., and Rao, J. (2019). Sub-seasonal prediction skill for the stratospheric meridional mass circulation variability in CFSv2. Clim. Dynam. 53 (1), 631–650. doi:10.1007/s00382-018-04609-9
Zhao, X. R., Sheng, Z., Li, J. W., Yu, H., and Wei, K. J. (2019). Determination of the “wave turbopause” using a numerical differentiation method. J. Geophys. Res.: Atmosphere 124 (20), 10592–10607. doi:10.1029/2019jd030754
Keywords: polar vortex, circulation, Arctic Oscillation index (AOI), upward propagating planetary waves (UPPWs), climate anomaly, splitting characteristics
Citation: Zhang J, Sheng Z, Ma Y, He Y, Zuo X and He M (2021) Analysis of the Positive Arctic Oscillation Index Event and Its Influence in the Winter and Spring of 2019/2020. Front. Earth Sci. 8:580601. doi: 10.3389/feart.2020.580601
Received: 06 July 2020; Accepted: 28 December 2020;
Published: 08 February 2021.
Edited by:
Yuqing Wang, University of Hawaii at Manoa, United StatesReviewed by:
Eduardo Zorita, Helmholtz Centre for Materials and Coastal Research (HZG), GermanyJian Rao, Nanjing University of Information Science and Technology, China
Chaim Garfinkel, Hebrew University of Jerusalem, Israel
Copyright © 2021 Zhang, Sheng, Ma, He, Zuo and He. This is an open-access article distributed under the terms of the Creative Commons Attribution License (CC BY). The use, distribution or reproduction in other forums is permitted, provided the original author(s) and the copyright owner(s) are credited and that the original publication in this journal is cited, in accordance with accepted academic practice. No use, distribution or reproduction is permitted which does not comply with these terms.
*Correspondence: Zheng Sheng, MTk5OTQwMzVAc2luYS5jb20=