 Orlando Álvarez
 Stefanie Pechuan Canet2
 Andrés Folguera
- 1Instituto Geofísico y Sismológico Ing. Volponi, FCEFyN, Universidad Nacional de San Juan, San Juan, Argentina
- 2Consejo Nacional de Investigaciones Científicas y Técnicas, Buenos Aires, Argentina
- 3IDEAN – Instituto de Estudios Andinos “Don Pablo Groeber”, Departamento de Cs. Geológicas, FCEN, Universidad de Buenos Aires, Buenos Aires, Argentina
During the last two decades, space geodesy allowed mapping accurately rupture areas, slip distribution, and seismic coupling by obtaining refined inversion models and greatly improving the study of great megathrust earthquakes. A better understanding of these phenomena involving large areas of hundreds of square kilometers came from the last gravity satellite mission that allowed detecting mass transfer through the Earth interior. In this work, we performed direct modeling of satellite GOCE (Gravity Field and Steady-State Ocean Circulation Explorer) derived gravity gradients up to degree/order N = 200 of the harmonic expansion and then corrected this by the effect of topography. Cutting off the model up to this degree/order allows inferring mass heterogeneities located at an approximate depth of 31 km, just along the plate interface where most (but not all) significant slip occurs. Then, we compared the vertical gravity gradient to well-constrained coseismic slip models for three of the last major earthquakes along the Sunda interface. We analyzed seismic rupture behavior for recent and for historical earthquakes along this subduction margin and the relationship of the degree of interseismic coupling using the gravity signal. From this, we found that strong slip patches occurred along minima gravity gradient lobes and that the maximum vertical displacements were related quantitatively to the gravity-derived signal. The degree of interseismic coupling also presents a good correspondence to the vertical gravity gradient, showing an inverse relationship, with low degrees of coupling over regions of relatively higher density. This along-strike segmentation of the gravity signal agrees with the along-strike seismic segmentation observed from recent and historical earthquakes. The thermally controlled down-dip ending of the locked fault zone along central Sumatra also presented an inverse relationship with the density structure along the forearc inferred using our modeling. From this work, we inferred different mass heterogeneities related to persistent tectonic features along the megathrust and along the marine forearc, which may control strain accumulation and release along the megathrust. Combining these data with geodetical and seismological data could possibly delimit and monitor areas with a higher potential seismic hazard around the world.
Introduction
Numerous major to great earthquakes had affected the Sunda subduction system in the past, with some giant events in the last decades from Southern Sumatra to the Andaman Islands. This region is characterized by lateral variations of the convergence rate and obliquity that occur gradually (Chlieh et al., 2008) as the Indo and Australian plates are thrust beneath the Sunda plate. This work divided this subduction zone into four main segments according to the historical earthquakes that affected the margin. Along the Northern section occurred the great Mw = 9.15 2004 Sumatra-Andaman earthquake, one of the four largest earthquakes recorded in instrumental times and the largest of the last 40 years (Lay et al., 2005; Stein and Okal, 2005; Klingelhoefer et al., 2010). This segment ranges from the Simeulue Is. located at 2.5° N to the Andaman Is. to the North (Figures 1, 2). The Nias segment is located between Simeulue Is. and the Batu Islands; this central segment broke during the Mw = 8.6 2005 event (Briggs et al., 2006; Hsu et al., 2006; Konca et al., 2007) and previously in 1861 (∼Mw 8.5, Newcomb and McCann, 1987). To the South of this area, the central Sumatra margin beneath the Mentawai Islands (Figures 1, 2) had many major earthquakes in the past (Figures 1–3), e.g., in 1797 (Mw = 8.78.9), 1833 (Mw = 8.9–9.1), and 1861 (Newcomb and McCann, 1987; Zachariasen et al., 1999; Sieh et al., 2004; Natawidjaja et al., 2006) and even recently in 2007 with a Mw = 8.4. The last segment is located to the South of Enggano Is. Only moderate earthquakes have been reported, such as the 2000 Mw = 7.9 Enggano Is. earthquake (Abercrombie et al., 2003).
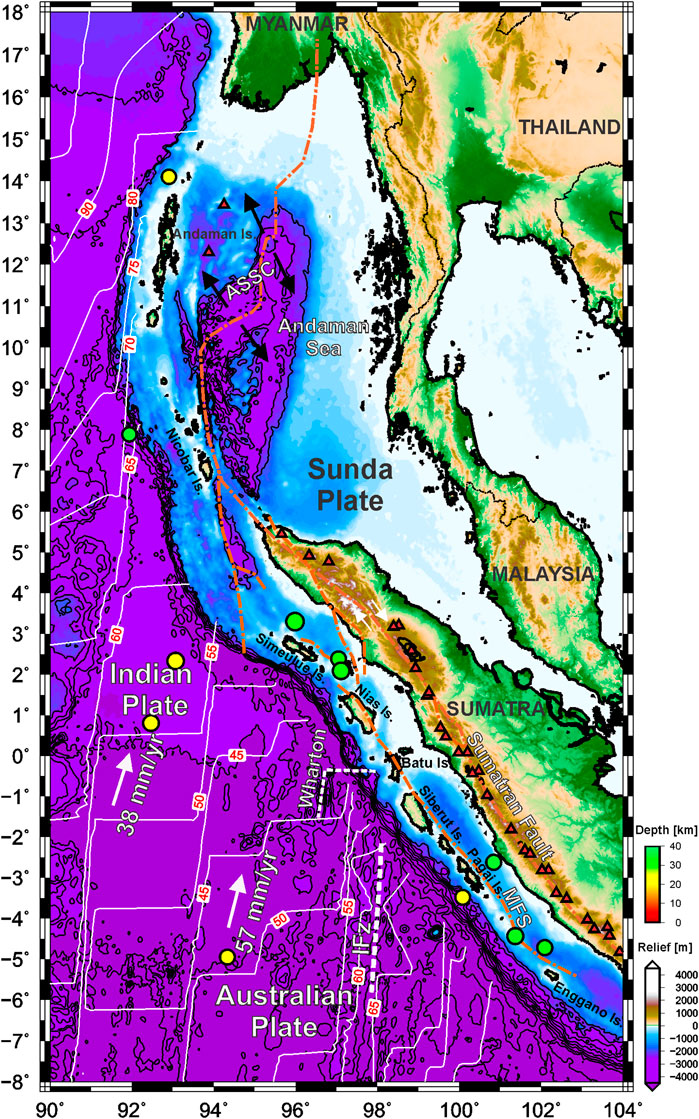
FIGURE 1. Relief map of the Australian, Indian, and Sunda plates from ETOPO1 (Amante and Eakins, 2009) with main bathymetric features. Orange dot and dashed line indicate the main faults as the Sumatran, Andaman, and Mentawi fault system (MFS). In this region, the Indian plate subducts obliquely beneath the Eurasian plate along the Sunda subduction zone at an approximate rate convergence of 39 mm/yr Chlieh et al. (2008). White arrows in the Andaman Sea indicate the Andaman Sea Spreading Center (ASSC). Plates rate convergence is from Chlieh et al. (2008), plate ages (white solid lines) are from Müller et al. (2008), red triangles indicate the volcanic arc (Siebert and Simkin, 2002), and white dashed lines indicate the Wharton fossil ridge and the investigator fracture zone (Fz). Circles indicate earthquakes with Mw > 7.5 from 2000 A.D (from USGS); the upper color bar indicates earthquake depth.
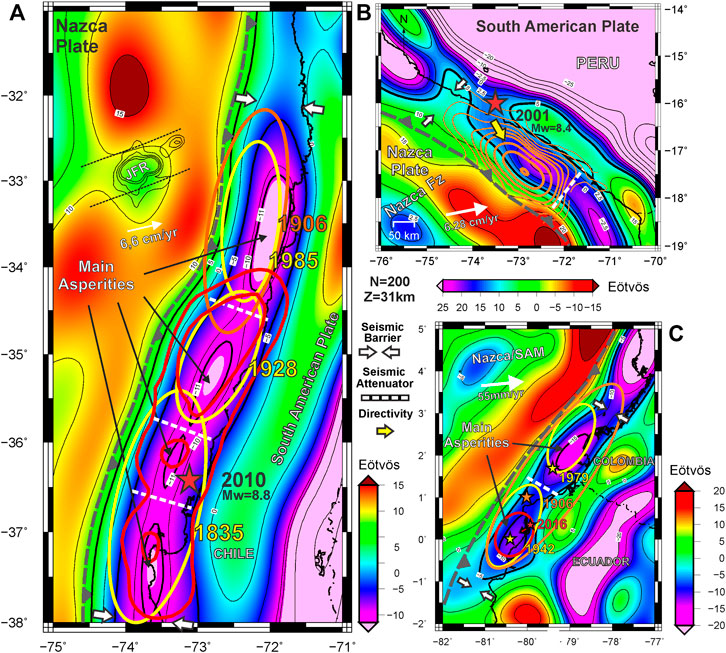
FIGURE 2. Topography corrected vertical gravity gradient obtained from GOCE satellite-only model GO_CONS_GCF_2_DIR_R5 (Bruinsma et al., 2013) up to N = 200. (A) Slip distribution (red solid line) for the Mw = 8.8 2010 Maule earthquake (Moreno et al., 2012), the −5 Eötvös contour (thick black line) roughly coincides with the seismogenic zone along the forearc. The −10 Eötvös contour coincides with the location of maximum slip lobes. Solid white arrows indicate a narrowing of the Tzz minima contours, which corresponds to main slip limits along strike (Alvarez et al., 2014; Alvarez et al., 2019b). Nazca-South American plates convergence (black arrow) is from DeMets et al. (2010). (B) Slip distribution for the Mw = 8.4 2001 Arequipa earthquake (Chlieh et al., 2011). The +5 Eötvös contour (thick black line) depicts higher densities to the NW and SE of the epicenter along the forearc (Alvarez et al., 2015; Alvarez et al., 2019a). A low Tzz anomaly to the SSE of the epicenter connects to the maximum slip, following the rupture propagation in the Southward direction (blank white arrow). Nazca-South American plates convergence (white arrow) is from Kendrick et al. (2003). (C) Historical ruptures along the Ecuador-Colombia margin (Alvarez et al., 2017b; Alvarez et al., 2019b). Red star indicates the epicenter’s location and the Perú-Chilean trench is indicated with a gray dashed line.
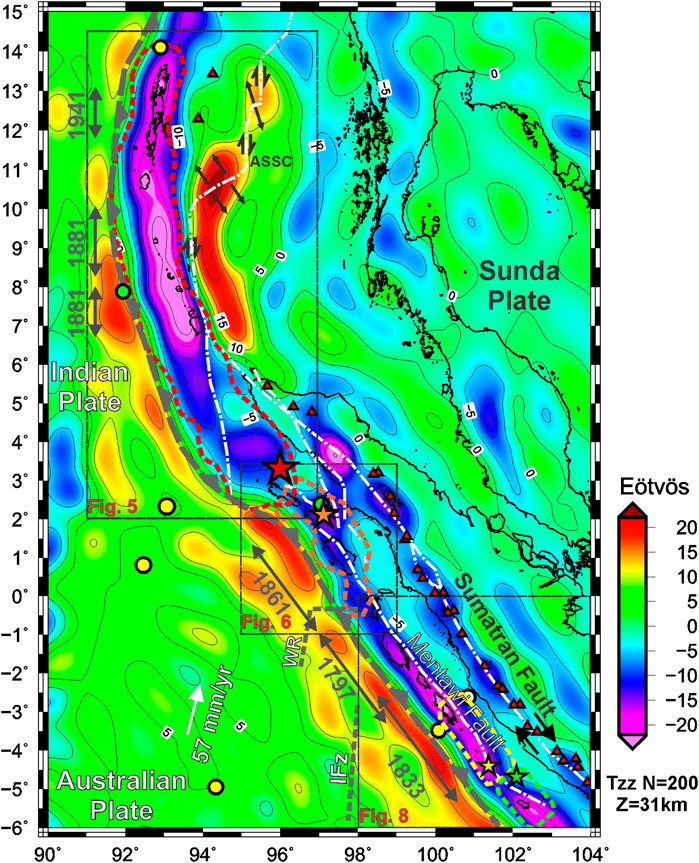
FIGURE 3. Topography corrected vertical gravity gradient (Tzz) obtained from GOCE model GO_CONS_GCF_2_DIR_R6 up to N = 200 (Bruinsma et al., 2014). The forebulge presents a high gravity gradient signal while lower to negative values are observed along the outer forearc, to the Northwest is clearly depicted the Andaman Sea Spreading Center (ASSC). Historical great earthquakes are indicated with gray double-arrows. The dimensions of the approximate rupture areas for four of the last great earthquakes along the Sumatra-Andaman margin are indicated with dashed lines. Stars indicate epicenter location of the Mw = 9.15 2004 Sumatra-Andaman earthquake (yellow), the Mw = 8.6 2005 Nias–Simeulue earthquake (orange), the Mw = 7.9 2007 Kepulauan-Mentawai earthquake (red), and the Mw = 7.9 2000 Southern Sumatra earthquake (green). Rectangles indicate the location of Figures 5, 6, and 8. IFz: investigator fracture zone, WR: Wharton ridge.
Different hypotheses have been proposed about the variables governing heterogeneous seismic behavior along the megathrust (e.g., thermal structure, subducting sediments and high oceanic features, and the forearc structure’s variable weight). These proposals were tested and studied through different methods and databases without any general conclusive result, leaving numerous open questions. One of them is the degree of interaction between the forearc density structure along the megathrust and seismic rupture behavior. From the early works of Song and Simons (2003) and Wells et al. (2003), it is expected that strong negative gravity anomalies between the coast and the trench correlate geographically to maximum coseismic slip for giant earthquakes.
The last authors proposed that large coseismic slip is associated with forearc gravity lows related to active basins and enhanced subduction erosion. Later, Llenos and Mc Guire (2007) related negative gravity variations to high-shear traction on the interplate thrust, associated with an increase in the effective coefficient of friction. The different variables governing this relationship have been proposed; e.g., changes of vertical stress loading due to forearc density structure produce lateral variations of shear strength, as stated by other authors (e.g., Sobiesak et al., 2007; Tassara 2010; among others).
Gravity modeling has proven to be useful for mapping the structure, geometry, and seismic segmentation of the interplate megathrust (e.g., Llenos and Mc Guire, 2007; Sobiesiak et al., 2007; Tassara, 2010; Alvarez et al., 2014; Alvarez et al., 2019a) and also for observing mass variations inside the Earth after great earthquakes. The Sumatra-Andaman earthquake has become one of the most studied from satellite gravimetry, particularly from the GRACE (Gravity Recovery and Climate Experiment) mission. Coseismic and postseismic gravity changes detected from this mission allowed for detecting deformation and a crustal dilatation resulting from this earthquake (e.g., Han et al., 2006; Chen et al., 2007; Panet et al., 2007).
We explore the seismic structure along the Sunda subduction zone from the GO_CONS_GCF_2_DIR_R6 satellite GOCE (Gravity Field and Steady-State Ocean Circulation Explorer) derived model (Bruinsma et al., 2014), as we made previously for the South American subduction margin (see Alvarez et al., 2019a and references therein). Then we compare the vertical gravity gradient to coseismic slip models for recent earthquakes, rupture areas for historical earthquakes, and the degree of interseismic coupling and the thermal structure along a portion of this margin.
Mapping Asperities Along the Megathrust From the Vertical Gravity Gradient (Tzz)
Despite the numerous studies carried out based on the mass changes detected by satellite gravimetry, the behavior of the rupture during the earthquake based on satellite-derived gradient data had not been addressed until the recent works of Alvarez et al. (2019a) and Alvarez et al. (2019b) and references therein. Following the pioneering works from Song and Simons (2003) and Wells et al. (2003), we found that minimum lobes in the negative vertical gravity gradient Tzz (the second vertical derivative of the anomalous potential) from GOCE present an inverse relationship with maximum slip areas during great megathrust earthquakes. This quantity (Tzz) offers a better spatial resolution than the gravity anomaly for mapping shallower mass anomalies (e.g., Li, 2001; Braitenberg et al., 2011; Alvarez et al., 2012).
In a recent review, Alvarez et al. (2019a) and references therein highlighted this relationship, mapping asperities and barriers (Lay et al., 1982), and showing how the gravity signal could also explain the directivity effect for some of these events (seismic asperities are interpreted as the site where the maximum seismic moment is released during large interplate earthquakes). They also proposed that the density structure (derived from GOCE satellite data at long wavelengths) affects the forearc region’s seismic behavior, mainly for these large-magnitude events.
Other works (e.g., Hicks et al., 2014) pointed out a moderate positive correlation between gravity and seismic velocity Vp from a seismic tomography in the lower forearc for the 2010 Maule earthquake. This relationship was also observed by Alvarez et al. (2019a) using GOCE derived vertical gradient (Tzz) at a spatial resolution of 80 km, corresponding to the maximum degree and order of the spherical harmonic expansion N = 250 and with Z = 25 km. In previous work, Sobiesak et al. (2007) found along the Northern Chilean margin that seismic b-value was correlated with geologic structures mapped by isostatic residual gravity anomalies. Now, we explore these relationships along the Sunda subduction zone, one of the regions of most significant interest on a global scale for the study of great megathrust earthquakes.
Methodology
Satellite Data and Gravity Derivatives
For calculation of the gravity derivatives, we used the satellite GOCE static model GO_CONS_GCF_2_DIR_R6 (Bruinsma et al., 2014), which is a full combination of data from GOCE-SGG (Satellite Gravity Gradiometer), GOCE-SST (Satellite-to-Satellite Tracking), GRACE (Gravity Recovery and Climatic Experiment), and LAGEOS (Laser GEOdynamics Satellite). The disturbing potential (T) is derived by subtracting the reference ellipsoid’s normal potential field (WGS84) from the observed potential. We calculated the disturbing potential by direct modeling from the spherical harmonic coefficients (Janak and Sprlak, 2006) of the GOCE mentioned above model. Then the vertical gravity gradient (Tzz) was obtained on a regular grid of 0.05° grid cell size as the second radial derivative of T (Rummel et al., 2011):
Tzz is expressed in Eötvös and represents a better theoretical resolution than the gravity vector itself for detecting crustal density variations (Li, 2001) (mainly shallower structures with high-density contrast), allowing determination of the edges of anomalous masses with better detail and accuracy. The gravity disturbance presents a spread signal highlighting deeper sources (Braitenberg et al., 2011; Alvarez et al., 2012).
Topographic Correction
To remove the correlation of the satellite-derived gravity signal with topographic masses, Tzz was reduced by the topographic effect. This correction allows highlighting the different (and unknown) density contrasts within the crust.
The topographic contribution calculation requires discretization of a digital elevation model (ETOPO1, Amante and Eakins, 2009) using spherical prisms of constant density (Grombein et al., 2013). Using a spherical approximation, the Earth’s curvature was taken into account, avoiding considerable errors over the large study region. Then, the effect generated by the topographic masses on the gravity field and over its derivatives was calculated following Newton’s law of universal gravitation.
We performed the topography contribution calculation to Tzz using the Tesseroids Phyton package from Uieda et al. (2016). Densities used are mean standard values of 2,670 kg/m3 for masses above sea level and 1,030 kg/cm3 for seawater. The calculation height selected is of 3,000 m to ensure that all values are above the topography. Before satellite data reduction, the topographic effect contribution was filtered using a 4th order Butterworth filter at 133 km wavelength to compare to satellite data at similar wavelengths.
Tzz Harmonic Decomposition From Spherical Coefficients
In previous works, we found that, by limiting the harmonic expansion to degree and order N = 200, we reached an exploration depth of approximately 30 km. At this exploring depth, where the shallow portion of the plate interface (megathrust) is located, we found the best correlation between slip distribution and Tzz.
The harmonic decomposition from spherical coefficients is based on Featherstone (1997), who performed a spectral analysis of the geoid and gravity anomalies and found that limiting the degree/order allows decomposition of the gravimetric signal as causative mass depth increases. By deriving a similar equation (Eq. 2) (see Alvarez et al., 2017a and references therein) the depth (Zl) of a causative mass was related to a determined degree of the spherical harmonic expansion (N) for the Tzz:
where, for an Earth’s radius RE of approximately 6,371 km, Tzz calculation height HC of 3,000 m, and a degree/order of the harmonic expansion N = 200, we obtained an exploration depth of approximately 31 km. Table 1 shows the depth Zl and corresponding spatial resolution for different degrees/orders of the harmonic expansion. Higher orders are associated with shallower sources (low Zl), while low orders are related to deeper mass anomalies (higher Zl).
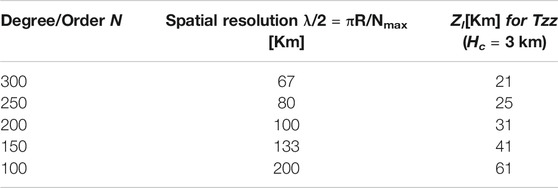
TABLE 1. Approximated depth (Zl) of a causative mass for a determined degree of the spherical harmonic expansion for Tzz and corresponding spatial resolution (Alvarez et al., 2017a).
Results and Discussion
From the early 2000 A.D., more than ten earthquakes with Mw > 7.5 affected the Sumatra-Andaman margin, four of them with Mw > 8 (two offshore in the region of the Indian Ocean) and one of the four Mw > 9.0 registered. Some of these events have been extensively studied and accurately modeled from different datasets with widely distributed seismic and GPS networks along the margin and with sea bottom sensors resulting in well-constrained slip models (e.g., Abercrombie et al., 2003; Briggs et al., 2006; Chlieh et al., 2007; Konca et al., 2007; Konca et al., 2008). Some works also found meaningful mass redistribution from gravity changes detected by the GRACE satellite (Han et al., 2006; Chen et al., 2007; Panet et al., 2007). In this work, we analyze the rupture propagation pattern for some of these events and its relation with the distribution of crustal mass heterogeneities from satellite GOCE derived data.
At first glance over the gradient signal (Figure 2), we can highlight the positive effect of the Australian and Indian oceanic plates, which is enhanced at the forebulge (outer rise), reaching more than +10 Eötvös. Between 0° and 2.5° N it is important to highlight an anomalous region where the positive expression of the forebulge presents an abnormal behavior compared to other regions along the margin (i.e., presents an inflection toward the Simeulue and Nias Islands). In this region, Franke et al. (2008) observed (based on marine geophysical data acquired offshore Simeulue in 2006) that the top of the oceanic crust presents a significant deepening toward the SE and suggested that the segmentation of the margin at this latitude is caused by a ridge currently undergoing subduction.
To the South of this (Figures 2, 4), the high positive signal along the forebulge is segmented at the collision points of the Wharton fossil ridge and at the investigator Fz. Relatively higher values in Tzz lobes (>+15 Eötvös) are observed along the outer rise, not only offshore Simeulue and Nias Islands but at the offshore of Batu, Siberut, and Pagai Islands (Mentawi Is.). Henstock et al. (2016) had already identified different regions of positive residual gravity, namely, 1° offshore Nias beneath the accretionary prism (that corresponds to an area of active uplift: Cook et al., 2014); 2° offshore the Batu Islands (reported as a series of positive residuals immediately adjacent to the location of the extinct WFR: Liu et al., 1983); and 3° offshore Siberut (where positive residuals were found aligned with fracture zones in the subducting plate).
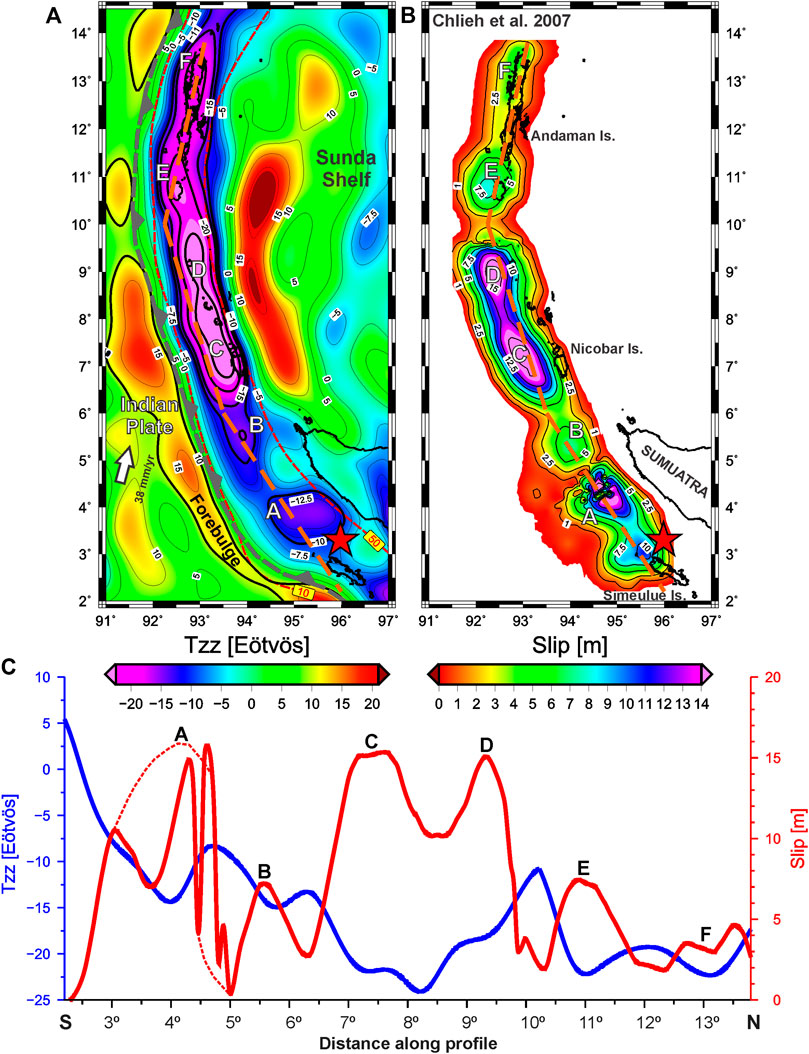
FIGURE 4. (A) Topography corrected vertical gravity gradient (Tzz) obtained from GOCE model GO_CONS_GCF_2_DIR_R6 up to N = 200 (Bruinsma et al., 2014). Slab depths of 10 km and 50 km from Slab 2.0 of Hayes (2018) are plotted with red dashed lines. (B) Slip model for the Mw = 9.15 2004 Sumatra-Andaman earthquake (Chlieh et al., 2007). (C) Latitudinal profile along the Tzz signal (blue) and along the slip model (red), letters indicate the location of asperities where slip is enhanced. Note that maximum slip coincides with minimum Tzz and vice versa. The red dashed line indicates a “high-wavelength” component of the slip. Letters A to F indicate the location of different seismic asperities where a high amount of energy and minor short-period seismic radiation were released.
Another first-order gravity signature is observed (Figures 2, 5) at the Andaman Sea Spreading Center (ASSC) where two highly positive lobes (with more than +20 Eötvös) indicate a shallower mantle over the divergent plate boundary. Along the trench, the high forebulge gravity rapidly decreases, representing the deepening of the slab, to a negative gradient signal beneath the forearc.
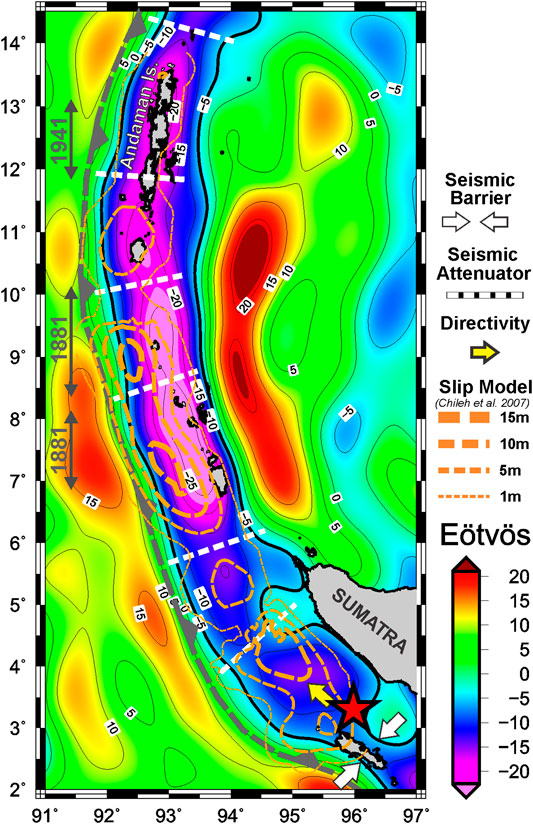
FIGURE 5. Slip model for the Mw = 9.15 2004 Sumatra-Andaman earthquake (Chlieh et al., 2007) superimposed to the topography corrected Vertical Gravity Gradient (Tzz) obtained from GOCE model GO_CONS_GCF_2_DIR_R6 up to N = 200 (Bruinsma et al., 2014). The dashed white line indicates the location of regions that behaved as seismic energy attenuators; white arrows indicate the existence of a seismic barrier that arrested rupture propagation. Historical great earthquakes are indicated with gray double-arrows.
The negative gravity gradient signal along the marine forearc (or between the trench and the coastline along Sumatra) may be in response to lower density material along the accretionary wedge, the deep-sea terrace, marginal basins, and high sediment thickness along the trench, which cannot be differentiated at this spatial resolution without other constraints. This low gravity signal appears to be segmented along strike (Figure 2), with lower values to the North of the Nicobar Is. (<−25 Eötvös), intermediate values between 6° N and −1° S (−5 to −15 Eötvös), and low values in the region of Mentawi Islands to the South (−20 Eötvös approximately). An across-strike segmentation is observed to the North and South of the Mw = 9.15 2004 earthquake and the NE of the Mentawi fault zone (Figures 4–6).
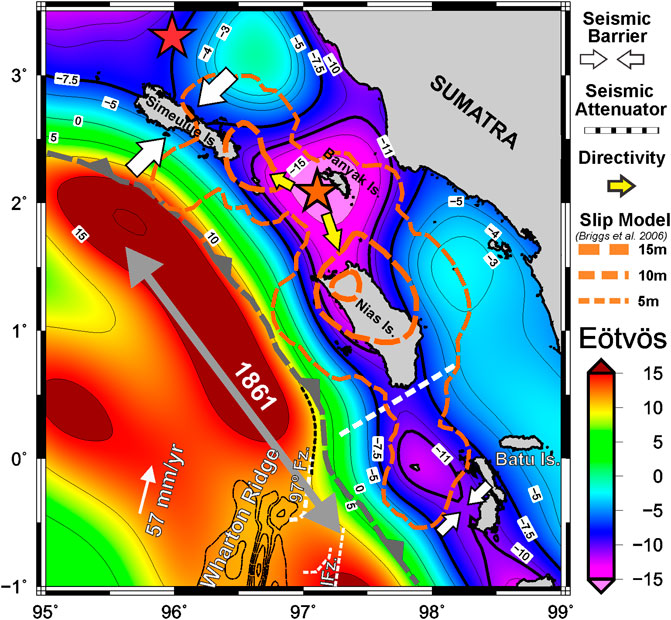
FIGURE 6. Slip model (dashed orange contours) for the Mw = 8.6 2005 Simeulue-Nias earthquake (Briggs et al., 2006) superimposed to the topography corrected vertical gravity gradient (Tzz) obtained from GOCE model GO_CONS_GCF_2_DIR_R6 up to N = 200 (Bruinsma et al., 2014). The dashed white line indicates the location of regions that behaved as seismic energy attenuators; white arrows indicate the existence of a seismic barrier that arrested rupture propagation. The great historical earthquake of 1861 is indicated with gray double-arrows (Newcomb and McCann, 1987).
Along the Southern region (Figures 2, 6), the Mentawi fault zone (MFZ, Diament et al., 1992) can be mapped lying to the East of the outer arc ridge (along the center of the marine forearc) and can be mapped to the North up to the Nias Island where it intersects with other faults that can be tracked following the Tzz contours. Inland, the right-lateral Sumatran Fault System can be observed following Tzz minima over the active volcanic arc.
Along the Sumatra-Andaman region, historical and recent earthquake ruptures coincide with the along-strike segmentation of the gradient signal over the marine forearc (Figure 2), as observed in previous works along the South American active margin (Alvarez et al., 2019a). In the next section, we will compare results derived from satellite GOCE with the slip models of the Mw = 9.15 2004 Sumatra-Andaman earthquake, the Mw = 8.6 2005 Nias–Simeulue earthquake, the Mw = 7.9 2007 Kepulauan-Mentawai earthquake, and the Mw = 7.9 2000 Southern Sumatra earthquake (Figure 2).
The Mw = 9.15 2004 Sumatra-Andaman Earthquake
On December 26, 2004, the NW Sumatra margin was affected by a giant earthquake that initiated to the North of the Simeulue Island (Figures 1, 7) at an approximate depth of 30 km with an estimated magnitude of Mw ∼ 9.15 (Ammon et al., 2005; Lay et al., 2005; Vigny et al., 2005; Chlieh et al., 2007). Rupture extended along the trench from Northern Sumatra to the Andaman Islands; different slip models showed three distinct peaks, reaching up to approximately 20 m, at about 4° N, 7° N, and 9° N (Bilham et al., 2005; Chlieh et al., 2007; Dewey et al., 2007). The seismic rupture was the longest ever recorded (∼515 s), making it difficult to constrain some seismic characteristics using seismological methods. The coseismic slip model from Chlieh et al. (2007), derived from geodetic observations, conciliates the spatial distribution of slip along ∼1,500 km (and width of ∼150 km) with the total released moment of 6.7–7.0 × 1,022 Nm, being one of the most robust, reliable, and better constrained for this earthquake. This model is roughly similar to that estimated from seismological data by Ammon et al. (2005), consistent with the latitudinal seismic moment released and T-waves from Guilbert et al. (2005) and with body waves from Ni et al. (2005).
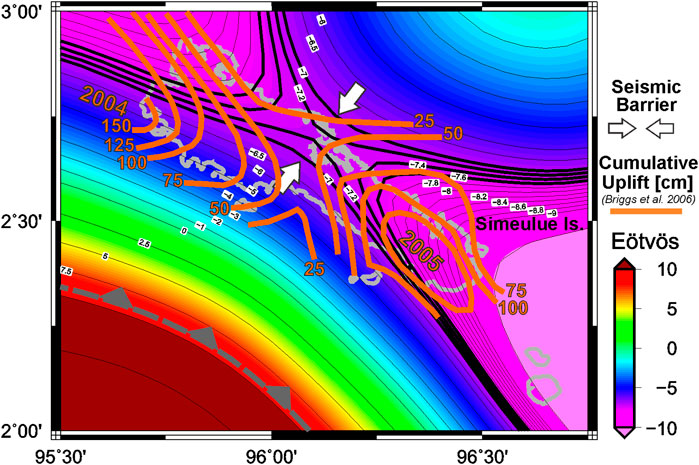
FIGURE 7. Cumulative uplift (solid orange contours) from Briggs et al. (2006), recorded after the 2004 Sumatra-Andaman and the 2005 Simeulue-Nias earthquakes, superimposed to the topography corrected vertical gravity gradient (Tzz) obtained from GOCE model GO_CONS_GCF_2_DIR_R6 up to N = 200 (Bruinsma et al., 2014). White arrows indicate the existence of a seismic barrier that arrested rupture propagation. Note the saddle structure of the cumulative uplift (in cm) that seems to replicate the gravimetric structure, coinciding the minimum in the center of the Island with the local maxima in Tzz interpreted as a seismic barrier to rupture propagation.
Earthquake Rupture Behavior From Tzz
The topography corrected vertical gravity gradient calculated up to N = 200 (Figure 8A) in the region of the Sumatra-Andaman earthquake presents a first-order anticorrelation with the rupture model of Chlieh et al. (2007) (Figure 8B) along the marine forearc. The along-strike segmentation of Tzz (relative maxima) coincides with minimum vertical displacements, while maximum slip patches (A to F) agree with relative minima Tzz (Figure 8C). The slip model shows high-frequency components close to the epicenter that cannot be solved by the long-wavelength characteristic of the GOCE signal. Despite this, assuming a “higher wavelength” trend for slip distribution (dashed line in Figure 8A), the relationship above explained is maintained (high slip over low Tzz). When superimposing the slip model to the Tzz (Figure 5), a slight lateral shift is observed between both quantities. This is interpreted as the positive effect of the subducting plate over the gradient signal masking the low Tzz trend observed along the marine forearc. From the next subsection onwards, we will make a detailed analysis of the above explained.
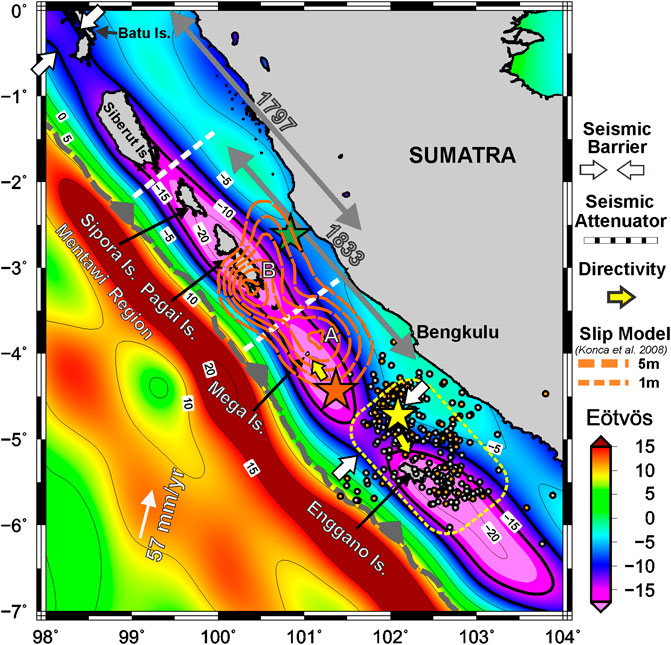
FIGURE 8. Cumulative slip model (dashed orange contours) for the September 2007 sequence (Konca et al., 2008) superimposed to the topography corrected vertical gravity gradient (Tzz) obtained from GOCE model GO_CONS_GCF_2_DIR_R6 up to N = 200 (Bruinsma et al., 2014). Stars indicate epicenter location for each event: Mw = 8.4 (orange), Mw = 7.9 (green). The Enggano 2000 Mw = 7.9 earthquake (yellow star) ruptured to the South as indicated by the aftershock activity (orange circles are from Pan et al. (2001) and gray circles are from USGS database). The dashed yellow rectangle shows the approximate rupture area (Abercrombie et al., 2003). The dashed white line indicates the location of regions that behaved as seismic energy attenuators; white arrows indicate the existence of a seismic barrier that arrested rupture propagation. Historical great earthquakes of 1833 and 1797 are indicated with gray double-arrows (Newcomb and McCann 1987; Natawidjaja et al., 2006).
Northern Directivity
The Sumatra-Andaman earthquake was initiated at ∼3° N with an initially rapid rupture followed by an important slip propagating in the Northward direction to the Andaman Islands at decreasing speed, with little or no slip to South of the epicenter (Banerjee et al., 2005; Lay et al., 2005; Chlieh et al., 2007). The strong unilateral rupture in one preferential direction is known as directivity and has been observed for many great earthquakes (McGuire et al., 2002), including the Mw = 9.6 1960 Valdivia earthquake.
The epicenter for the Sumatra-Andaman earthquake nucleated close to a relatively higher Tzz anomaly (Figure 5), in a region where the Tzz signal shows a narrowing to the South of the epicenter (white arrows in Figure 5) over the Simeulue Island. On the contrary, to the NE of the epicenter is observed a relative lower gradient signal where the first maxima slip patch occurred. Further North, in the vicinity of the Nicobar Islands the minima Tzz obtained along this portion of the Sunda margin are located, where maximum slip patches occurred, both in size and in amplitude. The low Tzz trend bounded by the −5 Eötvös (thick black contour in Figure 5), connecting the hypocenter location (30 km) to the maximum slip patches in the North, could be indicative of first-order structural or compositional characteristics that favored directivity in this direction. This behavior was also observed by means of Tzz for the 1960 Mw = 9.6 Valdivia (Alvarez et al., 2014), 2001 Mw = 8.4 Arequipa, and 2014 Mw = 8.2 Illapel earthquakes (Alvarez et al., 2014; Alvarez et al., 2015; Alvarez et al., 2019a).
Asperities Identification From Tzz
As explained in section 4.1, the latitudinal variation of geodetic moment from Chlieh et al. (2007) shows three distinct peaks, at about 4° N, 7° N, and 9° N. These peaks (A, C, and D in Figure 8B) coincide with the latitudinal variation of the energy radiated by T-waves from Guilbert et al. (2005) and are also consistent with the three distinct bursts of energy of high-frequency diffracted body waves as observed by Ni et al. (2005). These heterogeneities along the interplate megathrust that concentrate high seismic moment release and slip and a high-stress drop are known as asperities, as proposed in the model of Lay and Kanamori (1981) and Lay et al. (1982) and more recently in Lay et al. (2012).
Particularly, the region along the central portion of the megathrust where large earthquakes and high slip occur is named domain B in the model above mentioned. The along-strike segmentation of the vertical gravity gradient (Figure 8) shows different lobes of minimum negative values in agreement with those regions of minor short-period seismic radiation described as large and relatively uniform regions with unstable sliding frictional properties. Quantitatively, the region between 6.5° and 10° N (Figure 8C) where a high amount of energy (with more than +15 m of slip) was released coincides with the region where minimum mean negative Tzz (<−25 Eötvös) is obtained (C and D in Figure 8A). In general, the amount of slip at each asperity (A to F in Figure 8) presents a quantitative relationship (i.e., in the amount of amplitude) to the amplitude of the Tzz signal (see Figure 8C).
Seismic Segmentation and Seismic Barrier at the Simeulue Island
Earthquake magnitude and location are controlled to a high degree by segmentation along convergent margins. These segment boundaries have been mapped along the Chilean margin based on the vertical gravity gradient (Alvarez et al., 2014) and are related to relative positive values in the Tzz (see Figure 7). In work mentioned above, we mapped and differentiated two kinds of segment boundaries (first-order attenuators or barriers and second-order attenuators) based on the limits of different rupture zones (recent and historical ones), the entrance of high oceanic features (e.g., seamounts, aseismic ridges, and fracture zones), and the Tzz. A second-order attenuator differs from a barrier because ruptures across them present a certain overlap, thus indicating a degree of blockage rather than a barrier to rupture propagation. The vertical gravity gradient signal shows higher relative values at the location of second-order attenuators (i.e., a gradual transition between high and low along strike). On the other hand, higher Tzz values or regions where the narrowing of the general trend of low Tzz anomaly along the outer forearc is significant, which in turn are related to the subduction of high oceanic features, were identified as first-order attenuators or barriers.
The 2004 Sumatra-Andaman earthquake terminated abruptly along a common boundary with the 2005 Nias earthquake over the Simuelue Island (Figure 2). In this region, the Tzz signal shows an important narrowing of the −5 Eötvös contour (white arrows in Figure 5), indicating the probable location of a seismic barrier. Franke et al. (2008) found a ridge on the subducting Indo-Australian oceanic crust masked by the sedimentary cover in the trench from joint modeling of wide-angle and reflection seismic data, proposing that it may exert control on margin segmentation. The ridge was interpreted in that work as a fracture zone on the subducting oceanic plate, with most likely trend NNE–SSW beneath Simeulue Island, in agreement with the trend and location observed in the Tzz signal (white arrows in Figure 5).
To the North of the epicenter location (between 4.5° N and 5° N), on the western side of Sumatran coast, a relative high Tzz (>−5 Eötvös) coincides with an important narrowing of the slip distribution model, indicating the existence of heterogeneity that acted as a seismic attenuator. To the North up to the Andaman Islands, each narrowing of the gradient signal (dashed white lines in Figure 5) indicates different second-order barriers to seismic energy, which agree with amplitude attenuation in the slip model from Chlieh et al. (2007). Historical earthquake rupture areas are comprised of these second-order barriers, as previously observed along the Southern Chilean margin (Alvarez et al., 2014).
The 2005 Nias–Simeulue Mw = 8.6 Earthquake
On March 28, 2005, the Sunda megathrust ruptured offshore Northern Sumatra, along the Simeulue-Nias segment, as a result of a Mw = 8.6 earthquake, with hypocenter location at approximately 32 km depth close to the Banyak Island (Figure 4). This earthquake occurred three months before the great Sumatra-Andaman earthquake in 2004, causing widespread destruction and many humans loss (about 2,000), including a moderate Tsunami. McCloskey et al. (2005) explained that this earthquake might have been a consequence of increased Coulomb failure stress induced by the Sumatra-Andaman earthquake. The rupture took place along a 400 km gap between great ruptures in 2004 and 1797 (Figure 2) and propagated bilaterally with two high slip patches: one to the Northwest of the epicenter beneath Simeulue Island and one Southeast beneath Nias Island, respectively (Nalbant et al., 2005; Briggs et al., 2006; Konca et al., 2007). Geodetic measurements of surface deformation (coral and CGPS data) revealed about 8 m to more than 11 m of fault slip under those islands and a notorious decrease of slip to the trench (Briggs et al., 2006).
The approximate rupture area of the Mw 8.3-8, February 5, 1861, earthquake extended from the equator to the Banyak Islands as reported by Newcomb and McCann (1987, based on field data and tsunami reports) roughly coincident with the Southern patch of the 2005 Nias earthquake.
Earthquake Rupture Behavior From Tzz
The Simeulue-Nias 2005 earthquake nucleated over a Tzz minimum (<−15 Eötvös) close to the Banyak Island and propagated bilaterally to the NW and to the S-SE (yellow arrows in Figure 4). In this way, the 2010 Mw = 8.8 Maule earthquake nucleated close to a minima Tzz lobe (located along the marine forearc, see Figure 7) and propagated bilaterally (e.g., Moreno et al., 2012). Briggs et al. (2006) proposed that the structure and division of the 2005 rupture suggest the possibility that the megathrust has a tear or kink between Simeulue and Nias Islands. Moreover, Konca et al. (2007) reported that the region between the two maximum slip patches (at the hypocentral location) appears to be coincident with a local geological disruption of the forearc (i.e., a structural break) in the vicinity of the Banyak Islands (based on Sieh and Natawidjaja, 2000, and Karig et al., 1980). The low spatial resolution of the model developed up to N = 200 hinders to infer or identify these structures. However, the minima mentioned above (<−15 Eötvös) in the topography corrected vertical gravity gradient, calculated up to N = 200, present an elongation in both directions of rupture propagation (highlighted in the −11 Eötvös contour) having a more pronounced shape (like a tear) in the Southern one (Figure 4). Particularly, in this direction occurred the highest slip under Nias Island. Rupture models (Briggs et al., 2006; Konka et al., 2007) indicate a smaller slip patch (∼5 m) between the Nias and Batu Islands in agreement with the relative minima lobe of Tzz (<−11 Eötvös contour).
Up-Dip and Down-Dip Limits of the Seismogenic Zone
Briggs et al. (2006) reported that most of the moment (95%) was concentrated between depths of about 14–35 km, while slip values were highest at depths of about 25 km and decreased gradually both up-dip and down-dip. During the 2004 earthquake most of the slip occurred along Tzz minima stripe over the marine forearc (see the −7 Eötvös black thick contour of Figure 4). Joint inversion of geodetic and seismological data shows that the coseismic slip of the 2005 Simeulue-Nias earthquake decays significantly up-dip before it reaches the trench at two locations: ∼0° N and ∼1.5° N (Briggs et al., 2006; Konca et al., 2007). The last authors (Konca et al., 2007) explained that the rupture propagation was impeded when it reached the accretionary prism resulting in a small amount of slip toward the trench. The Tzz signal shows an important bulge penetrating inland between 0° N and 2.5° N (Tzz maxima lobe of > +15 Eötvös). This high in the gravity signal could be indicative of structural heterogeneities that acted as a barrier to seismic propagation toward the trench and consequently limiting the size of the Tsunami associated with this earthquake. As mentioned in section 4, in this region, a significant deepening of the top of the oceanic crust toward the SE was observed by Franke et al. (2008), suggesting that the margin’s segmentation at these latitudes is related to a ridge currently undergoing subduction.
Regarding the down-dip limit of the seismogenic zone, different authors explained that seismic slip decreases landward across a strong gravity gradient generally observed along the coastline (e.g., Bassett and Watts, 2015a; Bassett and Watts, 2015b). This gravity high could be related to the landward edge of the forearc basins and deep-sea terrace (Wells et al., 2003), to the thermal structure (Grevemeyer and Tiwari, 2006; Kopp, 2013 as well as to the forearc morphology (Krabbenhoeft et al., 2010).
In this work, instead of a highly positive gradient as observed along the South American margin (see Figure 7), we can observe that the Tzz signal becomes more positive (−5 Eötvös contour) to the NE of the Mentawi Fz (Figures 2, 4) along the center of the marine forearc (Diament et al., 1992). Simoes et al. (2004) found that at these latitudes the forearc Moho intersects with the subduction interface at a distance of 110 km from the trench and a depth of 30 km (based on bathymetry from Sandwell and Smith, 1997, seismic refraction data, Kieckhefer et al., 1980, and seismicity, Engdhal et al., 1998). Thus, the −5 Eötvös contour could be interpreted as indicative of structural heterogeneities related to the expression of the forearc Moho at this distance from the trench.
Asperities Identification From Tzz
Joint inversions of geodetic measurements and seismological data revealed that this earthquake ruptured along two main asperities generating a fault slip in the order of 10 m under the Simeulue and Nias Islands, a slip deficiency around the hypocenter, and no significant slip near the trench (Briggs et al., 2006; Konca et al., 2007). Although, for this event, it is not possible to establish a clear relationship between maximum slip patches and minima Tzz lobes as that of Sumatra-Andaman (Figure 4), slip also occurred over minimum Tzz. The smaller patch near Southern Simeulue (of about 8 m) was “comprised” between the −7.5 Eötvös contour, whereas the most significant patch under Northern Nias (with a maximum slip of about 15 m) occurred inside the −12 Eötvös contour. For this patch, the 10 m contour of slip occurred inside the −7.5 Eötvös contour, as what occurred for the southernmost smaller patch between Nias and Batu Islands.
On April 6, 2010, a shallow thrust fault earthquake with Mw = 7.8 occurred at 2.383°N 97.048°E (31.0 km depth) to the North of the Banyak Is.; with an approximate rupture area of about 80 × 60 km that appears to have occurred within the rupture zone of the M = 8.6 earthquake of March 2005 (Hayes et al., 2017). The rupture that occurred predominantly surrounding and up-dip of the hypocenter matches the minima Tzz lobe of −15 Eötvös around the Banyak Is. (and between Simeulue and Nias Islands).
Seismic Barriers and Attenuators
Seismic segmentation along strike agrees with the Tzz signal morphology. Three segments can be identified: an important narrowing of the gradient signal at the Northern termination of the 2005 rupture (white arrows in Figure 4) and a narrowing of the signal to the South of the Nias Is. and others and at the latitudes of the Batu Is., coincident with the approximate Northern limit of the major 1797 earthquake.
Seismic Barrier at Simeulue Island
In Section 4.1.5, we explained that the 2004 and 2005 earthquakes terminated abruptly along a common boundary over the Simuelue Island in a region where the Tzz signal shows an important narrowing of the −5 Eötvös contour (white arrows in Figures 4, 5, 9) indicating the probable location of a seismic barrier. Briggs et al. (2006) made dense coral measurements on the coasts of Simeulue Island and found that summing uplifts from 2004 (up to ∼1.5 m on the Northwestern flank) and 2005 (up to ∼1.6 m on the Southeast) earthquakes reveal a 70-km-long saddle-shaped depression (orange contour lines in Figure 9) centered on the island (uplift at the center was only 0.5 m). As slip on the megathrust beneath central Simeulue was appreciably less than it was to the Northwest and Southeast, the last authors interpreted that the Simeulue saddle reflects a section of the megathrust that in general slips aseismically or fails in smaller earthquakes, probably this section being a barrier to trench-parallel propagation of large ruptures. It is remarkable to note that although there is a slight gap between uplift (from coral measurements) and the vertical gravity gradient, the latter reflects well the saddle structure. Gravity signal, in general, reflects structural heterogeneities mainly related to density variations, which reinforces the hypothesis of a structural cause for the 2004/2005 coincident rupture terminations as observed by Briggs et al. (2006) and Franke et al. (2008).
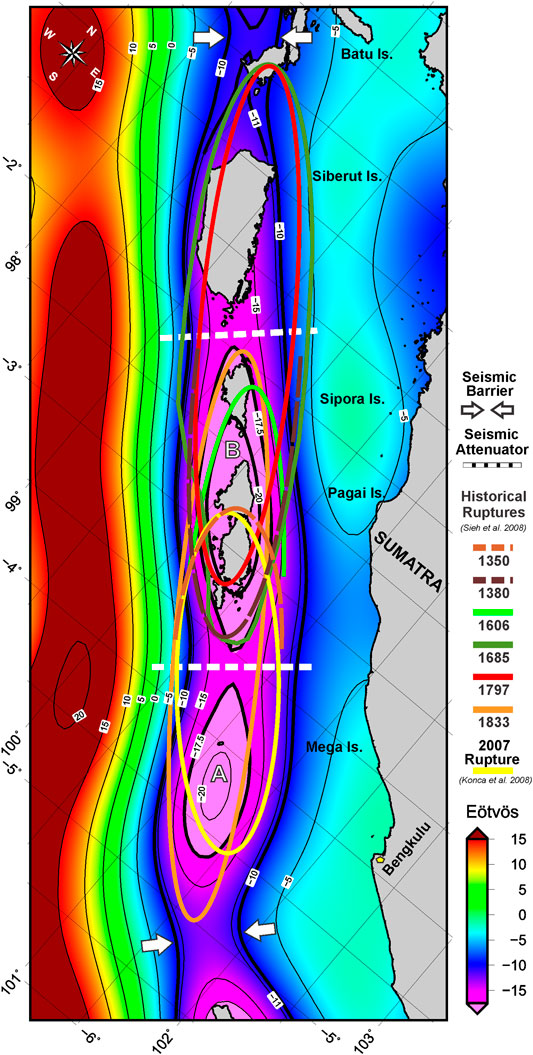
FIGURE 9. Approximate rupture areas for recent (Konca et al., 2008) and historical earthquakes (Sieh et al., 2008) superimposed to the topography corrected vertical gravity gradient (Tzz) obtained from GOCE model GO_CONS_GCF_2_DIR_R6 up to N = 200 (Bruinsma et al., 2014). Dashed white line indicates the location of regions that behaved as seismic energy attenuators; white arrows indicate the existence of a seismic barrier that arrested rupture propagation.
Southern Nias Is. Attenuator
Henstock et al. (2016) identified a 3 km basement high on the downgoing plate probably originated at the Wharton fossil ridge at the approximate location of the Southern termination of the 2005 rupture from multichannel seismic and gravity data. The last authors explained that where Wharton fossil ridge (WFR) intersects the 97° E Fz, basement shallows by ∼3 km, forming a bathymetric high on the Southern (inside) corner. At these latitudes, we observed that the expression of the forearc bulge presents a landward inflection (black dashed line in Figure 4), with the negative Tzz contours “comprised” along the marine forearc and the slip distribution showing an attenuation at these latitudes. The former authors suggested that the basement high causes a fundamental segment boundary within the subduction zone, which behaved aseismically over the data set period and produced a locally strong plate boundary that stops large earthquake rupture. Moreover, Graindorge et al. (2008) explained that, at these latitudes, the upper plate deformation is strongly influenced by the structure of the lower plate (based on multibeam bathymetry data), which is characterized by North-South trending lineaments from the fossil Wharton spreading center.
The Seismic Barrier at the Offshore of Batu Is
Offshore of the Batu Is. an interruption of the −11 Eötvös contour is highlighted (solid black contour in Figure 4) at the Southern termination of the 5 m of slip contour. At these latitudes, the investigator fracture zone (IFZ) intersects the margin beneath the Batu Islands zone (offshore MW Siberut Figure 2), with a section of the relict WFR intersecting the margin offshore the Batu Islands (Liu et al., 1983; Henstock et al., 2016). The region that marks the Southern termination of the 2005 earthquake is limited to the Northwest by the great rupture of 1861 and to the Southeast by the giant earthquake rupture of 1797 (Figure 2). Briggs et al. (2006) exposed that the reasons for lateral variations in the mode of failure along this segment of the megathrust are unclear, explaining that abrupt lateral variations of temperature along the plate interface are improbable. This led them to propose either that variation in the mode of slip along strike may result from lithologic or pore pressure variations or that structural complexities in the Batu Islands patch may have inhibited thoroughgoing rupture during the 2004 and 2005 giant earthquakes. Our results reinforce the hypothesis of these authors of a structural cause for the 2005 Southern rupture termination. Deformation related to the subduction of the investigator fracture zone beneath the Batu Islands zone left is imprinted on the gravimetric signal (Figure 4) as observed previously along the Chilean margin for other Fz’s that acted as seismic barriers to rupture propagation (e.g., the Mocha Fz. that acted as a barrier to the 2010 Maule Mw = 8.8 earthquake and for the 1960 Valdivia Mw = 9.6 earthquake).
The 2007 Mw = 8.4 South Pagai Is. Earthquake and the 2000 Mw = 7.9 Enggano Is. Earthquake at SW of Sumatra
On September 12, 2007, two earthquakes stroke off the west coast of Southern Sumatra (Figure 6) in the region of the Mentawi Islands (Konca et al., 2008; Lorito et al., 2008; Lubis et al., 2013). The first earthquake, with a magnitude Mw = 8.4, occurred about 130 km SW of Bengkulu and generated a tsunami of a moderate intensity (Borrero et al., 2009; Fujii and Satake, 2008). Twelve hours later, a second earthquake with Mw = 7.9 occurred near the SW Sumatra coast at the latitude of the Pagai Is. which also generated a small tsunami. Source models of the Mw = 8.4 main shock show a unilateral rupture that propagated to the Northwest of the epicenter (Konca et al., 2008; Lorito et al., 2008).
Konca et al. (2008) calculated a cumulative slip model including the Mw = 8.4 and Mw = 7.9 earthquakes and then calculated each rupture area separately (by using, conveniently as appropriate, GPS measurements, teleseismic data, Interferometric Synthetic Aperture Radar (InSAR), field measurements of coral uplift, and seismological records). The cumulative slip model shows two main slip peak areas (Figure 6), located on South Pagai Island with a maximum slip of 8 m and around Mega Island with 5 m local maxima. Another minor slip patch of about 2.5 m was obtained beneath Sipora Island.
Other authors (Lubis et al., 2013) found a similar coseismic slip distribution (from inversion of GPS and coral data), although with somewhat lower aptitudes. On the contrary, Lorito et al. (2008) found a maximum slip patch of 10 m (100 km long × 50 km wide), located about 100 km Northwest from the epicenter (by inversion of the tsunami waveforms). The 2007 sequence occurred in the region of the 1797 (M ∼ 8.8) and 1833 (Mw ∼ 9.0) historical earthquakes (Newcomb and McCann, 1987; Natawidjaja et al., 2006). Coseismic slip models showed that recent ruptures were much smaller than during those previous events, indicating that joint rupture did not cover the whole area of the 1833 event, thus anticipating that some slip has still to occur (Konca et al., 2008; Lorito et al., 2008).
On June 4, 2000, an intraslab strike-slip earthquake, known as Enggano earthquake (Figure 6), occurred with an estimated Mw = 7.9 at the Southern edge of the rupture area of the 1833 subduction earthquake (Pan et al., 2001; Abercrombie et al., 2003), about 110 km off the west coast of Bengkulu. The first strike-slip event (there was no tsunami reported following the earthquake) occurred at approximately 50 km depth within the subducting Australian plate and triggered a thrust subevent on the megathrust and ruptured SE away from the 1833 earthquake to the Enggano Is. where most of the losses occurred, as reported by Pan et al. (2001). Most aftershocks for this sequence were located to the SE of the main shock epicenter, coinciding with the inferred rupture area of the second subevent and extending approximately 150 km along the subduction interface (Abercrombie et al., 2003). Nerveless, the aftershocks also extend to the North of the main shock epicenter over 50 km along the first subevent’s preferred fault plane, as explained by the last authors.
Earthquakes Rupture From Tzz (Directivity Effect)
The topography corrected vertical gravity gradient calculated up to N = 200 (Figure 6) in the region between 0° and 7° S can be separated into two regions or main lobes along the marine forearc following the −15 Eötvös contour, with a region relatively more positive between both lobes (at about 5° S). A first-order anticorrelation can be observed between the Tzz signal and recent earthquake ruptures (Abercrombie et al., 2003; Konca et al., 2008) and to historical ones (1797 and 1833). The along-strike segmentation of Tzz (relative maxima) coincides with ruptures ending (Figures 3, 6), while maximum slip patches agree with relative minima Tzz. As observed in previous sections, the directivity effect can be observed when earthquakes nucleated close to a region with a relative higher Tzz signal (i.e., a narrowing in the contours) with seismic energy propagating off this attenuator/barrier to a region with a Tzz minima (e.g., <−15 Eötvös lobes). This rupture behavior was also observed by means of Tzz signal for the 1960 Valdivia, 2001 Arequipa, and 2016 Illapel earthquakes (Alvarez et al., 2014; Alvarez et al., 2019a).
Asperities Identification From Tzz
The coseismic slip of the 2007 MW 8.4 South Pagai Is. earthquake had two (Konca et al., 2008) or three major asperities (Lubis et al., 2013) to the NW of the epicenter (Lorito et al., 2008 found only a major slip patch in this direction). The first two mentioned models agree in a high slip patch close to the epicenter whose location coincides with a minima Tzz lobe (A in Figure 6); additionally, in Southwest of Pagai Is. the maximum slip occurred just over the minima Tzz lobe (B) in this region (between 0° to −5° S). The afterslip distribution for this earthquake after 15 months (corrected by poroelastic and viscoelastic response modeling) from Lubis et al. (2013) shows a maximum centered at the Pagai Islands to the trench, while aftershocks distribution (M > 4.0) during this time-lapse reached the South of Siberut Is. This relationship between aftershocks distribution and location of Tzz lobes contours was also observed for the 2015 Mw = 8.3 Illapel earthquake (Alvarez et al., 2017a) and for the 2016 Musine Mw = 7.8 earthquake (Alvarez et al., 2017b).
The 2007 earthquake sequence ruptured along distinct asperities (i.e., patches with a locally large slip that had remained locked in the interseismic period) but reached only a portion of the area ruptured in 1833 (Konca et al., 2008); see Figures 3, 6. The last authors proposed that the 2007 sequence consisted of several separated asperities (in time and space) that really did not cooperate and that this probably was due to the action of nonpermanent barriers (i.e., areas with locally lower prestress that resulted from the occurrence of past earthquakes). They found a narrow zone beneath North Pagai Island that may have acted as a barrier in 2007 (although probably not a permanent barrier) because it had a locally lower stress level before the earthquake. The GOCE satellite-derived gravity model's high spatial resolution hinders to infer if the −20 Eötvös lobe beneath Pagai Islands is actually composed of two or more asperities separated by a barrier (probably not permanent as proposed by Konca et al., 2008).
When considering the historical ruptures from Sieh et al. (2008) we can observe (Figure 3) that the minima Tzz lobe of −17.5 Eötvös (B) under Sipora and Pagai Islands (between the second-order barriers/attenuators) coincides to the North with the 1,606 and 1,833 rupture areas ending, while to the South it agrees with the 1,685 and the 1,380 ruptures termination. This high wavelength lobe of minima Tzz is probably indicating the existence of a large region comprised of different main asperities. Moreover, the −20 Eötvös lobe under Pagai Is. coincides with the margin section that always broke through the successive earthquakes along the timeline, marking the Southern termination of the 1,797 earthquake. The historical rupture of 1,833 comprised both main asperities A and B (Figure 3), while the 1,797 and 1,685 historical earthquakes occurred along a region of relative minima Tzz from Batu Is. to the South, including the asperity delimited by the −17.5 Eötvös contour (asperity B in Figure 3).
Along-Strike Seismic Segmentation: Barriers and Attenuators
Along-strike seismic segmentation can be inferred from the study of repeated break of the plate interface along the timeline from historical earthquakes. The section of the Sunda megathrust between 0° and −5° S has generated almost repeated sequences of great megathrust earthquakes (Figure 3) approximately every two hundred years for at least the past 700 years as reported by Sieh et al. (2008), from corals records of the Mentawai Islands.
To the North, around the Batu Islands, the Tzz shows a narrowing and an interruption of the −11 Eötvös contour. This region, which marks the Southern termination of the 2005 Nias–Simeulue Mw = 8.6 earthquake (section 4.2) and the Northern termination of the 1,797 and the 1,685 historical earthquakes, behaved as a seismic barrier. In previous works (Alvarez et al., 2014; Alvarez et al., 2015; Alvarez et al., 2017a;Alvarez et al., 2017b; Alvarez et al., 2018; Alvarez et al., 2019a), we named these regions (where the along-strike limit for different ruptures coincides with local relative maxima in Tzz) first-order barriers. In the Southern portion of this region of the Sumatran margin, we propose the existence of another first-order barrier (white arrows in Figures 3, 6) that separates the rupture of the 2007 earthquake and the historical rupture of 1833 to the North from the 2000 Enggano earthquake to the South.
The region between these two first-order barriers (delimited by important narrowing of the Tzz signal or relative maxima interposed along strike) presents a low Tzz trend between them which is also segmented by second-order barriers or attenuators (defined by minor values/amplitude of Tzz contours) that indicate the existence of different seismic asperities along strike. The second-order barriers (white dashed lines in Figures 3, 6) locations mapped by beans of Tzz agree with seismic segmentation from historical ruptures (Sieh et al., 2008) along this portion of the Sunda megathrust.
What remains to be solved (probably through marine data or a global gravity model with higher spatial resolution as EIGEN-6c4) is the existence or not of a barrier that would separate the islands of Pagai North and South, indicating a heterogeneity that acted as a limit for the 2007 rupture and also to the historical one of 1,350. However, it is difficult to expect a relative higher Tzz (in a shorter wavelength signal, i.e., more resolution) located just in the middle of the minimum Tzz lobe (<−20 Eötvös) under the islands of Pagai. In this regard, Konca et al. (2008) explained that the sequence of 2007 essentially ruptured a set of asperities which did not cooperate efficiently (by triggering each other through static and dynamic interactions) because of the intervening barriers that were most likely not permanent, acting on the coast of North Pagai more like a ‘barrier’ during the coseismic slip in 2007. The last authors proposed that the presence of nonpermanent barriers due to the stress distribution leftover from previous ruptures is probably the major factor introducing irregularity, as observed in dynamic fault models (Ben-Zion and Rice, 1993; Cochard and Madariaga. 1996).
The 2007 earthquake did not reach the 1833 earthquake extent (Figures 3, 6), showing in its rupture behavior certain characteristics somewhat abnormal on its Northern slip patch termination. The rupture did not agree with the Tzz signal, differing from the degree of interseismic coupling from Chlieh et al. (2008). Neither the slip-predictable nor the time predictable models applied to this earthquake (Konca et al., 2008). Presumably, in this portion of the megathrust between North and South Pagai Is., instead of being permanent features, seismic asperities move from one rupture to another within the area that is locked in the interseismic period as proposed by Konca et al. (2008).
Tzz, Seismic Behavior, and Seismic Coupling
Throughout the previous sections, we have observed a correlation between the along-strike segmentation of the Tzz (by direct modeling of the Earth gravity field) and the seismic segmentation along the plate interface (considering recent and historical earthquakes). Geodetic (1991–2004) and paleogeodetic (1962–2000) measurements of interseismic deformation from Chlieh et al. (2008) revealed that the plate interface is partially or fully locked at shallower depths along the Sumatran portion of the Sunda subduction zone. Patches of high coupling, along this heterogeneous pattern of coupling from the last authors (Figure 10), present a high correlation with the rupture areas of large megathrust earthquakes (particularly when the locked fault zone is up to about 175 km wide). The last authors explained that these strongly coupled patches are roughly coincident with asperities that ruptured during great events, whereas the sections of narrow locking and low coupling have not produced great earthquakes (Mw > 8.0). Similar results can be found in Prawirodirdjo et al. (2010); these authors also found that coupling along the plate boundary is high throughout this region with lower coupling patches to the North of Batu Is. and around Enggano Is.
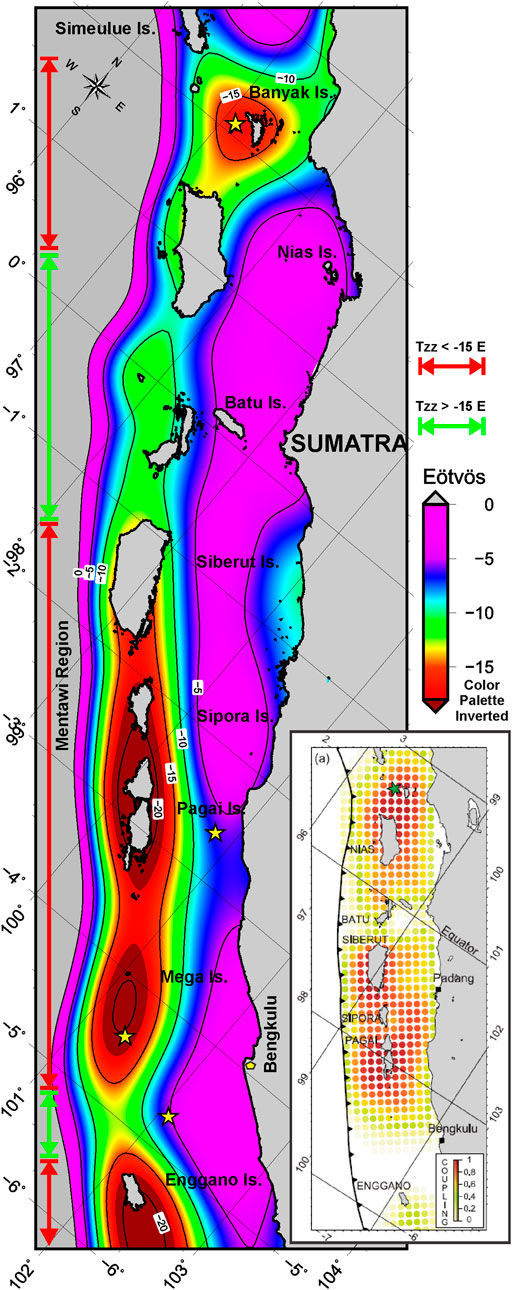
FIGURE 10. Topography corrected vertical gravity gradient (Tzz) obtained from GOCE model GO_CONS_GCF_2_DIR_R6 up to N = 200 (Bruinsma et al., 2014) with color palette inverted. In the right lower corner is plotted the interseismic locking degree from Chlieh et al. (2008): a value of 1 corresponds to full locking while 0 corresponds to creeping at the long-term plate convergence. Note the correspondence between highly coupled segments (red) with regions of relative minima Tzz (orange-to-red) indicated with double red arrows. Regions with intermediate to close to zero coupling agree with regions of relative higher Tzz (green segments).
In a recent work, Metois et al. (2016) found that, for the recent Mw > 8 events over the Chilean margin (from 38° to 18° S), coseismic asperities correlate well with highly coupled segments, while low coupling zones behaved as barriers and stopped the ruptures (by analyzing interseismic coupling variations on the subduction interface based on GPS networks). From comparing the results of the last authors to our maps of Tzz along the Chilean margin, we found that relative low Tzz anomalies correlate to regions with higher slip and a high degree of coupling. On the other hand, relative higher Tzz coincident to areas with lower coupling interposed along-strike mostly coincided with barriers to rupture propagation (Metois et al., 2016; Alvarez et al., 2014; Alvarez et al., 2017a; Alvarez et al., 2017b).
In this subsection, we will analyze the results obtained from direct modeling of the vertical gravity gradient with respect to the degree of seismic coupling from Chlieh et al. (2008) and to seismic behavior in the Sumatra region.
Banyak-Nias Strong Coupling Patch
The region comprised between the Banyak Is. and the Nias Is. to the South of it, which ruptured during the 2005 Mw = 8.7 Nias–Simeulue earthquake (Figure 4), coincides well with the wide patch of high coupling from Chlieh et al. (2008). This patch of high interseismic plate coupling presents a similar pattern when compared to the −10 Eötvös Tzz contour, with a maximum (of coupling) around Banyak Is. and Northern Nias Is. (−15 Eötvös), and a narrowing of Tzz in the Southern direction as what occurs with the predominantly decoupled equatorial patch.
Batu and North Enggano Low Coupling Patches
Around the Batu Is. and near the equator coupling is lower (Figure 10), with a narrow locked fault zone at the Northern edge of this Island (with coupling ratios close to zero at depths >35 km and a coupling ratio less than 0.6 at shallower depths, see Chlieh et al., 2008). In this area only moderate earthquakes have occurred with Mw < 8.0 (last rupture in 1935 with a magnitude 7.7), in the past few centuries (Sieh et al., 1999; Rivera et al., 2002; Natawidjaja et al., 2004; Konca et al., 2008), and none of the great historical earthquakes (Figure 3) ruptured significantly across this region from the South (in 1797 and 1833) or from the North (in 1861).
The Tzz (Figure 10) shows significant relative higher values (∼5 Eötvös higher) in the region between Southern Nias Is. and Northern Siberut Is., differentiating from the regions to the North and South where the gradient is smaller and where the earthquakes of higher magnitude occurred. Chlieh et al. (2008) located a region of low interseismic coupling above the subducting investigator Fz. and a well-defined nest of seismicity within the downgoing slab (Fauzi et al., 1996; Prawirodirdjo et al., 1997). In recent works along the Chilean margin (Alvarez et al., 2014; Alvarez et al., 2017a; Alvarez et al., 2017b; Alvarez et al., 2019b), we identified these regions (where the subduction of high oceanic features intercepts the plate interface) with low coupling and high rates of low-to-moderate seismicity with seismic barriers/attenuator to seismic energy propagation by means of higher relative values of the Tzz across the margin. Nalbant et al. (2013) explained that the 1935 earthquake patch has been slipping during the past century at about half the rate at which the plate is moving and that has accumulated strains and hence stresses on the Batu Is. patch are probably low. These authors also mentioned that recent paleogeodetic studies show that the megathrust is slipping aseismically at plate convergence rate both above and below this narrow patch.
Mentawi Strong Coupling Patch
Along the Mentawi region, from Siberut Is. to the latitude of Bengkulu, Chlieh et al. (2008) found that the interplate region is under strong coupling (Figure 10). According to Natawidjaja et al. (2007), coupling beneath the Mentawai Is. has been high for at least the past 40 years. Great historical earthquakes with wide rupture areas as the 1797 and 1833 affected this region of the Sunda megathrust. More recently, the Southern portion was shocked by the Mw = 8.4 and Mw = 7.9 earthquakes of September 2007 as early explained in this section. In this region, we found that there is a good correspondence between low Tzz lobes and strong coupling patches, mainly under Pagai and Sipora Islands (Figure 10).
To the North and South of this segment, a narrowing of the locked patch and a diminishment of the coupling ratio indicating weakly coupled regions (∼40% beneath the Batu Is.) correspond to the along-strike edges of the different ruptures previously analyzed. The gravity signal reflects structural and compositional heterogeneities along the megathrust, with low Tzz lobes being related to seismic asperities (Alvarez et al., 2019b), whereas interposed relative maxima are related to seismic barriers to rupture propagation (Alvarez et al., 2014). There is a high correspondence between these permanent barriers inferred from direct gravity modeling and those mapped from the modeling of interseismic strain (Figure 10). This agrees with the hypothesis that they are persistent segment boundary zones that influence the lateral extent of megathrust ruptures (as low coupling causes continuous strain release) that may be related to the subduction of HOF’s (Chlieh et al., 2008; Konca et al., 2008). Similar results were found along the Chilean margin, where the subduction of different HOF’s (aseismic ridges, seamounts, Fz’s) coincides with patches of a lower degree of coupling and higher relative Tzz and that has acted as seismic barriers for the recent earthquakes and also for historical ones (Sparkes et al., 2010; Contreras-Reyes and Carrizo 2011; Alvarez et al., 2014, Alvarez et al., 2019b; Metois et al., 2016).
South Enggano Intermediate Coupling Patch
The megathrust in the area of Enggano Is. and near Bengkulu (Figure 10) is only slightly coupled (although from sparse GPS data in the mentioned area: see Chlieh et al., 2008) and coincides with a region of relative higher Tzz (>−15 Eötvös). This region presented in the last 15 years an intense seismic activity (Abercrombie et al., 2003) and had many major but no giant earthquakes. The most recent occurred in 2000 with an Mw = 7.9 earthquake (Abercrombie et al., 2003) and ruptured to the South where the coupling is intermediate and a low Tzz lobe is located to the South of Enggano Is (Figure 10). Chlieh et al. (2008) explained that the cause of the low coupling obtained to the South of Pagai Is. is enigmatic and does not appear to be related to a subducted fracture zone or the thermal structure. In this work, we propose that a plausible explanation is a rheological heterogeneity or a structural complexity along the megathrust that can be mapped by its density contrast by means of Tzz.
The Correlation Between Coupling and Tzz
As above explained in this section, Chlieh et al. (2008) found a strong correlation between historical great earthquakes and patches of the megathrust that are currently strongly coupled, suggesting that asperities are persistent features under the largest outer arc islands, caused by intrinsic local properties of the megathrust (reinforced by the fact that the pattern of coupling in the Mentawai Islands is remarkably similar before and after the two great earthquakes of December 2004 and March 2005). This is opposed to the hypothesis that the seismic moment release is generally highest beneath forearc basins proposed by (Song and Simons, 2003; Wells et al., 2003) as in this region basins are located between the Mentawi Fz and the coastal line. In this work, we found from direct modeling of GOCE satellite data (with a greatly improved resolution) that negative Tzz lobes (Figures 3 and 6) agree with rupture areas under the Mentawi Islands, i.e., along the accretionary wedge instead of over the basins (which are located to the East). Our results (low Tzz lobes in correspondence with highly coupled segments) agree with the proposal of Chlieh et al. (2008), who observed that the most strongly coupled patches and seismic asperities correlate with the largest outer arc islands.
Tzz and the Up/Down-Dip Limits of the Seismogenic Zone
The down-dip limit of the seismogenic zone may be controlled (in a first-order) either by the thermal structure (due to a transition to dislocation creep at high temperatures: Scholz, 1990; Hyndman and Wang, 1993; Hyndman and Peacock, 2003) or by lithological variations, as the presence of a highly serpentinized mantle wedge allows megathrust creeping (i.e., the intersection of the megathrust with the forearc Moho may coincide with the change from stick-slip to aseismic stable sliding, e.g., Reinen et al. (1991); Hyndman et al. (1997); Oleskevich et al. (1999). Different authors found that, along the Sumatran margin, the megathrust extends significantly deeper than the continental Moho (which have shallow depths 22–30 km, e.g., Kieckhefer et al. (1980) and Simoes et al., 2004), opposing the hypothesis that the Moho is the down-dip limit in this region (Chlieh et al., 2008; Klingerhoefer et al., 2010). Variations in the down-dip locking depth over this region seems to be predominantly controlled by along-strike variations in temperature, with the 350–450°C isotherms (located 210 and 250 km from the trench axis at the North of Simeulue Is., Klingerhoefer et al., 2010) and the 300–400°C isotherms (located at 210 and 250 km from the trench axis, respectively, along the Mentawi region, Chlieh et al., 2008) coincident with the down-dip limit of the seismogenic zone (Figure 11). The vertical gravity gradient presents a notable contrast across strike in the Mentawi region, indicating higher densities landward, coinciding the approximate location of the −5 Eötvös contour (thick black contour in Figure 11) with the 350°C isotherm (from Chlieh et al., 2008). The last authors observed an increase in depth of locking between the equator and 4° S consistent with the isotherms trend and with the Southward increase in convergence rate. They explained that, together, the lateral variations of these two parameters partially explain the Southward increase of the down-dip edge of the locked fault zone from the Batu Islands, where it is 35 km deep to South Pagai Island, where it reaches a depth of about 55 km. The density structure along the marine forearc obtained by direct modeling of the satellite GOCE derived gravity model is consistent with these results, with the limit of the locked fault zone (yellow dashed line in Figure 11) coincident with the −5 Eötvös contour, which presents an interruption between Padang and Bengkulu indicating lower densities over the marine forearc in this region were locking reaching the coastline.
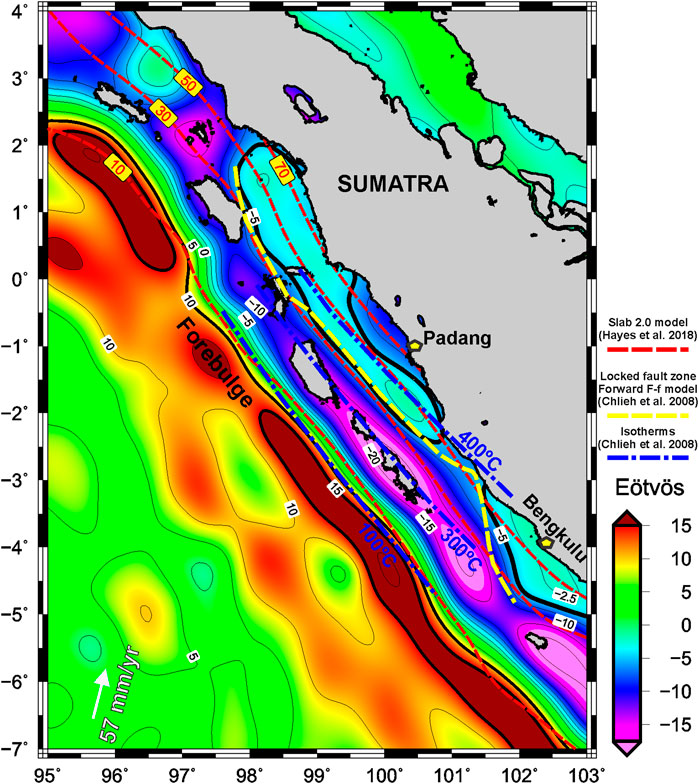
FIGURE 11. Topography corrected vertical gravity gradient (Tzz) obtained from GOCE model GO_CONS_GCF_2_DIR_R6 up to N = 200 (Bruinsma et al., 2014). Superimposed: isotherms (blue dot and dashed line) and down-dip limit (yellow dashed line) of the locked fault zone from the forward model F-f of Chlieh et al. (2008). Slab depths from Slab 2.0 of Hayes (2018) are plotted with red dashed lines. Note the correspondence between the −5 Eötvös contour and the approximate location of the 350°C isotherm that marks the limit of the seismogenic zone in this region and with the down-dip limit of the locked zone. The up-dip limit of the seismogenic zone can be identified by the high gradient indicated by the +15 Eötvös contour.
Similar results were found along the South American margin, where the −5 Eötvös contour was indicated as the down-dip limit of the seismogenic zone for the Maule 2010 earthquake (Alvarez et al., 2019b) and for the Musine 2017 earthquake (Alvarez et al., 2017b). In both cases, the trend of low-density values observed along the marine forearc presented an entry under the continental forearc in correspondence with coseismic slip models for the events mentioned above (see Figure 7).
The Up-Dip Limit and Tsunami-Genesis From Tzz
The up-dip limit in this region has also been successfully mapped (Figure 11) based on the thermal modeling. Its position has been located at ∼30 ± 10 km from the trench and around the 100–150°C isotherms (which is in good agreement with the aftershocks with a shallow thrusting mechanism in this zone (Engdahl et al., 2007; Chlieh et al., 2008; Hippchen and Hyndman, 2008). The Tzz presents a high gradient positive oceanward at the approximate location of the 100°C isotherm that could be indicative of the up-dip ending of the seismogenic zone (minor to zero Tzz along the marine forearc is related to the seismogenic zone and minima Tzz lobes to seismic asperities).
A higher positive Tzz signal (>+15 Eötvös) is observed (Figure 11) along the outer rise along the Mentawi Islands and along the Simeulue-Nias region where the 2005 Nias–Simeulue Mw = 8.6 earthquake, the 2007 MW 8.4 South Pagai Is. Earthquake, and the 2000 Mw = 7.9 Enggano Is. earthquake occurred. These three events (even though the latter is related to an intraslab strike-slip mechanism) that present a highly positive Tzz oceanward (Figure 11) only presented moderate tsunamis. A similar pattern is observed for the Mw = 8.4 Arequipa 2001 earthquake (also with a > +15 Eövos Tzz oceanward) which neither presented a severe tsunami.
On the other hand, the Mw = 9.15 2004 Sumatra-Andaman earthquake that presented a tsunami of great proportions occurred in a region where the Tzz signal is lower along the forebulge (see the +10 Eötvös contour in Figure 8). The 2010 Mw = 8.8 Maule earthquake (which also generated a destructive tsunami) presents a similar pattern as the Tzz signal along the outer rise is limited by the +10 Eötvös contour (see Figure 7A). Further North, the Mw = 8.2 Illapel earthquake, which generated a moderate but destructive tsunami, occurred against an inflection of this contour of +15 Eövos over the forebulge.
If this pattern is maintained on a global scale, it would be possible to determine if the density structure around the trench area could also have some influence on tsunami-genesis. It is plausible that where there is a lower density along this region, the rupture could reach the shallow and tsunamigenic portion of the megathrust (Lay et al., 2011; Lay et al., 2012), and thus a lower density structure of the forebulge would facilitate greater vertical seafloor displacements.
Conclusion
The correspondence between strong coupled patches along the interseismic period, maxima slip patches during earthquakes occurrence, and low Tzz lobes implies that the density structure could be reflecting either structural or rheological heterogeneities (i.e., asperities) of the megathrust along the marine forearc, having a strong influence on seismic rupture behavior. Thus, by mapping regions with a general trend of low Tzz, we could infer the approximate along-strike length of the rupture (mainly for large-magnitude events due to the low spatial resolution of satellite only models) identifying seismic asperities where slip is enhanced by means of minima Tzz lobes. The heterogeneous distribution of Tzz could also be reflecting rheological changes due to slight variations in the thermal structure, particularly along the down-dip edge of the locked fault zone.
Furthermore, the along-strike seismic segmentation along the continental forearc inferred from recent and historical rupture patterns could also be characterized by means of relative higher Tzz (identified as barriers) as observed along the Chilean margin in previous works. These barriers that inhibit the lateral propagation of great earthquake ruptures agree with narrower coupling over periods of time higher than one or two hundred years. Minor lateral variations in the Tzz signal are reflecting mass heterogeneities that contributed to the lateral variations in seismic behavior. Across-strike seismic barriers could be identified in those portions of the margin where the Tzz contours are narrowed or with a relative higher Tzz (this permanently creeping barriers should favor some regularity and similarity of earthquakes).
When an earthquake nucleates close to a relatively higher Tzz rupture propagates following a directivity effect toward minima Tzz lobes (and toward lower mean values of the Tzz signal along the margin). On the contrary, when earthquake nucleates close to a minima Tzz lobe, rupture presents a bilateral rupture propagation.
By calculating the topography corrected vertical gravity gradient up to degree/order N = 200 of the harmonic expansion (from Earth gravity field models) it could be possible to map coastal regions with a higher seismic risk along subduction margins.
Data Availability Statement
The raw data supporting the conclusions of this article will be made available by the authors, without undue reservation.
Author Contributions
OA was responsible for conceptualization, methodology, software, investigation, and writing of original draft, SC was responsible for software, investigation, and writing. MG was responsible for resources, supervision, project administration, and AF was responsible for conceptualization and writing – review and editing.
Conflict of Interest
The authors declare that the research was conducted in the absence of any commercial or financial relationships that could be construed as a potential conflict of interest.
Acknowledgments
The authors acknowledge the use of the GMT-mapping software of Wessel et al. (2019), to Dr. Mohamed Chlieh Y2hsaWVoLmdlb2F6dXJAbGFwb3N0ZS5uZXQ= (at the ISTerre Lab, Institut des Sciences de la Terre, Grenoble-Alpes University, France) and colleagues for sharing their slip model data of the Mw = 9.15 2004 Sumatra-Andaman earthquake. The authors would like to acknowledge CONICET-Argentina. Satellite GOCE models and derived data can be downloaded from the International Centre for Global Earth Models (ICGEM) http://icgem.gfz-potsdam.de/home.Topographic correction can be performed by forward modeling of gravitational fields in spherical coordinates following Uieda et.al. (2016), software freely available at Zenodo: doi:10.5281/zenodo.582366, http://tesseroids.leouieda.com.
References
Abercrombie, R. E., Antolik, M., and Ekström, G. (2003). The June 2000 Mw 7.9 earthquakes south of Sumatra: deformation in the India–Australia plate. J. Geophys. Res. 108 (B1), ESE 6-1–ESE 6-16. doi:10.1029/2001JB000674
Alvarez, O., Folguera, A., and Gimenez, M. E. (2017b). Rupture area analysis of the Ecuador (Musine) Mw = 7.8 thrust earthquake on april 16 2016, using GOCE derived gradients. Geod. Geodyn. 8, 49–58. doi:10.1016/j.geog.2017.01.005
Alvarez, O., Gimenez, M. E., Braitenberg, C., and Folguera, A. (2012). GOCE satellite derived gravity and gravity gradient corrected for topographic effect in the South Central Andes region. Geophys. J. Int. 190 (2), 941–959. doi:10.1111/j.1365-246X.2012.05556.x
Alvarez, O., Gimenez, M., Folguera, A., Moreno Chaves, C. A., and Braitenberg, C. (2019a). Reviewing megathrust slip behavior for recent Mw > 8.0 earthquakes along the Peru-Chilean margin from satellite GOCE gravity field derivatives. Tectonophysics 769, 228188. doi:10.1016/j.tecto.2019.228188
Álvarez, O., Gimenez, M., Guillen, S., Tocho, C., and Folguera, A. (2018). Goce derived geoid changes before the Pisagua 2014 earthquake. Geodesy Geodyn. 9, 50–56. doi:10.1016/j.geog.2017.09.005
Alvarez, O., Nacif, S., Gimenez, M., Folguera, A., and Braitenberg, C. (2014). GOCE derived vertical gravity gradient delineates great earthquake rupture zones along the Chilean margin. Tectonophysics 622, 198–215. doi:10.1016/j.tecto.2014.03.011
Alvarez, O., Nacif, S., Spagnotto, S., Folguera, A., Gimenez, M., Chlieh, M., et al. (2015). Gradients from GOCE reveal gravity changes before Pisagua Mw=8.2 and Iquique Mw=7.7 large megathrust earthquakes. J. S. Am. Earth Sci. 64 (P2), 15–29. doi:10.1016/j.jsames.2015.09.014
Alvarez, O., Pechuan, S., Gimenez, M., and Folguera, A. (2019b). “Seismic structure along the South American subduction zone using satellite gravity data,” in Andean tectonics. Editors B. K. Horton, and y. Andres, and F. Capitulo (Paises Bajos: Elsevier), Vol. 1, 3–18.
Alvarez, O., Pesce, A., Gimenez, M., Folguera, A., Soler, S., and Chen, W. (2017a). Analysis of the Illapel Mw = 8.3 thrust earthquake rupture zone using GOCE derived gradients. Pure Appl. Geophys. 174 (1), 47–75. doi:10.1007/s00024-016-1376-y
Amante, C., and Eakins, B.W. (2009). ETOPO1, 1 Arc-Minute global relief model: procedures, data sources and analysis. NOAA technical memorandum NESDIS. National Geophysical Data Center, NOAA, Vol. 24, 19. doi:10.7289/V5C8276M
Ammon, C. J., Ji, Thio, H. K., Robinson, D., Ni, S. D., Hjorleifsdottir, V., Kanamori, H., et al. (2005). Rupture process of the 2004 Sumatra-Andaman earthquake. Science 308, 1133–1139. doi:10.1126/science.1112260
Banerjee, P., Pollitz, F. F., and Bürgmann, R. (2005). The size and duration of the Sumatra-Andaman earthquake from far-field static offsets. Science 308, 1769–1772. doi:10.1126/science.1113746
Bassett, D., and Watts, A. B. (2015a). Gravity anomalies, crustal structure, and seismicity at subduction zones: 1. Seafloor roughness and subducting relief. Geochem. Geophys. Geosyst. 16, 1508–1540. doi:10.1002/2014GC005684
Bassett, D., and Watts, A. B. (2015b). Gravity anomalies, crustal structure, and seismicity at subduction zones: 2. Interrelationships between fore-arc structure and seismogenic behavior. Geochem. Geophys. Geosyst. 16, 1541–1576. doi:10.1002/2014GC005685
Ben-Zion, Y., and Rice, J. R. (1993). Earthquake failure sequences along a cellular fault zone in a 3-dimensional elastic solid containing asperity and nonasperity regions. J. Geophys. Res. 98, 14109–14131. doi:10.1029/93JB01096
Bilham, R., Engdahl, R., Feldl, N., and Satyabala, S. P. (2005). Partial and complete rupture of the Indo-Andaman plate boundary 1847–2004. Seismol Res. Lett. 76, 299–311. doi:10.1785/gssrl.76.3.299
Borrero, J. C., Weiss, R., Okal, E. A., Hidayat, R., Suranto, , Arcas, D., et al. (2009). The Tsunami of September 12, 2007, Bengkulu Province, Sumatra, Indonesia: post-tsunami field survey and numerical modeling. Geophys. J. Int. 178, 180–194. doi:10.1111/j.1365-246X.2008.04058.x
Braitenberg, C., Mariani, P., Ebbing, J., and Sprlak, M. (2011). “The enigmatic Chad lineament revisited with global gravity and gravity-gradient fields,” in The formation and evolution of Africa: a synopsis of 3.8 Ga of earth history. Editors D. J. J. Van Hinsbergen, S. J. H. Buiter, T. H. Torsvik, C. Gaina, and S. J. Webb (London: Geological Society, London, Special Publications), 357, 329–341. doi:10.1144/SP357.18
Briggs, R. W., Sieh, K., Meltzner, A. J., Natawidjaja, D., Galetzka, J., Suwargadi, B., et al. (2006). Deformation and slip along the Sunda Megathrust in the great 2005 Nias-Simeulue earthquake. Science 311, 1897–1901. doi:10.1126/science.1122602
Bruinsma, S. L., Förste, C., Abrikosov, O., Lemoine, J.-M., Marty, J.-C., Mulet, S., et al. (2014). ESA’s satellite-only gravity field model via the direct approach based on all GOCE data. Geophys. Res. Lett. 41, 7508–7514. doi:10.1002/2014GL062045
Bruinsma, S. L., Forste, C., Abrikosov, O., Marty, J. C., Rio, M. H., Mulet, S., et al. (2013). The new ESA satellite-only gravity field model via the direct approach. Geophys. Res. Lett. 40 (14), 3607–3612. doi:10.1002/grl.50716
Chen, J. L., Wilson, C. R., Tapley, B. D., and Grand, S. (2007). GRACE detects coseismic and postseismic deformation from the Sumatra-Andaman earthquake. Geophys. Res. Lett. 34, L13302. doi:10.1029/2007GL030356
Chlieh, M., Avouac, J. P., Hjorleifsdottir, V., Song, T.-R. A., Ji, C., Sieh, K., et al. (2007). Coseismic slip and afterslip of the great (Mw 9.15) Sumatra-Andaman earthquake of 2004. Bull. Seismol. Soc. Am. 97, S152–S173. doi:10.1785/0120050631
Chlieh, M., Avouac, J. P., Sieh, K., Natawidjaja, D. H., and Galetzka, J. (2008). Heterogeneous coupling of the Sumatran megathrust constrained by geodetic and paleogeodetic measurements. J. Geophys. Res. 113, B05305. doi:10.1029/2007JB004981
Chlieh, M., Perfettini, H., Tavera, H., Avouac, J., Remy, D., Nocquet, J., et al. (2011). Interseismic coupling and seismic potential along the Central Andes subduction zone. J. Geophys. Res. 116, B12405. doi:10.1029/2010JB008166
Cochard, A., and Madariaga, R. (1996). Complexity of seismicity due to highly ratedependent friction. J. Geophys. Res. 101, 25321–25336. doi:10.1029/96JB02095
Contreras-Reyes, E., and Carrizo, D. (2011). Control of high oceanic features and subduction channel on earthquake ruptures along the Chile–Peru subduction zone. Phys. Earth Planet. In. 186, 49–58. doi:10.1016/j.pepi.2011.03.002
Cook, B. J., Henstock, T. J., McNeill, L. C., and Bull, J. M. (2014). Controls on spatial and temporal evolution of prism faulting and relationships to plate boundary slip offshore north-central Sumatra. J. Geophys. Res. 119, 5594–5612. doi:10.1002/2013JB010834
DeMets, C., Gordon, R. G., and Argus, D. F. (2010). Geologically current plate motions. Geophys. J. Int. 181, 1–80. doi:10.1111/j.1365-246X.2009.04491.x
Dewey, J.W., Choy, G., Presgrave, B., Sipkin, S., Tarr, A.C., Benz, H., et al. (2007). Seismicity associated with the Sumatra– Andaman islands earthquake of December 26, 2004. Bull. Seismol. Soc. Am. 97 (1A), S25–S42. doi:10.1785/0120050626
Diament, M., Harjono, H., Karta, K., Deplus, C., Dahrin, D., Zen, M., et al. (1992). Mentawai fault zone off Sumatra: a new key to the geodynamics of western Indonesia. Geology 20, 259–262. doi:10.1130/0091-7613(1992)020<0259:MFZOSA>2.3.CO;2
Engdahl, E. R., Villasenor, A., DeShon, H. R., and Thurber, C. H. (2007). Teleseismic relocation and assessment of seismicity (1918–2005) in the region of the 2004 Mw 9.0 Sumatra-Andaman and 2005 Mw 8.6 Nias Island great earthquakes. Bull. Seismol. Soc. Am. 97, 43–61. doi:10.1785/0120050614
Engdhal, E., van der Hilst, R., and Buland, R. (1998). Global teleseismic earthquake relocation with improved travel times and procedures for depth determination. Bull. Seismol. Soc. Am. 88, 722–743.
Fauzi, , McCaffrey, R., Wark, D., and SunaryoPrih Haryadi, P.Y. (1996). Lateral variation in slab orientation beneath Toba Caldera, northern Sumatra. Geophys. Res. Lett. 23, 443–446. doi:10.1029/96GL0038
Featherstone, W. (1997). On the use of the geoid in geophysics: a case study over the North West shelf of Australia. Explor. Geophys. 28 (1–2), 52–57. doi:10.1071/EG997052
Franke, D., Schnabel, M., Ladage, S., Tappin, D. R., Neben, S., Djajadihardja, Y. S., et al. (2008). The great Sumatra-Andaman earthquakes. Imaging the boundary between the ruptures of the great 2004 and 2005 earthquakes. Earth Planet. Sci. Lett. 269 (1–2), 118–130. doi:10.1016/j.epsl.2008.01.047
Fujii, Y., and Satake, K. (2008). Tsunami waveform inversion of the 2007 Bengkulu, southern Sumatra, earthquake. Earth Planet Sp. 60, 993–998. doi:10.1186/BF03352856
Graindorge, D., Klingelhoefer, F., Sibuet, J. C., McNeill, L., Henstock, T. J., Dean, S., et al. (2008). Impact of the lower plate on upper plate deformation at the NW Sumatran convergent margin from seafloor morphology. Earth Planet. Sci. Lett. 275, 201–210. doi:10.1016/j.epsl.2008.04.053
Grevemeyer, I., and Tiwari, V.M. (2006). Overriding plate controls spatial distribution of megathrust earthquakes in the Sunda–Andaman subduction zone. Earth Planet. Sci. Lett. 251, 199–208. doi:10.1016/j.epsl.2006.08.021
Grombein, T., Heck, B., and Seitz, K. (2013). Optimized formulas fors the gravitational field of a tesseroid. J. Geod. 87, 645–600. doi:10.1007/s00190-013-0636-1
Guilbert, J., Vergoz, J., Schissele, E., Roueff, A., and Cansi, Y. (2005). Use of hydroacoustic and seismic arrays to observe rupture propagation and source extent of the M-w 9.0 Sumatra earthquake. Geophys. Res. Lett. 32, L15310. doi:10.1029/2005GL022966
Han, S.C., Shum, C., Bevis, M., Ji, C., and Kuo, C. (2006). Crustal dilatation observed by GRACE after the 2004 Sumatra-Andaman. Earthquake Shin-Chan Sci. 313, 658–662. doi:10.1126/science.1128661
Hayes, G. (2018). Slab2 – a comprehensive subduction zone geometry model. Science 362, 58–61. doi:10.1126/science.aat4723
Hayes, G. P., Myers, E. K., Dewey, J. W., Briggs, R. W., Earle, P. S., Benz, H. M., et al. (2017). Tectonic summaries of magnitude 7 and greater earthquakes from 2000 to 2015: United States. Geol. Surv. Open-File Rep. 2016–1192, 148. doi:10.3133/ofr20161192
Henstock, T. J., McNeill, L. C., Bull, J. M., Cook, B., Gulick, S., Austin, J. A., et al. (2016). Downgoing plate topography stopped rupture in the A.D. 2005 Sumatra earthquake. Geology 44 (1), 71–74. doi:10.1130/G37258.1
Hicks, S. P., Rietbrock, A., Rydera, I. M. A., Lee, C. S., and Miller, M. (2014). Anatomy of a megathrust: the 2010 M8.8 Maule, Chile earthquake rupture zone imaged using seismic tomography. Earth Planet Sci. Lett. 405, 142–155. doi:10.1016/j.epsl.2014.08.028
Hippchen, S., and Hyndman, R.D. (2008). Thermal and structural models of the Sumatra subduction zone: implications for the megathrust seismogenic zone. J. Geophys. Res. 113, B12103. doi:10.1029/2008JB005698
Hsu, Y. J., Simons, M., Avouac, J. P., Sieh, K., Galetzka, J., Chlieh, M., et al. (2006). Frictional afterslip following the Mw 8.7, 2005 Nias-Simeuleu earthquake, Sumatra. Science 312, 1921–1926. doi:10.1126/science.1126960
Hyndman, R. D., and Peacock, S.M. (2003). Serpentinization of the forearc mantle. Earth Planet. Sci. Lett. 212, 417–432. doi:10.1016/S0012-821X(03)00263-2
Hyndman, R. D., and Wang, K. (1993). Thermal constraints on the zone of major thrust earthquake failure: the Cascadia Subduction Zone. J. Geophys. Res. 98, 2039–2060. doi:10.1029/92JB02279
Hyndman, R. D., Yamano, M., and Oleskevich, D. A. (1997). The seismogenic zone of subduction thrust faults. Isl. Arc. 6, 244–260. doi:10.1111/j.1440-1738.1997.tb00175.x
Janak, J., and Sprlak, M. (2006). New software for gravity field modelling using spherical Armonic. Geod.Cartog. Hor. 52, 1–8.
Karig, D. E., Lawrence, M. B., Moore, G. F., and Curray, J. R. (1980). Structural frame work of the fore-arc basin, NW Sumatra. J. Geol. Soc. 137 (1), 77–91. doi:10.1144/gsjgs.137.1.0077
Kendrick, E., Bevis, M., Smalley, R., Brooks, B., Vargas, R. B., Lauría, E., et al. (2003). The Nazca-South America Euler vector and its rate of change. J. S. Am. Earth Sci. 16 (2), 125–131. doi:10.1016/S0895-9811(03)00028-2
Kieckhefer, R. M., Sho, G. G., and Curray, J. R. (1980). Seismic refraction studies of the Sunda trench and forearc basin. J. Geophys. Res. 85, 863–889. doi:10.1029/JB085iB02p00863
Klingelhoefer, F., Gutscher, M. A., Ladage, S., Dessa, J. X., Graindorge, D., Franke, D., et al. (2010). Limits of the seismogenic zone in the epicentral region of the 26 December 2004 great Sumatra-Andaman earthquake: results from seismic refraction and wide-angle reflection surveys and thermal modeling. J. Geophys. Res. 115, B01304. doi:10.1029/2009JB006569
Konca, A., Avouac, J., Sladen, A., Meltzner, A. J., Sieh, K., Fang, P., et al. (2008). Partial rupture of a locked patch of the Sumatra megathrust during the 2007 earthquake sequence. Nature 456, 631–635. doi:10.1038/nature07572
Konca, A. O., Hjorleifsdottir, V., Song, T., Avouac, J.-P., Helmberger, D. V., Ji, C., et al. (2007). Rupture kinematics of the 2005, Mw 8.6, Nias-Simeulue earthquake from the joint inversion of seismic and geodetic data. Bull. Seismol. Soc. Am. 97 (1A), S307–S322. doi:10.1785/0120050632
Kopp, H. (2013). Invited review paper: the control of subduction zone structural complexity and geometry on margin segmentation and seismicity. Tectonophysics 589, 1–16. doi:10.1016/j.tecto.2012.12.037
Krabbenhoeft, A., Weinrebe, R. W., Kopp, H., Flueh, E. R., Ladage, S., Papenberg, C., et al. (2010). Bathymetry of the Indonesian Sunda margin relating morphological features of the upper plate slopes to the location and extent of the seismogenic zone. Nat. Hazards Earth Syst. 10, 1899–1911. doi:10.5194/nhess-10-1899-2010
Lay, T., Ammon, C. J., Kanamori, H., Yamazaki, Y., Cheung, K. F., and Hutko, A. R. (2011). The 25 October 2010 Mentawai tsunami earthquake (Mw 7.8) and the tsunami hazard presented by shallow megathrust ruptures. Geophys. Res. Lett. 38, L06302. doi:10.1029/2010GL046552
Lay, T., Kanamori, H., Ammon, C. J., Nettles, M., Ward, S. N., Aster, R. C., et al. (2005). The great Sumatra-Andaman earthquake of 26 December 2004. Science 308, 1127–1133. doi:10.1126/science.1112250
Lay, T., and Kanamori, H. (1981). “An asperity model of large earthquake sequences,” in Earthquake prediction, an international review. Editors D. W. Simpson, and P. G. Richards (Maurice Ewing Book Series), Vol. 4, 579–592. doi:10.1029/ME004p0579
Lay, T., Kanamori, H., Ammon, C., Koper, K., Hutko, A., Ye, L., et al. (2012). Depth varying rupture properties of subduction zone megathrust faults. J. Geoph. Res., Solid Earth 117, B04311. doi:10.1029/2011JB009133
Lay, T., Kanamori, H., and Ruff, L. (1982). The asperity model and the nature of large subduction zone earthquakes. Earthq. Pred. Res. 1, 3–71. doi:10.1029/ME004p0579
Li, X. (2001). Vertical resolution: gravity versus vertical gravity gradient. Lead. Edge. 20, 901–904. doi:10.1190/1.1487304
Liu, C., Curray, J. R., and McDonald, J. M. (1983). New constraints on the tectonic evolution of the eastern Indian Ocean: Earth Planet Sci. Lett. 65, 331–342. doi:10.1016/0012-821X(83)90171-1
Llenos, A. L., and Mc Guire, J. J. (2007). Influence of fore-arc structure on the extent of great subduction zone earthquakes. J. Geophys. Res. 112, B09301. doi:10.1029/2007JB004944
Lorito, S., Romano, F., Piatanesi, A., and Boschi, E. (2008). Source process of the September 12, 2007, Mw 8.4 southern Sumatra earthquake from tsunami tide gauge record inversion. Geophys. Res. Lett. 35, L02310. doi:10.1029/2007GL032661
Lubis, A. M., Hashima, A., and Sato, T. (2013). Analysis of afterslip distribution following the 2007 September 12 Southern Sumatra earthquake using poroelastic and viscoelastic media. Geophys. J. Int. 192 (1), 18–37. doi:10.1093/gji/ggs020
McCloskey, J., Nalbant, S., and Steacy, S. (2005). Earthquake risk from co-seismic stress. Nature 434, 291. doi:10.1038/434291a
McGuire, J. J., Zhao, L., and Jordan, T. H. (2002). Predominance of unilateral rupture for a global catalog of large earthquakes. Bull. Seismol. Soc. Am. 92, 3309–3317. doi:10.1785/0120010293
Metois, M., Vigny, C., and Socquet, A. (2016). Interseismic coupling, megathrust earthquakes and seismic swarms along the Chilean subduction zone (38°-18°S). Pure Appl. Geophys. 173, 1431–1449. doi:10.1007/s00024-016-1280-5
Moreno, M. S., Melnick, D., Rosenau, M., Baez, J., Klotz, J., Oncken, O., et al. (2012). Toward understanding tectonic control on the Mw 8.8 2010 Maule Chile earthquake. Earth Planet Sci. Lett. 321–322, 152–165. doi:10.1016/j.epsl.2012.01.006
Müller, R. D., Sdrolias, M., Gaina, C., and Roest, W. R. (2008). Age, spreading rates, and spreading asymmetry of the world’s ocean crust. G-cubed 9, 18–36. doi:10.1029/2007GC001743
Nalbant, S., McCloskey, J., Steacy, S., NicBhloscaidh, M., and Murphy, S. (2013). Interseismic coupling, stress evolution, and earthquake slip on the Sunda megathrust. Geophys. Res. Lett. 40, 4204–4208. doi:10.1002/grl.50776
Nalbant, S., Steacy, S., Sieh, K., Natawidjaja, D., McCloskey, J., et al. (2005). Earthquake risk on the Sunda trench. Nature 435, 756–757. doi:10.1038/nature435756a
Natawidjaja, D. H., Sieh, K., Chlieh, M., Galetzka, J., Suwargadi, B. W., Cheng, H., et al. (2006). Source parameters of the great Sumatran megathrust earthquakes of 1797 and 1833 inferred from coral microatolls. J. Geophys. Res. 111, B06403. doi:10.1029/2005JB004025
Natawidjaja, D. H., Sieh, K., Galetzka, J., Suwargadi, B. W., Cheng, H., Edwards, R. L., et al. (2007). Interseismic deformation above the Sunda Megathrust recorded in coral microatolls of the Mentawai islands, West Sumatra. J. Geophys. Res. 112, B02404. doi:10.1029/2006JB004450
Natawidjaja, D., Sieh, K., Ward, S., Cheng, H., Edwards, R. L., Galetzka, J., et al. (2004). Paleogeodetic records of seismic and aseismic subduction from central Sumatran microatolls, Indonesia. J. Geophys. Res. 109, B04306. doi:10.1029/2003JB0002398
Newcomb, K., and McCann, W. (1987). Seismic history and seismotectonics of the Sunda arc. J. Geophys. Res. 92, 421–439. doi:10.1029/JB092iB01p00421
Ni, S., Kanamori, H., and Helmberger, D. (2005). Energy radiation from the Sumatra earthquake. Nature 434, 582. doi:10.1038/434582a
Oleskevich, D. A., Hyndman, R. D., and Wang, K. (1999). The up-dip and down-dip limits to great subduction earthquakes: thermal and structural models of Cascadia, south Alaska, SW Japan, and Chile. J. Geophys. Res. 104, 14,965–14,991. doi:10.1029/1999JB900060
Pan, T. C., Megawati, K., Brownjohn, J. M. W., and Lee, C. L. (2001). The Bengkulu, southern Sumatra, earthquake of 4 June 2000 (Mw 7.7): another warning to remote metropolitan areas. Seismol. Res. Lett. 72, 171–185. doi:10.1785/gssrl.72.2.171
Panet, I., Mikhailov, V., Diament, M., Pollitz, F., King, G., de Viron, O., et al. (2007). Coseismic and post-seismic signatures of the Sumatra 2004 December and 2005 March earthquakes in GRACE satellite gravity. Geophys. J. Int. 171 (1), 177–190. doi:10.1111/j.1365-246X.2007.03525.x
Prawirodirdjo, L., Bocl, Y., McCaffrey, R., Genrich, J., Calais, E., Stevens, C., et al. (1997). Geodetic observations of interseismic strain segmentation at the Sumatra subduction zone, Geophys. Res. Lett. 24, 2601–2604. doi:10.1029/97GL52691
Prawirodirdjo, L., McCaffrey, R., Chadwell, C. D., Bock, Y., and Subarya, C. (2010). Geodetic observations of an earthquake cycle at the Sumatra subduction zone: role of interseismic strain segmentation. J. Geophys. Res. 115, B03414. doi:10.1029/2008JB006139
Reinen, L. A., Weeks, J. D., and Tullis, T. E. (1991). The frictional behaviour of serpentinite: implications for aseismic creep on shallow crustal faults. Geophys. Res. Lett. 18, 1921–1924. doi:10.1029/91GL02367
Rivera, L., Sieh, K., Helmberger, D., and Natawidjaja, D. (2002). A comparative study of the Sumatran subduction-zone earthquakes of 1935 and 1984. Bull. Seismol. Soc. Am. 92, 1721–1736. doi:10.1785/0120010106
Rummel, R., Yi, W., and Stummer, C. (2011). GOCE gravitational gradiometry. J. Geodyn. 85 (11), 777–790. doi:10.1007/s00190-011-0500-0
Sandwell, D. T., and Smith, W. H. F. (1997). Marine gravity anomaly from Geosat and ERS 1 satellite altimetry. J. Geophys. Res. 102, 10039–10054. doi:10.1029/96JB03223
Scholz, C. H. (1990). The mechanics of earthquakes and faulting. Cambridge, U.K: Cambridge University Press, 439.
Siebert, L., and Simkin, T. (2002). “Volcanoes of the world: an illustrated catalog of holocene volcanoes and their eruptions.” Smithsonian Institution. Gloval volcanism program digital information series, GVP-3. Available at: www.volcano.si.edu/world (Accessed March 2020).
Sieh, K., and Natawidjaja, D. (2000). Neotectonics of the Sumatran fault, Indonesia. J. Geophys. Res. 105, 28295–28326. doi:10.1029/2000JB900120
Sieh, K., Natawidjaja, D., Chlieh, M., Galetzka, J., and Avouac, J.-P. (2004). “The giant subduction earthquakes of 1797 and 1833, West Sumatra: characteristic couplets, uncharacteristic slip,” in Fall Meeting. American Geophysical Union, Vol. 85.[abstract:T12B-04].
Sieh, K., Natawidjaja, D. H., Meltzner, A. J., Shen, C.-C., Cheng, H., Li, K.-S., et al. (2008). Earthquake Supercycles inferred from sea-level changes recorded in the corals of West Sumatra. Science 322, 1674–1678. doi:10.1126/science.1163589
Sieh, K., Ward, S. N., Natawidjaja, D. H., and Suwargadi, B. W. (1999). Crustal deformation at the Sumatran subduction zone. Geophys. Res. Lett. 26, 3141–3144.
Simoes, M., Avouac, J. P., Cattin, R., and Henry, P. (2004). The Sumatra subduction zone: a case for a locked fault zone extending into the mantle. J. Geophys. Res. 109, B10402. doi:10.1029/2003JB002958
Sobiesiak, M. M., Meyer, U., Schmidt, S., Götze, H. J., and Krawczyk, C. (2007). Asperity generating upper crustal sources revealed by b-value and isostatic residual anomaly grids in the area of Antofagasta. J. Geophys. Res. 112, B12308. doi:10.1029/2006JB004796
Song, T. R., and Simons, M. (2003). Large trench-parallel gravity variations predict seismogenic behavior in subduction zones. Science 301, 630–633. doi:10.1126/science.1085557
Sparkes, R., Tilmann, F., Hovius, N., and Hillier, J. (2010). Subducted seafloor relief stops rupture in South American great earthquakes: implications for rupture behavior in the 2010 Maule, Chile earthquake. Earth Planet Sci. Lett. 298, 89–94. doi:10.1016/j.epsl.2010.07.029
Stein, S., and Okal, E. A. (2005). Speed and size of the Sumatra earthquake. Nature 434, 581–582. doi:10.1038/434581a
Tassara, A. (2010). Control of forearc density structure on megathrust shear strength along the Chilean subduction zone. Tectonophysics 495, 34–47. doi:10.1016/j.tecto.2010.06.004
Uieda, L., Barbosa, V., and Braitenberg, C. (2016). Tesseroids: forward-modeling gravitational fields in spherical coordinates. Geophysics 81, F41–F48. doi:10.1190/geo2015-0204.1
Vigny, C., Simons, W. J. F., Abu, S., Bamphenyu, R., Satirapod, C., Choosakul, N., et al. (2005). Insight into the 2004 Sumatra-Andaman earthquake from GPS measurements in southeast Asia. Nature 436, 201–206. doi:10.1038/nature03937
Wells, R. E., Blakely, R. J., Sugiyama, Y., Scholl, D. W., and Dinterman, P. A. (2003). Basin centered asperities in great subduction zone earthquakes: a link between slip, subsidence and subduction erosion?. J. Geophys. Res. 108 (B10), 2507–2536. doi:10.1029/2002JB002072
Wessel, P., Luis, J. F., Uieda, L., Scharroo, R., Wobbe, F., Smith, W. H. F., et al. (2019). The generic mapping tools version 6. G-cubed 20, 5556–5564. doi:10.1029/2019GC008515
Keywords: great earthquake rupture process, megathrust earthquakes, Gravity Field and Steady-State Ocean Circulation Explorer satellite data, seismic hazard, subduction zone, Sumatra-Andaman earthquake, Sunda arc subduction zone, coseismic slip distribution
Citation: Álvarez O, Pechuan Canet S, Gimenez M and Folguera A (2021) Megathrust Slip Behavior for Great Earthquakes Along the Sumatra-Andaman Subduction Zone Mapped From Satellite GOCE Gravity Field Derivatives. Front. Earth Sci. 8:581396. doi: 10.3389/feart.2020.581396
Received: 09 July 2020; Accepted: 10 December 2020;
Published: 15 February 2021.
Edited by:
Debora Presti, University of Messina, ItalyReviewed by:
Gianluca Vignaroli, University of Bologna, ItalySebastiano D’Amico, University of Malta, Malta
Copyright © 2021 Álvarez, Pechuan Canet, Gimenez and Folguera. This is an open-access article distributed under the terms of the Creative Commons Attribution License (CC BY). The use, distribution or reproduction in other forums is permitted, provided the original author(s) and the copyright owner(s) are credited and that the original publication in this journal is cited, in accordance with accepted academic practice. No use, distribution or reproduction is permitted which does not comply with these terms.
*Correspondence: Orlando Álvarez, b3JsYW5kb19hX3BAeWFob28uY29tLmFy