 Alessandro Bonaccorso*
 Elisabetta Giampiccolo
- Istituto Nazionale di Geofisica e Vulcanologia - Osservatorio Etneo, Catania, Italy
Dikes are the primary mechanisms to transport magma and feed eruptions. Investigations of the surface deformation and seismicity caused by a dike can potentially provide useful information to forecast the expected propagation and associated hazard. On December 24, 2018, a dike intrusion reached the summit of Mt. Etna, feeding an effusive fissure. The intrusion was accompanied by a seismic swarm, with hypocenters beneath the summit craters and eruptive fissure, and by ground deformation. The seismicity continued the following day, with the hypocenters deepening to 3 km b.s.l. due to the propagation of a deeper and thicker dike. This situation generated the fear of feeding a more dangerous eruption in the medium-low flank. Recently it was found an equation that relates the average thickness and dimension of the dike with the expected released mechanical energy and, therefore, to the seismic moment. By using this updated application, it is shown that the observed seismicity could not be accounted for by the first dike. Instead, the cumulative effect of both dikes indicates a total moment from available energy expected that balances the moment recorded by the seismicity. The proposed approach proved very useful in the specific case of Etna volcano eruptions, resulting an effective tool to monitor the state of the intrusion of the magma and, therefore, to predict if a dike has enough energy to continue propagating or to stop.
Introduction
Dike propagation is a main process for magma transport and eruptions. Several studies have investigated this mechanism involving different approaches such as solid mechanics, field mapping and analogue lab experiments. Review presentations on dike investigations are reported in Pollard (1987), Lister and Kerr (1991), Rubin (1995), and Rivalta et al. (2015). A critical and intriguing aspect is dike arrest. In fact, in most cases propagating dikes can stop before reaching the free surface (e.g., Gudmundsson et al., 1999; Gudmundsson, 2003). Dike stopping may occur for different reasons: driving pressure decreasing (e.g., Rivalta, 2010; Taisne et al., 2011), magma solidification (e.g., Lister and Kerr, 1991), structural barrier (e.g., Geshi et al., 2010; Gudmundsson, 2011) and stress perturbation (Maccaferri et al., 2015; Xu et al., 2016). Despite the complexity of the issue, the goal of having a tool to track the propagation state of the dike is fundamental at frequently erupting volcanoes whose flanks are densely populated, such as at Mt. Etna. Bonaccorso et al. (2017) investigated the relationship between measured dike-induced deformation and the seismicity released during its propagation. The authors devised a simple equation related to the dike’s average thickness that can be used as a proxy of the expected mechanical energy to be released during its propagation. They also obtained an empirical law that quantifies the expected seismic energy released before arrest. The authors found a general law from data of different volcanoes around the world where dikes were modeled and seismicity recorded (Afar region, Japanese volcanoes, Etna volcano). However, if robust data for single volcanoes areas are available, then the goodness of the equation improves and it is better to use the representative equation of the specific investigated volcano.
So far, the equation fitted the recent dikes feeding the flank eruptions of the last 2 decades very well (2001, 2002-two dikes, 2008), suggesting it is a valid tool to determine the total seismic moment to be released by an intrusion, and thus potentially able to follow the energy status during the dike propagation and the timing of its possible arrest.
On December 24, 2018, in the early morning, a fast dike crossed Mt. Etna volcano and reached the surface at 11:10. It produced an eruptive fissure in the summit area and began emitting a lava flow in the high eastern flank (Calvari et al., 2020). From 8:30 to 11:10, the dike intrusion was accompanied by a seismic swarm located beneath the shallow (0–2 km a.s.l.) central portion of the volcano (Alparone et al., 2020; Giampiccolo et al., 2020) (Figure 1). One interesting aspect was that the seismic swarm continued even during the following 24 h, decreasing in the afternoon-evening of December 25th. This seismicity was localized in a more decentralized portion toward the SE of the volcano. This behavior raised great concern about the possibility that another intrusion with greater lateral extension was acting inside the volcanic building. This dike could have been a significant hazard if it reached the surface, resulting in more eruptive activity. In fact, the more an intrusion extends laterally, the greater the risk that the eruptive fissure and lava flows may approach small towns and villages. Similarly to the 2002 eruption, the intrusive process triggered an acceleration of the eastward sliding of the unstable eastern sector of the volcano (Bonforte et al., 2019). Following the eruptive period, this marked sliding was also accommodated by fault slip that on 26 December culminated with the ML 4.8 earthquake along the Fiandaca fault in the low Eastern flank (Alparone et al., 2020; Giampiccolo et al., 2020).
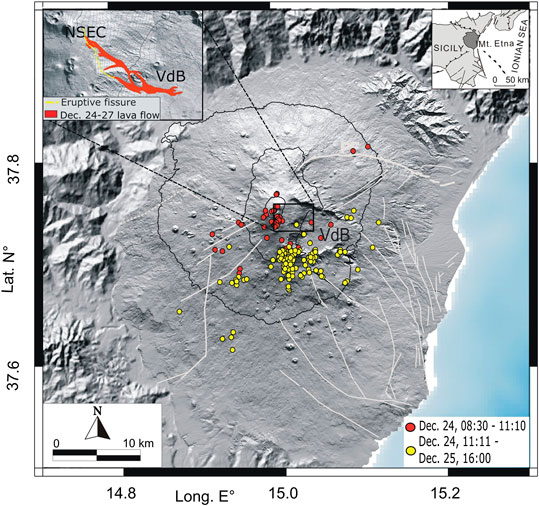
Figure 1. 3D location of the seismicity occurring at Mt. Etna between 08:30, December 24 and 16:00, December 25 (modified after Alparone et al., 2020). In the inset top left, the lava flow during the December 24–27eruption (Calvari et al., 2020) is shown together with the eruptive fissure that opened on December 24.
However, the effusive activity of the eruption lasted only a few days and emitted a modest lava volume of ca. ∼3 × 10⁶ m3. Therefore, the critical aspect regarding the second major intrusion that did not feed any eruption, and whether this behavior could have been better tracked, remained unclear.
Recently, Aloisi et al. (2020) jointly analyzed and modeled different types of continuous deformation data (strainmeters, tiltmeters and high-rate GPS) to constrain a detailed and complete model and the time evolution for the December 24–25, 2018 eruptive intrusion. The result improves the previous interpretative models that were not based on continuous deformation measurements. The authors showed that the data are robustly modeled by a first shallow dike departing under central crater area from sea level, and by a second deeper and larger dike that stopped below sea level without crossing the final portion of the volcano.
In this study, in “Estimation of Dike Energy from Inferred Dike Shape” section we present the approach from Bonaccorso et al. (2017) by using the observables of the energy released during diking, namely seismicity and deformation, and clarifying their mutual relationship. In “The Multiple Intrusions of the Etna Dec 2018 Eruption” section, we present the complex December 24–25, 2018 intrusion by reporting the 3D high-precision locations of the earthquakes and recent advanced modeling of the ground deformation during these two days. In “Updated Relationship Between Energy Expected from Dike Shape vs. Measured Seismic Energy” section, we update with the 2018 case the equation relating the energy expected from a dike with a determined geometry and the seismic energy released, and verify how this equation can provide useful information on the propagation of intrusions also in the recent case of the December 2018 eruption. Finally, we discuss the potential danger of the 2018 eruption and, even in this complex case characterized by a double intrusion, show that the proposed approach and updated equation prove a useful tool to obtain information on the state of the dike’s propagation.
Estimation of Dike Energy from Inferred Dike Shape
Following the linear elastic theory, in which the thickness t to length l ratio of a dike is related to the driving pressure Pd able to open the dike walls (i.e., Pollard, 1987; Rubin, 1995), Bonaccorso et al. (2017) obtained an equation for the available mechanical elastic strain energy UE as a function of the dike thickness t:
where μ is the medium rigidity and ν is the Poisson coefficient.
Equation 1 was used both on a world mean scale (Etna, Japan volcanoes and Afar eruptions) and on a single volcano (Etna) to obtain the relation linking the energy of the dikes modeled from the deformation measurements and the seismic energy release during the dike propagation. On Etna volcano, the modeled dike shapes and the seismic recordings are very robust for the recent eruptions thanks to an integrated monitoring system of ground deformation (static and continuous GPS measurements and continuous borehole tilt) and the dense seismic network around the volcano.
Bonaccorso et al. (2017) correlated the mechanical energy UE to the seismic moment released by the induced earthquakes. In particular, the authors obtained a linear relation between log10Mo and log10UT, where Mo is the cumulative recorded seismic moment and UT the total 3D available mechanical elastic strain energy, obtained multiplying the UE of Eq. 1 by the length of the dike in the direction perpendicular to the propagation (i.e., the estimated width).
The purpose of this result is to obtain a tool for tracking the energy released by the intrusion to evaluate its propagation. The logical chain of the proposed process essentially followed four steps:
1) The dike model parameters are obtained from the deformation measurements. This is possible since the size and shape of the dike can be modeled from the deformations recorded by the permanent monitoring system, in principle also from the first initial phases of the dike propagation.
2) From the dike model we can estimate the energy to be released, since from Eq. 1 this can be calculated from the dimension of the dike, mainly in terms of its thickness.
3) Defining the relationship between energy associated with the dike and energy released by earthquakes. From the numerous recent eruptions already studied and modeled, this energy estimated from the model obtained can, in turn, be related to the seismic energy released by the earthquakes induced by the propagation of the eruptive intrusion. A relation of type log10 (Mo) = a log10 (UT) + b is used, where a and b are the coefficients to fix by the fit of Mo and UT data.
4) Tracking the evolution of the process. Finally, we can estimate the expected energy, namely the one that the eruptive fissure (dike) should release during its propagation. We can also monitor the discharge of energy over time, and observe when it is approaching the expected value to be released. . This allows us to evaluate the state of the intrusion of the magma, and if this would continue to propagate (its cumulated energy is below the expected energy level) or if it is about to stop (the expected energy level is reached).
As a real case application, Bonaccorso et al. (2017) considered the December 27, Etna 2002 dike propagation modeled by the continuous borehole tiltmeters data that allowed inferring a near constant thickness of 3.35 m (Aloisi et al., 2006). The dike propagated in the NE flank, reaching a distance of ∼5 km from the summit craters area. Once again, there was concern that this eruptive fissure could propagate in the lower flank and discharge magma. Following the proposed approach, Bonaccorso et al. (2017) estimated the available elastic strain energy UT and then calculated the expected seismic moment Mo to be released and verified that the recorded cumulated Mo approached the expected Mo limit.
The Multiple Intrusions of the Etna Dec 2018 Eruption
The December 24, 2018 flank eruption at Mt. Etna began in the early morning with intense degassing from the summit craters. It was accompanied by both a seismic sequence, starting at 08:30, and a fast increase in the volcanic tremor amplitude (Alparone et al., 2020). At 11:10, an eruptive fissure, about 2 km long and SE-trending, opened between 3,000 and 2,400 m a.s.l. at the southern base of the New Southeast Crater (NSEC, inset in Figure 1) producing lava fountain and lava flows that spread eastward over the upper western flank of the Valle del Bove depression (VdB). The lava fountain lasted just half an hour, whereas the lava flow output from the main eruptive fissure remained copious on December 25, decreasing significantly on December 26, in conjunction with a drastic decrease in the volcanic tremor amplitude (Alparone et al., 2020 and references therein). Lava emission stopped definitively on December 27. The total length of the lava flow field was 0.88 km2 (Calvari et al., 2020), and the emitted volume was 1.4 ± 0.5 Mm3 of summit outflows and 0.85 ± 0.3 Mm3 of lateral flows, as calculated from spectroradiometers of the satellites MODIS and Sentinel-2 (Laiolo et al., 2019).
To study the process of the December 2018 intrusive episode, we used precise 3D hypocenters of the earthquakes recorded from the beginning of the dike intrusion (08:30, December 24 until 16:00, December 25 (Alparone et al., 2020; Giampiccolo et al., 2020). These locations, compared to 1D ones (GADS, 2020; Supplementary Table S1), show a sharpening of clustered seismicity features with a significant reduction in uncertainties (about 40% RMS reduction and average location errors less than 0.2 km in both the horizontal and vertical directions) and, therefore, provide a clearer picture of how seismicity evolved within the edifice.
The earthquake locations during the first 30 h (December 24–25; Figures 1 and 2). from 8:30 to 11:10 indicated an initial cluster of events with epicenters aligned in a N-S direction, located between −1 km b.s.l. and 2 km a.s.l., beneath the summit craters and along the eruptive vent (red circles in Figures 1 and 2). Then, the seismicity moved southeastwards and, starting from 16:30, it migrated toward the western wall of VdB with a deepening of the hypocenters up to −3 km b.s.l. (yellow circles in Figures 1 and 2). The seismicity occurring from 20:00 on December 24 until the afternoon (16:00) of December 25 affected a wider and deeper volume with respect to the main earthquake clusters (Alparone et al., 2020; yellow circles in Figures 1 and 2). The prevailing normal faulting mechanism of the earthquakes located beneath the summit craters and along the eruptive fractures matches well with the direction of extensional stress regime and is consistent with a magma push which favored the magma ascent through the shallow crust (Alparone et al., 2020).
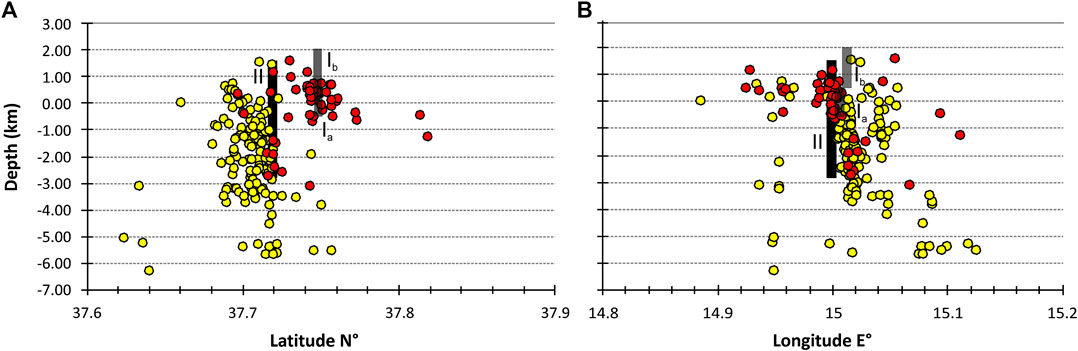
Figure 2. Depth vs. latitude (A) and longitude (B) distribution of the earthquakes occurring from 08:30 to 11:10 on December 24 (red circles) and from 11:11 to 16:00 on December 25 (yellow circles). The positions of the two dikes inferred by Aloisi et al. (2020) are also shown. The first dike, composed by two parts (Ia−Ib), is indicated in dark gray, the second dike (II) is indicated in black. For dike parameters see Supplementary Table S2.
During the initial phase of the eruption, the INGV provided a first estimation of the dike model in order to quickly assist the Italian Civil Protection Authorities in monitoring the on-going phenomenon. By using the real time GPS solutions exclusively, a shallow near-vertical dike was inferred, located between the sea level and the summit eruptive fissure, with a horizontal length of 2 km, vertical width of 1 km and an opening of 3 m (Aloisi et al., 2020). This modeling was then refined including more reliable displacement estimations, but it did not change much from the initial estimation. It provided a good indication of the intrusion acting during the early morning of December 24 until the eruption start at 11:10, but does not fit with the continuation of the seismicity for the whole day of December 25. So, after the start of the eruption the scenario was not as one would expect, in the sense that usually at volcanoes, once the eruption begins and the propagation of the feeder dike ends, the seismic activity diminishes and the deformation changes end. Instead, during the December 2018 intrusion, the seismicity continued after the eruption onset and, besides the summit area, also affected the southwestern flanks of the volcanic edifice (Alparone et al., 2020). Moreover, it promoted a strong acceleration of the eastern flank movements toward the SE direction (Bonforte et al., 2019; Alparone et al., 2020). These aspects clearly indicated that the intrusive process was more complex than the shallow intrusion modeled from 8:30 to 11:10.
A turning point for a more complete understanding of the intrusive process was recently provided by Aloisi et al. (2020). The authors integrated all the continuous deformation data (GPS, borehole strainmeters and tiltmeters), inferring a more detailed and robust model. The multi-parametric approach revealed the complexity of the real volcanic processes, involving two separate dikes rather than just one. The first dike is the shallower one departing in the last 3 km below the summit craters area (dike Ia), gradually increasing its horizontal dimension (dike Ib). It began propagating on December 24 at 8:20, reached the ground surface at 11:10 and fed the short-lived lateral eruption. After the start of the eruption and until the afternoon of December 25, a second dike penetrated the high southern eastern flank but did not reach the surface (dike II). This dike was very thick (∼5 m opening) and deeper, departing from about 3 km b.s.l. and stopping inside the volcano edifice at 1.5 km a.s.l. The parameters of the dikes modeled by Aloisi et al. (2020) are reported in Supplementary Table S2. The modeled dike positions are shown in Figure 2 together with the hypocentral location of the earthquakes. The 3D sketch map of the seismicity and the dike positions are shown in Figure 3, where the match between the earthquake locations and the dike positions inferred by geodetic models is evident.
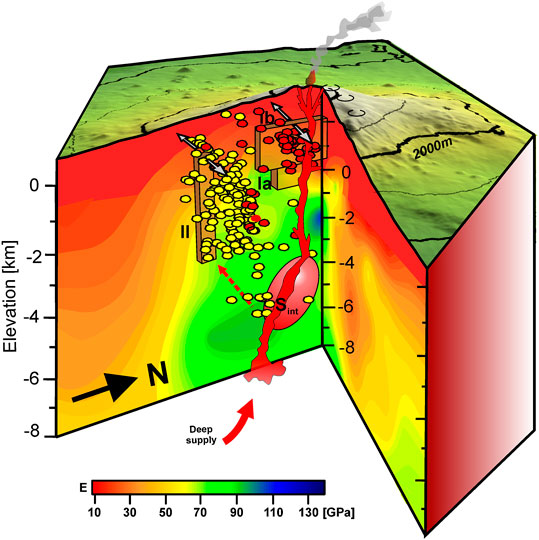
Figure 3. 3D sketch map showing the two dikes inferred by Aloisi et al. (2020) and the 3D high-precision locations (Alparone et al., 2020; Giampiccolo et al., 2020) of the earthquakes which accompanied the eruptive episode during the first 30 h. The first shallower eruptive dike increased its width during the propagation and is made up of the two parts Ia and Ib (see Supplementary Table S2). It reached the surface and generated the eruption. The second deeper non-eruptive dike II halted before reaching the free surface. See text for the detailed parameters and modeling description. The positions of the modeled dikes are well matched by the two main clusters of the seismicity. The Sint is the zone of the intermediate storage modeled by the recorded deformation during the inflation/deflation periods that precede/accompany the main eruptions at Etna (i.e., Bonforte et al., 2008 and references therein). The seismic tomography from Aloisi et al. (2002) is also reported along the cross-sections by representing the deduced Young’s modulus E.
Updated Relationship Between Energy Expected from Dike Shape vs Measured Seismic Energy
In quantifying the released energy during dike propagation, the seismic moment of the earthquakes accompanying and tracking the migratory path of the intruding magma can be considered not only the seismic energy which is radiated seismically but also a measure of the total energy released during the intrusion process (Bonaccorso et al., 2017). We derived the seismic moment of the earthquakes recorded during the intrusive episode of December 24 from the local magnitude ML, according to Eq. 2, obtained for Mt. Etna earthquakes by Giampiccolo et al. (2007):
From the onset of the dike intrusion until the opening of the eruptive fissure (08:30–11:10), about 60 earthquakes with 1.1 ≤ ML ≤ 4.0 were extracted from the INGV-OE Catalog (GADS, 2020; Supplementary Table S1). The total seismic moment released is about 1015 J. A second phase spans from the beginning of the eruption to 16:00 on December 25 and includes about 135 earthquakes with magnitude 1.4 ≤ ML ≤ 4.3. The cumulative energy released until the afternoon of December 25 reaches the value of 1.16 × 10¹⁶ J.
Supplementary Table S3 shows an updated scheme, also containing the dikes of the 2018 eruption, which summarizes the parameters of the eruptive dikes modeled from ground deformation and the associated recorded total seismic moment Mo released during their propagations. From the values reported in Supplementary Table S3, we estimated the updated relationship between the energy expected from dike shape/dimensions modeled from ground deformation measurements and the seismic energy measured from the cumulative seismic moment of the earthquakes recorded during the dike propagation. We obtained:
confirming the same previous coefficients found in Bonaccorso et al. (2017) and maintaining a very good correlation coefficient R2 equal to 0.97 (Figure 4A).
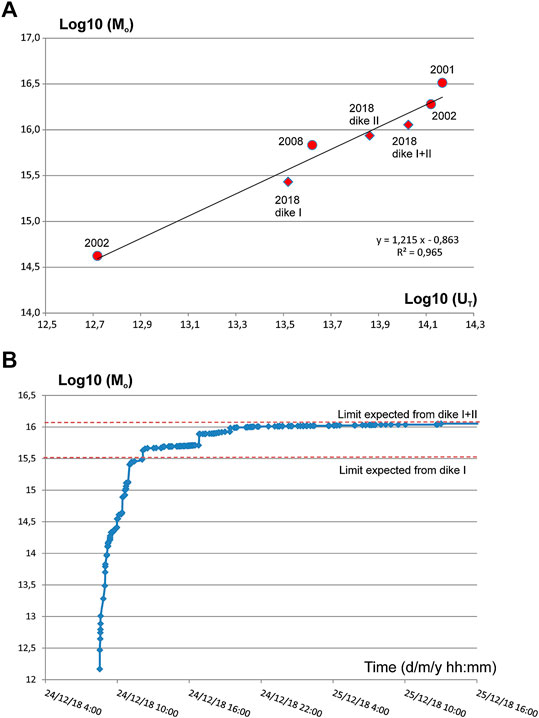
Figure 4. (A) Total seismic moment Mo (J) calculated from the seismicity recorded during the dike propagation vs. total 3-D available mechanical elastic strain energy UT (J) estimated from Eq. 4 for the modeled dikes of Etna’s eruptions (see Supplementary Table S3). The rhombuses are for the dike I, dike II and dikes (I + II), respectively, of 24–25 December 2018, while the circles are for the dikes of the 2001, 2002 (two dikes) and 2008 eruptions (see Supplementary Table S2). (B) Application example of the 24–25 December 2018 double dike intrusion of Etna. log10(Mo) vs. time. From the initial phases of the dike, after its opening is inferred, the available energy can be estimated from Eq. 2 and the expected total seismic moment to be released (dashed line) from Eq. 3. This Mo value is the limit to be reached by the cumulative recorded seismic moment to obtain the energy equilibrium and the dike stopping.
After UT is estimated from the dike parameters, Eq. 3 allows determining the seismic moment expected by the release of the dike’s available energy that can be compared with the recorded seismic moment, hence providing a tool to evaluate when the energy is balancing. In the case of the December 2018 eruption, the method highlights that the first eruptive dike, promptly modeled on the morning of December 24, did not release enough energy to balance the recorded seismic moment that continued to accumulate in the following hours (Figure 4B). Therefore, the proposed approach clearly suggests that another seismic source was active after the eruption started. From continuous deformation data, Aloisi et al. (2020) inferred a second deeper and thicker dike, located slightly further south than the first, that did not reach the free surface. If we consider the total moment from available energy expected by the cumulative effect of both dikes, then the expected Mo and the recorded one are well balanced (Figure 4B).
Discussion and Conclusion
The eruption of Christmas 2018 was a peculiar event for two main aspects: i) in spite of a powerful intrusion, the ensuing effusive activity lasted only about 3 days, stopping on the morning of December 27; ii) it was accompanied by a seismic swarm that did not stop after the start of the eruption (morning of 24 December) but continued until the afternoon of the following day.
The first dike, the eruptive one crossing the surface portion of the volcanic building and reaching the surface to feed the eruption, produced a clear deformation pattern on a scale of the entire volcano, more marked in the summit area and with a strong amplitude decay toward the external flanks, this due to the shallow position of this dike. The continuation of seismicity was associated with the propagation of a second deeper dike, which was unable to reach the surface but stopped 1.5 km below the crater area. This second dike instead caused a wide deformation detected more clearly in the southern flank portion above its projection. This dike stopped below the ground surface and did not cross the final portion of the volcano pile where the main deformation was produced. It was characterized by relatively small width (about 600 m) compared to the shallow dike (about 2,700 m) (see Figure 3; Supplementary Table S1). If the deeper dike had been >1.5–2 km wider, it would have caused marked deformation on the scale of the entire volcano edifice (Aloisi et al., 2020). The detail of the recorded and the expected deformation patterns is clearly shown in Figure 9 by Aloisi et al. (2020). After the start of the eruption, the main concern was the possible propagation of a more external and dangerous dike. In fact, because of its location shifted southward from the crater area, this second dike, if further propagating, could have been hazardous by generating a low flank eruption. In general, the longer the propagation, the more dangerous it is since the dike could approach towns and infrastructures, densely located on the volcano’s lower flanks. The risk map of lava flows shows that the highest risk is found in the south-eastern flank due to the combination of high hazard and population density (Del Negro et al., 2019). Related to this sector of the volcano, a famous example was the 1,669 eruption: an eruptive fissure propagated 16 km in the southern flank, fed an eruptive vent in the low flank and went on to destroy several villages and partially the main town of Catania (Branca et al., 2013). Today, an eruption similar to the 1,669 event would cause damage amounting to about seven billion Euros (Del Negro et al., 2016).
Fortunately, the scenario of a flank eruption in the lower flank did not take place probably because the first intrusion and the resulting eruption released most of the energy, as testified by the decreasing seismicity rate (Alparone et al., 2020) and by its distribution throughout the whole volcanic edifice and along well-known fault zones (Alparone et al., 2020). However, during the 24th and 25th of December it would have been very important and strategic to have valid tools to evaluate the propagation status.
In this work, we have updated the equation obtained by Bonaccorso et al. (2017) and subsequently verified its applicability to the 2018 eruption. The approach is based on the monitoring of the expected energy calculated starting from the main parameters of the dike (thickness and width) and the seismic energy released by the earthquakes accompanying the dike intrusion. With this approach, a key aspect is that the expected energy is calculated from the main parameters of the dike, i.e., thickness and width which, in principle, can be modeled in the early stages of dike propagation when its effect on the surface begins to be revealed by the deformation monitoring systems. The seismic energy can be calculated in near real-time from the seismic moment Mo obtained from the seismic recordings. Since the comparison of the seismic moment expected by the release of the available energy with the moment calculated in real-time provides a forecast of when the energy is balancing and, hence, when the dike is expected to stop, the proposed approach is very helpful to estimate the dike propagation hazard during the early phase of an eruptive intrusion.
Clearly, the more robust the data for a single volcano, the better the quality of the relationship. As shown in the application case reported in Bonaccorso et al. (2017) for the recent eruptions of Etna volcano, the modeled dike shapes and the seismic recordings are particularly robust. This is thanks both to the integrated monitoring system of ground deformation (static and continuous GPS measurements and continuous borehole tilt) and the dense seismic network around the volcano (Bonaccorso et al., 2017). Our analysis supports the robustness of the empirical law proposed by Bonaccorso et al. (2017) and its validity also for the 2018 Mt. Etna eruption. So, for purposes of supporting an understanding of the state of intrusion propagation, it is fundamental to develop real-time modeling of ground deformation data. Such an approach can be used to have integrated information during intrusive processes that at Etna and other active volcanoes are frequent and require maximum attention and the best possible interpretation during their evolution.
Data Availability Statement
The data are available in Supplementary Materials. The localizations and magnitudes of the recorded earthquakes are reported in Table S1, the parameters of the modeled dikes from previous published studies are reported in Tables S2 and S3.
Author Contributions
AB conceived this work and traced its scheme. EG prepared and revised seismic data. Both the authors contributed in writing the manuscript and shared the discussion of the results.
Conflict of Interest
The authors declare that the research was conducted in the absence of any commercial or financial relationships that could be construed as a potential conflict of interest.
Acknowledgments
We kindly acknowledge the INGV-OE seismic network staff who ensure the regular working of seismic stations and the “Gruppo Analisi Dati Sismici” for providing earthquake data. AB is particularly indebted to the technical staff of the Ground Deformation Group of INGV-OE for the regular operation of the tilt and GPS monitoring networks, which enabled the previous studies over the last 3 decades. We thank S. Conway for revising the English language of the manuscript.
Supplementary Material
The Supplementary Material for this article can be found online at: https://www.frontiersin.org/articles/10.3389/feart.2020.583815/full#supplementary-material
References
Aloisi, M., Bonaccorso, A., Cannavò, F., Currenti, G., and Gambino, S. (2020). The 24 december 2018 eruptive intrusion at Etna volcano as revealed by multidisciplinary continuous deformation networks (CGPS, Borehole Strainmeters and Tiltmeters). J. Geophys. Res. Solid Earth 125, e2019JB019117. doi:10.1029/2019JB019117.
Aloisi, M., Bonaccorso, A., and Gambino, S. (2006). Imaging composite dike propagation (Etna, 2002 case). J. Geophys. Res. 111, 219–223. doi:10.1029/2005JB003908.
Aloisi, M., Cocina, O., Neri, G., and Orecchio, B. E. (2002). Seismic tomography of the crust underneath the Etna volcano, Sicily. Phys. Earth Planet. Inter. 134, 139–155. doi:10.1016/S0031-9201(02)00153-X
Alparone, S., Barberi, G., Giampiccolo, E., Maiolino, V., Mostaccio, A., Musumeci, C., et al. (2020). Seismological constraints on the 2018 Mt. Etna (Italy) flank eruption and implications for the flank dynamics of the volcano. New Mexico: Terra Nova, 1–11. doi:10.1111/ter.12463.
Bonaccorso, A., Aoki, Y., and Rivalta, E. (2017). Dike propagation energy balance from deformation modeling and seismic release. Geophys. Res. Lett. 44, 5486–5494. doi:10.1002/2017GL074008.
Bonforte, A., Bonaccorso, A., Guglielmino, F., Palano, M., and Puglisi, G. (2008). Feeding system and magma storage beneath Mt. Etna as revealed by recent inflation/deflation cycles. J. Geophys. Res. 113, B05406. doi:10.1029/2007JB005334.
Bonforte, A., Guglielmino, F., and Puglisi, G. (2019). Large dyke intrusion and small eruption: the December 24, 2018 Mt. Etna eruption imaged by Sentinel‐1 data. Terra. Nova 31, 405–412. doi:10.1111/ter.12403.
Branca, S., De Beni, E., and Proietti, C. (2013). The large and destructive 1669 AD eruption at Etna volcano: reconstruction of the lava flow field evolution and effusion rate trend. Bull. Volcanol. 75, 694. doi:10.1007/s00445-013-0694-5.
Calvari, S., Bilotta, G., Bonaccorso, A., Caltabiano, T., Cappello, A., Corradino, C., et al. (2020). The VEI 2 Christmas 2018 Etna eruption: a small but intense eruptive event or the starting phase of a larger one? Remote Sens. 12 (6), 905 doi:10.3390/rs1206905.
Del Negro, C., Cappello, A., Bilotta, G., Ganci, G., and Herault, A. (2016). “Risk from lava flow inundations in densely populated areas: the case of Etna volcano, Abstract V12A-08,” in 2016 Fall Meeting, AGU, San Francisco, CA, 12–16 December.
Del Negro, C., Cappello, A., Bilotta, G., Ganci, G., Hérault, A., and Zago, V. (2019). Living at the edge of an active volcano: risk from lava flows on Mt. Etna. Geol. Soc. Am. Bull. 132, 1615. doi:10.1130/B35290.1
GADS - Gruppo Analisi Dati Sismici (2020). Catalogo dei terremoti della Sicilia Orientale—Calabria Meridionale (1999–2020). Catania, Italy: INGV. Available at: http://sismoweb.ct.ingv.it/maps/eq_maps/sicily/catalogue.php
Geshi, N., Kusumoto, S., and Gudmundsson, A. (2010). Geometric difference between non-feeder and feeder dikes. Geology 38 (3), 195–198. doi:10.1130/G30350.1.
Giampiccolo, E., Cocina, O., De Gori, P., and Chiarabba, C. (2020). Dyke intrusion and stress-induced collapse of volcano flanks: the example of the 2018 event at Mt. Etna (Sicily, Italy). Sci. Rep. 10, 6373. doi:10.1038/s41598-020-63371-3.
Giampiccolo, E., D'Amico, S., Patane, D., and Gresta, S. 2007). Attenuation and source parameters of shallow microearthquakes at Mt. Etna volcano, Italy. Bull. Seismol. Soc. Am. 97, 184–197. doi:10.1785/0120050252.
Gudmundsson, A. (2011). Deflection of dykes into sills at discontinuities and magma-chamber formation. Tectonophysics 500, 50–64. doi:10.1016/j.tecto.2009.10.015.
Gudmundsson, A., Marinoni, L. B., and Martí, J. (1999). Injection and arrest of dykes: implications for volcanic hazards. J. Volcanol. Geotherm. 88 (1–2), 1–13. doi:10.1016/S0377-0273(98)00107-3.
Gudmundsson, A. (2003). Surface stresses associated with arrested dykes in rift zones. Bull. Volcanol. Res. 65, 606–619. doi:10.1016/S0377-0273[98]00107-3
Laiolo, M., Ripepe, M., Cigolini, C., Coppola, D., Della Schiava, M., Genco, R., et al. (2019). Space- and ground-based geophysical data tracking of magma migration in shallow feeding system of mount Etna volcano. Rem. Sens. 11 (10), 1182. doi:10.3390/rs11101182.
Lister, J. R., and Kerr, R. C. (1991). Fluid-mechanical models of crack propagation and their application to magma transport in dykes. J. Geophys. Res. 96, 10049110–077. doi:10.1029/91jb00600
Maccaferri, F., Rivalta, F., Passarelli, L., and Aoki, Y. (2015). On the mechanisms governing dike arrest: insight from the 2000 Miyakejima dike injection, Earth Planet. Sci. Lett. 434 (64–7), 42016. doi:10.1016/j.epsl.2015.11.024.
Pollard, D. D. (1987). “Elementary fracture mechanics applied to the structural interpretation of dykes,” in Mafic Dyke swarms, Editors H. C. Halls and W. H. Fahrig, Geological Association of Canada special paper, Vol. 34, pp. 112–128.
Rivalta, E. (2010). Evidence that coupling to magma chambers controls the volume history and velocity of laterally propagating intrusions. J. Geophys. Res. 115, B07203. doi:10.1029/2009jb006922
Rivalta, E., Taisne, B., Bunger, A. P., and Katz, R. F. (2015). A review of mechanical models of dike propagation: schools of thought, results and future directions. Tectonophysics 638, 1–42. doi:10.1016/j.tecto.2014.10.003
Rubin, A. M. (1995). Propagation of magma-filled cracks, Annu. Rev. Earth Planet. Sci. 23, 287–336. doi:10.1146/annurev.ea.23.050195.001443
Taisne, B., Tait, S., and Jaupart, C. (2011). Conditions for the arrest of a vertical propagating dyke. Bull. Volcanol. 73, 191–204. doi:10.1007/s00445-010-0440-1.
Keywords: Etna volcano, dike intrusion, eruption monitoring, volcano seismicity, volcano deformation, energy balance
Citation: Bonaccorso A and Giampiccolo E (2020) Balance Between Deformation and Seismic Energy Release: The Dec 2018 ‘Double-Dike’ Intrusion at Mt. Etna. Front. Earth Sci. 8:583815. doi: 10.3389/feart.2020.583815
Received: 15 July 2020; Accepted: 22 September 2020;
Published: 09 October 2020.
Edited by:
Cecile Doubre, Université de Strasbourg, FranceReviewed by:
Eisuke Fujita, National Research Institute for Earth Science and Disaster Resilience (NIED), JapanFinnigan Illsley-Kemp, Victoria University of Wellington, New Zealand
Copyright © 2020 Bonaccorso and Giampiccolo. This is an open-access article distributed under the terms of the Creative Commons Attribution License (CC BY). The use, distribution or reproduction in other forums is permitted, provided the original author(s) and the copyright owner(s) are credited and that the original citation in this journal is cited, in accordance with accepted academic practice. No use, distribution or reproduction is permitted which does not comply with these terms.
*Correspondence: Alessandro Bonaccorso, YWxlc3NhbmRyby5ib25hY2NvcnNvQGluZ3YuaXQ=