 B. G. Bukchin1
 A. S. Fomochkina
 V. G. Kossobokov
 A. K. Nekrasova
- 1Institute of Earthquake Prediction Theory and Mathematical Geophysics, RAS, Moscow, Russia
- 2Gubkin Russian State University of Oil and Gas, Moscow, Russia
- 3Institut de Physique du Globe de Paris, Paris, France
- 4International Seismic Safety Organization, Arsita, Italy
For each of three major M ≥ 7.0 earthquakes (i.e., the January 24, 2016, M7.1 earthquake 86 km E of Old Iliamna; the January 23, 2018, M7.9 earthquake 280 km SE of Kodiak; and the November 30, 2018, M7.1 earthquake 14 km NNW of Anchorage, Alaska), the study considers characterization of the foreshock and aftershock sequences in terms of their variations and scaling properties, including the behavior of the control parameter η of the unified scaling law for earthquakes (USLE), along with a detailed analysis of the surface wave records for reconstruction of the source in the approximation of the second moments of the stress glut tensor to obtain integral estimation of its length, orientation, and development over time. The three major earthquakes at 600 km around Anchorage are, in fact, very different due to apparent complexity of earthquake flow dynamics in the orogenic corner of the Pacific and North America plate boundary. The USLE generalizes the classic Gutenberg-Richter relationship taking into account the self-similar scaling of the empirical distribution of earthquake epicenters. The study confirms the existence of the long-term periods of regional stability of the USLE control parameter that are interrupted by mid- or even short-term bursts of activity associated with major catastrophic events.
Introduction
The territories around Anchorage have recently experienced four major earthquakes (Figure 1) and associated seismic sequences which illustrate the complexity of the tectonic environment at the orogenic corner of the boundary between the Pacific and North America plates where an Eulerian plate model is not expected to be accurate (Bird, 2003). The January 24, 2016 and the November 30, 2018 earthquakes, both of M7.1, occurred under the North American plate at the south and north edges of the Cook Inlet, respectively. The largest of the four, the January 23, 2018, M7.9 earthquakes ruptured the Pacific plate in front of the continental crust of Alaska. The July 22, 2020, M7.8 Alaska Peninsula earthquake (July 22, 2020 06:12:44.719 UTC, 55.0683°N and 158.5543°W, 28 km, Mww7.83) ruptured a 200-km segment of the Aleutian megathrust fault in the study area after the manuscript submittal. All four appear to rupture the subducting Pacific plate right at the border of or within the extended source region of the March 27, 1964 Great Alaska, M9.3 mega-earthquake (Press and Jackson, 1965; Wyss and Brune, 1967; Kanamori, 1970; Christensen and Beck, 1994). The complexity of the megathrust is characterized with a multiple rupture of several segments of subducting Pacific plate, including the lateral transition faulting along the Yakutat block at the corner of the Pacific–North America plate boundary. The apparent reactivation of this region at the level of the M ≥ 7 earthquakes deserves special attention of seismologists. Therefore, in the following sections, we provide integral characterization of the fore- and aftershock sequences for each of the three earthquakes in terms of their magnitude–space–time distributions and the control parameter of the unified scaling law for earthquakes (Kossobokov and Mazhkenov, 1994; Bak et al., 2002; Kossobokov and Nekrasova, 2019), as well as the average estimates of the rupture extent, duration, and velocity, making use of the low-degree moments of the stress glut rate (Backus, 1977a; Backus, 1977b). Nowadays, when large earthquakes occur in sensible areas, including the Alaska’s most populous city of Anchorage, numerous studies provide source tomographies (e.g., Ohta et al., 2006; Wei et al., 2012; Li et al., 2016; Grapenthin et al., 2018; Krabbenhoeft et al., 2018; Lay et al., 2018; Ruppert et al., 2018; Liu et al., 2019; Mann and Abers 2020; Ruppert et al., 2020; West et al., 2020). A large amount of work on the Alaskan earthquakes is based on different types of data and/or different methodological approaches. Therefore, some inconsistency and contradictions in the results obtained by different authors are inevitable, so that rupture process models are often different. That is why simple methods should be used to produce robust constrains to improve resolution of authoritative comprehensive determinations.
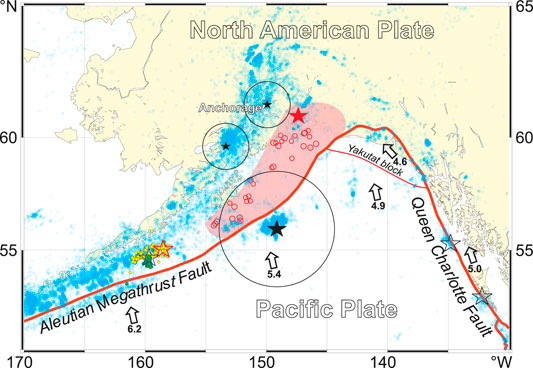
FIGURE 1. Epicenters of the M ≥ 2.5 earthquakes (ANSS, 2006–2019; small blue circles) and the three major earthquakes (black stars) in Southern Alaska. Note: The two major earthquakes of MW7.1 and the one of MW7.9 under study are encircled with R = 1° and 2.5° circles, respectively. Red line marks the boundary of the North American and the Pacific plates. The epicenters of the 1964 Great Alaskan earthquake (big red star) and its first aftershocks (red circles) are given on top the subsurface rupture zone (shaded pink). The epicenters of the 22 July 2020, MW7.8 (red outline star) and its first day M ≥ 2.5 aftershocks (small yellow circles) at 105 km SSE of Perryville, Alaska and the 19 October 2020, MW7.6 earthquake at 97 km SSE of Sand Point, Alaska (blue outline star) and its first day aftershocks (small green circles) occurred after the manuscript submittal and acceptance, correspondingly. The directions and rates (in cm/year) of Pacific plate convergence are indicated by the arrows.
Data
Seismicity of the region around Anchorage from January 01, 2006 through May 2019 is considered within 54°–64°N and 140°–160°W. The online search of the U.S. Geological Survey Advanced National Seismic System (ANSS) database provides a reasonably complete record of magnitude 2.5 or above earthquakes in the study area (Figure 2); in particular, the catalog is complete in the circles around the two M7.1 epicenters, while has an apparent deficiency of earthquakes below magnitude 3.0 in the larger circle around the M7.9 epicenter in front of the continental Alaska. The graphs of the monthly number of the M ≥ 2.5 earthquakes confirm the stability of hypocenters’ determinations in the ANSS catalog in advance of the major events.
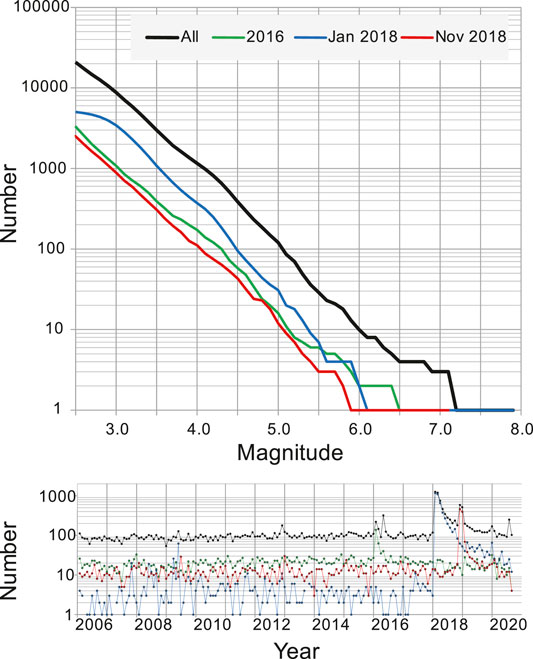
FIGURE 2. The Gutenberg–Richter plot of the cumulative number of earthquakes (above) and the monthly number of the M ≥ 2.5 earthquakes (below) in the study region (black) and around each of the three major earthquakes: the January 24, 2016, M7.1 (green), January 23, 2018, M7.9 (blue), and November 30, 2018, M7.1 (red) earthquakes.
For each of the total 20,803 earthquakes considered, the catalog reports the ANSS preferred magnitude M. The Gutenberg–Richter plot (Gutenberg and Richter, 1944) of the cumulative number of earthquakes in magnitude range from 2.5 to 7.9 (Figure 2) follows the exponential best-fit trend line with the b-value of 0.868 (R2 = 0.993). The plot is below its trend line in the magnitude range from below 5 up to 6.8, and then rises above due to the three major earthquakes on January 24, 2016, January 23, 2018, and November 30, 2018, whose parameters are listed in Table 1. Figure 3 displays the 4-D distribution of earthquakes in plots of magnitude, latitude, and longitude vs. time. The determination of depth is naturally biased by preset constants; therefore, to avoid potentially misleading conclusions, the depth vs. time distribution is not shown. Earthquakes with data points on pale yellow are not considered in the study.
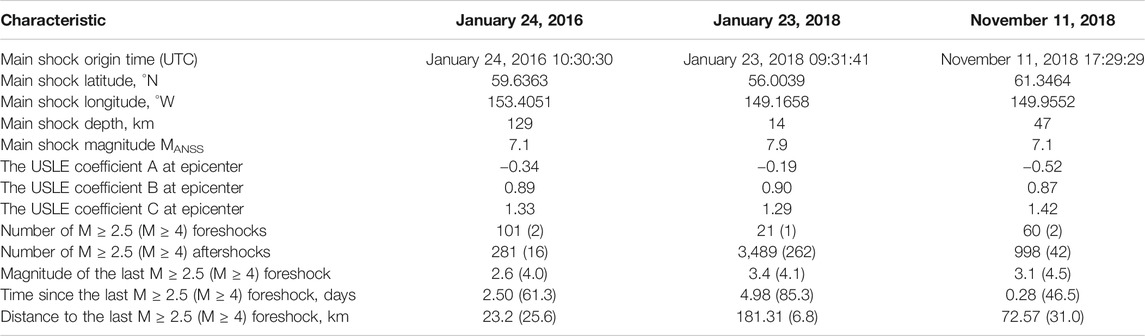
TABLE 1. Characteristics of the three major earthquake series in Southern Alaska, 2016–2018. Coefficients of the Unified Scaling Law for Earthquakes (USLE) are from the global map determinations (Nekrasova and Kossobokov, 2002) available from the ISC Dataset Repository.
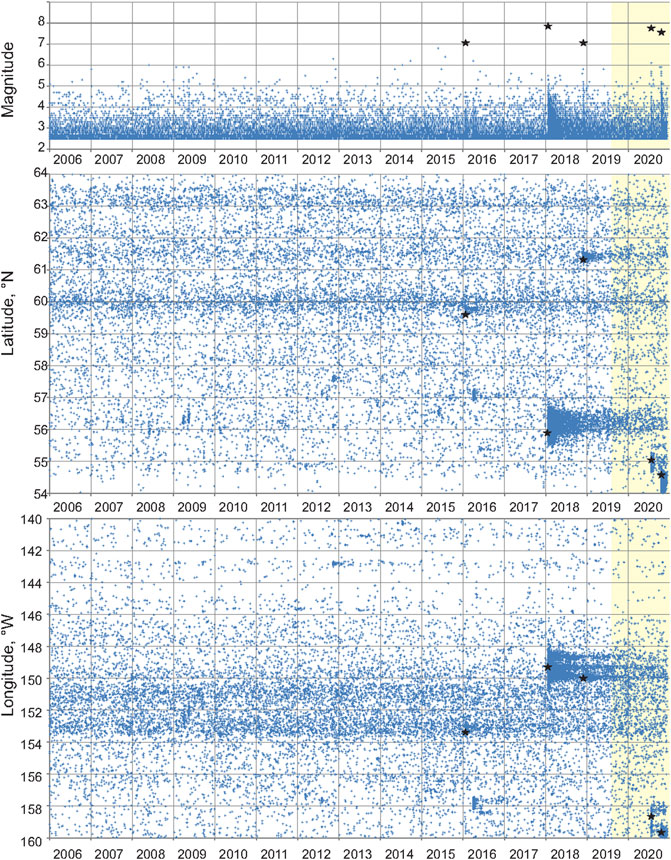
FIGURE 3. Magnitude–latitude–longitude vs. time distribution of earthquakes in Southern Alaska, 2006–2020. The 4-D display of seismic activity shows the variable space–time intensity of earthquake energy release in the region, in particular, the irregular shapes of aftershock clusters including those of the three major earthquakes (black stars).
Figure 4 provides the map of the coefficients of unified scaling law for earthquakes, USLE, which generalizes the Gutenberg–Richter relationship as follows (Nekrasova and Kossobokov, 2005; Kossobokov, 2020):
where N(M, L) is the number of earthquakes of a certain magnitude M expected in a year within an earthquake-prone area of diameter L; A and B are constants characterizing the annual rate of magnitude 5 events and the magnitude exponent analogous to a- and b-values of the Gutenberg–Richter relationship; and C estimates the fractal dimension of the epicenter loci at the given site. As evident from Figure 4C, the values of fractal dimension about 1.4 or larger highlight the highly fractured zone where subduction interacts with slippage along the Queen Charlotte transform fault. One can see that the highest values of C spread around the city of Anchorage accompanied with relatively low values of the logarithm of the seismic rate (A about −0.6). In contrast the area of Alaska–Aleutian trench is characterized by the highest level of earthquake rate (A about 0) and the lowest estimates of seismic locus dimension (C down to about 1). A, B, and C values at the epicenters of the three major earthquakes are listed in Table 1.
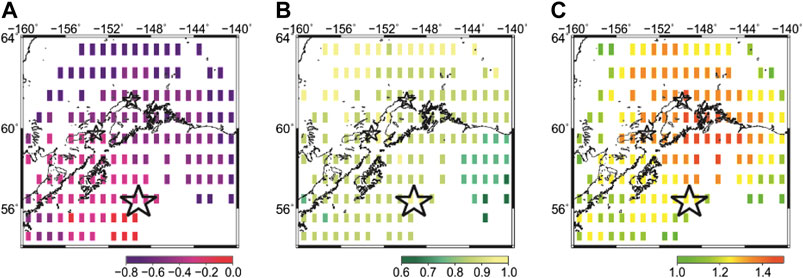
FIGURE 4. The Unified Scaling Law for Earthquakes (USLE) coefficients in Southern Alaska (Nekrasova and Kossobokov, 2002; Nekrasova and Kossobokov, 2019). Note: stars mark the epicenters of the three major earthquakes.
Methodology
Characterizing Earthquake Sequences
As clearly noted by Bak et al. (2002), in essence, the USLE states that the distribution of inter-event times between earthquakes depends only on the value of the variable control parameter
where τ is the time between the two successive earthquakes, M is the magnitude of the second one, and L is the distance between the two. Recent studies of seismic sequences associated with strong M ≥ 6 earthquakes in Central Italy (Kossobokov and Nekrasova, 2017) and major M ≥ 7 earthquakes in New Zealand confirmed the existence of steady levels of the USLE control parameter η, called “periods of stability,” which, apparently, may change at the shorter times of critical transitions of a seismic regime, including those associated with regional or local catastrophic events, that is, major or strong earthquakes. To characterize seismic dynamics around each of the three major earthquakes, we use the same choices of the space–time limits as in Kossobokov and Nekrasova (2019). In particular, we apply the 50-point moving averages to control parameter η evaluated at an angular distance of 1° (or 2.5°) from the epicenter of the M ≥ 7 (or M ≥ 7.5) main shock for 128 days before and 128 days after its origin time (Figure 5). (The choice of time interval allows for a sevenfold doubling of the 1-day period which is appropriate in analyzing either acceleration or deceleration of a daily time series.)
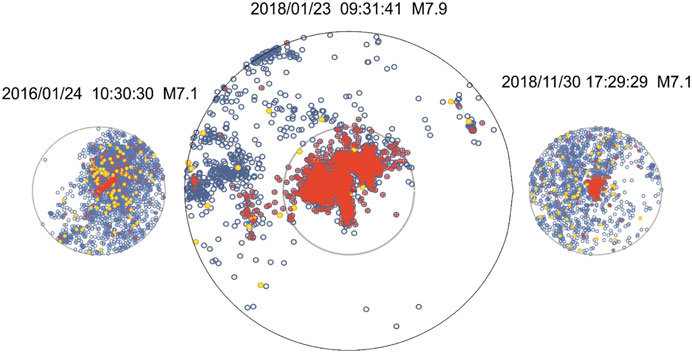
FIGURE 5. Epicenters of the M ≥ 2.5 earthquakes at angular distance of 1° and 2.5° from the epicenter of each of the three major earthquakes in Southern Alaska. Note: open blue circles are epicenters of earthquakes in January 24, 2006–January 24, 2019, January 23, 2008–May 27, 2019, and November 30, 2008–May 27, 2019, correspondingly; yellow circles and small red crosses are those events occurring within 128 days before and 128 days after the origin time of a major event, respectively.
Characterizing an Earthquake Source
We analyze surface wave amplitude spectra at periods much longer than the earthquake duration to determine its source parameters derived from the moments of the stress glut rate. A detailed description of this methodology is given in Bukchin (1995). These techniques have been successfully applied in a number of studies of earthquake rupture processes (e.g., Aoudia et al., 2000; Lasserre et al., 2001; Clévédé et al., 2004).
Considering the source of an earthquake in approximation of an instant point, we determine the source depth and focal mechanism (in terms of strike, dip, and slip angles) by systematic exploration of 4D parametric space, as well as seismic moment by minimizing the residual between the observed and calculated long period surface wave amplitude spectra. To improve the resolution of surface wave inversion, we performed joint inversion of surface waves and first arrival polarities. We calculate amplitude spectra using the model of weak lateral inhomogeneity for the Earth structure (Babich et al., 1976; Woodhouse, 1974). As is well known, the focal mechanism cannot be uniquely determined from the surface waves’ amplitude spectra. We use P-wave first arrival polarities to select the optimal solution, which in detail description and constrains are given in Lasserre et al. (2001). Before inversion, we apply a smoothing procedure to the observed polarities, then use the frequency–time analysis program (FTAN) (Lander 1989a; Lander 1989b; Levshin et al., 1989) to isolate the Love and Rayleigh fundamental modes recorded by selected stations of the IRIS, GEOSCOPE, and GEOFON networks (Institut de physique du globe de paris, & ecole et observatoire des sciences de La terre de strasbourg, 1982; Scripps Institution of Oceanography, 1986; GEOFON, 1993). We simulated separately Love and Rayleigh fundamental modes, and compared them with observed records located by FTAN. The observed surface wave records were corrected for attenuation using PREM model and instrumental response. Analyzing the surface wave spectra at shorter periods, we describe the source as an approximation of the stress glut second moments (Backus, 1977a; Backus, 1977b). Using these moments, we determine integral estimates of the length of the source major and minor axes, lmax and lmin, its duration ∆t, modulus of the axis average value of the instant centroid velocity |v|, and two angles: the angle between the strike axis and major axis, φl, and the angle between the strike axis and instant centroid velocity axis, φv.
Source dimension and spatial extent depend on the distribution of the stress glut rate in time and along the fault. In assumption of Gaussian distributions and 99% confidence levels, duration and length are set 2.5 and 3 times larger than their integral estimations, respectively.
To measure the effect of directivity, we consider a 1-D bilateral fault model with uniform slip from the nucleation point in two directions and define the modulus of uniform rupture velocity |v| and the ratio α = β/λ, where β is the shorter length to the source edge from the nucleation point and λ is the total source length. These two parameters can be expressed through the second moments of the stress glut rate. The vector v is directed along the vector of the average instant centroid velocity.
Identification of the fault plane based on the source description in terms of the second moment of stress glut rate approximation is impossible, if the major axis of the source is much larger than the minor one and rupture propagation is directed along the line of nodal planes’ intersection. In the case of a frequently encountered type of earthquake in which the major axis and the average instantaneous centroid velocity are directed along the strike axis, the fault plane can be reliably identified for a strike-slip event (λ = 0° or λ = 180°), and cannot be reliably identified for a dip-slip event (λ = 90° or λ = 270°). If the earthquake considered is not of the type mentioned above, then its fault plane identification must be resolved with other available evidence (Bukchin, 2017).
Results
Figure 5 shows epicenters of the M ≥ 2.5 earthquakes at angular distance of 1° and 2.5° from the epicenter of each of the three major earthquakes around Anchorage sampled in the time interval from 10 years before to 3 years after the origin time of the main shock or to the end of the available catalog. We specify those events occurring 128 days before (yellow circles) and after the main shock (red circles) and report a few related characteristics in the last rows of Table 1. The numbers of fore- and aftershocks differ dramatically; the ratio between them is 1:8, 1:262, and 1:21 for M ≥ 4.0 events around the January 2016, January 2018, and November 2018 main shocks, respectively. The delay time from the last foreshock differs from less than 7 h to about 5 days for the M ≥ 2.5 foreshocks and rises to a few months when M ≥ 4.0 foreshocks are considered. It is notable that the corresponding distances are much shorter for M ≥ 4.0 foreshocks (in particular, for both 2018 major earthquakes).
The sizes and shapes of aftershocks’ time series are also very different in Figure 5: for the 2016, M7.1 event, we observe a nearly straight line extending for about 50 km; for the January 20518, M7.9 event, the pattern of epicenters looks like a butterfly, with the sub-meridian narrow body extending for about 130 km and the two wings with a span of about 150 km, which appears consistent with the Coulomb stress transfer pattern; for the November 2018, M7.1 Anchorage earthquake, aftershocks are concentrated within a 40 × 20-km area.
The individual values of the USLE control parameter η from 2006 to 2019, along with their 50-point moving average <η>, are shown in Figure 6. The single period of stability of <η> for the entire interval of time (within a decimal order of their values 104 ≤ <η> < 105) was interrupted just for a few months after the January 24, 2016, M7.1 earthquake. In case of earthquake series around the January 23, 2018, M7.9 epicenter, the period of stability with 2 × 10⁵ ≤ <η> < 2 × 10⁶ was violated by a burst of activity from the end of March to the middle of May 2009 when seven earthquakes in magnitude range M5.0–5.9 occurred and then after the major shock. By the end of May 2019, the values of <η> increased to about 104 and may remain at this level as characterized by more intensive seismic activity in the area (confirmed by 4 × 10³ ≤ <η> < 4 × 10⁴ in June 2019−July 2020). Among the three series, the period in advance of the November 30, 2018, M7.1 Anchorage earthquake, characterized with 5 × 10⁴ ≤ <η> < 2 × 10⁵, is the most stable in regard to the variance of the USLE control parameter. Moreover, by the end of May 2019, the values of <η> have increased above 2 × 10⁴, which indicates reaching the same decimal order of values as those in advance of the main major shock (confirmed by 5 × 10⁴ ≤ <η> < 105 in June 2019–July 2020).
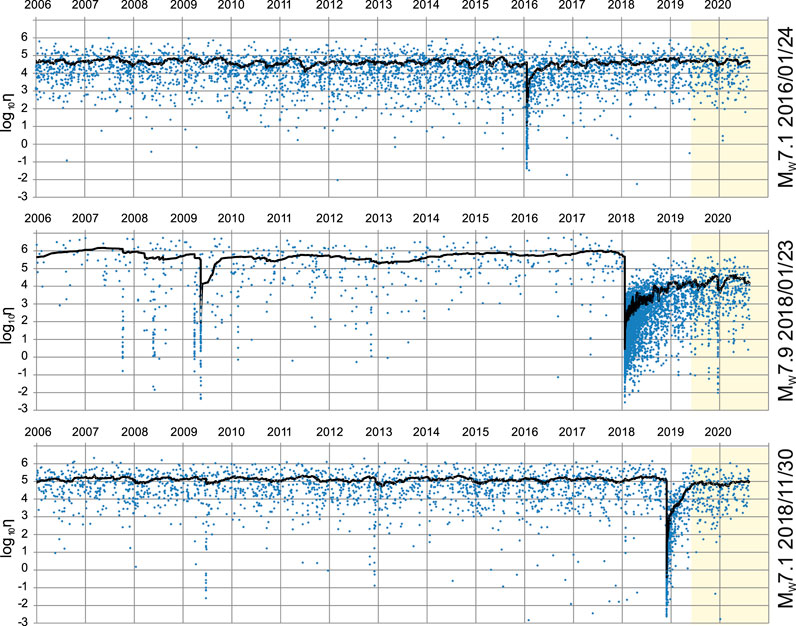
FIGURE 6. Values of the USLE control parameter η (little crosses) vs. earthquake origin time within angular distance of 1° from the epicenters of MW7.1 January 24, 2016 (top) and November 30, 2018 (bottom) and within 2.5° from the epicenter of MW7.9 January 23, 2018 (middle) main shocks and their averages per 50 events (lines). An apparent rise and drop of <η> by a factor of 2 in amplitude is observed in about a year preceding the two 2018 main shocks and not before the January 24, 2016, M7.1 event.
Let us zoom in to the 128-day intervals in advance and after the three major earthquakes. In the expanded view of <η> shown in Figure 7, we notice an apparent increase of <η> by a factor of 2 in advance of the January 24, 2016, M7.1 event, as well as a drop of <η> by a factor of 2 in advance of the other two major earthquakes, which does not appear to offer a method for short-term earthquake forecasting. The decay of the aftershock series is also rather diverse: the best fit of the 50-point moving average <η> in the three aftershock series of the January 2016, January 2018, and November 2018, as a function of time after the main shock, t, is the power law equal to 80.8 × t1.18 (R2 = 0.988), 22.6 × t1.18 (R2 = 0.949), and 19.9 × t0.88 (R2 = 0.932), respectively.
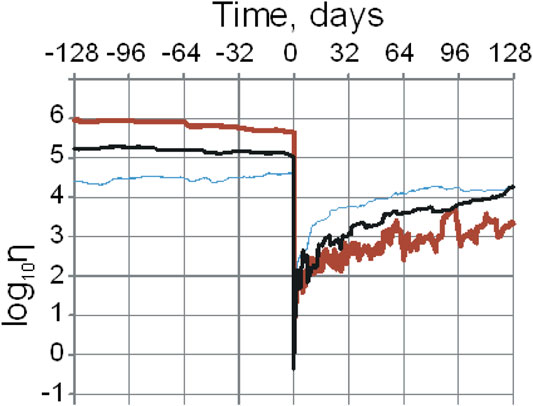
FIGURE 7. Averages of the USLE control parameter η per 50 events vs. time to the main shock for the MW7.1 January 24, 2016 (thin blue line), MW7.9 January 23, 2018 (heavy red line), and MW7.1 November 30, 2018 (black line) major earthquakes.
To determine the source parameters of the three major earthquakes at 600 km around Anchorage as derived from the moments of stress glut rate (Bukchin, 1995), we selected the following spectral bands (spectral bands in brackets correspond to the second moment approximation): 70–250 s (40–60 s) for the two M7.1 major earthquakes in 2016 and 2018 and 150–250 s (40–60 s) for the M7.9 earthquake in 2018. Table 2 shows for each of the three major earthquakes, the two nodal planes (first row) and, for each nodal plane, the six integral source parameters derived from the second stress glut moments (rows 2–7) along with the values of total residuals in the optimal solution (row 8). The six parameters characterize the earthquake model size, orientation, duration, and rupture propagation. The characteristics were obtained from making use of 36, 42, and 40 fundamental Love and Rayleigh mode records of the January 24, 2016, January 23, 2018, and November 30, 2018 earthquakes, respectively. Selecting the records, we did our best to satisfy the following conditions: i) signal quality, characterized by the value of the polarization anomaly, should be less than 15°, and ii) the azimuthal distribution of stations should be rather homogeneous.
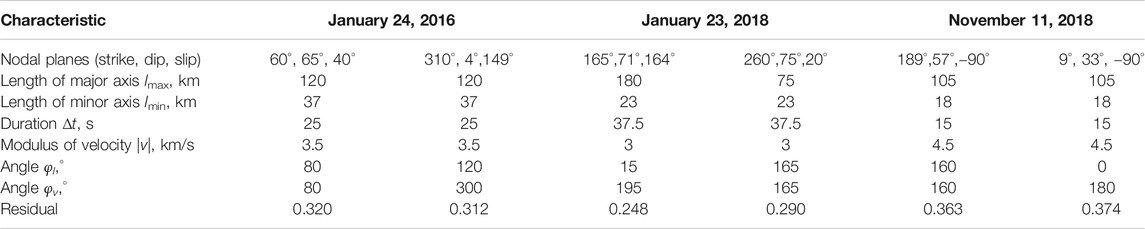
TABLE 2. Characteristics of the three major earthquake sources in Southern Alaska, 2016–2018. The earthquake source parameters are given for each of the two nodal planes.
Figure 8 summarizes modeling of the January 24, 2016, MW7.1 earthquake source by displaying the location of stations used in the determination a), the residual function which minimum defines the depth of the instant point source b), the double couple beach ball solution c), the focal mechanism modeled by three angles d), and the 1-D bilateral model of faulting e). The solution is not a pure dip slip, which complicates identification the fault plane. The residuals for the nodal planes of this earthquake (Table 2, last row) are about the same and do not allow for a confident choice of the fault plane; however, the abovementioned shape of the distribution of its aftershocks in Figure 5 favors the mechanism presented in Figure 8D.
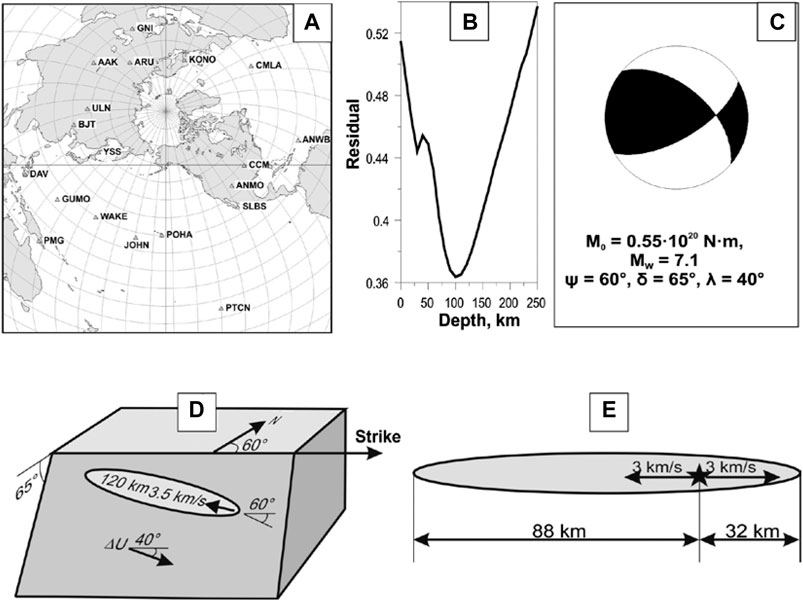
FIGURE 8. Modeling the January 24, 2016, MW7.1 earthquake: (A) stations used to determine parameters of the earthquake in the double couple approximation, (B) source depth residual function, (C) focal mechanism, (D) the earthquake focal model, (E) one-dimensional bilateral model of faulting oriented along the centroid velocity. Notes: the map (A) is centered at the epicenter of the major earthquake; M0, MW, ψ, δ, λ, and ΔU are seismic moment, moment magnitude, strike, dip, slip, and vector of slip direction, respectively.
By analogy, Figure 9 summarizes modeling of the January 23, 2018, MW7.9 earthquake source. In this case, the focal mechanism is practically pure strike-slip motion. The residuals, that differ by about 17%, favor the slippage along the near meridian strike of the narrow “butterfly body” of the aftershock distribution in Figure 5. As evident from Figures 3, 5, 10, the aftershocks of this earthquake split into three clusters with the narrow middle one associated with the largest number of aftershocks (Figure 10).
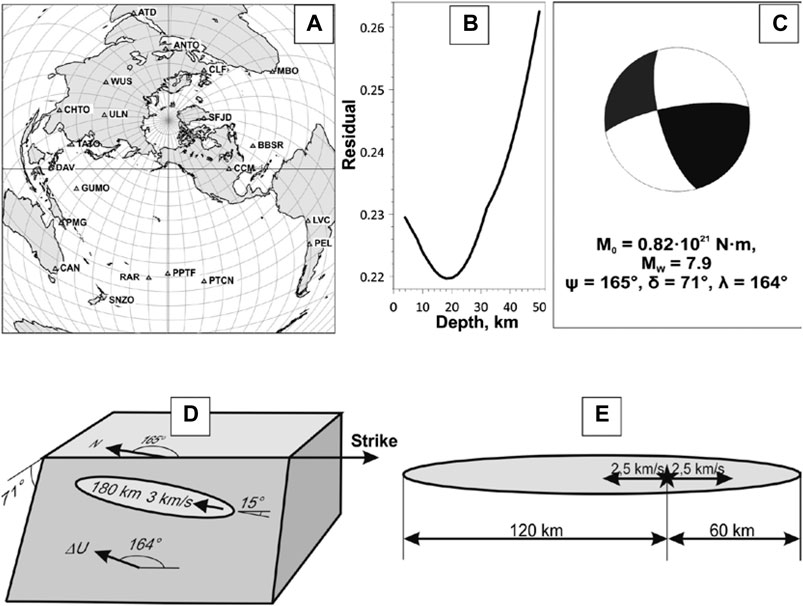
FIGURE 9. Modeling the January 23, 2018, MW7.9 earthquake: (A) stations used to determine parameters of the earthquake in the double couple approximation, (B) source depth residual function, (C) focal mechanism, (D) the earthquake focal model, e) one-dimensional bilateral model of faulting oriented along the centroid velocity. Notes: the same as in Figure 8.
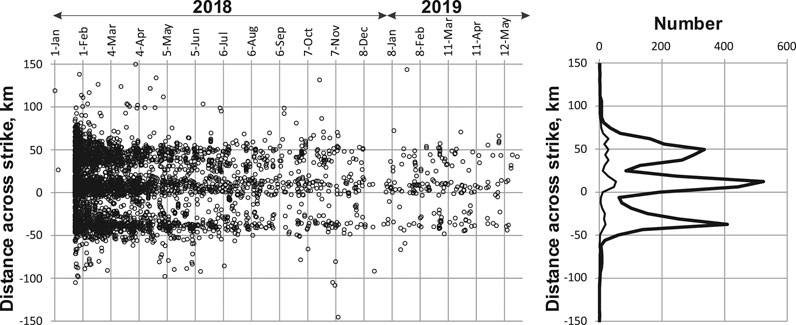
FIGURE 10. Distribution of M ≥ 2.5 earthquakes across strike of the MW7.9, January 23, 2018 main shock in time (left) and in number (right). The sub-meridian cluster dominates both in the first day of aftershocks (thin line) and to the end of May 2019 (heavy line); its width is much smaller than its length along the main shock strike (ψ = 165°).
Figure 11 is analogous to Figures 8, 9. The November 30, 2019, MW7.1 earthquake is modeled as a pure dip slip. In this case, there is no evidence for a confident choice of the fault plane, so that the optimal choice based on nearly the same residuals (which differ by a negligible 3% of their value, Table 2) remains rather uncertain; an option of both nodal planes involved in the normal faulting at a depth of about 70 km (Figure 11B) cannot be dismissed (the apparently bimodal shape of the graph may explain different determinations reported by other agencies).
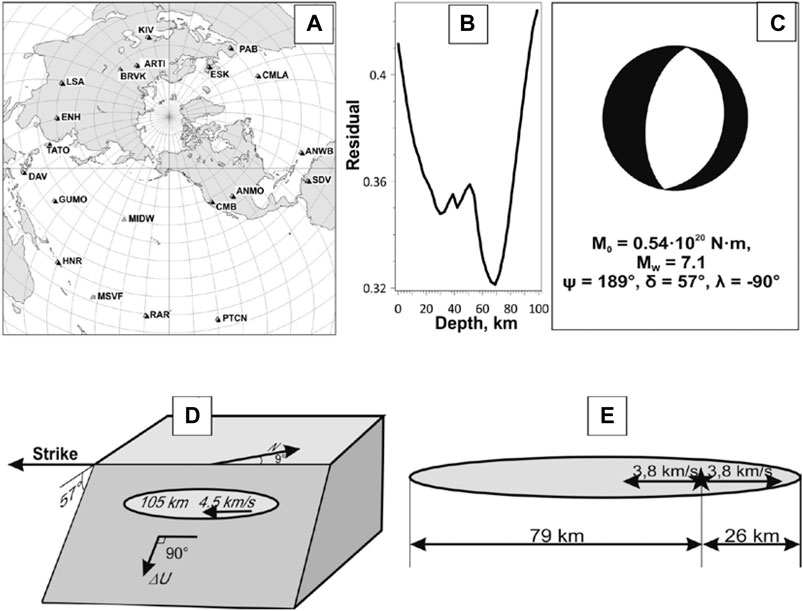
FIGURE 11. Modeling the November 30, 2018, MW7.1 earthquake: (A) stations used to determine parameters of the earthquake in the double couple approximation, (B) source depth residual function, (C) focal mechanism, (D) the earthquake focal model, (E) one-dimensional bilateral model of faulting oriented along the centroid velocity. Notes: the same as in Figure 8.
It is worth mentioning that there are no significant differences in focal mechanisms from the parameters provided by USGS, Global CMT, and ESMC. However, the depths of the three major earthquakes provided by these agencies differ from our determination (e.g., compare 100, 20, and 70 km with 129, 14.7, and 46.7 km by USGS, respectively). A significant difference is the choice of a nodal plane representing the fault plane for the January 23, 2018 event; the USGS determination favor E-W plane, while our analysis of the complex aftershock data (Figures 3, 5, 10) strongly suggests the orthogonal one as the correct representative of the fault plane.
Discussion and Conclusion
The determination of the spatial and temporal distribution of slip over the fault area of large earthquakes is essential for better comprehension of the mechanics of the seismic rupture and its environmental impact (e.g., Yagi and Kikuchi, 2000; Bouchon et al., 2001; Clevede et al., 2012). We use the integral source parameters given by the stress glut rate moments of total degree 2 for constraining the models of the three major earthquakes at 600 km around Anchorage, Southern Alaska. Beyond point source moment tensor and hypocenter determinations, we provide average estimates of the rupture length and width, duration, and velocity, making use of the low degree moments of stress glut rate (Backus, 1977a; Backus, 1977b). To our knowledge, a few earthquakes have been studied from this point of view (Gusev and Pavlov, 1988; Bukchin, 1995; Gomez et al., 1997a; Gomez et al., 1997b; Aoudia et al., 2000; McGuire et al., 2000; McGuire et al., 2001; McGuire et al., 2002; Clévédé et al., 2004).
Our analysis of the source models for the three earthquakes yields similar results to other moment tensor solutions. However, for the 2018 Kodiak earthquake, we infer that the conjugate plane in the final USGS NEIC solutions is the fault plane. This is similar to the findings presented in the comprehensive study by Lay et al. (2018) based on seismic, GPS, and tsunami data. They conclude a multiple fault rupture dominated by right-lateral slip on an SSE trending, Specifically, their “primary faulting with ϕ = 155° and δ = 72°, with slip of up to 15.6 m in the crust and uppermost mantle,” is confirmed and complimented by our robust estimates based on the low-degree moments of the stress glut rate (Table 2; Figure 9).
In general, major earthquakes of Mw ≥ 7 are complex. The geometry, timing, and slip distribution of the complex nonlinear system of the lithospheric blocks and faults (Keilis-Borok, 1990) involved are usually not well resolved. Their rupture may propagate both upward into the crust and downward into the mantle (Liu et al., 2019; Ruppert et al., 2020). As a result, the expected ground shaking could be under- or over-predicted by an order of magnitude (Grapenthin et al., 2018; Mann and Abers 2020), causing unexpected societal impacts and errors in seismic hazard assessment (Wyss et al., 2012; West et al., 2020).
Seismic energy accumulation, release, and redistribution in the lithosphere are not yet well studied. It appears that seismic diversity is a cornerstone of understanding complex dynamics of a system of blocks and faults in advance and after catastrophic events, the main contributors to energy release (Ben-Zion, 2008; Zaliapin et al., 2008). Characterization of the fore- and aftershock sequences of the recent major earthquakes in Southern Alaska confirms the existence of the long-term periods of seismic stability defined by the averages <η> of the USLE control parameter that are interrupted by mid- or even short-term bursts of activity associated with catastrophic events. However, at this time, neither of the two M7.1 events considered in this study showed a change in the level of <η> observed in advance of their origin times; the January 23, 2018, M7.9 earthquake may become an exception, if the level of <η> reached by the end of May 2019 persists. It seems premature to discuss if the variability of <η> can be useful in operational earthquake forecasting (Kossobokov et al., 2015) of seismic catastrophes, due to the yet rather small number of case studies: five cases in Central Italy (Kossobokov and Nekrasova, 2017), nine in New Zealand (Kossobokov and Nekrasova, 2019), and three in Southern Alaska. Nevertheless, the apparent major seismic activity, in particular, the one associated with the M7.9 strike-slip earthquake 280 km SE of Kodiak and the most recent M7.8 Alaska Peninsula thrust faulting, right at the borders of the rupture zone of the 1964 Great Alaska, M9.3 mega-earthquake (Figure 1), deserves special attention, with continued further studies and monitoring of this region.
Data Availability Statement
Datasets related to this article can be found at https://doi.org/10.5066/F7MS3QZH, hosted at U.S. Geological Survey, Earthquake Hazards Program (U.S. Geological Survey, Earthquake Hazards Program 2017), accessed June 1, 2019; http://ds.iris.edu/wilber3/find_event, hosted at Incorporated Research Institutions for Seismology (Institut de Physique du Globe de Paris & Ecole et Observatoire des Sciences de la Terre de Strasbourg, 1982; Scripps Institution of Oceanography, 1986; GEOFON, 1993); https://doi.org/10.31905/XT753V44, hosted at the International Seismological Centre (ISC) Dataset Repository (Nekrasova and Kossobokov, 2019).
Author Contributions
BB and AF contributed the solutions and interpretation of the three major earthquake sources; VK and AN contributed presentation of seismic flow dynamics in advance and after the three major earthquakes.
Funding
This study was carried out as part of the RF state task of Scientific Research Works on “Development of methods of seismic data analysis in order to study the source, environment, seismic hazard” (No. 0143-2019-0007). No other funding received.
Conflict of Interest
The authors declare that the research was conducted in the absence of any commercial or financial relationships that could be construed as a potential conflict of interest.
References
Aoudia, A., Saraó, A., Bukchin, B., and Suhadolc, P. (2000). The 1976 Friuli (NE Italy) thrust faulting earthquake: a reappraisal 23 years later. Geophys. Res. Lett. 27, 573–576. doi:10.1029/1999GL011071
Babich, V. M., Chikachev, B. A., and Yanovskaya, T. B. (1976). Surface waves in a vertically inhomogeneous elastic half-space with weak horizontal inhomogeneity. Izv. Akad. Nauk. SSSR - Fiz. Zemli 4, 24–31.
Backus, G. E. (1977a). Interpreting the seismic glut moments of total degree two or less. Geophys. J. Int. 51, 1–25. doi:10.1111/j.1365-246x.1977.tb04187.x
Backus, G. E. (1977b). Seismic sources with observable glut moments of spatial degree two, Geophys. J. Int. 51, 27–45. doi:10.1111/j.1365-246x.1977.tb04188.x
Bak, P., Christensen, K., Danon, L., and Scanlon, T. (2002). Unified scaling law for earthquakes. Phys. Rev. Lett. 88, 178501–178504. doi:10.1103/physrevlett.88.178501
Ben-Zion, Y. (2008). Collective behavior of earthquakes and faults: continuum-discrete transitions, progressive evolutionary changes, and different dynamic regimes. Rev. Geophys. 46, RG4006. doi:10.1029/2008RG000260
Bird, P. (2003). An updated digital model of plate boundaries. Geochem. Geophys. Geosyst. 4. 1027–1078. doi:10.1029/2001GC000252
Bouchon, M., Bouin, M.-P., Karabulut, H., Toksöz, M. N., Dietrich, M., and Rosakis, A. J. (2001). How fast is rupture during an earthquake? New insights from the 1999 Turkey earthquakes. Geophys. Res. Lett. 28, 2723–2726. doi:10.1029/2001gl013112
Bukchin, B. G. (1995). Determination of stress glut moments of total degree 2 from teleseismic surface wave amplitude spectra. Tectonophysics 248, 185–191. doi:10.1016/0040-1951(94)00271-A
Bukchin, B. G. (2017). Second-moment approximation of the earthquake source and fault plane identification. Izv. Phys. Solid Earth 53, 243–249. doi:10.1134/s1069351317020045
Christensen, D. H., and Beck, S. L. (1994). The rupture process and tectonic implications of the great 1964 Prince William Sound earthquake. Pageoph 142, 29–53. doi:10.1007/BF00875967
Clévédé, E., Bouin, M.-P., Bukchin, B., Mostinskiy, A., and Patau, G. (2004). New constraints on the rupture process of the 1999 August 17 Izmit earthquake deduced from estimates of stress glut rate moments. Geophys. J. Int. 159, 931–942. doi:10.1111/j.1365-246X.2004.02304.x
Clevede, E., Bukchin, B., Favreau, P., Mostinskiy, A., Aoudia, A., and Panza, G. F. (2012). Long-period spectral features of the Sumatra-Andaman 2004 earthquake rupture process. Geophys. J. Int. 191, 1215–1225. 10.1111/j.1365-246X.2012.05482.x
GEOFON (1993). GEOFON seismic network. Deutsches GeoForschungsZentrum GFZ. Other/Seismic Network. doi:10.14470/TR560404
Gómez, J. M., Bukchin, B., Madariaga, R., Rogozhin, E. A., and Bogachkin, B. (1997a). Rupture process of the 19 August 1992 susamyr, Kyrgyzstan, earthquake. J. Seismol. 1, 219–235. doi:10.1023/a:1009780226399
Gómez, J. M., Bukchin, B., Madariaga, R., and Rogozhin, E. A. (1997b). A study of the Barisakho, Georgia, earthquake of 1992 October 23 from broad-band surface and body waves. Geophys. J. Int. 129, 613–623. doi:10.1111/j.1365-246x.1997.tb04497.x
Grapenthin, R., West, M., Tape, C., Gardine, M., and Freymueller, J. (2018). Single‐frequency instantaneous GNSS velocities resolve dynamic ground motion of the 2016 Mw 7.1 iniskin, Alaska, earthquake. Seismol Res. Lett. 89, 1040–1048. doi:10.1785/0220170235
Gusev, A. A., and Pavlov, V. M. (1988). Determination of space-time structure of a deep earthquake source by means of power moments. Tectonophysics 152, 319–334. doi:10.1016/0040-1951(88)90057-1
Gutenberg, R., and Richter, C. F. (1944). Frequency of earthquakes in California. Bull. Seism. Soc. Am. 34, 185–188.
Institut de Physique du Globe de Paris & Ecole et Observatoire des Sciences de la Terre de Strasbourg (1982). GEOSCOPE, French global network of broad band seismic stations. Institut de Physique du Globe de Paris. doi:10.18715/GEOSCOPE
Kanamori, H. (1970). The Alaska earthquake of 1964: radiation of long-period surface waves and source mechanism. J. Geophys. Res. 75, 5029–5040. doi:10.1029/jb075i026p05029
Keilis-Borok, V. I. (1990). The lithosphere of the Earth as a nonlinear system with implications for earthquake prediction. Rev. Geophys. 28, 19–34. doi:10.1029/rg028i001p00019
Kossobokov, V. (2020). “Unified scaling law for earthquakes that generalizes the fundamental gutenberg-richter relationship,” in Encyclopedia of solid Earth geophysics. Encyclopedia of Earth sciences series. Editor H. Gupta, Springer.
Kossobokov, V. G., and Mazhkenov, S. A. (1994). “On similarity in the spatial distribution of seismicity,” in Computational Seismology and geodynamics, Editors D. K. Chowdhury, Washington DC: Am. Geophys. Union, 6–15.
Kossobokov, V. G., and Nekrasova, A. K. (2017). Characterizing aftershock sequences of the recent strong earthquakes in central Italy. Pure Appl. Geophys. 174, 3713–3723. doi:10.1007/s00024-017-1624-9
Kossobokov, V. G., and Nekrasova, A. K. (2019). Aftershock sequences of the recent major earthquakes in New Zealand. Pure Appl. Geophys. 176, 1–23. doi:10.1007/s00024-018-2071-y
Kossobokov, V. G., Peresan, A., and Panza, G. F. (2015). On operational earthquake forecast and prediction problems. Seismol Res. Lett. 86, 287–290. doi:10.1785/0220140202
Krabbenhoeft, A., von Huene, R., Miller, J. J., Lange, D., and Vera, F. (2018). Strike-slip 23 January 2018 MW 7.9 Gulf of Alaska rare intraplate earthquake: complex rupture of a fracture zone system. Nat. Sci. Rep. 8, 13706. doi:10.1038/s41598-018-32071-4
Lander, A. (1989a). “Frequency-time analysis,” in Seismic surface waves in laterally inhomogeneous Earth, Editor V. Keilis-Borok, Dordrecht, Netherlands: Kluwer Academic Publishers, 153–163.
Lander, A. (1989b). “Linear-polarization analysis,” in Seismic surface waves in laterally inhomogeneous Earth, Editor V. Keilis-Borok, Dordrecht, Netherlands: Kluwer Academic Publishers, 164–178.
Lasserre, C., Bukchin, B., Bernard, P., Tapponnier, P., Gaudemer, Y., Mostinsky, A., et al. (2001). Source parameters and tectonic origin of the 1996 June 1 tianzhu (Mw=5.2) and 1995 July 21 yongden (Mw=5.6) earthquakes near the haiyuan fault (gansu, China). Geophys. J. Int. 144, 206–220. doi:10.1046/j.1365-246x.2001.00313.x.
Lay, T., Ye, L., Bai, Y., Cheung, K. F., and Kanamori, H. (2018). The 2018 M W 7.9 gulf of Alaska earthquake: multiple Fault rupture in the Pacific plate. Geophys. Res. Lett. 45, 9542–9551. doi:10.1029/2018GL079813
Levshin, A. L., Yanovskaya, T. B., Lander, A. V., Bukchin, B. G., Barmin, M. P., Ratnikova, L. I., et al. (1989). “Recording, identification and measurement of surface wave parameters,” in Seismic surface waves in laterally inhomogeneous Earth, Editor V. Keilis-Borok, Dordrecht, Netherlands: Kluwer Academic Publishers, 131–182.
Li, S., Freymueller, J., and McCaffrey, R. (2016). Slow slip events and time‐dependent variations in locking beneath lower cook inlet of the Alaska‐Aleutian subduction zone. J. Geophys. Res. Solid Earth 121. 1060–1079. doi:10.1002/2015jb012491
Liu, C., Lay, T., Xie, Z., and Xiong, X. (2019). Intraslab deformation in the 30 november 2018 Anchorage, Alaska, M W 7.1 earthquake. Geophys. Res. Lett. 46, 2449–2457. doi:10.1029/2019GL082041
Mann, M. E., and Abers, G. A. (2020). First‐order mantle subduction‐zone structure effects on ground motion: the 2016 Mw 7.1 iniskin and 2018 Mw 7.1 Anchorage earthquakes. Seismol Res. Lett. 91, 85–93. doi:10.1785/0220190197
McGuire, J. J., Zhao, L., and Jordan, T. H. (2002). Predominance of unilateral rupture for a global catalog of large earthquakes. Bull. Seismol. Soc. Am. 92, 3309–3317. doi:10.1785/0120010293
McGuire, J. J., Zhao, L., and Jordan, T. H. (2000). Rupture dimensions of the 1998 Antarctic Earthquake from low-frequency waves, Geophys. Res. Lett. 27, 2305–2308. doi:10.1029/1999gl011186
McGuire, J. J., Zhao, L., and Jordan, T. H. (2001). Teleseismic inversion for the second-degree moments of earthquake space-time distributions. Geophys. J. Int. 145, 661–678. doi:10.1046/j.1365-246x.2001.01414.x
Nekrasova, A., and Kossobokov, V. (2002). Generalizing the Gutenberg-Richter scaling law. Fall Meeting Suppl., Am. Geophys. UnionAbstract NG62B-0958.
Nekrasova, A. K., and Kossobokov, V. G. (2005). Temporal variations in the parameters of the unified scaling law for earthquakes in the eastern part of honshu island (Japan). Dokl. Earth Sci. 405, 1352–1356.
Nekrasova, A. K., and Kossobokov, V. G. (2019). Unified scaling law for earthquakes: global map of parameters, ISC’s Seismological Dataset Repository. doi:10.31905/XT753V44
Ohta, Y., Freymueller, J., Hreinsdottir, S., and Suito, H. (2006). A large slow slip event and the depth of the seismogenic zone in the south central Alaska subduction zone. Earth Planet Sci. Lett. 247, 108–116. doi:10.1016/j.epsl.2006.05.013
Press, F., and Jackson, D. (1965). Alaskan Earthquake, 27 March 1964: vertical extent of faulting and elastic strain energy release. Science 147, 867–868. doi:10.1126/science.147.3660.867
Ruppert, N. A., Nayak, A., Thurber, C., and Richards, C. (2020). Aftershock analysis of the 2018 Mw 7.1 Anchorage, Alaska, earthquake: relocations and regional moment tensors. Seism. Res. Lett. 91, 114–125. doi:10.1785/0220190199
Ruppert, N. A., Rollins, C., Zhang, A., Meng, L., Holtkamp, S. G., West, M. E., et al. (2018). Complex faulting and triggered rupture during the 2018 MW7.9 offshore Kodiak, Alaska, earthquake. Geophys. Res. Lett. 45, 7533–7541. doi:10.1029/2018GL078931
Scripps Institution of Oceanography (1986). Global seismograph network - IRIS/IDA. International federation of digital seismograph networks. Available at: https://doi.org/10.7914/SN/II.
U.S. Geological Survey, Earthquake hazards program (2017). Advanced national seismic system (ANSS) comprehensive catalog of earthquake events and products: various, Available at: https://doi.org/10.5066/F7MS3QZH.
Wei, M., McGuire, J. J., and Richardson, E. (2012). A slow slip event in the south central Alaska subduction zone and related seismicity anomaly. Geophys. Res. Lett. 39, L15309. doi:10.1029/2012GL052351
West, M. E., Bender, A., Gardine, M., Gardine, L., Gately, K., Haeussler, P., et al. (2020). The 30 november 2018 Mw 7.1 anchorage earthquake. Seism Res. Lett. 91, 66–84. doi:10.1785/0220190176
Woodhouse, J. H. (1974). Surface waves in the laterally varying structure. Geophys. J. R. Astr. Soc. 90, 713–728. 10.1111/j.1365-246X.1974.tb04098.x
Wyss, M., Nekrasova, A., and Kossobokov, V. (2012). Errors in expected human losses due to incorrect seismic hazard estimates. Nat. Hazards 62, 927–935. doi:10.1007/s11069-012-0125-5
Wyss, M., and Brune, J. (1967). The Alaska earthquake of 27 March 1964: a complex multiple rupture. Bull. Seism. Soc. Am. 57. 1017–1023.
Yagi, Y., and Kikuchi, M. (2000). Source rupture process of the Kocaeli, Turkey, earthquake of August 17, 1999, obtained by joint inversion of near-field data and teleseismic data. Geophys. Res. Lett. 27, 1969–1972. doi:10.1029/1999gl011208
Keywords: earthquake sequences, earthquake source, Pacific and North America plate boundary, unified scaling law for earthquakes, control parameter analysis
Citation: Bukchin BG, Fomochkina AS, Kossobokov VG and Nekrasova AK (2020) Characterizing the Foreshock, Main Shock, and Aftershock Sequences of the Recent Major Earthquakes in Southern Alaska, 2016–2018. Front. Earth Sci. 8:584659. doi: 10.3389/feart.2020.584659
Received: 17 July 2020; Accepted: 07 October 2020;
Published: 21 December 2020.
Edited by:
Giovanni Martinelli, National Institute of Geophysics and Volcanology, ItalyReviewed by:
Nguyen Huu Tuyen, Vietnam Academy of Science and Technology, VietnamBoyko Ranguelov, University of Mining and Geology “Saint Ivan Rilski,” Bulgaria
Copyright © 2020 Kossobokov, Bukchin, Fomochkina and Nekrasova. This is an open-access article distributed under the terms of the Creative Commons Attribution License (CC BY). The use, distribution or reproduction in other forums is permitted, provided the original author(s) and the copyright owner(s) are credited and that the original publication in this journal is cited, in accordance with accepted academic practice. No use, distribution or reproduction is permitted which does not comply with these terms.
*Correspondence: V. G. Kossobokov, dm9sb2R5YUBtaXRwLnJ1