 Midori Koike1,2
 Haruhisa Nakamichi2*
- 1Division of Earth and Planetary Sciences, Graduate School of Science, Kyoto University, Kyoto, Japan
- 2Sakurajima Volcano Research Center, Disaster Prevention Research Institute, Kyoto University, Kagoshima, Japan
Magma intrusion usually causes seismicity and deformation in the surrounding rock and often leads to eruptions. A swarm of volcano-tectonic (VT) earthquakes associated with rapid dike intrusion in hours occurred beneath Sakurajima volcano on August 15, 2015. We determined the hypocenters and focal mechanisms of the VT earthquake swarm. The distributions of pressure (P)- and tension (T)-axes of the azimuths of the mechanisms are also obtained. The results indicate spatiotemporal changes of the distributions of the hypocenters and P- and T-axes. The hypocenters are distributed at depths of 0.3–1 km and 7:00–10:30 JST, and are located at depths of 0.3–3 km and 10:30–12:00 during which the seismic activity is the largest. At 12:00–24:00, the hypocenters are distributed in shallow and deep clusters at depths of 0.2–1 km and 1.5–3.5 km, respectively. The dike induced rapid ground deformation and is located between the shallow and deep clusters. The strike and opening directions of the dike are parallel to the NE–SW and NW–SE directions, respectively, corresponding to the regional maximum and minimum compression stress. The T-axes of the shallow cluster are distributed parallel to the opening direction of the dike. The P-axes of the deep cluster exhibit a pattern corresponding to the NE–SW direction and the T-axes are distributed in the NW–SE direction. In contrast, a 90° rotated pattern of strike-slip faulting is also observed at the deep cluster at 12:00–24:00, where the P-axes are distributed in the NW–SE direction and the T-axes are distributed in the NE–SW direction. This reflects the change in the stress field due to the dike inflation during the earthquake generation, and indicates that the alteration of stress in the vicinity of the dike due to the dike inflation and VT earthquakes are induced by the differential stress exceeding the brittle fracture strength of the rock. Future seismic and deformation observations in volcanoes will verify whether the spatiotemporal changes of the hypocenters and focal mechanism shown by this study are unique features of rapid dike intrusion.
Introduction
Magma rises or laterally moves and is accumulated in the crust or within a volcano edifice. This causes stress in the surrounding rock, leading to its deformation. Ground deformation occurs when the deformation extends to the surface. When the stress exceeds the fracture strength of the rock, or magma moves in cracks or conduits, fracturing or oscillation occur and generate an earthquake, that is, a volcanic earthquake. The frequency and duration of seismic ground motions of volcanic earthquakes vary widely; predominantly, volcano-tectonic (VT) earthquakes, low-frequency earthquakes, and volcanic tremors occur (e.g., McNutt, 2005; Nishimura and Iguchi, 2011; Chouet and Matoza, 2013). VT earthquakes are ordinary earthquakes that occur in brittle rock within a volcanic edifice or in the crust beneath it. They are characterized by sharp onsets of P- and S-waves, reflected by broad spectra extending up to 15 Hz (e.g., McNutt, 2005; Nishimura and Iguchi, 2011; Chouet and Matoza, 2013). They are called VT earthquakes because of their close similarity to tectonic earthquakes, although the stresses that induce them are derived from volcanic processes rather than from large-scale tectonic movements (e.g., McNutt, 2005; Nishimura and Iguchi, 2011; Chouet and Matoza, 2013). The VT earthquakes, which sometimes become seismic swarms, have been observed in many volcanic regions. Therefore, in many cases, seismic analyses have been applied to determine the hypocenters and focal mechanisms (e.g., Prejean et al., 2002). Compared with low-frequency earthquakes and volcanic tremors, VT earthquakes allow more precise hypocenter determination, and it is easier to determine their source mechanisms. Moreover, tracking the spatiotemporal changes in hypocenters and source mechanisms provides more information that could facilitate the estimation of the behavior of magma intrusion.
Magma transport in the crust is closely related to the magnitude and orientation of crustal stresses. Differential stresses in the crust are due to large-scale tectonic movements. Dikes represent the most natural means for magma transport at depth in the crust. The regional stress field around a volcano affects the position and orientation of a dike (Nakamura, 1977; Nakamura et al., 1977). Dikes preferentially intrude in the plane perpendicular to the direction of the minimum compressive stress. For dikes to propagate and inflate, magma must exert sufficient stress at the dike tip to overcome the fracture strength of the rock. It is well known that dike intrusions are frequently associated with VT earthquake swarms (e.g., Einarsson and Brandsdóttir, 1980; Savege and Cockerham, 1984). They occur ahead of the dike tip (Rubin and Pollard, 1988; Rubin, 1992; Ukawa and Tsukahara, 1996; Roman and Cashman, 2006; Ebinger et al., 2008; Woods et al., 2019; Ágústsdóttir et al., 2019), and in regions adjacent to dike walls (e.g., Bonafede and Danesi, 1997; Roman et al., 2004; Roman, 2005; Roman and Cashman, 2006; Ebinger et al., 2008; Ágústsdóttir et al., 2019). Following the development of new techniques for seismic data analysis in the recent two decades, hypocenters can be more accurately determined and the focal mechanisms of more events can be estimated, yielding more detailed discussions of dike intrusion processes and the stress field change corresponding to the spatiotemporal changes of the hypocenters and focal mechanisms of VT events (e.g., Hayashi and Morita, 2003; Ebinger et al., 2008; Grandin et al., 2011; Passarelli et al., 2015; Woods et al., 2019).
The studies described above were targeted at slow dike intrusions, lasting from several weeks to several months. For example, the 1998 earthquakes swarm off the east coast of Izu Peninsula, Japan was induced by a dike intruding for two weeks (Hayashi and Morita, 2003). Dike intrusions sporadically occurred and lasted several weeks from 2005 to 2010 in the Manda Harare-Dabbahu Rift, Afar, Ethiopia (Ebinger et al., 2010; Grandin et al., 2011). Episodes of dike intrusions lasting a few weeks occurred during the Bárðarbunga-Holuhraun rifting event from August 2014 to January 2015 (Woods et al., 2019). The dike intrusion at Miyakejima-Kozushima-Niijima, Japan began on June 26, 2000 and continued until September 2000 (Japan Meteorological Agency, 2000; Ukawa et al., 2000; Sakai et al., 2001). On the other hand, dike intrusions often occurred in short time period, hours to days, in basaltic volcanoes such as Kilauea’s East Rift Zone in January 1983 (Okamura et al., 1988) and September 1999 (Cervelli et al., 2002), and the November 1986 eruption of Izu-Oshima (Linde et al., 2016).
Magma intrusion rate is a key parameter to understand unrest and its possible outcome, from non-eruptive unrest to phreatic explosions or explosive magmatic eruptions (Moran et al., 2011). For example, rapid magma intrusion often leads to explosive eruptions (Moran et al., 2011). Explosive eruptions are dominant at andesite volcanoes and crucial for risk mitigation, since many people live in the neighborhoods. Rapid dike intrusions cause pronounced earthquake swarm and deformation in short time periods. In these cases, it is important to obtain hypocenters and focal mechanisms to elucidate any induced spatiotemporal stress change.
On August 15, 2015, a VT earthquake swarm occurred beneath Sakurajima volcano, Japan; at the same time, rapid and significant ground deformation was observed (Hotta et al., 2016a). However, no distinct explosive eruption occurred within weeks after the VT earthquake swarm (Iguchi et al., 2019). Analysis of the ground deformation associated with the VT earthquake swarm revealed the presence of an inflating dike with the NE–SW strike direction and the NW–SE opening direction at a depth of 1–2 km below the sea level beneath the summit region of Sakurajima, suggesting shallow magma intrusion. The dike is obtained based on GNSS displacement data, tilts and strains (Hotta et al., 2016a), and 3-D deformation data from interferometric synthetic aperture radar (InSAR) images (Morishita et al., 2016). However, the intrusion process estimated from the ground deformation lacks a time resolution. Conversely, earthquakes reflect the stress release of rock, that is, the occurrence of earthquakes is sensitive to the temporal change in stress. The advantage of using earthquakes over deformation is that the time resolution is higher. Therefore, the analysis of the VT earthquake swarm allows tracing high-resolution spatiotemporal changes in the stress exerted by dike emplacement on the surrounding rock.
In the present study, we determine the hypocenters and focal mechanisms of the VT earthquake swarm that occurred on August 15, 2015 beneath Sakurajima volcano. We clarify the spatiotemporal changes of the hypocenter and focal mechanisms of the VT earthquake swarm induced by rapid dike intrusion (one day). We then reveal the inflation process of the dike that penetrated the shallow depth beneath Sakurajima volcano. Finally, we discuss the generation of the VT earthquake swarm induced by dike propagation from the viewpoint of the brittle fracture strength of the crustal rock, to evaluate any difference between faster and slowing emplacing dikes.
Geological, Geophysical Settings, and Volcanic Activity of Sakurajima
Sakurajima (Cherry Island in English) is an andesitic composite volcano located on the southern edge of the Aira caldera, southern Kyuhsu, Japan (Figure 1). In Kyushu, active volcanism results from the subduction of the Philippine Sea plate (PSP) beneath the Eurasian plate (EUP) and appears to be linked to back-arc extension. The edifice of Sakurajima started to develop 26,000 years ago and is now composed of two overlapping stratovolcanoes: the older Kita-dake and younger Minami-dake (Fukuyama, 1978; Kobayashi et al., 2013; Yasui et al., 2013). Eruptive activity over the last 4500 years has mainly occurred at Minami-dake, which has produced Vulcanian explosions and continuous venting of ash clouds almost daily since 1955, making it Japan’s most active volcano. Within the last six centuries, the volcano has experienced three periods of repeated Plinian eruptions of VEI 4–5 (Volcanic Explosivity Index) accompanied with voluminous lava effusion, that is, the Bunmei (1471–1476 AD), Anei (1779–1782 AD), and Taisho (1914–1915 AD) eruptions. The latter was the largest eruption in Japan in the 20th century. Initially an island, the Sakurajima volcano is now connected to the Osumi Peninsula via a narrow isthmus formed by a lava flow that was generated during the Taisho eruption. Before the beginning of the Taisho eruption, a volcanic earthquake swarm, including many felt earthquakes, was observed at the Kagoshima Weather Observatory (Figure 1) using a Gray–Milne seismometer (Omori, 1920). It began three days prior to the onset of the Taisho eruption on January 12, 1914 (Omori, 1920; Iguchi et al., 2019). Eight hours after the onset, a large earthquake with an M = 7.0 (Sakurajima earthquake) occurred in the southwestern part of the Sakurajima volcano (Omori, 1920). The Taisho eruption was accompanied by ∼1 m subsidence of the caldera floor (Omori, 1916; Mogi, 1958; Yokoyama, 2013). Since then, the caldera has been inflating gradually. Afterward, subsidence occurred during the Showa eruption (lava flow, 1946 AD). Two main pressure sources are responsible for the recent geodetic deformation: the main source is located beneath the Aira caldera ∼10 km below sea level (Hickey et al., 2016) and a supplementary source is located at a depth of 4–6 km beneath the summit (Hotta et al., 2016b). The current inflation of the Aira caldera is the result of magma accumulation at rates faster than current eruption rates, resulting in an uplift that approaches the pre-1914 level, increasing the risk of a new strong explosive event (Hickey et al., 2016). On August 15, 2015, rapid expansive ground deformation occurred in Sakurajima associated with an intense VT earthquake swarm (Hotta et al., 2016a). The latest earthquake swarm in Sakurajima occurred on May 29, 1968, including several felt earthquakes, with an M = 4 (Yoshikawa and Nishi, 1969). Nishi (1978) reported that the temporal changes in the frequency of Vulcanian explosions and focal mechanisms of VT earthquakes are correlated. Strike-slip-type mechanisms predominate during calm periods when the frequency is low, while normal fault-type mechanisms predominate in the beginning of the active eruptive period when the number of the events begin to increase toward the maximum. Subsequently, strike-slip-type mechanisms become dominant again with the decrease in frequency. The changes in the focal mechanisms prior to eruptive activity suggest that the crustal stress field varies according to magma supply.
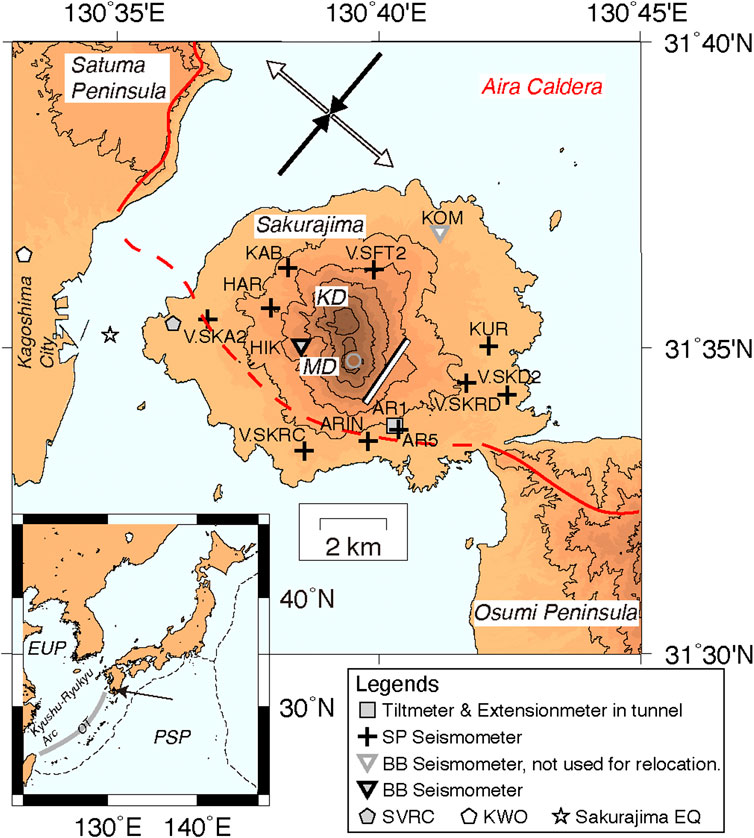
FIGURE 1. Map showing the locations of Sakurajima volcano and seismic stations. Inset shows the location of Sakurajima relative to Japan. The abbreviation KD and MD indicate the Kita-dake (old clatter) and Minami-dake (currently the most active crater). Contours are provided every 200 m. The plus signs and inverted triangles show the locations of the short-period and broadband seismic stations, respectively, used for the analyses of the hypocenters and focal mechanisms, except for station KOM, which was used only for short-term-/long-term-average seismic detection. The gray square indicates the station AR1, which has short-period seismometer and tiltmeter and extension meters in an underground tunnel, and it was also used for the analyses. Open and solid black arrows indicate the directions of the regional maximum extension and compression, respectively, of the stress field at a depth of 10 km (Terakawa and Matsu’ura, 2010). The rectangle shows the location of the dike source obtained from the ground deformation on August 15, 2015 (Hotta et al., 2016a). The thick black line of the rectangle represents the top of the dike. The gray and open pentagons show the locations of the Sakurajima Volcano Research Center (SVRC) and the Kagoshima Weather Observatory (KWO) at the time of the Taisho 1914 eruption. The open star shows the epicenter of the Sakurajima M = 7 earthquake (Omori, 1920).
The Kyushyu–Ryukyu Arc is a NE–SW-trending island arc that connects southwestern Japan with Taiwan (Figure 1). An active back-arc opening of the Okinawa Trough (OT) is located along the arc and affects the crustal stress field in the southern Kyushu and Ryukyu region (Figure 1). Based on geodetic and seismic analyses, NW–SE extension and NE–SW compression dominate in southern Kyushu (Kubo and Fukuyama, 2003; Watanabe and Tabei, 2004; Savage et al., 2016). Terakawa and Matsu’ura (2010) estimated the three-dimensional (3D) tectonic stress field in Japan from the centroid moment tensor solutions of seismic events with magnitudes in the 3.5–5.0 range. The 3D tectonic stress field shows a strike-slip-type focal mechanism with a NE–SW pressure (P)-axis and NW–SE tension (T)-axis at crustal depth (10 km) in southern Kyusyu (Figure 1). The VT earthquakes in the southwestern part of Sakurajima have normal fault mechanisms with NW–SE-oriented T-axes (Hidayati et al., 2007), which are strongly affected by the tectonic stress in southern Kyushu. The ground deformation on August 15, 2015, was modeled with a nearly vertical dike with a NE–SW strike and NW–SE opening (Hotta et al., 2016a; Morishita et al., 2016). The dike orientation and opening are also strongly affected by the regional tectonic stress.
Data
Figure 1 shows the locations of Sakurajima volcano and seismic stations used in the present study. Each seismic station is equipped with a three-component short-period seismograph (sensitivity of 200 V/m/s) with a natural period of 1 s or a broadband seismograph (sensitivity of 1500 V/m/s). Two sets of water tube tiltmeters and extension meters (one directed toward Minami-dake crater and the other directed perpendicular to the crater) and a short-period seismograph are located in an underground tunnel, station AR1. The underground tunnel has a length of 283 m and is used to monitor the volcanic activity of Sakurajima. The outputs of the seismographs are digitized at 100 or 200 Hz by a 24-bit analog-to-digital converter and the data are transmitted to the Sakurajima Volcano Research Center using a wired virtual private network or wireless local area network and stored as continuous seismic waveform data.
Figure 2 shows the seismic records of a vertical component of the station AR1 during the swarm activity of August 15, 2015. The hourly occurrences of earthquakes with velocity amplitudes ≥10 μm/s at the station AR1 are shown in Figure 3. The VT earthquake swarm began at 7:05 Japan Standard Time (JST) and the occurrence frequency increased between 8:00 and 10:00 JST. A felt earthquake with an M = 2 occurred in Sakurajima at 10:47 JST. Subsequently, the occurrence frequency per hour decreased after the peak at 11:00–12:00 JST and another felt earthquake with an M = 2 occurred at 14:46 JST. In total, 887 VT earthquakes were observed on August 15, 2015 (Hotta et al., 2016a). We used the records of the tiltmeters at the AR1 station for the comparison of the results.
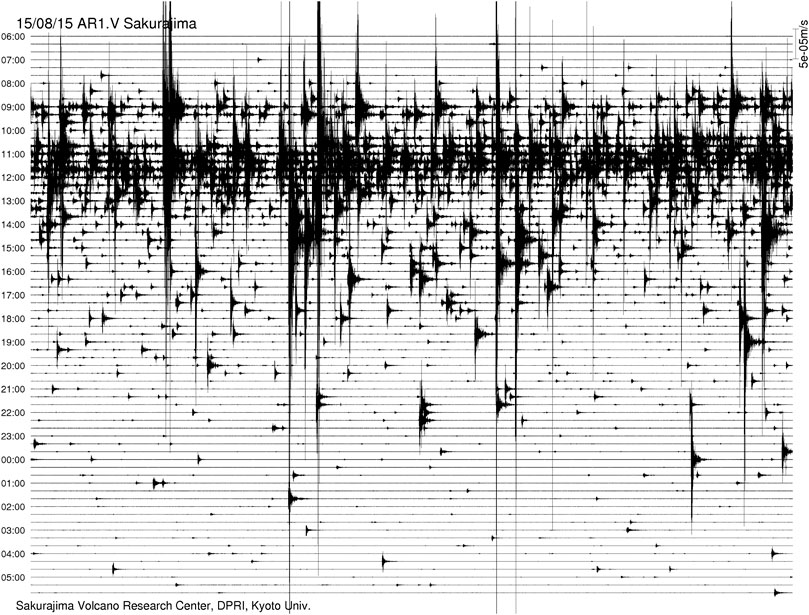
FIGURE 2. Continuous seismogram of the vertical component of a short-period seismometer at station AR1 recorded from 6 AM on August 15 to 6 AM on August 16, 2015 (Japan Standard Time, JST).
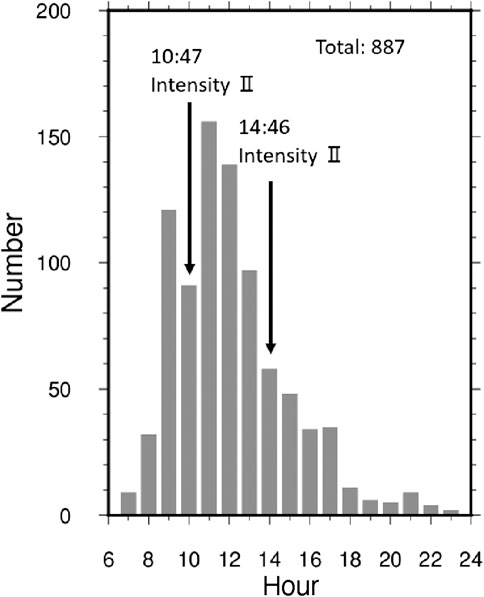
FIGURE 3. Hourly volcano-tectonic earthquake occurrences from 6:00 to 23:59 JST on August 15, 2015.
Methods
Hypocenter Determination
We selected VT earthquakes to determine their hypocenters using the amplitude ratio of short-term average (STA) and long-term average (LTA) from continuous waveform records. The time window lengths for the calculations of the STA and LTA were 0.3 s and 60 s, respectively. The thresholds for the earthquake detections were STA/LTA ≧ 5 at the ARIN, HIK, KOM, HAR, KUR, KAB, V SKA2, V.SFT2, V.SKRC, and V.SKRD stations. The arival times of the P- and S-waves of the selected earthquakes were visually determined. The hypocenters were determined using the P- and S-wave arrival times recorded at more than eight and six stations, respectively. The seismic stations, except for station KOM, at which both the P- and S-wave arrival times were ≥200 were used for location procedures. Figure 1 shows the locations of the selected seismic stations. The hypocenters were determined based on the method of Hirata and Matsu’ura (1987) and based on the one-dimensional P-wave velocity structure, as shown in Supplementary Table S1. The velocity structure was constructed by referring to the 2D P-wave velocity structure across Sakurajima volcano, which was obtained from the seismic refraction by artificial seismic sources (Miyamachi et al., 2013). The derived hypocenter locations were then treated as the initial hypocenters during further analysis, as discussed in the following section.
Hypocenter Relocation With the Double-Difference Method
We used the double-difference (DD) method (Waldhauser and Ellsworth, 2000) to obtain accurate hypocenter locations from initial hypocenters. The DD method software package, which is available to the public, consists of two programs, ph2dt and hypoDD (Waldhauser, 2001). The ph2dt is a preprocessing program that can be used to create DD data from the arrival times of the P-and S-waves recorded during seismic events. During ph2dt processing, several parameters, such as weights of readings used for hypocenter calculation and the maximum distance between paired seismic events and the stations, are set to create DD data. The ph2dt parameters used in the present study are shown in Supplementary Table S2. hypoDD can be used to calculate hypocenters from the DD data prepared using ph2dt. In hypoDD, the user sets the maximum distance between a cluster of hypocenters and stations. The minimum number of arrival catalog time difference data and the number of time difference data based on waveform cross-correlation in event pairs are also set in hypoDD. The hypoDD parameters used in the present study are shown in Supplementary Tables S3,S4. Because earthquakes with close hypocenters have similar source mechanisms and seismic wave propagation paths, the observed waveforms are likely similar. Accurate DD data can be obtained by calculating the travel time difference based on the cross-correlation of earthquake pairs with similar waveforms. We used the cross-correlation method of Deichmann and Garcia-Fernandez (1992) to obtain the travel time differences from seismic pairs using 0.64-s time windows including the recorded arrival time. A bandpass filter of 2–8 Hz was applied to the seismic waveform before the cross-correlation analysis. Only seismic pairs with cross-correlation coefficients greater than or equal to 0.8 were used as DD data.
Estimation of Focal Mechanisms
To improve the reliability of focal mechanism solutions, we estimated the focal mechanisms using the amplitude ratios of P- and S-waves as well as the P-wave polarities according to the method of Hardebeck and Shearer (2003). We visually determined the P-wave polarity and P- and S-wave amplitudes of the earthquakes relocated using the DD method, and estimated their focal mechanisms using the HASH program (Hardebeck and Shearer, 2002; Hardebeck and Shearer, 2003). For the earthquakes used for the estimation of focal mechanisms, the velocity waveforms were integrated into displacement waveforms, which were processed with a bandpass filter of 1–15 Hz. The time window length is half the time difference between the initial arrival times of the P- and S-waves. We measured the amplitudes of the P-waves using the peak-to-peak values of the amplitudes of the vertical component in the time window from the starting point of the time window as the P-wave initial arrival time. We measured the amplitudes of the S-waves using the maximum of the peak-to-peak values of the three components in the time window from the starting point of the time window as S-wave initial arrival time to 3 s. In the HASH program, we estimated the focal mechanisms of the earthquakes if the initial P-wave polarities were obtained at eight or more stations. The focal mechanisms were evaluated by sorting them into six quality categories from A to F based on the misfit of the polarity, as shown in Supplementary Table S5. Only focal mechanisms with A, B, or C qualities were considered for further discussion.
Results
Cross-Correlation Analysis of VT Earthquake Waveforms
We calculated the cross-correlation coefficients of the waveforms of the VT earthquakes that occurred on August 15, 2015, based on the total number of events for which P-wave arrival times were measured at station HIK. The 2–8 Hz bandpass-filtered waveforms were used to calculate the cross-correlation coefficients in a time window of 4 s including the initial P-wave motion. Figure 4A shows the occurrence times of the earthquakes with correlation coefficients ≥0.7. The record of the water tube tiltmeter at station AR1 directed toward Miami-dake is shown in Figure 4B for comparison. The tilt change began at ∼8:00 JST and its rate increased before 9:00 JST. The tilt change rate decreased gradually from 9:00–10:30 JST and then began to increase rapidly. The increase in the tilt change rate continued until 12:00 JST. Subsequently, the tilt change rate decreased gradually. Event clusters with correlation coefficients ≥0.7 can be observed in the following time periods: 7:00–9:00, 9:00–10:30, 10:30–12:00, and 12:00–24:00 JST (Figure 4A). Event clusters are concentrated in the 10:30–12:00 JST time period. Moreover, the time boundaries corresponding to the clusters correspond with the time at which the tilt change is inflected. Therefore, the temporal change in the hypocenters of the VT swarm can be divided into four time periods: A: 7:00–9:00, B: 9:00–10:30, C: 10:30–12:00, and D: 12:00–24:00.
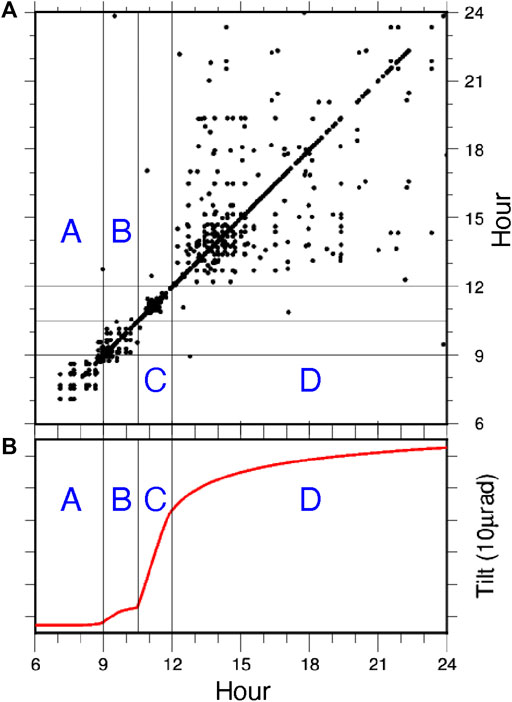
FIGURE 4. (A) Occurrence times of the earthquakes with cross-correlation coefficients of ≥0.7 (black circle) and (B) tilt change at the station AR1 (red line). The tiltmeter is directed toward the Minami-dake (MD) crater. The lines indicate 9:00, 10:30, and 12:00 JST on August 15, 2015. The letters A, B, C, and D show time periods as defined in this study.
Evaluation of Double-Difference Relocation
By using STA/LTA, as described in DATA 257 events are extracted from continuous seismograms for the determination of the hypocenters. We carefully measured the arrival times of P- and S-waves. The reading accuracies of the arrival times of P- and S-waves are higher than 0.05 s (Supplementary Figure S1). Subsequently, the hypocenters of 242 events are determined with P arrival times of eight or more and S arrival times of six or more. Twenty-two of the events are air quakes whose hypocenters are located higher than any stations in Sakurajima. We excluded such air quakes and relocated the hypocenters using the DD method. In total, out of the numbers of DD data pairs used for the hypocenter relocation, the numbers of DD catalog data pairs derived from reading arrival times are 46,696 and 39,888 for P- and S-waves, respectively. Conversely, the numbers of DD data pairs derived from cross-correlation are 12,484 and 12,274 for P- and S-waves, respectively. The final root-mean-square residuals of the DD data after 25 iterations are 58% and 26% of the initial residuals for the recorded and cross-correlated data, respectively. In total, 204 hypocenters were relocated using the DD method. Figure 5 shows the hourly frequencies of the relocated hypocenters. The hourly frequency of the relocated hypocenters is >10 from 9:00 to 14:00 JST, facilitating the discussion of the temporal change of the hypocenter distribution for the four time periods from A to D.
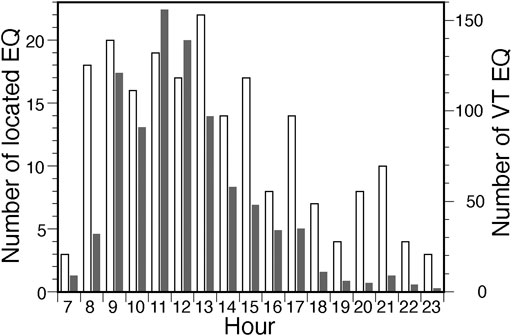
FIGURE 5. Histogram of the number of VT earthquakes (gray bars, right axis; Hotta et al., 2016a) and number of the relocated earthquakes (open bars, left axis).
To assess the uncertainty of the relative hypocenter locations determined using the DD method, we applied the bootstrap resampling method (Shearer, 1997;Waldhauser and Ellsworth, 2000) to all relocated events. During bootstrap resampling, a sample with zero-mean normally distributed values is selected using the mean reading error for each station (Supplementary Figure S1) and then added to the recorded arrival times. The hypocenters are then determined by preparing DD data by randomly re-extracting the arrival times from the selected samples. This process was repeated 500 times. Figure 6 shows the hypocenters relocated using the bootstrap resampling method and the ellipse of the 95% confidence interval (CI) for the three earthquakes. The cumulative frequency of the major axis radii of the 95% CI ellipses differs with respect to the magnitude and direction of the CI ellipses for each earthquake in the horizontal and vertical directions (Supplementary Table S6). The major axis radius, which has a cumulative frequency of 80%, is 200 m in the horizontal direction and 250 m in the vertical direction. Based on the above-mentioned error evaluation, the errors of the hypocenters relocated using the DD method are ±200 m in the horizontal direction and ±250 m in the vertical direction. A difference in the hypocenter locations exceeding the error range is considered significant.
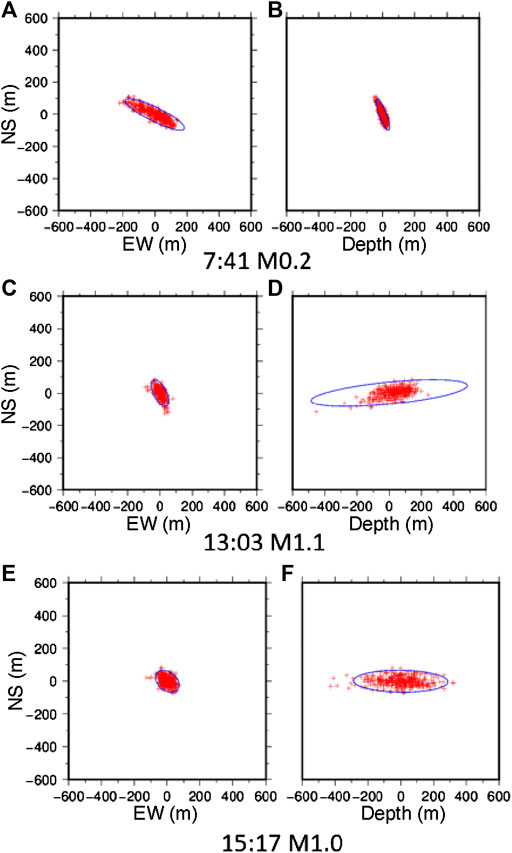
FIGURE 6. Examples of the hypocenter distributions obtained by the bootstrap resampling method. Red cross marks and blue ellipses represent the hypocenters and the 95% confidence interval ellipses, respectively. (A) and (B) show the results for the event on 7:41 JST with M = 0.2. (C) and (D) show the results for the event on 13:03 JST with M = 1.1. (E) and (F) show the results for the event on 15:17 JST with M = 1.0. (A) (C), and (E) show the results for horizontal planes. (B) (D), and (F) show the results for NS to vertical cross sections. It is worth noting how the hypocenter distribution and confidence ellipse of the different earthquakes differ.
Spatiotemporal Distribution of Relocated Hypocenters
Figure 7 shows the hypocenters of 204 VT earthquakes relocated using the DD method. The hypocenters are distributed at a depth of 0–4 km from the vicinity of Minami-dake into the northeastern direction within a distance of 1 km. In addition, a seismicity gap is detected at a depth of ∼1 km; the hypocenters are concentrated above and below the seismicity gap. The hypocenter distributions for the time periods A, B, C, and D are shown using map views (Figure 8) and vertical cross-sections (Figure 9). Figure 10 shows the temporal variation of the depths of the hypocenters and the magnitudes of the earthquakes. In time period A (7:00–9:00 JST), the hypocenters are distributed at depths of 0.3–1 km (Figures 9A, 10) and 0.5–1 km east of Minami-dake (Figure 8A). In time period B (9:00–10:30 JST), the hypocenters are distributed within 1 km east of Minami-dake (Figure 8B) and at a depth of 0.3–0.9 km (Figures 9B, 10), except for an event at a depth of 2 km that occurred at 9:03 JST. The magnitudes of the earthquakes in time period B (M = 1–2) are larger than those in time period A (Figure 10). In time period C (10:30–12:00), the epicenters shift 0.5 km northeast compared with time periods A and B (Figure 8C). The distribution of the hypocenters expands at depths of 0.4–3 km (Figures 9C, 10). Many earthquakes with relatively large magnitude (multiple M = 2 earthquakes) occurred in time period C when compared with other time periods. In time period D (12:00–24:00 JST), the epicenters occupy a large area and are distributed from Minami-dake to 1 km east and 1 km northeast of it (Figure 8D). In time period D, the hypocenters are distributed in two clusters with an increase in depth; the hypocenters of the shallow and deep clusters are distributed at depths of 0.2–1 km and 1.5–3.5 km, respectively (Figures 9D, 10). As described above, the VT earthquake swarm on August 15, 2015, starts at very shallow depth and, subsequently, the seismogenic zone expands in the depth direction in a relatively short time period of ∼6 hr.
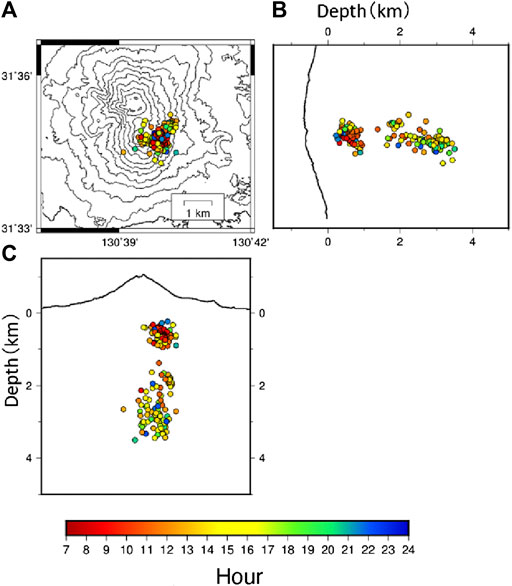
FIGURE 7. Hypocenter distributions of the VT earthquakes on August 15, 2015, as determined by the double-difference method. The colors indicate the occurrence time. (A) Map view of the relocated hypocenters. Contours are provided every 100 m. (B) and (C) are the EW and NS cross sections, respectively.
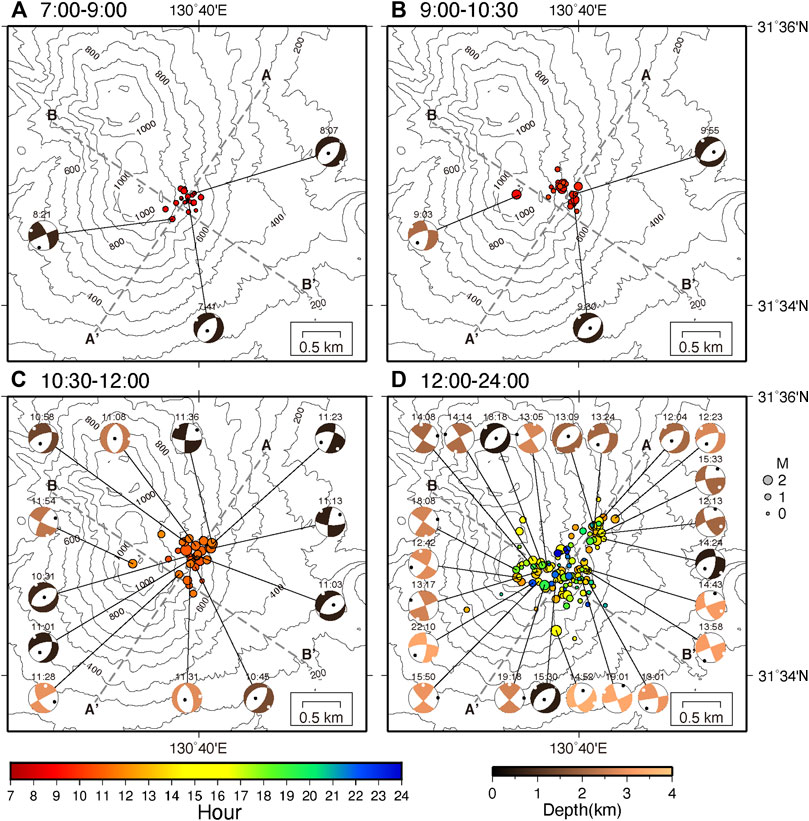
FIGURE 8. Epicenter distributions of the VT earthquakes (circles). The colors of the circles indicate the occurrence time same as Figure 7. Some of focal mechanisms (beach balls) are shown along with their epicenters. The colors of the beach balls indicate focal depths. The occurrence time of the focal mechanism is also shown along with corresponding beach ball. Contours are provided every 100 m. (A) Period from 7:00 to 9:00 JST. (B) Period from 9:00 to 10:30 JST. (C) Period from 10:30 to 12:00 JST. (D) Period from 12:00 to 24:00 JST.
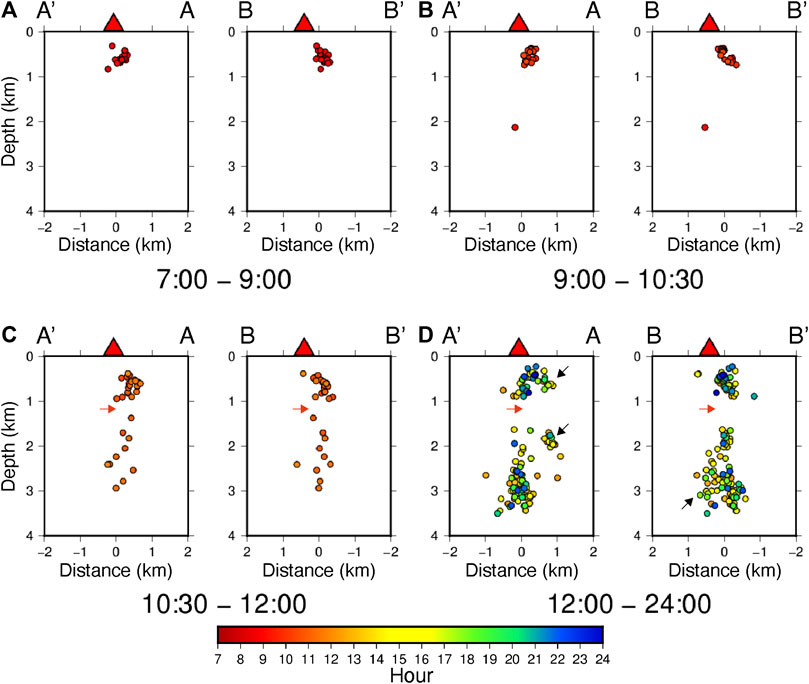
FIGURE 9. Hypocenters of the VT earthquakes on August 15, 2015, projected on the cross sections A–A’ (NE–SW) and B–B’ (NW–SE), as shown in Figure 8. The colors indicate the occurrence time as Figure 7. Red arrows show the depth of the center of the aseismic zone. The black arrows show the position of the tip of the expanded area of the hypocenter distribution. (A) Period from 7:00 to 9:00 JST. (B) Period from 9:00 to 10:30 JST. (C) Period from 10:30 to 12:00 JST. (D) Period from 12:00 to 24:00 JST.
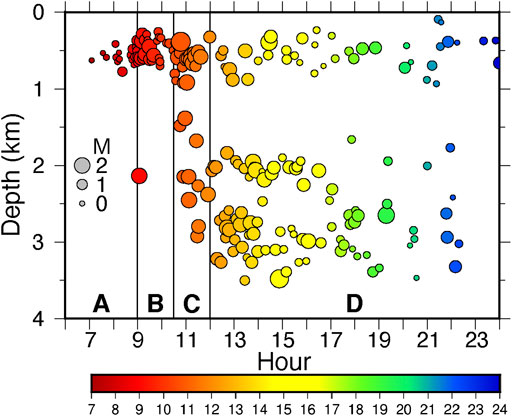
FIGURE 10. Temporal change of the hypocenter depth of the VT earthquakes on August 15, 2015. The colors indicate the occurrence time as Figure 7. The size of the circle is proportional to the magnitudes of the VT earthquakes. The vertical lines indicate 9:00, 10:30, and 12:00 JST. The letters A, B, C and D represent the time periods.
It is evident that the hypocenter distribution changes based on the velocity structure model used for hypocenter determination. Therefore, we relocated the hypocenters using the same method and two additional velocity structures (Supplementary Figure S3). One is a homogeneous half-space structure used in Hotta et al. (2016a) and the other is a structure subdivided (fine structure) from the velocity structure used in the present study (Supplementary Table S1). As a result of the hypocenter relocation, no remarkable difference in epicentral distribution is observed in the three structures. However, with regard to the depth distribution, there is a difference among the three structures (Figure 9; Supplementary Figures S4,S5). For the homogeneous structure, during the time periods A and B, earthquakes cluster at 1.2–2 km depths, which are deeper than the depths obtained with the original velocity structure during the same time periods (Figures 9A,B). In time periods C and D, the hypocenter distribution expanded to a depth of 3 km and a small seismicity gap was observed at a depth of approximately 2 km (Supplementary Figure S4). For the fine structure, the hypocenters are distributed at depths of 0.3–2.5 km and a small seismicity gap is observed at approximately 1 km (Supplementary Figure S5). The small seismicity gap of the homogeneous and fine structures is smaller than that of the original structure (Figures 9C,D) and their widths are approximately equal to the error in the depth direction of the hypocenters (Figure 6 and Supplementary Table S6). Therefore, it is necessary to judge carefully whether the existence of the seismic gap is significant or not. To do this, the frequency profiles of the depths of the hypocenters obtained using the three velocity structures are displayed on Supplementary Figure S6. The arrow in the figure corresponds to the depth of the seismicity gap shown in Figure 9 and Supplementary Figures S4,S5). Considering the frequency distribution of the depths of the hypocenters of the velocity structures used in this study (Supplementary Figure S6A), it is evident that the frequency distribution is divided into shallow and deep clusters at depths of 0.2–1 km and 1.8–3.4 km, respectively. Conversely, the frequency distributions based on the homogeneous and fine structures (Supplementary Figures S6B,C) obscure the distinction between the shallow and deep clusters. However, they also show two peaks in the shallow and deep clusters as well as bimodal characteristics. Therefore, the existence of a seismicity gap between the shallow and deep clusters is confirmed regardless of the assumed velocity structure applied for the relocation of the hypocenter. However, the size of the seismicity gap varies with the velocity structure.
Focal Mechanisms
The focal mechanisms of 176 events are estimated from the P-wave polarity and amplitude ratios of the P- and S-waves. Focal mechanisms with qualities A, B, or C, as described in Estimation of Focal Mechanisms, are obtained for 93 events (Supplementary Figure S2) and are used for the discussion in this study. Some of them are also plotted on map views along with their epicenters for the time periods A, B, C, and D (Figure 8). The strikes of normal faulting mechanisms well match the A–A’ (NE–SW) direction for the four time periods (Figure 8). The P- and T-axes of the focal mechanisms of all events with a quality of C or higher are plotted on one focal sphere in Figure 11. The P-axes are distributed in the NE–SW direction from the center of the focal sphere, while the T-axes are distributed in the NW–SE direction. Figure 12 shows the azimuthal distribution of the P- and T-axes for the time periods A, B, C, and D. We classify the focal mechanisms into three types, that is, normal faulting, reverse faulting, and strike-slip faulting (Supplementary Table S7), using the method of Álvarez-Gómez (2019). In time period A, a regularity of the distribution of the P- and T-axes cannot be observed because the number of each azimuth angle is small and there are only four focal mechanisms (Figure 12A). Two normal faulting and two strike-slip faulting events occurred in time period A. Two normal faulting, four strike-slip faulting, and two reverse faulting events occurred in time period B. In time period C, eight normal faulting, five strike-strike slip faulting, and two reverse faulting events occurred. In time periods B and C, both the P- and T-axes are linearly symmetrically distributed (Figures 12B,C). In time zone B, the P-axes are distributed in the W–NW and E–SE directions, while the T-axes are distributed in the NW and S–SE directions (Figure 12B). In time period C, the P-axes are distributed in the NE–E and SW directions, while the T-axes are distributed in the NW and SE–E directions (Figure 12C). The dispersed distribution of the P-axis azimuths in time period C is because normal faulting accounts for a half of the events in the time period. In time period D, there are 18 normal faulting, 40 strike-slip faulting, and eight reverse faulting events (Supplementary Table S7). While normal faulting mechanism is dominant for the period A, strike-slip faulting events began to occur at higher depths in the period C, and were dominant at higher depths in the period D (Figure 8; Supplementary Table S7). In time period D, the P- and T-axes show asymmetric distributions; however, the distributions can be divided into two directions. The P-axes are distributed in two directions, that is, W–NW to E–SE and SW to NE, and the T-axes are distributed in two directions, that is, NW to E–SE and N–NE to S–SW. In time periods B, C, and D, the P- and T-axes are linearly symmetrically distributed in the strike direction of the dike (Figures 12C,D).
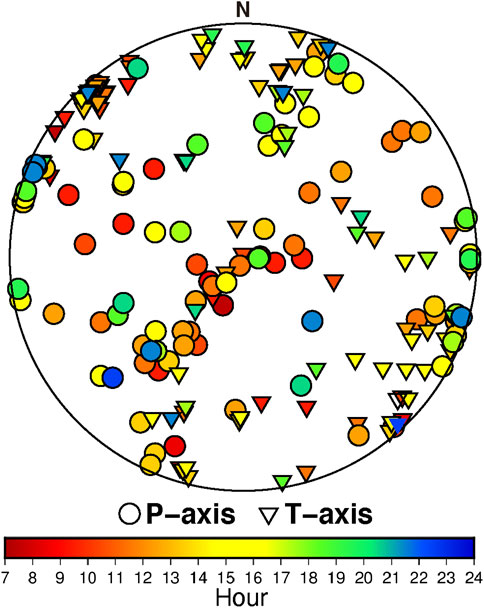
FIGURE 11. Distribution of the tension (T)-axes (inverted colored triangles) and pressure (P)-axes (colored circles) of the focal mechanisms in an equal-area lower-hemisphere projection of the focal sphere. The colors indicate the occurrence time as in Figure 7.
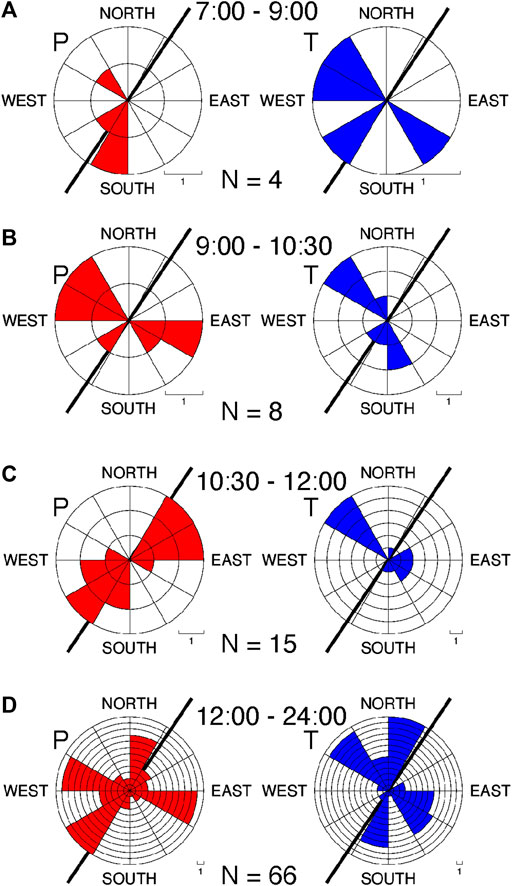
FIGURE 12. Rose diagrams showing the frequency distribution of the azimuths of the P-axis (red) and T-axis (blue) for the time periods: (A) 7:00 to 9:00, (B) 9:00 to 10:30, (C) 10:30 to 12:00, and (D) 12:00 to 24:00 JST on August 15, 2015. The rose diagrams have a 30° interval. Each bin shows one frequency. The number of events whose P- and T-axes were determined for each time period is also shown. The thick line in each diagram shows the strike direction of the dike source of the ground deformation associated with the VT earthquake swarm (Hotta et al., 2016a).
Discussion
Spatial Relation Between Volcano-Tectonic Swarm Seismicity and the Dike Inflation
The VT earthquake swarm occurred in a short time period. Earthquakes with similar waveforms were concentrated in time period A when the tilt change started in the first stage of the swarm (Figure 4). In time periods B and C, they were concentrated when the tilt change rate increased (Figure 4). Further, the hypocenters clustered at very shallow depths in time periods A and B, while the hypocenter area extended to the deeper depths during time period C, with the largest tilt change rate (Figures 4B, 10). Subsequently, the tilt change rate decreased gradually in time period D (Figures 4B, 10). The hypocenters in the period can be divided into shallow and deep regions, corresponding to the sporadic occurrence of earthquakes with similar waveforms (Figures 4A, 10). The tilt change was caused by dike inflation, as previously described (Hotta et al., 2016a). Here, we discuss the relationship between the VT swarm seismicity and dike inflation. Figure 13 presents a comparison between the hypocenter distribution and location of the dike. As mentioned above, the VT earthquakes can be classified into shallow cluster (cluster 1) and deep cluster (cluster 2) based on depth. The results show that the dike is located in the seismic gap between clusters 1 and 2 (Figures 13B,C). Cluster 1 is located above the central part of the top of the dike (Figures 13B,C). In addition, the hypocenters of cluster 1 are distributed on the upper extension of the dip direction of the dike (Figure 13C). On the other hand, the hypocenters of cluster 2 are located below the bottom of the dike. However, cluster 2 is not on the lower extension line of the dip direction of the dike but offset by ∼1 km toward Minami-dake. Based on the classification of the focal mechanisms into three types, i.e., normal, reverse, and strike-slip faulting, normal faulting was predominant in cluster 1, while strike-slip faulting was predominant in cluster 2 (Supplementary Table S8; Figure 8). The distributions of the P- and T-axes of clusters 1 and 2 are shown in Figure 14. Because normal faulting is predominant in cluster 1, the azimuth of the P-axis is uneven and the distribution of the P-axis does not converge in one direction (Figure 14). Most of the T-axes of cluster 1 are distributed in the NW direction. This direction is consistent with the NW–SE extension of the regional crustal stress field in the area including Sakurajima volcano, which was estimated from the moment tensor solutions of tectonic earthquakes (Terakawa and Matsu’ura, 2010). This direction also matches the direction perpendicular to the strike (NE–SW) direction of the dike or the direction parallel to the opening direction (NW–SE) of the dike (Hotta et al., 2016a). The azimuthal distributions of the P- and T-axes can be used to discuss the stress field of cluster 2 because strike-slip faulting is dominant. The P-axes are distributed both nearly parallel to the strike direction of the dike and nearly perpendicular to it (Figure 14). The T-axes are also distributed parallel and perpendicular to the strike direction of the dike (Figure 14).
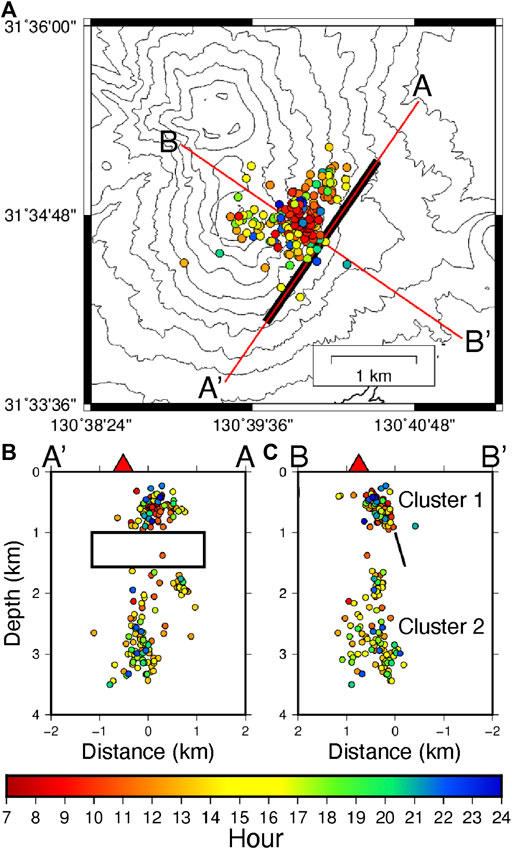
FIGURE 13. Hypocenters of the VT earthquakes and dike source (Hotta et al., 2016a) on August 15, 2015. (A) Map view of the hypocenters and location of the dike source. (B) and (C) show cross sections A–A′ and B–B′ parallel and perpendicular to the strike of the dike source, respectively. The open rectangle and solid line represent the location of the dike.
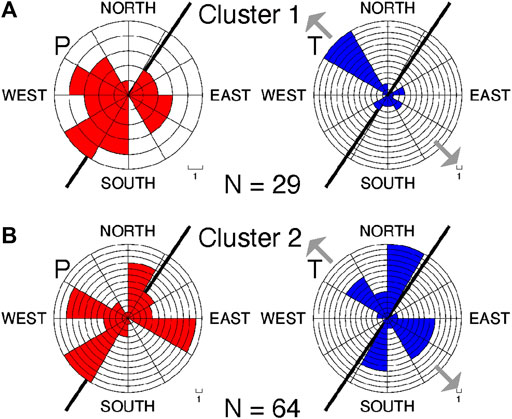
FIGURE 14. Rose diagrams showing the frequency distribution of the azimuths of the P-axis (red) and T-axis (blue) for clusters 1 (A) and 2 (B). The rose diagrams have a 30° interval. Each bin shows one frequency. The number of events whose P- and T-axes were determined for each time period is also shown. The thick line in each diagram shows the strike direction of the dike source of the ground deformation associated with the VT earthquake swarm (Hotta et al., 2016a). Gray arrows indicate the azimuth of the regional maximum extension of the stress field (Terakawa and Matsu’ura, 2010).
Based on the above-mentioned results, we will describe the generation of earthquakes in clusters 1 and 2 caused by the dike source inflation in this section. Roman and Cashman (2006) summarized three existing models for the relationship between the magma migration and VT seismicity, including expected spatiotemporal patterns of VT hypocenters and focal mechanisms: 1) VT earthquakes occur due to slip on shear planes extending obliquely from the edges of the inflating dike (Hill, 1977); 2) VT earthquakes occur in a zone of inflation-induced tension ahead of the tip of a dike (eg, Ukawa and Tsukahara, 1996); and 3) VT earthquakes occur close to the walls (away from the tips and edges) of a dike inflating in the direction of the regional minimum compressive stress (Roman, 2005). Only a single dike was modeled for the ground deformation associated with the VT swarm seismicity (Hotta et al., 2016a; Morishita et al., 2016); multiple deformation sources have not been proposed. Therefore, we excluded the first model (Hill, 1977) and discuss the generation mechanisms of the VT earthquakes of clusters 1 and 2 using the second and third models. However, we will discuss the potential sources of the multiple deformations. Based on the second model, the P- and T-axes of the focal mechanism should be parallel to the regional maximum compression and tension, respectively (Roman and Cashman, 2006). Based on the third model, the P-and T-axes of the focal mechanism should be oriented ∼90° to the regional maximum compression and tension, respectively (Roman, 2005). As described previously, VT earthquakes in cluster 1 occur in a zone ahead of the top of the inflating dike (Figures 13B,C). Most focal mechanisms in cluster 1 have T-axes parallel to the minimum regional compression (Figure 14A) and normal faulting with the NE–SW strike direction. Therefore, the generation of VT earthquakes in cluster 1 can be explained with the second model. Previous studies (Roman, 2005; Roman and Heron, 2007; Vargas-Bracamontes and Neuberg, 2012) showed that dike inflation can induce tension in the zone ahead of the dike tip; however, the source can induce compression in the obliquely extended region. The hypocenters of cluster 2 are below the dike, but are slightly skewed off a zone ahead of the bottom tip of the dike. Therefore, the hypocenters of cluster 2 could be considered located in a zone ahead of the dike tip, or in a zone of the obliquely extended region of the dike tip.
Next, we describe the stress fields around Sakurajima and close to the dike. As noted previously, the stress field around Sakurajima is characterized by extension in the NW–SE direction and compression in the NE–SW direction (Figure 1; Terakawa and Matsu’ura, 2010). Notably, strike-slip faulting corresponding to this stress field is predominant in cluster 2 (Supplementary Table S8). The P-axes of cluster 2 are distributed either in the direction nearly matching the compression direction (NE–SW) of the regional stress field or in the direction nearly matching the direction rotated by 90° with respect to the compression direction (Figure 14B). Similarly, the T-axes of cluster 2 are distributed either in the direction nearly coincident with the extension direction (NW–SE) of the regional stress field or in a direction nearly coincident with the direction rotated by 90° with respect to the extension direction (Figure 14B). Therefore, earthquakes in cluster 2 might have occurred either in a zone of inflation-induced tension ahead of the tip of the dike (Ukawa and Tsukahara, 1996) or close to the walls of the dike inflating in the direction of the regional minimum compressive stress (Roman, 2005). The earthquakes in cluster 2 occurred during time periods C and D; however, the earthquake generation in those periods differs. The second model is acceptable for time period C when the dike inflation rate is large because earthquakes in the direction of the T-axis, which corresponds to the regional stress period, are dominant. Conversely, in time period D, the P- and T-axes are distributed in the direction corresponding to the regional stress field and in the direction perpendicular to it. Therefore, the distributions of the P- and T-axes can be interpreted using a mixture of both the second and third models.
As explained in the latter part of Spatiotemporal Distribution of Relocated Hypocenters, the depth of the hypocenter distribution changes with a change in the assumed velocity structure (Figure 9; Supplementary Figures S4,S5). Therefore, the positional relation with the dike and the hypocenters along the depth differs depending on the assumed velocity structure. However, it is more appropriate to discuss the positional relation between the dike and the hypocenters obtained by the velocity structure in this study or the fine structure, which are both constructed from the result of the seismic refraction analysis (Miyamachi et al., 2013), rather than the hypocenters obtained based on the homogeneous structure. From the relative positional relationship between the dike and the depth distribution of the hypocenters of the structures considered in this study (Figure 13) as well as those of the fine structure (Supplementary Figure S5), the dike lies between the shallow and deep clusters. In the case of cluster 1, which is the shallow cluster, the hypocenters, based on both velocity structures, are distributed in a zone ahead the top tip of the dike. Conversely, in the case of cluster 2, which is the deep cluster, based on the velocity structure in the present study, there are numerous earthquakes in a zone ahead of the bottom tip of the dike, whereas earthquakes close to the dike wall seem to be few (Figures 9, 13). However, based on the fine structure, there are numerous earthquakes close to the dike wall and not so many earthquakes in a zone ahead the bottom tip of the dike, suggesting that changes in the hypocenter distribution obtained based on the assumed velocity structure may alter the mechanism of VT seismicity interpreted based on relative positions of the dike and the seismicity.
In addition, in the focal mechanism analysis, the influence of take-off angles of seismic waves from the hypocenter on velocity structure can slightly alter the mechanism. Therefore, regarding the earthquake generation mechanism model, it is difficult to assign either the second or third model to cluster 2 as the primary earthquake generation mechanism. To address the problem, three-dimensional (3-D) seismic velocity structure should be adopted in hypocenter determination and focal mechanism estimation. For example, Alparone et al. (2020) determined with more precision the hypocenters and the focal mechanism of a preceding and accompanying seismic swarm of the Mt. Etna flank eruption in December 2018 based on a 3-D velocity structure. According to Alparone et al. (2020), the swarm began at shallower depths near the sea level, and the swam area expanded to a depth of 4 km in approximately 12 hr. Therefore, the shallow-to-deep extension of the hypocenter within a relatively short time is similar to that of the swarm of Sakurajima volcano on August 15, 2015. Based on high-sampling continuous ground deformation data associated with the seismic swarm, including GNSS, tiltmeter, and strainmeter data, Aloisi et al. (2020) estimated two dikes with different depths beneath Mt. Etna. Thereafter, they modeled the geometry, location and volume change more accurately using a finite element method based on a 3-D subsurface structure and the surface topography of the edifice. This made it possible to compare the two dikes and hypocenters more meaningfully (Aloisi et al., 2020). Practically, Bonaccorso (2020) and Giampiccolo (2020) shows a strong connection between the two dikes and the refined relocated seismicity. The single dike model (Hotta et al., 2016a) alone may be inadequate for capturing the ground deformation on August 15, 2015 at Sakurajima volcano, and the presence of multiple deformation sources may also have to be considered.
The inflation deformation associated with the swarm seismicity of Sakurajima has a relatively simple differential InSAR image, as it can be explained by a single dike (Morishita et al., 2016). Both Morishita et al. (2016) and Hotta et al. (2016a) only estimated a single dike based on the daily change in the ground deformation from the pre-earthquake swarm to the end of the swarm. They did not estimate multiple deformation sources in response to the spatiotemporal evolution of the hypocenters during the swarm. It is necessary to estimate their geometry, size, location, and volume change more accurately so as to elucidate the mechanism of generation of the swarm seismicity. It would be effective to estimate these parameters based on the finite element method using a more realistic structure that considers the topography of the mountain edifice as well as a 3-D subsurface structure.
There is a possibility of the growth of the dike or the existence of another dike corresponding to the extension of the hypocentral area toward the northeast, as observed in period D. According to a principal strain analysis of the records of extension meters installed in station AR1 during the swarm seismicity, principal strain axes rotate clockwise over time from period A to D (Higashi Uchida personal communication). In particular, the rotational speed from period C to D is greater than those in the previous periods (Higashi Uchida personal communication), which suggests the northeastward extension of the dike or the formation of a second dike. More precise modeling of the multidisciplinary high time-sampling continuous deformation data during the swarm seismicity should be explored in future.
Possible Scenario of the Swarm Seismicity Associated With the Dike Inflation on August 15, 2015
In the previous section, the relation between the dike inflation and VT earthquake swarm was discussed based on the hypocenter location and azimuthal distributions of the P- and T-axes. Here, we describe the dike inflation process and VT swarm seismicity induced by the dike inflation in the four periods A, B, C, and D. Figure 15 shows the conceptual cross-sectional view of the hypocenter distribution and location of the inflating dike at a depth of 0–4 km for the four periods, the depth profile of the brittle fracture strength of the crustal rocks in the crust, and the conceptual diagram of the amount of inflation of the dike. Hotta et al. (2016a) stated that the inflation volume is 2.7 × 10⁶ m3 and the inflation rate is very large (1 × 10⁶ m3/hr). However, the temporal evolution of the dike inflation was not described. We assume that the temporal change of the tilt, as shown in Figure 4B, corresponds to the temporal change of the dike inflation volume. The brittle fracture strength is very low in the uppermost part of the crust and gradually increases with an increase in depth (Cho, 1993; Kohlstedt et al., 1995). The brittle fracture strength of the Earth’s crust increases with increasing confining pressure. In this study, we used the equation for the depth change considering the confining pressure, temperature, and strain rate dependencies on the brittle fracture strength reported by Cho (1993) to produce the depth profile (see Supplementary Description S1). Notably, for volcanic rocks it seems to be weaker than for the granites that make up a common crust. Heap et al. (2014) investigated the effect of the porosity on the brittle fracture strength of volcanic rock and reported that the fracture strength is 0.4–0.44 GPa if the bulk porosity is 2%. This value almost corresponds to the fracture strength at the depth at which the VT earthquake swarm is initiated, as shown Figure 15. In time period A, the inflation volume is small in the very early stage of dike inflation. The differential stress between the maximum and minimum principal stresses induced by dike inflation is estimated to reach 0.4 GPa corresponding to the brittle fracture strength of the rocks at a depth of 1 km, where the earthquakes occur with normal faulting (Figure 15A). On the other hand, no earthquake has occurred below 1 km because the differential stress has not reached the fracture strength of the rock at the depth of the center of the dike and in the deeper part of the dike. In time period B, the dike inflation progressed and inflation volume increased, inducing tension and compression around the dike. Because earthquakes started to occur at a depth of 2 km below the bottom of the dike, it has been estimated that the magnitude of the induced differential stress reached ∼0.5 GPa in time period B. Normal faulting occurs at a depth of around 1 km, while strike-slip faulting occurs at a depth of around 2 km. In time period C, the dike inflation proceeded and the cumulative inflation volume reached ∼70% of the final cumulative inflation volume at the end of the period. At this time, the hypocenters expanded deeper to a depth of 3 km and earthquakes occurred in the upper part of the top of the dike and in the lower part of the bottom of the dike. It has been estimated that the differential stress induced by the dike inflation reached ∼0.6 GPa. Finally, in time period D, the remaining 30% of dike inflation occurred and the hypocenter depth slightly increased to 3.5 km, while earthquakes occurred in the upper part of the top of the dike and in the lower part of the bottom of the dike. At this time, the differential stress induced by the dike inflation must have exceeded 0.6 GPa. The relation between the dike inflation and VT earthquake swarm described here does not include the migration of magma and dike formation due to magma intrusion. In addition, although the ground deformation caused by the dike was analyzed in previous studies (Hotta et al., 2016a; Morishita et al., 2016), the temporal change or migration of the position of the dike was not discussed. Therefore, it remains unclear where the magma moved based on the direction to which the dike inflated and the VT earthquake swarm moved. Despite these remaining challenges, it is important to estimate the seismicity associated with rapid dike intrusion that causes significant ground deformation in hours. The VT earthquake swarm initiated at shallow depth, affecting the weaker rocks due to the stress increasing in response to dike inflation; then it migrated at depth, affecting the stronger rocks. Subsequently, seismicity occurred at both shallower and deeper levels. The spatiotemporal changes of the hypocenters and focal mechanisms of the seismicity associated with this rapid dike intrusion/inflation seem different from those associated with slower dike intrusion, lasting several weeks, where dike-induced earthquakes follow to the propagation of the dike tip and dike inflation and their focal mechanisms are well aligned to the direction of the dike (e.g., Woods et al., 2019). Although there are fewer rapid dike intrusion cases compared with slow dike intrusion cases, more observations are needed to verify whether the spatiotemporal changes in hypocenters and focal mechanisms present in this study are inherent features of the rapid dike intrusion. For this purpose, it is essential to deploy highly sensitive continuous deformation sensors and a dense seismic network in volcanoes, and observe seismicity and ground deformation associated with rapid dike intrusion.
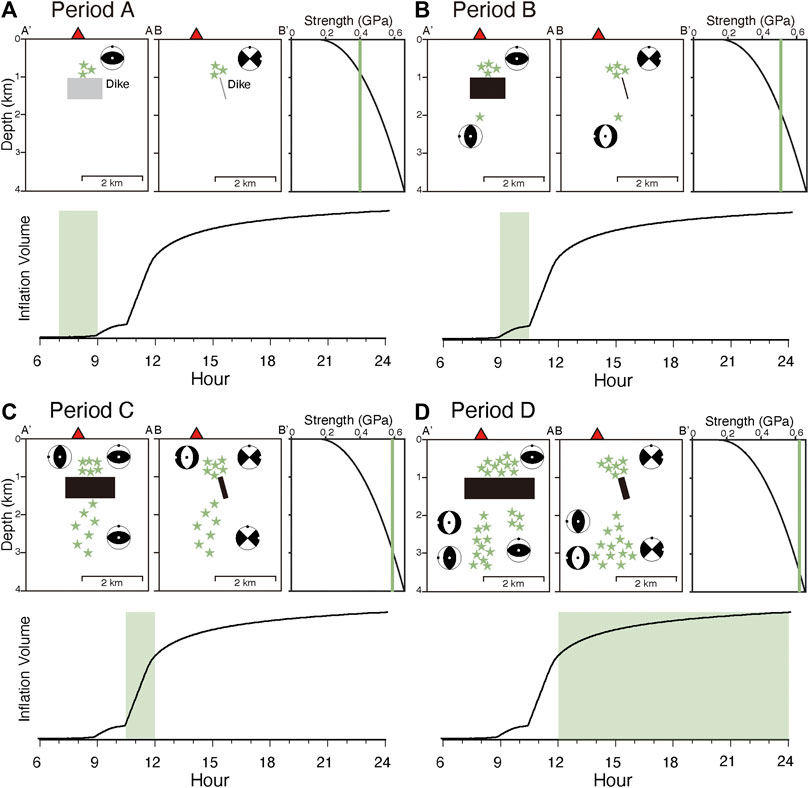
FIGURE 15. Conceptual cross-sectional A–A′ and B–B′ views of the hypocenter distribution, location of the dike, depth profile of the brittle fracture strength of the crustal rocks, and conceptual diagram of the amount of the inflation of the dike for the time periods: (A) 7:00 to 9:00, (B) 9:00 to 10:30, (C) 10:30 to 12:00, and (D) 12:00 to 24:00 JST on August 15, 2015. Corresponding time period is shown with bright-green color. The location of the dike is shown by rectangles and lines in the cross-sections. The gray rectangle and lines indicate the initial stage of the dike inflation, while black ones indicate the evolution stage of the dike inflation. Although the size of the dike rectangle is same for period A and B, the gray dike rectangle exists only in period A, because the inflation volume of the dike in period A is smaller than the one in period B. Note that typical focal mechanisms (beach balls) are projected on the cross-sections for the four periods. The white and black dots show the position of T- and P-axes, respectively.
Conclusions
We relocated 204 hypocenters and derived 176 focal mechanisms of the VT earthquake swarm that occurred at Sakurajima volcano on August 15, 2015. Based on the cross-correlation of waveforms of the VT earthquakes and the change rate of the ground deformation associated with the VT swarm, we obtained the following results for four time periods:
Period A (7:00–9:00 JST) and B (9:00–10:30 JST): The hypocenters are distributed at a shallow depth of 0.3–1 km.
Period C (10:30–12:00 JST): The hypocenter distribution expands to the deeper part and is located at a depth of 0.3–3 km. The seismic activity is largest and there are multiple M2 class earthquakes and the change rate of the ground deformation is the largest.
Period D (12:00–24:00 JST): The hypocenters are distributed in two clusters at different depths. The shallow and deep clusters are located at depths of 0.2–1 km and 1.5–3.5 km, respectively.
For the four time periods, the hypocenters are divided into the shallow and deep clusters, and the P- and T-axis distributions of the focal mechanism solutions are compared with strike and opening directions of the dike estimated from the ground deformation. The normal faulting and strike-slip faulting are dominant for the focal mechanisms during the four time periods. The T-axes of the shallow cluster were distributed parallel to the opening direction of the dike. The P-axes of the deep cluster have a pattern that is in agreement with the regional stress field in the strike direction of the dike, whereas the T-axes are parallel to the opening direction of the dike. In addition, the deep cluster also shows a 90°-rotated pattern in which the P-axes are distributed in the opening direction of the dike and the T-axes are distributed in the strike direction of the dike. Although there is only the former pattern in time period C, both patterns are mixed in time period D. This reflects the difference in how the stress field changes due to the dike inflation in earthquake generation. It is interpreted that the stress in the vicinity of the dike was modified by the dike inflation, and the VT earthquakes were induced by the differential stress exceeding the brittle fracture strength of the rock. It is suggested that dike inflation is so fast that the VT earthquake swarm initiated from shallow depths, within weaker rocks, expanded at deep within stronger rocks as dike inflation progressed, and continued for a while during the deceleration of the intrusion growth. The spatiotemporal changes of the hypocenters and focal mechanism shown here may be unique features of rapid dike intrusion. Further seismic and deformation observations are required to test this hypothesis.
Data Availability Statement
The raw data supporting the conclusions of this article will be made available by the corresponding author, without undue reservation.
Author Contributions
MK performed all the analysis in the present study and wrote his master thesis. HN and MK contributed to the planning and interpretation of the present study. HN reconstruct the thesis, refined the interpretation, drafted and revised the manuscript. All authors read and approved the final manuscript.
Funding
This work was supported by JSPS KAKENHI Grant Number 18K03781 to HN and the Ministry of Education, Culture, Sports, Science and Technology (MEXT) of Japan, under its Earthquake and Volcano Hazards Observation and Research Program.
Conflict of Interest
The authors declare that the research was conducted in the absence of any commercial or financial relationships that could be construed as a potential conflict of interest.
Acknowledgments
We thank Shiro Ohmi and Masato Iguchi for providing valuable advice and comments. We also thank Valerio Acocella and Luigi Passarelli and two other reviewers for critical inputs that improved the quality of the manuscript.
Supplementary Material
The Supplementary Material for this article can be found online at: https://www.frontiersin.org/articles/10.3389/feart.2020.600223/full#supplementary-material.
References
Ágústsdóttir, T., Winder, T., Woods, J., White, R. S., Greenfield, T., and Brandsdóttir, B. (2019). Intense seismicity during the 2014–2015 Bárðarbunga-Holuhraun rifting event, Iceland, reveals the nature of dike-induced earthquakes and caldera collapse mechanisms. J. Geophys. Res. Solid Earth 124, 8331–8357. doi:10.1029/2018JB016010
Aloisi, M., Bonaccorso, A., Cannavò, F., Currenti, G., and Gambino, S. (2020). The 24 december 2018 eruptive intrusion at Etna volcano as revealed by multidisciplinary continuous deformation networks (CGPS, borehole strainmeters and tiltmeters). J. Geophys. Res. Solid Earth 125, e2019JB019117. doi:10.1029/2019JB019117
Alparone, S., Barberi, G., Giampiccolo, E., Maiolino, V., Mostaccio, A., Musumeci, C., et al. (2020). Seismological constraints on the 2018 Mt. Etna (Italy) flank eruption and implications for the flank dynamics of the volcano. Terra. Nova. 32, 334–344. doi:10.1111/ter.12463
Álvarez-Gómez, J. A. (2019). FMC—earthquake focal mechanism data management, cluster and classification. SoftwareX 9, 299–307. doi:10.1016/j.softx.2019.03.008
Bonaccorso, A., and Giampiccolo, E. (2020). Balance between deformation and seismic energy release: the dec 2018 ‘double-dike’ intrusion at Mt. Etna. Front. Earth Sci. 8, 583815. doi:10.3389/feart.2020.583815
Bonafede, M., and Danesi, S. (1997). Near-field modifications of stress induced by dyke injection at shallow depth. Geophys. J. Int. 130 (2), 435–448. doi:10.1111/j.1365-246X.1997.tb05659.x
Cervelli, P., Segall, P., Amelung, F., Garbeil, H., Meertens, C., Owen, S., et al. (2002). The 19 September 1999 Upper East Rift Zone dike intrusion at Kilauea volcano, Hawaii. J. Geophys. Res. Solid Earth 107 (B7), 2150. doi:10.1029/2001JB000602
Cho, A. (1993). Fracture strength of the crust estimated from laboratory experiments: a possibility of high-pressure type fracturing in the crust. J. Geography. 102, 279–287. doi:10.5026/jgeography.102.3_279
Chouet, B.A., and Matoza, R.S. (2013). A multi-decadal view of seismic methods for detecting precursors of magma movement and eruption. J. Volcanol. Geotherm. Res. 252, 108–175. doi:10.1016/j.jvolgeores.2012.11.013
Deichmann, N., and Garcia-Fernandez, M. (1992). Rupture geometry from high-precision relative hypocentre locations of microearthquake clusters. Geophys. J. Int. 110 (3), 501–517. doi:10.1111/j.1365-246X.1992.tb02088.x
Ebinger, C., Ayele, A., Keir, D., Rowland, J., Yirgu, G., Wright, T., et al. (2010). Length and timescales of rift faulting and magma intrusion: the Afar rifting cycle from 2005 to present. Annu. Rev. Earth Planet Sci. 38, 439–466. doi:10.1146/annurev-earth-040809-152333
Ebinger, C. J., Keir, D., Ayele, A., Calais, E., Wright, T. J., Belachew, M., et al. (2008). Capturing magma intrusion and faulting processes during continental rupture: seismicity of the Dabbahu (Afar) rift. Geophys. J. Int. 174, 1138–1152. doi:10.1111/j.1365-246X.2008.03877.x
Einarsson, P., and Brandsdóttir, B. (1980). Seismological evidence for lateral magma intrusion during the July 1978 deflation of the Krafla volcano in NE-Iceland. J. Geophys. 47, 160–165. doi:10.2172/890964
Fukuyama, H. (1978). Geology of Sakurajima volcano, southern Kyushu. J. Geol. Soc. Jpn. 84, 309–316. doi:10.5382/GB.34
Grandin, R., Jacques, E., Nercessian, A., Ayele, A., Doubre, C., Socquet, A., et al. (2011). Seismicity during lateral dike propagation: insights from new data in the recent Manda Harare-Dabbahu rifting episode (Afar, Ethiopia). G-cubed 12, 4. doi:10.1029/2010GC003434
Hardebeck, J. L., and Shearer, P. M. (2002). A new method for determining first-motion focal mechanisms. Bull. Seismol. Soc. Am. 92 (6), 2264–2276. doi:10.1785/0120010200
Hardebeck, J. L., and Shearer, P. M. (2003). Using S/P amplitude ratios to constrain the focal mechanisms of small earthquakes. Bull. Seismol. Soc. Am. 93 (6), 2434–2444. doi:10.1785/0120020236
Hayashi, Y., and Morita, Y. (2003). An image of a magma intrusion process inferred from precise hypocentral migrations of the earthquake swarm east of the Izu Peninsula. Geophys. J. Int. 153 (1), 159–174. doi:10.1046/j.1365-246X.2003.01892.x
Heap, M. J., Xu, T., and Chen, C. (2014). The influence of porosity and vesicle size on the brittle strength of volcanic rocks and magma. Bull. Volcanol. 76, 856. doi:10.1007/s00445-014-0856-0
Hickey, J., Gottsmann, J., Nakamichi, H., and Iguchi, M. (2016). Thermomechanical controls on magma supply and volcanic deformation: application to Aira caldera, Japan. Sci. Rep. 6, 32691. doi:10.1038/srep32691 |
Hidayati, S., Ishihara, K., and Iguchi, M. (2007). Volcano-tectonic earthquakes during the stage of magma accumulation at the Aira caldera, southern Kyushu, Japan. Bull. Volcanol. Soc. Jpn. 52 (6), 289–309. doi:10.18940/kazan.52.6_289
Hill, D. P. (1977). A model for earthquake swarms. J. Geophys. Res. Solid Earth. 82 (8), 1347–1352. doi:10.1029/JB0821i008p01347
Hirata, N., and Matsu’ura, M. (1987). Maximum-likelihood estimation of hypocenter with origin time eliminated using nonlinear inversion technique. Phys. Earth Planet. In. 47, 50–61. doi:10.1016/0031-9201(87)90066-5
Hotta, K., Iguchi, M., Ohkura, T., and Yamamoto, K. (2016b). Multiple-pressure-source model for ground inflation during the period of high explosivity at Sakurajima volcano, Japan – combination analysis of continuous GNSS, tilt and strain data –. J. Volcanol. Geoth. Res. 310, 12–25. doi:10.1016/j.jvolgeores.2015.11.017
Hotta, K., Iguchi, M., and Tameguri, T. (2016a). Rapid dike intrusion into Sakurajima volcano on august 15, 2015, as detected by multi-parameter ground deformation observations. Earth Planets Space 68, 68. doi:10.1186/s40623-016-0450-0
Iguchi, M., Tamaguri, T., Hirabayashi, J., and Nakamichi, H. (2019). Forecasting volcanic eruption of Sakurajima volcano based on magma intrusion rate. Bull. Volcanol. Soc. Jpn. 64 (2), 33–51. doi:10.18940/kazan.64.2_33
Japan Meteorological Agency (2000). Recent seismic activity in the Miyakejima and Niijima-Kozushima region, Japan–the largest earthquake swarm ever recorded. Earth Planets Space 52, 8. doi:10.1186/BF03351658
Kobayashi, T., Miki, D., Sasaki, H., Iguchi, M., Yamamoto, T., and Uto, K. (2013). Geological map of Sakurajima volcano. 2nd edition. Geological Survey of Japan, AIST. (in Japanese with English abstract).
Kohlstedt, D. L., Evans, B., and Mackwell, S. J. (1995). Strength of the lithosphere: constraints imposed by laboratory experiments. J. Geophys. Res. Solid Earth 100 (B9), 17587–17602. doi:10.1029/95JB01460
Kubo, A., and Fukuyama, E. (2003). Stress field along the Ryukyu arc and the Okinawa trough inferred from moment tensors of shallow earthquakes. Earth Planet Sci. Lett. 210, 305–316. doi:10.1016/S0012-821X(03)00132-8
Linde, A. T., Kamigaichi, O., Churei, M., Kanjo, K., and Sacks, S. (2016). Magma chamber recharging and tectonic influence on reservoirs: the 1986 eruption of Izu-Oshima. J. Volcanol. Geoth. Res. 311, 72–98. doi:10.1016/j.jvolgeores.2016.01.001
McNutt, S. R. (2005). Volcanic seismology. Annu. Rev. Earth Planet Sci. 32, 461–491. doi:10.1146/annurev.earth.33.092203.122459
Miyamachi, H., Tomari, C., Yakiwara, H., Iguchi, M., Tameguri, T., Yamamoto, K., et al. (2013). Shallow velocity structure beneath the Aira caldera and Sakurajima volcano as inferred from refraction analysis of the seismic experiment in 2008. Bull. Volcanol. Soc. Jpn. 58, 227–237. doi:10.18940/kazan.58.1_227
Mogi, K. (1958). Relations between the eruptions various volcanoes and the deformations of the ground surfaces around them. Bull. Earthq. Res. Inst. Univ. Tokyo 36, 99–134. http://hdl.handle.net/2261/11909
Moran, S. C., Newhall, C., and Roman, D. C. (2011). Failed magmatic eruptions: late-stage cessation of magma ascent. Bull. Volcanol. 73, 115–122. doi:10.1007/s00445-010-0444-x
Morishita, Y., Kobayashi, T., and Yarai, H. (2016). Three-dimensional deformation mapping of a dike intrusion event Sakurajima in 2015 by exploiting the right- and left-looking ALOS-2 INAR. Geohys. Res. Lett. 43, 4197–4204. doi:10.1002/2016GL068293
Nakamura, K., Jacob, K. H., and Davies, J. N. (1977). Volcanoes as possible indicators of tectonic stress orientations—Aleutians and Alaska. Pure Appl. Geophys. 115, 87–122. doi:10.1007/BF01637099
Nakamura, K. (1977). Volcanoes as possible indicators of tectonic stress orientation—principle and proposal. J. Volcanol. Geoth. Res. 2 (1), 1–16. doi:10.1016/0377-0273(77)90012-9
Nishi, K. (1978). On the focal mechanism of volcanic earthquakes in Sakurajima volcano. Annuals of Disas. Prev. Res. Inst. 21 (B-1), 145–152. (in Japanese with English abstract). http://hdl.handle.net/2433/70195.
Nishimura, T., and Iguchi, M. (2011). Volcanic earthquakes and tremor in Japan. Kyoto: Kyoto University Press.
Okamura, A. T., Dvorak, J. J., Koyanagi, R. Y., and Tanigawa, W. T. (1988). “Surface deformation during dike propagation,”in The Pu’uO’o eruption of Kilauea volcano, Hawaii: Episodes 1 through 20, January 3, 1983, through June 8, 1984. Editor E. W. Wolfe, Washington D. C.: U. S. Geological Survey Professional Paper, 1463, 165–181.
Omori, F. (1916). The Sakura-jima eruptions and earthquakes II. Bull. Imp. Earthq. Invest. Comm. 8 (2), 35–179. http://hdl.handle.net/2261/16063
Omori, F. (1920). The Sakura-jima eruptions and earthquakes V. Bull. Imp. Earthq. Invest. Comm. 8 (5), 353–466. http://hdl.handle.net/2261/16104
Passarelli, L., Rivalta, E., Cesca, S., and Aoki, Y. (2015). Stress changes, focal mechanisms, and earthquake scaling laws for the 2000 dike at Miyakejima (Japan). J. Geophys. Res. Solid Earth 120, 4130–4145. doi:10.1002/2014JB011504
Prejean, S., Ellsworth, W., Zoback, M., and Waldhauser, F. (2002). Fault structure and kinematics of the Long Valley caldera region, california, revealed by high-accuracy earthquake hypocenters and focal mechanisms stress inversions. J. Geophys. Res. Solid Earth 107, B12. doi:10.1029/2001JB001168
Roman, D. C., and Cashman, K. V. (2006). The origin of volcano-tectonic earthquake swarms. Geology 34 (6), 457–460. doi:10.1130/G22269.1
Roman, D. C., and Heron, P. (2007). Effect of regional tectonic setting on local fault response to episodes of volcanic activity. Geophys. Res. Lett. 34, L13310. doi:10.1029/2007GL030222
Roman, D. C. (2005). Numerical models of volcanotectonic earthquake triggering on non-ideally oriented faults. Geophys. Res. Lett. 32, L02304. doi:10.1029/2004GL021549
Roman, D. C., Moran, S. C., Power, J. A., and Cashman, K. V. (2004). Temporal and spatial variation of local stress fields before and after the 1992 eruptions of Crater Peak vent, Mount Spurr volcano, Alaska. Bull. Seismol. Soc. Am. 94 (6), 2366–2379. doi:10.1785/0120030259
Rubin, A. M. (1992). Dike-induced faulting and graben subsidence in volcanic rift zones. J. Geophys. Res. 97, 1839–1858. doi:10.1029/91JB02170
Rubin, A. M., and Pollard, D. D. (1988). Dike-induced faulting in rift zones of Iceland and Afar. Geology 16 (5), 413–417. doi:10.1130/0091-7613(1988)016<0413:DIFIRZ>2.3.CO;2
Sakai, S., Yamada, T., Ide, S., Mochizuki, M., Shiobara, H., Urabe, T., et al. (2001). Magma migration from the point of view of seismic activity in the volcanism of Miyake-jima Island in 2000. J. Geogr. 110 (2), 145–155. doi:10.5026/jgeography.110.2_145
Savage, J. C., and Cockerham, R. S. (1984). Earthquake swarm in Long Valley caldera, california, January 1983: evidence for dike inflation. J. Geophys. Res. Solid Earth 89 (B10), 8315–8324. doi:10.1029/JB089iB10p08315
Savage, M. K., Aoki, Y., Unglert, K., Ohkura, T., Umakoshi, K., Shimizu, H., et al. (2016). Stress, strain rate and anisotropy in Kyushu, Japan. Earth Planet Sci. Lett. 439, 129–142. doi:10.1016/j.epsl.2016.01.005
Shearer, P. (1997). Improving local earthquake locations using the L1 norm and waveform cross correlation: Application to the Whittier Narrows, California, aftershock sequence. J. Geophys. Res. Solid Earth. 102, 8269–8283. doi:10.1029/96JB03228
Terakawa, T., and Matsu’ura, M. (2010). The 3-D tectonic stress fields in and around Japan inverted from centroid moment tensor data of seismic events. Tectonics 29, TC6008. doi:10.1029/2009TC002626
Ukawa, M., and Tsukahara, H. (1996). Earthquake swarms and dike intrusions off the east coast of Izu Peninsula, central Japan. Tectonophysics 253, 285–303. doi:10.1016/0040-1951(95)00077-1
Ukawa, M., Fujita, E., Yamamoto, E., Okada, Y., and Kikuchi, M. (2000). The 2000 Miyakejima eruption: crustal deformation and earthquakes observed by the NIED Miyakejima observation network. Earth Planets Space 52, 8. doi:10.1186/BF03351659
Vargas-Bracamontes, D. M., and Neuberg, J. W. (2012). Interaction between regional and magma-induced stresses and their impact on volcano-tectonic seismicity. J. Volcanol. Geoth. Res. 243–244, 91–96. doi:10.1016/j.jvolgeores.2012.06.025
Waldhauser, F. (2001). HypoDD: a computer program to compute double-difference earthquake locations. U. S. Geol. Surv. Open-File Report 01-113. Available at: https://pubs.usgs.gov/of/2001/0113/
Waldhauser, F., and Ellsworth, W. L. (2000). A double-difference earthquake location algorithm: method and application to the northern Hayward fault, California. Bull. Seismol. Soc. Am. 90 (6), 1353–1368. doi:10.1785/0120000006
Watanabe, T., and Tabei, T. (2004). GPS velocity field and seismotectonic of the Ryukyu arc, southwest Japan. Bull. Seismol. Soc. Jpn. 57, 1–10. doi:10.4294/zisin1948.57.1_1
Woods, J., Winder, T., White, R. S., and Brandsdóttir, B. (2019). Evolution of lateral dike intrusion revealed by relatively-relocated dike-induced earthquakes: the 2015-15 Bárðarbunga-Holuhraun rifting event, Iceland. Earth Planet Sci. Lett. 506, 32. doi:10.1016/j.epsl.2018.10.032
Yasui, M., Takahashi, M., Shimada, J., Miki, D., and Ishihara, K. (2013). Comparative study of proximal eruptive events in the large-scale eruption of Sakurajima: An-ei eruption vs. Taisho eruption. Bull. Volcanol. Soc. Jpn. 58 (1), 59–76. doi:10.18940/kazan.58.1_59
Yokoyama, I. (2013). An interpretation on secular changes in deformation caused by the 1914 eruption of Sakurajima volcano. Bull. Volcanol. Soc. Jpn. 58 (1), 77–90. doi:10.18940/kazan.58.1_77
Yoshikawa, K., and Nishi, K. (1969). On the earthquake activity in the deeper zone of Sakurazima. Annuals of Disas. Prev. Res. Inst. 12 (A), 57–65. (in Japanese with English abstract). http://hdl.handle.net/2433/69455.
Keywords: hypocenter, focal mechanism, volcano-tectonic earthquake, dike inflation, earthquake swarm, Sakurajima
Citation: Koike M and Nakamichi H (2021) Dike Inflation Process Beneath Sakurajima Volcano, Japan, During the Earthquake Swarm of August 15, 2015. Front. Earth Sci. 8:600223. doi: 10.3389/feart.2020.600223
Received: 29 August 2020; Accepted: 24 December 2020;
Published: 16 February 2021.
Edited by:
Luigi Passarelli, Université de Genève, SwitzerlandReviewed by:
Federica Lanza, ETH Zurich, SwitzerlandAlessandro Bonaccorso, National Institute of Geophysics and Volcanology, Italy
Copyright © 2021 Koike and Nakamichi. This is an open-access article distributed under the terms of the Creative Commons Attribution License (CC BY). The use, distribution or reproduction in other forums is permitted, provided the original author(s) and the copyright owner(s) are credited and that the original publication in this journal is cited, in accordance with accepted academic practice. No use, distribution or reproduction is permitted which does not comply with these terms.
*Correspondence: Haruhisa Nakamichi, bmFrYW1pdGlAc3ZvLmRwcmkua3lvdG8tdS5hYy5qcA==