 J. Jotautas Baronas1,2*
 Douglas E. Hammond1
 Mia M. Bennett3,4
 Olivier Rouxel5
 Lincoln H. Pitcher3†
 Laurence C. Smith3†
- 1Department of Earth Sciences, University of Southern California, Los Angeles, CA, United States
- 2Department of Earth Sciences, University of Cambridge, Cambridge, United Kingdom
- 3Department of Geography, University of California Los Angeles, Los Angeles, CA, United States
- 4Department of Geography, The University of Hong Kong, Hong Kong, China
- 5IFREMER, Centre De Brest, Unité Géosciences Marines, Plouzané, France
Glacial environments offer the opportunity to study the incipient stages of chemical weathering due to the high availability of finely ground sediments, low water temperatures, and typically short rock-water interaction times. In this study we focused on the geochemical behavior of germanium (Ge) in west Greenland, both during subglacial weathering by investigating glacier-fed streams, as well as during a batch reactor experiment by allowing water-sediment interaction for up to 2 years in the laboratory. Sampled in late August 2014, glacial stream Ge and Si concentrations were low, ranging between 12–55 pmol/L and 7–33 µmol/L, respectively (Ge/Si = 0.9–2.2 µmol/mol, similar to parent rock). As reported previously, the dissolved stable Ge isotope ratio (δ74Ge) of the Watson River was 0.86
1 Introduction
Glacial rivers typically have low solute concentrations, reflecting the limited degree of mineral dissolution due to low temperatures and relatively short water-rock interaction times in the subglacial environment (e.g., Anderson, 2007; Bartholomew et al., 2011; Tranter and Wadham, 2014; Chu et al., 2016). The preferential dissolution of highly reactive trace minerals such as pyrite has been observed during subglacial weathering, especially in alpine glaciers (Anderson et al., 1997; Brown, 2002; Graly et al., 2014; Andrews et al., 2018). When coupled with carbonate dissolution, it results in the net release of
The uniqueness of subglacial weathering is also reflected in the signatures of silicate weathering intensity proxies such as germanium to silicon (Ge/Si) or Si isotope
In glaciated catchments, however, both dissolved Ge/Si and
Recently, it has been shown that dissolved Ge isotope ratios in rivers (δ74Ge = 1.7–5.5‰) also primarily reflect fractionation via secondary weathering phases and that this fractionation is much less pronounced in the single glaciated catchment analyzed to date, the Watson River in west Greenland [0.86
Studying the chemical and isotopic composition of glacial discharge offers an opportunity to better understand the incipient stages of silicate weathering in a subglacial environment where secondary aluminosilicate clay precipitation is limited and where vegetation is absent. This is especially informative for solutes whose elemental and isotopic ratios can be fractionated by plant uptake in vegetated catchments, such as Si and Ge. For these same reasons, glacial river sediments also present an ideal substrate to experimentally quantify how weathering proxy signatures are fractionated with increasing water-rock interaction times.
In this study, we analyzed the major solute concentrations and Ge/Si signatures of a number of streams and rivers in a well-studied area of west Greenland. In addition, we performed lab weathering experiments, allowing water-rock interaction for up to 2 years in unfiltered river samples and observing the evolution of dissolved Ge/Si and
2 Methods
2.1 Study Site and Sample Collection
The study site is located in southwest Greenland, in the proglacial area between the Isunnguata Sermia, Russell, and Leverett glaciers to the east and the settlement of Kangerlussuaq in the west (Figure 1), a region which has been the focus of many previous geochemical studies on chemical weathering and non-traditional stable isotope dynamics (e.g., Wimpenny et al., 2010, Wimpenny et al., 2011; Graly et al., 2014; Hindshaw et al., 2014; Yde et al., 2014; Graly et al., 2016; Rickli et al., 2017; Stevenson et al., 2017; Andrews and Jacobson, 2018; Hatton et al., 2019a; Auqué et al., 2019; Hindshaw et al., 2019). The local geology has been described in detail previously (e.g., Van Gool et al., 2002; Engström and Klint, 2014) and a good summary was recently provided by Hindshaw et al. (2019), and references therein. Briefly, the bedrock underneath the Leverett and Russel glaciers is composed of two distinct Archean orthogneiss units with different degrees of metamorphic alteration, intruded by a mafic dyke swarm.
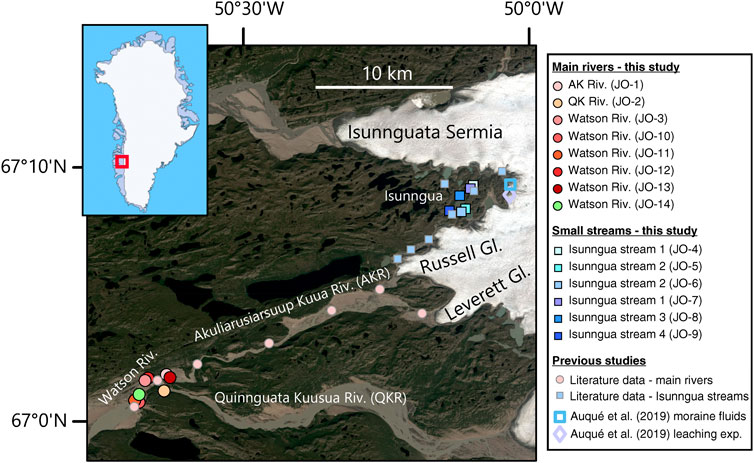
FIGURE 1. Satellite image (Landsat 8) showing the river sample locations in west Greenland, collected as part of this study, as well as the locations of samples from previous studies whose data is compiled here for comparison. Inset shows the study region location within Greenland.
The area lies just above the Arctic Circle (66°30′ N) with average winter and summer air temperatures of −18.0 and 9.3°C, respectively (for 1961–1990), and low annual precipitation of ∼120 mm (Smeets et al., 2018). The hydrology of glacial catchments is complex, with a seasonal evolution from an inefficient distributed drainage during early melt season, toward increasing channelization draining previously isolated pockets of meltwater during mid-melt season, to an efficient channelized system with rapid flushing of meltwater and supraglacial lake evacuation events in the late season (Bartholomew et al., 2011; Cowton et al., 2013; Lindbäck et al., 2015; Smith et al., 2015; Chu et al., 2016; Davison et al., 2019). In terms of total water flux, more than 98% is thought to occur as efficient drainage with short transit times (on the order of hours to days) in the Leverett Glacier catchment (Linhoff et al., 2017) and this is likely to be similar for the whole Watson River catchment.
For this study, a number of water samples were collected between August 19–27, 2014 (Table 1) during the late melt season. One set of samples was collected from small marginal glacial streams draining the southern edge of the Isunnguata Sermia glacier and ultimately flowing past the Russell Glacier to join with the Akuliarusiarsuup Kuua (AK) River fed by the Rusell and Leverett Glaciers. Further downstream, the Qinnguata Kuussua (QK) River draining the Ørkendalen and Isorlersuup Glaciers joins AK to form the Watson River. Another set of samples was collected from AK, QK, and Watson rivers in the vicinity of Kangerlussuaq settlement (Figure 1).
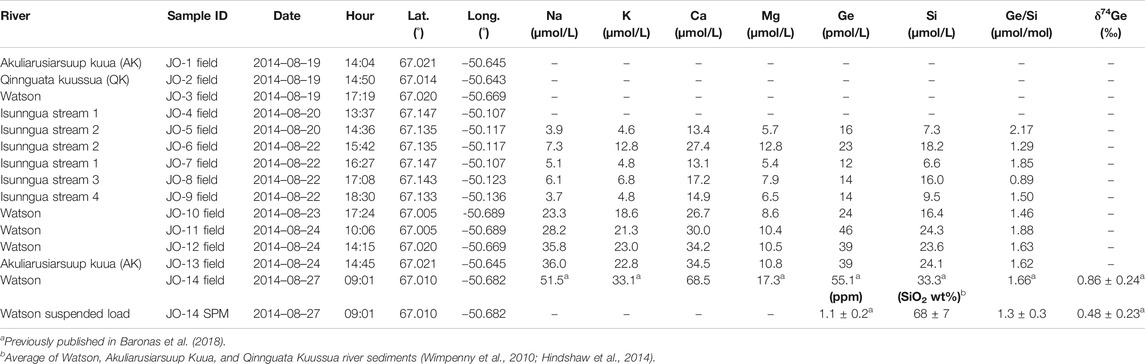
TABLE 1. Details and solute composition of field-filtered west Greenland stream samples.
The samples were collected into HDPE plastic bottles, pre-cleaned using 10%
2.2 River Sediment Weathering Experiment
To assess how dissolved stream chemistry evolves over longer water-sediment interaction timescales, unfiltered river and stream sample aliquots were allowed to continue reacting in the laboratory for up to 470 or 785 days. The unfiltered samples were left in the original sample bottles and placed on a shaker table inside a temperature-controlled incubator. The experimental setup was not designed to simulate subglacial weathering conditions because it was done in an oxygenated environment and the rock/water ratio in rivers is considerably lower than in the subglacial environment. Instead, the goal of the experiment was to determine how solution composition evolves with the continued dissolution of phases present in the riverine sediment (and the potential precipitation of any secondary phases). Therefore, in order to increase reaction rates, the temperature was set to 25°C. The samples were continually agitated to keep the sediment suspended, and left in the dark. No magnetic stir bars were used, eliminating the possibility of physical grinding during the experiment. Periodically, 4–10 ml aliquots were sub-sampled from each bottle and filtered using 0.2 μm PES syringe filters (Millipore). At the end of the experiment, two ∼500 ml samples were filtered for Ge isotope analyses. For several of the samples, suspended sediment concentrations were determined by weighing the dry sediment retained on the filters.
2.3 Major and Trace Element Analyses
Both field and experimental water samples were acidified with trace grade HNO3 several weeks prior to chemical analyses. Major cation concentrations were measured using Agilent 4100 MP-AES at USC and Agilent 5100 ICP-AES at the University of Cambridge. Si concentration measurements were done using molybdate blue colorimetry (Mullin and Riley, 1955) at USC. Ge concentrations were measured using isotope dilution-hydride generation-ICP-MS on a Thermo Element 2 at USC, following the method developed by Mortlock and Froelich (1996), as modified by Baronas et al. (2016). Trace metal concentrations were measured using ICP-MS (Thermo Element 2) and ICP-AES. Measurement accuracy was determined through repeated analyses of standard reference materials SLRS-6, ION-915, and TMDA-51.4, which agreed within 10% of certified values for all elements, and with a precision of 5% for major elements, 5% for Ge and Si, 10% for Mn, and 20% or 0.2 µmol/L, whichever was higher, for Fe and Al. The propagated uncertainty of measured Ge/Si ratios is around 7%.
2.4 Thermodynamic Calculations
The saturation indices of common mineral and amorphous phases were calculated using the PHREEQC 3.6.2 software (Parkhurst and Appelo, 2013) for a number of sample solutions throughout the course of the weathering experiment. Because pH was not measured in the experimental solutions, we did three sets of calculations by assuming pH = 7, 8, and 9, respectively, bracketing the range of pH values measured in the Leverett Glacier outflow and Watson River previously (Wimpenny et al., 2010; Hatton et al., 2019a). Although
2.5 Ge Isotope Analyses
Ge isotope composition was measured using hydride generation-multi-collector-ICP-MS (Thermo Neptune) at Ifremer, as previously described in detail by Baronas et al. (2018); Baronas et al. (2019). The sample preparation and analytical procedure is briefly summarized below. The dissolved and suspended sediment Ge isotope composition of the “JO-14” sample was previously published by Baronas et al. (2018).
Ge Co-precipitation
The samples “JO-14 Field” (filtered two days after collection), “JO-2 Final”, and “JO-3A Final” (filtered after reacting for 470 days in the lab) containing 19, 1.5, and 1.9 ng of Ge, respectively, were processed as follows. The filtered and acidified aliquots were spiked with a Ge isotope double spike [
Anion-Exchange Chromatographic Separation
A procedure adapted from Rouxel et al. (2006) was used. All reagents used were either in-house Teflon-distilled or Optima-grade. A 10 ml column was loaded with 1.8 ml (wet volume) of BioRad AG1-X8 resin, washed with 10 ml of 3M HNO3, 0.28M HNO3, and DDIW in sequence, and conditioned with 5 ml 1M HF. Samples in 1M HF solution as prepared above were centrifuged to separate insoluble fluorides. The presence or amount of insoluble fluorides at this stage did not appear to affect the final Ge recovery. After centrifugation, 10–29 ml of solution was carefully added to columns. The remaining matrix was eluted with 5 ml of 1M HF followed by 3 ml of DDIW, leaving fluorinated Ge retained on the column. Ge was then eluted with 10 ml 0.28M HNO3. If needed, the solution was dried down and redissolved in a smaller volume of 0.28M HNO3 to obtain the 2–10 ppb Ge concentration required for isotope measurements.
HG-MC-ICP-MS
Ge isotope analyses were performed on a Thermo Neptune multi-collector ICP-MS at IFREMER using a method adapted from Rouxel et al. (2006) and Escoube et al. (2015). Sample solutions of 2–10 ppb natural Ge in 0.28M HNO3 were introduced into an online hydride generation system (CETAC HGX-200) at a rate of 150 μl/min where they were mixed with 0.25M NaBH4 solution (in 1.5M NaOH) introduced at an equal rate. The dissolved Ge(OH)4 species was reduced to gaseous GeH4 and transported into the ICP-MS torch using Ar carrier gas. The Neptune MC-ICP-MS was operated in low mass resolution mode, measuring
3 Results
3.1 Glacial Stream Chemistry
The measured major cation concentrations were low in all sampled streams (Table 1), in agreement with previous data collected at the end of the melt season in late August (Hindshaw et al., 2014; Andrews et al., 2018; Andrews and Jacobson, 2018; Hatton et al., 2019a). In particular, there was a clear distinction between the small Isunngua streams draining the edge of Isunnguata Sermia glacier, where Na and K concentrations ranged between 4–13 µmol/L, and the large rivers draining the Leverett-Russell glaciers, with Na and K ranging between 19–36 µmol/L (Table 1). Ca and Mg concentrations were more similar between the two localities, with 6–13 µmol/L Mg and 13–35 µmol/L Ca. Dissolved Ge and Si concentrations ranged between 12–46 pmol/L and 7–24 µmol/L, respectively, resulting in Ge/Si ratios of 0.9–2.2 µmol/mol (for comparison, global riverine average is 0.54 ± 0.10 µmol/mol; Froelich et al. (1992)). The Ge concentration in the large (Watson and Akuliarusiarsuup Kuua) rivers was twice that in the small Isunngua streams (avg. ± 2 s.d.: 37 ± 18 and 16 ± 9 µmol/mol, respectively). The large Watson River sample filtered 2 days after collection (JO-14) had slightly higher concentrations of all dissolved elements, which may reflect either some solute addition from sediments before filtration or a natural evolution toward higher concentrations at the end of the melt season since this sample was collected last, three days after the preceding Watson River sample.
3.2 Experimental Weathering
There are two potential complicating factors that are important to address. First, the solutions were not poisoned and it is therefore possible that some microbial growth took place during the two years of the experiment. However, the experiments were carried out in the dark, preventing the growth of any photosynthetic organisms. No change in sample appearance or odor was detected in any of the bottles during the experiment and we thus infer that any microbial growth in the experimental solutions was limited.
Second, the solution volume changed during the experiments due to sampling and potentially some evaporation. In total, sampling removed between 5 and 20% of the total initial solution volume by the end of the experiment. However, care was taken to subsample each solution with the sediment fully suspended, therefore keeping the sediment/water ratio constant. Based on the pre- and post-experiment volumes and taking into account the total subsampled volume, water mass balance was preserved within ±10–20%, with no systematic loss of water among the different samples. Finally, because the Isunngua stream samples had very low suspended sediment concentrations, they can effectively serve as control for any evaporative pre-concentration. The constant concentrations of conservative major cations in these samples therefore also indicate the lack of any evaporative water loss (see below).
During the lab experiment, some solute concentrations in the unfiltered stream samples continued to increase over the course of more than two years (Figure 2; Tables 2, 3). Again, there was a clear distinction between the main river (AK, QK, and Watson) and the small Isunngua stream samples. For the main rivers, Na, K, and Mg concentrations increased slightly, by less than
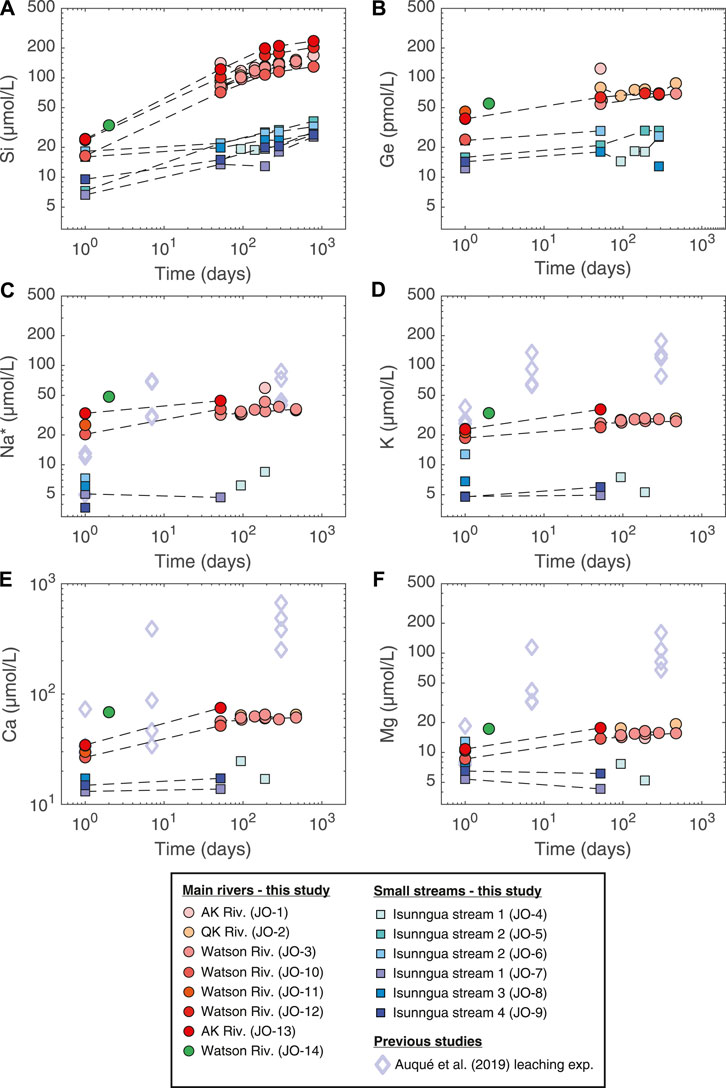
FIGURE 2. Evolution of dissolved element concentrations during the course of the lab weathering experiment. Also shown are the results of Auqué et al. (2019), where Isunngua moraine till was leached using deionized water for up to 1 year but at a much higher sediment/water ratio equivalent to ∼600 g/L suspended sediment concentration. Na* refers to Na concentrations corrected for cyclic salt inputs (Na* = Na–0.85
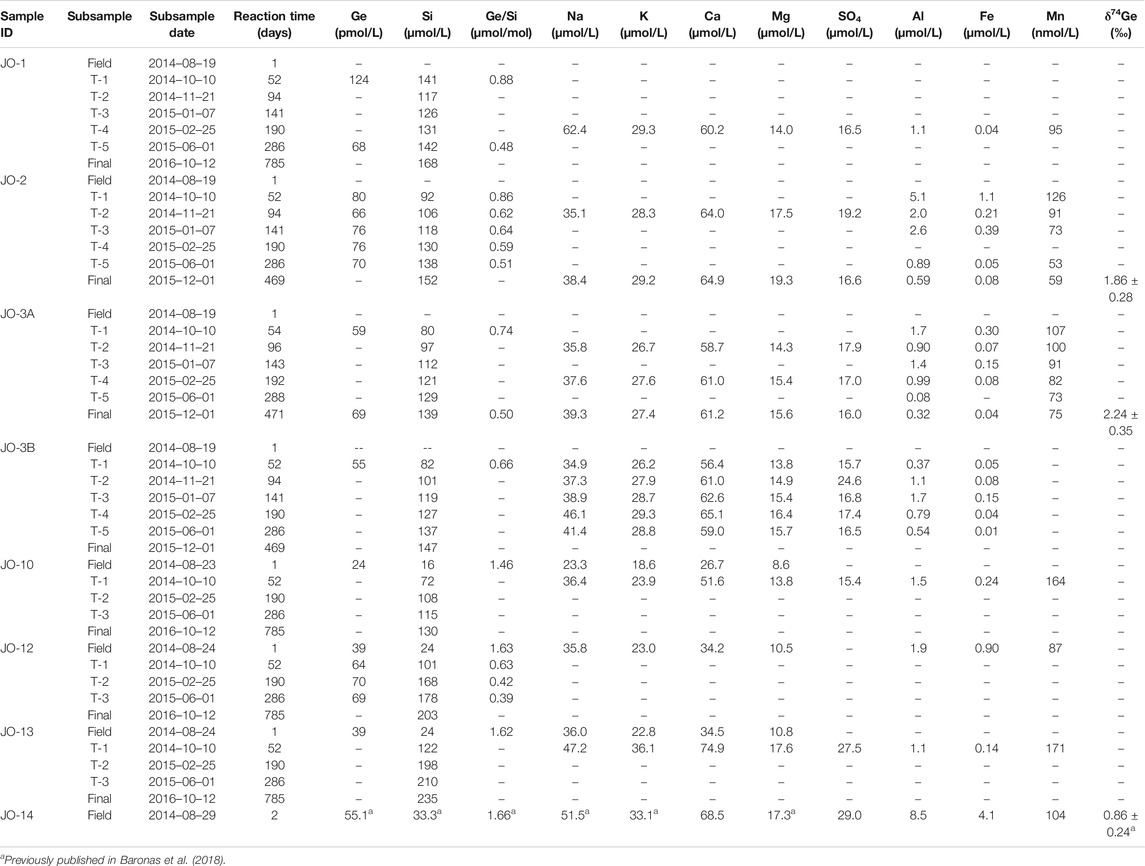
TABLE 2. River sediment weathering experiment data: main rivers (Akuliarusiarsuup Kuua (AK), Qinnguata Kuussua (QK), and Watson Rivers).
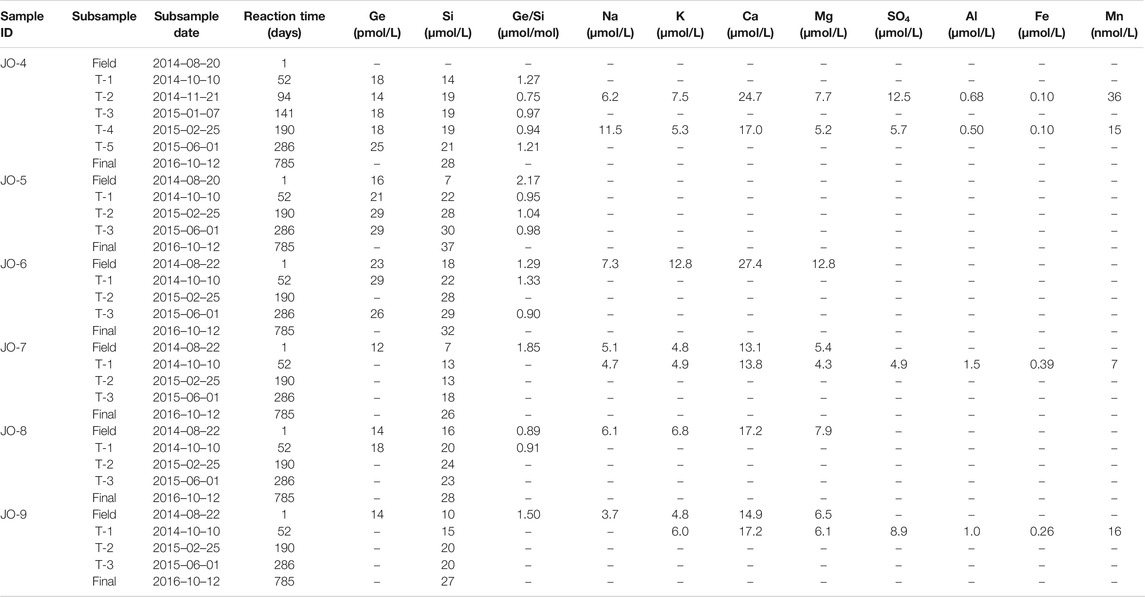
TABLE 3. River sediment weathering experiment data: small Isunngua streams.
Fe and Al concentrations in the main river samples showed a consistent decrease toward the end of the experiment, from ∼12 to below 0.1–0.2 µmol/L (Figures 3A,B). Similarly, Mn concentrations decreased from ∼100 to 60−70 nmol/L (Figure 3C). Although there are only a few data points available, Fe and Al concentrations in the Isunngua stream experiments appear similar to the main rivers, while Mn concentrations were much lower, ranging between 7–36 nmol/L after 50–190 days of reaction.
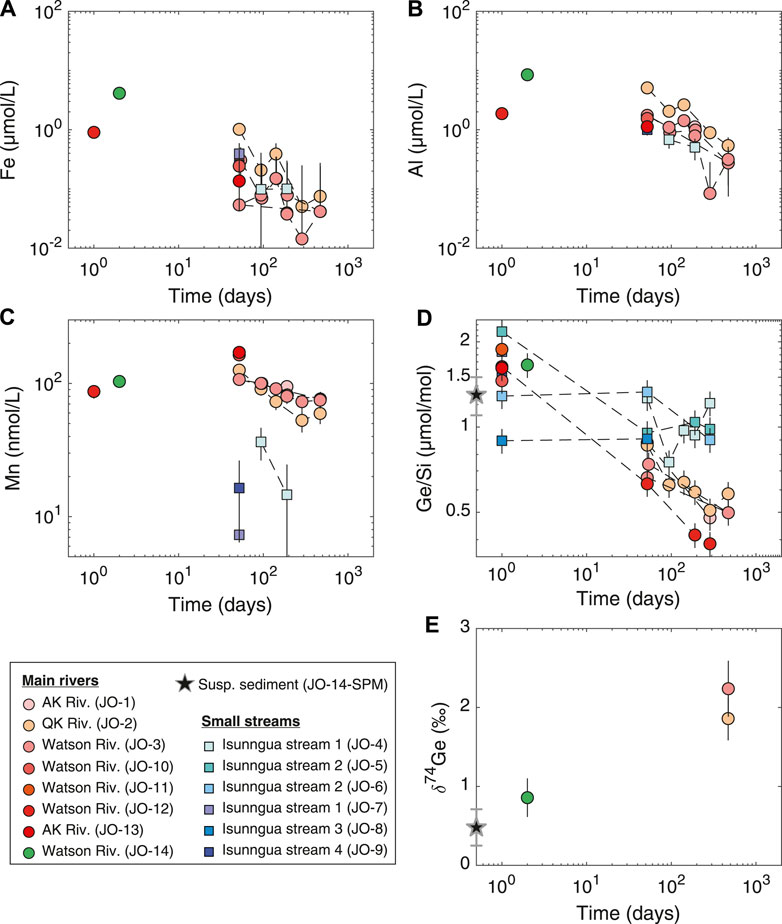
FIGURE 3. Evolution of dissolved trace element concentrations, Ge/Si, and Ge isotope ratios during the course of lab weathering experiment. The Ge/Si and Ge isotope composition of the suspended sediment is shown as a black star at Time
For the main rivers, Ge/Si ratios decreased significantly, from initial values of 1.5–1.9 to 0.4–0.6 µmol/mol by the end of the experiment (Figure 3D). In contrast, Isunngua stream Ge/Si remained relatively stable around 0.9–1.5
Due to the low Ge concentrations,
3.3 Suspended Sediment Concentrations
Suspended sediment concentrations determined for three main river samples (JO-1, JO-12, and JO-13) at the end of the experiment were 0.6, 1.3, and 2.0 g/L, respectively, which is within the range of values previously measured (Wimpenny et al., 2010; Hindshaw et al., 2014; Hatton et al., 2019a). Suspended sediment concentrations were too low to reliably measure for any of the Isunngua streams and are estimated to be below 0.1 g/L.
4 Discussion
4.1 Field Signatures
The chemical composition of the AK, QK, and Watson rivers, as well as of the Isunngua streams at similar locations to those sampled here, has been previously studied in detail by a number of researchers (e.g., Wimpenny et al., 2010, Wimpenny et al., 2011; Graly et al., 2014; Hindshaw et al., 2014, Hindshaw et al., 2019; Yde et al., 2014; Andrews and Jacobson, 2018; Hatton et al., 2019a). In general, the majority of weathering reactions are thought to occur in the subglacial environment, characterized by a large reactive mineral surface area due to glacial comminution and relatively short (but seasonally variable) water transit times, similar to many other glacial systems (Tranter and Wadham, 2014). More specifically, during the early melt season (May-June) the Leverett Glacier outlet appears to primarily drain distributed pockets of subglacial fluids which had been previously stored for months or longer (Chu et al., 2016) and thus exhibit relatively high solute concentrations (Bartholomew et al., 2011; Hindshaw et al., 2014; Hatton et al., 2019a). As melting and discharge increases through July-August, subglacial channels become established and connected, resulting in the efficient discharge of meltwater, which has only hours or days to interact with the subglacial bed (Chandler et al., 2013; Cowton et al., 2013; Lindbäck et al., 2015).
The lower concentrations of the small Isunngua streams draining the southern edge of Isunnguata Sermia can be readily explained by their smaller drainage basin and stream power, compared to the main rivers. The larger Watson River catchment area can extend over ∼ 12,000 km2 under the Greenland Ice Sheet, with 1,000–2,000 m3/s peak discharge (e.g., Lindbäck et al., 2015; Van As et al., 2017). In contrast, the Isunngua streams drain only 30–50 km2 of the southern Isunnguata Sermia margin, with 10–20 m3/s peak discharge (Rennermalm et al., 2013; Lindbäck et al., 2015), as most of the drainage from this glacier takes places through the Isortoq River, the main outlet to the west. The small marginal streams sampled here thus appear to discharge meltwater that had very little interaction with glacial till.
Sampled during the late melt season at the end of August, the AK, QK, and Watson rivers in this study primarily reflect the “efficient drainage,” short water transit type fluids, as indicated by the low solute concentrations (Table 1). Once dissolved Na is corrected for cyclic salt inputs (see above), and assuming there is not significant Na supply from cation exchange with marine sedimentary rocks (Tipper et al., 2021), it can be assumed to come exclusively from the weathering of bedrock silicate minerals. Then, element-to-Na ratios can be used to assess the dissolution of different silicate and trace minerals and the precipitation of secondary phases (Figure 4). As noted in previous studies, the dissolved composition of the streams draining the Leverett and Russell glaciers is for the most part consistent with the dissolution of dominant gneissic bedrock minerals, such as plagioclase, K-feldspar, and hornblende, with some additional contribution of Ca from either trace carbonates or Ca-rich silicates [Figure 4B; Wimpenny et al. (2011); Hindshaw et al. (2014); Hindshaw et al. (2019)]. However, there is a significant non-stoichiometric enrichment in dissolved K (Figure 4C), consistent with the previously proposed preferential leaching of glacially ground biotite in the Leverett catchment (Andrews and Jacobson, 2018; Auqué et al., 2019; Hindshaw et al., 2019). Since biotite and other micas typically exhibit higher Ge/Si ratios than other silicates (Mortlock and Froelich, 1987; Filippelli et al., 2000; Kurtz et al., 2002), their preferential weathering could result in elevated Ge/Si of the dissolved phase, as proposed previously for glacial streams in Alaska (Anders et al., 2003). However, there is no indication of this when the dissolved and the suspended sediment Ge/Si ratios are compared (Figure 4F), suggesting congruent weathering of silicates with regards to Ge/Si during weathering under the Greenland Ice Sheet.
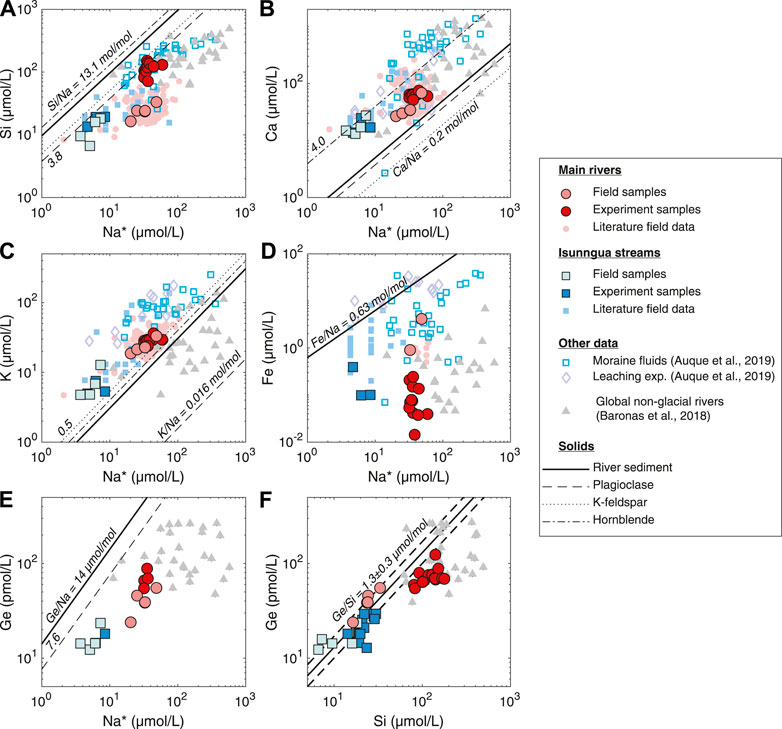
FIGURE 4. Solute signatures of streams and dominant bedload minerals in southwest Greenland compared to experimental solutions and global rivers. Main (Akuliarusiarsuup Kuua, Qinnguata Kuussua, and Watson) river and Isunngua stream literature data from Wimpenny et al. (2010); Hindshaw et al. (2014); Andrews et al. (2018); Andrews and Jacobson (2018); Deuerling et al. (2019); Hatton et al. (2019a). River sediment and individual mineral compositions from Wimpenny et al. (2010) and Hindshaw et al. (2014), respectively. Na* refers to Na concentrations corrected for cyclic salt inputs (Na* = Na–0.85 ⋅ Cl). The solid and dashed lines in (F) show the Ge/Si and 2 S.D. uncertainty, respectively, of the Watson River suspended sediment, calculated from Ge concentration measured in this study and previously measured Si concentrations (Table 1).
In contrast to the major cations, we observed substantial depletion of dissolved Si and Fe in the field samples (Figures 4A,D), consistent with the subglacial precipitation of aSi (Hawkings et al., 2017; Hatton et al., 2019a; Urra et al., 2019) and Fe oxyhydroxide phases (Wimpenny et al., 2010; Hindshaw et al., 2014; Aciego et al., 2015; Stevenson et al., 2017; Auqué et al., 2019; Hawkings et al., 2020). Similarly to Si/Na*, Ge/Na* indicates Ge depletion, requiring uptake by secondary phases (Figure 4E). Again, the agreement between the solid and dissolved Ge/Si suggests that any uptake of these elements into secondary phases during subglacial weathering is likely congruent. This makes it unlikely that Si and Ge are taken up by aluminosilicate clays or Fe oxyhydroxides, which are known to lower Ge/Si in non-glacial streams (Froelich et al., 1992; Baronas et al., 2018). The phase removing Si and Ge from solution during initial subglacial weathering is thus most likely to be amorphous silica (aSi), which has been shown to control Si isotope dynamics under the Leverett Glacier and to represent the majority of Si exported from this watershed (Hawkings et al., 2018; Hatton et al., 2019a).
Although the subglacial formation mechanism of aSi is unknown, it likely involves either leaching or localized supersaturation at the surface of glacial till particles (Hawkings et al., 2017; Hatton et al., 2019b) which may be aided or even induced by freezing (Dietzel, 2005; Woronko and Hoch, 2011; Pokrovsky et al., 2013; Oelze et al., 2015; Alfredsson et al., 2016). Possibly as a result of its unique formation mechanism, subglacial aSi has shown much weaker
4.2 Experimental Weathering of Glacial River Sediments
The experimental setup did not aim to represent either the subglacial weathering environment (since riverine rock/water ratio is much lower), or the marine environment where the sediments are ultimately exported and deposited. Instead, the experiments offered a way to directly observe Ge/Si and
Importantly, by using aliquots of unfiltered river water, we allow continuity between the field-filtered and experimental samples and ensure that the dissolved composition of the dilute solutions is not dominated by cation exchange reactions or other artifacts associated with reacting lab-dried sediments with pure deionized water. This approach is distinct from previous weathering experiments of glacial till, which were designed to specifically simulate subglacial processes (Brown et al., 1996; Hodgkins et al., 1998; Brown et al., 2001; Auqué et al., 2019).
A direct comparison can be made with the results of the experiment performed by Auqué et al. (2019), who reacted deionized water with air-dried till collected from a moraine north of the Russell Glacier for up to 305 days at 5.5°C. Another key difference is the much higher sediment/water ratio in their experiment (570 g/L) compared to ours (<0.1–2.0 g/L). Despite the lower temperature, their cation release rates were much higher compared to ours, especially for Ca and Mg (Figure 2). This difference is most easily explained by the much higher sediment/water ratio and the rapid dissolution of secondary calcite and gypsum present in the moraine till (Auqué et al., 2019). The rapid cation exchange of dried sediments with deionized water is also likely to play a role during the early stage. Unfortunately, there were no dissolved Si or Ge concentrations reported for the Auqué et al. (2019) experiment, and we are therefore unable to assess how their different experimental parameters would influence the release of these elements.
4.2.1 Inferred Dissolution Reactions
In the absence of evaporation and biological effects, the evolution of solute concentrations during our weathering experiments (Figures 2, 3) should reflect the net effect of the dissolution and precipitation of a range of solid phases. Given the difference in physical conditions (higher temperature, access to oxygen, and longer water-rock interaction times, see Section 4.3) the dissolution-precipitation reactions during the experiment are likely to differ from those during subglacial weathering. Both the main river and the Isunngua stream samples started out enriched in K/Na* (and slightly in Ca/Na*) relative to the various solid phases (see discussion of field samples above). Throughout the experiment, the solute concentrations (incl. Na*) and ratios of the Isunngua samples remained relatively constant, which is not surprising given their very low SPM concentrations.
In the main river samples, an increase in Na* and K indicated the dissolution of a small amount of silicates, such as plagioclase (saturation index (SI) of −3.8 to −5.7) and K-feldspar (SI of −1.5 to −2.7), both dominant in the local bedrock (Hindshaw et al., 2014). The dissolved Ca/Na* increased slightly from around 1.1–1.6 mol/mol (Figure 4B), perhaps reflecting the dissolution of a small amount of trace calcite or garnet (Hindshaw et al., 2019). In contrast, K/Na* remained constant within uncertainty around 0.7 mol/mol (Figure 4C), which suggests negligible dissolution of biotite, consistent with a K-mica SI of 2.2–6.7.
Importantly, Si/Na* shows the largest change in the case of main river (AK, QK, and Watson) samples, increasing from values significantly below the mineral ratios at the beginning and approaching the mineral Si/Na by the end of the experiment (Figure 4A). Crucially, the increase in dissolved Si/Na* ratio varied between 4 and 33 mol/mol, often significantly higher than 4–5 mol/mol of the dominant orthogneiss rock, corrected for relatively unreactive quartz (Hindshaw et al., 2014). The excess Si added to solution is almost certainly due to the dissolution of highly reactive amorphous silica (undersaturated, SI = −1.1 to −1.6) previously formed in the subglacial environment (Hawkings et al., 2017; Hatton et al., 2019b). It was shown by Hatton et al. (2019a) that aSi is present in concentrations of up to 300 µmol/L in Leverett Glacier outflow and strongly impacts its dissolved Si dynamics, with an increased dissolution of aSi during mid-melt season in late June-July when subglacial waters with the longest residence times are being discharged. Over the duration of our experiment (470 or 785 days, depending on the sample), dissolved Si concentrations in main river samples increased by 113–235 µmol/L. For samples where suspended sediment concentrations were measured, this translated to a dissolution of 0.6–1.4 wt%
Calculating the observed Si release rate during the experiment can potentially help further distinguish between the dissolution of aSi and primary silicate minerals. By assuming a sediment surface area typical of glacial till sediments [0.5–5 m2/g, from Brantley et al. (1999)], we calculate Si dissolution rates in the range of
4.2.2 Ge/Si and Ge Isotope Ratio Evolution During the Experiment
There are two possible main interpretations of the evolution of dissolved Ge/Si and
4.2.3 Inferred Secondary Reactions and Ge Isotope Fractionation
Although it is difficult to discern whether any secondary phases precipitated during the weathering experiment, the decrease in Fe, Al, and Mn concentrations suggest that trace metals were scavenged from the solution, whether by precipitation of amorphous oxides, secondary clays, or by adsorption onto already present mineral surfaces. The amorphous
Dissolved
(1) The initial Ge and Si concentrations in the solution (i.e., in supraglacial melt water before rock-water contact) were negligible. The dissolved Ge and Si in the initial unfiltered river water samples (at t = 1 day) used in the experiment were therefore taken to be derived from subglacial rock-water interaction that took place before sample collection.
(2) A negligible portion of Si released via the dissolution of aSi (or silicates) during the experiment was removed from solution by co-precipitation with secondary phases. This is reasonable, given the low dissolved Al and Fe concentrations compared with Si (Figure 3).
(3) Mineral dissolution released Ge into solution with a
(4) The difference between measured Ge concentrations at the end of the experiment and those expected from aSi (or silicate) dissolution reflects the amount of Ge removed by secondary phase uptake (e.g., via incorporation into Fe oxyhydroxides). The fraction of Ge remaining in solution can then be calculated as:
where
The increase in
where
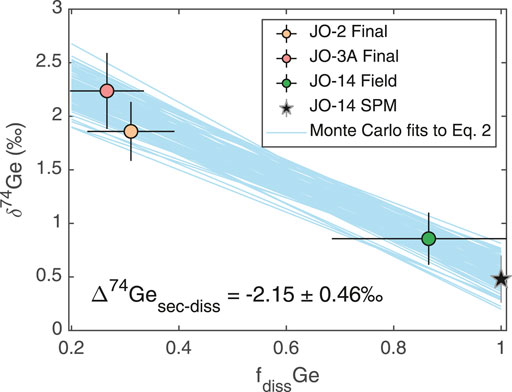
FIGURE 5. Dissolved
4.3 Implications for Ge Isotope Behavior During Subglacial and Non-glacial Weathering
As discussed above, subglacial weathering results in less pronounced Ge uptake by secondary phases (although this may be masked to some degree by the incongruent weathering of Ge-rich silicate phases) and little to no fractionation of Ge isotopes, in contrast to the clear fractionation of both Ge/Si and
While the role that water transit times play in the dynamics of chemical weathering is poorly understood, it has very important implications for our understanding of the relationship between weathering and climate (e.g., Maher and Chamberlain, 2014; Li, 2019; Torres and Baronas, 2021). Therefore, the possibility that dissolved
An important caveat is that potential seasonal and spatial variations in
4.4 Implications for Amorphous Si Bioavailability
Our experimental results add to the growing evidence that the flux of amorphous Si from glacial landscapes is several times higher than that of dissolved silica (Hawkings et al., 2017, Hawkings et al., 2018; Hatton et al., 2019a; Hatton et al., 2019b). Importantly, the high Si release rates observed during our experiments under ambient 25°C temperature and circum-neutral pH conditions (see Section 4.2.1 and Figure 2) indicate that this aSi is highly labile and thus likely an important source of dissolved silica in the offshore marine environment. Given the lower temperature but the higher ionic activity of seawater, aSi dissolution rates offshore are expected to be similar to our experiments (Kato and Kitano, 1968; Icenhower and Dove, 2000; Dove et al., 2008; Rimstidt et al., 2016). Our results therefore fully support the similar experimental data of Hawkings et al. (2017), as well as their prediction that aSi dissolution is a major source of dissolved Si in the Watson River estuary. Given that dissolved Si is an important nutrient for diatom growth in the region, the export of highly soluble aSi (along with other nutrients) by Greenland runoff is likely to play an important role as the offshore productivity and ecosystem dynamics shift with changing climate (Lawson et al., 2014; Hawkings et al., 2015; Tremblay et al., 2015; Arrigo et al., 2017; Hendry et al., 2019).
4.5 Implications for the Interpretation of Paleorecords
Lastly, our results suggest that
Importantly, evidence to date suggests limited biological fractionation of
5 Conclusion
This study investigated Ge/Si and
We propose that a significant portion of Ge is incorporated into subglacially formed amorphous silica (aSi), resulting in minimal Ge/Si and
Data Availability Statement
The original contributions presented in the study are included in the article/Supplementary Material, further inquiries can be directed to the corresponding author.
Author Contributions
JB designed the study. DH and LS obtained the funding. MB and LP collected the samples. JB and OR performed Ge isotope analyses. JB performed the experiments and modeling and wrote the article, with input from all co-authors.
Funding
Fieldwork was supported by NASA Cryosphere Program Grants NNX14AH93G and 80NSSC19K0942 to LS, managed by Thomas P. Wagner, Colene Haffke, and Thorsten Markus. Laboratory and analytical work was supported by United States NSF grants OCE 1061700 and 1260692 to DH. JB was also supported by an InterRidge research fellowship and a John Montagne Award from GSA Quaternary Geology and Geomorphology Division. Support to OR was provided by the Institut Carnot Ifremer EDROME and the LabexMer ANR-10-LABX-19–01.
Conflict of Interest
The authors declare that the research was conducted in the absence of any commercial or financial relationships that could be construed as a potential conflict of interest.
Supplementary Material
The Supplementary Material for this article can be found online at: https://www.frontiersin.org/articles/10.3389/feart.2021.551900/full#supplementary-material.
Acknowledgments
Field, logistics, and cargo support was provided by Polar Field Services. Josh West is thanked for allowing the experiment to continuously run and take up space in his incubator for 2 years. Yi Hou is thanked for help with Si concentration analyses at USC and Ed Tipper for support with ICP-AES analyses in Cambridge. We thank the reviewers for constructive comments that helped improve the manuscript.
References
Aciego, S. M., Stevenson, E. I., and Arendt, C. A. (2015). Climate vs. geological controls on glacial meltwater micronutrient production in southern Greenland. Earth Planet. Sci. Lett. 424, 51–58. doi:10.1016/j.epsl.2015.05.017
Alfredsson, H., Clymans, W., Hugelius, G., Kuhry, P., and Conley, D. J. (2016). Estimated storage of amorphous silica in soils of the circum‐Arctic tundra region. Global Biogeochem. Cycles 30, 479–500. doi:10.1002/2015GB005344
Anders, A. M., Sletten, R., Derry, L., and Hallet, B. (2003). Germanium/silicon ratios in the Copper River Basin, Alaska: weathering and partitioning in periglacial vs. glacial environments. J. Geophys. Res. 108, 6005. doi:10.1029/2003JF000026
Anderson, S. P. (2007). Biogeochemistry of glacial landscape systems. Annu. Rev. Earth Planet. Sci. 35, 375–399. doi:10.1146/annurev.earth.35.031306.140033
Anderson, S. P., Drever, J. I., and Humphrey, N. F. (1997). Chemical weathering in glacial environments. Geology 25, 399. doi:10.1130/0091-7613(1997)025¡0399:CWIGE¿2.3.CO;2
Andrews, M. G., and Jacobson, A. D. (2018). Controls on the solute geochemistry of subglacial discharge from the Russell Glacier, Greenland Ice Sheet determined by radiogenic and stable Sr isotope ratios. Geochim. Cosmochim. Acta 239, 312–329. doi:10.1016/j.gca.2018.08.004
Andrews, M. G., Jacobson, A. D., Osburn, M. R., and Flynn, T. M. (2018). Dissolved carbon dynamics in meltwaters from the Russell Glacier, Greenland ice sheet. J. Geophys. Res. 123, 2922–2940. doi:10.1029/2018JG004458
Arrigo, K. R., van Dijken, G. L., Castelao, R. M., Luo, H., Rennermalm, A. K., Tedesco, M., et al. (2017). Melting glaciers stimulate large summer phytoplankton blooms in southwest Greenland waters. Geophys. Res. Lett. 44, 6278–6285. doi:10.1002/2017GL073583
Auqué, L. F., Puigdomenech, I., Tullborg, E. L., Gimeno, M. J., Grodzinsky, K., and Hogmalm, K. J. (2019). Chemical weathering in a moraine at the ice sheet margin at Kangerlussuaq, western Greenland. Arct. Antarct. Alp. Res. 51, 440–459. doi:10.1080/15230430.2019.1660125
Baronas, J. J., Hammond, D. E., Berelson, W. M., McManus, J., and Severmann, S. (2016). Germanium-silicon fractionation in a river-influenced continental margin: the Northern Gulf of Mexico. Geochim. Cosmochim. Acta 178, 124–142. doi:10.1016/j.gca.2016.01.028
Baronas, J. J., Hammond, D. E., McManus, J., Wheat, C. G., and Siebert, C. (2017). A global Ge isotope budget. Geochim. Cosmochim. Acta 203, 265–283. doi:10.1016/j.gca.2017.01.008
Baronas, J. J., Hammond, D. E., Rouxel, O. J., and Monteverde, D. R. (2019). A first look at dissolved Ge isotopes in marine sediments. Front. Earth Sci. 7, 1–17. doi:10.3389/feart.2019.00162
Baronas, J. J., Torres, M. A., West, A. J., Rouxel, O. J., Georg, R. B., Bouchez, J., et al. (2018). Ge and Si isotope signatures in rivers: a quantitative multi-proxy approach. Earth Planet. Sci. Lett. 503, 194–215. doi:10.1016/j.epsl.2018.09.022
Baronas, J. J., West, A. J., Burton, K. W., Hammond, D. E., Opfergelt, S., Pogge von Strandmann, P. A. E., et al. (2020). Ge and Si isotope behavior during intense tropical weathering and ecosystem cycling. Global Biogeochem. Cycles 34. e2019GB006522. doi:10.1029/2019GB006522
Bartholomew, I., Nienow, P., Sole, A., Mair, D., Cowton, T., Palmer, S., et al. (2011). Supraglacial forcing of subglacial drainage in the ablation zone of the Greenland ice sheet. Geophys. Res. Lett. 38, 1–5. doi:10.1029/2011GL047063
Bernstein, L. (1985). Germanium geochemistry and mineralogy. Geochim. Cosmochim. Acta 49, 2409–2422. doi:10.1016/0016-7037(85)90241-8
Bernstein, L. R., and Waychunas, G. A. (1987). Germanium crystal chemistry in hematite and goethite from the Apex Mine, Utah, and some new data on germanium in aqueous solution and in stottite. Geochim. Cosmochim. Acta 51, 623–630. doi:10.1016/0016-7037(87)90074-3
Brantley, S. L., White, A. F., and Hodson, M. E. (1999). “Surface area of primary silicate minerals,” in Growth, Dissolution and Pattern Formation in Geosystems. Dordrecht: Springer, 291–326.
Brantley, S., and Olsen, A. (2014). “Reaction kinetics of primary rock-forming minerals under ambient conditions,” in Treatise on Geochemistry. 2nd Edn. Elsevier, 7, 69–113.
Brown, G. H. (2002). Glacier meltwater hydrochemistry. Appl. Geochem. 17, 855–883. doi:10.1016/S0883-2927(01)00123-8
Brown, G. H., Hubbard, B., and Seagren, A. G. (2001). Kinetics of solute acquisition from the dissolution of suspended sediment in subglacial channels. Hydrol. Process. 15, 3487–3497. doi:10.1002/hyp.1039
Brown, G. H., Tranter, M., and Sharp, M. J. (1996). Experimental investigations of the weathering of suspended sediment by alpine glacial meltwater. Hydrol. Process. 10, 579–597. doi:10.1002/(SICI)1099-1085(199604)10:4<579::AID-HYP393>3.0.CO;2-D
Burton, J., Culkin, F., and Riley, J. (1959). The abundances of gallium and germanium in terrestrial materials. Geochim. Cosmochim. Acta 16, 151–180. doi:10.1016/0016-7037(59)90052-3
Chandler, D. M., Wadham, J. L., Lis, G. P., Cowton, T., Sole, A., Bartholomew, I., et al. (2013). Evolution of the subglacial drainage system beneath the Greenland Ice Sheet revealed by tracers. Nat. Geosci. 6, 195–198. doi:10.1038/ngeo1737
Chillrud, S. N., Pedrozo, F., Temporetti, P., Planas, H., and Froelich, P. (1994). Chemical weathering of phosphate and germanium in glacial meltwater streams: effects of subglacial pyrite oxidation. Limnol. Oceanogr. 39, 1130–1140. doi:10.4319/lo.1994.39.5.1130
Chu, W., Schroeder, D. M., Seroussi, H., Creyts, T. T., Palmer, S. J., and Bell, R. E. (2016). Extensive winter subglacial water storage beneath the Greenland Ice Sheet. Geophys. Res. Lett. 43, 484–512. doi:10.1002/2016GL071538
Cornelis, J.-T., Delvaux, B., Georg, R., Lucas, Y., Ranger, J., and Opfergelt, S. (2011). Tracing the origin of dissolved silicon transferred from various soil-plant systems towards rivers: a review. Biogeosciences 8, 89–112. doi:10.5194/bg-8-89-2011
Cowton, T., Nienow, P., Sole, A., Wadham, J., Lis, G., Bartholomew, I., et al. (2013). Evolution of drainage system morphology at a land-terminating Greenlandic outlet glacier. J. Geophys. Res. Earth Surf. 118, 29–41. doi:10.1029/2012JF002540
Crompton, J. W., Flowers, G. E., Kirste, D., Hagedorn, B., and Sharp, M. J. (2015). Clay mineral precipitation and low silica in glacier meltwaters explored through reaction-path modelling. J. Glaciol. 61, 1061–1078. doi:10.3189/2015JoG15J051
Davison, B. J., Sole, A. J., Livingstone, S. J., Cowton, T. R., and Nienow, P. W. (2019). The influence of hydrology on the dynamics of land-terminating sectors of the Greenland ice sheet. Front. Earth Sci. 7, 1–24. doi:10.3389/feart.2019.00010
De La Rocha, C., Brzezinski, M., DeNiro, M., and Shemesh, A. (1998). Silicon-isotope composition of diatoms as an indicator of past oceanic change. Nature 395, 680–683.
Delvigne, C., Cardinal, D., Hofmann, A., and André, L. (2012). Stratigraphic changes of Ge/Si, REE+Y and silicon isotopes as insights into the deposition of a Mesoarchaean banded iron formation. Earth Planet. Sci. Lett. 355–356, 109–118. doi:10.1016/j.epsl.2012.07.035
Derry, L. A., Kurtz, A. C., Ziegler, K., and Chadwick, O. A. (2005). Biological control of terrestrial silica cycling and export fluxes to watersheds. Nature 433, 728–731. doi:10.1038/nature03299
Deuerling, K. M., Martin, J. B., Martin, E. E., Abermann, J., Myreng, S. M., Petersen, D., et al. (2019). Chemical weathering across the western foreland of the Greenland Ice Sheet. Geochim. Cosmochim. Acta 245, 426–440. doi:10.1016/j.gca.2018.11.025
Dietzel, M. (2005). Impact of cyclic freezing on precipitation of silica in Me-SiO2-H2O systems and geochemical implications for cryosoils and -sediments. Chem. Geol. 216, 79–88. doi:10.1016/j.chemgeo.2004.11.003
Dove, P. M., Han, N., Wallace, A. F., and De Yoreo, J. J. (2008). Kinetics of amorphous silica dissolution and the paradox of the silica polymorphs. Proc. Natl. Acad. Sci. 105, 9903–9908. doi:10.1073/pnas.0803798105
Dubnick, A., Wadham, J., Tranter, M., Sharp, M., Orwin, J., Barker, J., et al. (2017). Trickle or treat: the dynamics of nutrient export from polar glaciers. Hydrol. Process. 31, 1776–1789. doi:10.1002/hyp.11149
Engström, J., and Klint, K. E. S. (2014). Continental collision structures and post-orogenic geological history of the kangerlussuaq area in the southern part of the nagssugtoqidian orogen, central west Greenland. Geosciences 4, 316–334. doi:10.3390/geosciences4040316
Escoube, R., Rouxel, O. J., Edwards, K., Glazer, B., and Donard, O. F. X. (2015). Coupled Ge/Si and Ge isotope ratios as geochemical tracers of seafloor hydrothermal systems: case studies at Loihi Seamount and East Pacific Rise 950’N. Geochim. Cosmochim. Acta 167, 93–112. doi:10.1016/j.gca.2015.06.025
Escoube, R., Rouxel, O. J., Luais, B., Ponzevera, E., and Donard, O. F. (2012). An intercomparison study of the germanium isotope composition of geological reference materials. Geostand. Geoanal. Res. 36, 149–159. doi:10.1111/j.1751-908X.2011.00135.x
Filippelli, G., Carnahan, J., Derry, L., and Kurtz, A. (2000). Terrestrial paleorecords of Ge/Si cycling derived from lake diatoms. Chem. Geol. 168, 9–26. doi:10.1016/S0009-2541(00)00185-6
Frings, P. J., Clymans, W., Fontorbe, G., De La Rocha, C. L., and Conley, D. J. (2016). The continental Si cycle and its impact on the ocean Si isotope budget. Chem. Geol. 425, 12–36. doi:10.1016/j.chemgeo.2016.01.020
Froelich, P., Blanc, V., Mortlock, R., Chillrud, S., Dunstan, W., Udomkit, A., et al. (1992). River fluxes of dissolved silica to the ocean were higher during glacials: Ge/Si in diatoms, rivers, and oceans. Paleoceanography 7, 739–767. doi:10.1029/92PA02090
Froelich, P., Hambrick, G., Andreae, M., Mortlock, R., and Edmond, J. (1985). The geochemistry of inorganic germanium in natural waters. J. Geophys. Res. 90, 1133–1141. doi:10.1029/JC090iC01p01133
Georg, R., Reynolds, B., West, A., Burton, K., and Halliday, A. (2007). Silicon isotope variations accompanying basalt weathering in Iceland. Earth Planet. Sci. Lett. 261, 476–490. doi:10.1016/j.epsl.2007.07.004
Gerringa, L. J., Alderkamp, A. C., Laan, P., Thuróczy, C. E., De Baar, H. J., Mills, M. M., et al. (2012). Iron from melting glaciers fuels the phytoplankton blooms in Amundsen Sea (Southern Ocean): iron biogeochemistry. Deep-Sea Res. Part II 71–76, 16–31. doi:10.1016/j.dsr2.2012.03.007
Graly, J. A., Humphrey, N. F., and Harper, J. T. (2016). Chemical depletion of sediment under the Greenland ice sheet. Earth Surf. Process. Landforms 41, 1922–1936. doi:10.1002/esp.3960
Graly, J. a., Humphrey, N. F., Landowski, C. M., and Harper, J. T. (2014). Chemical weathering under the Greenland ice sheet. Geology 42, 551–554. doi:10.1130/G35370.1
Grenne, T., and Slack, J. F. (2003). Paleozoic and Mesozoic silica-rich seawater: evidence from hematitic chert (jasper) deposits. Geology 31, 319–322. doi:10.1130/0091-7613(2003)031<0319:PAMSRS>2.0.CO;2
Guillermic, M., Lalonde, S. V., Hendry, K. R., and Rouxel, O. J. (2017). The isotope composition of inorganic germanium in seawater and deep sea sponges. Geochim. Cosmochim. Acta 212, 99–118. doi:10.1016/j.gca.2017.06.011
Hamade, T., Konhauser, K. O., Raiswell, R., Goldsmith, S., and Morris, R. C. (2003). Using Ge/Si ratios to decouple iron and silica fluxes in Precambrian banded iron formations. Geology 31, 35. doi:10.1130/0091-7613(2003)031<0035:UGSRTD>2.0.CO;2
Hammond, D. E., McManus, J., and Berelson, W. M. (2004). Oceanic germanium/silicon ratios: evaluation of the potential overprint of temperature on weathering signals. Paleoceanography 19, PA2016. doi:10.1029/2003PA000940
Harper, J. T., Humphrey, N. F., Meierbachtol, T. W., Graly, J. A., and Fischer, U. H. (2017). Borehole measurements indicate hard bed conditions, Kangerlussuaq sector, western Greenland Ice Sheet. J. Geophys. Res. Earth Surf. 122, 1605–1618. doi:10.1002/2017JF004201
Hatton, J. E., Hendry, K. R., Hawkings, J. R., Wadham, J. L., Kohler, T. J., Stibal, M., et al. (2019a). Investigation of subglacial weathering under the Greenland Ice Sheet using silicon isotopes. Geochim Cosmochim Acta 247, 191–206. doi:10.1016/j.gca.2018.12.033
Hatton, J. E., Hendry, K. R., Hawkings, J. R., Wadham, J. L., Opfergelt, S., Kohler, T. J., et al. (2019b). Silicon isotopes in Arctic and sub-Arctic glacial meltwaters: the role of subglacial weathering in the silicon cycle. Proc. R. Soc. A 475, 20190098. doi:10.1098/rspa.2019.0098
Hawkings, J. R., Hatton, J. E., Hendry, K. R., de Souza, G. F., Wadham, J. L., Ivanovic, R., et al. (2018). The silicon cycle impacted by past ice sheets. Nat. Commun. 9, 1–10. doi:10.1038/s41467-018-05689-1
Hawkings, J. R., Skidmore, M. L., Wadham, J. L., Priscu, J. C., Morton, P. L., Hatton, J. E., et al. (2020). Enhanced trace element mobilization by Earth’s ice sheets. Proc. Natl. Acad. Sci. 117, 202014378. doi:10.1073/pnas.2014378117
Hawkings, J. R., Wadham, J. L., Benning, L. G., Hendry, K. R., Tranter, M., Tedstone, A., et al. (2017). Ice sheets as a missing source of silica to the polar oceans. Nat. Commun. 8, 14198. doi:10.1038/ncomms14198
Hawkings, J. R., Wadham, J. L., Tranter, M., Lawson, E., Sole, A., Cowton, T., et al. (2015). The effect of warming climate on nutrient and solute export from the Greenland Ice Sheet. Geochemical Perspect. Lett. 1, 94–104. doi:10.7185/geochemlet.1510
Hawkings, J., Wadham, J., Tranter, M., Telling, J., Bagshaw, E., Beaton, A., et al. (2016). The Greenland Ice Sheet as a hot spot of phosphorus weathering and export in the Arctic. Global Biogeochem. Cycles 30, 191–210. doi:10.1002/2015GB005237
Hendry, K. R., and Brzezinski, M. a. (2014). Using silicon isotopes to understand the role of the Southern Ocean in modern and ancient biogeochemistry and climate. Quat. Sci. Rev. 89, 13–26. doi:10.1016/j.quascirev.2014.01.019
Hendry, K. R., Huvenne, V. A., Robinson, L. F., Annett, A., Badger, M., Jacobel, A. W., et al. (2019). The biogeochemical impact of glacial meltwater from Southwest Greenland. Prog. Oceanogr. 176, 102126. doi:10.1016/j.pocean.2019.102126
Hindshaw, R. S., Rickli, J., and Leuthold, J. (2019). Mg and Li stable isotope ratios of rocks, minerals, and water in an outlet glacier of the Greenland ice sheet. Front. Earth Sci. 7, 1–16. doi:10.3389/feart.2019.00316
Hindshaw, R. S., Rickli, J., Leuthold, J., Wadham, J., and Bourdon, B. (2014). Identifying weathering sources and processes in an outlet glacier of the Greenland Ice Sheet using Ca and Sr isotope ratios. Geochim. Cosmochim. Acta 145, 50–71. doi:10.1016/j.gca.2014.09.016
Hodgkins, R., Tranter, M., and Dowdeswell, J. A. (1998). The hydrochemistry of runoff from a “cold-based” glacier in the high Artic (Scott Turnerbreen, Svalbard). Hydrol. Process. 12, 87–103. doi:10.1002/(SICI)1099-1085(199801)12:1<87:AID-HYP565>3.0.CO;2-C
Icenhower, J. P., and Dove, P. M. (2000). The dissolution kinetics of amorphous silica into sodium chloride solutions: effects of temperature and ionic strength. Geochim. Cosmochim. Acta 64, 4193–4203. doi:10.1016/S0016-7037(00)00487-7
Jasechko, S. (2019). Global isotope hydrogeology―review. Rev. Geophys. 57, 835–965. doi:10.1029/2018RG000627
Jochum, K. P., Schuessler, J. A., Wang, X. H., Stoll, B., Weis, U., Müller, W. E., et al. (2017). Whole-Ocean changes in silica and Ge/Si ratios during the last deglacial deduced from long-lived giant glass sponges. Geophys. Res. Lett. 44, 555–611. doi:10.1002/2017GL073897
Kato, K., and Kitano, Y. (1968). Solubility and dissolution rate of amorphous silica in distilled and seawater at 20* C. J. Oceanogr. Soc. Jpn. 24, 147–152. doi:10.5928/kaiyou1942.24.147
Kurtz, A., Derry, L., and Chadwick, O. (2002). Germanium-silicon fractionation in the weathering environment. Geochim. Cosmochim. Acta 66, 1525–1537. doi:10.1016/S0016-7037(01)00869-9
Lawson, E. C., Wadham, J. L., Tranter, M., Stibal, M., Lis, G. P., Butler, C. E., et al. (2014). Greenland ice sheet exports labile organic carbon to the arctic oceans. Biogeosciences 11, 4015–4028. doi:10.5194/bg-11-4015-2014
Li, L. (2019). Watershed reactive transport. Rev. Mineral. Geochem. 85, 381–418. doi:10.2138/rmg.2018.85.13
Lindbäck, K., Pettersson, R., Hubbard, A. L., Doyle, S. H., Van As, D., Mikkelsen, A. B., et al. (2015). Subglacial water drainage, storage, and piracy beneath the Greenland ice sheet. Geophys. Res. Lett. 42, 7606–7614. doi:10.1002/2015GL065393
Linhoff, B. S., Charette, M. A., Nienow, P. W., Wadham, J. L., Tedstone, A. J., and Cowton, T. (2017). Utility of 222Rn as a passive tracer of subglacial distributed system drainage. Earth Planet. Sci. Lett. 462, 180–188. doi:10.1016/j.epsl.2016.12.039
Lugolobi, F., Kurtz, A. C., and Derry, L. A. (2010). Germanium-silicon fractionation in a tropical, granitic weathering environment. Geochim. Cosmochim. Acta 74, 1294–1308. doi:10.1016/j.gca.2009.11.027
Maher, K., and Chamberlain, C. P. (2014). Hydrologic regulation of chemical weathering and the geologic carbon cycle. Science 343, 1502–1504. doi:10.1126/science.1250770
Mantoura, S. C. (2006). Development and application of opal based paleoceanographic proxies. Ph.D. thesis. England (United Kingdom): University of Cambridge.
Meire, L., Meire, P., Struyf, E., Krawczyk, D. W., Arendt, K. E., Yde, J. C., et al. (2016). High export of dissolved silica from the Greenland Ice Sheet. Geophys. Res. Lett. 43, 9173–9182. doi:10.1002/2016GL070191
Mortlock, R., Charles, C., Froelich, P., Zibello, M., Saltzman, J., Hays, J., et al. (1991). Evidence for lower productivity in the Antarctic Ocean during the last glaciation. Nature 351, 220–223. doi:10.1038/351220a0
Mortlock, R., and Froelich, P. (1987). Continental weathering of germanium: Ge/Si in the global river discharge. Geochim. Cosmochim. Acta 51, 2075–2082. doi:10.1016/0016-7037(87)90257-2
Mortlock, R., and Froelich, P. (1996). Determination of germanium by isotope dilution-hydride generation inductively coupled plasma mass spectrometry. Anal. Chim. Acta 332, 277–284. doi:10.1016/0003-2670(96)00230-9
Mullin, J., and Riley, J. (1955). The colorimetric determination of silicate with special reference to sea and natural waters. Anal. Chim. Acta 12, 162–175. doi:10.1016/S0003-2670(00)87825-3
Murnane, R. J., Leslie, B., Hammond, D. E., and Stallard, R. F. (1989). Germanium geochemistry in the southern California borderlands. Geochim. Cosmochim. Acta 53, 2873–2882. doi:10.1016/0016-7037(89)90164-6
Murnane, R., and Stallard, R. (1990). Germanium and silicon in rivers of the Orinoco drainage basin. Nature 344, 749–752.
Nelson, A. H., Bierman, P. R., Shakun, J. D., and Rood, D. H. (2014). Using in situ cosmogenic 10Be to identify the source of sediment leaving Greenland. Earth Surf. Process. Landforms 39, 1087–1100. doi:10.1002/esp.3565
Oelze, M., von Blanckenburg, F., Bouchez, J., Hoellen, D., and Dietzel, M. (2015). The effect of Al on Si isotope fractionation investigated by silica precipitation experiments. Chem. Geol. 397, 94–105. doi:10.1016/j.chemgeo.2015.01.002
Opfergelt, S., Burton, K., Pogge von Strandmann, P., Gislason, S., and Halliday, A. (2013). Riverine silicon isotope variations in glaciated basaltic terrains: implications for the Si delivery to the ocean over glacial-interglacial intervals. Earth Planet. Sci. Lett. 369–370, 211–219. doi:10.1016/j.epsl.2013.03.025
Overeem, I., Hudson, B. D., Syvitski, J. P., Mikkelsen, A. B., Hasholt, B., Van Den Broeke, M. R., et al. (2017). Substantial export of suspended sediment to the global oceans from glacial erosion in Greenland. Nat. Geosci. 10, 859–863. doi:10.1038/NGEO3046
Parkhurst, D. L., and Appelo, C. (2013). “Description of input and examples for PHREEQC version 3: a computer program for speciation, batch-reaction, one-dimensional transport, and inverse geochemical calculations,” in Technical report. Reston, VA: US Geological Survey, 497.
Pokrovsky, O., Pokrovski, G., Schott, J., and Galy, A. (2006). Experimental study of germanium adsorption on goethite and germanium coprecipitation with iron hydroxide: X-ray absorption fine structure and macroscopic characterization. Geochim. Cosmochim. Acta 70, 3325–3341. doi:10.1016/j.gca.2006.04.012
Pokrovsky, O. S., Galy, A., Schott, J., Pokrovski, G. S., and Mantoura, S. (2014). Germanium isotope fractionation during Ge adsorption on goethite and its coprecipitation with Fe oxy(hydr)oxides. Geochim. Cosmochim. Acta 131, 138–149. doi:10.1016/j.gca.2014.01.023
Pokrovsky, O. S., Reynolds, B. C., Prokushkin, A. S., Schott, J., and Viers, J. (2013). Silicon isotope variations in Central Siberian rivers during basalt weathering in permafrost-dominated larch forests. Chem. Geol. 355, 103–116. doi:10.1016/j.chemgeo.2013.07.016
Qi, H. W., Hu, R. Z., Jiang, K., Zhou, T., Liu, Y. F., and Xiong, Y. W. (2019). Germanium isotopes and Ge/Si fractionation under extreme tropical weathering of basalts from the Hainan Island, South China. Geochim. Cosmochim. Acta 253, 249–266. doi:10.1016/j.gca.2019.03.022
Raiswell, R., Tranter, M., Benning, L. G., Siegert, M., De’ath, R., Huybrechts, P., et al. (2006). Contributions from glacially derived sediment to the global iron (oxyhydr)oxide cycle: implications for iron delivery to the oceans. Geochim. Cosmochim. Acta 70, 2765–2780. doi:10.1016/j.gca.2005.12.027
Rennermalm, A. K., Smith, L. C., Chu, V. W., Box, J. E., Forster, R. R., Van Den Broeke, M. R., et al. (2013). Evidence of meltwater retention within the Greenland ice sheet. Cryosphere 7, 1433–1445. doi:10.5194/tc-7-1433-2013
Rickli, J., Hindshaw, R. S., Leuthold, J., Wadham, J. L., Burton, K. W., and Vance, D. (2017). Impact of glacial activity on the weathering of Hf isotopes – observations from Southwest Greenland. Geochim. Cosmochim. Acta 215, 295–316. doi:10.1016/j.gca.2017.08.005
Rimstidt, J. D., Zhang, Y., and Zhu, C. (2016). Rate equations for sodium catalyzed amorphous silica dissolution. Geochim. Cosmochim. Acta 195, 120–125. doi:10.1016/j.gca.2016.09.020
Rouxel, O. J., Galy, A., and Elderfield, H. (2006). Germanium isotopic variations in igneous rocks and marine sediments. Geochim. Cosmochim. Acta 70, 3387–3400. doi:10.1016/j.gca.2006.04.025
Rouxel, O. J., and Luais, B. (2017). Germanium isotope geochemistry. Rev. Mineral. Geochem. 82, 601–656. doi:10.2138/rmg.2017.82.14
Shemesh, A., Mortlock, R. A., and Froelich, P. N. (1989). Late cenozoic Ge/Si record of marine biogenic opal: implications for variations of riverine fluxes to the ocean. Paleoceanography 4, 221–234. doi:10.1029/PA004i003p00221
Siebert, C., Nägler, T., and Kramers, J. (2001). Determination of molybdenum isotope fractionation by double-spike multicollector inductively coupled plasma mass spectrometry. Geochem. Geophys. Geosyst. 2, 2000GC000124. doi:10.1029/2000GC000124
Smeets, P. C., Kuipers Munneke, P., van As, D., van den Broeke, M. R., Boot, W., Oerlemans, H., et al. (2018). The K-transect in west Greenland: automatic weather station data (1993–2016). Arct. Antarct. Alp. Res. 50, S100002. doi:10.1080/15230430.2017.1420954
Smith, L. C., Chu, V. W., Yang, K., Gleason, C. J., Pitcher, L. H., Rennermalm, A. K., et al. (2015). Efficient meltwater drainage through supraglacial streams and rivers on the southwest Greenland ice sheet. Proc. Natl. Acad. Sci. U.S.A. 112, 1001–1006. doi:10.1073/pnas.1413024112
Stevenson, E. I., Fantle, M. S., Das, S. B., Williams, H. M., and Aciego, S. M. (2017). The iron isotopic composition of subglacial streams draining the Greenland ice sheet. Geochim. Cosmochim. Acta 213, 237–254. doi:10.1016/j.gca.2017.06.002
Sutton, J., Ellwood, M. J., Maher, W. A., and Croot, P. L. (2010). Oceanic distribution of inorganic germanium relative to silicon: germanium discrimination by diatoms. Global Biogeochem. Cycles 24, GB2017. doi:10.1029/2009GB003689
Sutton, J. N., André, L., Cardinal, D., Conley, D. J., de Souza, G. F., Dean, J., et al. (2018). A review of the stable isotope bio-geochemistry of the global silicon cycle and its associated trace elements. Front. Earth Sci. 5, 112. doi:10.3389/feart.2017.00112
Tipper, E. T., Stevenson, E. I., Alcock, V., Knight, A. C. G., Baronas, J. J., Hilton, R. G., et al. (2021). Global silicate weathering flux overestimated because of sediment–water cation exchange. Proc. Natl. Acad. Sci. 118, e2016430118. doi:10.1073/pnas.2016430118
Torres, M. A., and Baronas, J. J. (2021). Modulation of riverine concentration–discharge relationships by changes in the shape of the water transit time distribution. Global Biogeochem. Cycles 35. e2020GB006694. doi:10.1029/2020GB006694
Torres, M. A., Moosdorf, N., Hartmann, J., Adkins, J. F., and West, A. J. (2017). Glacial weathering, sulfide oxidation, and global carbon cycle feedbacks. Proc. Natl. Acad. Sci. 114, 8716–8721. doi:10.1073/pnas.1702953114
Tranter, M., and Wadham, J. L. (2014). “Geochemical weathering in glacial and proglacial environments,” in Treatise on Geochemistry. 2nd Edn. Elsevier, 7, 157–173.
Tremblay, J. E., Anderson, L. G., Matrai, P., Coupel, P., Bélanger, S., Michel, C., et al. (2015). Global and regional drivers of nutrient supply, primary production and CO2 drawdown in the changing Arctic Ocean. Prog. Oceanogr. 139, 171–196. doi:10.1016/j.pocean.2015.08.009
Urra, A., Wadham, J., Hawkings, J. R., Telling, J., Hatton, J. E., Yde, J. C., et al. (2019). Weathering dynamics under contrasting Greenland ice sheet catchments. Front. Earth Sci. 7, 299. doi:10.3389/feart.2019.00299
Van As, D., Mikkelsen, A. B., Nielsen, M. H., Box, J. E., Liljedahl, L. C., Lindbäck, K., et al. (2017). Hypsometric amplification and routing moderation of Greenland ice sheet meltwater release. Cryosphere 11, 1371–1386. doi:10.5194/tc-11-1371-2017
Van Gool, J. A., Connelly, J. N., Marker, M., and Mengel, F. C. (2002). The nagssugtoqidian orogen of West Greenland: tectonic evolution and regional correlations from a west Greenland perspective. Can. J. Earth Sci. 39, 665–686. doi:10.1139/e02-027
Vick-Majors, T. J., Michaud, A. B., Skidmore, M. L., Turetta, C., Barbante, C., Christner, B. C., et al. (2020). Biogeochemical connectivity between freshwater ecosystems beneath the west antarctic ice sheet and the sub-ice marine environment. Global Biogeochem. Cycles 34, e2019GB006446. doi:10.1029/2019GB006446
White, A. F., and Brantley, S. L. (2003). The effect of time on the weathering of silicate minerals: why do weathering rates differ in the laboratory and field?. Chem. Geol. 202, 479–506. doi:10.1016/j.chemgeo.2003.03.001
Wimpenny, J., Burton, K. W., James, R. H., Gannoun, A., Mokadem, F., and Gíslason, S. R. (2011). The behaviour of magnesium and its isotopes during glacial weathering in an ancient shield terrain in West Greenland. Earth Planet. Sci. Lett. 304, 260–269. doi:10.1016/j.epsl.2011.02.008
Wimpenny, J., James, R. H., Burton, K. W., Gannoun, A., Mokadem, F., and Gíslason, S. R. (2010). Glacial effects on weathering processes: new insights from the elemental and lithium isotopic composition of West Greenland rivers. Earth Planet. Sci. Lett. 290, 427–437. doi:10.1016/j.epsl.2009.12.042
Woronko, B., and Hoch, M. (2011). The development of frost-weathering microstructures on sand-sized quartz grains: examples from Poland and Mongolia. Permafr. Periglac. Process. 22, 214–227. doi:10.1002/ppp.725
Yde, J. C., Finster, K. W., Raiswell, R., Steffensen, J. P., Heinemeier, J., Olsen, J., et al. (2010). Basal ice microbiology at the margin of the Greenland ice sheet. Ann. Glaciol. 51, 71–79. doi:10.3189/172756411795931976
Keywords: glacial weathering, germanium, isotope fractionation, Amorphous silica, experimental dissolution
Citation: Baronas JJ, Hammond DE, Bennett MM, Rouxel O, Pitcher LH and Smith LC (2021) Ge/Si and Ge Isotope Fractionation During Glacial and Non-glacial Weathering: Field and Experimental Data From West Greenland. Front. Earth Sci. 9:551900. doi: 10.3389/feart.2021.551900
Received: 14 April 2020; Accepted: 15 January 2021;
Published: 15 March 2021.
Edited by:
Katharine Rosemary Hendry, University of Bristol, United KingdomReviewed by:
Jade Hatton, University of Bristol, United KingdomJon Hawkings, Florida State University, United States
Copyright © 2021 Baronas, Hammond, Bennett, Rouxel, Pitcher and Smith. This is an open-access article distributed under the terms of the Creative Commons Attribution License (CC BY). The use, distribution or reproduction in other forums is permitted, provided the original author(s) and the copyright owner(s) are credited and that the original publication in this journal is cited, in accordance with accepted academic practice. No use, distribution or reproduction is permitted which does not comply with these terms.
*Correspondence: J. Jotautas Baronas, am90YXV0YXMuYmFyb25hc0BnbWFpbC5jb20=
†Present address: Lincoln H. Pitcher, Cooperative Institute for Research in Environmental Sciences (CIRES), University of Colorado–Boulder, Boulder, CO, United States Laurence C. Smith, Brown University, Providence, RI, United States