 Wahyu Triyoso
 David P. Sahara
- Global Geophysics Group, Faculty of Mining and Petroleum Engineering, Bandung Institute of Technology, Bandung, Indonesia
A seismic hazard study and analysis of the megathrust source off the west coast of North Sumatra, Indonesia, were conducted based on the estimated horizontal crustal strain using the surface displacement data. This area was selected due to the availability of pre- and co-seismic Global Positioning System (GPS) data for the 2005 Nias–Simeulue Mw 8.6 event. This study aimed to estimate the seismic hazard function (SHF), which is expressed as peak ground acceleration (PGA) versus probability of exceedance (PE), for a 500 years return period using GPS data. The source area model of the Mw 8.6 event is determined based on the co-seismic GPS data. The horizontal crustal strain of the source area is estimated using least square prediction employing local covariance functions based on the horizontal displacement data. The Mw 8.6 return period is estimated by dividing the sum of the co-seismic seismic moment by the pre-seismic seismic moment based on GPS data. The seismicity rate model above a magnitude of completeness is then estimated assuming the b-value of 1 obtained on the previous study’s earthquake catalog data in the region. We show that the SHF based on the study area’s horizontal crustal strain is higher than the one based on earthquake catalogs and estimated geological sliprate data. This discrepancy is associated with the static stress increase (Coulomb failure stress, CFS) of about 0.25 bar imparted by the 2004 Aceh Mw 9.1 event that occurred in the north of the study region. We interpreted that the increase of the SHF was due to the increase in the region’s stress load, which was well documented by the GPS data.
Introduction
It has been concluded that the Sumatra Subduction Zone is one of the most active plate tectonic margins in the world (Petersen et al., 2004). Its geometry has an oblique NE-ward convergence between the subducting Indian–Australian Plate and the overriding southeastern Eurasian Plate (McCaffrey, 1991; Prawirodirdjo et al., 2000; Pan et al., 2001). A convergence rate of about 49 mm/year (Zachariasen et al., 2000) results in Sumatra Island having a very high annual rate of earthquakes: over the last 250 years, five major earthquakes (Mw ≥ 8.0) have occurred along the Sumatran megathrust (Megawati and Pan, 2009). The major earthquakes might perturb the vicinity stress concentration and, hence, the seismic hazard function (Steacy et al., 2005; Pollitz et al., 2006).
Previous regional hazard models for slip along the Sumatran megathrust have been proposed. The Global Seismic Hazard Assessment Program (GSHAP., 1999) proposes that two sources, i.e., the Sumatra Subduction Zone and the Sumatran Fault, characterize this region. Megawati and Pan (2001) further expand this ground motion assessment toward Singapore and Malaysia. Petersen et al. (2004, 2007) updated the GSHAP map (GSHAP., 1999) by compiling the updated earthquake catalogs to develop new seismotectonic models. Bilham et al. (2005) use geological data to infer the seismic hazard in this region. However, none of these studies integrate geologic, seismic, and geodetic data to estimate the seismic hazard function of Sumatra Island.
Ward (1994) introduced integrating information based on geology, paleoseismology, space geodesy, and observational seismology. According to Ward (1994), geology and paleoseismology come into play as they locate, segmentize, and fix the long-term slip of principal faults. Input from geodesy in the form of strain rate data takes command in quantifying the seismic potency of an area where there is inadequate knowledge of the slip rates of Late Quaternary fault data (Ward, 1998). Synthetic seismicity contributes by estimating the statistical possibilities of various scenarios of multiple segments breaking. In essence, Ward’s work tries to consider an unidentified zone by using geodetic data. The essential part of his work is to incorporate geodetic data into a probabilistic seismic hazard study and analysis using Kostrov’s formula regarding seismic moment and strain (Kostrov, 1974). The use of Global Positioning System (GPS) data for seismic hazard study and analysis has been widely explained in previous studies (e.g., Ward, 1994; Working Group California Earthquake Probabilities [WGCEP], 1995; Savage and Simpson, 1997).
Triyoso et al. (2020) have estimated the seismic hazard function in southern Sumatra based on integrated pre-seismic GPS data, earthquake catalog, and estimated geological sliprate data. The horizontal crustal strain was estimated using the least squares collocation (LSC) technique employing local covariance functions based on the surface displacement data. The seismic moment rate model was derived from the GPS displacement of pre-seismic data around the subduction zone. To avoid the possibility of any strain surplus or deficit, the seismic moment rate model was then normalized. The rate was then used to weight the mean seismicity smoothing rate derived based on the correlation distances of 25, 50, and 150 km (Frankel, 1995), and the seismic hazard function (SHF) was constructed.
The 2005 Nias–Simeulue Mw 8.6 event was recorded by the available pre- and co-seismic GPS data. Using the recorded co-seismic GPS data and Kostrov’s formula (Kostrov, 1974), the source area model of the Mw 8.6 event can be estimated. The return period is calculated by dividing the sum of seismic moments of the co-seismic GPS data by the pre-seismic GPS data for the same source area model. Furthermore, using b-value ∼1 (Triyoso et al., 2020), the annual A-value (Gutenberg and Richter, 1944) above magnitude completeness could be estimated.
Thus, this study intended to perform the probabilistic seismic hazard analysis using the source area’s surface displacement data off the west coast of northern Sumatra. The seismic source model considers pre-seismic and post-seismic moment to constrain an Mw 8.6 event’s recurrence period. The study area is around the subduction zone of Mw 8.6. Based on the previous results (Triyoso et al., 2021), the Sumatran Fault’s impact could be neglected.
The seismic hazard function obtained in this study is then compared with the seismic hazard functions obtained from each single data, i.e., geology, geodetic GPS data, and seismology. The result shows that the SHF based on the horizontal crustal strain is higher than the SHF obtained from data based on earthquake catalogs and geological data. The increase of probability of exceedance (PE) in the SHF, which could be correlated with the time advance of the Mw 8.6 occurrence, is further associated with the increased Coulomb failure stress in the source area of the Mw 8.6 event by about 0.25 bar caused by the 2004 Aceh Mw 9.1 event. This study’s critical finding is that increasing static stress could increase the probability of exceedance of the peak ground acceleration (PGA) level in SHF compared to the previous study’s expected result. The result may be very beneficial for earthquake mitigation and modeling efforts for probabilistic seismic hazard study and future analysis.
Data and Methods
Data
In this study, two primary data were used to calculate the seismic hazard function of the west coast of northern Sumatra: surface displacement data based on the GPS of both pre-seismic and co-seismic and the earthquake catalog. Figure 1A summarizes the GPS and earthquake data used in this study. Following a previous study (Triyoso et al., 2020), the horizontal crustal strain values estimated based on the surface displacement data of Chlieh et al. (2007); Prawirodirdjo et al. (2010), Shearer and Burgmann (2010), and Bradley et al. (2017) were used along with additional data obtained from Bird (2003) and Qiu et al. (2019). The velocity vectors for the pre-seismic data obtained from Bird (2003) are based on GPS surveys from 1991 through 2001. Thus, the GPS data could be grouped into pre- and co-seismic data of the Mw 8.6 event. Twenty particulars of the pre-seismic and 22 particulars of the co-seismic GPS data distributed in northern Sumatra were used. The horizontal displacement in each cell was then estimated using the least squares collocation (LSC) technique (Kaula, 1963; Moritz, 1978; Kato et al., 1998; El-fiky and Kato, 1999; El-Fiky et al., 1999; Triyoso and Shimazaki, 2012; Triyoso et al., 2020).
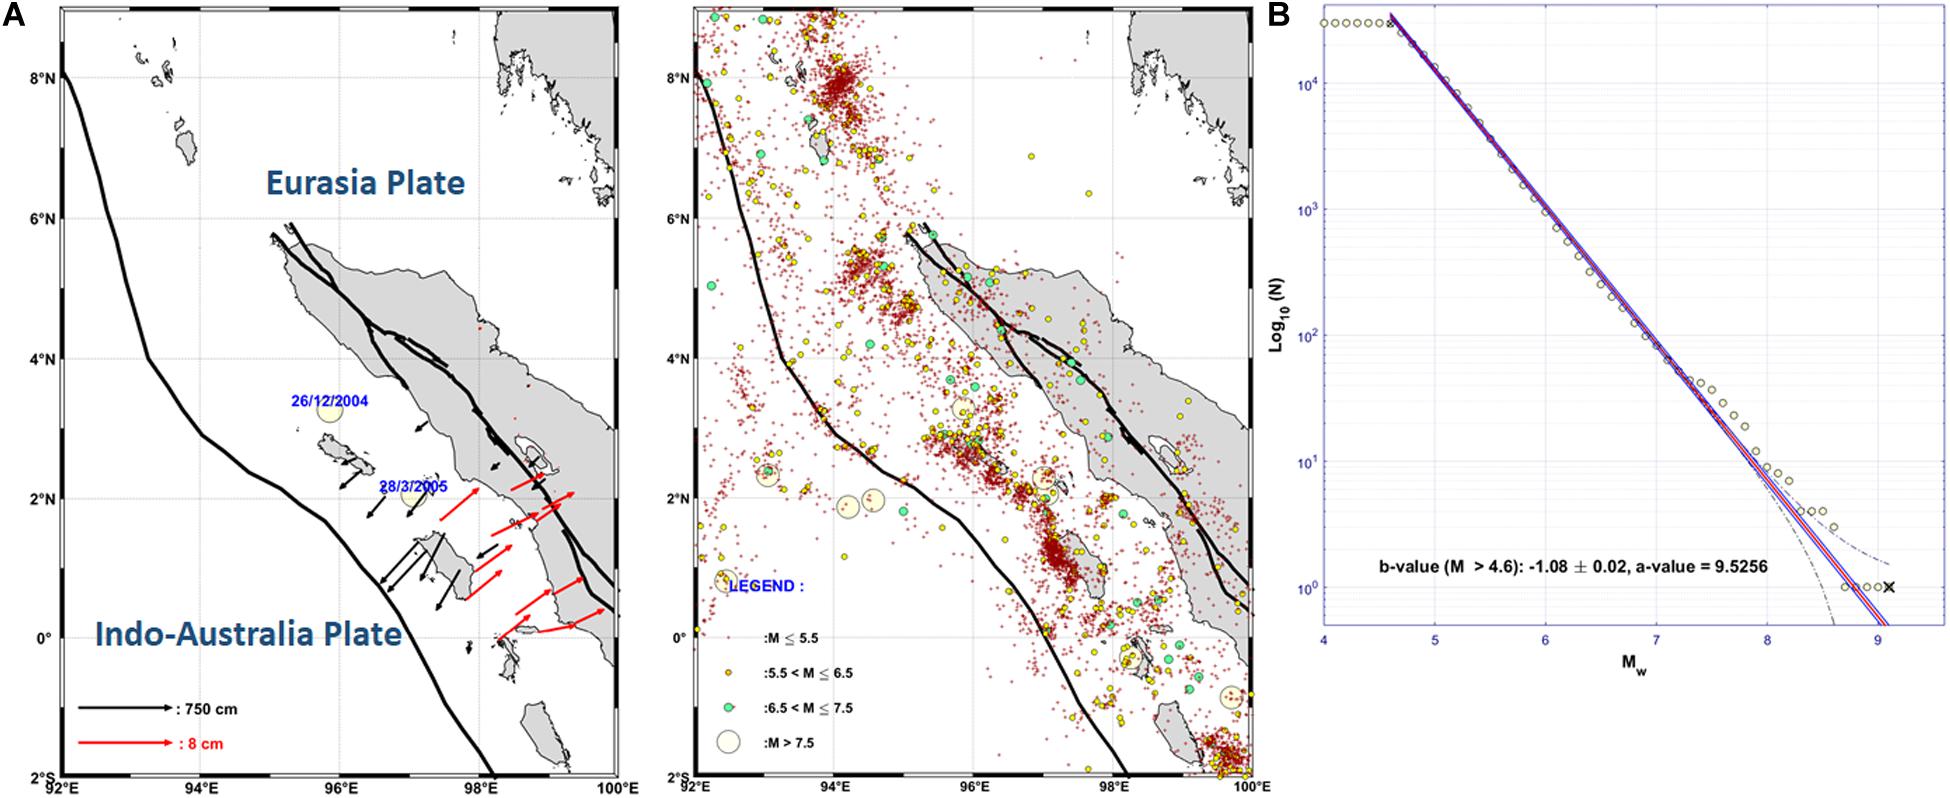
Figure 1. (A) Plotting of Global Positioning System (GPS) data mainly used for horizontal crustal strain estimation with co-seismic (black) and pre-seismic (red) data. (B) Plotting of the 2017 PuSGeN earthquake catalog data during the years 1963–2016 and the b-value estimation based on the hypocenter ≤ 50 km and Mw ≥ 4.6. The GPS data from around the study area were mainly taken from Bird (2003), Chlieh et al. (2007); Prawirodirdjo et al. (2010), Shearer and Burgmann (2010); Bradley et al. (2017), and Qiu et al. (2019).
Figure 1B shows that the earthquake catalog data used in this study are based on Triyoso et al. (2020), in which seismic data and moment magnitude conversion are taken from the 2017 PuSGeN (Tim PusatStudiGempa Nasional-2017 [The 2017 PuSGen], 2017). The period of the seismic data is from 1963 to 2016. Following Triyoso et al. (2020), the regional b-value in northern Sumatra is assumed to be 1.0.
Least Squares Prediction Technique
Following Triyoso et al. (2020), the scalar moment rate based on Ward (1994) could be rewritten as:
The μ is the rigidity, H is the seismogenic thickness, A is the unit area of the study, and e1 and e2 are the principal strain rates.
Following Molnar (1979) and Field et al. (1999), the Gutenberg–Richter (GR) relationship in terms of the seismic moment could be expressed as:
where β is equal to (b/c), b is the b-value of the GR relationship (Gutenberg and Richter, 1944), and c is the constant of the seismic moment–magnitude relationship, where log Mo = cM+ d. Mo could be replaced by Mw using the Hanks and Kanamori (1979)relationship.
The study area is gridded into a cell size in which the surface strain rate in each cell needs to be estimated based on GPS data. We adopt procedures from previous studies to estimate each cell’s horizontal crustal strain rate (Kato et al., 1998; El-fiky and Kato, 1999; El-Fiky et al., 1999; Triyoso and Shimazaki, 2012; Triyoso et al., 2020), applying the LSC method.
As a follow-up to the successful result of the previous study in the generalized estimation of interpolation, which combines adjustment, filtering, and prediction, i.e., Kaula (1963); Mikhail and Ackermann (1976), and Moritz (1978, 1980), the LSC method is briefly discussed in this study. The detailed application for surface strain data is based on a previous study done around the Japanese Islands (Kato et al., 1998; El-fiky and Kato, 1999; El-Fiky et al., 1999; Triyoso and Shimazaki, 2012) and the Sumatra Islands (Triyoso et al., 2020). The basic assumption of the LSC application is that data vector L could be composed of systematic errors (El-fiky and Kato, 1999), in which the tectonic signal and noise could be expressed as:
Following Moritz (1980), the parameter model that underlies the least square collocation is:
Variable x is the vector observation or measurement, X is the unknown vector, and n is noise or the vector of the measuring errors; A is a known rectangular matrix. Thus, x could be decomposed into a systematic part denoted by AX and a random part represented by n. In the sequel, the number of observations will consistently be denoted by q and the number of parameters by m; to get an over determined problem, we must have m<q. x and n are the column vectors of q components, X is a column vector of m components, and A is a q by m matrix. By admitting n is the noise, a second random quantity s, which is then called the signal, the following generalization could be expressed as:
in which the measurement x consists of a systematic part, AX, and two random parts, s and n. Usually, the systematic part will be nonlinear initially, and the linear form AX will be obtained on linearization using Taylor’s theorem. The signal s may exist at points between the measuring points, and it may vary continuously, although x is only measured at discrete points. Thus, by applying this algorithm, we could do the so-called interpolation.
Horizontal Crustal Strain Estimation
In this study, we assume that the horizontal displacement field at the observation point over the entire seismogenic thickness is homogeneous and isotropic, i.e., considering the horizontal displacement components u or v as the signal t in the equation, in which components u and v are the displacement components in the x and y directions. The local x–y coordinate system is the x-axis in the E–W direction and the y-axis in the N–S direction. A further assumption is then made in which signals u and v are not correlated with one another (El-fiky and Kato, 1999; El-Fiky et al., 1999). Even though they are correlated, the cross-covariance is very small compared to the variances (El-fiky and Kato, 1999; El-Fiky et al., 1999); therefore, the above non-correlative assumption would be acceptable. Thus, by following the non-correlative assumption, it is possible to treat the displacement components u and v separately, thus simplifying the procedures in both the estimation of covariance function and the derivation of the least prediction equation squares collocation. By knowing the covariance functions for both displacement components u and v, we may have (El-fiky, 1998):
U and V are signals to be estimated. CUu is the (n × 1) vector of the cross-covariance between U and each element ui of u and Cv v is the n*1 vector of cross-covariance between V and each element vi of v.
Cuu is the variance matrix of u with the size of (n × n)
Cvv is the variance matrix of v with the size of (n × n)
u and v are the (n × 1) vectors of the known displacement components in the x and y directions. Using the notation of
We may write Eq. (6) as:
When u and v are determined, a and b can be obtained immediately. They are constants to U and V and, thus, can be computed beforehand. The algorithms for sparse and symmetrical linear equations are still feasible. By adopting the assumption that the covariance function is satisfied by the Gaussian function (El-fiky and Kato, 1999; El-Fiky et al., 1999) with d as the correlation distance, we may have:
Then, we have:
where CUui and Cv vi are the elements of the vector. The distance (di) between (x,y) and (xi,yi), with (x,y) being the coordinates of signal U or V, could be estimated by using di = [(x-xi)2+(y-yi)2]1/2, and (xi,yi) are the coordinates of observation point i.
Referring to Eq. (10), we can easily obtain the following equation just by differentiating Eq. (8):
where ai is the element of vector a(a1,a2,…ai…an)T and bi is the element of vector b(b1,b2,…bi…bn)T.
Following El-fiky and Kato (1999), the dilatation Δ, maximum shear strain emax, principal strain (e1, e2), the orientation of the major principal axis of strain θ (angle to x-axis counter clockwise), and rotation ω can be deduced from Eq. (11). Using Eqs. (11) and (1), we can calculate the seismic moment in each of our cell maps over the entire study area. We could then calculate the seismic moment of the co- and pre-seismic data based on the surface strain data.
Seismic Hazard Function
Seismicity Rate Modeling: Source Area and Earthquake Rate Formulation
The earthquake occurrence rate above or equal to magnitude completeness as the magnitude reference (Mc) in the particular cell i could theoretically be expressed as:
Ni is the number of earthquakes with magnitude ≥ Mc in cell i, and T is the length of record or estimated return period; vi represents the likelihood of the 10a of the earthquake with a magnitude greater than or equal to Mc (Bender, 1983).
Furthermore, substituting 10a of Eq. (12) in frequency–magnitude of the Guttenberg–Richter equation (Gutenberg and Richter, 1944), we may write the following equation:
in which ni(≥Mref) is the estimated number of earthquakes above or equal to the completeness moment magnitude. T is a given period of observation and b is the uniform b-value.
The GR model and the seismicity rate of the earthquake with a magnitude greater than or equal to the Mref derived based on the estimated horizontal crustal strain of the entire source area are shown in Figures 4A,B.
Seismic Hazard Function Estimation: Ground Motion Prediction Equation and Probability Exceedance
The PE of the annual earthquake rate of given magnitude completeness, which could be converted into the estimated ground motion [PGA or peak ground velocity (PGV)] using ground motion prediction equation (GMPE), denoted by a at a site or point of observation due to events at a particular cell k under the Poisson distribution, could be expressed as:
in which Pk(m ≥ m(ao, Rk)) is the annual PE of earthquakes in the kth cell, m(ao, Rk) is the magnitude in the kth source cell that would produce an estimated PGA or PGV of ao or larger at the site, and Rk is the distance between the site and the source cell. Since the purpose of this study was to make a comparison with previous results, the calculation of SHF, the parameter is based on Triyoso et al. (2020), in which Rk is the distance of the source to the site with the starting locking depth as the top being a 3 km depth, as taken from the 2017; Tim PusatStudiGempa Nasional-2017 (The 2017 PuSGen) (2017). The function m(ao, Rk) is the GMPE relation. The total PE distribution of PGA or PGV at the site was determined by integrating the influences of the surrounding source cells, which could be expressed as:
By substituting the GMPE in Eq. (15), we could obtain the annual PE of the particular PGA or PGV as follows:
For a given specified time duration T, the PE could be estimated as follows:
Thus, the annual PE of the specified ground motion for each grid is calculated using Eq. (16). For a given time duration T, the PE of the specified ground motions is computed using Eq. (17).
Results and Discussion
This study’s motivation was to perform a probabilistic seismic hazard analysis using the source area’s surface displacement data off the west coast of northern Sumatra on March 28, 2005. Based on the previous study by Triyoso et al. (2021), the Sumatran Fault’s impact on the seismic hazard analysis in the vicinity of the major subduction event could be neglected. Considering the availability of the recorded pre- and co-seismic GPS data in the study area, we intend to compare the seismic hazard function estimated using a horizontal crustal strain with the one obtained previouslyusing various input data. A lesson learned from the comparison might be beneficial for seismic mitigation purposes.
In the previous study, the SHF of probabilistic seismic hazard analysis was constructed based on pre-seismic GPS data, data from the earthquake catalog, and the estimated geological sliprate in northern Sumatra. The geological sliprate of Bilham et al. (2005) is used to develop the pre-seismic GPS model on the position of the co-seismic GPS data of Subarya et al. (2006) and Chlieh et al. (2007). In doing so, the Okada dislocation model (Okada, 1985, 1992) is implemented. The LSC technique using local covariance functions (Eq. 9) based on the surface displacement data is applied to estimate the horizontal displacement in each cell. The obtained GPS pre-seismic model is used to calculate the horizontal crustal strain rate and the seismic moment rate model. Afterward, the seismicity rate model is included in the algorithm to avoid the possibility of any strain surplus and deficit. It was done by normalizing the estimated seismic moment rate model and weighting the mean seismicity smoothing rate derived based on the correlation distances of 25, 50, and 150 km (Frankel, 1995). Seismicity smoothing is applied for the declustered catalog data with magnitude completeness of Mw ≥ 5.0 and a depth maximum of 50 km. The declustering is performed using ZMAP (Wiemer, 2001). By applying the seismicity smoothing algorithm, we assume that the rate model is equivalent to the earthquake rate model.
As a consequence of the seismicity smoothing (Frankel, 1995) applied in this study, SHF was constructed based on point source approximation. It is applied to simplify the calculation as the realization of hazard calculation depends only on the source’s magnitude and distance (Cornel, 1968; McGuire, 1976; Grandori et al., 1984; Working Group California Earthquake Probabilities [WGCEP], 1995). The source position is placed in the middle of the seismogenic thickness.
In this study, to realize the SHF of probabilistic seismic hazard analysis, we follow the GR law (Gutenberg and Richter, 1944). In this case, the annual A-value, i.e., the earthquake occurrence rate function (vi) above the magnitude reference (Mref), has to be estimated. Mref can be taken to be equal to or larger than magnitude completeness (Mc). Following Triyoso et al. (2020), the Mref is set at 5.0. Assuming the b-value is equal to 1, the A-value of Mref 5.0 can be estimated using the larger magnitude event rate data. Thus, the co- and pre-seismic GPS data of the 2005 Nias–Simeulue event (Mw 8.6) can be used to estimate the seismicity rate by estimating the return period.
The LSC in this study is applied to estimate the horizontal displacement in every10 × 10 km2 cell of the study area. The cell’s position in this study area is the same as in the previous study (Triyoso et al., 2020). Before estimating the horizontal displacement in each cell, we need to evaluate the horizontal displacement prediction in each original data position. Figure 2 shows the results of the horizontal displacements of the co-seismic and pre-seismic GPS data. It appears that the results of the horizontal displacement estimation of both co- and pre-seismic GPS are good enough, in which the predicted horizontal displacement is close to the real data. An important finding based on the LSC shows that the area of relatively high horizontal crustal strain rate took place at around the relatively high horizontal crustal strain release caused by the earthquake event on March 28, 2005. It happened around Nias Island. This phenomenon explains that the tsunami is relatively small during this Mw 8.6 earthquake, or almost no tsunami was reported.
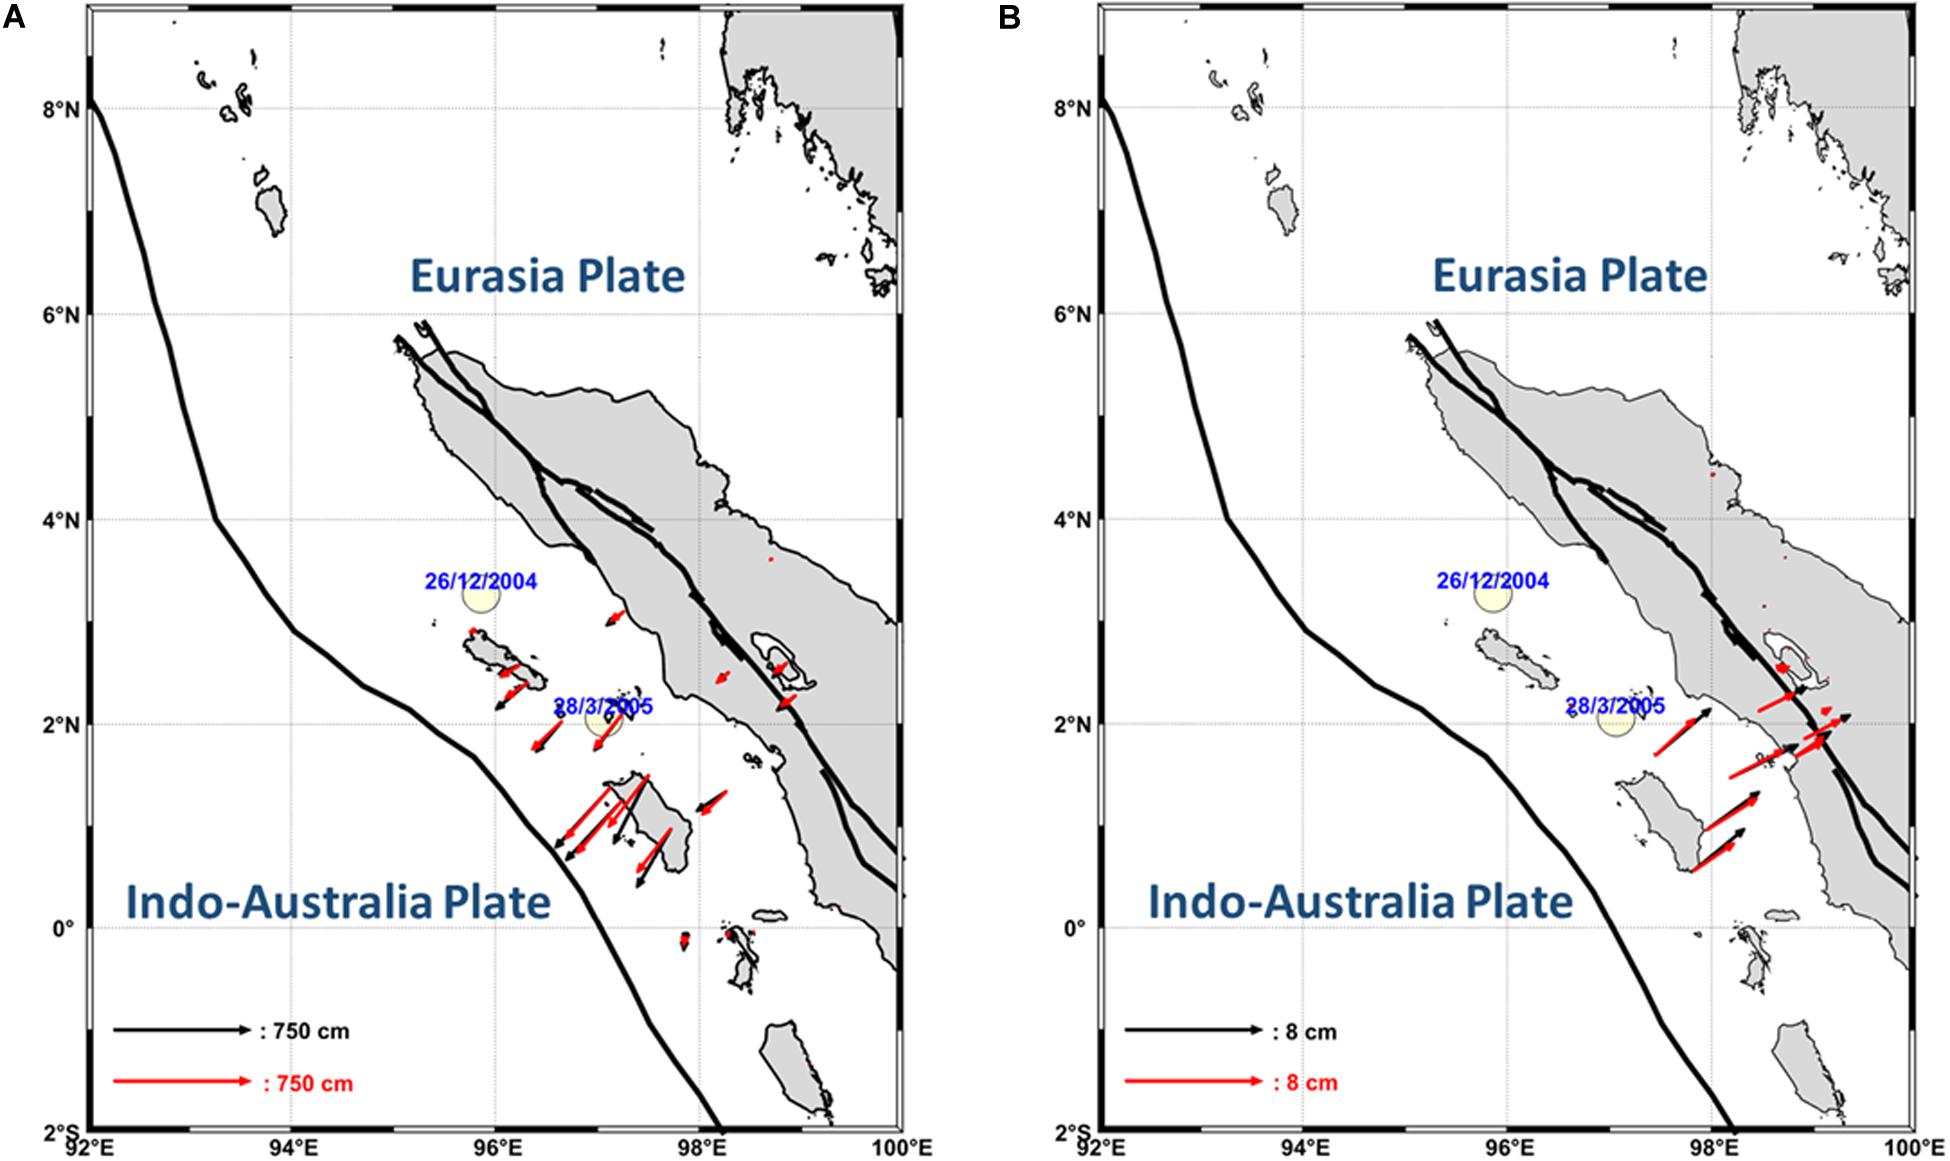
Figure 2. Results of both the horizontal displacements estimation (red) compared to real data (black) of the co-seismic (A) and pre-seismic (B) Global Positioning System (GPS) data. It appears that the results of the horizontal displacement estimation (red) and real data (black) of both the co- and pre-seismic GPS are close enough. An important finding based on the least square prediction (LSC) shows that the area of relatively high horizontal crustal strain rate took place at around the relatively high horizontal crustal strain release caused by the earthquake event on March 28, 2005. It happened around Nias Island.
In estimating the return period, the 2005 Nias–Simeulue event’s source are a needs to be defined first by summing up the seismic moment of the co-seismic GPS data. The result is then converted to the seismic moment’s entire source area into Mw, equal to 8.6 (Hanks and Kanamori, 1979). The model of the source area of the 2005 Nias–Simeulue is presented in Figure 3A. Using the source area of Mw8.6, we can sum up the seismic moment of the pre-seismic GPS data, shown in Figure 3B. The return period is then calculated by dividing the sum of seismic moments of the co-seismic GPS data by the sum of seismic moments of the pre-seismic GPS data for the same source area model. The sums of seismic moments of the co-seismic and pre-seismic GPS data over the entire source boundary are about 118.2 × 1027 and 0.94 × 1027 dyn.cm, respectively. We obtained the return period of Mw 8.6 as about 126 years.
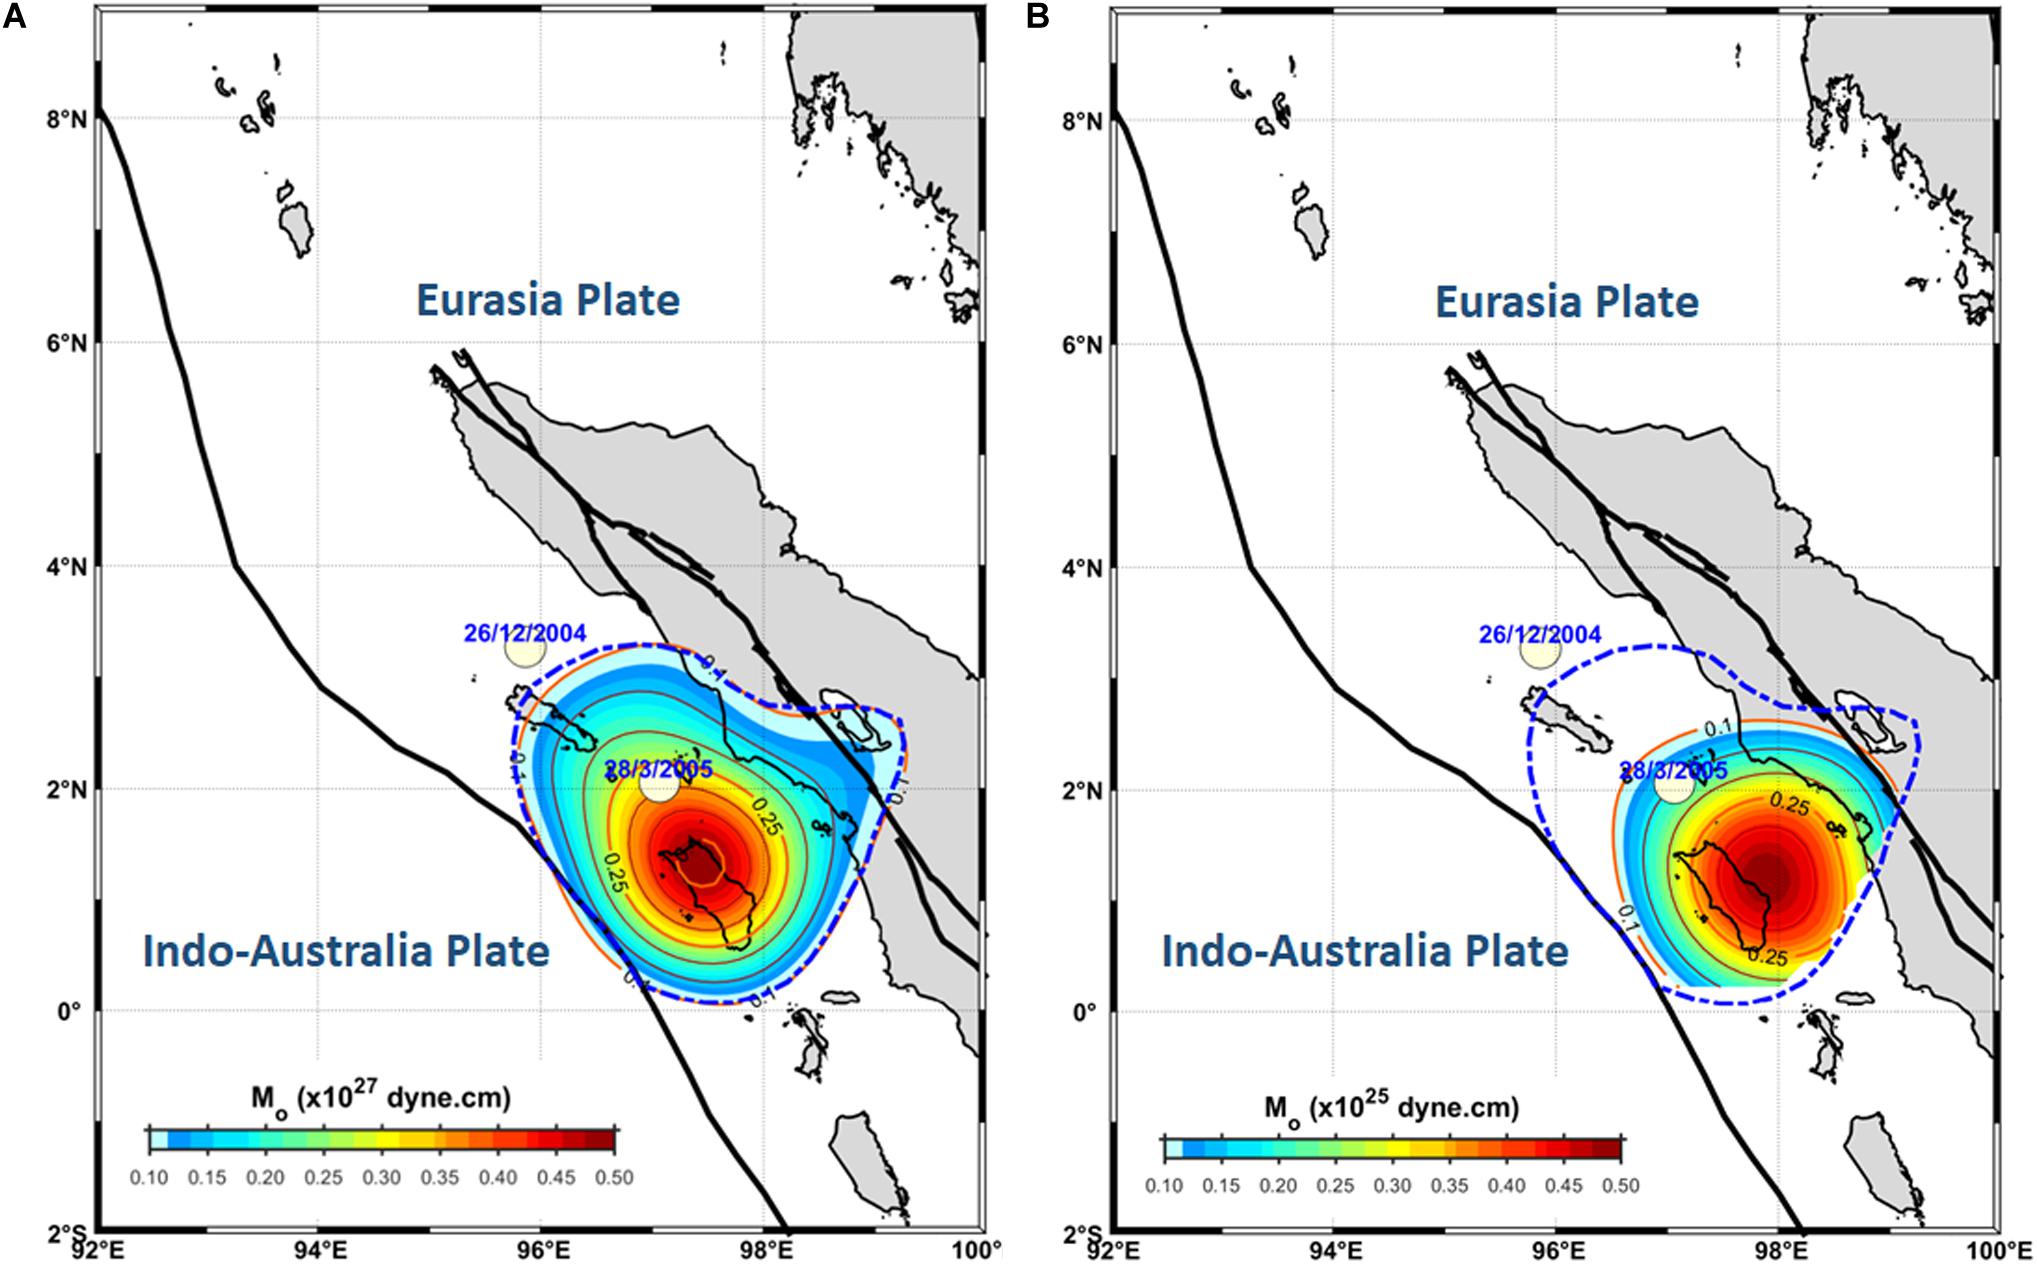
Figure 3. Estimated source are a based on the horizontal crustal strain estimated of the 2005 Nias–Simeulue event (Mw 8.6) co-seismic slip (A) and the selected pre-seismic moment rate the same as that of the source area event (B). The blue dash line is the boundary area. Using the Mw 8.6 event’s obtained source area, we could estimate the pre-seismic moment rate’s sum-up prior to Mw 8.6. Knowing the seismic moment in the pre- and co-seismic data of the 2005 Nias–Simeulue, the return period (T) of the Mw 8.6 event could then be estimated.
Thus, using the b-value ∼1, as shown in Figure 4A, we could estimate the 10a of Mw ≥ 5.0 of the study areas as illustrated in Figure 4B. Figure 4C shows the 10a of Mw ≥ 5.0 in the previous study (Triyoso et al., 2020). Figure 4C is derived based on integrating the seismicity rate model of the mean seismicity smoothing rate derived based on the correlation distances of 25, 50, and 150 km (Frankel, 1995) weighted by normalizing the estimated seismic moment rate model.
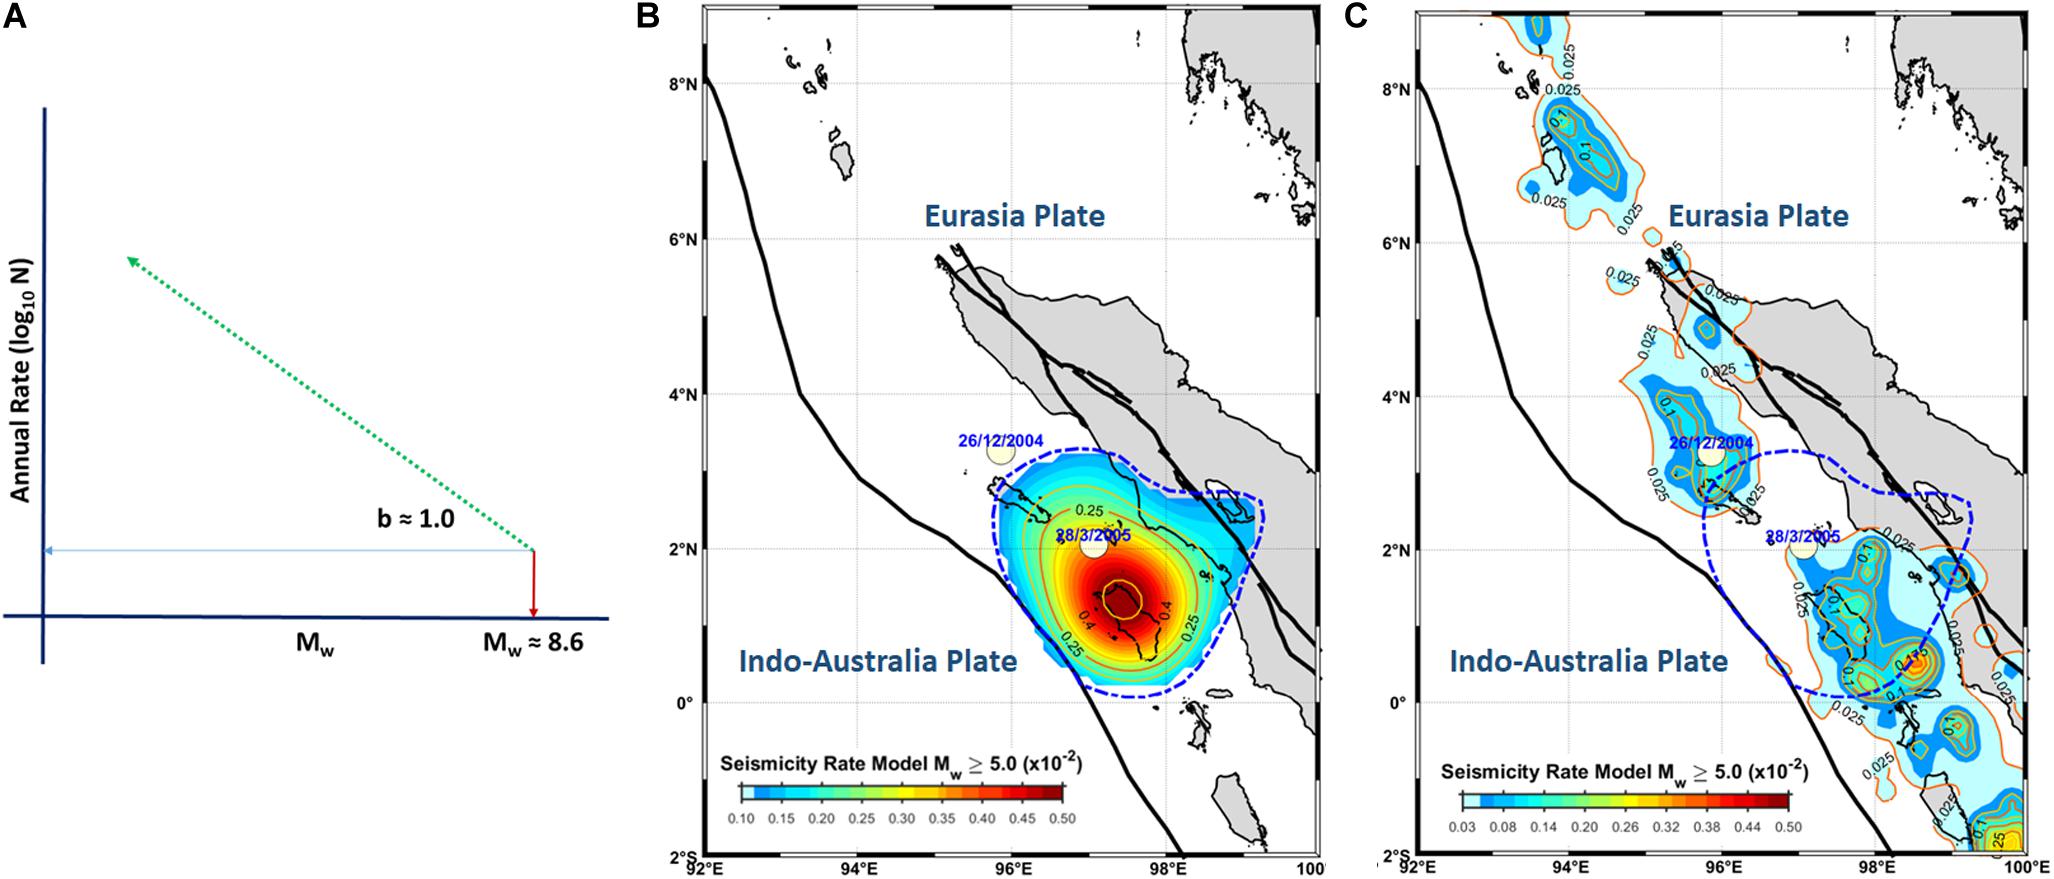
Figure 4. The Gutenberg–Richter (GR) model of seismicity was derived based on the horizontal crustal strain model with the b-value ∼1.0 (A) and the seismicity rate model of Mw ≥ 5.0 (B). The previous seismicity rate model of Mw ≥ 5.0 was derived based on integrating the seismicity rate model of the mean seismicity smoothing rate derived based on the correlation distances of 25, 50, and 150 km (Frankel, 1995) weighted by normalizing the estimated seismic moment rate model (C).
We could then estimate the horizontal crustal strain using Eq. (11). Furthermore, the seismic moment in each cell can be estimated using Eq. (1). We assumed the rigidity (μ) and the seismogenic depth (H) to be 3.4 × 10¹¹ dyn.cm–2 and 20 km, respectively (Triyoso et al., 2020). The Mw’s error obtained from the Mw 8.6 event, based on the horizontal crustal strain estimation, could be evaluated by calculating the estimated displacement and the average difference of the observed data. The range values are small, i.e., about ∼0.1 for the co-seismic data and ∼0.2 for the pre-seismic data.
Based on the result of 10a with Mw ≥ 5.0 and the b-value ∼1, the seismic hazard map expressed as the PGA of a 500 years return period at the base rock could be constructed. The SHF curve of the total probability of an exceedance value of 10% of earthquake events in 50 years versus the PGA values is also estimated. In this study’s probabilistic seismic hazard calculation, the maximum radius distance of about 100 km is used with the magnitude range of 6.0–8.6. The same magnitude range is also used to compare the SHF based on the previous study’s seismicity rate model. Thus, by using Eq. (17), the calculation of PGA is realized. Following the previous study, the SHF is constructed based on point source approximation.
The GMPE used in this study refers to the recommendation results of Triyoso et al. (2020). They are the GMPEs of Zhao et al. (1997) and Atkinson and Boore (2006). It was done as we wanted to analyze the impact of the different data sources in building the SHF off the west coast of northern Sumatra. Thus, we implement both models and calculate the mean of both solutions. Figure 5 shows an illustration of the processing flow in calculating the mean PGA of 10% PE in 50 years based on the GMPE (Triyoso et al., 2020) with the input of seismic rate modeling based on Figure 4B. Figure 5 shows that the epicenter of Mw 8.6 took place around the highest area of the PGA estimated. The relatively high PGA estimated in the present study is almost similar to that of the previous study, except for the closure of the highest area of the PGA estimated. The previous study shows that the PGA’s highest area closure took place around the southeast of Nias Island.
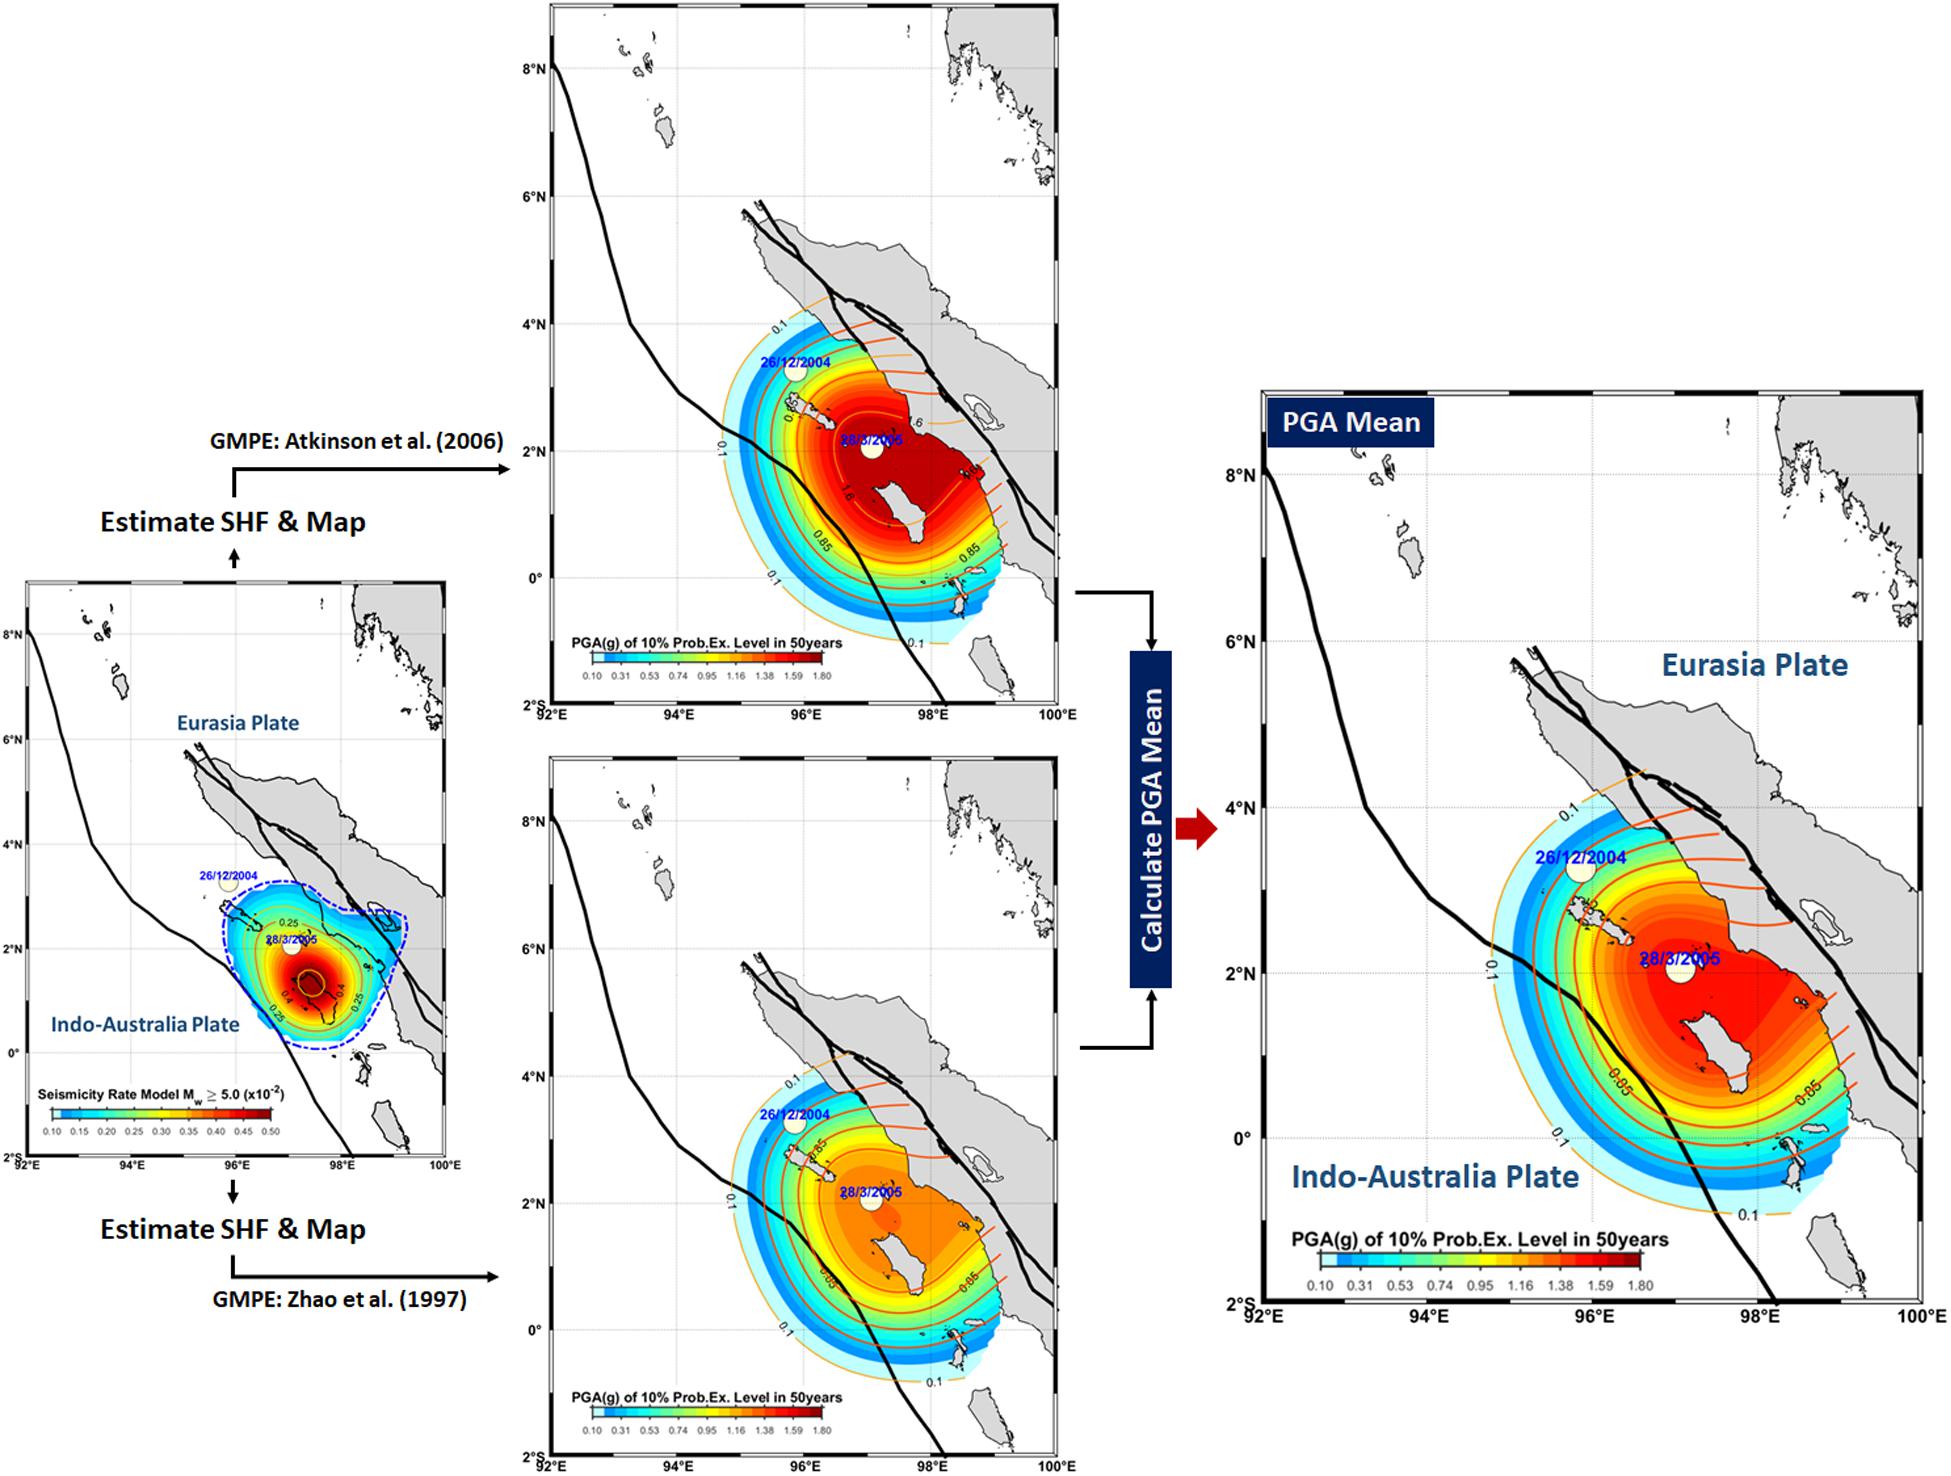
Figure 5. Detailed flow of the calculation of the mean peak ground acceleration (PGA) of 10% of exceedance probability in 50 years based on the ground motion prediction equations (GMPEs) obtained by Zhao et al. (1997) and Atkinson and Boore(2006) using the input of the seismic rate model of Mw ≥ 5.0 (Figure 4B). It shows that the epicenter of Mw 8.6 took place at around the highest area of the PGA estimated.
In comparing the probabilistic seismic hazard analysis with the previous study, we pick the area with a relatively high PGA estimated of the present and the previous study and plot the SHF as shown in Figure 6. The previous study’s earthquake seismicity rate model is based on Triyoso et al. (2020), and the geological rate is based on Bilham et al. (2005). The result shows that the SHF based on the horizontal crustal strain model tends to be higher than the SHF derived from the earthquake catalog and geological rate.
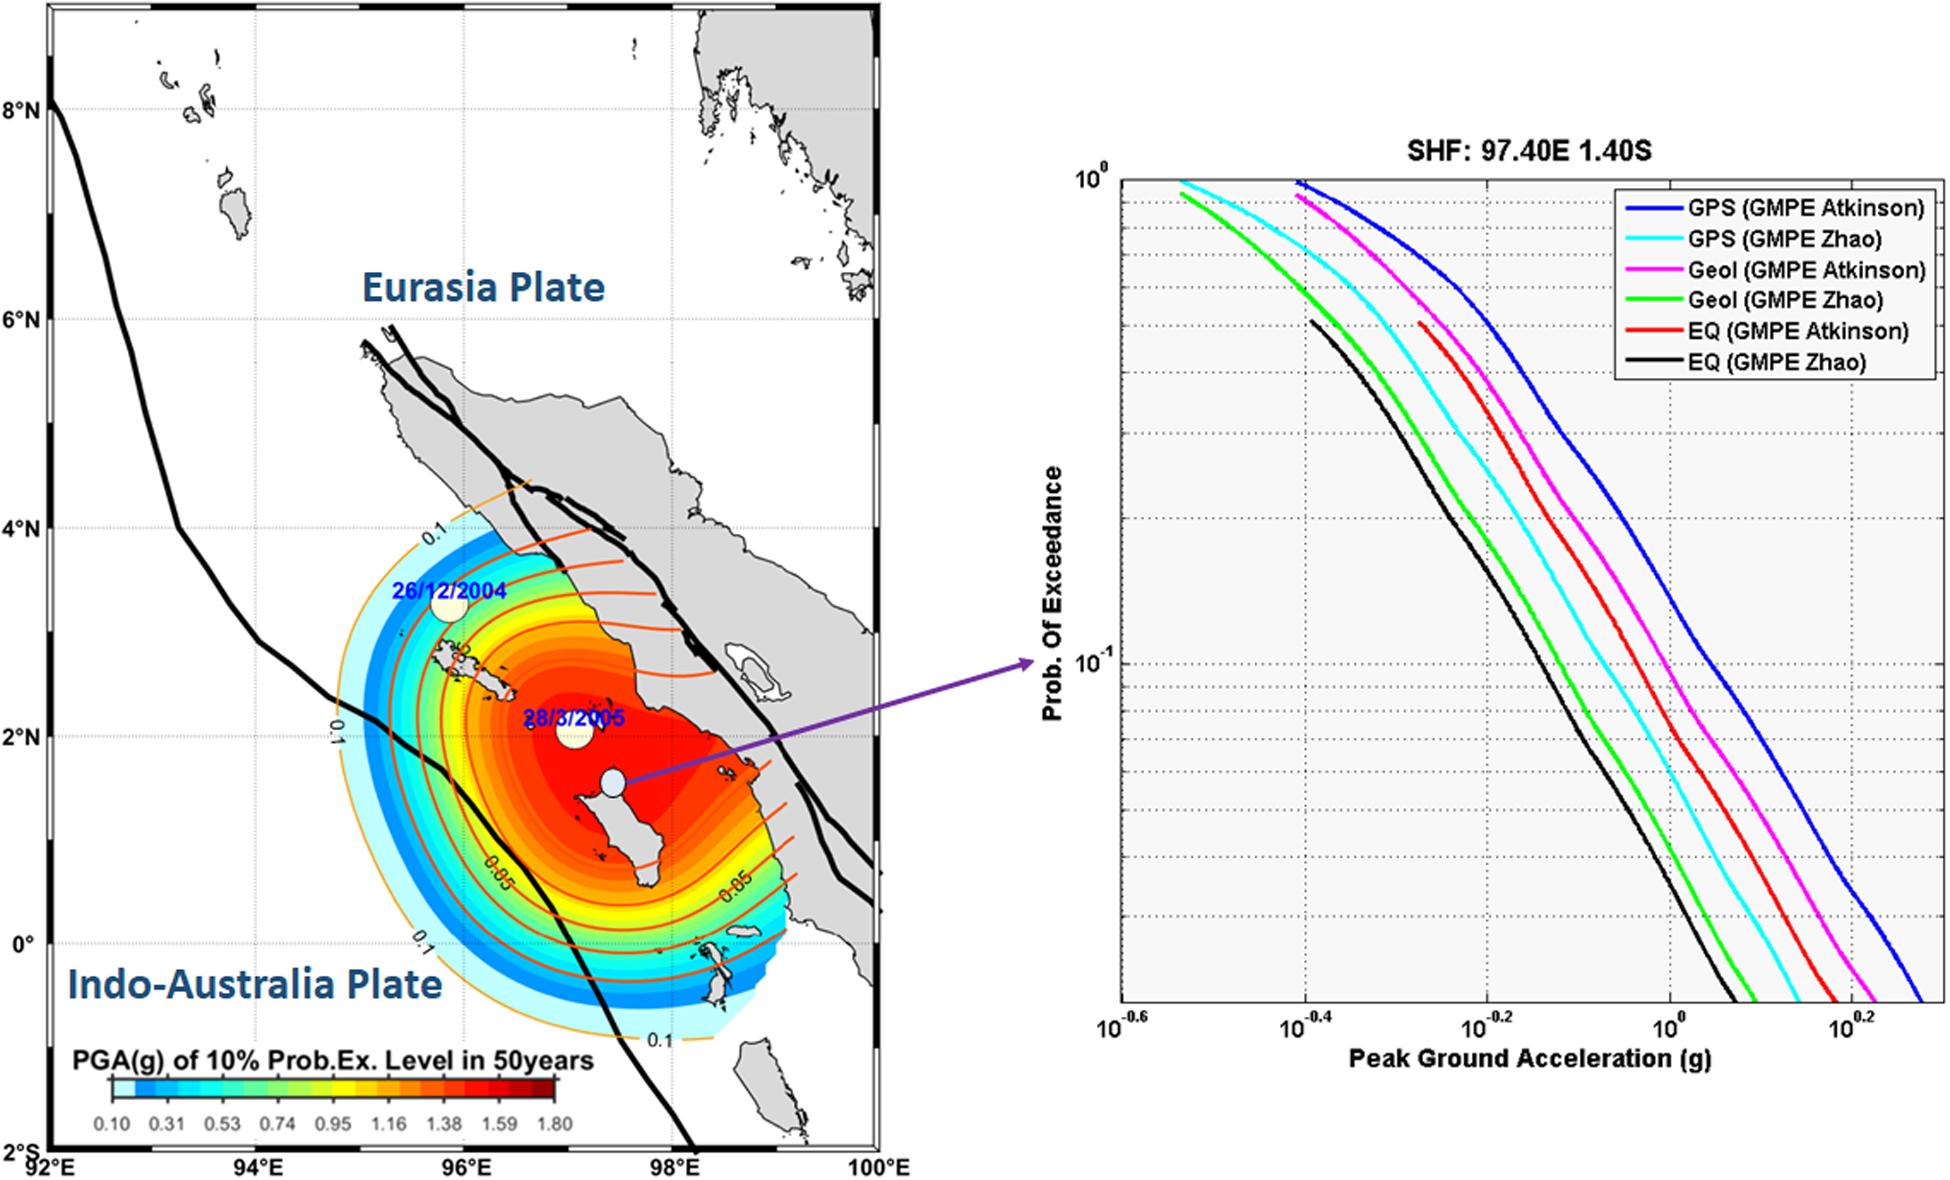
Figure 6. The seismic hazard function (SHF) based on the horizontal crustal strain data model (SHF-GPS) compared to the SHF based on the earthquake catalog and geological data. The SHF-GPS tends to be higher than the SHF derived from the earthquake catalog and geological data. In comparing the probabilistic seismic hazard analysis with the previous study, we pick the area with a relatively high PGA estimated in the present and the previous study and plot the SHF.
The previous study of the Coulomb failure stress (CFS) (Pollitz et al., 2006) estimated that the Mw9.1 event caused increased static stress loading in the Mw 8.6 event by about 0.25 bar in the study area. Steacy et al. (2005) pointed out that stress transfer leads to changes in the probability of earthquake occurrence for large earthquakes and aftershocks. Therefore, the phenomenon of increasing SHF or probability of exceedance of earthquake occurrence in this study is then associated with previous studies on the CFS. We interpreted that the increasing SHF obtained in this study is most likely due to the increase in the region’s stress load, which was well documented by the GPS data. As shown in Figure 6, increasing the CFS by about 0.25 bar (Pollitz et al., 2006) could increase the PGA level by nearly 0.1. The result may be very beneficial for earthquake mitigation and modeling efforts for probabilistic seismic hazard study and future analysis, especially in the Sumatra area.
Conclusion
The SHF analysis off the west coast of northern Sumatra is challenging since there is a lack of information regarding geology, geodesy, and seismological records of seismicity. The result shows that SHF based on the horizontal crustal strain data model tends to be higher than the SHF based on the earthquake catalog and the SHF result based on geological rate. We interpreted that the increasing SHF is most likely due to the increase in the region’s stress load. It is suggested that it was the increased stress loading on December 26 of the 2004 event. This is confirmed by the results of a previous study on CFS, in which it was pointed out that the Mw 9.1 event caused an increased CFS on the Mw 8.6 event by about 0.25 bar (Pollitz et al., 2006). This study’s critical finding is that increasing static stress could increase the probability of exceedance of the PGA level in the SHF compared. The increase of the CFS by about 0.25 bar (Pollitz et al., 2006) could increase the PE of the PGA level by nearly 0.1. Owing to the wealth of GPS station data available on northern Sumatra, which recorded the pre- and co-seismic events in 2005 around the study area, the seismic hazard function around off the west coast of northern Sumatra could be well constrained and analyzed. Evidence from the Nias–Simeulue area is an example that clearly shows the effect of increasing static stress on the SHF. It is in line with what was pointed out by Petersen et al. (2004) regarding the possibility of a large increase in the potential for earthquake hazards between the Nias and Simeulue Islands. This increased hazard is based on an Mw 8.6 earthquake that occurred in 2005. The location of that event is very well constrained using GPS data distributed in the study area. Thus, this model represents the most updated seismic hazard function in the region. The results obtained in this studymay be very beneficial for earthquake mitigation and modeling efforts for probabilistic seismic hazard study and future analysis.
Data Availability Statement
The original contributions presented in the study are included in the article/supplementary material, further inquiries can be directed to the corresponding author/s.
Author Contributions
WT and DS contributed to the writing of the manuscript. Both authors contributed to the preparation of the manuscript.
Funding
This research was in part supported by the Riset P3MI ITB 2020 grant funded by the Research and Community Services (LPPM), the Institute of Technology, Bandung (ITB), Indonesia.
Conflict of Interest
The authors declare that the research was conducted in the absence of any commercial or financial relationships that could be construed as a potential conflict of interest.
Acknowledgments
We wish to thank the Global Geophysics Group, Faculty of Mining and Petroleum Engineering, Bandung Institute of Technology, for their support in producing this manuscript. We also wish to thank several reviewers for their suggestions and valuable comments.
References
Atkinson, G. M., and Boore, D. M. (2006). Earthquake ground-motion prediction equations for Eastern North America. Bull. Seismol. Soc. Am. 96, 2181–2205. doi: 10.1785/0120050245
Bender, B. (1983). Maximum likelihood estimation of b values for magnitude grouped data. Bull. Seismol. Soc. Am. 73, 831–851.
Bilham, R. G., Engdahl, E. R., Feldl, N., and Satyabala, S. P. (2005). Partial and complete rupture of the Indo-Andaman plate boundary 1847–2004. Seismol. Res. Lett. 76, 299–311. doi: 10.1785/gssrl.76.3.299
Bird, P. (2003). An updated digital model of plate boundaries. Geochem. Geophys. Geosyst. 4:1027. doi: 10.1029/2001GC000252
Bradley, K. E., Feng, L., Hill, E. M., Natawidjaja, D. H., and Sieh, K. (2017). Implications of the diffuse deformation of the Indian Ocean lithosphere for slip partitioning of oblique plate convergence in Sumatra. J. Geophys. Res. Solid Earth 122, 572–591. doi: 10.1002/2016jb013549
Chlieh, M., Avouac, J., Hjorleifsdottir, V., Song, T. A., Ji, C., Sieh, K., et al. (2007). Coseismic slip and afterslip of the great Mw 915 Sumatra-Andaman Earthquake of 2004. Bull. Seismol. Soc. Am. 97, S152–S173.
El-fiky, G. S. A. (1998). Temporal Change of Crustal Deformation and Interplate Coupling in the Tohoku District, Northeast Japan – A New Approach. Ph.D. Thesis, Tokyo Univ.
El-fiky, G. S. A., and Kato, T. (1999). Continuous distribution of the horizontal strain in the Tohoku district, Japan, predicted by least-squares collocation. Geodynamics 27, 213–236. doi: 10.1016/s0264-3707(98)00006-4
El-Fiky, G. S. A., Kato, T., and Oware, E. N. (1999). Crustal deformation and interplate coupling in the Shikoku district, Japan, as seen from continuous GPS observation. Tectonophysics 314, 387–399. doi: 10.1016/s0040-1951(99)00226-7
Field, E. H., Jackson, D. D., and Dolan, J. F. (1999). A mutually consistent seismic-hazard source model for Southern California. Bull. Seismol. Soc. Am. 89, 559–578.
Frankel, A. (1995). Mapping seismic hazard in the Central and Eastern United States. Seismol. Res. Lett. 66, 8–21. doi: 10.1785/gssrl.66.4.8
Grandori, G., Guagenti, E., and Petrini, V. (1984). “On the use of renewal process in seismic hazard analysis,” in Proceedings of the 8th World Conference on Earthquake Engineering, 1, (Japan: IAEE), 287–294.
GSHAP. (1999). The Global Seismic Hazard Assessment Program (GSHAP) 1992–1999. Ann. Geofis. 42, 957–1230.
Gutenberg, B., and Richter, C. F. (1944). Frequency of earthquake in California. Bull. Seismol. Soc. Am. 34, 185–188.
Hanks, T. C., and Kanamori, H. (1979). A moment magnitude scale. J. Geophys. Res. 84, 2348–2350. doi: 10.1029/JB084iB05p02348
Kato, T., El-Fiky, G. S., Oware, E. N., and Miyazaki, S. (1998). Crustal strain in the Japanese islands as deduced from GPS dense array. Geophys. Res. Lett. 25, 3445–3448. doi: 10.1029/98gl02693
Kostrov, V. V. (1974). Seismic moment and energy of earthquakes, and seismic flow of rock. Izv. Acad. Sci. USSR Phys. Solid SOC. 61, 285–301, 303–318; 48, 42–52; Earth 1, 23–44.
McCaffrey, R. (1991). Slip vectors and stretching of the Sumatran fore arc. Geology 19, 881–884. doi: 10.1130/0091-7613(1991)019<0881:svasot>2.3.co;2
McGuire, R. (1976). FORTRAN Computer Program for Seismic Risk Analysis. Open File Report 76—67. U.S: U.S. Geological Survey, 90.
Megawati, K., and Pan, T. (2001). “Estimation of ground motion in Singapore due to a great Sumatran subduction earthquake,” in The Eighth East Asia-Pacific Conference on Structural Engineering and Construction. (Singapore: Nanyang Technological University).
Megawati, K., and Pan, T. (2009). Regional seismic hazard posed by the mentawai segment of the sumatran megathrust. Bull. Seismol. Soc. Am. 99, 566–584. doi: 10.1785/0120080109
Mikhail, E. M., and Ackermann, F. (1976). Observations and Least Squares. Manhattan: Harper and Row, 497.
Molnar, P. (1979). Earthquake recurrence intervals and plate tectonic. Bull. Seismol. Soc. Am. 69, 115–133.
Moritz, H. (1978). Least-squares collocation. Rev. Geophys. 16, 421–443. doi: 10.1029/rg016i003p00421
Okada, Y. (1985). Surface deformation due to shear and tensile faults in a halfspace. Bull. Seismol. Soc. Am. 75, 1135–1154.
Okada, Y. (1992). Internal deformation due to shear and tensile faults in a halfspace. Bull. Seismol. Soc. Am. 82, 1018–1040.
Pan, T. C., Megawati, K., Brownjohn, J. M. W., and Lee, C. L. (2001). The Bengkulu, southern Sumatra, earthquake of 4 June 2000 (Mw = 7:7): another warning to remote metropolitan areas, Seism. Res. Lett. 72, 171–185.
Petersen, M., Harmsen, S., Mueller, C., Haller, K., Dewey, K., Luco, N., et al. (2007). Documentation for the Southeast Asia Seismic Hazard Maps, Administrative Report. USA: Geological Survey.
Petersen, M. D., Dewey, J., Hartzell, S., Mueller, C., Harmsen, S., Frankel, A. D., et al. (2004). Probabilistic seismic hazard analysis for Sumatra, Indonesia and across the Southern Malaysian Peninsula. Tectonophysics 390, 141–158. doi: 10.1016/j.tecto.2004.03.026
Pollitz, F. F., Banerjee, P., Burgmann, R., Hashimoto, M., and Choosakul, N. (2006). Stress changes along the Sunda trench following the 26 December 2004 Sumatra-Andaman and 28 March 2005 Nias earthquakes. Geophy. Res. Lett. 33:L06309. doi: 10.1029/2005GL024558
Prawirodirdjo, L., Bock, Y., Genrich, J. F., Puntodewo, S. S. O., Rais, J., Subarya, C., et al. (2000). One century of tectonic deformation along the Sumatran fault from triangulation and Global Positioning System surveys. J. Geophys. Res. 105, 28343–28361. doi: 10.1029/2000jb900150
Prawirodirdjo, L., McCaffrey, R., Chadwell, C. D., Bock, Y., and Subarya, C. (2010). Geodetic observations of an earthquake cycle at the Sumatra subduction zone: role of interseismic strain segmentation. J. Geophys. Res. Solid Earth 115:B03414.
Qiu, Q., Feng, L., Hermawan, I., and Hill, E. M. (2019). Coseismic and postseismic slip of the 2005 Mw 8.6 Nias-Simeulu earthquake: spatial overlap and localized viscoelastic flow. J. Geophys. Res. Solid Earth 124, 7445–7460. doi: 10.1029/2018jb017263
Savage, J. C., and Simpson, R. W. (1997). Surface strain accumulation and the seismic moment tensor. Bull. Seismol. Soc. Am. 87, 1345–1353.
Shearer, P., and Burgmann, R. (2010). Lessons Learned from the 2004 Sumatra-Andaman Megathrust Rupture. Annu. Rev. Earth Planet Sci. 38, 103–131. doi: 10.1146/annurev-earth-040809-152537
Steacy, S., Gomber, J., and Cocco, M. (2005). Introduction to special section: stress transfer, earthquake triggering, and time-dependent seismic hazard. J. Geophys. Res. 110:B05S01.
Subarya, C., Chlieh, M., Prawirodirdjo, L., Avouac, J. P., Bock, Y., Sieh, K., et al. (2006). Plate-boundary deformation associated with the great Sumatra-Andaman earthquake. Nature 440, 46–51. doi: 10.1038/nature04522
Tim Pusat Studi Gempa Nasional-2017 (The 2017 PuSGen), (2017). Peta Sumber Dan Bahaya Gempa Indonesia Tahun 2017. Jakarta: Kementrian Pekerjaan Umum dan Perumahan Rakyat (In Indonesian).
Triyoso, W., and Shimazaki, K. (2012). Testing various seismic potential models for hazard estimation against a historical earthquake catalog in Japan. Earth Planets Space 64, 673–681. doi: 10.5047/eps.2011.02.003
Triyoso, W., Suwondo, A., and Naibaho, Z. Y. X. (2021). Earthquake Potential Hazard Analysis of Palembang City, Sumatra Island. Indones. J. Geosci. 8, 1–9. doi: 10.17014/ijog.8.1.1-9
Triyoso, W., Suwondo, A., Yudistira, T., and Sahara, D. P. (2020). Seismic Hazard Function (SHF) study of coastal sources of Sumatra Island: SHF evaluation of Padang and Bengkulu cities. Geosci. Lett. 7:2. doi: 10.1186/s40562-020-00151-x
Ward, S. N. (1994). A multidisciplinary approach to seismic hazard in Southern California. Bull. Seismol. Soc. Am. 84, 1293–1309.
Ward, S. N. (1998). On the consistency of earthquake moment rates, geological fault data, and space geodetic strain: the United States. Geophys. J. Int. 134, 172–186. doi: 10.1046/j.1365-246x.1998.00556.x
Working Group California Earthquake Probabilities [WGCEP], (1995). Seismic hazard in California: probable earthquakes, 1994 to 2024. Bull. Seismol. Soc. Am. 85, 379–439.
Wiemer, S. (2001). A software package to analyze seismicity: ZMAP. Seismol. Res. Lett. 72, 373–382. doi: 10.1785/gssrl.72.3.373
Zachariasen, J., Sieh, K., Taylor, F. W., and Hantoro, W. S. (2000). Modern vertical deformation above the Sumatran Subduction Zone: paleogeodetic insights from coral microatolls. Bull. Seismol. Soc. Am. 90, 897–913. doi: 10.1785/0119980016
Keywords: horizontal crustal strain, least-squares prediction, seismicity rate model, seismic hazard function, peak ground acceleration, probability of exceedance
Citation: Triyoso W and Sahara DP (2021) Seismic Hazard Function Mapping Using Estimated Horizontal Crustal Strain Off West Coast Northern Sumatra. Front. Earth Sci. 9:558923. doi: 10.3389/feart.2021.558923
Received: 15 January 2021; Accepted: 02 March 2021;
Published: 28 April 2021.
Edited by:
Chong Xu, Ministry of Emergency Management, ChinaReviewed by:
Qi Yao, China Earthquake Networks Center, ChinaXiaoyi Shao, China Earthquake Administration, China
Weijin Xu, China Earthquake Administration, China
Copyright © 2021 Triyoso and Sahara. This is an open-access article distributed under the terms of the Creative Commons Attribution License (CC BY). The use, distribution or reproduction in other forums is permitted, provided the original author(s) and the copyright owner(s) are credited and that the original publication in this journal is cited, in accordance with accepted academic practice. No use, distribution or reproduction is permitted which does not comply with these terms.
*Correspondence: Wahyu Triyoso, d3RyaXlvc29AZ21haWwuY29t