 Ji-In Jung
 Julie A. Bowles
- Department of Geosciences, University of Wisconsin-Milwaukee, Milwaukee, WI, United States
Microbialites–layered, organosedimentary deposits–exist in the geologic record and extend back in deep time, including all estimated times of inner core nucleation. Microbialites may preserve magnetic field variations at high-resolution based on their estimated growth rates. Previous studies have shown that microbialites can have a stable magnetization. However, the timing and origin of microbialite magnetization were not well determined, and no study has attempted to evaluate whether actively growing microbialites record the geomagnetic field. Here, we present centimeter-scale magnetization and magnetic property variations within the structure of modern microbialites from Great Salt Lake (GSL), United States, and Laguna Bacalar, Mexico, Pleistocene microbialites from GSL, and a Cambrian microbialite from Mongolia. All samples record field directions close to the expected value. The dominant magnetic carrier has a coercivity of 35–50 mT and unblocking temperatures are consistent with magnetite. A small proportion of additional high coercivity minerals such as hematite are also present, but do not appear to appreciably contribute to the natural remanent magnetization (NRM). Magnetization is broadly consistent along microbialite layers, and directional variations correlate with the internal slope of the layers. These observations suggest that the documented NRM may be primarily detrital in origin and that the timing of magnetization acquisition can be close to that of sediment deposition.
Introduction
Recent work demonstrates the potential of speleothems as paleomagnetic recorders. These laminated cave deposits form by precipitation of carbonate and include detrital or authigenic magnetic particles that appear to document paleosecular variation (PSV) at high temporal resolution (e.g., Lascu and Feinberg, 2011; Bourne et al., 2015; Chou et al., 2018; Trindade et al., 2018). Stromatolites are also finely laminated carbonate materials, thought to have often formed by a microbially-mediated balance between sedimentation and intermittent lithification (Reid et al., 2000). Compared to speleothems, stromatolites are well represented in the geologic record, and the oldest examples go back at least 3.5 billion years (e.g., Awramik, 1992; Riding, 2010; Baumgartner et al., 2019). This spans all estimated times of inner core nucleation, which range from the late Archean to early Proterozoic (2.4–2.5 Ga) (e.g., Tarduno et al., 2006; Valet et al., 2014), to Mesoproterozoic times (∼1.2 Ga) (e.g., Biggin et al., 2015; Smirnov et al., 2016), to the Ediacaran period (∼570 Ma) (e.g., Bono et al., 2019). These materials may, therefore, hold promise as paleomagnetic recorders with high temporal resolution, and this type of record in deep time could have potential for capturing geomagnetic field behavior when the core may have been in different states.
Modern stromatolites have widely varying estimated growth rates ranging from 0.05 mm/yr to about 50 mm/yr (Paull et al., 1992; Brady et al., 2009; Berelson et al., 2011; Petryshyn et al., 2012). Laminations (when present), represent hiatal periods in sediment accretion, are thought to form approximately every 4–10 years in some studied stromatolites (Paull et al., 1992; Petryshyn et al., 2012), with one study finding yearly laminations (Rasmussen et al., 1993). In modern stromatolites (Reid et al., 2000), microbial filaments trap and bind sand and carbonate grains during periods of rapid accretion. During hiatal periods, a continuous exopolymer surface film develops, and bacterial activity promotes formation of a thin micritic crust which may be further modified into a thicker, fused carbonate crust. These laminated crusts therefore represent a sequence of lithified and preserved microbial mat surfaces. Laminations in ancient (>1 billion year old) stromatolites have been interpreted to represent day-night growth cycles (e.g., Vanyo and Awramik, 1982), although these interpretations have been increasingly called into question in light of the work on modern stromatolites mentioned above.
In this work, we look more broadly at microbialites, an umbrella term that includes at least some stromatolites. Burne and Moore (1987) define microbialites as organosedimentary deposits accreted by a benthic microbial community via trapping and binding detrital sediment and/or precipitation of calcite (abiotic or biologically induced). Microbialites have a relatively wide environmental distribution, found at the sediment-water interface in marine, alkaline freshwater, hypersaline lakes, evaporitic, and hydrothermal environments. They can be classified by different internal structures as stromatolite (laminated structure), thrombolite (clotted structure lacking lamination), dendrolite (dendritic structure), leolite (structureless), or some intergradational combination (Riding, 2000; Riding, 2011). Stromatolite diversity abundance increased from the late Archean (∼2.4 Ga), peaking around ∼1.25 Ga (Awramik and Sprinkle, 1999). Diversity declined up to the Eradican (∼550 Ma) (Walter and Heys, 1985; Awramik and Sprinkle, 1999), but resurged in the early Phanerozoic and late Cambrian when thrombolites and dendrolites became the predominant type of microbialite (Riding, 2000; Kiessling, 2002). Grazing and metazoan competition have been suggested as a major factor contributing to the decline of stromatolite diversity, but other factors such as seawater chemistry and atmospheric composition could also affect their diversity (Riding, 2006). There are some arguments that not all Archean stromatolites are biogenic in origin (Lowe, 1994; Brasier et al., 2004; McLoughlin et al., 2008) but this interpretation remains controversial (Awramik and Graey, 2005; Allwood et al., 2006; Awramik, 2006; Schopf et al., 2007).
A primary magnetization in microbialites may arise from a detrital remanent magnetization (DRM) or a biogenic magnetization, or some combination of the two. Microbialites may trap detrital ferromagnetic (sensu lactu) particles from nearby sources within the microbialite matrix and carry a DRM. Lund et al. (2010) examined coral reef cores and observed detrital titanomagnetite bound within microbialites that had filled the primary cavities of the coral framework. These grains were determined to carry the natural remanent magnetization (NRM) and appeared to accurately record geomagnetic field variability. A DRM may also be biomediated in that the sticky microbial mat may play a role in particle retention and immobilization. Petryshyn et al. (2016) used bulk magnetic susceptibility to differentiate between stromatolites that are biogenic or abiogenic in origin and demonstrated that a cyanobacterial mat traps and binds grains more readily than abiogenic carbonate precipitates.
The other potential source of magnetic particles is biogenic magnetite which can be produced by biologically controlled mineralization (BCM) and biologically induced mineralization (BIM). Magnetotactic bacteria can create single-domain magnetic particles in chains by a matrix mediated BCM process. The presence of biogenic magnetite has been inferred in ancient (Chang et al., 1989) and modern (Stolz et al., 1989) microbialite environments by using rock magnetic techniques and transmission electron microscopy (TEM) to identify single domain magnetite with the unique crystal structures typically associated with magnetotactic bacteria. However, it has since been demonstrated that similar crystal morphologies can also be produced abiotically through reductive alteration of nanogoethite (Till et al., 2017) or via thermal decomposition of siderite (Golden et al., 2004). Maher and Taylor (1988) also observed similar fine-grained magnetite in soils and suggested that it may have formed via oxidation of Fe2+ solutions (Taylor et al., 1987). Biogenic magnetite might also be produced extracellularly by iron-reducing bacteria through BIM processes (Lovley, 1991; Konhauser et al., 2011; Konhauser and Riding 2012). Maloof et al. (2007) used TEM and ferromagnetic resonance to infer the presence of superparamagnetic magnetite formed via extracellular processes. Although superparamagnetic material will not contribute to remanence, extracellular magnetite typically has a wide grain size distribution including grains that are large enough to have stable single domain behavior (e.g., Egli, 2004).
Relatively little paleomagnetic work has intentionally focused on microbialites. Vanyo and Awramik (1982) extracted a paleomagnetic direction via alternating field demagnetization from a single specimen of late Proterozoic stromatolite. Thermal demagnetization of Jurassic stromatolites from Poland have shown them to carry a stable magnetization, including a polarity reversal (Muraszko, 2014) also observed in middle-late Jurassic limestones, stromatolites, and radiolarites in Poland (Kądziałko-Hofmokl and Kruczyk, 1987). As noted above, microbialites found in a post Last-Glacial-Maximum and late Pleistocene coral reef framework appear to accurately record the field direction (Lund et al., 2010). Several studies have sampled in or near ancient carbonate beds containing microbialites. The Love’s Creek Member of the Bitter Springs Formation contains stromatolite and microbialite facies and was interpreted to be remagnetized through magnetite authigenesis along with the remainder of the section (Swanson-Hysell et al., 2012). However, the lower Ordovician Oneota dolomite which is locally stromatolitic carries a direction interpreted to be potentially primary (Jackson and Van der Voo, 1985), and Neoproterozoic dolomites containing microbialite laminites are interpreted to carry primary DRM (Trindade et al., 2003; Font et al., 2005). Maloof et al. (2007) sampled modern platform carbonate muds in the Bahamas and proposed that early cemented, laminated microbially-bound carbonates may preserve syn-depositional paleomagnetic directions. Few of these studies focus on the timing of magnetization with respect to microbialite formation, and no studies have attempted to evaluate whether actively growing microbialites accurately record the known field.
This study is designed to further assess the feasibility of microbialites as paleomagnetic recorders. We examined two actively growing or recently lithified microbialites, as well as one Cambrian microbialite. Variations in magnetization and magnetic mineralogy were evaluated at the centimeter scale. We also consider the timing of the magnetization with respect to deposition or microbialite growth.
Methods
Sampling and Settings
This study focuses on microbialites from three localities/environments: 1) Great Salt Lake (GSL), Utah, United States (hypersaline lake environment); 2) Laguna Bacalar (LB), Quintana Roo, Mexico (freshwater alkaline environment); 3) the Cambrian Bayan Gol (BG) formation, southwestern Mongolia (marine environment) (Figure 1). Detailed information about locations, sample types, and descriptions are provided in Table 1.
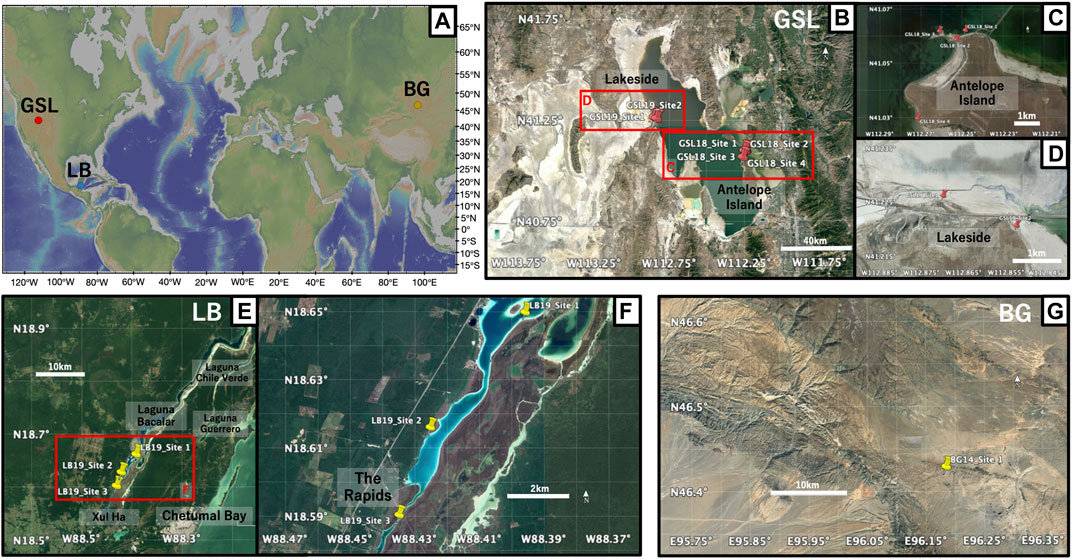
FIGURE 1. (A) Global map of the locations of three microbialite samples: Great Salt Lake (GSL), Utah; Laguna Bacalar (LB), Quintana Roo, MX; Bayan Gol formation (BG), Southwestern Mongolia. The figure was made with GeoMapApp (www.geomapapp.org) (Ryan et al., 2009). (B) Satellite image of the sampling locations of microbialites at GSL (C) Close-up of GSL18 study localities at the Antelope Island and (D) GSL 19 sampling sites at Lakeside. (E) Satellite image of sampling locations of microbialites at LB. (F) Close-up of LB19 study localities and three sampling sites. (G) Satellite image of sampling locations at BG. Imagery from July 2019 for GSL, april 2018 for LB, and april 2019 for BG, ©2019 Google, Image Landsat/Copernicus.
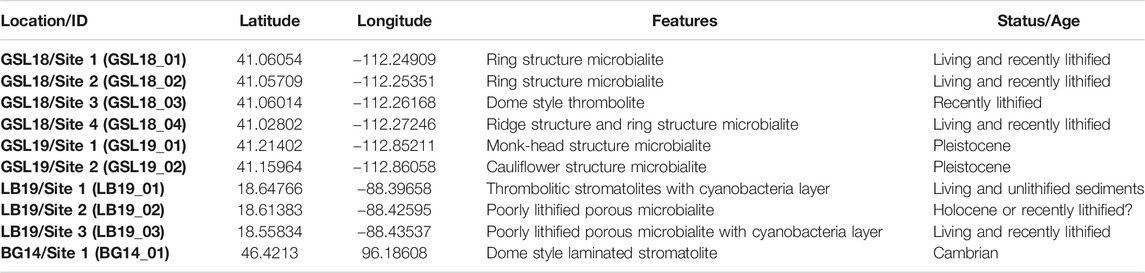
TABLE 1. Microbialite sample locations and descriptions.
At the Great Salt Lake, living and recently lithified modern microbialites were sampled from shallow water on the shores of Antelope Island in the southwestern part of the lake (GSL18). Samples were taken from living, low-profile ring-shaped structures and elongated, narrow ridge structures (Chidsey et al., 2015; Berg, 2019), but we were unable to maintain orientation, and the soft samples easily fell apart. These samples were preserved in lake water during transportation back to the laboratory. One oriented hand sample was collected from the steep side of a lithified, dome-style thrombolite structure that has been exposed by a lake level drop over the past few decades. Pleistocene microbialites are exposed along the western shoreline of the lake at Lakeside (Newell et al., 2017), and oriented hand samples were collected from two locations (GSL19).
Living deposits and lithified giant Holocene microbialites (Gischler et al., 2008; Castro-Contreras et al., 2014) were collected from shallow water at three sites at Laguna Bacalar. Microbialites from Site 1 are unlithified layered domal structure deposits with a stromatolitic structure at the bottom but transitioning to a more thrombolitic fabric toward the top (Figure 2C). The approximate thickness of the actively growing greenish microbial mat was ∼2 cm from the surface. Site 2 microbialites were lithified but porous. The Site 3 giant microbialites had soft surfaces including living cyanobacteria layers (∼2 cm) and lithified microbialites underneath. Living microbial mats on the surface at Site 1 (LB19_0101) and 3 (LB19_0304) were easily penetrated and collected by pushing standard 2 cm3 plastic cubes) into the mats. One hand sample from Site 1 (LB19_0102) was subsampled with 2 cm3 plastic cubes. Site 1 microbialites were additionally sampled with 5 cm diameter by 14 cm long (LB19_0103) and 7 cm diameter by 30 cm long (LB19_0104) plastic cores by push coring. Lithified samples were collected at Sites 2 and 3 using an electric drill with a 1 inch diamond coring bit. Soft samples collected by push core and directly in cubes were frozen after sampling.
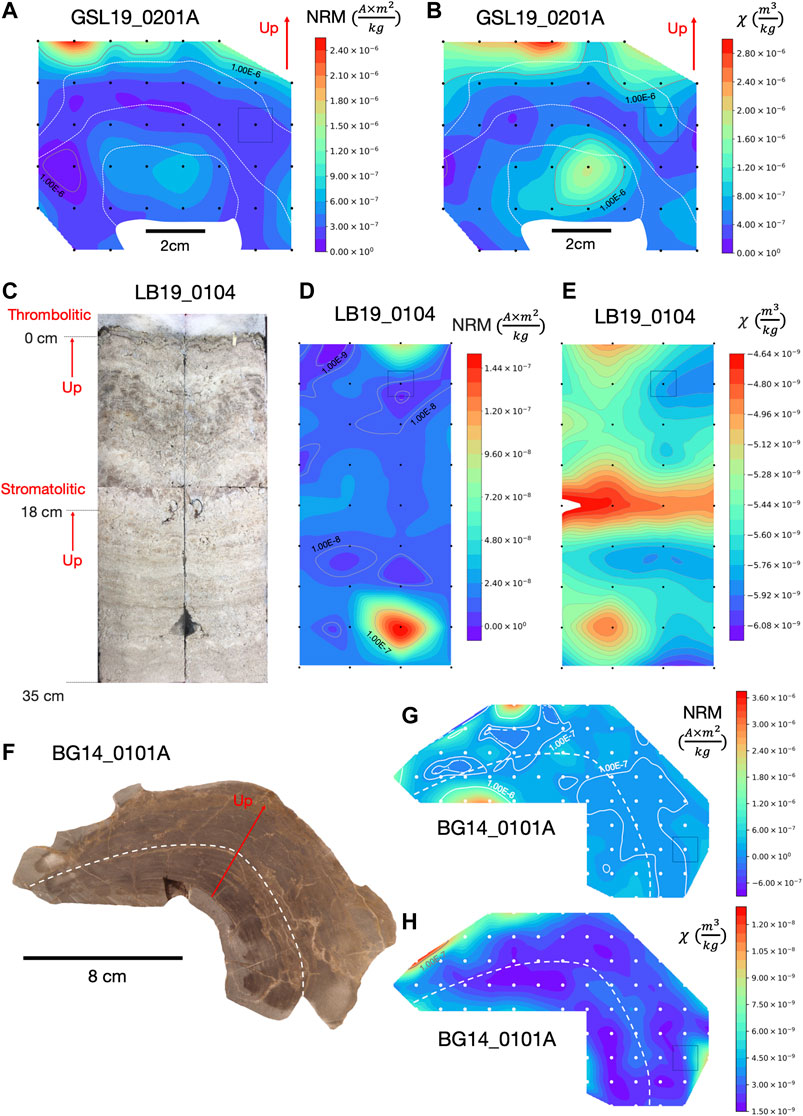
FIGURE 2. NRM intensity and magnetic susceptibility maps of microbialites with cubic interpolation to produce contours. (A) NRM intensity map and (B) magnetic susceptibility map of GSL19_0201A with approximate 1.5 cm spatial resolution. (C) Photo of split large push core (LB19_0104) from unlithified living microbialite with stromatolitic structures laminations up to 18 cm and thrombolitic structures from 18 cm to the top. (D) NRM intensity map and (E) magnetic susceptibility map of LB19_0104 with approximate 3.5 cm spatial resolution. (F) Photograph of BG14_0101 sample slice prior to sub-sampling, and (G) its NRM intensity map and (H) magnetic susceptibility map with approximate 1 cm spatial resolution. Color contours are on a linear scale but labeled gray contour lines show order of magnitude variations. Black or white dots are sample positions and the color bars represent NRM intensity (Am2/kg) and magnetic susceptibility (m3/kg) values in the color range. Gray squares illustrate approximate specimen sizes on sample maps. Solid (up) red arrow indicates up in the field and is similar to the sample growth direction. White dashed lines roughly represent locations of distinct laminations. The red arrow represents the up direction in the field, which is close to the growth direction.
A lower Cambrian stromatolite limestone head was taken from the middle of Unit 18 (Khomentovsky and Gibsher, 1996) of the Bayan Gol section within the Bayan Gol Formation. The sample was only oriented with respect to stratigraphic up, and with relatively high uncertainty as the sample was not originally collected for paleomagnetic study. The sample has parallel, but not horizontal, internal laminations (Figure 2F), consistent with convex-upward growth over a domal structure.
In the laboratory, lithified hand samples were sliced perpendicular to laminations or growth directions. Each slice was further subdivided along a grid forming samples of 1–1.5 cm3. These specimens, as well as the unoriented living GSL specimens, were immobilized in 2 cm3 plastic cubes using nonmagnetic paddings. Push cores from LB were split longitudinally while frozen and were then allowed to soften so they could be subsampled vertically every 3.5 cm using 2 cm3 cubes. Four specimens from each vertical horizon were collected. Electric drilled samples were cut into 2 cm long specimens. Types of samples and the number of sub-sampled specimens are listed in Table 2.
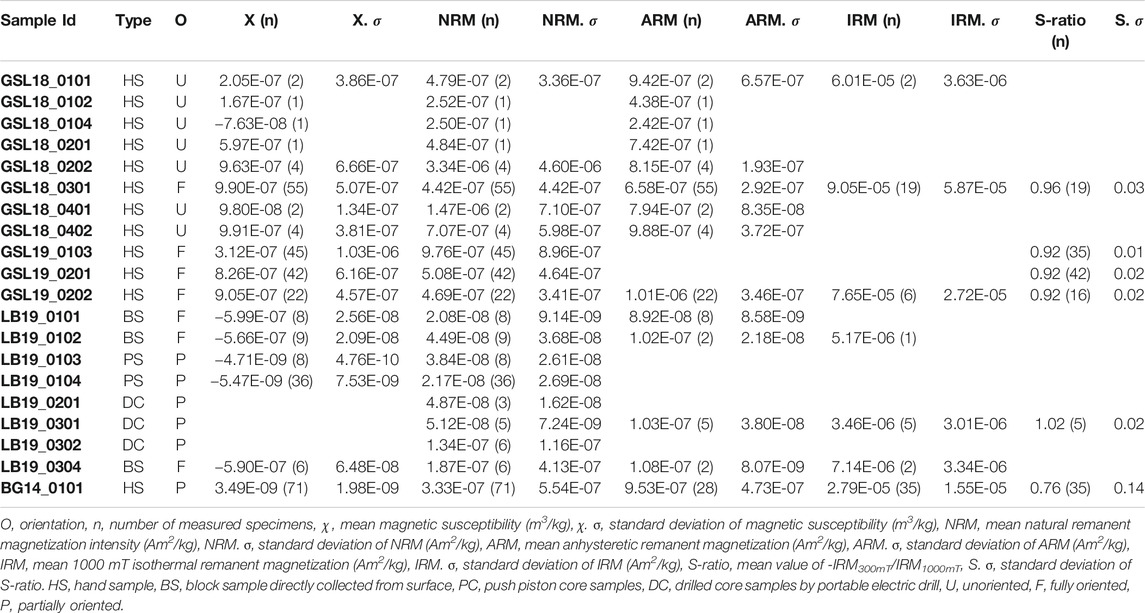
TABLE 2. Sample types and magnetic properties.
Magnetic Methods
NRM and magnetic susceptibility (
Following AF demagnetization, a single-step anhysteretic remanent magnetization (ARM) was acquired in a 150 mT AF with 0.05 mT bias field. An isothermal remanent magnetization (IRM) was acquired in steps between 0 mT and 1,000 mT on fully demagnetized specimens. Some specimens had already been exposed to high fields, and in this case a stepwise IRM was acquired starting from a backfield of -1,000 mT IRM. These two methods are symbolized as IRM0mT for the first case and IRM-1000mT for the second case. To calculate the S-ratio, fully AF-demagnetized (to 200 mT) specimens were given an IRM at 300 mT after an exposure to a saturation field at a 1,000 mT in the opposite direction. The S-ratio was calculated based on the formula of Thompson and Oldfieid, 1986 as S-ratio = −IRM300mT/IRM1000mT.
The first derivatives of IRM acquisition curves were unmixed mathmatically to provide information on coercivity distributions and magnetic mineral populations (e.g., Robertson and France, 1994). This was carried out using MaxUnmix (Maxbauer et al., 2016) online software which fits a set of skew normal distributions to the data. For each distribution, the mean coercivity (MC), dispersion parameter (DP), relative proportion, skewness, and standard deviations were obtained.
Finally, to better constrain magnetic mineralogy, selected specimens were subjected to thermal demagnetization of a 3-axis IRM (Lowrie, 1990). IRMs of 1,000, 300, and 100 mT were applied in three orthogonal directions to separate the hard, medium, and soft coercivity fractions, and specimens were then thermally demagnetized to 700°C.
Remanence measurements were made using a 2G Enterprises 755SRMS Superconducting Rock Magnetometer inside a magnetically shielded room. Magnetic susceptibilities were acquired using an AGICO MFK1-FA Multifunction Kappabridge susceptibility bridge. AF demagnetization and ARM acquisition were undertaken with an ASC D-2000 AF demagnetizer. Stepwise thermal demagnetization was undertaken by an ASC Thermal Demagnetizer, and IRM was imparted with an ASC Impulse Magnetizer. These measurements were all conducted at the Paleomagnetism Laboratory at the University of Wisconsin- Milwaukee. Additionally, magnetization vs. applied field (up to 1 T) measurements were conducted on a Princeton Measurements vibrating sample magnetometer at the Institute for Rock Magnetism, University of Minnesota. The samples were all weakly magnetic and had a high diamagnetic:ferrimagnetic or paramagnetic:ferrimagnetic ratio, and hysteresis parameters could not be accurately calculated. We instead report the high-field behavior of the samples.
Results
Magnetization Intensity and Susceptibility Variations
With the exception of LB samples, all samples possess an average NRM intensity 1.00E-07 Am2/kg. Table 2 displays average magnetic susceptibility, NRM, ARM and IRM1000mT with standard deviations of each sample. The NRM intensity measurements for all samples (>1.00E-11 Am2) were not limited by the sensitivity of the cryogenic SQUID magnetometer (∼1.00E-12 Am2 moment sensitivity limit). However, specimens with NRM intensity less than 1.00E-10 Am2 approach the magnetization of sample container (1.00E-13 to 1.00E-11 Am2).
To assess internal spatial variations in magnetization and distribution of magnetic minerals, mass-normalized magnetic susceptibility and NRM intensity of four GSL hand samples, two LB push core samples, and one BG hand sample were contoured by cubic interpolation (Figure 2). Spatial variations in magnetization within these microbialite structures were compared to their internal laminations with the aim of understanding magnetization processes and assessing NRM reliability.
Samples GSL19_0103, GSL19_0201, and GSL19_0202 have a spatial correlation between NRM intensity and magnetic susceptibility. GSL19 microbialite NRM and susceptibility vary along the growth directions and are consistent along internal laminations (Figures 2A,B, Supplementary Figure S1). With the exception of a high NRM intensity spot at the bottom right, LB19_0104 has roughly consistent NRM intensity distribution along internal structures (Figure 2D). The magnetic susceptibility mapping shows high values around 18 cm depth, the transition level where stromatolitic laminations changed to a thrombolytic structure (Figure 2E). BG14_0101 has roughly constant NRM intensity (Figure 2G) and magnetic susceptibilities (Figure 2H) along laminations, with a low value in middle layers compared to outer and bottom layers. Magnetic susceptibility and NRM of GSL18_0301 and LB19_0103 (not shown), which have a width less than 10 cm, have similar magnetic susceptibility and NRM intensity trends. However, no obvious correlations with laminations are observed within these small samples.
Magnetic Mineralogy
Results from all samples are consistent with magnetite as a dominant magnetic carrier. This component has a mean coercivity of ∼29–57 mT (Supplementary Table S1), consistent with single domain (SD) to ‘pseudo-single-domain' (PSD) minerals that have non-uniform spin behavior. Modern samples (e.g., GSL, LB) are dominated by this component and have large negative high-field diamagnetic slopes. The Cambrian BG sample, however, has a mixture of low- and high-coercivity minerals with positive high-field paramagnetic slopes (Supplementary Figure S2).
GSL18: The S-ratio range of 19 lithified GSL18_0301 specimens is 0.92–1.06, with an average of 0.96, indicating that low coercivity ferrimagnetic minerals such as magnetite are dominant. Based on IRM unmixing results, the dominant magnetic components of the GSL18 living and GSL18_0301 lithified specimens have a mean coercivity of ∼56 mT for four IRM0mT unmixing results and ∼38 mT for four IRM-1000mT unmixing results, with similar DPs of 2.7 mT. Coercivity spectra derived from IRM acquisition data for all specimens are shown in Figure 3. There is little variability between living and lithified specimens from the same site. The three-component IRM demagnetization experiment shows a gradual decrease of the soft (71–78%) and medium (17–23%) coercivity fractions to 575°C and flattening after 620°C (Figure 4A). This gradual unblocking is consistent unblocking of domain walls, but may also represent some compositional variability. A high-coercivity fraction contributes <7% to the total IRM, and measurement noise made it difficult to evaluate a maximum unblocking temperature.
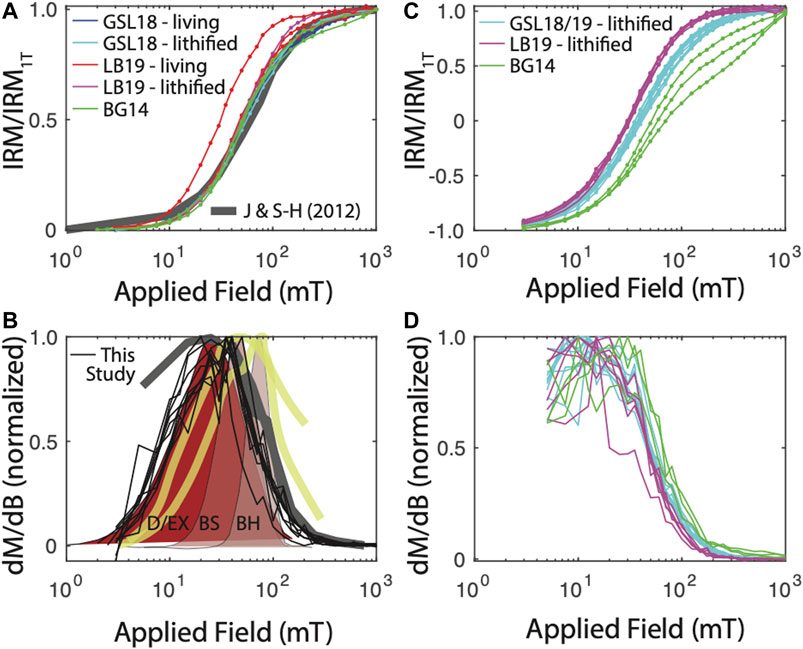
FIGURE 3. IRM acquisition results. (A) IRM acquisition starting from the AF-demagnetized state. For comparison, IRM acquisition curves for two remagnetized carbonates are shown (Jackson and Swanson-Hysell, 2012). (B) Derivative of IRM acquisition, normalized to peak value to better compare spectra. Data from (A) shown in thin black lines. For comparison, data from Jackson and Swanson-Hysell (2012) in thick gray line. Surface carbonate platform muds in thick yellow lines (Maloof et al., 2007). Biogenic hard (BH), biogenic soft (BS), and detrital + extracellular (D/EX) shown in shaded brown from Egli (2004). Maloof et al. (2007) and Egli (2004) distributions derived from AF demagnetization of a 300–350 mT IRM and are therefore not strictly analagous to data from this study. (C) Backfield IRM acquisition and (D) derivative.
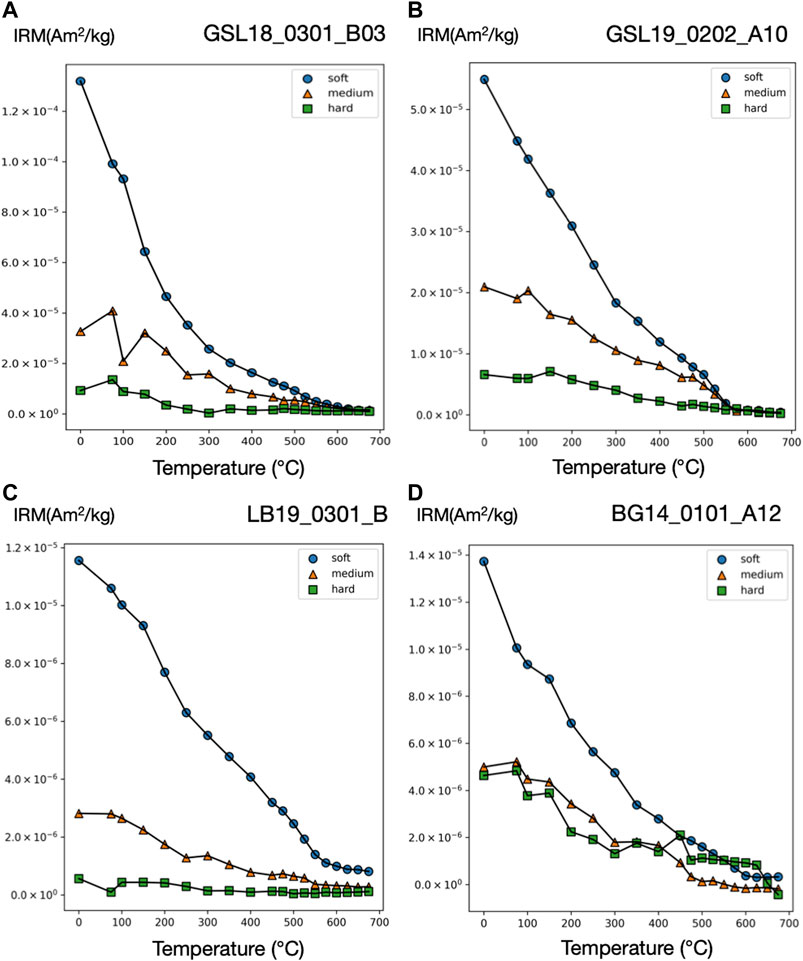
FIGURE 4. Three-component IRM technique thermal demagnetization results for microbialite samples (A) GSL18 (B) GSL19 (C) LB19, and (D) BG14. Three-component IRM (Am2/kg) produced with applied field of 100 mT (soft), 300 mT (intermediate), and 1,000 mT (hard). Soft, medium, and hard fractions are shown as blue circle, orange triangle, and green square, respectively. Additional plots are included in Supplementary Figure S4.
GSL19: The average S-ratio value of 93 GSL19 specimens is slightly lower than GSL18, with an average of 0.92 and a range of 0.87–0.96 (Table 2). All three GSL19 samples have a spatially correlated NRM intensity and S-ratio. High NRM correlates with high S-ratio (Supplementary Figures S1, S3). Only a single magnetic component can be confidently identified in six specimens of the Pleistocene GSL19_0202 based on IRM-1000mT unmixing. This dominant component has a mean coercivity of 38 mT with a DP of 3.1 mT, again consistent with SD to ‘PSD’-like magnetite. The soft (68–73%) and medium (22–26%) coercivity fractions flatten out at ∼580°C in the three-component IRM test (Figure 4B). Although a higher-coercivity component was not identified in the relatively noisy IRM unmixing data, hard minerals comprise a small fraction (5–8%) of the three-component IRM and gradually decrease to 675°C, consistent with hematite.
LB19: LB results are similar to those observed in GSL18 specimens. The S-ratio range of five LB19_0301 specimens is 0.99–1.05 with a mean value of 1.02, again consistent with low-coercivity minerals like magnetite. LB19_0102, 0301, and 0304 were subjected to IRM unmixing experiments and all LB microbialites have a consistent dominant component with a mean coercivity of 28–50 mT with a DP of 2.2–2.9. No major differences are observed between living microbial sediments and lithified microbialite samples in terms of component numbers, major MC, or DP. In the three-component IRM experiment, the low-coercivity fraction accounted for the highest proportion (75–81%) of IRM for 4 specimens of LB19_0301. This component gradually decreased and flattened out after 575°C–600°C, indicating magnetite (Figure 4C). With the exception of LB19_0301_C, the medium coercivity (17–22%) components have maximum unblocking temperatures of 550°C, and there is no significant hard coercivity fraction (<5%) (Supplementary Figure S4).
BG14: Unlike the GSL and LB samples, the BG stromatolite has variable magnetic mineralogy with a large S-ratio range from 0.42 to 0.95 (Figure 5). Low coercivity minerals are present in higher concentrations in inner layers and high coercivity minerals occur in outermost layers except two points at the left top. This is also shown in IRM acquisition (Figure 3C) and unmixing curves (Figures 3D, 5) where outer layers have a significant high coercivity component (purple lines in Figure 5). Based on the three-component IRM results (Figure 4D), the soft fraction is the largest (51–69%) and gradually unblocks up to ∼575°C, again consistent with magnetite. The medium fraction (20–25%) decreases to ∼300–350°C for low S-ratio specimens (e.g., BG14_0101_A05 and 12), consistent with titanomagnetite and/or pyrrhotite. The medium fraction in high S-ratio specimens additionally decreases to ∼650°C (e.g., BG14_0101_A12 and 70), consistent with (titano)hematite and/or thermally stable maghemite (Supplementary Figure S4). The hard fraction of low S-ratio and high S-ratio specimens accounts for 20–30% and <12% of the IRM, respectively. This fraction decreases to about 625°C–675°C, consistent with the presence of hematite.
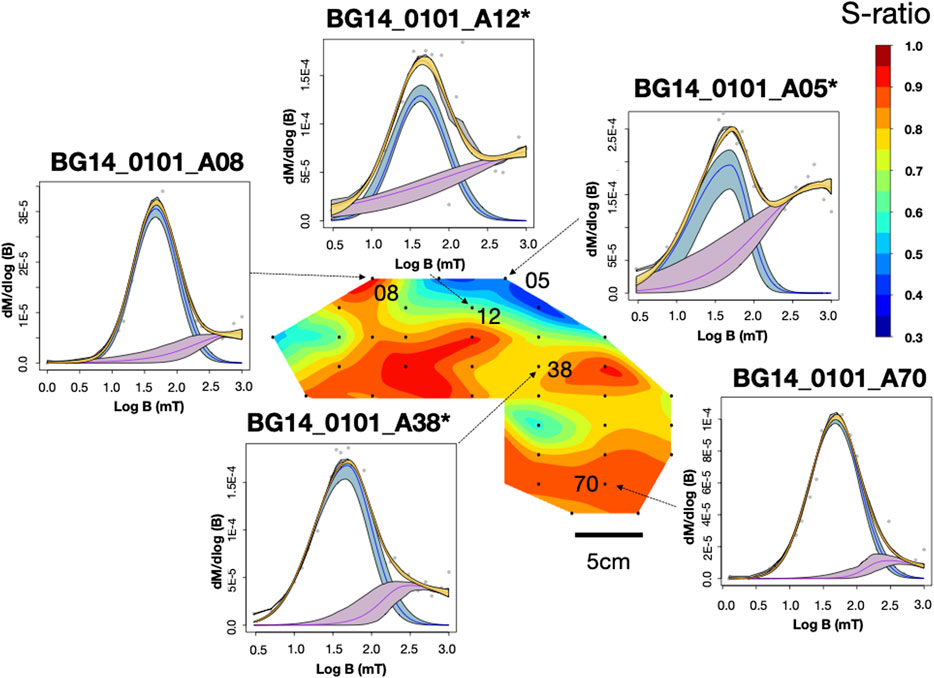
FIGURE 5. IRM unmixing curve and S-ratio distribution for sample BG14_0101. IRM results were plotted through the MaxUnmix online software (Maxbauer et al., 2016) on a log scale. Gray dots represent actual data, and yellow lines represent total IRM best-fit based on real data. Colored lines (blue and purple) represent different coercivity components. The shadings represent 95% confidence intervals calculated using a resampling algorithm with N = 300. An asterisk next to a specimen name indicates that the specimen went through the -1000mT IRM process.
Directional Analysis
GSL: Fifteen measured (unoriented) actively growing cyanobacteria layers are fully demagnetized by around 40–100 mT, and a stable paleomagnetic direction is isolated up to 60 mT (Figure 6A). A small overprint is typically removed by ∼7.5 mT. Of the lithified (oriented) samples GSL18_0301, GSL19_0103, and GSL19_0202, 47% (26/55), 100% (10/10) and 35% (8/23) respectively have stable AF demagnetization behavior (Figure 6C), and 80% (8/10) of GSL19_0103 specimens have stable thermal demagnetization behavior (Figure 6D). Sample-level Fisher mean declinations (Figure 7A) of all samples are close to that predicted for a geocentric axial dipole (GAD) or to models of paleosecular variation for the past 10 kyr (CALS10k.2; Constable et al., 2016). However, GSL18_0301 (43.9°) and GSL19_0103 (36.7°) have anomalously shallow inclinations.
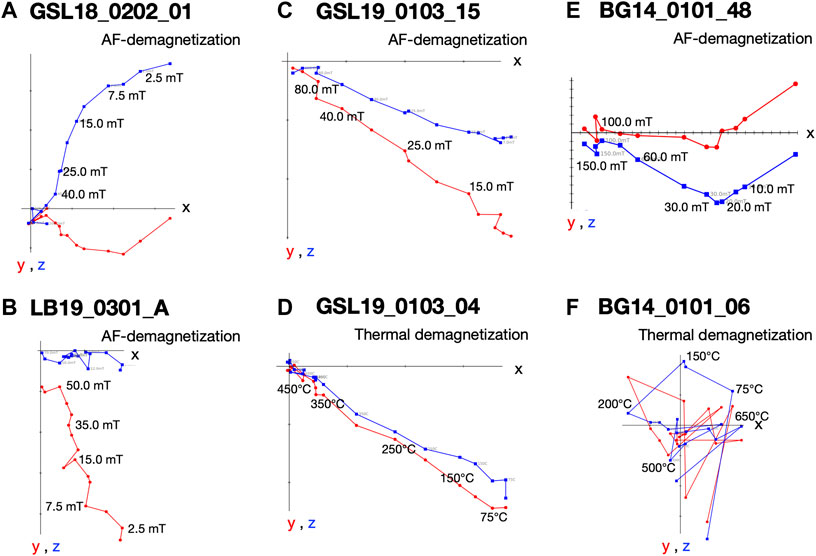
FIGURE 6. Vector endpoint diagrams for representative microbialite specimens. (A) AF demagnetization pattern for living Antelope Island GSL microbialite specimen GSL18_0202_01 (B) AF demagnetization pattern for living lithified LB Site 3 microbialite specimen LB19_0301_A (C) AF demagnetization pattern for specimen Lakeside lithified GSL microbialite GSL19_0103_15 (D) thermal demagnetization of specimen GSL19_0103_04 (E) AF demagnetization for BG stromatolite specimen BG14_0101_48; and (F) thermal demagnetization for specimen BG14_0101_06.
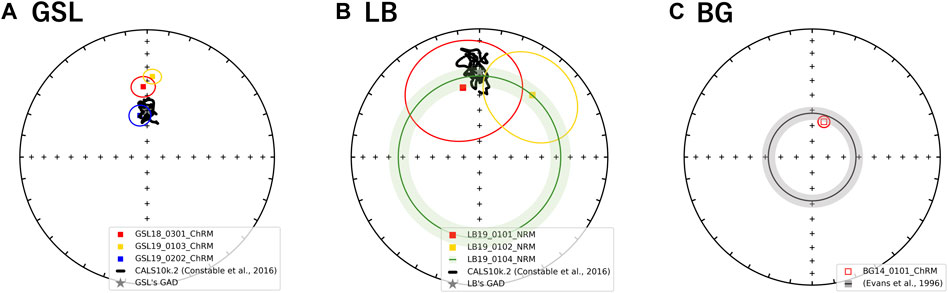
FIGURE 7. Equal area stereographic projection of magnetization components observed from (A) GSL (B) LB, and (C) BG samples. The mean declination and inclination with α95 ellipses of NRM or ChRM. Where declination was not available (LB19_0104) mean inclination is shown as a circle around the center with α95. Open and closed symbols represent directions in the upper and lower hemisphere, respectively. A gray star in (A) GSL (B) LB panel represents GAD value of each site. The black line on GSL and LB stereographic projections represent the CALSk10.2 model based on the latitude and longitude of GSL sampling site from 10 ka to present (Constable et al., 2016). The gray shading annulus on the BG panel (inclination: −62 ± 4°) represents the expected directions derived from sedimentary beds in the same formation (Evans et al., 1996).
LB: Living sediments (e.g., LB19_0101, 0102, 0304) and lithified microbialites (e.g., LB19_0301) were fully demagnetized by 25–60 mT and 60–70 mT, respectively. Five specimens of lithified microbialite LB19_0301 have stable AF-demagnetization, and magnetic directions are isolated between 12.5 mT and 60 mT (Figure 6B). Most of the LB sites were located in moving water, which may complicate interpretation of DRM directions. LB19 Site 1 was in a stagnant environment, so only specimens from this site were used for directional analysis. These samples were not demagnetized (see Magnetic Methods), we report only NRM directions for this site. The Fisher (1953) mean direction (Table 3) of LB19_0101 (N = 8) and LB_0102 (N = 8) overlap the CALS10k.2 or GAD, although they have high α95 values. LB19_0104 (N = 36) has a large declination dispersion consistent with rotation of the core during sampling. The inclination-only (McFadden and Reid, 1982) Fisher mean of LB19_0104 is 36.8° ± 7.15, which overlaps the GAD value of 33.9° (Figure 7B; Table 3).
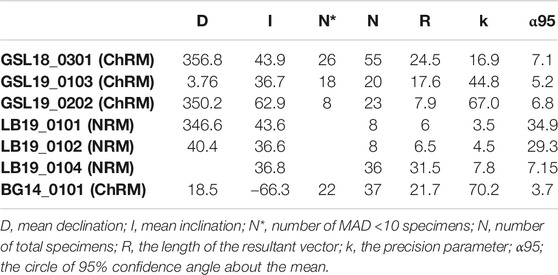
TABLE 3. Sample-average Fisher statistics.
BG: BG14_0,101 was only oriented with respect to up, but specimens in the structure were mutually oriented. AF demagnetization was more effective in extracting stable magnetizations (59.4%), and an overprint is typically removed by ∼30 mT. None of the thermally processed specimens (N = 10) had a coherent demagnetization pattern (Figures 6E,F). Pilot thermomagnetic data, c(T), show the production of magnetite at temperatures > ∼400°C (Supplementary Figure S5), consistent with the thermal decomposition of siderite (e.g., Pan et al., 2000). ChRM Fisher mean inclinations for 22 out of 37 AF-demagnetized specimens (−66.3° ± 3.7°) overlap with the inclination (−62 ± 4°) obtained from siliclastic sediments with calcareous interbeds in the Bayan Gol formation (Evans et al., 1996) (Figure 7C). There are inclination variations, however, associated with bedding/lamination slopes of the microbialite. While inclinations from one side with respect to the vertical have inclinations of −75.0° to −65.0°, those from the other side are −65.0° to −55.0° (Figure 8).
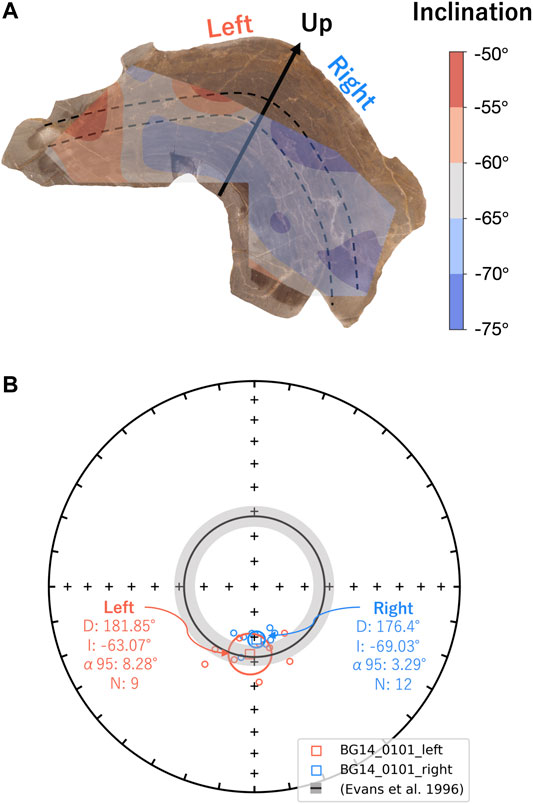
FIGURE 8. (A) Inclination mapping of the BG14_0101 sample slice with contouring by cubic interpolation. The black arrow and dashed lines represent up directions and laminations. (B) Equal area stereographic projection of reoriented magnetization components of the sample BG14_0101 by rotating total mean declination to the magnetic north. Specimen declinations and inclinations from the left and right sides with respect to the stratigraphic up direction (black arrow) are symbolized as red and blue circles, respectively. The mean direction of each group is marked as a square symbol with α95 ellipses. The gray shading annulus on the BG panel (inclination: −62 ± 4°) represents the expected directions derived from sedimentary beds in the same formation (Evans et al., 1996).
Discussion
Magnetic Minerology
While S-ratio values for all modern microbialites (i.e., GSL18, LB19) are high (i.e., magnetite), ancient samples (i.e., GSL19, BG14) have lower values that indicate the presence of additional high coercivity materials. IRM unmixing results and three-component IRM tests show that all modern samples are dominated by a component with a mean coercivity of 37 mT for IRM-1000mT and 48 mT for IRM0mT, with the DP of 2.7, consistent with magnetite. The BG microbialite has a high relative proportion of high coercivity and high unblocking-temperature (up to 675°C) minerals consistent with hematite. A signature from high coercivity fractions is observed in IRM unmixing results for weakly magnetic living GSL18 and LB19 cyanobacteria layer samples. This might represent a small proportion of high coercivity material, but experimental noise means this component is poorly constrained. While three-component IRM results contain a hint of hard fractions (<7%), we infer that these signatures are experimental noise based on S-ratio results.
This difference in magnetic mineralogy between young and old microbialite samples may be attributed to different depositional material in the original environment. It is also possible that the high-coercivity minerals formed during diagenesis, leading to concerns of a partial or complete overprint in the ancient samples. However, these high-coercivity minerals do not appear to contribute to the NRM, which is fully AF-demagnetized at < 200 mT and is held entirely by low-coercivity minerals.
The coercivity distribution for nearly all GSL and LB specimens is remarkably similar, although GSL specimens have slightly higher coercivity (Figure 3). These distributions are similar to IRM acquisition for some remagnetized Devonian carbonates (Jackson and Swanson-Hysell, 2012). That study interpreted the magnetic signature to arise at least partially from authigenic formation of SD magnetite, an interpretation favored by many other studies of carbonate rocks (e.g., Jackson 1990; McCabe and Channell, 1994; Suk and Halgedahl, 1996; Swanson-Hysell et al., 2012). Diagenesis seems an unlikely explanation for the GSL and LB samples, where we see no difference between living and lithified specimens.
In Figure 3B, we also compare our coercivity spectra derived from the IRM0mT with spectra derived from AF demagnetization of a 300 mT (Egli, 2004) or 350 mT (Maloof et al., 2007) IRM. Spectra are all normalized to their peak value for better comparison. While the methods are not strictly analogous, our spectra show a lower mean coercivity but similar dispersion (in log space) to two spectra measured on surface carbonate platform muds in the Bahamas (Maloof et al., 2007). Based on these and other data, Maloof et al. (2007) interpret the magnetic remanence in their samples to arise largely from magnetotactic bacteria. The component spectra from Egli (2004) are derived from IRM unmixing of lake sediment data. Two narrow spectra with peaks at ∼45 mT (‘biogenic soft’) and ∼75 mT (‘biogenic hard’) are interpreted to result from the presence of magnetotactic bacteria, while a much broader distribution with a peak at ∼25 mT is thought to be a mixture of detrital magnetite and extracellular biogenic magnetite, which have overlapping distributions. Our spectra most closely resemble this detrital/extracellular component. We interpret the GSL and LB samples to be dominated by a similar component, although we cannot exclude some contribution from lower-coercivity magnetotactic bacteria.
The BG samples have a similar component consistent with detrital and/or extracellular magnetite, in addition to the high coercivity component. Due to the age of the sample, we cannot exclude the additional possibility of authigenic magnetite (e.g., Jackson and Swanson-Hysell, 2012), although there is some evidence the magnetization may be detrital in origin (Origin and Timing of Magnetization). Authigenic magnetite is common in many carbonates (e.g., Jackson, 1990; McCabe and Channell, 1994; Suk and Halgedahl, 1996; Jackson and Swanson-Hysell, 2012; Swanson-Hysell et al., 2012). Early reductive diagenesis can dissolve primary magnetite and produce iron sulfides such as pyrite, which may then later oxidize to magnetite (e.g., Suk et al., 1990a; Suk et al., 1990b; Weil and Van der Voo, 2002; Kodama, 2012; Roberts, 2015). Nevertheless, it has been proposed that the early lithification and cementation associated with some microbialites may lead to an increased probability of preserving the primary magnetic mineralogy (Maloof et al., 2007).
Origin and Timing of Magnetization
Directional information from microbialites with moments <1.00E-10 Am2 is apparently less reliable, likely due to a small but significant contribution from the chosen sample containers (1.00E-13 to 1.00E-11 Am2). As these samples demagnetize, they also approach the stated sensitivity of the magnetometer (∼1.00E-12 Am2). These effects could be reduced in future studies in part by careful choice of sample holders.
Our results for microbialite ChRMs with sufficiently high magnetization appear to record directions close to the expected field direction, with some caveats. The Laguna Bacalar NRM directions are consistent with the expected field direction but have large uncertainties. We interpret these uncertainties to arise from the relatively small number of specimens measured and the lack of AF cleaning which would remove any overprints. While the inclination recorded by the Bayan Gol formation stromatolite is consistent with that reported by Evans et al. (1996) in sediments from the same formation, those authors could not preclude the possibility of a remagnetization. Even though the ChRM was determined to pre-date folding, the entire measured section was of a single polarity, leading the authors to question a primary remanence.
Despite these limitations, an attraction of using ancient microbialites is to potentially recover high temporal resolution variations of geomagnetic field, and it is therefore important to assess the timing and origin of the acquired magnetization. Is the magnetization detrital, locked in soon after deposition and incorporated into the microbialite matrix? Or is it a chemical remanence (biomediated or otherwise) acquired soon after deposition? Or is it related to later diagenesis?
The observed relatively homogenous magnetization along microbialite laminations and variations across laminations suggests a magnetic mineral concentration and magnetization distribution associated with deposition. All studied microbialites seem to preserve this magnetization pattern.
The observed deviation of paleomagnetic directions away from expected values (declination ±10°, inclination ±20°) may be caused by deposition on sloping beds. King (1955) and Kodama (2012) proposed that when a bed dips (shallowly) in the same direction as the magnetic field, the magnetization vector would be steeper by the degree of dip gradient. If the bedding slope is opposite to the Earth’s magnetic field, the inclination can be shallower. Many microbialites have domal internal structures, hence, magnetic directions recorded by different parts of the structure might be disturbed by the effect of deposition on a sloping bed, although there are some obvious differences between normal sedimentary deposition and incorporation into a filamentous microbial matrix. Sample GSL18_0301 was from the (very) steep side of the columnar mound structure, with a slope opposite to the magnetic field. The sample Fisher mean inclination of 43.9° is 16.1° shallower than the geocentric axial dipole (GAD) inclination, and the magnetic vectors may have experienced a bedding-related shallowing. Data from partially oriented sample BG14_0101 were rotated (Figure 8B) so that the mean declination corresponds to geographic south (expected declination for reverse polarity). In this orientation, the left side of the stromatolite (Figure 8A) dips down toward geographic south, opposite to the field direction which is up (negative inclination) and has an inclination shallower than total mean of −66.3° (Figure 8B). By contrast, the right side on Figure 8A dips down to geographic north, roughly parallel to the field, and has a steeper inclination. Inclinations from right side of the structure are −75.0° to −65.0° (Fisher mean = −69.0° ± 3.3°), while the specimens from left side are −65.0° to −55.0° (Fisher mean = −63.1° ± 8.3°), which might support the bedding slope effect. However, Watson’s F-test (Watson, 1956) and Vw-test (Watson, 1983) both show that these means are not statistically distinct at the 95% confidence level. In contrast to these two samples which show inclination deviations, all GSL 19 samples are small structures (<40 cm diameter), and specimens from throughout the structure were used and averaged out. The push core sample LB19_0104 was from the middle of the structure with nearly horizontal layering, and here the Fisher mean inclination of 36.8° ± 7.2° is close to the expected GAD inclination of 33.94°. While not conclusive, these inclination variations associated with the slope of the microbialite layering are intriguing and point to preservation of a primary DRM.
DRM is a relatively inefficient magnetization process, so the DRM/ARM ratio should be relatively low. While not definitive, a ratio of NRM/ARM <1 is consistent with a DRM. Clastic sediments have a wide NRM/ARM range from ∼0.1 to 0.8 (e.g., Levi and Banerjee, 1976; King et al., 1983; Constable, 1985). The NRM/ARM of biogenic magnetite is comparatively low (<0.05) in marine sediments (Roberts et al., 2012; Rodelli et al., 2019), but much higher values (0.4–1.4) have been documented in varved lake sediments dominated by biogenic magnetite (Snowball and Sandgrena, 2002). The low values in marine sediments are attributed to the SD state of the biogenic material which results in very efficient ARM acquisition (Egli and Lowrie, 2002) compared to larger particles. The elevated values in the varved sediments may be partially due to more efficient DRM acquisition in fresh water (Katari and Tauxe, 2000; Mitra and Tauxe, 2009); a higher concentration of particles leading to magnetic interaction effects on ARM acquisition (Egli and Lowrie, 2002); and/or reduced bioturbation (Egli and Zhao, 2015; Zhao et al., 2016). Chemical remanent magnetization (CRM) acquired by magnetite growth through the blocking volume has a CRM/ARM ratio of ∼0.5 (Pick and Tauxe, 1991), which may be similar to extracellular magnetite produced in situ by bacteria within the microbialite matrix. It may or may not be similar to a CRM acquired during oxidation of pyrite to magnetite, the processes possibly responsible for magnetite in remagnetized carbonates.
Figure 9 shows NRM vs ARM intensity data for this study, along with NRM/ARM bounds for clastic sediments (0.1–0.8) and marine biogenic magnetite (<0.05). The geometric mean of the NRM/ARM of GSL18 living microbialites, GSL18_0301, and GSL19_0202, are 0.98, 0.57, and 0.37, respectively. LB19 living microbialites and LB19_0301 have a geometric mean of 0.41 and 0.52, respectively. BG14_0101 has a geometric mean NRM/ARM ratio of 0.19, the lowest value among all microbialites. Most specimens are within the clastic detrital range with only one BG14_0101 specimen less than 0.05. These data are fully consistent with a predominantly clastic detrital origin, but some uncertainty in ratio for a biogenic contribution(s) and/or a CRM leaves room for other interpretations. While more work needs to be done to examine the magnetization process and the possible effects of diagenesis, the internal distribution of magnetization with respect to microbialite layering, NRM/ARM ratios, and the inclination variations correlated with bedding slopes suggest that the timing of sediment deposition and acquisition of magnetization samples are close and may be consistent with a primary DRM.
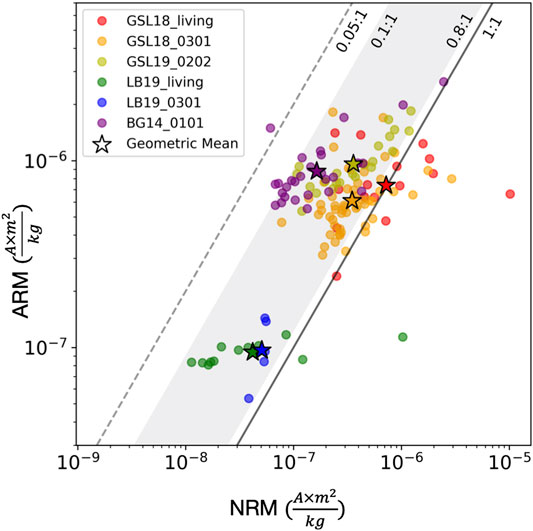
FIGURE 9. NRM intensity (x-axis) vs. ARM intensity (y-axis) of microbialites on log scales. The sample group of GSL18_living (GSL18 living microbialites with cyanobacteria layer collected from Antelope Island Site 1, 2 and 4), GSL18_0301 (lithified microbialite from Antelope Island Site 3), GSL19_0202 (lithified modern microbialite from Lakeside Site 2), LB19_living (surface living microbialite samples collected from LB19 Site 1 and 3), LB19_0301 (lithified porous microbialite sample from LB19 Site 3), BG14_0101 (Cambrian Bayan Gol formation stromatolite) are shown with red, orange, yellow, green, blue, and purple circles, and their geometric means are symbolized with stars. The black solid line represents NRM to ARM ratio of 1 (x = y), and measurements plotted on the left side of this line (ARM >> NRM) is consistent with a DRM origin. The gray shading shows the NRM/ARM range of clastic sediments (0.1–0.8) (e.g., Levi and Banerjee, 1976; Constable, 1985), and the gray dashed line represents the maximum constraint for biogenic magnetite (0.05) (e.g., Roberts et al., 2012; Rodelli et al., 2019).
Conclusion
We investigated the potential of modern and ancient microbialites as paleomagnetic recorders. Microbialites with NRM >1.00E-10 Am2 record recoverable, stable magnetic directions. All microbialites appear to record average directions close to the expected field direction. The dominant NRM carrier in all samples is 35–50 mT SD to ‘PSD’ magnetite. The Cambrian BG sample also has a contribution from high coercivity minerals, which do not contribute to the NRM.
We interpret the NRM to be at least partially detrital in origin. This interpretation is based on the magnetization distribution in the structure, the NRM/ARM ratios consistent with detrital sediments, and inclination variations that correlate with changes in bedding slopes. In some cases, the NRM to ARM ratio is higher, suggesting another magnetization process. This may be due to biomineralization of magnetic minerals and/or diagenesis soon after deposition.
To reduce inclination variations resulting from sloping beds, samples from large domal structures should be collected avoiding steep sides or by sampling all sides. For smaller scale hand samples (<50 cm), the sample slice should be cut parallel to the expected direction of the magnetic declination. Then, specimens from different lamination angles should be collected to average out the deviations generated by sloping beds.
Data Availability Statement
Raw data supporting the conclusions of this article are available in the Magnetics Information Consortium (MagIC) database at earthref.org/MagIC/17087.
Author Contributions
J-IJ participated in GSL and LB field work, and collected and analyzed the data. JB designed the study and participated in GSL field work. Both authors contributed to the writing and editing of the manuscript.
Funding
This work was supported by a Research and Creative Activities Support (RACAS) award from the University of Wisconsin–Milwaukee (project AAD3431).
Conflict of Interest
The authors declare that the research was conducted in the absence of any commercial or financial relationships that could be construed as a potential conflict of interest.
Acknowledgments
We thank Bonnie Baxter and Jaimi Butler of Westminster College who provided assistance and education in sampling microbialites on Antelope Island. These samples were collected under permit provided to Westminster College by the Division of Parks and Recreation/Antelope Island State Park. We thank Tim Grundl for help with sampling at Laguna Bacalar, Steve Dornbos who provided the BG sample, and Joshua Marquardt for preliminary measurements on the BG sample. Many thanks to Andrew Roberts and Nick Swanson‐Hysell whose comments helped improve this manuscript.
Supplementary Material
The Supplementary Material for this article can be found online at: https://www.frontiersin.org/articles/10.3389/feart.2021.603805/full#supplementary-material.
References
Allwood, A. C., Walter, M. R., Kamber, B. S., Marshall, C. P., and Burch, I. W. (2006). Stromatolite reef from the early archaean era of Australia. Nature 441, 714–718. doi:10.1038/nature04764
Awramik, S. M. (2006). Palaeontology: respect for stromatolites. Nature 441, 700–701. doi:10.1038/44170010.1038/441700a
Awramik, S. M., and Grey, K. (2005). Stromatolites: biogenicity, biosignatures, and bioconfusion. Proc. SPIE 3906, 5906P1–5906P9. doi:10.1117/12.625556
Awramik, S. M., and Sprinkle, J. (1999). Proterozoic stromatolites: the first marine evolutionary biota. Hist. Biol. 13, 241–253. doi:10.1080/08912969909386584
Awramik, S. M. (1992). The oldest records of photosynthesis. Photosyn Res. 33, 75–89. doi:10.1007/bf00039172
Baumgartner, R. J., Kranendonk, M. J., Wacey, D., Fiorentini, M. L., Saunders, M., Caruso, S., et al. (2019). Nano−porous pyrite and organic matter in 3.5-billion-year-old stromatolites record primordial life. Geology 47, 1039–1043. doi:10.1130/g46365.1
Berelson, W. M., Corsetti, F. A., Pepe-Ranney, C., Hammond, D. E., Beaumont, W., and Spear, J. R. (2011). Hot spring siliceous stromatolites from Yellowstone National Park: assessing growth rate and laminae formation. Geobiology 9, 411–424. doi:10.1111/j.1472-4669.2011.00288.x
Berg, M. D. (2019). Domes, rings, ridges, and polygons: characteristics of microbialites from Utah's Great Salt Lake. Sediment. Rec. 17, 4–10. doi:10.2110/sedred.2019.1.4
Biggin, A. J., Piispa, E. J., Pesonen, L. J., Holme, R., Paterson, G. A., Veikkolainen, T., et al. (2015). Paleomagnetic field intensity variations suggest Mesoproterozoic inner-core nucleation. Nature 526, 245–248. doi:10.1038/nature15523
Bono, R. K., Tarduno, J. A., Nimmo, F., and Cottrell, R. D. (2019). Young inner core inferred from Ediacaran ultra-low geomagnetic field intensity. Nat. Geosci. 12, 143–147. doi:10.1038/s41561-018-0288-0
Bourne, M. D., Feinberg, J. M., Strauss, B. E., Hardt, B., Cheng, H., Rowe, H. D., et al. (2015). Long-term changes in precipitation recorded by magnetic minerals in speleothems. Geology 43, 595–598. doi:10.1130/g36695.1
Brady, A. L., Slater, G., Laval, B., and Lim, D. S. (2009). Constraining carbon sources and growth rates of freshwater microbialites in Pavilion Lake using (14)C analysis. Geobiology 7, 544–555. doi:10.1111/j.1472-4669.2009.0021510.1111/j.1472-4669.2009.00215.x
Brasier, M., Green, O., Lindsay, J., and Steele, A. (2004). “Earth’s oldest (approximately 3.5 Ga) fossils and the “Early Eden hypothesis” questioning the evidence” in Origins of Life and Evolution of the Biosphere. Editor P. L. Luisi (Dordrecht: Kluwer), 257–269. doi:10.1023/B:ORIG.0000009845.62244.d3
Burne, R. V., and Moore, L. S. (1987). Microbialites: organosedimentary deposits of benthic microbial communities. Palaios 2, 241. doi:10.2307/3514674
Castro-Contreras, S. I., Gingras, M. K., Pecoits, E., Aubet, N. R., Petrash, D., Castro-Contreras, S. M., et al. (2014). Textural and geochemical features of freshwater microbialites from Laguna bacalar, Quintana Roo, Mexico. Palaios 29, 192–209. doi:10.2110/palo.2013.063
Chang, S. R., Stolz, J. F., Kirschvink, J. L., and Awramik, S. M. (1989). Biogenic magnetite in stromatolites. II. Occurrence in ancient sedimentary environments. Precambrian Res. 43, 305–315. doi:10.1016/0301-9268(89)90062-4
Chidsey, T. C., Berg, M. D., and Eby, D. E. (2015). Petrography and characterization of microbial carbonates and associated facies from modern Great Salt Lake and Uinta Basin's Eocene Green River Formation in Utah, USA. London: Geological Society, London, Special Publications, 418, 261-286. doi:10.1144/sp418.6
Chou, Y. M., Jiang, X., Liu, Q., Hu, H. M., Wu, C. C., Liu, J., et al. (2018). Multidecadally resolved polarity oscillations during a geomagnetic excursion. Proc. Natl. Acad. Sci. U S A. 115, 8913–8918. doi:10.1073/pnas.1720404115
Constable, C. G. (1985). Eastern Australian geomagnetic field intensity over the past 14000 yr. Geophys. J. Int. 81, 121–130. doi:10.1111/j.1365-246x.1985.tb01354.x
Constable, C., Korte, M., and Panovska, S. (2016). Persistent high paleosecular variation activity in southern hemisphere for at least 10 000 years. Earth Planet. Sci. Lett. 453, 78–86. doi:10.1016/j.epsl.2016.08.015
Egli, R. (2004). Characterization of individual rock magnetic components by analysis of remanence curves, 1. Unmixing Natural Sediments. Studia Geophysica et Geodaetica 48, 391–446. doi:10.1023/B:SGEG.0000020839.45304.6d
Egli, R., and Lowrie, W. (2002). Anhysteretic remanent magnetization of fine magnetic particles. J. Geophys. Res. 107, 2209. doi:10.1029/2001JB000671
Egli, R., and Zhao, X. (2015). Natural remanent magnetization acquisition in bioturbated sediment: general theory and implications for relative paleointensity reconstructions. Geochem. Geophys. Geosystems 16, 995–1016. doi:10.1002/2014GC005672
Evans, D. A., Zhuravlev, A. Y., Budney, C. J., and Kirschvink, J. L. (1996). Paleomagnetism of the bayan Gol formation, western Mongolia. Geol. Mag. 133, 487–496. doi:10.1017/s0016756800007615
Fisher, R. (1953). Dispersion on a sphere. Proc. R. Soc. A: Math. Phys. Eng. Sci. 217, 295–305. doi:10.1098/rspa.1953.0064
Font, E., Trindade, R. I., and Nédélec, A. (2005). Detrital remanent magnetization in haematite-bearing Neoproterozoic Puga cap dolostone, Amazon craton: a rock magnetic and SEM study. Geophys. J. Int. 163, 491–500. doi:10.1111/j.1365-246x.2005.02776.x
Gischler, E., Gibson, M. A., and Oschmann, W. (2008). Giant Holocene freshwater microbialites, Laguna bacalar, Quintana Roo, Mexico. Sedimentology 55, 1293–1309. doi:10.1111/j.1365-3091.2007.00946.x
Golden, D., Ming, D., Morris, R., Brearley, A., Lauer, H., Treiman, A., et al. (2004). Evidence for exclusively inorganic formation of magnetite in Martian meteorite ALH84001. Am. Mineral. 89, 681–695. doi:10.2138/am-2004-5-602
Jackson, M. (1990). Diagenetic sources of stable remanence in remagnetized paleozoic cratonic carbonates: a rock magnetic study. J. Geophys. Res. 95, 2753. doi:10.1029/jb095ib03p02753
Jackson, M., and Swanson-Hysell, N. L. (2012). Rock magnetism of remagnetized carbonate rocks: another look. Geol. Soc. Lond. Spec. Publ 371, 229–251. doi:10.1144/sp371.3
Jackson, M., and Van der Voo, R. (1985). A lower ordovician paleomagnetic pole from the Oneida dolomite, upper Mississippi river valley. J. Geophys. Res. 90, 10449. doi:10.1029/jb090ib12p10449
Katari, K., and Tauxe, L. (2000). Effects of pH and salinity on the intensity of magnetization in redeposited sediments. Earth Planet. Sci. Lett. 181, 489–496. doi:10.1016/S0012-821X(00)00226-0
Khomentovsky, V. V., and Gibsher, A. S. (1996). The Neoproterozoic–lower Cambrian in northern Govi-Altay, western Mongolia: Regional setting, lithostratigraphy and biostratigraphy. Geolog. Mag, 133, 371-390. doi:10.1017/s001675680000755x Society for Sedimentary Geology.
Kiessling, W. (2002). Secular variations in the phanerozoic reef ecosystem. Soc. Sediment. Geology. 72, 625–690. doi:10.2110/pec.02.72.0625
King, J. W., Banerjee, S. K., and Marvin, J. (1983). A new rock-magnetic approach to selecting sediments for geomagnetic paleointensity studies: application to paleointensity for the last 4000 years. J. Geophys. Res. Solid Earth 88, 5911–5921. doi:10.1029/jb088ib07p05911
King, R. F. (1955). The remanent magnetism of artificially deposited sediments. Geophys. J. Int. 7, 115–134. doi:10.1111/j.1365-246x.1955.tb06558.x
Kirschvink, J. L. (1980). The least-squares line and plane and the analysis of paleomagnetic data. Geophys. J. Int. 62, 699–718. doi:10.1111/j.1365-246x.1980.tb02601.x
Kodama, K. P. (2012). Paleomagnetism of sedimentary rocks: process and interpretation. Chichester: Wiley-Blackwell.
Konhauser, K. O., Kappler, A., and Roden, E. E. (2011). Iron in microbial metabolisms. Elements 7, 89–93. doi:10.2113/gselements.7.2.89
Konhauser, K., and Riding, R. (2012). “Bacterial biomineralization,” in Fundamentals of geobiology. Editors A. H. Knoll, D. E. Canfield, and K. O. Konhauser (Chichester: Wiley-Blackwell)), 105–130. doi:10.1002/9781118280874.ch8
Kądziałko-Hofmokl, M., and Kruczyk, J. (1987). Paleomagnetism of Middle-Late Jurassic sediments from Poland and implications for the polarity of the geomagnetic field. Tectonophysics 139, 53–66. doi:10.1016/0040-1951(87)90197-1
Lascu, I., and Feinberg, J. M. (2011). Speleothem magnetism. Quat. Sci. Rev. 30, 3306–3320. doi:10.1016/j.quascirev.2011.08.004
Levi, S., and Banerjee, S. K. (1976). On the possibility of obtaining relative paleointensities from lake sediments. Earth Planet. Sci. Lett. 29, 219–226. doi:10.1016/0012-821x(76)90042-x
Lovley, D. R. (1991). “Magnetite formation during microbial dissimilatory iron reduction,” in Iron biominerals. Editors R. B. Frankel, and R. P. Blakemore (Boston, MA: Springer), 151–166. doi:10.1007/978-1-4615-3810-3_11
Lowe, D. R. (1994). Abiological origin of described stromatolites older than 3.2 Ga. Geology 22, 387. doi:10.1130/0091-7613(1994)0222.3.co;2
Lowrie, W. (1990). Identification of ferromagnetic minerals in a rock by coercivity and unblocking temperature properties. Geophys. Res. Lett. 17, 159–162. doi:10.1029/gl017i002p00159
Lund, S., Platzman, E., Thouveny, N., Camoin, G., Corsetti, F., and Berelson, W. (2010). Biological control of paleomagnetic remanence acquisition in carbonate framework rocks of the Tahiti coral reef. Earth Planet. Sci. Lett. 298, 14–22. doi:10.1016/j.epsl.2010.07.010
Maher, B., and Taylor, R. (1988). Formation of ultrafine-grained magnetite in soils. Nature 336, 368–370. doi:10.1038/336368a0
Maloof, A. C., Kopp, R. E., Grotzinger, J. P., Fike, D. A., Bosak, T., Vali, H., et al. (2007). Sedimentary iron cycling and the origin and preservation of magnetization in platform carbonate muds, Andros Island, Bahamas. Earth Planet. Sci. Lett. 259, 581–598. doi:10.1016/j.epsl.2007.05.021
Maxbauer, D. P., Feinberg, J. M., and Fox, D. L. (2016). MAX UnMix: a web application for unmixing magnetic coercivity distributions. Comput. Geosciences 95, 140–145. doi:10.1016/j.cageo.2016.07.009
McCabe, C., and Channell, J. E. (1994). Late Paleozoic remagnetization in limestones of the Craven Basin (northern England) and the rock magnetic fingerprint of remagnetized sedimentary carbonates. J. Geophys. Res. Solid Earth 99, 4603–4612. doi:10.1029/93jb02802
McFadden, P. L., and Reid, A. B. (1982). Analysis of paleomagnetic inclination data. Geophys. J. Int. 69, 307–319. doi:10.1111/j.1365-246X.1982.tb04950.x\
McLoughlin, N., Wilson, L. A., and Brasier, M. D. (2008). Growth of synthetic stromatolites and wrinkle structures in the absence of microbes - implications for the early fossil record. Geobiology 6, 95–105. doi:10.1111/j.1472-4669.2007.00141.x
Mitra, R., and Tauxe, L. (2009). Full vector model for magnetization in sediments. Earth Planet. Sci. Lett. 286, 535–545. doi:10.1016/j.epsl.2009.07.019
Muraszko, J. R. (2014). Magnetic properties of Jurassic stromatolites from selected localities in Poland. [master’s thesis]. [Poland]: University of Warsaw.
Newell, D. L., Jensen, J. L., Frantz, C. M., and Berg, M. D. (2017). Great Salt Lake (Utah) Microbialite δ13C, δ18O, and δ15N record fluctuations in lake biogeochemistry since the late Pleistocene. Geochem. Geophys. Geosystems 18, 3631–3645. doi:10.1002/2017gc007078
Pan, Y., Zhu, R., Banerjee, S. K., Gill, J., and Williams, Q. (2000). Rock magnetic properties related to thermal treatment of siderite: behavior and interpretation. J. Geophys. Res. Solid Earth 105, 783–794. doi:10.1029/1999jb900358
Paull, C., Neumann, A., Bebout, B., Zabielski, V., and Showers, W. (1992). Growth rate and stable isotopic character of modern stromatolites from San Salvador, Bahamas. Palaeogeogr. Palaeoclimatol. Palaeoecol. 95, 335–344. doi:10.1016/0031-0182(92)90149-y
Petryshyn, V. A., Corsetti, F. A., Berelson, W. M., Beaumont, W., and Lund, S. P. (2012). Stromatolite lamination frequency, Walker Lake, Nevada: implications for stromatolites as biosignatures. Geology 40, 499–502. doi:10.1130/g32675.1
Petryshyn, V. A., Corsetti, F. A., Frantz, C. M., Lund, S. P., and Berelson, W. M. (2016). Magnetic susceptibility as a biosignature in stromatolites. Earth Planet. Sci. Lett. 437, 66–75. doi:10.1016/j.epsl.2015.12.016
Pick, T., and Tauxe, L. (1991). Chemical remanent magnetization in synthetic magnetite. J. Geophys. Res. 96, 9925–9936. doi:10.1029/91JB00706
Rasmussen, K. A., Macintyre, I. G., and Prufert, L. (1993). Modern stromatolite reefs fringing a brackish coastline, Chetumal Bay, Belize. Geology 21, 199. doi:10.1130/0091-7613(1993)0212.3.co;2
Reid, R. P., Visscher, P. T., Decho, A. W., Stolz, J. F., Bebout, B. M., Dupraz, C., et al. (2000). The role of microbes in accretion, lamination and early lithification of modern marine stromatolites. Nature 406, 989–992. doi:10.1038/35023158
Riding, R. (2006). Microbial carbonate abundance compared with fluctuations in metazoan diversity over geological time. Sediment. Geology. 185, 229–238. doi:10.1016/j.sedgeo.2005.12.01
Riding, R. (2000). Microbial carbonates: the geological record of calcified bacterial-algal mats and biofilms. Sedimentology 47, 179–214. doi:10.1046/j.1365-3091.2000.00003.x
Riding, R. (2011). “Microbialites, stromatolites, and thrombolites,” in Encyclopedia of geobiology encyclopedia of Earth sciences series. Editors J. Reitner, and V. Thiel (Dordrecht: Springer), 635–654. doi:10.1007/978-1-4020-9212-1_196
Riding, R. (2010). The nature of stromatolites: 3,500 million years of history and a century of research. Adv. Stromatolite Geobiology Lecture Notes Earth Sci. 131, 29–74. doi:10.1007/978-3-642-10415-2_3
Roberts, A. P., Chang, L., Heslop, D., Florindo, F., and Larrasoaña, J. C. (2012). Searching for single domain magnetite in the “pseudo-single-domain” sedimentary haystack: implications of biogenic magnetite preservation for sediment magnetism and relative paleointensity determinations. J. Geophys. Res. Solid Earth 117. doi:10.1029/2012jb009412
Roberts, A. P. (2015). Magnetic mineral diagenesis. Earth-Science Rev. 151, 1–47. doi:10.1016/j.earscirev.2015.09.010
Robertson, D., and France, D. (1994). Discrimination of remanence-carrying minerals in mixtures, using isothermal remanent magnetisation acquisition curves. Phys. Earth Planet. Interiors 82, 223–234. doi:10.1016/0031-9201(94)90074-4
Rodelli, D., Jovane, L., Giorgioni, M., Rego, E. S., Cornaggia, F., Benites, M., et al. (2019). Diagenetic fate of biogenic soft and hard magnetite in chemically stratified sedimentary environments of mamanguá ría, Brazil. J. Geophys. Res. Solid Earth 124, 2313–2330. doi:10.1029/2018jb016576
Ryan, W. B., Carbotte, S. M., Coplan, J. O., O'hara, S., Melkonian, A., Arko, R., et al. (2009). Global multi-resolution topography (GRMT) synthesis. Geochem. Geophys. Geosystems 10. doi:10.1029/2008gc002332
Schopf, J. W., Kudryavtsev, A. B., Czaja, A. D., and Tripathi, A. B. (2007). Evidence of archean life: stromatolites and microfossils. Precambrian Res. 158, 141–155. doi:10.1016/j.precamres.2007.04.009
Smirnov, A. V., Tarduno, J. A., Kulakov, E. V., Mcenroe, S. A., and Bono, R. K. (2016). Palaeointensity, core thermal conductivity and the unknown age of the inner core. Geophys. J. Int. 205, 1190–1195. doi:10.1093/gji/ggw080
Snowball, I., and Sandgrena, P. (2002). Geomagnetic field variations in northern Sweden during the Holocene quantified from varved lake sediments and their implications for cosmogenic nuclide production rates. The Holocene 12, 517–530. doi:10.1191/0959683602hl562rp
Stolz, J. F., Chang, S. R., and Kirschvink, J. L. (1989). Biogenic magnetite in stromatolites. I. Occurrence in modern sedimentary environments. Precambrian Res. 43, 295–304. doi:10.1016/0301-9268(89)90061-2
Suk, D., and Halgedahl, S. L. (1996). Hysteresis properties of magnetic spherules and whole rock specimens from some Paleozoic platform carbonate rocks. J. Geophys. Res. Solid Earth 101, 25053–25075. doi:10.1029/96jb02271
Suk, D., Peacor, D. R., and Voo, R. V. (1990a). Replacement of pyrite framboids by magnetite in limestone and implications for paleomagnetism. Nature 345, 611–613. doi:10.1038/345611a0
Suk, D., Voo, R. V., and Peacor, D. R. (1990b). Scanning and transmission electron microscope observations of magnetite and other iron phases in Ordovician carbonates from east Tennessee. J. Geophys. Res. Solid Earth 95, 12327–12336. doi:10.1029/JB095iB08p1232
Swanson-Hysell, N. L., Maloof, A. C., Kirschvink, J. L., Evans, D. A., Halverson, G. P., and Hurtgen, M. T. (2012). Constraints on neoproterozoic paleogeography and paleozoic orogenesis from paleomagnetic records of the bitter Springs Formation, amadeus basin, central Australia. Am. J. Sci. 312, 817–884. doi:10.2475/08.2012.01
Tarduno, J. A., Cottrell, R. D., and Smirnov, A. V. (2006). The paleomagnetism of single silicate crystals: recording geomagnetic field strength during mixed polarity intervals, superchrons, and inner core growth. Rev. Geophys. 44. doi:10.1029/2005rg000189
Tauxe, L., Shaar, R., Jonestrask, L., Swanson‐Hysell, N. L., Minnett, R., Koppers, A. A., et al. (2016). PmagPy: software package for paleomagnetic data analysis and a bridge to the magnetics information Consortium (MagIC) database. Geochem. Geophys. Geosystems 17, 2450–2463. doi:10.1002/2016gc006307
Taylor, R. M., Maher, B. A., and Self, P. G. (1987). Magnetite in soils: 1. The synthesis of single-domain and superparamagnetic magnetite. Clay Minerals 22, 411–422. doi:10.1180/claymin.1987.022.4.05
Thompson, R., and Oldfieid, F. (1986). Environmental magnetism. Dordrecht: Springer. doi:10.1007/978-94-011-8036-8
Till, J. L., Guyodo, Y., Lagroix, F., Morin, G., Menguy, N., and Ona-Nguema, G. (2017). Presumed magnetic biosignatures observed in magnetite derived from abiotic reductive alteration of nanogoethite. Comptes Rendus Geosci. 349, 63–70. doi:10.1016/j.crte.2017.02.001
Trindade, R. I., Font, E., D'agrella-Filho, M. S., Nogueira, A. C., and Riccomini, C. (2003). Low-latitude and multiple geomagnetic reversals in the Neoproterozoic Puga cap carbonate, Amazon craton. Terra Nova 15, 441–446. doi:10.1046/j.1365-3121.2003.00510.x
Trindade, R. I., Jaqueto, P., Terra-Nova, F., Brandt, D., Hartmann, G. A., Feinberg, J. M., et al. (2018). Speleothem record of geomagnetic south atlantic anomaly recurrence. Proc. Natl. Acad. Sci. 115, 13198–13203. doi:10.1073/pnas.1809197115
Valet, J., Besse, J., Kumar, A., Vadakke-Chanat, S., and Philippe, E. (2014). The intensity of the geomagnetic field from 2.4 Ga old Indian dykes. Geochem. Geophys. Geosystems 15, 2426–2437. doi:10.1002/2014gc005296
Vanyo, J. P., and Awramik, S. M. (1982). Length of day and obliquity of the ecliptic 850 MA ago: preliminary results of a stromatolite growth model. Geophys. Res. Lett. 9, 1125–1128. doi:10.1029/gl009i010p01125
Walter, M. R., and Heys, G. R. (1985). Links between the rise of the metazoan and the decline of stromatolites. Precambrian Res. 29, 149–174. doi:10.1016/0301-9268(85)90066-X
Watson, G. S. (1956). Analysis of dispersion on a sphere. Geophys. J. Int. 7, 153–159. doi:10.1111/j.1365-246x.1956.tb05560.x
Watson, G. S. (1983). Large sample theory of the Langevin distribution. J. Stat. Plann. Inference 8, 245–256. doi:10.1016/0378-3758(83)90043-5
Weil, A. B., and Van der Voo, R. (2002). Insights into the mechanism for orogen‐related carbonate remagnetization from growth of authigenic Fe‐oxide: a scanning electron microscopy and rock magnetic study of Devonian carbonates from northern Spain. J. Geophys. Res. Solid Earth 107, 1–14. doi:10.1029/2001JB000200
Keywords: microbialites, stromatolites, paleomagnetism, rock magnetism, paleosecular variation
Citation: Jung J-I and Bowles JA (2021) A Feasibility Study of Microbialites as Paleomagnetic Recorders. Front. Earth Sci. 9:603805. doi: 10.3389/feart.2021.603805
Received: 08 September 2020; Accepted: 25 January 2021;
Published: 05 March 2021.
Edited by:
Eric C. Ferre, University of Louisiana at Lafayette, United StatesReviewed by:
Andrew Philip Roberts, Australian National University, AustraliaNicholas L. Swanson-Hysell, University of California, Berkeley, United States
Copyright © 2021 Jung and Bowles. This is an open-access article distributed under the terms of the Creative Commons Attribution License (CC BY). The use, distribution or reproduction in other forums is permitted, provided the original author(s) and the copyright owner(s) are credited and that the original publication in this journal is cited, in accordance with accepted academic practice. No use, distribution or reproduction is permitted which does not comply with these terms.
*Correspondence: Ji-In Jung, amlpbmp1bmdAc3RhbmZvcmQuZWR1