 T. V. Lakshmi Kumar1
 G. Purna Durga1
 K. Koteswara Rao2*
 Humberto Barbosa3Ashwini Kulkarni4Savita Patwardhan4
 R. K. Mall5V. Brahmananda Rao6
- 1Atmospheric Science Research Laboratory, SRM Institute of Science and Technology, Kattankulathur, India
- 2Centre for Climate Change and Sustainability, Azim Premji University, Bengaluru, India
- 3Laboratório de Análise e Processamento de Imagens de Satélites-LAPIS, Instituto de Ciências Atmosféricas-ICAT, Universidade Federal de Alagoas, UFAL, Maceió, Brazil
- 4Indian Institute of Tropical Meteorology, Ministry of Earth Sciences, Pune, India
- 5DST-Mahamana Center of Excellence in Climate Change Research, Banaras Hindu University, Varanasi, India
- 6Instituto de Pesquisas Espaciais, Sâo José Dos Campos, Brazil
Mean monthly Atmospheric Residence Times (ART), deduced from the global climate models of Coupled Model Intercomparison Project 5 (CMIP5) under RCP4.5 and RCP8.5 emission scenarios over Indian landmass, show a perceptible increase by the end of the 21st century. India, being a tropical country, faces prolonged ART, particularly during the June month of Southwest monsoon season (June to September) which will be an indicative measure of the increased frequency of extreme weather events. Here we show a possible connection of quasi-resonant amplification (QRA) to the recent (August 2018) Kerala heavy rains that resulted in severe floods and claimed more than 400 mortalities. Remarkable delay in residence times over India during June is shown to have an association with QRA evidenced by the higher magnitudes of amplitudes at the wavenumbers six and seven from the 19 global climate models of CMIP5 under the RCP4.5 and RCP8.5 scenarios.
Introduction
The atmospheric residence times (ART) are defined as the time that the moisture stays in the atmosphere before it precipitates (Chahine, 1992). The spatiotemporal variability of residence times characterizes the regional and global hydrological cycle (Van Der Ent and Tuinenburg, 2017). Chahine (1992) reported residence times as the ratio of precipitable water vapor to the precipitation rate. Later, Trenberth (1998) studied the same over the globe and termed them as the e–folding residence times and reported the atmosphere’s depletion and restoration rates of moistening and drying. Van Der Ent and Tuinenburg (2017) studied the ART using atmospheric moisture tracking models and reported the global average residence times as 8.9 ± 0.4 days Van Der Ent and Tuinenburg (2017) used the method to estimate the residence times is slightly different by Chahine (1992), Trenberth (1998) where they have not considered the horizontal transport of water vapor in estimating the residence time. Hence, Van Der Ent and Tuinenburg (2017) termed the residence times obtained by Chahine (1992), Trenberth (1998) as the residence times for moisture recycling (Wang et al., 2018). It is worth mentioning that moisture recycling is a diagnostic measure for local evaporation contribution in turning the moisture into rainfall over the same region (Brubakar et al., 1993; Lakshmi Kumar et al., 2021). Moisture recycling over India has been studied by Lakshmi Kumar et al. (2014), Pathak et al. (2014), Sujit et al. (2017). We can find more details on moisture recycling over the Indian monsoon region using CMIP5 models in Lakshmi Kumar et al. (2021). Li et al. (2011) used the Special Sensor Microwave Imager (SSMI) water vapor, and Global Precipitation Climatology Project (GPCP) rainfall data sets to study the global moisture recycling and reported the decrease/increase of moisture recycling in lower/higher precipitation zones, which strengthens the concept of “rich get richer and the poor get poorer” as the societies are more vulnerable to the perturbations in water cycle than the temperature alone (http://blogs.nature.com/news/2012/04/global-water-cycle-is-revving-up.html). As the inverse of cycling rate is the residence time (Chahine, 1992), the global decrease of cycling of moisture indicates the increase in ART. However, ART is the indicator of the atmospheric water holding capacity that combines the role of evaporation and water vapor. The spatial variability of residence times throws challenges in understanding the atmospheric dynamics and thermodynamics in terms of its motion and moisture content. Also, it has great potential to realize the intensity of local and regional hydrological cycles over the oceans and the landmass.
Recent studies of Kornhuber et al. (2019), Mann et al. (2018) and Coumou et al. (2014) reported that extreme events such as droughts, floods in different parts of the globe are having a connection with the slow-moving amplified Rossby waves, known as quasi-resonant amplification (QRA). Severe damage in Bosnia, Herzegovina, Serbia, and Croatia due to the floods caused by the cyclone during the 14th and May 19, 2014 have been explained by the dynamic processes such as planetary wave resonance (Stadtherr et al., 2016). These Rossby waves move eastward, carrying the moisture from tropics to poles, creating lows and highs worldwide. As the jet streams meander with these waves, these mid-latitude waves become slow and cause the wave resonance, resulting in extreme weather events worldwide. The amplification of quasi-resonant Rossby waves can be seen in the amplitude of zonal wavenumber from six to 8. These QRA favorable conditions are linked to increase Arctic warming that happened due to climate change (Mann et al., 2017). Mann et al. (2018) stressed the increase of QRA events resulting in more extreme weather events across the globe under business as usual conditions using the CMIP five model simulations. As the increased residence times manifest extreme weather events, associated changes in residence times can be in future QRA events.
The studies on ART over India are very sparse. Lakshmi Kumar et al. (2014) studied the residence times based on the formula of Chahine (1992) on all Indian time scale. They reported the ART to vary from 10 to 2 days during the pre-monsoon (March to May) and southwest monsoon (June to September) seasons over India. Pathak et al. (2014) limited their studies to precipitation recycling to infer the source and sinks of moisture over India. In the present work, the time series of mean monthly ART for the southwest monsoon has been obtained from 1986 to 2,100 under RCP 4.5 and 8.5 emission scenarios. Attempts are made to see QRA’s possible connection with the Kerala heavy rains in Aug 2018 by studying the zonal wave spectra and other associated methods. Further, the delay in residence times has been focused on India during the southwest monsoon season. This delay is studied concerning the QRA for future climate change scenarios.
Methods and Data Sets Used
The main data source for the present study is the global climate models’ outputs from CMIP5 for the period 1986 to 2,100. Nineteen (19) models have been considered in the present study to estimate the ART. List of the models used along with the details are given in Table.1 (Taylor et al., 2012). We estimated the residence times in the historical period of 1986–2005 and also for the three future epochs 2016–2035, 2046–2065, and 2080–2099, which are treated as near, mid, and far future (Stocker et al., 2013) under the two emission scenarios of RCP 4.5 and RCP 8.5. All the models are with monthly temporal resolution and brought to the 1° × 1° spatial resolution by the bilinear interpolation technique (Mishra et al., 2018) for obtaining the Multi-Model Mean (MMM) (mean of the all models) which will help to study the explicit diagnosis of residence times on space and time scale. In the present work, we used the method of Chahine (1992) to estimate the atmospheric residence times (ART) by taking the ratio of the precipitable water vapor to the precipitation rate. Time series of ART have been obtained by averaging the respective grids over different regions under consideration. We also estimated the ART using the gridded rainfall data developed by India Meteorological Department (IMD) based on the wide rain gauge network (Pai et al., 2014) and the precipitable water vapor data from European Center for Medium-Range Weather Forecasting Reanalysis (ERA) and National Center for Environmental Protection (NCEP) gridded data set. These are used to compare with the CMIP5 model derived ART to understand the agreement between them.
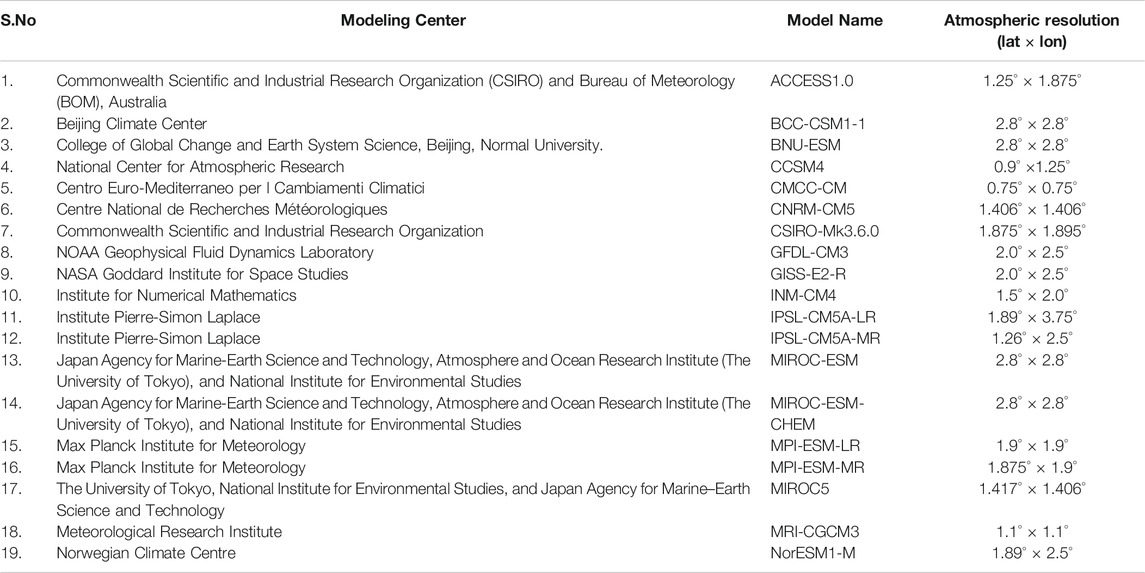
TABLE. 1. List of CMIP 5 Models used for the analysis.
Meridional wind at 300 hPa for June month has been obtained for different CMIP five models and subjected to the one-dimensional simple harmonic oscillator problem to get the zonal wavenumber spectra for different years. The meridional wind fields have been averaged zonally for each 10° box for the latitudinal region 37.5°N to 57.5°N and are used in the present study. The QRA mechanism can be understood from the phase speed equation of Rossby waves, which is given below,
Where c is the phase speed, U is the zonal wind, ß are the Rossby parameter, and K and l are meridional and zonal wave numbers, respectively. From Eq. 1, it can be inferred that the phase speed of stationary Rossby waves dependent on the magnitude of zonal wavenumber. Since the wind speeds are high in the southern hemispheric region, the QRA can apply to lower wavenumbers, i.e., above 4. But in the case of the northern hemisphere, similar QRA can be seen for higher wavenumbers i.e., above six or 7 (Kornhuber et al., 2017). Important steps in the aforementioned methodology are also provided in the flowchart given below.
Results and Discussion
The space scale variations of ART over India obtained from the CMIP5 MMM and the water vapor of ERA and NCEP with the rainfall of IMD for the SW monsoon season of 1986–2005 are shown in Figures 1A–C. The ART pattern obtained from the model and reanalysis data sets shows similar features over the monsoon core region of India. Mean monthly ART show less than 11 days over the MCI. However, the ART are much higher over India’s other regions, such as peninsular India and northwestern parts of India, which might be due to the low SW monsoon activity. Mean monthly ART over Indian landmass for the SW monsoon season under RCP 4.5 and 8.5 emission scenarios from 1986 to 2,100 showed a steady increase from 9.32 ± 0.44 to 10 ± 0.26 10.86 ± 0.21, respectively (Figure 2). These regional ART are analogous to the global atmospheric lifetimes of water vapor reported varying from 8 to 10 days (Chahine, 1992; Trenberth, 1998; Bosilovich and Schubert, 2002; Van Der Ent et al., 2014). The increase in ART is generally attributed to the increased radiative forcing that enhances the atmospheric water holding capacity, which is mainly driven by the rise in temperature (Trenberth, 1998) and the low exchange of moisture flux from surface to free troposphere (Allan and Liepert, 2010). Higher and lower residence times over oceans and land regions and the variability of residence times regionally are also connected to different reasons such as the land-sea patterns, stable stratification of the atmosphere in desert areas, intense coupling of evaporation and precipitation within the extratropical cyclones of the mid latitudinal regions, quasi-continuous evaporation over tropical regions respectively. The delay in the ART over the Indian landmass indicates the long span regional hydrological cycle over India. This delay also resembles the Indian hydrological cycle’s intensification, resulting in more frequent extreme weather events. The estimated spatial ART for the southwest monsoon months June, July, August, and September show a remarkable delay in June month compared to other months (Supplementary Figure S1). A delay of 50–90% from its mean has been observed with peak activity in the Western Ghats and core monsoon region (Figure 3). The delay in residence times gradually focused on the core monsoon region during the epochs 2046–2065 and 2080–2099, extending to the Western Ghats during the later epoch. The rest of the months have shown a slight delay in residence times along with the oceanic part. Since the SW monsoon is active over the Western Ghats and central Indian regions, the delay may conspicuous in these regions. The observed delay of ART in June may affect the agriculture sector, as Findell et al. (2019) reported. The reduction in global recycling might impact the crop yields to make them increasingly soil moisture limited. As the reduction in recycling is an indication of delay in residence times (Chahine, 1992), this will also impact the crop yields. Also, the reported delay of ART in the monsoon core region covering the geographical regions of Indo-Gangetic plains will play a crucial role as this region is prone to continuous droughts (Nath et al., 2017). The possible reasons one may think for the delay in ART during June month could be due to the increasing pre-monsoon rainfall and the changes in the monsoon onset dates. But, Sinha et al. (2019) reported that India’s pre-monsoon rainfall had shown a significant decreasing trend. This trend is attributed to the precipitation over China and temperature over the South China Sea, which will impact the Indian southwest monsoon rainfall. Secondly, southwest monsoon’s onset dates over the core monsoon India are slightly advanced from 1979 to 2014 (Supplementary Figure S2). Also, Rai et al. (2015) reported that the early onset of monsoon over India’s northwest parts would decrease the rainfall amounts during the June and July months of southwest monsoon. Further, our analysis on the increasing number of heavy rainfall events (rainfall greater than 64 mm per day) (Supplementary Figure S3) and the number of dry days (All India rainfall less than 2 mm per day) (Supplementary Figure S4) in June for the period 1986 to 2005 over India confirmed that there is an increment of aforementioned which could be due to delayed residence times. Unlike the temperature, the computed rainfall trend over the monsoon season for the future emission scenarios also does not yield any significantly increasing or decreasing (Supplementary Figure S5). The trend in water vapor shows a perceptible increase as it is mainly dependent on temperature (Supplementary Figure S6). Past studies of Goswami and Xavier (2005) reported that though the trend of summer monsoon rainfall over Central India is not increasing, the frequency of heavy rainfall events shows a remarkable increase. This remarkable increase is offset by the decreasing number of moderate rainy days, which compensate for rainfall, not increasing, and keeping steady. Hence, the ratio of precipitable water vapor to the rainfall (residence times) provides a good understanding of extreme weather events' increasing frequency. This work’s main objective is to examine the QRA during the June month to show the delayed residence times, causing the increased frequency of extreme weather events associated with the Rossby wave resonance. As reported, the southward incursion of upper tropospheric westerlies associated with mid-latitude troughs can severely affect the Indian summer monsoon. This interaction depends on the phase of Rossby waves (Joseph et al., 2014). It is also worth mentioning that the CMIP five models project increased Indian summer monsoon rainfall due to its strong negative feedback of cloud-radiation in the western Pacific and reduced surface warming over the eastern equatorial Indian Ocean (Li et al., 2015; Li et al., 2016; Li et al., 2017). Here, we first show QRA’s indication during the recent Kerala floods, which is the result of heavy rainfall over the regions of Kerala during August 2018. Hunt and Menon (2020) attributed Kerala heavy rainfall events in 2018 to climate change, which weakened the synoptic activity of the Indian monsoon and increased tropical tropospheric moisture. The rainfall over Kerala from 1st to August 19, 2018 is 758.6 mm against the normal rainfall amount of 287.6 mm (The organisation, H. S., 2018). Using the National Centers for Environmental Prediction (NCEP) reanalysis data, the QRA detection scheme suggested by Kornhuber et al. (2017) has been carried out. Figures 4A–D shows the meridional variations of seasonal mean surface temperature from 1st to Aug 19, 2018 and its corresponding climatology. Figure 4B reveals the difference between the temperature of QRA time and its climatology. QRA fingerprint has been obtained (Figure 4C) by restricting profiles to the mid latitudinal region (25 N-75 N) and calculated the associated variation in temperature associated with QRA (Figure 4D). The corresponding temperature gradient and the temperature decrease the near-neutral values around 40̊ N and positive values through 50 N and peak in subpolar latitudes. The temporal gradient Figure 4D shows the positive values in the mid latitudinal region and poleward reduction. These temperature gradient variations resemble the minimum zonal wind and strong westerlies over mid and polar latitudes, which are the favorable conditions of QRA.
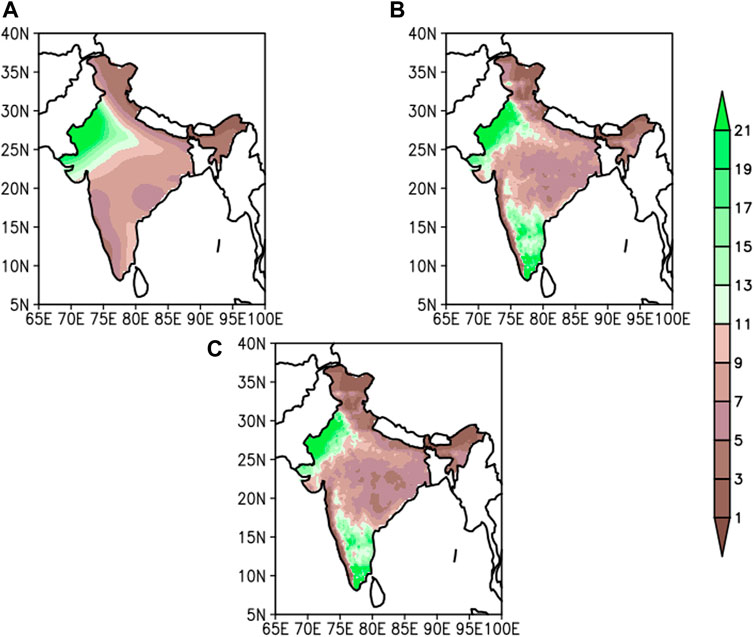
FIGURE 1. Spatial pattern of mean monthly atmospheric residence times (ART) over India obtained from (A) CMIP5 MMM data sets, (B) water vapor of ERA and rainfall of IMD and (C) water vapor of NCEP and rainfall of IMD for the south west monsoon season of 1986–2005.
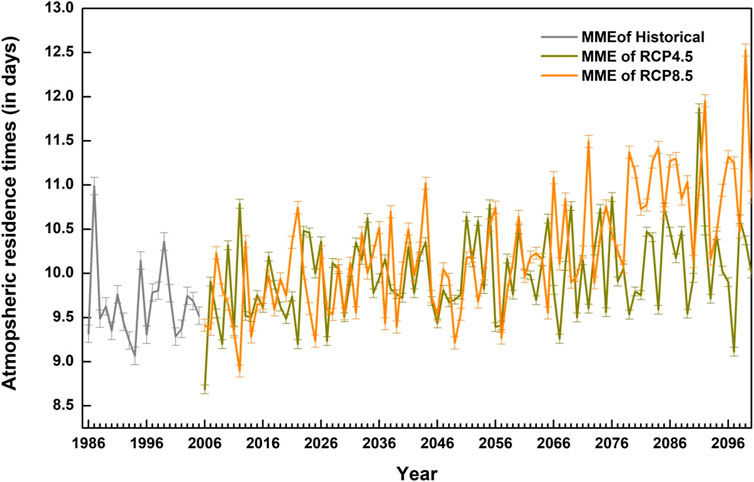
FIGURE 2. Mean monthly atmospheric residence times over Indian landmass for the SW monsoon from 1986 to 2,100 obtained from the multi model ensemble of CMIP 5 (vertical bars represent the standard error from the 19 global climate models).
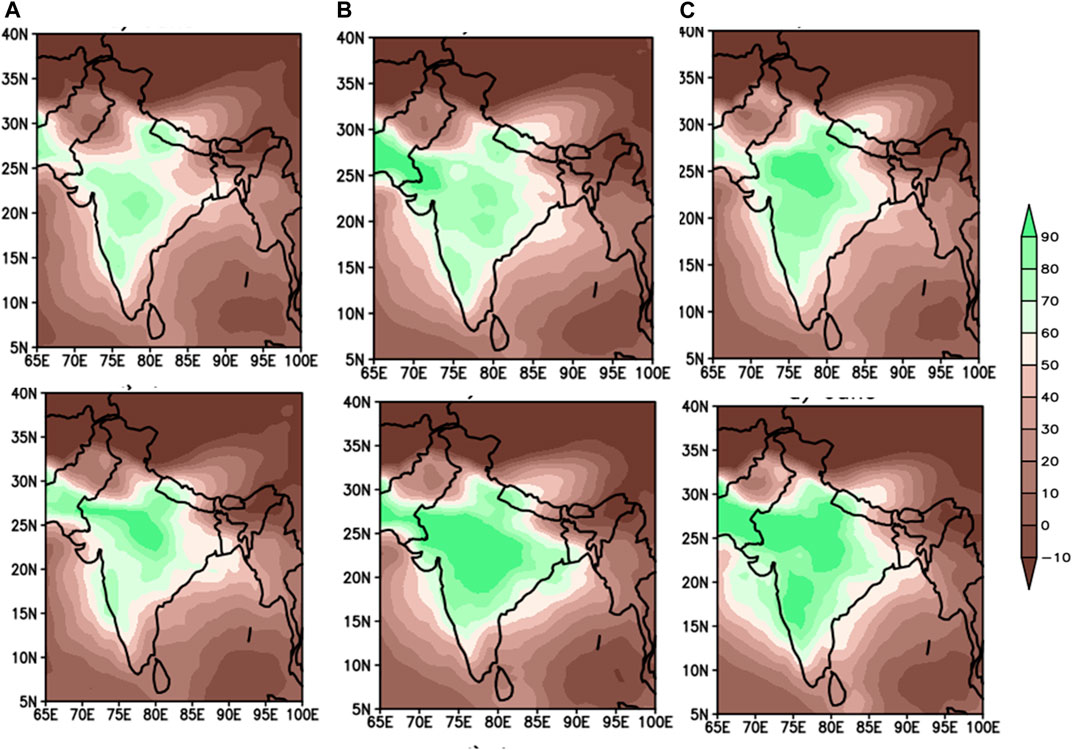
FIGURE 3. Anomalies in ART for June over India for the periods (A) 2016–2035, (B) 2046–2065 and (C) 2080–2099 under RCP 4.5 (top panel) and 8.5 (bottom panel) emission scenarios.
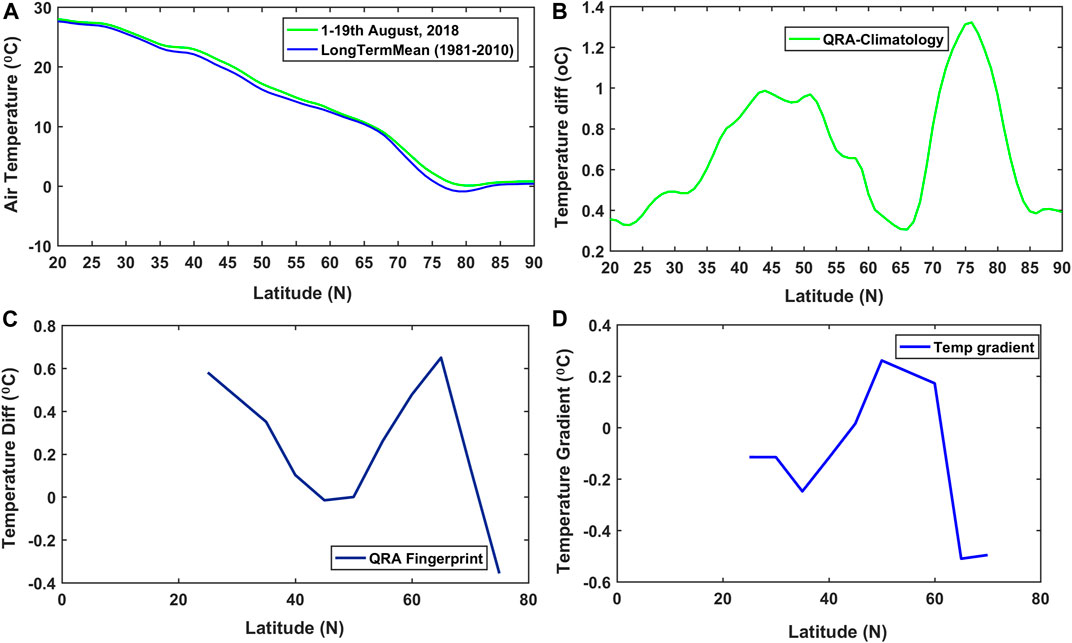
FIGURE 4. (A) Meridional variations of zonal mean surface temperatures over NH (B) the difference between zonal mean temperatures associated with QRA favorable conditions (C) The QRA fingerprint and (D) Temperature gradient for each 5 over NH during 1–19th August 2018.
The zonal mean zonal wind fields at 300 hPa from 1st to Aug 19, 2018 and the climatology (1981–2010) (Figure 5A) show the double jet structure by slowing down in mid latitudinal regions, amplification in sub-Polar Regions. Figure 5B shows the corresponding variations in surface temperature during the observational period and climatological period. Figure 5B is the zonal mean of meridional wind at 300 hPa showing a wavy pattern symbolizing the highs and lows across the poles and tropics. The zonal wavenumber spectra for the period 1st to August 19, 2018 for the zonally averaged meridional wind from 37.5°N to 57.5°N latitudes show the peak amplitude, the wave number six and is high compared to that of the same for the normal period (Figure 5C). As the floods caused by heavy downpours are not connected to human-induced climate change, the reasons are the short term variability in natural climate change induced by the anomalous large scale circulation features (Mishra and Shah, 2018). As the stationary waves influence the hydrological cycle by showing the changes in a vertical motion and the divergent circulations in the zonal variations of moisture, these can be related to the Asian monsoon (Wills et al., 2019). These stationary Rossby waves influencing the extreme weather persists longer than the synoptic scales, and hence these can be detected with sizable data less than the seasonal scale (Screen 2014). As the amplification in the Rossby waves has been seen at wave number six for the Kerala floods, we apply a similar technique to detect the Rossby wave influence on the future climate change scenarios of delayed residence times in June over India. Zonal wavenumber spectra for 19 global climate models show the peak at the wavenumbers six or seven during the three epochs of RCP 4.5 climate scenarios (Figure 6). The vertical bars in Figure 6 denote the standard error. Most of the models show a higher amplitude at wave number more than 5. The standard error of the amplitude of wave numbers six and seven is high compared to other wavenumbers, indicating the higher variability with the higher wavenumbers representing the favorable conditions for the QRA occurrence over the Indian region. Kornhuber et al. (2017), in their work on the QRA during the summertime Rossby wave resonance in the northern and southern hemispheres for the period 1979 to 2015, using the reanalysis data, found that the duration of the QRA events in the NH for wave number 7 as 6 days duration and the average duration for the wavenumbers 6–8 as 4.6 days. This duration is shorter than that of over the SH, observed at the wavenumber four and 5. However, from Figure 6, it can learn that the amplitude peaks change randomly for the near-century (2016–2035), mid-century (2046–2065), and far-century (2080–2099) future terms. We also show the number of QRA events for all the models during the above-mentioned periods (Figure 7). The events are calculated based on the wavenumber amplitude is higher than 1.5 of its standard deviation. All the models witnessed the occurrence of QRA with a distinguished number of events. An average of 10 years among the 20 years is found to be with extreme QRA from all models under RCP4.5 and 8.5 emission scenarios. Models such as ACCESS1, BNU-ESM, CCSM4, CNRM-CM5, GISS-E2-R, and MIROC-ESM-CHEM show the highest number of QRA events during the far future period in the RCP4.5 scenario, while models like GISS-E2-R, INMCM4, IPSL-CM5A-MR, MIROC5, and NorESM1 shows the highest number of QRA events during the far future period in the RCP8.5 scenario. As reported by Mann et al. (2018), some of the CMIP five models, which show the Arctic warming only could indicate the increase in QRA occurrence in the future while the rest yield to a potential decrease. In the present study, we could also see similar results of increasing and decreasing QRA events in different epochs. Nevertheless, India's residence times could show a continuous increase for future scenarios, showing that QRA is a primary component that influences the delay in ART over India. As the association of QRA is evidenced over the Indian region for different years of the study period, higher amplitude observed from the wave numbers six and seven and the number of QRA events from all the models indicate the intense and heavy rainfall events resulting from longer prolonged dry spells during the June month of Southwest monsoon season over India.
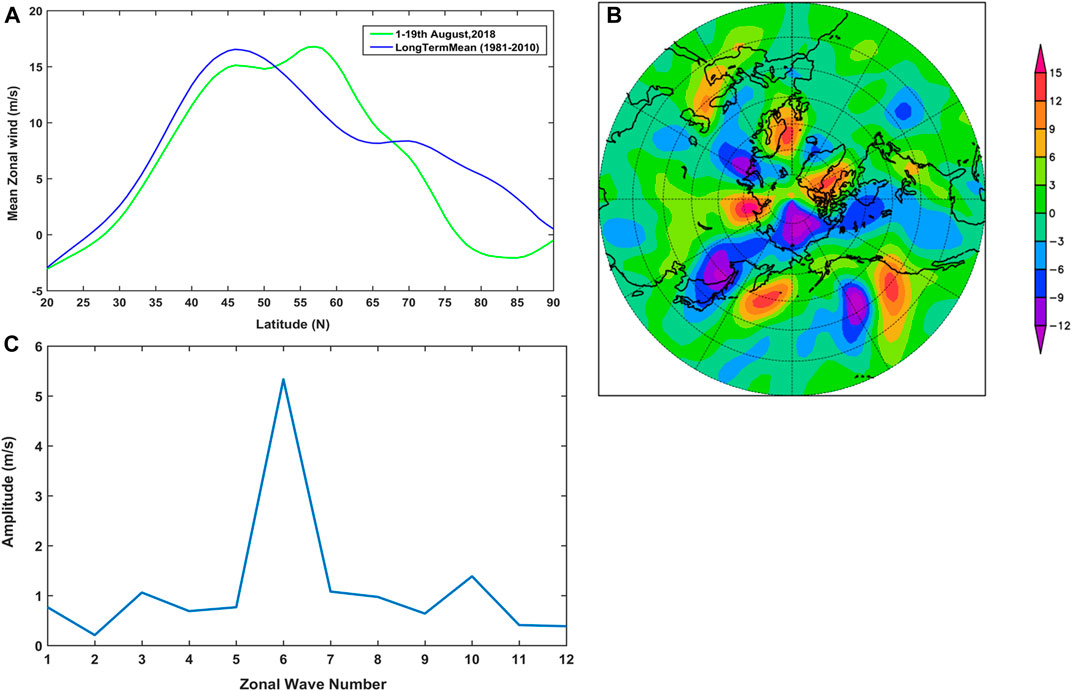
FIGURE 5. (A) Meridional variations of upper-troposphere (300hPa) zonal mean zonal winds over NH (B) Circumglobal variations of upper-troposphere (300hPa) meridional wind fields over NH and (C) Zonally averaged zonal wave number spectra for the meridional wind fields at 300 hPa over 37.5° to 57.5°N for the period 1st to August 19, 2018.
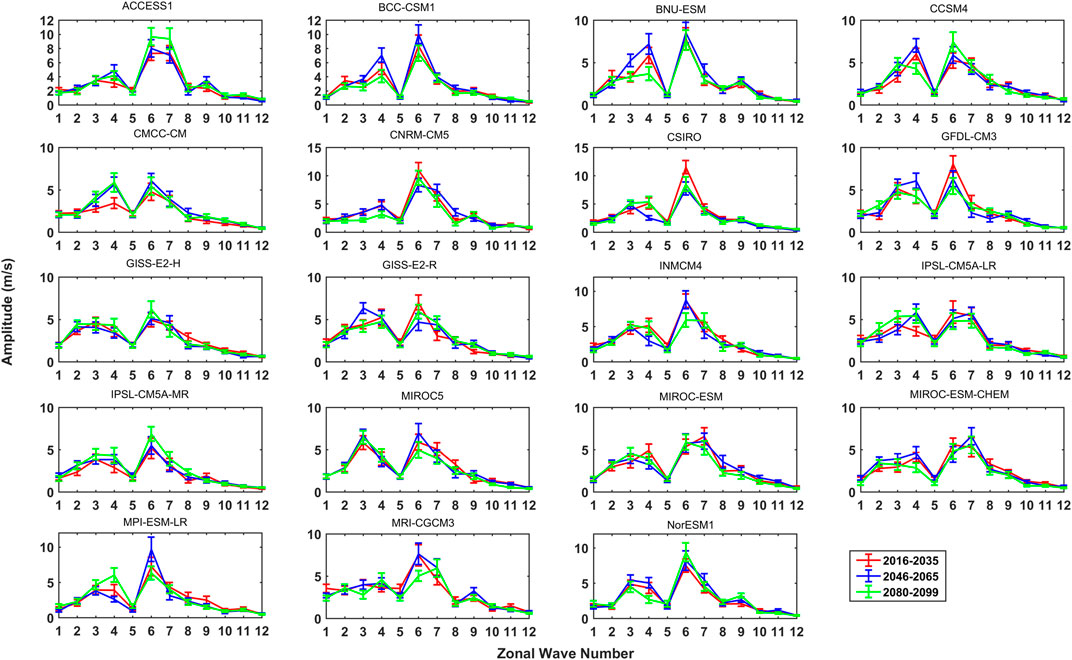
FIGURE 6. Zonal wave number spectra for the meridional wind fields at 300 hPa over 37.5° to 57.5°N for the June month for the near, mid and far future terms under RCP4.5 scenario.
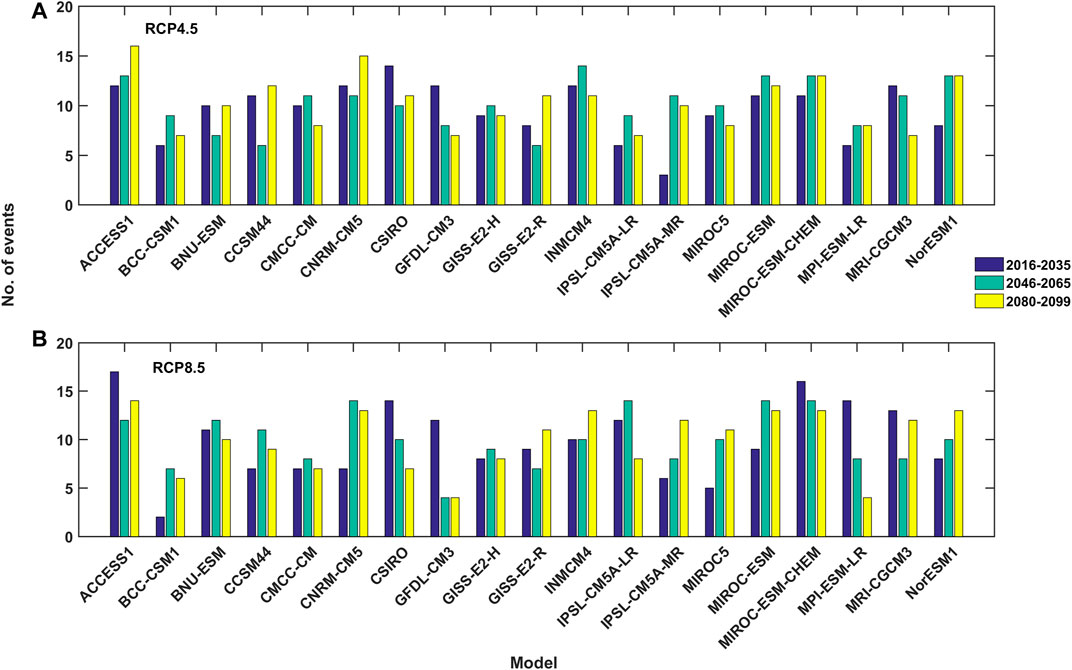
FIGURE 7. Number of QRA events with 1.5 of standard deviation obtained from all models during June for the near, mid and far future terms under (A) RCP4.5 (B) RCP8.5 emission scenarios.
Conclusions
Based on the analysis performed in the present study, we draw the following main conclusions.
i. June month over India witnessed a great delay in ART in near, mid, and far-future scenarios of RCP 4.5 and 8.5 pathways. This delay is concentrated in the regions of the Western Ghats and the core monsoon region of India.
ii. The association of QRA has been shown to have a connection with recent Kerala heavy rains in the year 2018.
iii. The delay in ART during June over India is associated with the occurrence of QRA events in near, mid, and future climate change scenarios.
Data Availability Statement
The original contributions presented in the study are included in the article/Supplementary Material, further inquiries can be directed to the corresponding author.
Author Contributions
TK conceived the idea, written the draft paper. GD analyzed the data. KR developed the idea and made the draft paper as a fair one. HB, RM, and VR are helped in interpreting the results and correction of manuscript. AK and SP helped in the interpretation of the results.
Conflict of Interest
The authors declare that the research was conducted in the absence of any commercial or financial relationships that could be construed as a potential conflict of interest.
Acknowledgments
The authors are thankful to the Science Engineering Research Board (SERB), Govt. of India, for funding this work.
Supplementary Material
The Supplementary Material for this article can be found online at: https://www.frontiersin.org/articles/10.3389/feart.2021.615325/full#supplementary-material.
References
Allan, R. P., and Liepert, B. G. (2010). Anticipated changes in the global atmospheric water cycle. Environ. Res. Lett. 5, 025201–025203. doi:10.1088/1748-9326/5/2/025201
Bosilovich, M. G., and Schubert, S. D. (2002). Water vapor tracers as diagnostics of the regional hydrologic cycle. J. Hydrometeor 3, 149–165. doi:10.1175/1525-7541(2002)003<0149:wvtado>2.0.co;2
Brubaker, K. L., Entekhabi, D., and Eagleson, P. S. (1993). Estimation of continental precipitation recycling. J. Clim. 6, 1077–1089. doi:10.1175/1520-0442(1993)006<1077:EOCPR>2.0.CO;2
Chahine, M. T. (1992). The hydrological cycle and its influence on climate. Nature 359, 359–379. doi:10.1038/359373a0
Coumou, D., Petoukhov, V., Rahmstorf, S., Petri, S., and Schellnhuber, H. J. (2014). Quasi-resonant circulation regimes and hemispheric synchronization of extreme weather in boreal summer. Proc. Natl. Acad. Sci. 111, 12331–12336. doi:10.1073/pnas.1412797111
Findell, K. L., Keys, P. W., van der Ent, R. J., Lintner, B. R., Berg, A., and Krasting, J. P. (2019). Rising temperatures increase importance of oceanic evaporation as a source for continental precipitation. J. Clim. 32, 7713–7726. doi:10.1175/jcli-d-19-0145.1
Goswami, B. N., and Xavier, P. K. (2005). Dynamics of “internal” interannual variability of the Indian summer monsoon in a GCM. J. Geophys. Res. Atmos. 110, 1–17. doi:10.1029/2005jd006042
Hunt, K. M. R., and Menon, A. (2020). The 2018 Kerala floods: a climate change perspective. Clim. Dyn. 54, 2433–2446. doi:10.1007/s00382-020-05123-7
Joseph, S., Sahai, A. K., Chattopadhyay, R., Sharmila, S., Abhilash, S., and Rajeevan, M. (2014). Contrasting progression phase of Indian summer monsoon during June 2013 and 2014 : observational diagnostics. Pune: Indian Institute of Tropical Meteorology.
Kornhuber, K., Osprey, S., Coumou, D., Petri, S., Petoukhov, V., Rahmstorf, S., et al. (2019). Extreme weather events in early summer 2018 connected by a recurrent hemispheric wave-7 pattern. Environ. Res. Lett. 14. doi:10.1088/1748-9326/ab13bf
Kornhuber, K., Petoukhov, V., Karoly, D., Petri, S., Rahmstorf, S., and Coumou, D. (2017). Summertime planetary wave resonance in the Northern and Southern hemispheres. J. Clim. 30, 6133–6150. doi:10.1175/jcli-d-16-0703.1
Lakshmi Kumar, T. V., Purnadurga, G., Koteswara Rao, K., and Mall, R. K. (2021). Moisture recycing over monsoon core region of India in response to global warming from CMIP 5 model data sets, Book, Asian monsoon—beyond teleconnections, Editor C. Gnannaseelan, A. Parekh, and J. S. Chowdary (Amsterdam, NL: Elsevier Publications) Under Review.
Lakshmi Kumar, T. V., Rao, K. K., Uma, R., and Aruna, K. (2014). The role of El Niño Southern Oscillation on the patterns of cycling rates observed over India during the monsoon season. J. Water Clim. Chang. 5, 696. doi:10.2166/wcc.2014.128
Li, G., Xie, S.-P., and Du, Y. (2016). A robust but spurious pattern of climate change in model projections over the tropical Indian ocean. J. Clim. 29 (15), 5589–5608. doi:10.1175/jcli-d-15-0565.1
Li, G., Xie, S.-P., and Du, Y. (2015). Monsoon-induced biases of climate models over the tropical Indian ocean*. J. Clim. 28, 3058–3072. doi:10.1175/jcli-d-14-00740.1
Li, G., Xie, S.-P., He, C., and Chen, Z. (2017). Western Pacific emergent constraint lowers projected increase in Indian summer monsoon rainfall. Nat. Clim Change 7, 708. doi:10.1038/NCLIMATE3387
Li, L., Jiang, X., Chahine, M. T., Olsen, E. T., Fetzer, E. J., Chen, L., et al. (2011). The recycling rate of atmospheric moisture over the past two decades (1988-2009). Environ. Res. Lett. 6, 034018. doi:10.1088/1748-9326/6/3/034018
Mann, M. E., Rahmstorf, S., Kornhuber, K., Steinman, B. A., Miller, S. K., and Coumou, D. (2017). Influence of anthropogenic climate change on planetary wave resonance and extreme weather events. Sci. Rep. 7, 4682. doi:10.1038/srep46822
Mann, M. E., Rahmstorf, S., Kornhuber, K., Steinman, B. A., Miller, S. K., Petri, S., et al. (2018). Projected changes in persistent extreme summer weather events: the role of quasi-resonant amplification. Sci. Adv. 4, eaat3272. doi:10.1126/sciadv.aat3272
Mishra, S. K., Sahany, S., Salunke, P., Kang, I.-S., and Jain, S. (2018). Fidelity of CMIP5 multi-model mean in assessing Indian monsoon simulations. Npj Clim. Atmos. Sci. 1, 1–8. doi:10.1038/s41612-018-0049-1
Mishra, V., and Shah, H. L. (2018). Hydroclimatological perspective of the Kerala flood of 2018. J. Geol. Soc. India 92, 645–650. doi:10.1007/s12594-018-1079-3
Nath, R., Nath, D., Li, Q., Chen, W., and Cui, X. (2017). Impact of drought on agriculture in the Indo-Gangetic plain, India. Adv. Atmos. Sci. 34, 335–346. doi:10.1007/s00376-016-6102-2
Pai, D. S., Latha, S., Rajeevan, M., Sreejith, O. P., Satbhai, N. S., and Mukhopadhyay, B. (2014). Development of a new high spatial resolution (0.25×0.25) long period (1901–2010) daily gridded rainfall data set over India and its comparison with existing data sets over the region. Mausam 65, 1–18.
Pathak, A., Ghosh, S., and Kumar, P. (2014). Precipitation recycling in the Indian subcontinent during summer monsoon. J. Hydrometeorol. 15, 2050–2066. doi:10.1175/jhm-d-13-0172.1
Rai, A., Saha, S. K., Pokhrel, S., Sujith, K., and Halder, S. (2015). Influence of preonset land atmospheric conditions on the Indian summer monsoon rainfall variability. J. Geophys. Res. Atmos. 120, 4551–4563. doi:10.1002/2015JD023159
Screen, J. A. (2014). Arctic amplification decreases temperature variance in northern mid- to high-latitudes. Nat. Clim Change 4, 577–582. doi:10.1038/nclimate2268
Sinha, P., Nageswararao, M. M., Dash, G. P., Nair, A., and Mohanty, U. C. (2019). Pre-monsoon rainfall and surface air temperature trends over India and its global linkages. Meteorol. Atmos. Phys. 131, 1005–1018. doi:10.1007/s00703-018-0621-6
Stadtherr, L., Coumou, D., Petoukhov, V., Petri, S., and Rahmstorf, S. (2016). Record Balkan floods of 2014 linked to planetary wave resonance. Sci. Adv. 2, e1501428. doi:10.1126/sciadv.1501428
Stocker, T. F., Qin, D., Plattner, G.-K., Tignor, M. M. B., Allen, S. K., and Boschung, J. (2013). Climate change 2013: the physical science basis. Contribution of Working Group I to the Fifth Assessment Report of the Intergovernmental Panel on Climate Change. Cambridge, UK and New York, NYCambridge University Press, 1535
Sujit, K., Saha, S. K., Pokhrel, S., Hazra, A., and Chaudhari, H. S. (2017). The dominant modes of recycled monsoon rainfall over India. J. Hydrometeorol 18, 2647–2657. doi:10.1175/JHM-D-17-0082.1
Taylor, K. E., Stouffer, R. J., and Meehl, G. A. (2012). An overview of CMIP5 and the experiment design. Bull. Am. Meteorol. Soc. 93, 485–498. doi:10.1175/bams-d-11-00094.1
The organisation, H. S. (2018). Hydrology ( S ) directorate STUDY REPORT Kerala FLOODS OF AUGUST 2018New Delhi: Central Water Comission.
Trenberth, K. E. (1998). Atmospheric moisture residence times and cycling: implications for rainfall rates and climate change. Clim. Change 39, 667–694. doi:10.1023/a:1005319109110
Van Der Ent, R. J., and Tuinenburg, O. A. (2017). The residence time of water in the atmosphere revisited. Hydrol. Earth Syst. Sci. 21, 779–790. doi:10.5194/hess-21-779-2017
Van Der Ent, R. J., Wang-Erlandsson, L., Keys, P. W., and Savenije, H. H. G. (2014). Contrasting roles of interception and transpiration in the hydrological cycle – Part 2: moisture recycling. Earth Syst. Dyn. 5, 471–489. doi:10.5194/esd-5-471-2014
Wang, N., Zeng, X.-M., Zheng, Y., Zhu, J., and Jiang, S. (2018). The atmospheric moisture residence time and reference time for moisture tracking over China. J. Hydrometeorol. 19, 1131–1147. doi:10.1175/jhm-d-17-0204.1
Keywords: atmospheric residence times, southwest monsoon, QRA, CMIP5, extreme events
Citation: Lakshmi Kumar TV, Durga GP, Rao KK, Barbosa H, Kulkarni A, Patwardhan S, Mall RK and Rao VB (2021) Connection of Quasi-Resonant Amplification to the Delay in Atmospheric Residence Times Over India. Front. Earth Sci. 9:615325. doi: 10.3389/feart.2021.615325
Received: 08 October 2020; Accepted: 15 February 2021;
Published: 08 April 2021.
Edited by:
Kyung-Ja Ha, Pusan National University, South KoreaReviewed by:
Gen Li, Hohai University, ChinaSubimal Ghosh, Indian Institute of Technology Bombay, India
Copyright © 2021 Lakshmi Kumar, Durga, Rao, Barbosa, Kulkarni, Patwardhan, Mall and Rao. This is an open-access article distributed under the terms of the Creative Commons Attribution License (CC BY). The use, distribution or reproduction in other forums is permitted, provided the original author(s) and the copyright owner(s) are credited and that the original publication in this journal is cited, in accordance with accepted academic practice. No use, distribution or reproduction is permitted which does not comply with these terms.
*Correspondence: K. Koteswara Rao, a290aS5tZXRlb0BnbWFpbC5jb20=