 Jixin Deng
 Chongyi Wang
 Qun Zhao4
- 1State Key Laboratory of Oil and Gas Reservoir Geology and Exploitation, Chengdu University of Technology, Chengdu, China
- 2Lab of Geophysics, School of Geophysics, Chengdu University of Technology, Chengdu, China
- 3State Key Laboratory of Petroleum Resources and Prospecting, China University of Petroleum, Beijing, China
- 4Petrochina Research Institute of Petroleum Exploration and Development, Beijing, China
This integrated study provides significant insight into parameters controlling the dynamic and static elastic behaviors of shale. Acoustic and geomechanical behaviors measurement from laboratory have been coupled with detailed petrographic and geochemical analyses, and microtexture observations on shale samples from the Wufeng−Longmaxi Formation of the southeast Sichuan Basin. The major achievement is the establishment of the link between depositional environment and the subsequent microtexture development, which exerts a critical influence on the elastic properties of the shale samples. Microtexture and compositional variation between upper and lower sections of the Wufeng−Longmaxi Formation show that the former undergoes normal mechanical and chemical compaction to form clay supported matrices with apparent heterogonous mechanical interfaces between rigid clasts and the aligned clay fabric. Samples from lower sections exhibited a microcrystalline quartz-supported matrix with a homogeneous mechanical interface arising from syn-depositional reprecipitation of biogenic quartz cement. This type of microtexture transition exerts primary control on elastic behavior of the shale samples. A clear “V” shaped trend observed from acoustic velocities and static Young’s moduli document contrasting roles played by microtexture, porosity and organic matter in determining elastic properties. Samples with a quartz-supported matrix exhibit elastic deformation and splitting failure modes. The increment of the continuous biogenic quartz cemented medium with limited mechanic interface. By contrast, samples showing a predominantly clay-supported matrix exhibited more signs of plastic deformation reflecting heterogeneous mechanical interfaces at grain boundaries.
Introduction
Horizontal drilling and hydraulic fracturing technologies have greatly increased oil and gas production in North America and East Asia (Curtis, 2002; Jia et al., 2012; McGlade et al., 2013). The Jiaoshiba, Zhaotong and Changning shale gas fields for example represent productive and profitable concerns in China (Jia et al., 2012; Ma et al., 2012; Jin et al., 2016). Among known shale basins however, productivity of wells varies considerably due to micro- and macro-scale heterogeneity of the reservoir rock (Ross et al., 2008; Breyer et al., 2012; Milliken et al., 2012). These conditions require geophysical prediction of “sweet-spots” using seismic methods. Total organic content (TOC), porosity, mineralogy and geomechanical parameters are all used as criteria for identifying sweet spots. Together, these indicate reservoir storage capacity as well as response to drilling and hydrofracturing (Sondergeld et al., 2000; Rickman et al., 2008). A better understanding of correlation between seismic parameters and causal mechanisms can help improve sweet-spot identification from seismic datasets.
Experimental studies have shown that shale seismic properties depend on the interplay of TOC, porosity, rock composition, ambient conditions and rock fabric. This range of factors makes it difficult to isolate the effects of variation in a single parameter on seismic response (Vernik and Liu, 1997; Sone and Zoback, 2013). Shales can also exhibit significant acoustic and mechanical anisotropy due to alignment and distribution of clay minerals (Hornby et al., 1994; Johnston and Christensen, 1995; Deng et al., 2009) and organic matter (Vernik and Nur, 1992; Vernik and Liu, 1997; Sondergeld et al., 2000; Vanorio et al., 2008; Vernik and Milovac, 2011; Sone and Zoback, 2013). Studies have demonstrated that maturity and the orientation of principal stress can significantly influence velocity anisotropy (Dewhurst et al., 2011). Theoretical models can be used to estimate the influence of varying TOC content, fluid saturation and pore pressure on seismic parameters (Sayers, 1994; Vernik and Landis, 1996; Johansen et al., 2004; Carcione and Avseth, 2015). But those theoretical relationships still have substantial limitation because of the composition, texture and diagenesis complexity of shales (Ross et al., 2008; Breyer et al., 2012; Milliken et al., 2012). However, the exact roles of composition, porosity and texture in relation with the seismic properties of shales are not fully understood. Systematical rock physics experiments are thus prerequisite to building a robust relationship for seismic-to-rock property transforms for mapping “sweet-spots” of shale reservoir. Fully capturing this complexity experimentally is still severe lack in the existing literature, partly due to the significant efforts required in core handling and preservation (Dewhurst et al., 1998; Horsrud et al., 1998; Dewhurst and Siggins, 2006).
Rock deformation in the subsurface, including that which occurs during hydraulic fracturing and fluid injection, depends rock geomechanical properties and in-situ stress fields. Empirical research on the geomechanical behaviors of shales from different reservoirs has demonstrated that static elastic moduli, strength and deformation of these materials depend on the applied pressure (Niandou et al., 1997; Islam, 2013; Rybacki et al., 2015), temperature (Masri et al., 2014; Rybacki et al., 2015) and rock composition (Rybacki et al., 2015; Dong et al., 2017). There is still a severe lack of mechanical understanding on how geomechancal behaviors are controlled by rock properties, including composition and rock texture, and to what extend geomechancal properties can be inferred from seismic parameters. More directly, the relationships between reservoir quality, seismic and geomechanical rock properties and depositional environment and burial history, at scales relevant to exploration and production, are prerequisite to character “sweet-spots”.
This paper describes a detailed rock physics study combined with microstructural analysis and diagenetic interpretation of core material from the Late Ordovician - Early Silurian Wufeng−Longmaxi black shale of the southeast Sichuan Basin. We investigated the seismic, geomechanical, geochemical, petrophysical and microstructural properties of about 82 core samples. The objectives were 1) to identify relationships between velocity and rock composition and between TOC content and porosity, 2) to interpret observed velocity anisotropy, 3) to examine mechanical behavior and failure mode, 4) to determine static Young’s moduli and any mineral content dependence and 5) to evaluate the brittleness index. An integrated study of this sort provides significant insight into key factors controlling the acoustic and geomechanical behaviors of the Wufeng−Longmaxi Formation shale, especially depositional and diagenetic controls on its macroscopic seismic and geomechanical properties (Hereafter, the Wufeng-Longmaxi Formation shale is referred to simply as the Longmaxi Formation for the sake of brevity.)
Geological Setting
The Longmaxi Formation samples selected consist of core material obtained from five adjacent wells located in the Changning shale gas field along the southern edge of the Sichuan Basin (Figure 1), a region of Longmaxi Formation shale that is notably for its high TOC content and abundant graptolite fossils, including Glyptograptus, Parakidograptus, Cystograptus, Demirastrites (Chen et al., 2000; Chen et al., 2010). Since the Sinian Period, this large Paleozoic-Mesozoic basin experienced several major tectonic events conferring a complex stratigraphy and rhombic configuration on the basin (Guo et al., 1996). Structurally, the Changning area is located along a southerly flank of the Sichuan Fold Belt referred to as the Hubei-Huan-Guizhou fold belt. As shown in Figure 1B, the study area contains a wide and gentle anticline confined by several northwest trending faults. This structure exposes Jurassic strata in axial areas and Triassic strata in the fold’s limbs. The Longmaxi Formation shale occurs in core material as consistent and relatively undeformed layers. Outer regions of the anticline limbs exhibit greater dip angle and show effects of bounding faults (Figure 1B). From Late Ordovician to Early Silurian, global transgression (Su et al., 2007) along with uplift of the Sichuan Basin margin caused by the Duyun tectonic event formed a low-energy, anoxic shelf environment hosting uniform deposition of several organic-rich shale horizons (Longmaxi Formation).
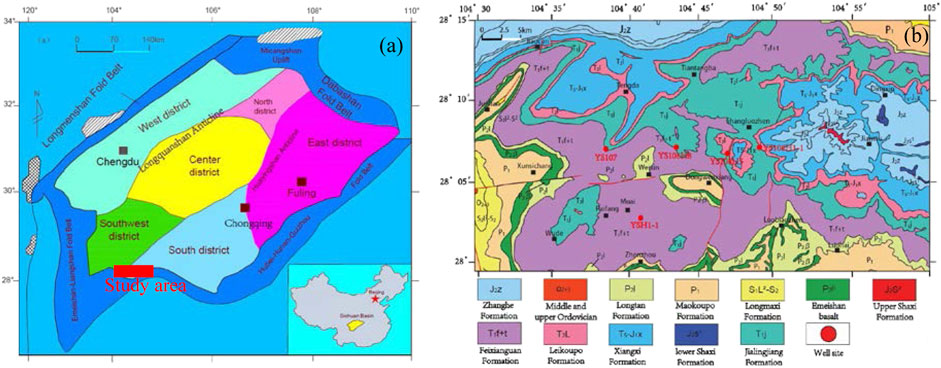
FIGURE 1. (A) Location and paleogeographic map of the study area in south Sichuan Basin, and the structural subdivisions include the east district, the south district, the north district, the central district the (modified from Chen et al. (2016), Hao et al. (2008)). (B) Geological map of study area, showing sample sites.
Depositional indicators in the Longmaxi Formation suggest both deep and shallow water shelf settings. The lower member of the Longmaxi Formation consists mainly of thick, black, siliceous shale, calcareous-siliceous mixed shale and micritic shale with abundant fossils, including graptolites, sponge spicules, siliceous radiolarians and other planktonic algae. This assemblage indicates the deep water conditions and low sedimentation rates (Chen et al., 2016; Han et al., 2016). The upper member consists of argillaceous, laminated shale, argillaceous-calcareous mixed laminated shale and wavy bedded shale with a more depauperate fossil assemblage indicative of intermediate to shallow depositional conditions (Chen et al., 2016; Han et al., 2016). The Lower Member is equivalent to a third-order sequence, which is composed of a transgressive systems tract (TST), early highstand systems tract (EHST) and late highstand systems tract (LHST) (Chen et al., 2015; Wang et al., 2015) (Figure 2A). The Upper Member are combined to be a third-order sequence, which consists of a low stand system tract (LST), a transgressive systems tract (TST) and highstand systems tract (HST) (Chen et al., 2015; Wang et al., 2015) (Figure 2A). Lithofacies associations indicating deep water shelf deposition are interpreted as probable reservoir rocks whereas lithofacies indicating semi-deep to shallow shelf deposition are interpreted as probable cap rock. Together, these form a seal reservoir-cap rock association (Figure 2A).
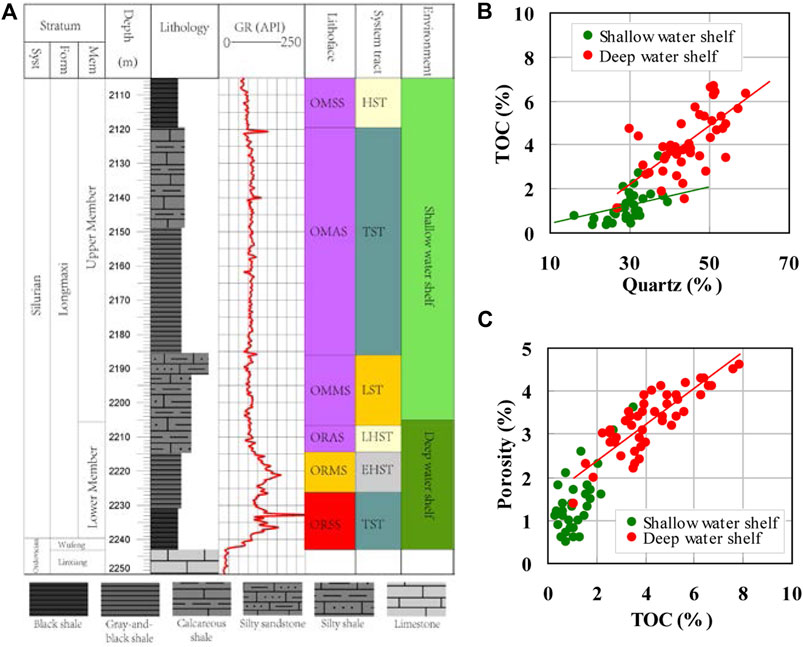
FIGURE 2. (A) Sequence stratigraphic framework of Wufeng-Longmaxi Formation shale. ORSS: Organic-rich siliceous shale; ORMS: Organic-rich mixed shale; ORAS: Organic-lean argillaceous shale; OMSS: Organic-moderate siliceous shale; OMMS: Organic-moderate mixed shale; OMAS: Organic-moderate argillaceous shale. TST:transgressive systems tract; EHST: early highstand systems tract; LHST: late highstand systems tract (LHST); LST: low stand system tract; HST: highstand systems tract. (B) Relationship of TOC content and quartz content. (C) Relationship of TOC content and porosity. Data are sorted by sedimentary circumstance.
Sampling and Analytical Techniques
Samples
A suite of 82 samples was selected for analysis from cores collected from five shale gas wells. Samples represent volumetrically dominant lithofacies of the Longmaxi Formation shale (Figure 2). Visible irregularities, such as fractured surfaces, were avoided in sampling to minimize sources of uncertainty in analyses of subsamples. Each sample showed some degree of subtle variation in texture and composition given the relatively thin scale of bedding and lamination relative to the sampling horizon. Two cylindrical samples (‘plugs’) were extracted from the full core (approximately 10 cm in diameter), one in a direction parallel to bedding and the other in a direction perpendicular to bedding. Each plug was about 25.4 mm (1 inch) in diameter and between 30 and 50 mm long. Cores were also systematically subsampled for compositional, pore structure and microstructural analysis. Inhibitive potassium-rich fluids (light mineral oil) were deployed as cooling fluid during drilling to lessen reactions between water and clay minerals (Steiger, 1982). Dry conditions in this report refer to ambient conditions for ultrasonic velocity measurements which assume no free water in pore space. Subparallel to bedding microfractures form as consequence of stress release after coring or from the expulsion of hydrocarbons. These microfractures will influence velocity and anisotropy of the rock, especially at low confining pressures (Sayers and Munster, 1991; Vernik and Liu 1997).
Geochemical Analysis
Exact mineral compositions of the 82 samples were determined through powder XRD (X-ray diffraction) analysis and pyrolysis. This procedure analyzed crushed sample powders (grain sizes less than 48 μm) using a PANalytical (Empyrean) X-ray diffractometer. Whole rock geochemical analyses were conducted on 37 samples using inductively coupled plasma-mass spectrometry (ICP-MS). These analytical methods yield data for 13 major oxides and 10 trace elements. Analytical results were calibrated with laboratory internal standards. Total organic content (TOC) was also measured for samples using standard high-temperature pyrolyzation methods and A Leco carbon/sulfur analyzer.
Petrography
Focused Ion Beam scanning electron microscopy (FIB-SEM), scanning electron microscopy (SEM), and conventional optical microscopy were used to image and interpret predominant microtextural character of samples, especially in terms of microcrystalline quartz. Ar-ion polished thin sections of typical shale samples were examined using FIB-SEM (FEI Helios 650) with a backscattered electron (BSE) detector adapted for imaging microtexture at 4 nm pixel resolution. Samples were prepared with an Ar-ion thin section polisher operated at 5 kV and 100 μA over a 10 h preparation period. The polished surface was then plasma coated with a 10 nm thick gold film to enhance conductivity. Thin sections were imaged using conventional SEM (JEOL JSM-5500LV) along with cathodoluminescent (CL) techniques commonly used on sandstones to interpret chemical compaction and diagenetic history (Götze et al., 2001; Thyberg and Jahren, 2011). Shale samples are seldom subjected to CL imaging due to the method’s low resolution relative to clay grain size (Götze et al., 2001; Thyberg and Jahren, 2011). This study used SEM and CL imaging to differentiate extrabasinal quartz and diagenetic quartz, especially biogenic quartz cement, which provided important clues concerning the Longmaxi Formation’s depositional and diagenetic history.
Ultrasonic Measurements
Ultrasonic transmission techniques were used to measure seismic velocity in dry samples. Measurements were conducted for various confining pressures at nominal center frequencies of 800 kHz for the P-wave transducer and 350 kHz for the S-wave transducer. Experiments began within a pressure cell at room temperature and confining pressures of 2 MPa, which ran up to 80 MPa in increments of 5 MPa. For each pressure interval, the first break of the transmitted pulse was selected from a 20 min period during which the sample strain fell below 2 × 10⁻⁴. This technique gave velocity measurement precisions of about ±1% for the compressional wave and about ±2% for shear waves. Deviations in pressure were less than 0.3%. According to wave polarization and propagation directions with respect to bedding plane of core plugs, this method allowed measurement of six velocities. These include VP-0°, V SH-0°and VSV-0°for vertically propagating waves and VP-90°, VSV-90°and VSH-90°for horizontally propagating waves, where the subscript P represents the compressional wave, subscript S represents the shear wave, subscript SV indicates the polarization perpendicular to bedding and subscript SH indicates polarization parallel to bedding. These velocity measurements only allow for calculation of anisotropic parameters ε and γ. Total porosity was measured using a method based on the Boyle-Mariotte Law.
Mechanical Properties Measurements
Uniaxial compression experiments were performed on 26 samples using a servo-hydraulically controlled deformation apparatus (MTS). In this test, LVDTS wrapped around the samples monitored axial and lateral strain at constant deformation rates of 10–3 mm/s before abrupt failure at 0.1 mm/min after failure. These points correspond to an axial strain rate of less than 1 × 10⁻⁵s−1. The slope of stress-strain curves then provided estimates for a secant Young’s modulus,ΕS. The measurement error in stress and strain was less than 4%, a value which gave corresponding uncertainties in Young’s moduli of about 20%. These tests were only performed on bedding-normal samples to lessen the influence of sample bedding and lamination on estimates of brittle failure properties.
Results
Lithofacies
Shale lithofacies were interpreted based on petrology and sedimentary environment. The Longmaxi Formation samples included six dominant lithofacies subdivided into organic-rich siliceous shale lithofacies (TOC≥2%) and organic-moderate shale lithofacies group (TOC<2%). Organic-rich siliceous shale lithofacies occur in lower parts of the Longmaxi Formation and consist primarily of organic-rich siliceous shale, organic-rich mixed shale and little organic-rich argillaceous shale (Figure 3A). Silicates (quartz, K-feldspar and Na-rich plagioclase) are the most abundant minerals found in samples of those lithofacies. Silicate fraction ranges from 38.7 to 67.6 wt% with an average of 52.9 wt%. This lithofacies contained relatively low abundances of total clay minerals (clay-sized minerals; reported as illite-semctite), measured at 30.5 wt%. Samples also exhibited low carbonate (calcite and dolomite) content ranging from 5.7 to 29.3 wt% with an average of 12.3 wt% (Figure 3A). TOC ranged from 2.0% to 7.87% with an average of 4.19%. The high TOC lithofacies group is interpreted to have formed in a deep water shelf environment with high paleoproductivity of planskton under anoxic condition. Fossil assemblages include radiolarians, sponge spicules and graptolites. Core material of this lithofacies exhibits thin, well-developed, black to black and gray bedding.
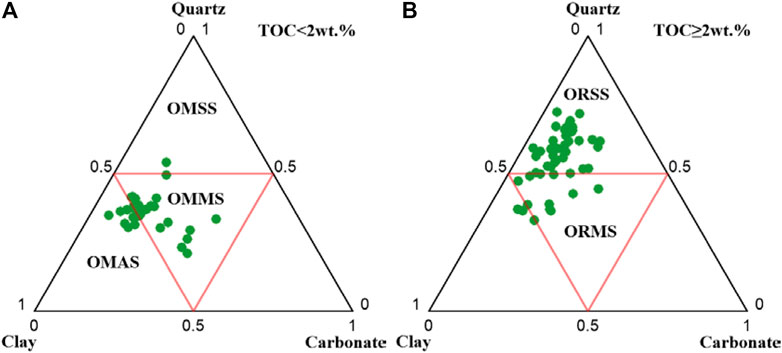
FIGURE 3. Lithofacies classification based on TOC content and ternary diagram of mineralogy of shale samples. (A) Ternary diagram for samples with TOC≥2%. (B) Ternary diagram for samples with TOC<2%. ORSS: Organic-rich siliceous shale; ORMS: Organic-rich mixed shale; OMMS: Organic-moderate mixed shale; OMAS: Organic-moderate argillaceous shale.
The organic-moderate shale lithofacies group occurs primarily in the upper part of the Longmaxi Formation and consists mainly of organic-moderate mixed shale, organic-moderate argillaceous shale and little organic-moderate siliceous shale (Figure 3B). The dominant mineral components found in this lithofacies are clay and silicates (38.8 wt% and 38.7 wt%, respectively). Average carbonate content ranges from 14% to 41% with an average of 19.6 wt% (Figure 3B). Trace minerals detected by XRD include pyrite, anhydrite and chlorite. This lithofacies is distinguished by its higher relative clay and carbonate content compared to the organic-rich lithofacies, which exhibits higher quartz content. The TOC content of the organic-moderate lithofacies ranges from 0.35% to 1.73% with an average of 1.02%. The organic-moderate shale lithofacies is interpreted to have formed in a shallow water shelf environment under dysoxic condition. The millimeter to centimeter scale silty belts in this lithofacies indicate higher energy conditions of shallow water environments. Thin sections and core samples of the organic-moderate lithofacies contain only a few graptolites. Subangular to rounded clasts of quartz, feldspar and pyrite exist in a matrix of elongated, aligned illite minerals.
For entire data set, TOC content, porosity do not display significant correlation with quartz or clay content, or any major element (Figures 2B,C). When samples are sorted by their depositional environment, we observe positive relation between TOC content, quartz content and their porosity for shale samples from deep water shelf (Figures 2B,C), consistent with the location of porosity within organic matter. However, shale samples from shallow water shelf display few significant correlations between TOC content, quartz content and their porosity (Figures 2B,C).
Pore Structure and Microtexture
Pores large enough to be detected by SEM (>4 nm) occur primarily within organic matter that fills intergranular space. Organic matter pores are usually elliptical or bubble-like with average diameter ranging from a few nanometers to a few hundred nanometers (Figure 4A). SEM images show intergranular pores as well developed and primarily localized between particles of quartz, feldspar, clay and organic matter (Figures 4B,C). As a conjunction result of preservation of primary pores and diagenetic alteration, intergranular pores between rigid particles, such as quartz, calcite and feldspar, appear primarily as triangular or polygonal features with well-defined edges (Figure 4C). Pores between clay platelets or adjacent to rigid particles appear as elongated ellipsoids (Figure 4C). Interparticle pores are relatively large in size with average diameter ranging from dozens of nanometers to a few microns. Samples contain a minor component of simple intracrystalline pores (Figure 4D), which are primarily localized within pyrite framboids and dissolution particles having an average diameter of less than 400 nm.
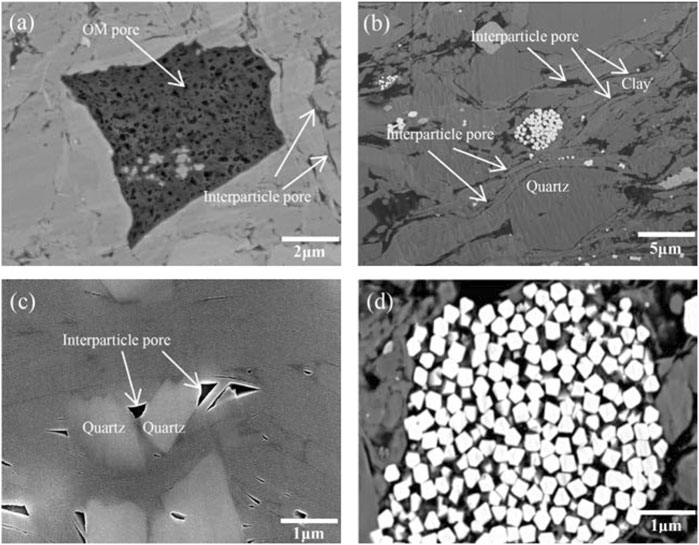
FIGURE 4. Examples of pore type observed on BES. (A) organic-matter pores (OM pore) and interparticle pores (Sample C37; TOC: 5.1%; Porosity: 3.2%; 2452 m). (B) interparticle pores with the shape of elongated ellipsoid between aligned clay (Sample C15; TOC: 2.74%; Porosity: 2.8%; 2162 m). (C) interparticle pores with triangular shape between rigid quartz grains (Sample C31; TOC: 3.5%; Porosity: 2.2%; 2375 m). (D) intracrystalline pores within pyrite framboids (Sample C21; TOC: 2.7%; Porosity: 3.1%; 2288 m).
SEM images exhibit two kinds of microtextures in shale samples (Figure 5). For sample from upper Longmaxi Formation shale, very coarse microcrystalline quartz (crystal size above 10 μm) surrounded by the aligned clay mineral constitutes the main morphology (Figures 5A,B). Contacts of anhedral quartz crystals are mostly punctic coalescent (particles partially welded to each other). Samples from the lower Longmaxi Formation exhibit variable proportions of compact, fine microcrystalline quartz (clast size less than 4 μm). Microcrystalline quartz consists of fully coalescent anhedral particles with distinct contacts (Figures 5C,D). Most of these samples exhibit a nonporous crystal mosaic microtexture similar to that described in Moshier (1989).
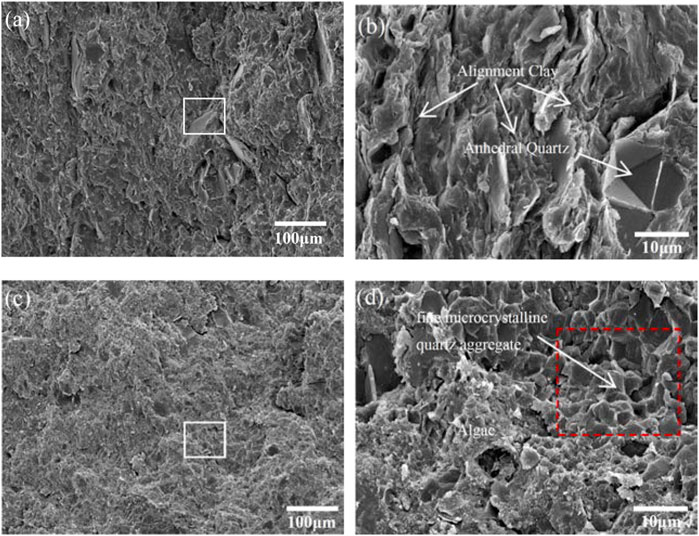
FIGURE 5. Examples of microtextures observed on SEM. White rectangles are the magnification areas. (A) and (B) Very coarse microcrystalline quartz with surrounded alignment clay (Sample C7; TOC: 1.65%; Porosity: 1.8%; shallow water shelf). (C) and (D) Compact fine microcrystalline quartz (Sample C51; TOC: 5.68%; Porosity: 4.2%; deep water shelf).
Velocity Versus Quartz Content
We analyzed how seismic elastic properties varied with shale composition, including organic matter content and porosity. Figure 6A shows bedding normal velocity (VP-0, VSV-0°) as function of quartz content at 30 MPa confining pressure (see Table 1). Velocity plotted versus quartz abundance exhibited a “V” shaped pattern shown in Figure 6A. Samples with quartz content of approximately less than 38% showed a subtle velocity decrease with increasing quartz content but samples with quartz content in excess of 38% showed a positive correlation between velocity and quartz content. We interpret the V-shape as recording the transition in load bearing structure from rigid quartz and carbonate grains isolated within ductile clay of the clay-supported matrix in samples with quartz content less than 38% to multiple generations of authigenic quartz surrounded by ductile clay in the quartz-supported matrix of samples with quartz content exceeding 38%. Clay-supported samples show elastic properties primarily reflecting the elasticity of clay minerals. Increasing quartz content did not change the dominant load-bearing phase but increasing grain content did enhance preservation of intergranular pores in compaction resulting in the subtle velocity decrease as function of quartz content. Carbonate components in clay-supported samples represent an important diagenetic phase that obscures variation trends due to their high velocity. Velocity increases with increasing carbonate content (black arrow) and thus contributes to the increasing slope of the velocity-quartz content trend. Relatively rigid microcrystalline quartz replaces clay as the load-bearing phase in quartz supported samples, but this substitution occurs on a continuum. Velocities therefore show a general positive correlation with quartz content with a piece-wize pattern according to clay content. Samples with quartz content above 38% fall into three groups of 0–20% clay, 20–30% clay and >30% clay. The load-bearing grains and clay fraction parameters are similar within each group (Figure 6A). The gradual increase in quartz-supported fraction for each group (Figures 6A–C) correlates with increases in bedding normal velocity. Velocity decreases with quartz content within each group reflecting the influence of TOC and porosity on the velocity. These latter parameters increase with increasing quartz content, especially in the case of authigenic quartz, which can provide a rigid framework that prevents compaction if formed early enough (see discussion below). Data also indicate that rock microtexture (load-bearing grains) is the most significant factor in determining velocity variation in the Longmaxi Formation, whereas porosity and TOC exert secondary influence. Compared with Figure 6B, where data are sorted by sedimentary circumstance, we observe that microtexture related acoustic velocity variations are in good agreement with the strong control of sedimentary circumstance on velocity. Here, we can speculate that the microtexture evolution of shale samples, to a larger extent, reflects the difference of sedimentary circumstance. In other words, strong control of rock microtexture on acoustic velocity also indicates the influence of sedimentary circumstance on velocity.
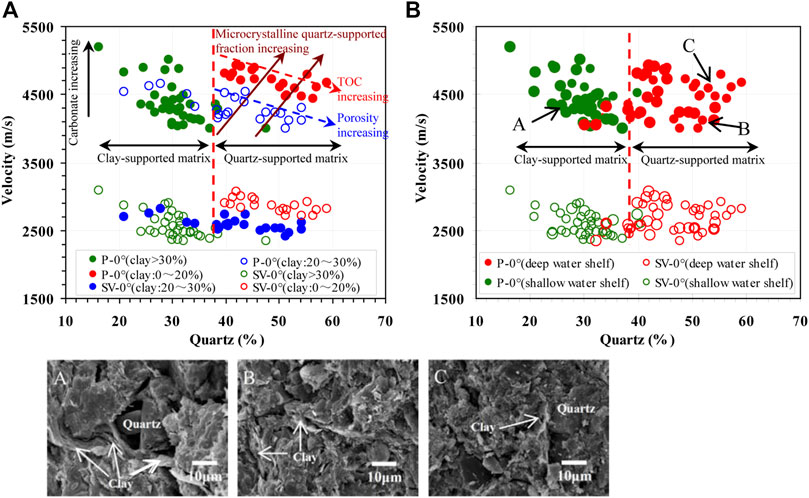
FIGURE 6. Effect of microtexture variations on velocity of shale samples. (A) and (B) Velocity variations with quartz content, where data are sorted by clay content and sedimentary circumstance, respectively (A) SEM photomicrographs of clay as load-bearing grains (Sample C24; Clay: 43.7%; Quartz: 26%; TOC: 0.92%) (B) SEM photomicrographs of clay and quartz jointly as load-bearing grains (Sample C52; Clay: 32.4%; Quartz: 51.2%; TOC: 6.26%) (C) SEM photomicrographs of quartz as load-bearing grains (Sample C33; Clay: 17.5%; Quartz: 55.3%; TOC: 4.7%).
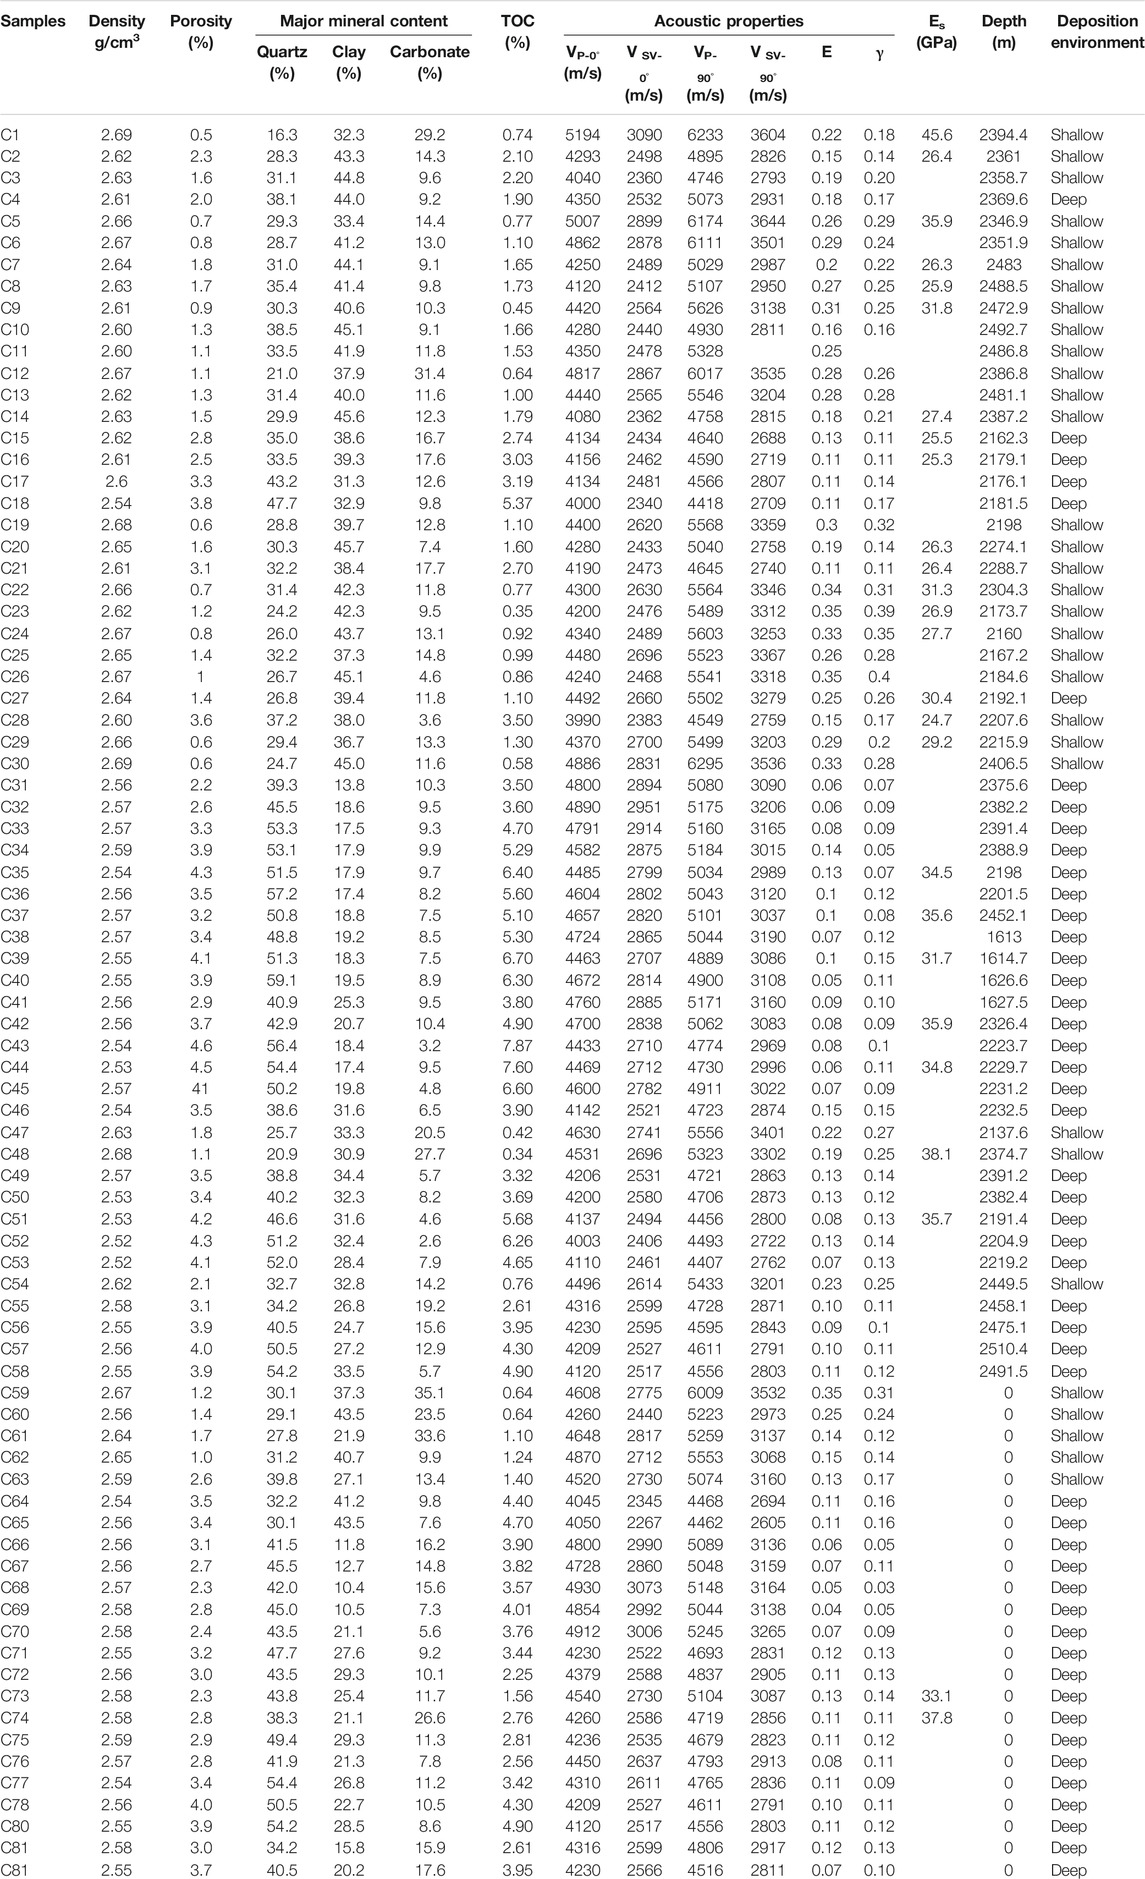
TABLE 1. Database of mineral content and rock physical properties of sales sample at 30 MPa confining pressure.
Velocity Anisotropy
All shale samples are assumed to have transverse isotropic (TI) symmetry, with symmetry axis normal to the lamination or bedding plane. Five independent elastic constants C11, C33, C44, C66 and C13 are therefore needed to fully describe shale elastic properties. These can be obtained experimentally from measured velocity and density. Following Thomsen (1986), two important anisotropy parameters are defined as:
In general, four basic textures are responsible for the seismic anisotropy of shales: 1) alignment of mineral grains (mainly platy clay particles) at micron scale, 2) alignment of lenticular kerogen or thin kerogen layers, 3) alignment of microfractures and 4) micro-lamination with different elastic properties. Figure 7 shows the anisotropy parameter ε as function of kerogen content at an effective pressure of 30 MPa. The figure also shows a modified Backus model for a two-layer illite/kerogen composite (Vernik and Nur, 1992) that demonstrates the theoretical effects of TOC on seismic anisotropy. The plot includes a subset of data corresponding to typical mature and immature Bakken shale samples (Vernik and Liu, 1997) for comparison. Comparing the results for Bakken shale and Longmaxi shales helps elucidate the impact of organic matter distribution on anisotropy. For the Longmaxi samples, the compressional wave anisotropy parameter ε shows only a weak negative correlation with kerogen content. The Bakken shale samples show a positive correlation for the same two parameters indicating that kerogen influence on velocity anisotropy depends on texture, diagenetic history and associated alignment of clay particles. Given the post-mature character of the Longmaxi samples and the location of its organic matter (primarily in pores as observed from SEM images), organic matter does not likely play a load-bearing role in the Longmaxi. By contrast, mature samples of the Bakken shale contain organic matter distributed in bedding parallel deposits that form a laminated lenticular texture and play a clear structural role Table 2. Thus, it is rational to speculate that anisotropy caused by the alignment of lenticular kerogen is not remarkable for Longmaxi Formation shale, except for samples with strong preferred orientation of clay minerals from the upper part of the Longmaxi Formation, where bed-parallel kerogen lenses along elongated pore within clay platelets can be observed.
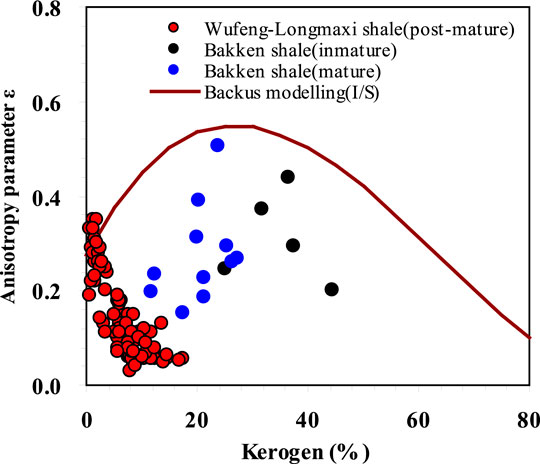
FIGURE 7. Anisotropy parameter ε versus kerogen content for Wufeng-Longmaxi Formation shales and some mature and immature shales from Bakken shales displayed on the background of the modified Backus model for two-layer illite/kerogen composite (Vernik and Nur, 1992).
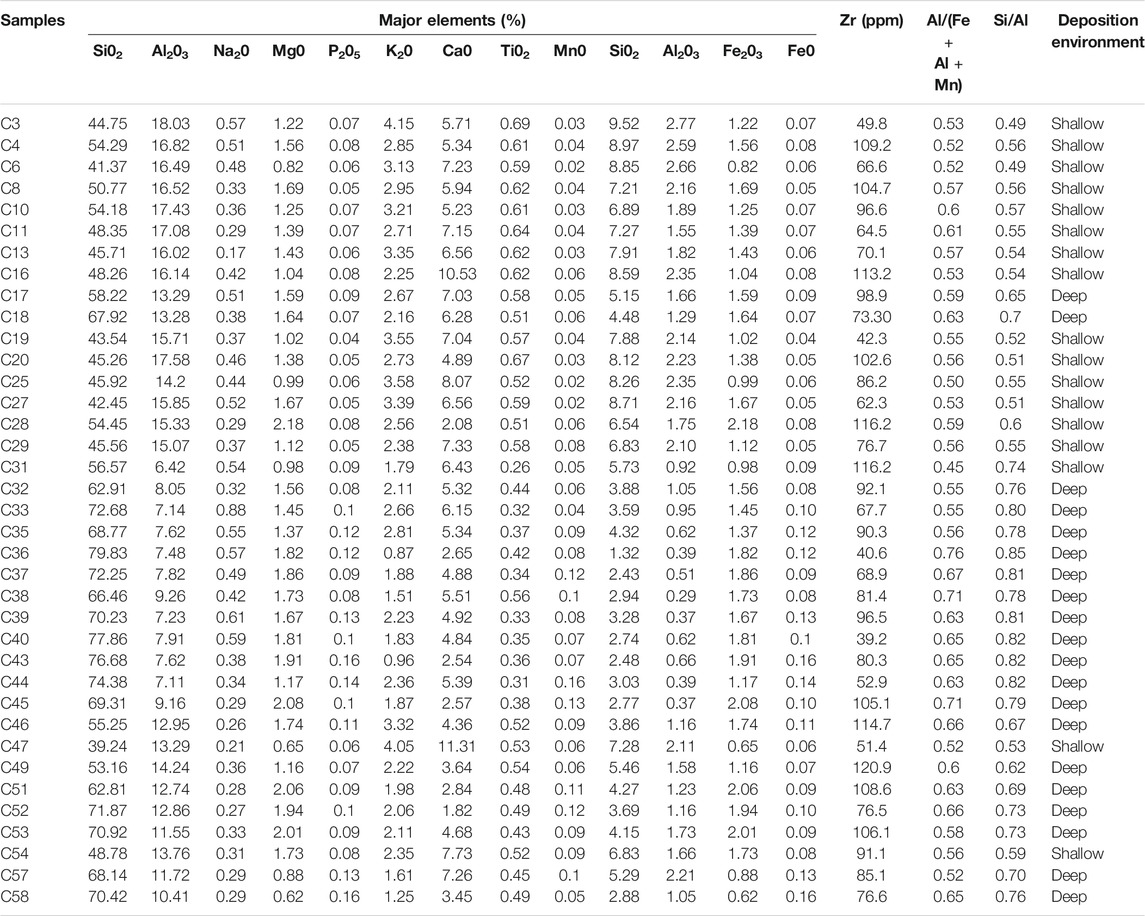
TABLE 2. Whole rock major element analyses of shale samples.
In addition to organic matter distribution, the alignment of platy clay particles can also cause velocity anisotropy. Figure 8 plots the two major anisotropy parameters ε andγas function of clay content at an effective pressure of 30 MPa. The data clearly show increasing ε and γ values with increasing clay content but with considerable variation in ε and γ values. This scatter does not apparently reflect variation in kerogen content as samples with relatively high ε andγ values give low TOC values. Organic matter distribution in pores also limits its influence on velocity anisotropy. Data plotted according to depositional environment showed a revealing trend. For a given clay content, shale samples from deep water shelf environments exhibit lower velocity anisotropy values relative to samples from shallow water shelf environments. These properties imply that alignment of platy clay particles is still primarily account for the velocity anisotropy of post-mature Longmaxi Formation shale. But it is also reasonable to speculate, at least, that for Longmaxi Formation shale in different dispositional environment, compaction and associated alignment of clay particles is very different. Relatively weak compaction and alignment of clay particles is observed in the shale samples from deep water shelf circumstance, consistently with lower velocity anisotropy in the samples. Note that shale samples from deep water circumstance are characterized by quartz-supported framework, which will enhance effectively the preservation of intergranular pores in compaction; moreover, weaken the alignment of clay particles by intervening them from compactional rearrangement.

FIGURE 8. Anisotropy parameters ε(A) and γ(B) as function of clay content of shale samples. Data points are sorted by clay content and sedimentary circumstance and TOC content (color bar).
Mechanical Behavior at Ambient Conditions
Figure 9A shows the measured stress-strain curves during triaxial compression at a confining pressure of 30 MPa: this figure clearly illustrates the deformation behavior of Longmaxi shale in different dispositional environment. Note that the shape of stress-strain curves occur in two typical forms, namely, elastic deformation and elastic-plastic deformation. For representative samples C35, C42, and C55 from siliceous shale and calcareous-siliceous mixed shale of deep water shelf circumstance, the measured stress-strain curves show typically elastic deformation with either limited or none inelastic deformation until abrupt failure and small stress drops in the post-failure regime (occurrence at axial stresses up to about 110 MPa); the compressive strength almost coincide with the yield stress, as a results, the point of yield stress is often difficult to identify. For representative samples C1, C14, and C28 from argillaceous laminae shale of shallow water shelf circumstance, the measured stress-strain curves is characterized by typically elastic-plastic deformation, and the curve consists a linear segment of elastic deformation stage and a continuous non-linear plastic yield deformation stage until failure, and a relatively large stress drops in the post-failure regime can be observed. Figures 10B–G show sample failure modes described above. In accordance with this transition in the shape of curves, samples C35 and C55 showed brittle fracture with typical splitting failure. Samples C14 and C28 developed a single shear crack, indicating the ductile nature of rock samples. Samples C1 and C41 showed conjugate shear cracks indicating semibrittle deformation (transitional between brittle and plastic deformation). The observed differences are likely attributed not only to composition, porosity, water content, but also on the structure and texture.
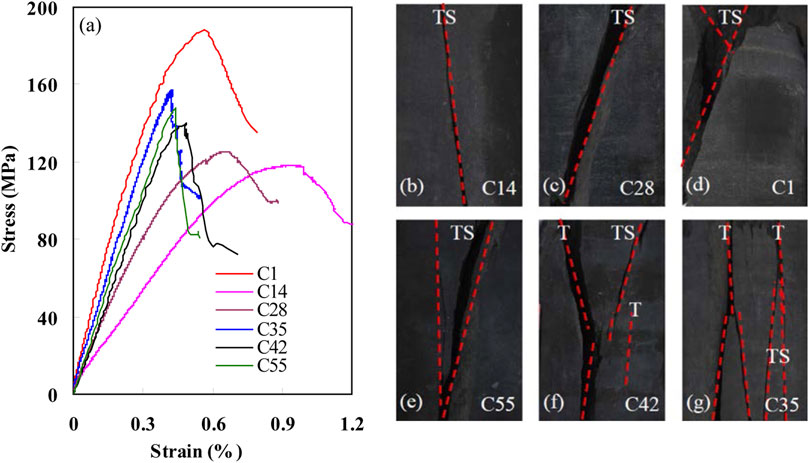
FIGURE 9. Typical stress-strain curves of the shale samples (A) and fracture patterns (B–G) (T represents tensile crack and tensile shear crack in the figure).
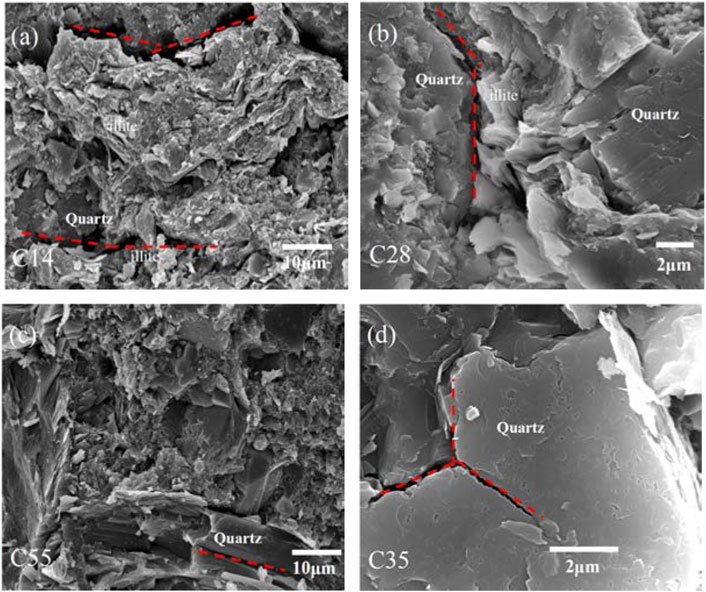
FIGURE 10. Microscopic crack characteristics of the typical shale samples after fracturing. (A) Microscopic crack characteristics of sample C14. (B) Microscopic crack characteristics of sample C28. (C) Microscopic crack characteristics of sample C35. (D) Microscopic crack characteristics of sample C55.
Figure 10 shows SEM images of representative samples after failure. For samples C14 and C28, microfractures developed mostly between grains having apparent stiffness differences (e.g., boundary between quartz and clay). These represent a heterogonous mechanical interface (Figures 11A,B). Microfractures gradually connect and join to form a larger shear fracture. Given this simple failure mode, quartz grains do not show brittle cracks from failure under triaxial compression. Samples C35 and C55 showed microfractures within quartz grains or compact microcrystalline quartz aggregates (Figures 11C,D). Figure 11D for example shows a “Y” shaped crack within a quartz grain. The crack has not been infilled by other minerals demonstrating its opening during fracturing. These “Y” shaped cracks could connect to form a complex network resulting in the final splitting failure mode.
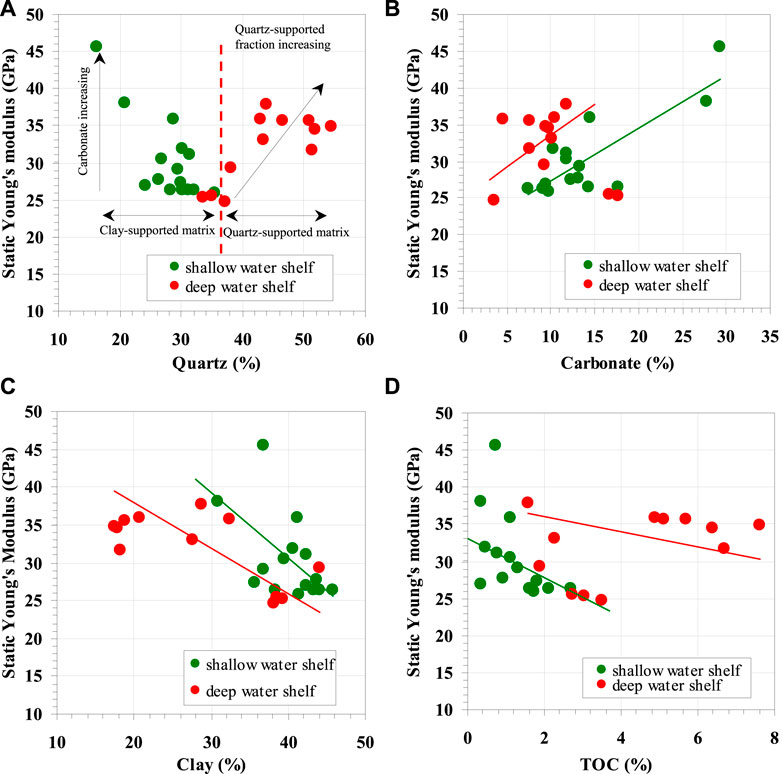
FIGURE 11. Crossplot of static Young’s modulus with major mineral composition. (A) Crossplot between static Young’s modulus and quartz content. (B) Crossplot between static Young’s modulus and carbonate content. (C) Crossplot between static Young’s modulus and carbonate content. (D) Crossplot between static Young’s modulus and TOC content.
Effect of Shale Composition on Static Young’s Modulus
To determine the effect of shale composition on the static elastic properties, we tested the relationship between the static Young’s modulus and the predominant mineral content, including quartz, clay, carbonate and TOC (Figure 11). Static Young’s modulus and microtexture showed a similar “V” shaped relationship as that observed between velocity and microtexture. Static Young’s modulus correlated positively with quartz content for samples with quartz content >38%. Samples with quartz content <38% showed a negative correlation between static Young’s modulus and quartz content (Figure 11A). These correlations may arise from the macroscopic effects of clay-versus quartz-supported matrices as captured by variation in quartz content. The carbonate, as the important cementation components, has an important effect on static Yong’s modulus because of their high elastic modulus, resulting in the increment of static Yong’s modulus with increasing carbonate content (Figures 11A,B); however, we can only observe a very weak positive relationship between them, under the condition that data are discriminated by the sedimentary circumstance, indicating that the effect of carbonate on static Yong’s modulus is offset by the microtexture variation. Clay minerals and TOC are usually interpreted as ductile materials due to the higher moduli of quartz and carbonates (Pickett, 1963; Mondol et al., 2008). Clay and TOC contents can thus significantly alter the elastic properties of shale (Han et al., 1986; Jarvie et al., 2007; Ahmadov, 2011; Vernik and Milovac, 2011; Eliyahu, 2015; Labani and Rezaee, 2015). Actually, static Yong’s modulus does not show a clear, systematic dependence on clay or TOC content. Only when data are displayed by sedimentary circumstance, we observe a very weak negative correlation between static Yong’s modulus and clay or TOC content in shale samples (Figures 11C,D). These weaker correlations still confirm that microtexture of shale samples (rather than mineral composition) exerts the strongest influence on static elastic properties of the Longmaxi Formation.
Discussion
Quartz Cementation
Although all the samples analyzed derive from the same formation, the upper and lower members of the Longmaxi Formation (shallow water and deep water shelf environments, respectively) show systematic differences in their elastic behavior. These differences help constrain the interpretation of depositional and diagenetic factors from the mechanical properties of shale.
Comparison of sample grain assemblage textures demonstrates the importance of micro-scale quartz crystals in the matrix, which form cement within the illitized clay matrix (Figures 5A,B) or occur as matrix-localized microcrystalline quartz (load-bearing grains) (Figures 5C,D). The SEM-CL images collected show clear differences between the extrabasinal and intrabasinal character of the quartz particles. Figures 12A,B show typical CL spectra for samples from the upper part of the Longmaxi Formation. Two major different categories of luminescence emission bands can be observed during the monochromatic CL analysis. Silt-sized angular quartz display a characteristic CL-spectrum of two broad symmetric “bell-shaped” with major luminescence peaks close to 680~720 nm and relatively weak secondary peaks close to 430~470nm, and these quartz can be identified as extrabasinal detrital quartz (Peltonen et al., 2009; Thyberg and Jahren, 2011). The micro-sized quartz, occurred mainly within the illitized clay matrix as discrete grains, small clusters, display a characteristic CL-spectrum of “bell-shaped” with peaks close to 590~620nm, and they can be identified as authigenic quartz, soured from smectite to illite reaction (Götze et al., 2001; Thyberg and Jahren, 2011).
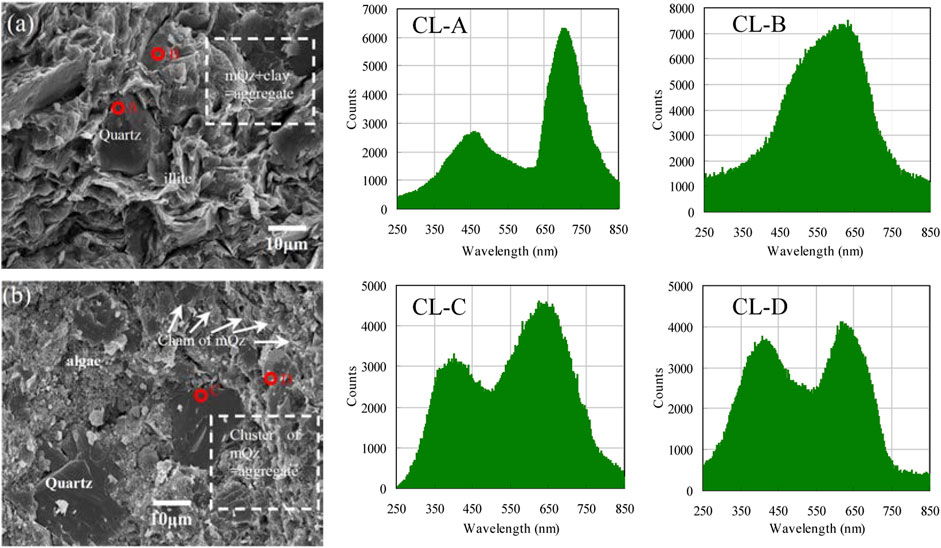
FIGURE 12. Typical characteristics of quartz in shale samples. (A) SEM photomicrographs of shale sample C8 from the upper part of the Wufeng-Longmaxi Formation shale (mQz: microcrystalline quartz). Discrete microcrystalline quartz embedded in the fine-grained illitized smectitic clay matrix. (B) SEM photomicrographs of shale sample C39 from the lower part of the Wufeng-Longmaxi Formation shale. Microcrystalline quartz formed coalescent aggregates. CL-A corresponding CL spectrum of extrabasinal quartz. CL-B corresponding CL spectrum of authigenic quartz sourced from smectite to illite reaction. CL-C and CL-D corresponding CL spectrum of biogenic quartz.
Typical results of the CL response for samples from lower part of Longmaxi Formation are shown in Figures 12C,D. We can observed that silt-sized irregular quartz and relatively large aggregates of microcrystalline quartz, display almost similar CL-spectrum with two symmetric “bell-shaped” with luminescence peaks close to 390~430 nm and 580~620 nm. Such quartz grains are often been considered as biogenic origin, re-crystallized locally during progressive burial from a biogenic precursor like radiolarians and sponge spiculus, and the weak peak close to 390~430 nm is commonly interpreted as being remnants of CL-properties of opal-A/opal-CT inheritance from biogenic precursor material to the re-crystallized microcrystalline quartz and finally to the macro-quartz during progressive diagenesis (Williams et al., 1985; Thyberg and Jahren, 2011). Comparing of the results of CL-spectrum, it can be seen that the derivation of microcrystalline quartz in the two shale units are very different. Very coarse microcrystalline quartz within clay matrix in samples from upper part is mainly soured from smectite to illite reaction, whilst compact fine microcrystalline quartz in samples from lower part is mainly biogenic origin.
In addition, biogenic quartz is characterized by high concentration of SiO2, P2O5 and Fe2O3, and relatively low concentration of TiO2, Al2O3, FeO and MgO (Wedepohl, 1971). Samples from the lower Longmaxi Formation have low TiO2 and Al2O3 content and do not show correlations between SiO2 and TiO2 or Al2O3 contents. This indicates only limited extrabasinal input to overall SiO2 content. By contrast, samples from the upper Longmaxi Formation exhibit high TiO2 and Al2O3 contents and a strong positive correlation between SiO2 and TiO2 indicating the presence of extrabasinal quartz. The Al/(Fe + Al + Mn) index is widely used to interpret silica precipitation in sedimentary rocks (Yamamoto, 1987). Hydrothermal silica gives Al/(Fe + Al + Mn) values of around 0.01 whereas biogenic silica gives Al/(Fe + Al + Mn) values greater than 0.6. Samples from the lower Longmaxi Formation give Al/(Fe + Al + Mn) values greater 0.6 indicating a biogenic origin. Samples from the upper Longmaxi Formation give Al/(Fe + Al + Mn) values below 0.59 suggesting an extrabasinal origin. Samples from the lower Longmaxi Formation also primarily plot above the illite Si/Al line (Rowe et al., 2008) further indicating a biogenic origin (Figure 13A).
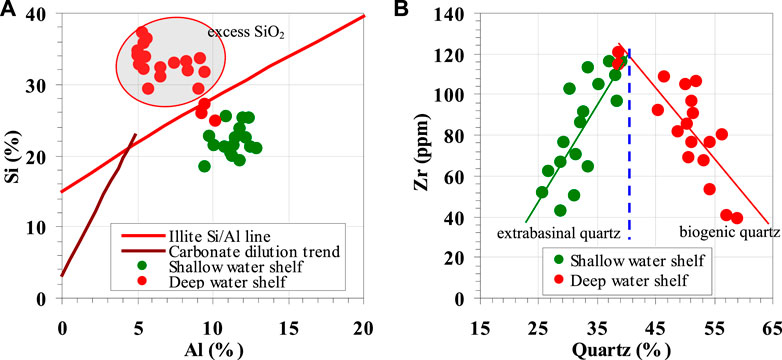
FIGURE 13. (A) Crossplot of Si and Al of Wufeng-Longmaxi Formation shale on the background of illite Si/Al line and carbonate dilution line (Rowe et al., 2008). Excess SiO2 indicates the biogenic quartz. (B) Crossplot of SiO2 versus Zr. Bioenic quartz is distinguished from extrabasinal quartz by the slope. Data points are sorted by sedimentary circumstance.
Wright et al. (2010) suggested that extrabasinal and biogenic silica can be differentiated on the basis of quartz (representatives of total quartz) and Zr content. Zirconium concentration is closely related to the heavy mineral zircon, which can serve as a proxy for silt-sized material of extrabasinal origin. A negative correlation between quartz and Zr content indicates that silica is primarily biogenic in origin while a positive correlation indicates extrabasinal input. Samples from the upper Longmaxi Formation show a positive correlation between quartz and Zr content, whereas samples from the lower Longmaxi Formation exhibit a negative correlation between quartz and Zr content (Figure 13B). These trends affirm that the 38% quartz content threshold effectively differentiates between extrabasinal and biogenic quartz contributions. Proxies described above indicate extrabasinal quartz contribution in samples from the upper Longmaxi Formation and a major biogenic quartz contribution for samples from the lower Longmaxi Formation. This model is also consistent with our SEM–CL work and geochemical analysis.
Influence of Diagenesis and Microtexture on Macroscopic Seismic Elastic and Geomechanical Behaviors
Most important factors controlling elastic properties of reservoir rock at great burial depth are the primary sediment composition, sedimentary environment and subsequent diagenetic processes. The mechanical and chemical compaction of sediment during diagenesis drives the rock towards higher mechanical and chemical stability. Effective stress from overburden at temperatures below 70–80°C causes mechanical compaction, which includes the reorientation, shifting and ductile deformation of clay particles. These processes diminish porosity and create an aligned clay fabric. At greater depth (higher temperature) compaction in shales is mostly chemical and cementation resulting from mineral reactions, e.g. transformation of smectite to illite, will dramatically increase the rock strength, in company with the further reduction of porosity and permeability, which will in most cases effectively shut down the mechanical compaction. Therefore, mechanical compaction and chemical compaction are commonly considered as two sequential processes controlling the elastic properties of shales during burial. Actually, the stratigraphic difference in depth between the two part of Wufeng-Longmaxi Formation shales cannot explain the major difference in the macroscopic seismic elastic and geomechanical behaviors, as the maximum effective stresses and temperatures the two formations have undergone during burial and uplift must have been practically the same.
The upper part of the Longmaxi Formation is interpreted to represent a relatively shallow water dysoxic to anoxic shelf environment with minor fluctuations in depositional conditions. Correspondingly, the primary composition of shale samples from this part contains not only a prominent fraction of clay minerals but also a significant component of silt-size extrabasinal debris. Primary grain assemblage gradually mixed with organic materials formed by the decadent of algae (mainly blue algae) and other plankton (Wang et al., 2014). Lower primary productivity associated with reducing conditions contributes to lower organic matter content. In the following mechanical compaction process during burial, platy clay particles in the primary composition of shale samples were re-oriented and re-arranged under overburden to reach the maximal mechanical stability with the fabric of preferred orientation of clay minerals normal to the overburden, where silt-sized extrabasinal debris is surrounded by a matrix containing abundant alignment clay-size clay minerals. However, such stable clay fabric remains unchanged during the subsequent burial history. Hence, it is reasonable to speculate that velocity anisotropy and its magnitude are basically determined in the mechanical compaction process. Intermediate burial depths of 2.0–3.5 km correspond to temperature ranges of 80–100°C where smectite becomes unstable and transforms into mixed-layer illite-smectite (Nadeau et al., 1985; Yau et al., 1987; Nadeau et al., 2002). This reaction releases excess silica which precipitates as authigenic micro-scale quartz within the illitized clay matrix as discrete grains or small clusters of grains (Figures 5B, 12A). Precipitation of illite and quartz will cause a sharp increase in matrix rigidity and prevent mechanical compaction. Thus, for the upper part of the Longmaxi Formation shales, it is rational to speculate that mechanical compaction and chemical compaction are two sequential processes in controlling elastic properties. Carbonate cement in samples from upper part of Longmaxi Formation is another critical component with respect to burial diagenesis. Relatively moderate amounts of carbonate cement in samples can results in high velocity and mechanical strength at shallow depth.
The lower part of the Longmaxi Formation shales are interpreted to represent deep-water shelf sediments deposited under anoxic conditions, where the primary composition of shale samples are also assumed to mainly contain detrital quartz and clay grains. High primary productivity and reducing conditions caused biogenetic silica to dissolve and reprecipitate as microcrystalline quartz coating on detrital quartz and clay grains, after biogenetic silica reacts to form opal-A and micro-quartz at about 60~80°C (Williams et al., 1985). Precipitation of amorphous silica from pore-water solutions can only occur at shallow depths, and super-saturation of silica limits or prevents later quartz cement precipitation from smectite to illite reactions, which demonstrate that biogenetic quartz have an early diagenetic origin. The euhedral shape of the microcrystalline quartz, as well as their growth on detrital quartz grains into the pore space seen via SEM (Figures 5D, 12B , isconsistent with early in situ precipitation in a non-compacted sediment rather than having been transported. Biogenic silica cement around primary grain assemblages during diagenetic transformation from opal-A to compact microcrystalline quartz forms a rigid, load bearing framework of interconnected quartz grains. As indicated by the CL-spectra, authigenic microcrystalline quartz cementation from the silica released by the smectite to illite reaction can also be identified, which can be considered as the primary results of chemical compaction. In a summary, microtexture and compositional reorganization of Longmaxi Formation Shale was apparently affected by the syn-depositional chemical transformation of the primary mineral assemblage. The interpretation of the depositional and diagenetic evolution of the two shale units is summarized in a simplified conceptual model in Figure 14.
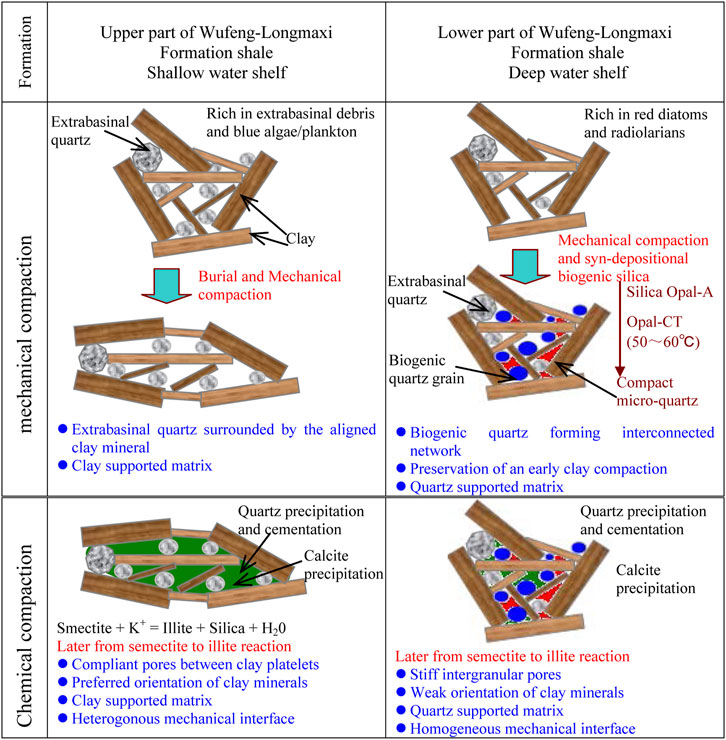
FIGURE 14. Conceptual model summarizing the depositional and diagenetic processes of the Wufeng-Longmaxi Formation shale.
The salient differences in microtexture and diagenetic evolution between the upper and lower Longmaxi Formation shales can be used to interpret contrasting acoustic and geomechanical properties as measured in the laboratory. Samples from the upper and lower parts of the Longmaxi Formation specifically differed in terms of brittleness, seismic velocity anisotropy, deformation and failure modes, relations between static Young’s modulus versus composition, their seismic velocity versus quartz content relationships and seismic velocity versus porosity (TOC content) relationships.
Samples from the upper Longmaxi Formation contain extrabasinal detrital and authigenic quartz surrounded by a load bearing clay matrix. The seismic elastic and geomechanical properties for these samples reflect the elastic response of their clay matrices (Figure 5B). For samples from lower part of Longmaxi Formation Shales, early biogenetic quartz forms the interlocking and continuous quartz cement, and biogenetic quartz will take the role as load bearing grains; therefore, the seismic elastic and geomechanical properties of the shale samples is mainly controlled by the elastic response of quartz aggregates (Figure 5D). Plots of seismic velocity according to clay- and quartz-supported matrix show a “V” shaped trend (Figure 6). It is reasonable to hypothesize, at least, that the quartz-supported fraction in the specimens will increase with the biogenetic quartz content. Similar observations are reported on the laboratory measurement for unconsolidated sand/shale mixtures (Yin, 1992) and on the Horn River Formation Group shale (Dong et al., 2017). Additional, the relationship between static Young’s modulus and quartz content also indicates variation in load-bearing grains of shale samples. These trends indicate that quartz primarily has an extrabasinal origin in samples with quartz content <38%, whereas it is predominantly biogenic in origin in samples with quartz content >38%.
Contrasting diagenetic histories also influence porosity in shales. Because of the more rigid behavior of quartz-supported rock framework compared with the relatively more ductile behavior of clay-supported matrix, the existing of early biogenetic quartz in samples from lower part of Longmaxi Formation Shales is more favorable for the preservation of the primary intergranular pores in compaction. Intergranular spaces between rigid quartz particles exhibit primarily triangular or polygonal shapes (Figures 4A,C). Their high aspect ratio confers rigid behavior. Therefore, the velocity of these specimens is often insensitive to the porosity. Samples from the upper Longmaxi Formation contain few intergranular pores due to extreme compaction and cementation. Intergranular pores persist between clay platelets or around edges of detrital quartz (Figure 4B). Their elongate, ellipsoid shapes are often aligned parallel to bedding. This type of porosity is associated with considerable velocity variation. Secondary pores, including intraparticle pores within framboids and other unstable phases (e.g., feldspar, clay and calcite) also impose considerable uncertainty in velocity interpretation.
Velocity anisotropy variation in shales primarily arises from alignment of clay particles established during mechanical and chemical compaction. The preferred orientation of clay minerals, described by the orientation distribution function, depends primarily on the degree of mechanical compaction (Aplin et al., 2006; DayStirrat et al., 2008). Samples from the lower Longmaxi Formation show greater rigidity due to early diagenetic cementation of biogenic quartz, which limited mechanical compaction. Hence, it is likely that early biogenetic quartz cementation may indeed contribute to a lowering of the velocity anisotropy by the preservation of a very early clay compaction state in these shale samples; similar observations were reported on the anhydrite-cemented lithologies of the Bongabinni Formation Shale studied by Piane et al., (2015). Samples from the upper Longmaxi Formation show extreme mechanical compaction and pervasive grain-scale clay alignment. These factors contribute to the stronger velocity anisotropy values observed for samples of the lower Longmaxi Formation. The influence of chemical compaction on the velocity anisotropy is very complex, and some counteracting effects on shale anisotropy are documented in both experiments and rock physics modeling results. Illitization of semectite has been suggested as critical diagenetic process to achieve a significant illite preferred orientation (Charpentier et al., 2003; DayStirrat et al., 2008). The precipitation of pore-filling micro-quartz from illitization of semectite may form stronger vertical binding between the clay particles resulting in the reduction of velocity anisotropy (Avseth et al., 2010). Clearly, the strong clay alignment observed in the samples from upper part of the Longmaxi Formation Shales suggests the possible contribution of the semectite-illitization transformation to the overall velocity anisotropy.
Considering the larger strain amplitude (10−2–10–3) of static measurements, geomechanical behaviors of individual shale samples appear to be mostly affected by the elastic response of grain-to-grain contacts as a consequence of the distributed stress concentration in the zone of relatively heterogeneous components. Stress-strain curves from samples from the upper Longmaxi Formation showed an apparent plastic yield deformation stage prior to failure with ductile properties. This indicates a clay-supported matrix with apparent mechanical interface between stiff extrabasinal quartz embedded in clay. Deformation occurred as microfractures between those interfaces at the microscale. Samples from the lower part of the Longmaxi Formation showed elastic deformation indicating a more brittle quartz-supported framework with limited mechanical interfaces. Deformation occurred as microfractures within contiguous micritic quartz. Previous studies suggest that water content, bedding orientation and deformational parameters such as pressure, temperature and strain rate influence shale stress-strain behavior (see for example Rybacki et al., 2015). This study focused primarily on the influence of diagenetic and microstructural factors on macroscopic seismic elastic and geomechanical behaviors.
Conclusion
This research performed laboratory measurements of acoustic and geomechanical properties along with detailed petrographic, geochemical analysis of 82 high-maturity shales from core samples of the Longmaxi Formation in the southeast Sichuan Basin, China. Interpretation of the data revealed how depositional history can influence acoustic and geomechanical properties.
The major achievement is the establishment of the link between depositional environment and the subsequent microtexture development, which finally exerts a critical influence on the reservoir quality and the physical properties of the shales. Specifically, we have shown that microtexture and compositional reorganization of Longmaxi Formation shale was affected by the syn-depositional chemical reactivity of the primary grain assemblage, notable the biogenic quartz grains. The lower part of the Longmaxi Formation formed in a deep water shelf environment where early cementation by biogenic quartz formed interlocking, contiguous quartz cement with limited mechanical interfaces. This biogenetic quartz cement thus assumed the role of a load bearing framework which effectively decreased subsequent mechanical compaction during burial. A very early clay fabrics and primary intergranular pores were effectively preserved. The upper part of the Longmaxi Formation formed in a shallow water shelf environment. Absent initial diagenetic cementation, clay minerals experienced normal compaction to form elongated ellipsoidal pores and a pervasively aligned clay fabric with apparent mechanic interface that played a load-bearing role. SEM-CL images, Si-Al relationships and trace element parameters such as Zr and Ti support the interpretation of a clay-supported framework for these samples.
The microstructural differences between the upper and lower Longmaxi shales exert a primary influence on their macroscopic acoustic and geomechanical behaviors. A “V” shaped trend in seismic velocities and static Young’s modulus plotted as function of quartz content for example clearly differentiates the elastic response of clay-supported and quartz-supported samples. The influence of porosity and TOC content on velocity is undeniable but velocity variation could be seen as a more direct result of the evolution of microstructure such as the load-bearing. Alignment of platy clay particles is the dominant factor in causing velocity anisotropy observed in Longmaxi Formation samples. Indeed, apparent velocity anisotropy discrepancy could be observed as a reflection of the different compaction during burial. Microtexture also exerts a strong influence on the deformation mode. Samples with quartz-supported matrix (from reprecipitation of biogenic quartz cement) exhibit typical elastic deformation and splitting failure modes. By contrast, samples with clay-supported microtexture show more plastic deformation caused by a heterogeneous medium with a mechanical interface between stiff minerals and the more ductile clay matrix. Overall, these results provide insights for the role of depositional and diagenetic controls on the microtexture and resulting rock properties of Wufeng-Longmaxi Formation Shales that could be applied positively to practical seismic-based “sweet-spots” prospecting of gas shale reservoir.
Data Availability Statement
The original contributions presented in the study are included in the article/Supplementary Material, further inquiries can be directed to the corresponding author.
Author Contributions
All authors listed have made a substantial, direct, and intellectual contribution to the work and approved it for publication.
Conflict of Interest
QZ and WG are employed by the company Petrochina.
The remaining authors declare that the research was conducted in the absence of any commercial or financial relationships that could be construed as a potential conflict of interest.
Acknowledgments
This work is sponsored by the Nation Natural Science Foundation of China Research (41774136, 41374135); the National Science and Technology Major Project (2017X05035004–004). We think Zhonghua Xu for providing the technical support on SEM-CL. The data used for building Figures 2,3,6–9,12 are given in Table S1 in the supporting information, those for Figure 13 are given in S2, and relevant imaging may be obtained by contacting the corresponding author (ZGVuZ2ppeGluQGNkdXQuY24=).
References
Ahmadov, R. S. (2011). Microtextural, elastic and transport properties of source rocks. Ph.D. dissertation. California: Stanford University.
Aplin, A. C., Matenaar, I. F., Mccarty, D. K., and van der Pluijm, B. A. (2006). Influence of mechanical compaction and clay mineral diagenesis on the microfabric and pore-scale properties of deep-water gulf of Mexico mudstones. Clays Clay Miner. 54 (4), 500–514. doi:10.1346/ccmn.2006.0540411
Avseth, P., Mukerji, T., Mavko, G., and Dvorkin, J. (2010). Rock-physics diagnostics of depositional texture, diagenetic alterations, and reservoir heterogeneity in high porosity siliciclastic sediments and rocks—a review of selected models and suggested work flows. Geophysics 75, 31–147. doi:10.1190/1.3483770
Breyer, J. A., Bunting, P. J., Monroe, R. M., and Steed, M. B. (2012). “Lithologic stratigraphic variation in a continuous shale-gas reservoir: the barnett shale (mississippian), fort worth basin, Texas,” in Shale reservoirs: giant resources for the 21st century. Editor J. A. Breyer (AAPG Memoir), 97, 368–381.
Carcione, J. M., and Avseth, P. (2015). Rock-physics templates for clay-rich source rocks. GEOPHYSICS 80 (5), D481–D500. doi:10.1190/geo2014-0510.1
Charpentier, D., Worden, R. H., Dillon, C. G., and Aplin, A. C. (2003). Fabric development and the smectite to illite transition in gulf ofmexico mudstones: an image analysis approach. J. Geochemical Exploration 78–79 (3), 459–463. doi:10.1016/s0375-6742(03)00073-6
Chen, L., Jiang, Z., Liu, K., Wang, P., Ji, W., Gao, F., et al. (2016). Effect of lithofacies on gas storage capacity of marine and continental shales in the Sichuan Basin, China. J. Nat. Gas Sci. Eng. 36, 773–785. doi:10.1016/j.jngse.2016.11.024
Chen, L., Lu, Y., Jiang, S., Li, J., Guo, T., and Luo, C. (2015). Heterogeneity of the lower silurian Longmaxi marine shale in the southeast Sichuan Basin of China. Mar. Pet. Geology. 65, 232–246. doi:10.1016/j.marpetgeo.2015.04.003
Chen, X., Fan, J., Melchin, M. J., and Mitchell, C. E. (2010). Hirnantian (latest ordovician) graptolites from the upper yangtze region, China. Palaeontology 48 (2), 235–280. doi:10.1111/j.1475-4983.2005.00453.x
Chen, X., Rong, J. S., Mitchell, C. E., Harper, D. A. T., Zhan, R. B., Zhang, Y. D., et al. (2000). Late Ordovician to earliest Silurian graptolite and brachiopod biozonation from the Yangtze region,South China, with a global correlation. Geol. Mag. 137 (6), 623–650. doi:10.1017/S0016756800004702
Curtis, J. B. (2002). Fractured shale-gas systems. AAPG Bull. 86 (9), 1921–1938. doi:10.1306/61EEDDBE-173E-11D7-8645000102C1865D
Day-Stirrat, R. J., Aplin, A. C., Środoń, J., and van der Pluijm, B. A. (2008). Diagenetic reorientation of phyllosilicate minerals in paleogene mudstones of the podhale basin, southern Poland. Clays Clay Miner. 56 (1), 100–111. doi:10.1346/ccmn.2008.0560109
Deng, J., Wang, S., and Han, D.-H. (2009). The velocity and attenuation anisotropy of shale at ultrasonic frequency. J. Geophys. Eng. 6 (3), 269–278. doi:10.1088/1742-2132/6/3/006
Dewhurst, D. N., Aplin, A. C., Sarda, J.-P., and Yang, Y. (1998). Compaction-driven evolution of porosity and permeability in natural mudstones: an experimental study. J. Geophys. Res. 103 (B1), 651–661. doi:10.1029/97jb02540
Dewhurst, D. N., and Siggins, A. F. (2006). Impact of fabric, microcracks and stress field on shale anisotropy. Geophys. J. Int. 165 (1), 135–148. doi:10.1111/j.1365-246x.2006.02834.x
Dewhurst, D. N., Siggins, A. F., Sarout, J., Raven, M. D., and Nordgårdbolås, H. M. (2011). Geomechanical and ultrasonic characterization of a norwegian sea shale. Geophysics 76 (76), WA101–WA111. doi:10.1190/1.3569599
Dong, T., Harris, N. B., Ayranci, K., and Yang, S. (2017). The impact of rock composition on geomechanical properties of a shale formation: middle and Upper Devonian Horn River Group shale, Northeast British Columbia, Canada. Bulletin 101 (2), 177–204. doi:10.1306/07251615199
Eliyahu, M., Emmanuel, S., Day-Stirrat, R. J., and Macaulay, C. I. (2015). Mechanical properties of organic matter in shales mapped at the nanometer scale. Mar. Pet. Geology. 59 (59), 294–304. doi:10.1016/j.marpetgeo.2014.09.007
Götze, J., Plötze, M., and Habermann, D. (2001). Origin, spectral characteristics and practical applications of the cathodoluminescence (CL) of quartz – a review. Mineralogy Petrology 71 (3–4), 225–250. doi:10.1007/s007100170040
Guo, Z., Deng, K., and Han, Y. (1996). The forming and evolution of Sichuan Basin. Beijing: Geological Publishing House.
Han, C., Jiang, Z., Han, M., Wu, M., and Lin, W. (2016). The lithofacies and reservoir characteristics of the upper ordovician and lower silurian black shale in the southern sichuan basin and its periphery, China. Mar. Pet. Geology. 75, 181–191. doi:10.1016/j.marpetgeo.2016.04.014
Han, D. h., Nur, A., and Morgan, D. (1986). Effects of porosity and clay content on wave velocities in sandstones. Geophysics 51 (11), 2093–2107. doi:10.1190/1.1442062
Hao, F., Guo, T., Zhu, Y., Cai, X., Zou, H., and Li, P. (2008). Evidence for multiple stages of oil cracking and thermochemical sulfate reduction in the Puguang Gas Field, Sichuan basin, China. AAPG Bulletin 92 (5), 611–637. doi:10.1306/01210807090
Hornby, B. E., Schwartz, L. M., and Hudson, J. A. (1994). Anisotropic effective‐medium modeling of the elastic properties of shales. Geophysics 59 (10), 1570–1583. doi:10.1190/1.1443546
Horsrud, P., SØnstebØ, E. F., and BØe, R. (1998). Mechanical and petrophysical properties of North Sea shales. Int. J. Rock Mech. Mining Sci. 35 (8), 1009–1020. doi:10.1016/s0148-9062(98)00162-4
Islam, M. A., and Skalle, P. (2013). An experimental investigation of shale mechanical properties through drained and undrained test mechanisms. Rock Mech. Rock Eng. 46 (6), 1391–1413. doi:10.1007/s00603-013-0377-8
Jarvie, D. M., Hill, R. J., Ruble, T. E., and Pollastro, R. M. (2007). Unconventional shale-gas systems: the Mississippian Barnett Shale of north-central Texas as one model for thermogenic shale-gas assessment. Bulletin 91 (4), 475–499. doi:10.1306/12190606068
Jia, C., Zheng, M., and Zhang, Y. (2012). Unconventional hydrocarbon resources in China and the prospect of exploration and development. Pet. Exploration Development 39 (2), 139–146. doi:10.1016/s1876-3804(12)60026-3
Jin, Z., Hu, Z., Gao, B., et al. (2016). Controlling factors on the enrichment and high productivity of shale gas in the Wufeng-Longmaxi Formations, southeastern Sichuan Basin. Earth Sci. Front. 23 (1), 1–10. doi:10.13745/j.esf.2016.01.001
Johansen, T. A., Ruud, B. D., and Jakobsen, M. (2004). Effect of grain scale alignment on seismic anisotropy and reflectivity of shales. Geophys. Prospecting 52, 133–149. doi:10.1046/j.1365-2478.2003.00405.x
Johnston, J. E., and Christensen, N. I. (1995). Seismic anisotropy of shales. J. Geophys. Res. 100 (B4), 5991–6003. doi:10.1029/95jb00031
Labani, M. M., and Rezaee, R. (2015). The importance of geochemical parameters and shale composition on rock mechanical properties of gas shale reservoirs: a case study from the Kockatea Shale and Carynginia Formation from the Perth Basin, Western Australia. Rock Mech. Rock Eng. 48 (3), 1249–1257. doi:10.1007/s00603-014-0617-6
Ma, Y., Feng, J., Mu, Z., Zhao, P., Bao, S., and Wang, F. (2012). The potential and exploring progress of unconventional hydrocarbon resources in sinopec. Eng. Sci. 14 (6), 22–30. doi:10.3969/j.issn.1009-1742.2012.06.004
Masri, M., Sibai, M., Shao, J. F., and Mainguy, M. (2014). Experimental investigation of the effect of temperature on the mechanical behavior of tournemire shale. Int. J. Rock Mech. Mining Sci. 70 (9), 185–191. doi:10.1016/j.ijrmms.2014.05.007
McGlade, C., Speirs, J., and Sorrell, S. (2013). Unconventional gas - a review of regional and global resource estimates. Energy 55, 571–584. doi:10.1016/j.energy.2013.01.048
Milliken, K. L., Esch, W. L., Reed, R. M., and Zhang, T. (2012). Grain assemblages and strong diagenetic overprinting in siliceous mudrocks, barnett shale (mississippian), fort worth basin, Texas. Bulletin 96 (8), 1553–1578. doi:10.1306/12011111129
Mondol, N. H., Jahren, J., Bjørlykke, K., and Brevik, I. (2008). Elastic properties of clay minerals. The Leading Edge 27 (6), 758–770. doi:10.1190/1.2944161
Moshier, S. O. (1989). Microporosity in micritic limestones: a review. Sediment. Geology. 63 (3), 191–213. doi:10.1016/0037-0738(89)90132-2
Nadeau, P. H., Peacor, D. R., Yan, J., and Hillier, S. (2002). I–S precipitation in pore space as the cause of geopressuring in Mesozoic mudstones, Egersund Basin, Norwegian continental shelf. Am. Mineral. 87 (11–12), 1580–1589. doi:10.2138/am-2002-11-1208
Nadeau, P. H., Wilson, M. J., Mchardy, W. J., and Tait, J. M. (1985). The conversion of smectite to illite during diagenesis: evidence from some illitic clays from bentonites and sandstones. Mineral. Mag. 49 (352), 393–400. doi:10.1180/minmag.1985.049.352.10
Niandou, H., Shao, J. F., Henry, J. P., and Fourmaintraux, D. (1997). Laboratory investigation of the mechanical behaviour of Tournemire shale. Int. J. Rock Mech. Mining Sci. 34 (1), 3–16. doi:10.1016/s1365-1609(97)80029-9
Peltonen, C., Marcussen, Ø., Bjørlykke, K., and Jahren, J. (2009). Clay mineral diagenesis and quartz cementation in mudstones: the effects of smectite to illite reaction on rock properties. Mar. Pet. Geology. 26 (6), 887–898. doi:10.1016/j.marpetgeo.2008.01.021
Piane, C., Almqvist, B. S. G., Macrae, C., Torpy, A., Mory, A. J., and Dewhurst, D. (2015). Texture and diagenesis of ordovician shale from the canning basin, western Australia: implications for elastic anisotropy and geomechanical properties. Mar. Pet. Geology. 59, 56–71. doi:10.1016/j.marpetgeo.2014.07.017
Pickett, G. R. (1963). Acoustic character logs and their applications in formation evaluation. J. Pet. Tech. 15 (6), 659–667. doi:10.2118/452-pa
Rickman, R., Mullen, M., and Erik Petrel, E., (2008). “A practical use of shale petrophysics for stimulation design optimization:All shale plays are not clones ofthe barnett shale,” in SPE Annual Technical Conference and Exhibition, Denver, Colorado, September 21, 2008.
Ross, D. J. K., Bustin, R. M., and Bustin, R. (2008). Characterizing the shale gas resource potential of Devonian-Mississippian strata in the Western Canada sedimentary basin: application of an integrated formation evaluation. Bulletin 92 (1), 87–125. doi:10.1306/09040707048
Rowe, H. D., Loucks, R. G., Ruppel, S. C., and Rimmer, S. M. (2008). Mississippian barnett formation, fort worth basin, Texas: bulk geochemical inferences and Mo-TOC constraints on the severity of hydrographic restriction. Chem. Geology. 257 (1–2), 16–25. doi:10.1016/j.chemgeo.2008.08.006
Rybacki, E., Reinicke, A., Meier, T., Makasi, M., and Dresen, G. (2015). What controls the mechanical properties of shale rocks? - Part I: strength and Young's modulus. J. Pet. Sci. Eng. 135, 702–722. doi:10.1016/j.petrol.2015.10.028
Sayers, C. M. (1994). The elastic anisotrophy of shales. J. Geophys. Res. 99 (B1), 767–774. doi:10.1029/93jb02579
Sayers, C. M., and van Munster, J. G. (1991). Microcrack-induced seismic anisotropy of sedimentary rocks. J. Geophys. Res. 96 (B10), 16529–16533. doi:10.1029/91jb01232
Sondergeld, C. H., Rai, C. S., Margesson, R. W., and Whidden, K. (2000). Ultrasonic measurement of anisotropy on the kimmeridge shale. New York: SEG.
Sone, H., and Zoback, M. D. (2013). Mechanical properties of shale-gas reservoir rocks - Part 1: static and dynamic elastic properties and anisotropy. Geophysics 78 (5), D381–D392. doi:10.1190/geo2013-0050.1
Steiger, R. P. (1982). Fundamentals and use of potassium/polymer drilling fluids to minimize drilling and completion problems associated with hydratable clays. J. Pet. Tech. 34 (8), 1661–1670. doi:10.2118/10100-pa
Su, W. B., Li, Z. M., Ettensohn, F. R., Johnson, M. E., Huff, D., Wang, W., et al. (2007). Distribution of black shale in the wufeng-longmaxi formations (ordovician- silurian), south China: major controlling factors and implications. Earth Sci. 32 (6), 819–827.
Thyberg, B., and Jahren, J. (2011). Quartz cementation in mudstones: sheet-like quartz cement from clay mineral reactions during burial. Pet. Geosci. 17 (1), 53–63. doi:10.1144/1354-079310-028
Vanorio, T., Mukerji, T., and Mavko, G. (2008). Emerging methodologies to characterize the rock physics properties of organic-rich shales. The Leading Edge 27 (6), 780–787. doi:10.1190/1.2944163
Vernik, L., and Landis, C. (1996). Elastic anisotropy of source rocks: implications for hydrocarbon generation and primary migration. AAPG Bull. 80, 531–544. doi:10.1190/1.1444461
Vernik, L., and Liu, X. (1997). Velocity anisotropy in shales: a petrophysical study. Geophysics 62 (2), 521–532. doi:10.1190/1.1444162
Vernik, L., and Milovac, J. (2011). Rock physics of organic shales. The Leading Edge 30 (3), 314–323. doi:10.1190/1.3567263
Vernik, L., and Nur, A. (1992). Ultrasonic velocity and anisotropy of hydrocarbon source rocks. Geophysics 57 (5), 727–735. doi:10.1190/1.1443286
Wang, S., Zou, N., Dong, H., Wang, M., Huang, L., and Guo, J. (2014). Biogenic silica of organic-rich shale in Sichuan Basin and its significance for shale gas. Acta Scientiarum Naturalium Universitatis Pekinensis 50 (3), 476–486. doi:10.13209/j.0479-8023.2014.079
Wang, T., Yang, K., Xiong, L., et al. (2015). Shale sequence stratigraphy of Wufeng-Longmaxi Formation in Southern Sichuan and their control on reservior. Acta Petrolei Sinica 36 (8), 915–925.
Wedepohl, K. H. (1971). Environmental influences on the chemical composition of shales and clays. Phys. Chem. Earth 8, 307–333. doi:10.1016/0079-1946(71)90020-6
Williams, L. A., Parks, G. A., and Crerar, D. A. (1985). Silica diagenesis, I. Solubility controls. J. Sediment. Petrology 55 (3), 301–311. doi:10.1306/212F86AC-2B24-11D7-8648000102C1865D
Wright, A. M., Spain, D., and Ratcliffe, K. T. (20102010). “Application of inorganic whole rock geochemistry to shale resource plays,” in Canadian unconventional resources and international petroleum conference (Calgary, Canada: SPE-137946-MS), 18. doi:10.2118/137946-MS
Yamamoto, K. (1987). Geochemical characteristics and depositional environments of cherts and associated rocks in the franciscan and shimanto terranes. Sediment. Geology. 52 (1), 65–108doi:10.1016/0037-0738(87)90017-0
Yau, Y. C., Peacor, D. R., and McDowell, S. D. (1987). Smectite-to-illite reactions in Salton Sea shales: a transmission and analytical electron microscopy study. J. Sediment. Petrology 57 (2), 335–342. doi:10.1306/212F8B20-2B24-11D7-8648000102C1865D
Keywords: microtexture properties, acoustic properties, geomechanical behaviors, longmaxi shale, diagenetic processes
Citation: Deng J, Wang C, Zhao Q, Guo W, Tang G and Zhao J (2021) Depositional and Diagenetic Controls on Macroscopic Acoustic and Geomechanical Behaviors in Wufeng-Longmaxi Formation Shale. Front. Earth Sci. 9:617831. doi: 10.3389/feart.2021.617831
Received: 03 November 2020; Accepted: 11 February 2021;
Published: 18 March 2021.
Edited by:
Erik H. Saenger, Bochum University of Applied Sciences, GermanyReviewed by:
Ya-juan Xue, Chengdu University of Information Technology, ChinaLuis Gago-Duport, University of Vigo, Spain
Copyright © 2021 Deng, Wang, Zhao, Guo, Tang and Zhao. This is an open-access article distributed under the terms of the Creative Commons Attribution License (CC BY). The use, distribution or reproduction in other forums is permitted, provided the original author(s) and the copyright owner(s) are credited and that the original publication in this journal is cited, in accordance with accepted academic practice. No use, distribution or reproduction is permitted which does not comply with these terms.
*Correspondence: Jixin Deng, ZGVuZ2ppeGluQGNkdXQuY24=; Chongyi Wang, Y2RsZ3JvY2twaHlzaWNzQGdtYWlsLmNvbQ==