 Xin He
 Jiali Luo
 Xiran Xu
 Lu Ren1
- 1Key Laboratory for Semi-Arid Climate Change of the Ministry of Education, College of Atmospheric Sciences, Lanzhou University, Lanzhou, Gansu, China
- 2Shandong Provincial Climate Center, Jinan, Shandong, China
- 3Xichang Satellite Launch Center, Xichang, Sichuan, China
Using the Microwave Limb Sounding measurements and the National Center for Environmental Prediction/National Center for Atmospheric Research (NCEP/NCAR) reanalysis product, we have investigated the response of carbon monoxide (CO) mixing ratio within the Asian Summer Monsoon Anticyclone (ASMA) region to the Quasi-Biennial Oscillation (QBO) and the potential dynamical mechanisms behind it. The results showed that the mixing ratio of CO within the ASMA is significantly higher at both 100 hPa and 147 hPa in the east phase of QBO (EQBO) years than in the west phase of QBO (WQBO) years, especially in the eastern part of the ASMA. The CO difference between EQBO and WQBO years is consistent with the interannual variation of the location and strength of the ASMA. Specifically, during the EQBO years, the area of the ASMA reduces to the southeast in the upper troposphere, while the westerly jet on the north side of the anticyclone and the southerly winds on the west side of the anticyclone both strengthen. These variations are associated with tropospheric circulation anomalies. The ascending motions over the Tibetan Plateau (TP) are enhanced during the EQBO years, which are correlated with the relatively high CO at 100 hPa. Consistently, an anomalous cyclonic circulation is found at 500 hPa over the TP when the QBO is on its east phase, which promotes the convergence of air mass and carries CO from the surface to the Upper Troposphere and Lower Stratosphere (UTLS).
Introduction
The Asian Summer Monsoon Anticyclone (ASMA) is the dominant circulation system in the northern hemisphere, which extends from Asia to the Middle East in boreal summer (June–September) (Mason and Anderson, 1963; Hokins and Rodwell, 1995; Randel et al., 2001; Randel and Park, 2006). Convective activities associated with the monsoon circulation mostly originate in the South Asian subcontinent, Southeast Asia, and the southern slope of Himalaya. Deep convection can transport air parcels and pollutants from the atmospheric boundary layer (ABL) to the tropopause layer covered by the ASMA (Hoskins and Rodwell, 1995; Highwood and Hoskins, 1998; Bergman et al., 2012; Fan et al., 2017). In the Upper Troposphere and Lower Stratosphere (UTLS) region, the ASMA behaves as a strong horizontal transport barrier, which consists of a westerly jet in the north and an easterly jet in the south (Dunkerton, 1995; Highwood and Hoskins, 1998; Randel and Park, 2006). In other words, the combination of the near-elliptical streamline and the low wind speed in the core (north of the Arabian Sea) of the ASMA region forms a strong restrictive circle, which prevents air mass in the interior of the ASMA with higher concentrations of pollutants from mixing with air mass outside the ASMA. As a result, relatively high concentrations of water vapor (Ronsenlof et al., 1997), methane, nitrogen oxides (Park et al., 2004), and carbon monoxide (CO) (Li et al., 2005) and relatively low concentrations of ozone (Randel et al., 2001) are trapped within the ASMA.
The ASMA shows an interannual variation in its location and intensity (Wei et al., 2012). During stronger monsoon years, the mixing ratio of tropospheric tracers within the ASMA typically increases as the ASMA region expands and the ascending motions to the east of 85°E are enhanced (Yuan et al., 2019). On the other hand, the ASMA structure is influenced by persistent convection (Hoskins and Rodwell, 1995). Convective activities commonly occur over the area of 60°–120° E and 15°–30° N and are closely related to spatial distributions of chemical compositions within the ASMA (Park et al., 2007). Previous studies have pointed out that the tropical deep convection can be modulated by upper-level circulations such as the stratosphere Quasi-Biennial Oscillation (QBO) (Collimore et al., 2003; Son et al., 2016; Lim et al., 2019).
The QBO is a significant interannual variability signal in the tropical stratosphere (Gray and Chipperfield, 1990; Baldwin et al., 2001; Tian et al., 2006; Tian et al., 2011). Some studies found that westerly (easterly) shear anomalies at 30 hPa can generate abnormal tropopause heights in the equatorial region (e.g., Plumb and Bell, 1982; Reid and Gage, 1985; Gray et al., 1992; Ribera et al., 2008; Shi et al., 2009) and the variations in the tropopause can subsequently affect the development of convective activities by changing the atmospheric static stability and convective available potential energy (CAPE) in the UTLS (Emanuel, 1994; Liu, 2014). The spatial distribution of deep convective motions is also significantly affected by the QBO (Gray et al., 1992; Liu, 2014). Moreover, the QBO affects the rate of air transportation across the tropopause from the upper troposphere to the lower stratosphere (Hamilton and Fan, 2000). It is found that air temperature (e.g., Reed, 1965) and chemical compositions (nitrogen oxides and methane (Hamilton and Fan, 2000)) in the troposphere are related to the stratospheric QBO signal. Thus, it is worth investigating the modulation of QBO on the spatial distributions of tropospheric tracers in the ASMA region.
CO is a primary pollutant from the surface, and CO emission has distinct seasonal and regional variations due to biomass burning processes and human activities (Park et al., 2009; Pan et al., 2016). CO has an insoluble gas composition with a long lifetime (∼2 months). For this reason, CO is often chosen as a tropospheric tracer in studying the chemical transport from the troposphere to the lower stratosphere (Park et al., 2007; Park et al., 2009; Pommrich et al., 2014; Yuan et al., 2019).
This study focused on the modulation of QBO on the distribution of CO in the UTLS during the Asian Summer Monsoon (ASM) season. The National Center for Environmental Prediction/National Center for Atmospheric Research (NCEP/NCAR) reanalysis product and the Microwave Limb Sounding (MLS) satellite observations of CO for the period of 2005–2017 are used. This article is organized as follows. First, we describe the responses of CO distribution and the ASMA structure to the QBO signal. Then, we explore the dynamical mechanisms of the QBO signal we described before.
Data and Methods
Microwave Limb Sounding Database
The MLS instrument onboard the Aura spacecraft, one of the NASA Earth Observing System (EOS) platforms, has been measuring atmospheric parameters since August 2004 (Waters et al., 2006). MLS data have been used to quantify the impact of chemical compositions on climate and study pollution in the upper troposphere (e.g., Park et al., 2007; Park et al., 2009; Pan et al., 2016; Ploeger et al., 2017; Luo et al., 2018). In this study, CO volume mixing ratio (mol/mol) from MLS Version 4.2 Level 2 retrievals is used to investigate its distribution anomalies in the ASMA region caused by the QBO. Linear interpolation was performed for MLS CO data to produce monthly average data from 80° S to 80° N. The gridded data have a resolution of 2.5° (latitude) × 2.5° (longitude).
National Center for Environmental Prediction/National Center for Atmospheric Research Reanalysis
Geopotential height (GPH, gpm), zonal wind (U, m/s), meridional wind (V, m/s), and vertical velocity (ω, Pa/s) for the period of 2005–2017 were extracted from the NCEP reanalysis monthly dataset and used in this study. The NCEP reanalysis product has a horizontal resolution of 2.5° (latitude) × 2.5° (longitude) and 17 layers in the vertical direction from 1000 hPa to 10 hPa. In order to study the relationship between CO in the ASMA region and QBO phases, the NCEP/NCAR reanalysis data are vertically interpolated to the MLS CO data levels (215, 147, 100, and 68.1 hPa).
Methods
Several methods have been proposed in previous studies to identify the phases of QBO. Liu et al. (2015) used 50–70 hPa wind shear anomaly as the QBO index, where the west (east) phase of QBO is defined when the wind shear anomaly is greater (less) than 1.5 (-1.5) m/(s ∙ 20 hPa). In the study by Liu et al. (2019), the QBO index was set to be 30 hPa mean zonal wind in the equatorial region (5° S−5° N), and the westerly (easterly) events of QBO were defined as greater (less) than 5 (−5) m/s. In the present study, the east phase of QBO is identified when the summer mean zonal wind speed anomaly is greater than 5 m/s at 30 hPa in the equatorial region (5° S−5° N). According to the above method, five west phase years (2006, 2008, 2013, 2015, and 2016) and six east phase years (2005, 2007, 2009, 2012, 2014, and 2017) are identified. We investigate CO distribution within the ASMA during different phases of the QBO. We also use composite analysis to explore the dynamical mechanism by analyzing the differences of U, V, ω, and GPH in the UTLS.
Results
The mean summertime (JJA) CO mixing ratio distributions at different levels in the UTLS for the period 2005–2017 are shown in Figure 1. Relatively high CO centers at individual levels are consistent with the location of the ASMA. Note that selected GPHs (black contours) are often used to represent the position of the ASMA (Randel et al., 2001; Randel and Park, 2006; Pan et al., 2016). CO distribution at 215 hPa (Figure 1D) is different from that at upper levels. Specifically, the center of a relatively high CO mixing ratio at 215 hPa is located at the eastern part of the anticyclone (southern slope of Himalaya and South East Asia).
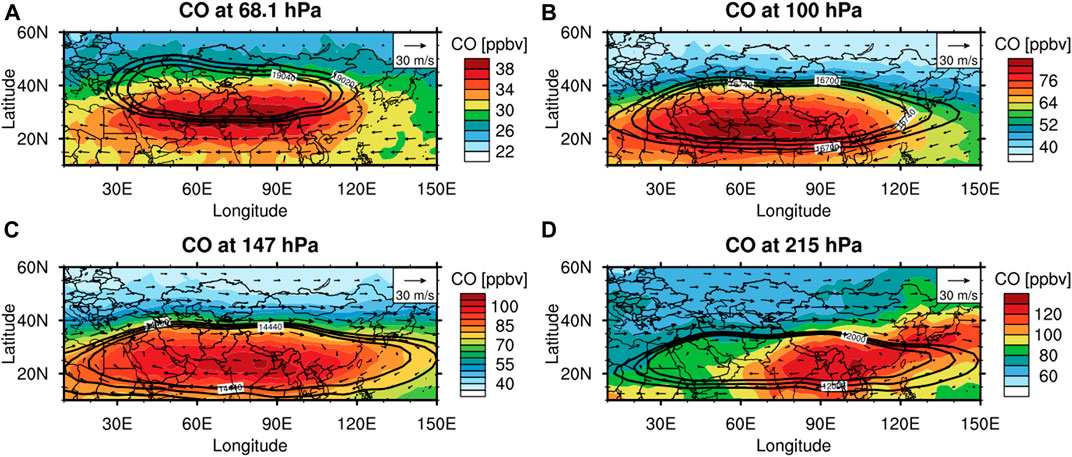
FIGURE 1. June–August (JJA) mean of 2005–2017 CO mixing ratio (color shadings, units: ppbv) at (A) 68.1, (B) 100, (C) 147, and (D) 215 hPa from MLS and horizontal winds (vectors, units: m/s) from the NCEP/NCAR reanalysis. Black contours represent GPH from NCAR/NCEP reanalysis: (A) 19,020, 19,030, and 19,040 gpm; (B) 16,700, 16,720, and 16,740 gpm; (C) 14,400, 14,420, and 14,440 gpm; and (D) 11,990, 12,000, and 12,010 gpm.
Previous studies have indicated that the QBO modulates the interannual variations of long-lived tropospheric tracers by influencing the stratosphere-troposphere exchange and convection in the tropics (Reed, 1965; Plumb and Bell, 1982; Hamilton and Fan, 2000). The mean summertime CO mixing ratio difference between the EQBO years and the WQBO years is further studied (Figure 2). It is found that there exist positive CO anomalies (∼2 ppbv) at 68.1 hPa (Figure 2A) over the area of 15°–35° N, 30°–150° E, which indicates that relatively high CO can be found within the ASMA when the QBO is on the east phase. Although it is not significant at 68 hPa, there are significant areas at 100 and 147 hPa. In Figure 2B, enhanced CO in the southeast of the ASMA is found during the EQBO years at 100 hPa. The CO mixing ratio is about 6 ppbv higher during the EQBO years, located over the region of 70°–120° E, 20°–30° N (“significant area,” denoted by the box shown in Figure 2B). Compared with the climatology mean CO mixing ratio of 72 ppbv in the “significant area,” it is estimated that the QBO phases can cause a 7% difference in CO distribution at 100 hPa within the ASMA. When it comes to 147 hPa, as shown in Figure 2C, CO is about 5 ppbv higher in the EQBO years than that in WQBO years, and the significant area is smaller than that at 100 hPa (Figure 2B). In Figure 2D, the CO differences at 215 hPa are different from that in upper levels, and there is no significant boundary between positive and negative anomalies of CO mixing ratio inside and outside the anticyclone. As the restrict effect of the ASMA is the strongest in the UTLS region, we focus on the “ significant area” at 100 hPa to further investigate the relationship between the QBO and dynamical fields of the ASMA.
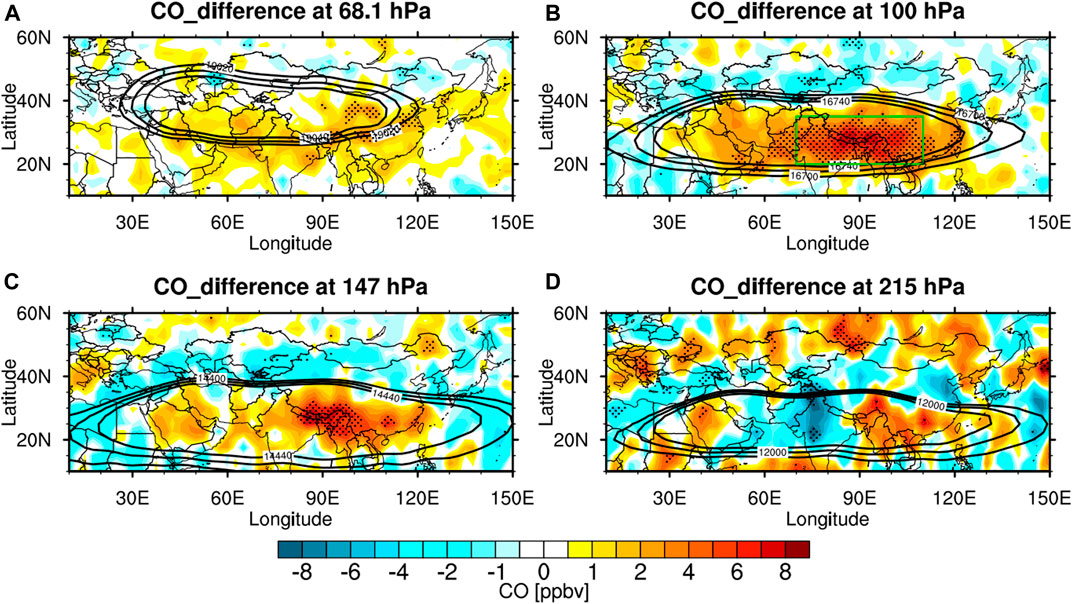
FIGURE 2. Differences in JJA mean CO (color shadings) distribution between EQBO years and WQBO years at (A) 68.1, (B) 100, (C) 147, and (D) 215 hPa. Black contours are the same as those in Figure 1. The dotted regions are for values statistically significant at the 95% confidence level determined by Student’s t-test. The green box in Figure 2B is over 70°–110° E, 20°–35° N (hereafter, named “significant area”).
The dynamical field anomalies between the EQBO and WQBO years have been investigated to determine whether the QBO modulates CO distribution by altering the structure of the ASMA. According to the previous studies on ASMA, different GPH values are selected at the four layers shown in Figure 3 to denote the spatial structure of anticyclone (Randel and Park, 2006; Park et al., 2007; Bergman et al., 2013; Pan et al., 2016; Yuan et al., 2019). There is a significantly low GPH band (with 40 gpm lower) located at 40°–55° N from 68.1 to 215 hPa, which is just on the northern side of the ASMA. By comparing the differences between the locations of ASMA during different QBO phases in Figures 3A−C (the locations of the ASMA are represented by red contours for WQBO and green contours for EQBO), it is evident that the ASMA extends further north and west during the WQBO years. That is to say that the anomalous GPH in the UTLS and the shifts of the ASMA position under different QBO phases are consistent: the edge of the ASMA extends northward and reaches 40°–55° N, where the GPH values increase during the WQBO years.
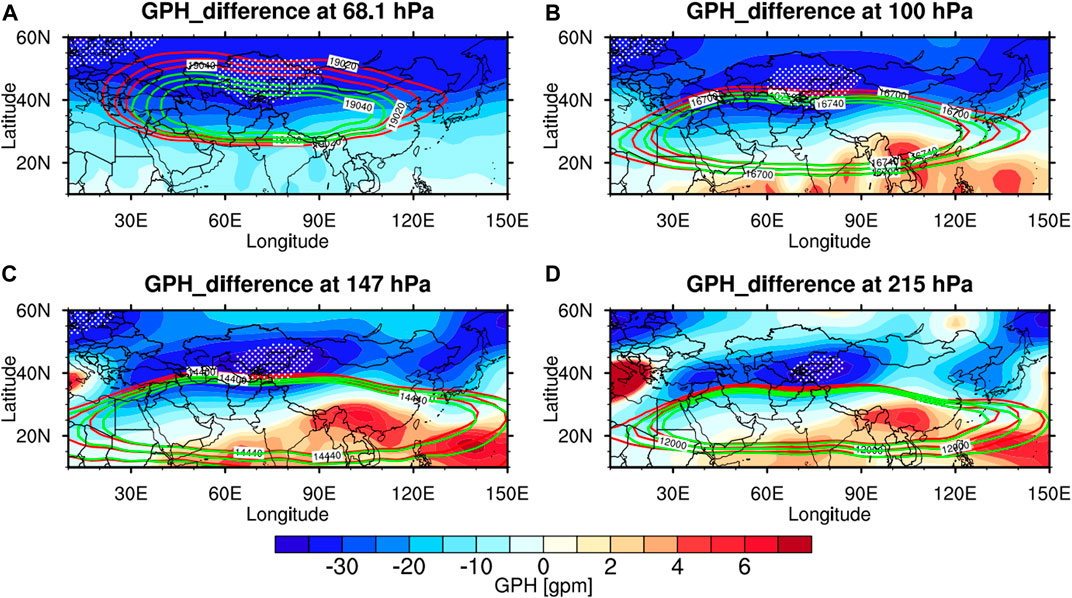
FIGURE 3. Same as Figure 2, but for GPH anomalies (units: gpm) between EQBO and WQBO years. Red (green) contours denote the location of the ASMA represented by GPH during WQBO (EQBO) years. The dotted regions are for values statistically significant at the 95% confidence level determined by Student’s t-test.
The edge of the ASMA is also defined as the jet core (e.g., Randel and Park, 2006, see Figure 1). It should be noted that the westerly jet is strongest at 147 hPa and 215 hPa (35°–45° N) according to the averaged zonal wind distribution for the period of 2005–2017 (figure not shown). Figure 4 shows the zonal wind differences between the EQBO and WQBO years. During the EQBO years, there are significant positive anomalies with the magnitude of 4 m/s in the area of 30°–40° N within the ASMA at 147 hPa and 215 hPa (Figures 4C,D). This indicates that the southern part of the westerly jet core increases during EQBO years. Additionally, negative anomalies are found over the area of 40°–50° N at lower layers (Figures 4C,D), indicating that the westerly jet at the northern edge of the ASMA decreases when the QBO is on the east phase. The increase of the westerly jet on the southern side and its decrease on the north side indicate that the midlatitude westerly jet moves southward during EQBO years. The significant southward movement of the westerly jet but small differences in the easterly jet may reduce the area of the ASMA and strengthen its confinement of CO inside. This would induce the increase of CO mixing ratio within the ASMA during EQBO years, as shown in Figure 2.
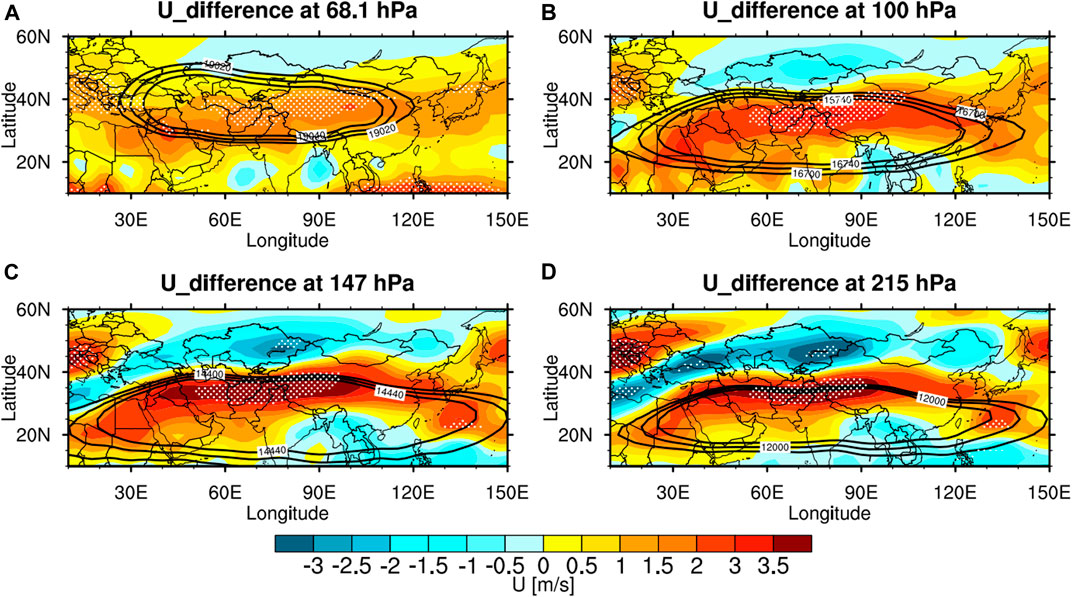
FIGURE 4. Same as Figure 2, but for zonal wind differences (units: m/s) between EQBO and WQBO years. The dotted regions are for values statistically significant at the 95% confidence level determined by the Student’s t-test.
Meridional wind is also important for the formation of anticyclonic circulation during the boreal ASM season. The climatological meridional wind shows that the east part of ASMA (10°–40° E) is dominated by the northerly wind and the west part of ASMA (90°–120° E) is dominated by the southerly wind (figures are not shown). The center of southerly wind is located at about 20°–30° E, 20°–40° N (defined as the northwest edge of the ASMA in the following study). Figure 5 presents meridional wind differences between the EQBO and WQBO years. Slightly negative anomalies can be found at about 10°–30° E, 25°–45° N, denoted by red boxes in Figures 5B–D, suggesting that the northwest part of the southerly wind center is relatively weak during the EQBO years. At lower layers (100 hPa, 147 hPa, and 215 hPa) shown in Figures 5B–D, positive anomalies occur in the area of 30°–50° E, 20°–30° N (denoted by blue boxes), which means the southerly winds inside the western ASMA are intensified during the EQBO years.
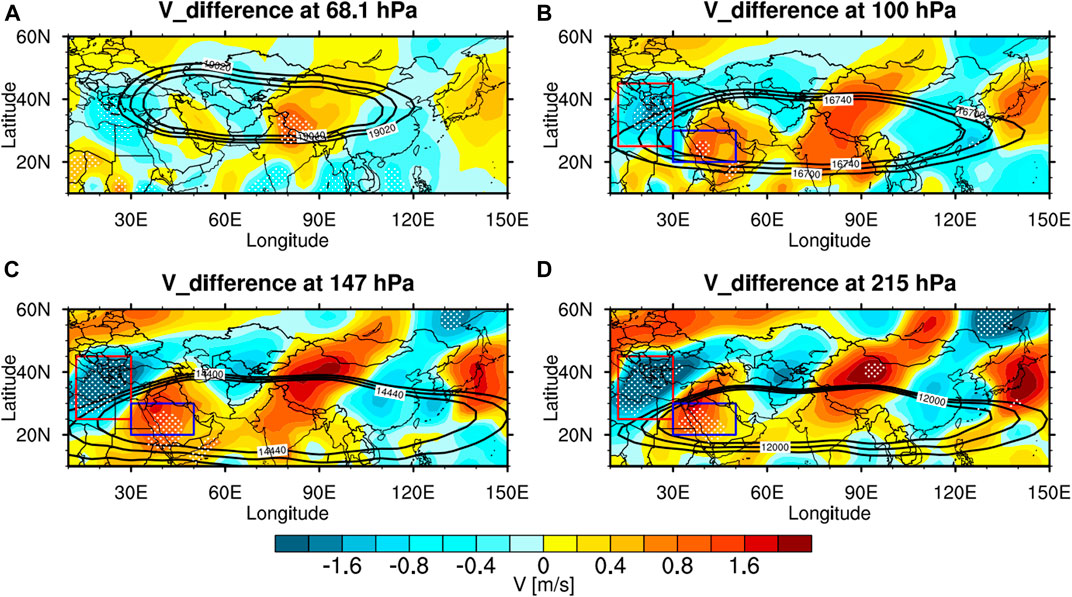
FIGURE 5. Same as Figure 4, except that color shading represents meridional wind differences (units: m/s) between EQBO and WQBO years. Yellow (green) boxes show the area of negative (positive) anomalies of meridional wind.
As is known, the ASMA acts as a horizontal transport barrier for tracers, but it is highly variable in shape and location (Vogel et al., 2015). The dynamical variability of the ASMA has been reported to be a significant driver for the distribution of UTLS CO (Pan et al., 2016). According to the spatial distributions of differences in GPH, U, and V, it is evident that, during the WQBO years, the ASMA expands northward and westward in the UTLS region. The trapping effect of the ASMA, which is related to the zonal and meridional winds, may be weaker during the WQBO period and the CO mixing ratio within the ASMA may be spread to a larger region in the UTLS. Consequently, the anomalous dynamical fields are consistent with the CO mixing ratio anomalies, as shown in Figure 2.
Previous studies have suggested that upward activities in the tropics are associated with relatively high chemical concentrations within the ASMA region (Park et al., 2007). The enhanced pollution within the ASMA is linked to rapid deep convection from Asia, India, and Indonesia (e.g., Park et al., 2009; Wright et al., 2011; Bergman et al., 2013; Vogel et al., 2015). Due to the potential response of the ASMA to the QBO discussed above, we further explore the mechanisms behind the modulation based on analysis of the vertical velocity (shown by ω). The climatological mean summertime vertical velocity from 2005 to 2017 is shown in the left panels (Figures 6A,C,E) and the differences in JJA mean vertical velocity between the EQBO years and the WQBO years are shown in the right panels (Figures 6B,D,F). It is shown that the eastern part of the ASMA region is dominated by ascending motion (red area) from 100 to 500 hPa (Figures 6A,C,E). This is consistent with the pathway of CO transport from surface to the ASMA region described previously (Pan et al., 2016; Luo et al., 2018). The vertical velocity differences indicate that there are no evident vertical velocity anomalies in the eastern edge of anticyclone at 100 and 200 hPa during the EQBO years, whereas significant ascending motion anomalies can be found at 500 hPa (Figure 6F) over the Tibetan Plateau (TP) (90°–110° E, 30°–40° N) (Figures 6B,D,F). Previous studies have pointed out that there are deep convective activities over the TP, which makes it an important channel for tropospheric chemicals to enter the UTLS (e.g., Bergman et al., 2013; Pan et al., 2016; Luo et al., 2018; Bian et al., 2020). Surface CO can be vertically transported to the height of 200 hPa and then slowly lifted to 100 hPa by large-scale motions within the anticyclone (e.g., Park et al., 2009).
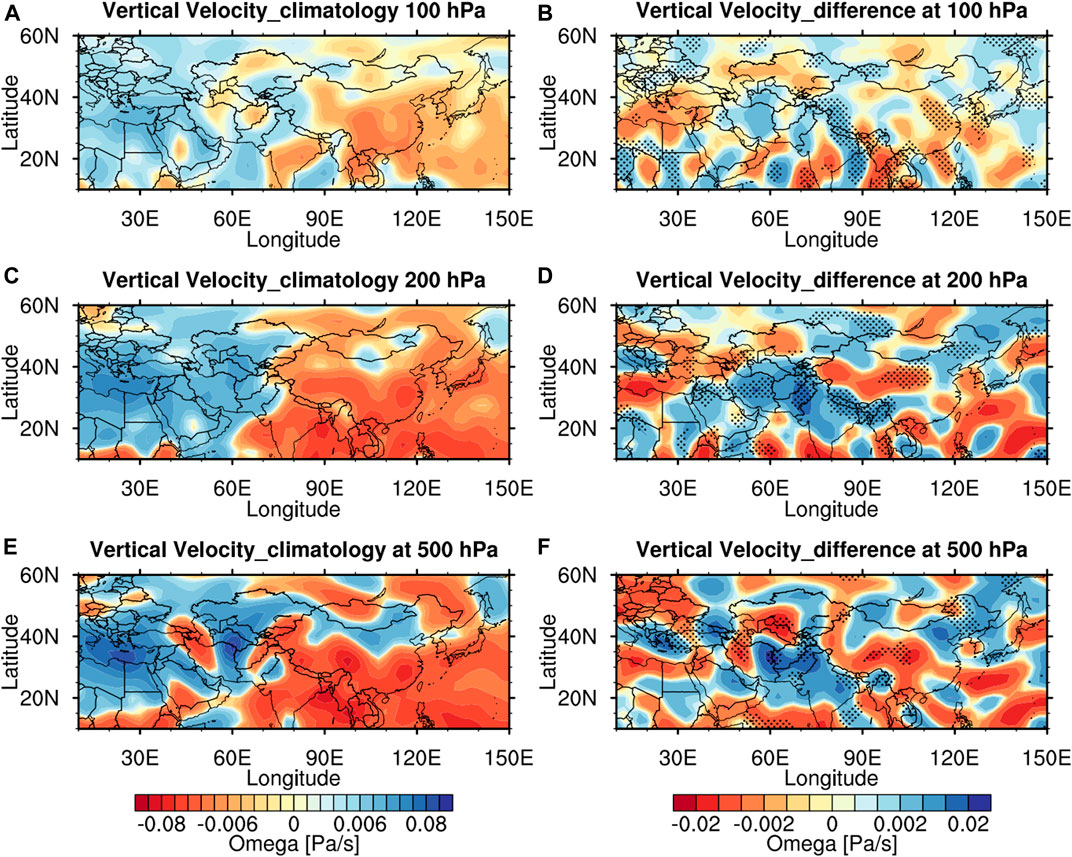
FIGURE 6. Average vertical velocity of JJA for the period from 2005 to 2017 at (A) 100 hPa, (C) 200 hPa, and (E) 500 hPa (units: Pa/s, color shading). The distribution of the difference in JJA mean vertical velocity (color shading) between EQBO years and WQBO years at (B) 100 hPa, (D) 200 hPa, and (F) 500 hPa. The selected levels of GPH are shown in Figure 6(A)−(D) (16,720 gpm at 100 hPa and 12,490 gpm at 200 hPa, black contours). The dotted regions represent the statistically significant values at the 95% confidence level determined by Student’s t-test.
The correlation coefficient in Figure 7 of the vertical velocity at each grid point and the average CO at 100 hPa in 70°–110° E, 20°–35° N is calculated to determine whether the upward motions over the TP at 500 hPa (Figure 6) could affect the CO distribution differences in the “significant area” in the UTLS during different QBO phases. As shown in Figure 7, a significant negative correlation appears over the TP (90°–105° E, 30°–40° N) at 500 hPa, suggesting that anomalous ascending motions here are related to CO mixing ratio in the “significant area” at 100 hPa. The location of the negative correlation region is almost the same as that of the anomalous ascending motion region at 500 hPa during the EQBO years (Figure 6F). Therefore, it can be inferred that the abnormal upward motions over the TP at 500 hPa during EQBO years can lead to an increase in CO in the “significant area” at 100 hPa.
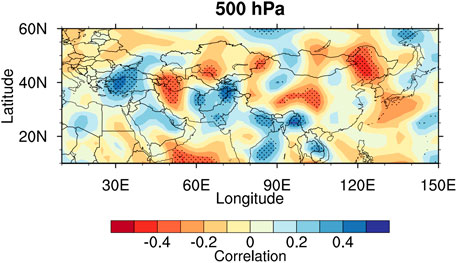
FIGURE 7. Correlation coefficients of the average vertical velocity of JJA for the period of 2005–2017 with average 100 hPa CO over 70°–110° E, 20°–35° N (color shadings) at 500 hPa. The dotted regions represent the statistically significant values at the 95% confidence level determined by Student’s t-test.
Differences of meridional mean vertical velocity over 80°–100° E are shown in Figure 8 to identify the discrepancy of vertical motions between different QBO phases. A continuous significant negative correlation appears in 30°–40° N from 500 to 200 hPa, which means more upward movements occur during the EQBO years. Note that this area is near the TP surface at 500 hPa. As we mentioned before, the TP is an important channel for tropospheric chemicals to enter the UTLS (e.g., Luo et al., 2018), and the anomalous upward movements shown in Figure 8 are conducive to the transportation of CO from the surface to the UTLS within the ASMA when the QBO is on its east phase.
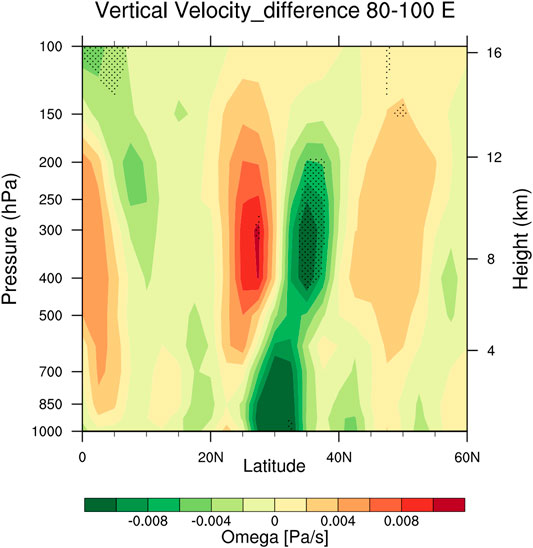
FIGURE 8. Differences in JJA meridional mean (80°–100° E) vertical velocity (color shading) between the EQBO years and the WQBO years. The dotted regions represent the statistically significant values at the 95% confidence level determined by Student’s t-test.
The horizontal wind field anomalies at 200 and 500 hPa over the TP are shown in Figure 9 to investigate how the stronger upward motions are generated during the EQBO years. It is evident that there is an anomalous cyclonic circulation over the area of 80°–110° E, 30°–40° N at 500 hPa (Figure 9C) and anomalous anticyclonic circulation over the area of 80°–110° E, 20°–30° N at 200 hPa (Figure 9A) when the QBO is on its east phase. The circulation anomaly can promote the convergence of the air mass at 500 hPa and the divergence at 200 hPa. The convergence at the lower layer and divergence at the higher layer are beneficial for the occurrence of ascending motions. It means that stronger ascending motions could occur over the TP during EQBO years, which transport CO from the surface to upper levels, and the transported CO accumulates on the eastern side of the anticyclone. On the contrary, during WQBO years, anomalous anticyclonic circulation can be found at the lower layer (Figure 9D) and anomalous cyclonic circulation occurs at the upper layer (Figure 9B), which may weaken the jet. Such a configuration of circulation pattern may induce anomalous descending movements over the TP when the QBO is on its west phase. This result is consistent with the vertical velocity distribution and correlations between CO and vertical velocity seen in Figures 6, 7. As the vertical upward motions at 500 hPa over the TP shown in Figure 7D are strengthened during EQBO years, a significant correlation between CO in the UTLS region and vertical ascending motions can be found, as shown in Figure 7D. Thus, it is inferred that the increase in vertical upward motions over the TP at 500 hPa is correlated with the anomalously increased distribution of CO in the UTLS region during EQBO, as shown in Figure 2.
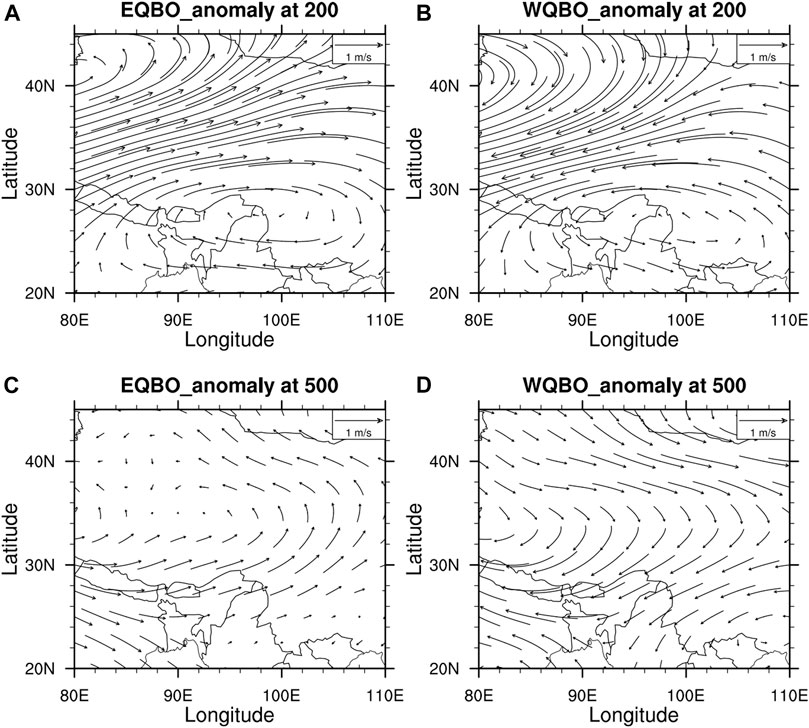
FIGURE 9. JJA mean U and V anomalies (vectors, units: m/s) over the TP at 200 hPa during (A) EQBO years and (B) WQBO years and at 500 hPa during (C) EQBO years and (D) WQBO years.
Conclusion
We have used the MLS measurement combined with NCEP monthly mean data to analyze the modulation of the QBO to CO distribution within the ASMA region and the potential dynamical mechanisms based on the composite analysis.
This is the first study focusing on whether there is a modulation of QBO on CO distribution at the UTLS region within the ASMA. As the features of ASMA, CO, and GPH within the approximately closed flow are relatively high (e.g., Randel and Park, 2006, see Figure 1). The differences of CO in the UTLS between different QBO years are significant in the area of 70°–110° E, 20°–35° N. Specifically, the CO mixing ratio within the east part of the ASMA is higher during the EQBO years at 100 and 147 hPa. On these levels, the large-scale circulation could redistribute CO within the ASMA (e.g., Pan et al., 2016). In this study, we found that the area of the ASMA reduces to the southeast and the westerly jet (35°–45° N) intensifies on the side close to the ASMA and weakens on the side away from it. A similar variation can be found for the southerly winds (90°–120° E). In this condition, the westerly jet (southerly winds) on the north (west) side of the ASMA shifts southward (eastward) when the QBO is on its east phase. The smaller anticyclone combined with stronger horizontal circulation contributes to an enhanced ASMA trapping effect on CO in the UTLS region. Consequently, CO mixing ratio is relatively high because of the stronger ASMA trapping effect in the “significant area” during the EQBO years. In contrast, the easterly jet (northerly winds) on the south (east) side of the ASMA does not show a similar signal. In addition, vertical upward transportation plays an important role in the CO distribution in the UTLS. There are stronger upward motions over the TP, making it an important channel in the ASMA for tropospheric chemicals to enter the UTLS (e.g., Pan et al., 2016; Luo et al., 2018). Stronger ascending movements can be found when the QBO is on its east phase. These anomalous ascending motions are found to be related to a cyclonic circulation at 500 hPa and an anticyclonic circulation at 200 hPa over the TP during EQBO years. With this configuration, the anomalously ascending movements occur from the surface to 200 hPa because of the convergence and divergence at the lower and upper layers, respectively. Moreover, the anomalous ascending movements over the TP at 500 hPa are confirmed to be related to the anomalous distribution of CO at 100 hPa in the “significant area” during the EQBO years. An opposite configuration in the lower and upper layers and anomalous descending movements can be found during the WQBO years, which may weaken the jet and transport less CO into the ASMA in the UTLS.
In this study, the MLS CO data we used are limited to a short timespan. In future work, we will use multiple datasets combined with numerical model simulations to investigate further the relationship between QBO and CO distribution in the UTLS and explore the dynamical mechanism behind it.
Data Availability Statement
The original contributions presented in the study are included in the article/Supplementary Material; further inquiries can be directed to the corresponding author.
Conflict of Interest
The authors declare that the research was conducted in the absence of any commercial or financial relationships that could be construed as a potential conflict of interest.
Author Contributions
JL and XH were responsible for conceptualization; JL and XH were responsible for methodology; JL contributed to validation; XH conducted the formal analysis; XH and XX conducted the investigation; XH and XX were responsible for data management; XH and JL wrote and prepared the original draft; XH, LR, and HT reviewed and edited the manuscript; LS and PX were responsible for supervision.
Funding
This research was sponsored by the Strategic Priority Research Program of the Chinese Academy of Sciences under Grant no. XDA17010106 and National Natural Science Foundation of China (41705025 and 41705021).
Acknowledgments
We acknowledge the datasets from AURA/MLS (https://disc.gsfc.nasa.gov/datasets/ML2H2O_004/summary) and NCEP/NCAR (https://psl.noaa.gov/data/gridded/reanalysis/).
References
Baldwin, M. P., Gray, L. J., Dunkerton, T. J., Hamilton, K., Haynes, P. H., Randel, W. J., et al. (2001). The quasi-biennial oscillation. Rev. Geophys. 39 (2), 179–229. doi:10.1029/1999RG000073
Bergman, J. W., Fierli, F., Jensen, E. J., Honomichl, S., and Pan, L. L. (2013). Boundary layer sources for the Asian anticyclone: regional contributions to a vertical conduit. J. Geophys. Res. Atmospheres 118 (6), 2560–2575. doi:10.1002/jgrd.50142
Bergman, J. W., Jensen, E. J., Pfister, L., and Yang, Q. (2012). Seasonal differences of vertical-transport efficiency in the tropical tropopause layer: on the interplay between tropical deep convection, large-scale vertical ascent, and horizontal circulations. J. Geophys. Res. 117 (D5), D05302. doi:10.1029/2011JD016992
Bian, J. C., Li, D., Bai, Z. X., Li, Q., Lyu, D. R., and Zhou, X. J. (2020). Transport of Asian surface pollutants to the global stratosphere from the Tibetan Plateau region during the Asian summer monsoon. Natl. Sci. Rev. 7 (3), 516–533. doi:10.1093/nsr/nwaa005
Collimore, C. C., Martin, D. W., Hitchman, M. H., Huesmann, A., and Waliser, D. E. (2003). On the relationship between the qbo and tropical deep convection. J. Clim. 16 (15), 2552–2568. doi:10.1175/1520-0442(2003)016<2552:OTRBTQ>2.0.CO;2
Dunkerton, T. J. (1995). Evidence of meridional motion in the summer lower stratosphere adjacent to monsoon regions. J. Geophys. Res. 100 (16), 675–688. doi:10.1029/95JD01263
Fan, Q. J., Bian, J. C., and Pan, L. L. (2017). Atmospheric boundary layer sources for upper tropospheric air over the Asian summer monsoon region. Atmos. Oceanic Sci. Lett. 10 (5), 358–363. doi:10.1080/16742834.2017.1344089
Gray, L. J., and Chipperfield, M. P. (1990). On the interannual variability of trace gases in the middle atmosphere. Geophys. Res. Lett. 17 (7), 933–936. doi:10.1029/GL017i007p00933
Gray, W. M., Sheaffer, J. D., and Knaff, J. A. (1992). Influence of the stratospheric QBO on ENSO variability. J. Meteorol. Soc. Jpn. 70 (5), 975–994. doi:10.2151/jmsj1965.70.5_975
Hamilton, K., and Fan, S. M. (2000). Effects of the stratospheric quasi-biennial oscillation on long-lived greenhouse gases in the troposphere. J. Geophys. Res. Atmospheres 105 (D16), 20581–20587. doi:10.1029/2000JD900331
Highwood, E. J., and Hoskins, B. J. (1998). The tropical tropopause. Q. J. R. Meteorol. Soc. 124 (549). doi:10.1002/qj.49712454911
Hokins, B. J., and Rodwell, M. J. (1995). A model of the Asian summer Monsoon. Part I: the Global Scale. J. Atmos. Sci. 52, 1329–1340. doi:10.1175/1520-0469(1995)052<1329:AMOTAS>2.0.CO;2
Li, Q., Jiang, J. H., Wu, D. L., Read, W. G., Livesey, N. J., Waters, J. W., et al. (2005). Convective outflow of South Asian pollution: a global CTM simulation compared with EOS MLS observations. Geophys. Res. Lett. 32, L14826. doi:10.1029/2005GL022762
Lim, Y., Son, S. W., Marshall, A. G., Hendon, H. H., and Seo, K. H. (2019). Influence of the QBO on MJO prediction skill in the subseasonal-to-seasonal prediction models. Clim. Dyn. 53, 1681–1695. doi:10.1007/s00382-019-04719-y
Liu, C. W., Rao, J., Wu, Z. W., Hu, J. H., Ma, X. H., Liu, Y. W., et al. (2019). Linkage between ENSO and China summer rainfall modulation by QBO. J. Trop. Meteorology 35 (1), 210–223. doi:10.16032/j.issn.1004-4965.2019.01.001
Liu, W. (2014). Effects of quasi-biennial oscillation on tropical stratosphere troposphere exchange. Lanzhou, China: University of Lanzhou.
Liu, W., Tian, W. S., Shu, J. C., Zhang, J. K., and Hu, D. Z. (2015). Effects of quasi-biennual oscillation on tropical tropopause and deep convective activities. Adv. Earth Sci. 30 (6), 724–736.
Luo, J. L., Pan, L. L., Honomichl, S. B., Bergman, J. W., Randel, W. J., Francis, G., et al. (2018). Space-time variability in UTLS chemical distribution in the Asian summer monsoon viewed by limb and nadir satellite sensors. Atmos. Chem. Phys. 18 (16), 12511–12530. doi:10.5194/acp-18-12511-2018
Mason, R. B., and Anderson, C. E. (1963). The development and decay of the 100-mb. Summertime anticyclone over southern Asia. Monthly Weather Rev. 91, 3–12. doi:10.1175/1520-0493(1963)091<0003:TDADOT>2.3.CO;2
Pan, L. L., Honomichl, S. B., Kinnison, D. E., Abalos, M., Randel, W. J., Bergman, J. W., et al. (2016). Transport of chemical tracers from the boundary layer to stratosphere associated with the dynamics of the Asian summer monsoon. J. Geophys. Res. Atmospheres 121, 14159–14174. doi:10.1002/2016JD025616
Park, M., Randel, W. J., Emmons, L. K., and Livesey, N. J. (2009). Transport pathways of carbon monoxide in the Asian summer monsoon diagnosed from model of ozone and related tracers (mozart). J. Geophys. Res. Atmospheres 114 (D8), D08303. doi:10.1029/2008JD010621
Park, M., Randel, W. J., Gettelman, A., Massie, S. T., and Jiang, J. H. (2007). Transport above the Asian summer monsoon anticyclone inferred from aura microwave limb sounder tracers. J. Geophys. Res. Atmospheres 112 (D16), 309. doi:10.1029/2006JD008294
Park, M., Randel, W. J., Kinnison, D. E., Garcia, R. R., and Choi, W. (2004). Seasonal variation of methane, water vapor, and nitrogen ocides near the tropopause: satellite observations and model simulations. J. Geophys. Res. 109, D03302. doi:10.1029/2003JD003706
Ploeger, F., Konopka, P., Walker, K., and Riese, M. (2017). Quantifying pollution reansport feom the Asian monsoon anticyclone into the lower stratosphere. Atmos. Chem. Phys. 17, 7055–7066. doi:10.5194/acp-17-7055-201710.5194/acp-17-7055-2017-supplement
Plumb, R. A., and Bell, R. C. (1982). A model of the quasi-biennial oscillation on an equatorial beta-plane. Q. J. R. Meteorol. Soc. 108 (456), 335–352. doi:10.1002/qj.49710845604
Pommrich, R., Müller, R., Grooss, J. U., Konopka, P., Ploeger, F., Vogel, B., et al. (2014). Tropical troposphere to stratosphere transport of carbon monoxide and long-lived trace species in the chemical Lagrangian model of the stratosphere (CLaMS). Geoscientific Model. Development 7 (6), 2895–2916. doi:10.5194/gmd-7-2895-2014
Randel, W. J., and Park, M. (2006). Deep convective influence on the Asian summer monsoon anticyclone and associated tracer variability observed with Atmospheric Infrared Sounder (AIRS). J. Geophys. Res. Atmospheres 111 (D12), 314. doi:10.1029/2005JD006490
Randel, W. J., Wu, F., Gettelman, A., Russel, J., Zawodny, J., and Oltmans, S. (2001). Seasonal variation of water vapor in the lower stratosphere observed in Halogen Occultation Experiment data. J. Geophys. Res. 106, D13. doi:10.1029/2001JD900048
Reed, R. J. (1965). The present status of the 26-month oscillation. Bull. Am. Meteorol. Soc. 46 (7), 374–387. doi:10.1175/1520-0477-46.7.374
Reid, G. C., and Gage, K. S. (1985). Interannual variations in the height of the tropical tropopause. J. Geophys. Res. Atmospheres 90 (D3), 5629–5635. doi:10.1029/JD090iD03p05629
Ribera, P., Peña-Ortiz, C., Anel, J. A., Gimeno, L., de la Torre, L., and Gallego, D. (2008). Quasi-biennial modulation of the northern hemisphere tropopause height and temperature. J. Geophys. Research-Atmospheres 113, D00B02. doi:10.1029/2007JD009765
Rosenlof, K. H., Tuck, A. F., Kelly, K. K., Russell, J. M., and Mccormick, M. P. (1997). Hemispheric asymmetries in water vapor and inferences about transport in the lower stratosphere. J. Geophys. Res. Atmospheres 102 (11D), 13213–13234. doi:10.1029/97JD00873
Shi, C. H., Zheng, B., Chen, Y. J., and Bi, Y. (2009). The quasi-biennial oscillation of water vapor in tropic stratosphere. Chin. J. Geophys. 52 (10), 2428–2435. doi:10.3969/j.issn.0001-5733.2009.10.002
Son, S. W., Lim, Y., Yoo, C. H., Hendon, H. H., and Kim, J. (2016). Stratospheric control of the madden-julian oscillation. J. Clim. 30 (6), 1909–1922. doi:10.1175/JCLI-D-16-0620.1
Tian, W. S., Chipperfield, M. P., Gray, L. J., and Zawodny, J. M. (2006). Quasi-biennial oscillation and tracer distributions in a coupled chemistry-climate model. J. Geophys. Res. 111 (D20). doi:10.1029/2005JD006871
Tian, W. S., Tian, H. Y., Shang, L., and Xin, Y. J. (2011). Advances in interactions between tropical stratosphere and troposphere. J. Trop. Meteorology 27 (5), 765–774. doi:10.1007/s00376-010-0016-1
Vogel, B., Guenther, G., Mueller, R., Grooss, J. U., and Riese, M. (2015). Impact of different Asian source regions on the composition of the Asian monsoon anticyclone and on the extratropical lowermost stratosphere. Atmos. Chem. Phys. 15 (7), 9941–9995. doi:10.5194/acpd-15-9941-2015
Waters, J., Froidevaux, L., Harwood, R. S., Jarnot, R. F., Pickett, H. M., Read, W. G., et al. (2006). The earth observing system microwave limb sounder (EOS MLS) on the Aura satellite. IEEE Trans. Geosci. Remote Sens. 44, 1075−1092. doi:10.1109/TGRS.2006.873771
Wei, W., Zhang, R. H., and Wen, M. (2012). Meridional variation of South Asian High and its relationship with the summer precipitation over China. J. Appl. Meteorol. Sci. 23 (6), 650–659. (in Chinese, with English summary). doi:10.1007/s11783-011-0280-z
Wright, J. S., Fu, R., Fueglistaler, S., iu, Y. S., and Zhang, Y. (2011). The influence of summertime convection over southeast Asia on water vapor in the tropical stratosphere. J. Geophys. Res. 116 (D12), D12302. doi:10.1029/2010JD015416
Keywords: QBO, Asian Summer Monsoon Anticyclone, Upper Troposphere and Lower Stratosphere, CO, vertical velocity
Citation: He X, Luo J, Xu X, Ren L, Tian H, Shang L and Xu P (2021) The QBO Modulation on CO Distribution in the UTLS Over the Asian Monsoon Region During Boreal Summer. Front. Earth Sci. 9:625990. doi: 10.3389/feart.2021.625990
Received: 04 November 2020; Accepted: 27 January 2021;
Published: 19 May 2021.
Edited by:
Yueyue Yu, Nanjing University of Information Science and Technology, ChinaCopyright © 2021 He, Luo, Xu, Ren, Tian, Shang and Xu. This is an open-access article distributed under the terms of the Creative Commons Attribution License (CC BY). The use, distribution or reproduction in other forums is permitted, provided the original author(s) and the copyright owner(s) are credited and that the original publication in this journal is cited, in accordance with accepted academic practice. No use, distribution or reproduction is permitted which does not comply with these terms.
*Correspondence: Jiali Luo, bHVvamxAbHp1LmVkdS5jbg==