 Xin Zhou
 Quanliang Chen
 Yang Li
 Yawei Yang
 Shaobo Zhang
 Yong Zhao
 Yulei Qi
 Jingtao Zhou
- 1Plateau Atmosphere and Environment Key Laboratory of Sichuan Province, College of Atmospheric Science, Chengdu University of Information Technology, Chengdu, China
- 2Shanghai Climate Center, Shanghai, China
The stratospheric pathway is a major driver of El Niño–Southern Oscillation (ENSO) impacts on mid-latitude tropospheric circulation and winter weather. The weak vortex induced by El Niño conditions has been shown to increase the risk of cold spells, especially over Eurasia, but its role for North American winters is less clear. This study involved idealized experiments with the Whole Atmosphere Community Climate Model to examine how the weak winter vortex induced by extreme El Niño events is linked to North American coldness in spring. Contrary to the expected mid-latitude cooling associated with a weak vortex, extreme El Niño events do not lead to North American cooling overall, with daily cold extremes actually decreasing, especially in Canada. The expected cooling is absent in most of North America because of the advection of warmer air masses guided by an enhanced ridge over Canada and a trough over the Aleutian Peninsula. This pattern persists in spring as a result of the trapping of stationary waves from the polar stratosphere and troposphere, implying that the stratospheric influence on North America is sensitive to regional downward wave activities.
Introduction
The El Niño-Southern Oscillation (ENSO) has far-reaching impacts globally and provides the most reliable source of seasonal to interannual climate prediction for North America (e.g., Tippett et al., 2012; L’Heureux et al., 2015). Many studies have discussed the impact of ENSO teleconnections on North America during the boreal winter, but it is becoming increasingly apparent that the stratospheric pathway is crucial to predictability on sub-seasonal to seasonal timescales (Butler et al., 2014, 2016; Domeisen et al., 2015), which are characteristically longer (Baldwin and Dunkerton, 2001; Baldwin et al., 2003; Polvani and Waugh, 2004; Gerber et al., 2009; Gerber et al., 2012; Yu et al., 2018a; Yu et al., 2018b), and hence more predictable than the tropospheric pathway (Domeisen et al., 2020a; Domeisen et al., 2020b).
The stratospheric pathway involves coupling between the troposphere and stratosphere; i.e., planetary waves propagate primarily upward and perturb the stratosphere, and surface conditions are thus affected by the stratospheric signal (Butler et al., 2014). Anomalous warming in the equatorial eastern Pacific associated with El Niño (EN) conditions can excite long wave trains with an anomalous Pacific North American (PNA) pattern (Garcia-Herrera et al., 2006) that intensifies the upward propagation of planetary Rossby waves to the stratosphere in the Northern Hemisphere during winter, resulting in a warmer and weaker polar vortex (Manzini et al., 2006; Camp and Tung, 2007; Free and Seidel, 2009; Fletcher and Kushner, 2011; Lan et al., 2012; Ren et al., 2012; Xie et al., 2012; Garfinkel et al., 2013a; Garfinkel et al., 2013b; Fletcher and Cassou, 2015). These EN-related stratospheric anomalies subsequently propagate downward into the troposphere, where they project a negative North Atlantic Oscillation (NAO) phase and an equatorward-shifted jet (Perlwitz and Graf, 1995; Thompson et al., 2002; Brönnimann et al., 2007; Kolstad et al., 2010). This tropospheric circulation change is often associated with mid-latitude cold snaps (Perlwitz and Graf, 1995; Thompson et al., 2002; Kolstad et al., 2010; Yu et al., 2015a; Yu et al., 2015b; Rao et al., 2020; Xie et al., 2020), notably over northern Eurasia (Scaife and Knight, 2008; Chen et al., 2011; Zhang et al., 2016). For North America, however, the influence of the stratospheric EN pathway is less pronounced.
The initial paramount issue for this topic—and the foundation of this study—is the nonlinearity in the tropospheric response to EN diversity. Different EN variants, such as the Eastern Pacific (EP) and Central Pacific (CP) types (Ren and Jin, 2013), have distinct influences on the stratospheric vortex because of their different sea surface temperature (SST) patterns (see Domeisen et al., (2019) for a review). The variance of EN intensity may also lead to differences in its stratospheric pathway. Very strong EN events (“extreme EN” hereinafter) are characterized by exceptional warming in the eastern equatorial Pacific, with the Niño3.4 anomaly reaching 2 K (L’Heureux et al., 2017). Three events in the satellite era are categorized as “extreme” (the 1982/83, 1997/98, and 2015/16 EN events), whereas other Eastern Pacific EN events are “moderate”. Note that only EP EN events are considered in this study, and CP events are excluded, to avoid possible differences induced by EN variants. Recent studies have shown potential nonlinearity in the stratospheric vortex response to extreme and moderate EN events, with the stratospheric response not necessarily being proportional to EN magnitude (Rao and Ren, 2016a, b), whereas other studies support a linear response (Richter et al., 2015; Trascasa-Castro et al., 2019). This discrepancy adds uncertainty to the downward influence of the weak stratospheric vortex associated with EN events.
Another key aspect of study is the seasonality of the EN stratospheric pathway. Most of the above studies have focused on the peak EN season (December–January–February; DJF) when the amplitudes of SST anomalies and teleconnections are at their highest. However, the potential for seasonal predictability over North America is greater during the late winter and spring season, as the SST-forced signals remain strong while background noise is reduced substantially (Kumar and Hoerling, 1998). The time variance of the EN response from early–late winter to early spring is essential for delineating the stratosphere–troposphere coupling (e.g., Manzini et al., 2006; Ineson and Scaife, 2009; Fletcher and Kushner, 2011; Sung et al., 2014; Calvo et al., 2017). When EN amplitude is involved, it has been reported that the anomalous strength of the stratospheric vortex shifts rapidly from positive to negative during December–January in cases of extreme EN (Calvo et al., 2010; Ayarzagüena et al., 2018; Zhou et al., 2018; Hardiman et al., 2019). The influence of stratosphere–troposphere coupling, or the stratospheric pathway, on North American surface climate in spring is thus of great theoretical and practical value, but has not yet received adequate attention.
Following the 2015/16 extreme EN winter, a warmer than average spring was seen in a large portion of the North America, from the Pacific Northwest into the Great Lakes and much of the Northeast. The abnormal warmth in the late winter/early spring period was accompanied by above-normal precipitation across the West. The weakening EN teleconnection in the troposphere, the PNA characterized by height anomalies over the western and eastern United States is expected to play an important role, but whether the stratospheric signal contributes to the reduced coldness is illusive. Zhou et al., (2020) found a persistent downward stratospheric signal throughout the winter–spring season induced by extreme EN, in contrast to moderate EN events and leading to the equatorward shift of the mid-latitude jet and a negative NAO pattern at the surface. Their results indicate that the prolonged stratospheric pathway of extreme EN increases the risk of cold spells over Eurasia in spring, but the impact on North America is unclear. Inspired by this, the aim of the present study was to examine how the weak winter vortex induced by extreme EN is linked to North American coldness in spring. Since the negative NAO response to extreme EN has already been proven, the atmospheric circulation change would be expected to lead to mid-latitude cooling. Here we present evidence from model simulations that highlight a “missing” cooling response in North America (which would be otherwise expected), which is offset by the thermodynamic effect of the advection of warmer air masses.
Methods and Models
The Whole Atmosphere Community Climate Model, version 4 (WACCM4; Marsh et al., 2013) was used; this is the atmospheric component of the coupled-climate-system model—the Community Earth System Model (CESM; Garcia et al., 2007). The standard version has 66 vertical levels extending from ground-level to 4.5 × 10⁻⁶ hPa (160 km geometric altitude), with a vertical resolution of 1.1–1.4 km in the tropical tropopause layer and lower stratosphere (<30 km altitude). All simulations were run with a horizontal resolution of 1.9° × 2.5° (latitude × longitude) and did not include interactive chemistry (Garcia et al., 2007). The fixed greenhouse gas (GHG) values used in the model radiation scheme were based on emission scenario A2 of the Intergovernmental Panel on Climate Change (IPCC; WMO, 2003) for 1980–2015. We used prescribed ozone forcing, with a 12-months seasonal cycle averaged over 1980–2015, from the CMIP5 ensemble mean ozone output. The quasi-biennial oscillation (QBO) forcing time series was determined using a 28-months fixed cycle.
The key to model simulations is to isolate the specific role of the stratospheric pathway. There are two main pathways of EN teleconnections to North America, namely the tropospheric and stratospheric pathways; these are not mutually exclusive, and some studies have suggested interactions between them (Geng et al., 2017). Numerical simulations were therefore used to isolate signals from the stratosphere, as applied with linear models in previous studies (Smith et al., 2010; Simpson et al., 2011). Zhou et al., (2020) addressed this issue using WACCM4, as summarized in Figure 1. Briefly, the prescribed EN–SST forcing in idealized experiments is limited to winter, so that the tropospheric pathway can be ignored ∼2 weeks after the termination of forcing (Jin and Hoskins, 1995), with the lagging response being attributed purely to the stratospheric pathway. We used the same simulations as those of Zhou et al., (2020) to allow comparison. Three experiments with daily outputs were designed, with one being a climatological run using prescribed fixed SSTs of the 12-months seasonal cycle for 1980–2015. The other two have EN–SST-forced SSTs in the tropical Pacific (30°S–30°N, 120–280°E), one with composited extreme EN SSTs and one with moderate EN SSTs, and climatological SSTs elsewhere. In the two sensitivity runs, the forcing was limited to the DJF season in each year. During the rest of the year, climatological SSTs were prescribed globally. The tropospheric pathway was therefore active solely during the DJF season and the following ∼2 weeks; after that, only the lagged EN influence through the stratospheric pathway was possible. The fact that stratospheric pathway was well isolated is carefully checked in multiple methods with dynamical analysis in Zhou et al., (2020), a nudging method applied to the stratosphere (Simpson et al., 2011; Wu and Smith, 2016King et al., 2017) using WACCM4 to better confirm the isolation and contribution of the stratospheric pathway is leaving for a future study. As for Zhou et al., (2020), the seasonal mean was taken for the period 15 March to 15 May to isolate a critical and consistent surface response in the subsequent analysis.
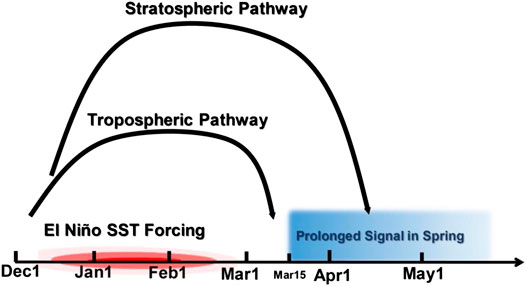
FIGURE 1. Time periods of imposed idealized EN–SST forcing in WACCM4, and active pathways by which EN can influence the Eurasian surface climate. The prolonged tropospheric signal in spring after Mar 15 is attributed solely to the stratospheric pathway, because the tropospheric pathway is negligible around two weeks after the termination of forcing (Dec–Jan–Feb).
Indices for cold extremes of temperature were used here, namely the percentile index, T10, and the absolute index, TN (Zhang et al., 2005; Alexander et al., 2006). T10 is calculated from the 10th percentile of daily temperature variability for the climatological run; i.e., a percentage count of the number of days below the 10th percentile. The advantage for this definition is that it is directly comparable with observational series, which eliminates the structural model uncertainties to a great extent (e.g., Sillmann et al., 2013; King et al., 2017; Zhu et al., 2020). The simulated T10 based on climatological run is ∼10% averaged in North America (20°N–80°N, 170–50°W), being similar with the observational results based on extreme dataset HadEX2 (Donat et al., 2013; Dunn et al., 2020). TN is the seasonal coldest daily temperature, giving absolute extremes (in contrast to T10). TN reveals intensity, while T10 gives a sense of the number of days affected by the circulation regimes (Frich et al., 2002; Alexander et al., 2006). As T10 uses a percentile threshold, the actual temperature threshold varies with the seasonal cycle, so T10 counts unusually cold days relative to the seasonal cycle.
Takaya and Nakamura (2001) proposed the wave-activity flux, which was used to describe the propagation features of quasi-stationary Rossby waves in the extratropics. The formulation of the three-dimensional wave-activity flux can be expressed as follows:
where
Results
As the persistence of the weak stratospheric vortex with a descending signal in circulation throughout the atmosphere have been established in Zhou et al., (2020), here we focus on the subsequently surface temperature response to the downward propagating signal from the stratosphere in spring. The influence of the EN stratospheric pathway on coldness over North America was investigated by first comparing surface-air temperature (SAT) anomalies during modeled extreme and moderate EN events in spring (Mar 15 to May 15; Figures 2A,B). In the moderate EN case, cold anomalies occur over a large portion of North America, consistent with the surface pattern associated with a negative NAO phase, though the signal is statistically insignificant. However, for extreme EN, significant warm anomalies occur over the northwest from Alaska to Nunavut, accompanied by weak negative temperate anomalies over the Salt Lake area. Abnormal effects on cold extremes during extreme and moderate EN events are shown in Figures 2C–F. The moderate EN has almost no signal in temperature extremes, but during extreme EN the percentage of coldest days decreases, with the coldest day (TN) tending to be warmer. This suggests that spring temperature extremes during extreme EN over North America do not increase as expected in the case of an anomalously weak stratospheric vortex; rather, the risk of coldness over a large portion of North America is likely to be reduced in cases of extreme EN.
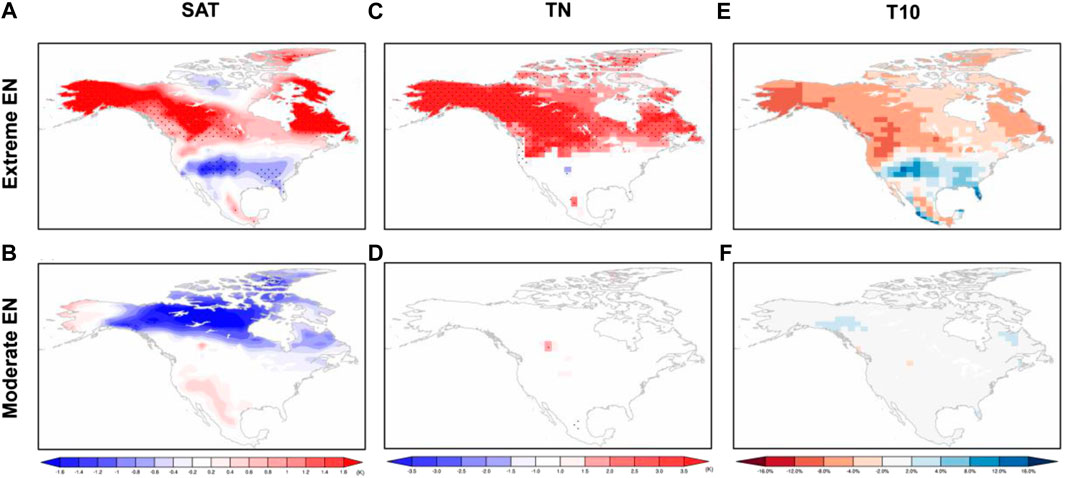
FIGURE 2. Differences in mean extreme (A and C, E) and moderate (B and D, F) EN events from the 30-years (control run) climatological mean for surface air temperature (SAT; A and B), the temperature of the coldest day in spring (TN; C and D), and the frequency of cold extremes (T10; E and F). TN indicates the response of the seasonal coldest night, and T10 is the change in the 10th percentile. Temperature anomalies in (A and B, C, D) that are significant at the 95% confidence level (Student’s t-test) are stippled.
The probability distribution function (PDF) of daily mean temperatures over North America (20°N–80°N, 170–50°W) in spring, between extreme EN and neutral conditions, is shown in Figure 3 (omitting results for moderate EN for brevity because of the lack of a significant signal in temperature extremes). The PDF for extreme EN narrows and shows a slight shift in mean value to the warmer side. The mean warming is 0.4 K in extreme EN conditions relative to neutral conditions, with the standard deviation decreasing by 0.4 K. All these changes are statistically significant at the 95% confidence level. There is no evidence of cooling or increased variability in SAT during extreme EN over North America; i.e., there is no evidence of increased cold extremes.
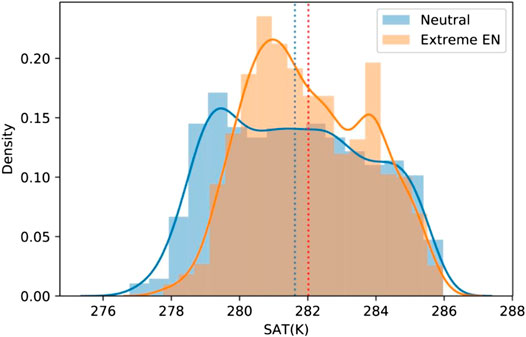
FIGURE 3. Probability distribution functions (PDFs) of regional mean SAT in North America in spring. Dashed black and solid red lines indicate PDFs for SAT for neutral ENSO and extreme EN events, respectively. The PDF for extreme EN is statistically different to that for neutral ENSO (based on a Kolmogorov-Smirnov test; p < 0.01). Figure for the moderate EN case with no obvious response were omitted.
The question remains as to why extreme EN makes North American spring temperatures warmer and less variable via the stratospheric pathway. The surface temperature is directly linked to tropospheric circulation, and the monthly mean geopotential height at 500 hPa is shown in Figure 4. Sub-seasonal means for Mar 15 to May 15 are considered rather than the daily evolution; in monthly mean fields, the quasi-stationary planetary wave structure becomes prominent, and time averaging causes attenuation of smaller-scale transient waves. A ridge persists along the western coast of North America during these periods, intensified by the positive geopotential-height anomalies over the western US and two anomalous lows at its sides—a stronger low over the North Pacific and a weaker low over the southern US. The southwest wind, conducted by the persisting ridge, brings warm air from the Pacific Ocean to the North American continent in spring. Specifically, the warm advection along the western coast of North America is decomposed into zonal and meridional components, with warm meridional advection as a primary role (
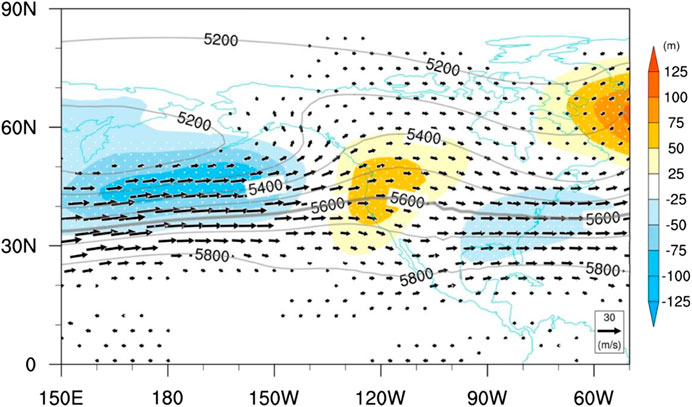
FIGURE 4. Monthly mean wind fields (vector), geopotential height (contours) and the anomaly (color) from spring climatology at 500 hPa, for extreme EN (with 100 m contours). The thicker line indicates 5600 m. Geopotential height anomalies that are significant at the 95% confidence level (Student’s t-test) are stippled. Figure for the moderate EN case with no obvious response were omitted.
We next traced the persisting tropospheric wave pattern to the signal from the stratosphere. Extreme EN drives upward propagation of more planetary Rossby waves into the stratosphere in winter, leading to a weak stratospheric polar vortex with a longer duration till spring (Zhou et al., 2020). The signal propagates downward into the troposphere by the reflection of Rossby waves (Perlwitz and Harnik, 2003). However, recent studies suggest that the reflective mechanism is sensitive to the exact region of upward wave-activity flux and is state-dependent on the strength of the vortex (Kretschmer et al., 2018). Three-dimensional visualization of wave behavior is thus particularly important for understanding the dynamics of the downward stratospheric impact on the troposphere. Height–longitude cross-sections of wave-activity flux and the zonal asymmetric component of geopotential height (Z*, with zonal mean removed) averaged over 30°–60°N during extreme EN events are depicted in Figure 5A, while Figure 5B shows the horizontal wave-activity flux and wave divergence anomalies at 500 hPa for extreme EN. The ridge along the western coast of North America extends into the stratosphere, with its phase tilting slightly eastward with height in the troposphere. The tropospheric trough over the North Pacific also expands into the stratosphere with its phase shifting westward, while the trough over the eastern USA tilts eastward with height (Figure 5A). Westward and eastward tilts of ridge lines with height indicate upward and downward propagation of planetary waves, respectively. This implies that a wave packet that propagates upward to the stratosphere from the North Pacific will reflect to the Western Hemisphere troposphere. From the horizontal view of wave activities, it is clear that there is significant wave convergence over the western coast of North America, supporting the trapping of stationary waves and intensifying the ridge over this region (Figure 5B). In case studies by Kodera et al., (2013), convergence of downward propagation of stratospheric planetary waves, indicating trapped stationary waves in a region, was also noted to favor occurrence of the Pacific blocking. The regional anomalous ridge is maintained through the interaction with transient synoptic eddies (Zhou et al., 2020).
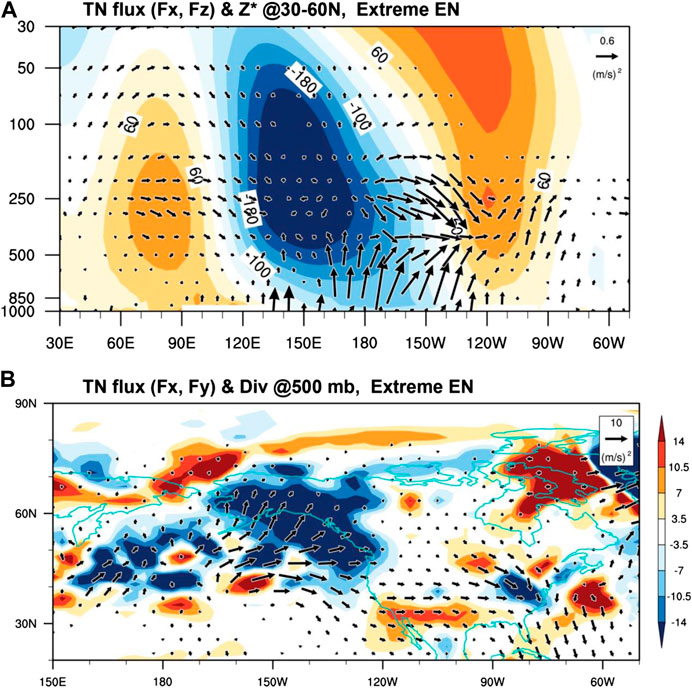
FIGURE 5. (A) Height–longitude cross-section of the wave flux (Fx, Fz; vectors) and eddy geopotential height (Z*; color; m) averaged over 30°–60°N during extreme EN. (B) 500-hPa horizontal wave-activity flux (Fx, Fy) (vectors; m2 s−2) and its divergence (color shading; 10−5 m2 s−2) for extreme EN. The wave flux is multiplied by the square root of 1000/pressure (hPa) to better indicate waves in the stratosphere. Figure for the moderate EN case with no obvious response were omitted.
This vertical propagation property can be further confirmed by the linear wave interaction between climatological waves and anomalous Rossby waves in response to extreme EN at different horizontal scales (Charney and Drazin, 1961). Figure 6 shows a longitude–pressure cross-section of the decomposed wave patterns of zonal wavenumber 1 and zonal wavenumber 2. For wavenumber 1, a nodal structure in phase difference exists near the tropopause. Above the tropopause, the wavenumber 1 response exhibits an eastward tilt with height during extreme EN, out of phase with the background stationary wave, indicating a downward reflection of the planetary waves. Below the tropopause, however, the wavenumber 1 response exhibits a westward tilt with height and is in phase with the background stationary wave, indicating upward propagation of the planetary waves. The wavenumber 2 response undergoes destructive interference with the climatological wave throughout the atmosphere, but the magnitude is considerably less than that of the wavenumber 1 pattern. The linear interference of wavenumbers 1 and 2 is consistent with vertical propagation characteristics based on the above three-dimensional wave-activity analysis, with trapping of stationary waves from the polar stratosphere and troposphere. It should be noted, however, that two-dimensional wave-interference analysis—despite being an effective tool for showing the vertical propagation property in a zonally averaged view—cannot indicate regional propagation properties, which are especially important for understanding the regional effects of the downward signal from the stratosphere.
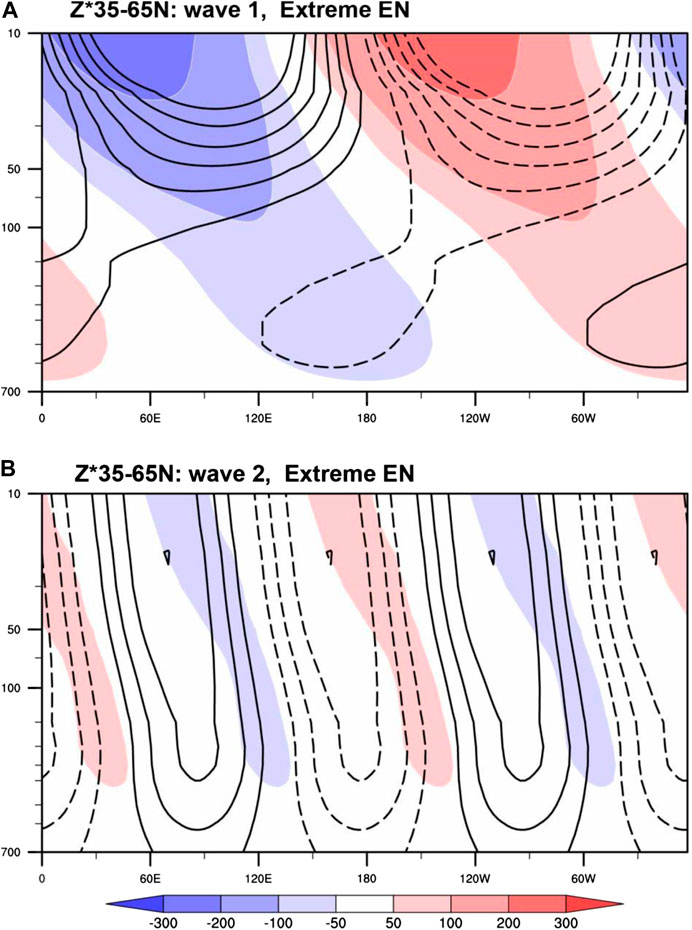
FIGURE 6. Longitude–height cross-section of the zonally asymmetric component of geopotential height anomalies (Z*) associated with stationary waves of (A) wavenumber 1 and (B) wavenumber 2, averaged over 30°–60°N during extreme EN. Contours indicate forced waves derived as sensitivity minus control values (contour intervals are 20 m; negative contours are dashed), and shading indicates the climatological stationary wave field from the control experiment. Figure for the moderate EN case with no obvious response were omitted.
Summary
This study involved idealized experiments with WACCM4 to explore how spring coldness is reduced by the persistent weak vortex induced by extreme El Niño events. The isolated stratospheric signal persisting in spring was shown to reduce the probability of daily cold extremes in North America. Although a weak stratospheric polar vortex is claimed to increase the risk of mid-latitude cold extremes with a negative NAO phase and southward shift of the jet stream, the regional impacts are sensitive to the downward path of planetary waves reflected from the stratosphere, especially in North America. In extreme EN events, a wave packet is propagated upward from the North Pacific to the stratosphere, and reflected back to the Western Hemisphere troposphere. The subsequent trapping of stationary waves from the polar stratosphere and troposphere over North America enhances a ridge over Canada and causes advection of warmer air masses. As a result, fewer, rather than more, cold extremes should be expected in North America during spring.
Data Availability Statement
The original contributions presented in the study are included in the article/Supplementary Material, further inquiries can be directed to the corresponding author.
Author Contributions
QC and XZ initiated the project. XZ conducted analysis and wrote the manuscript. YL, YY, SZ, YZ, and JZ contributed to discussion and revision of the manuscript. All authors read and edited the manuscript.
Funding
Funding for this project was provided by the National Natural Science Foundation of China (41905037, 41805054, 41875108, 41971026, U20A2097), the National Key Research and Development Program on Monitoring, Early Warning and Prevention of Major Natural Disaster (2018YFC1506006), the Second Tibetan Plateau Scientific Expedition and Research (STEP) program (2019QZKK0103), and the Sichuan Science and Technology Program (2020JDJQ0050).
Acknowledgments
We thank Yueyue Yu and two reviewers for their valuable suggestions and comments, which have led to considerable improvements in this work. We acknowledge SST from the United Kingdom Met Office Hadley Center for Climate Prediction and Research, and CESM-WACCM4 from NCAR. The numerical simulation data using CESM-WACCM4 from NCAR employed in this research is available online (https://doi.org/10.6084/m9.figshare.11479113).
Conflict of Interest
The authors declare that the research was conducted in the absence of any commercial or financial relationships that could be construed as a potential conflict of interest
References
Alexander, L., Zhang, X., Peterson, T., Caesar, J., Gleason, B., Klein Tank, A., et al. (2006). Global observed changes in daily climate extremes of temperature and precipitation. J. Geophy. Res.: Atmos. 111 (D5). doi:10.1029/2005JD006290
Ayarzagüena, B., Ineson, S., Dunstone, N., Baldwin, M., and Scaife, A. (2018). Intraseasonal effects of El Niño southern oscillation on North atlantic climate. J. Clim. (2018), 8861–8873. doi:10.1175/JCLI-D-18-0097.1
Baldwin, M. P., and Dunkerton, T. J. (2001). Stratospheric harbingers of anomalous weather regimes. Science 294 (5542), 581–584. doi:10.1126/science.1063315
Baldwin, M. P., Stephenson, D. B., Thompson, D. W., Dunkerton, T. J., Charlton, A. J., and O'Neill, A. (2003). Stratospheric memory and skill of extended-range weather forecasts. Science. 301 (5633), 636–640. doi:10.1126/science.1087143
Brönnimann, S., Xoplaki, E., Casty, C., Pauling, A., and Luterbacher, J. (2007). ENSO influence on Europe during the last centuries. Clim. Dyn. 28 (2–3), 181–197. doi:10.1007/s00382-006-0175-z
Butler, A. H., Arribas, A., Athanassiadou, M., Baehr, J., Calvo, N., Charlton‐Perez, A., et al. (2016). The Climate‐system Historical Forecast Project: do stratosphere‐resolving models make better seasonal climate predictions in boreal winter? Q. J. R. Meteorol. Soc. 142 (696), 1413–1427. doi:10.1002/qj.2743
Butler, A. H., Polvani, L. M., and Deser, C. (2014). Separating the stratospheric and tropospheric pathways of El Nino-Southern Oscillation teleconnections. Environ. Res. Lett. 9 (2), 024014. doi:10.1088/1748-9326/9/2/024014
Calvo, N., Garcia, R. R., Randel, W. J., and Marsh, D. R. (2010). Dynamical mechanism for the Increase in tropical upwelling in the lowermost tropical stratosphere during warm ENSO events. J. Atmos. Sci. 67 (7), 2331–2340. doi:10.1175/2010jas3433.1
Calvo, N., Iza, M., Hurwitz, M. M., Manzini, E., Pena-Ortiz, C., Butler, A. H., et al. (2017). Northern Hemisphere stratospheric pathway of different El nino flavors in stratosphere-resolving CMIP5 models. J. Clim. 30 (12), 4351–4371. doi:10.1175/JCLI-D-16-0132.1
Camp, C. D., and Tung, K. K. (2007). Stratospheric polar warming by ENSO in winter: a statistical study. Geophy. Res. Lett. 34 (4). doi:10.1029/2006gl028521
Charney, J., and Drazin, P. (1961). Propagation of planetary scale waves from the lower atmosphere to the upper atmosphere. J. Geophys. Res. 66, 83–109.
Chen, Q., Li, Z., Fan, G., Zhu, K., Zhang, W., and Zhu, H. (2011). Indications of stratospheric anomalies in the freezing rain and snow disaster in South China, 2008. Science China Earth Sci. 54 (8), 1248. doi:10.1007/s11430-011-4192-3
Domeisen, D. I., Butler, A. H., Charlton‐Perez, A. J., Ayarzagüena, B., Baldwin, M. P., Dunn‐Sigouin, E., et al. (2020). The role of the stratosphere in subseasonal to seasonal prediction: 2. Predictability arising from stratosphere‐troposphere coupling. J. Geophy. Res.: Atmos. 125 (2), e2019JD030923. doi:10.1029/2019JD030923
Domeisen, D. I., Butler, A. H., Fröhlich, K., Bittner, M., Müller, W. A., and Baehr, J. (2015). Seasonal predictability over Europe arising from El Niño and stratospheric variability in the MPI-ESM seasonal prediction system. J. Clim. 28 (1), 256–271. doi:10.1175/jcli-d-14-00207.1
Domeisen, D. I. V., Butler, A. H., Charlton-Perez, A. J., Ayarzagüena, B., Baldwin, M. P., Dunn-Sigouin, E., et al. (2020). The role of the stratosphere in subseasonal to seasonal prediction: 1. Predictability of the stratosphere. J. Geophy. Res.: Atmos. 125 (2), e2019JD030920. doi:10.1029/2019jd030920
Domeisen, D. I. V., Garfinkel, C. I., and Butler, A. H. (2019). The teleconnection of El Nino Southern oscillation to the stratosphere. Rev. Geophys. 57 (1), 5–47. doi:10.1029/2018RG000596
Donat, M., Alexander, L., Yang, H., Durre, I., Vose, R., Dunn, R., et al. (2013). Updated analyses of temperature and precipitation extreme indices since the beginning of the twentieth century: the HadEX2 dataset. J. Geophy. Res.: Atmos. 118 (5), 2098–2118. doi:10.1002/jgrd.50150
Dunn, R. J. H., Alexander, L. V., Donat, M. G., Zhang, X., Bador, M., Herold, N., et al. (2020). Development of an updated global land in situ-based data set of temperature and precipitation extremes: HadEX3. J. Geophy. Res.: Atmos. 125 (16), e2019JD032263. doi:10.1029/2019JD032263
Fletcher, C. G., and Cassou, C. (2015). The dynamical influence of separate teleconnections from the Pacific and Indian Oceans on the northern annular mode. J. Clim. 28 (20), 7985–8002. doi:10.1175/jcli-d-14-00839.1
Fletcher, C. G., and Kushner, P. J. (2011). The role of linear interference in the annular mode response to tropical SST forcing. J. Clim. 24 (3), 778–794. doi:10.1175/2010JCLI3735.1
Free, M., and Seidel, D. J. (2009). Observed El niño-southern oscillation temperature signal in the stratosphere. J. Geophy. Res.-Atmos. 114 (D23). doi:10.1029/2009jd012420
Frich, P., Alexander, L. V., Della-Marta, P., Gleason, B., Haylock, M., Tank, A. K., et al. (2002). Observed coherent changes in climatic extremes during the second half of the twentieth century. Climate Res. 19 (3), 193–212. doi:10.3354/cr019193
Garcia, R. R., Marsh, D. R., Kinnison, D. E., Boville, B. A., and Sassi, F. (2007). Simulation of secular trends in the middle atmosphere, 1950-2003. J. Geophys. Res.‐Atm. 112 (D09301). doi:10.1029/2006jd007485
Garcia-Herrera, R., Calvo, N., Garcia, R. R., and Giorgetta, M. A. (2006). Propagation of ENSO temperature signals into the middle atmosphere: a comparison of two general circulation models and ERA-40 reanalysis data. J. Geophy. Res.-Atmos. 111 (D6). doi:10.1029/2005JD006061
Garfinkel, C. I., Hurwitz, M. M., Oman, L. D., and Waugh, D. W. (2013a). Contrasting effects of central pacific and eastern pacific El nino on stratospheric water vapor. Geophysical Research Letters 40 (15), 4115–4120. doi:10.1002/grl.50677
Garfinkel, C. I., Hurwitz, M. M., Waugh, D. W., and Butler, A. H. (2013b). Are the teleconnections of central pacific and eastern pacific El nio distinct in boreal wintertime? Climate Dynamics 41 (7–8), 1835–1852. doi:10.1007/s00338-012-1570-2
Geng, X., Zhang, W., Stuecker, M. F., and Jin, F. F. (2017). Strong sub-seasonal wintertime cooling over east asia and northern europe associated with super El Niño events. Sci. Rep. 7 (1), 3770. doi:10.1038/s41598-017-03977-2
Gerber, E., Orbe, C., and Polvani, L. M. (2009). Stratospheric influence on the tropospheric circulation revealed by idealized ensemble forecasts. Geophysical Research Letters 36 (24). doi:10.1029/2009gl040913
Gerber, E. P., Butler, A., Calvo, N., Charlton-Perez, A., Giorgetta, M., Manzini, E., et al. (2012). Assessing and understanding the impact of stratospheric dynamics and variability on the Earth system. Bull. American Meteor. Soc. 93 (6), 845–859. doi:10.1175/bams-d-11-00145.1
Hardiman, S. C., Dunstone, N. J., Scaife, A. A., Smith, D. M., Ineson, S., Lim, J., et al. (2019). The impact of strong El nino and La nina events on the north atlantic. Geophy. Res. Lett. 46 (5), 2874–2883. doi:10.1029/2018GL081776
Ineson, S., and Scaife, A. A. (2009). The role of the stratosphere in the European climate response to El Nino. Nat. Geosci. 2 (1), 32–36. doi:10.1038/NGEO381
Jin, F. F., and Hoskins, B. J. (1995). The direct response to tropical heating in a baroclinic atmosphere. J. Atmos. Sci. 52 (3), 307–319. doi:10.1175/1520-0469(1995)052<0307:tdrtth>2.0.co;2
King, A. D., Karoly, D. J., and Henley, B. J. (2017). Australian climate extremes at 1.5°C and 2°C of global warming. Nat. Clim. Change 7 (6), 412–416. doi:10.1038/nclimate3296
Kodera, K., Mukougawa, H., and Fujii, A. (2013). Influence of the vertical and zonal propagation of stratospheric planetary waves on tropospheric blockings. J. Geophy. Res.: Atmos. 118 (15), 8333–8345. doi:10.1002/jgrd.50650
Kolstad, E. W., Breiteig, T., and Scaife, A. A. (2010). The association between stratospheric weak polar vortex events and cold air outbreaks in the Northern Hemisphere. Q. J. R. Meteorol. Soc. 136 (649), 886–893. doi:10.1002/qj.620
Kretschmer, M., Cohen, J., Matthias, V., Runge, J., and Coumou, D. (2018). The different stratospheric influence on cold-extremes in Eurasia and North America. npj Clim. Atmos. Science 1 (1), 1–10. doi:10.1038/s41612-018-0054-4
Kumar, A., and Hoerling, M. P. (1998). Annual cycle of pacific–north American seasonal predictability associated with different phases of ENSO. J. Clim. 11 (12), 3295–3308. doi:10.1175/1520-0442(1998)011<3295:acopna>2.0.co;2
L’Heureux, M. L., Tippett, M. K., and Barnston, A. G. (2015). Characterizing ENSO coupled variability and its impact on North American seasonal precipitation and temperature*. J. Clim. 28 (10), 4231–4245. doi:10.1175/jcli-d-14-00508.1
L’Heureux, M. L., Takahashi, K., Watkins, A. B., Barnston, A. G., Becker, E. J., Di Liberto, T. E., et al. (2017). Observing and predicting the 2015/16 El nino. Bull. American Meteorol. Soc. 98 (7), 1363–1382. doi:10.1175/BAMS-D-16-0009.1
Lan, X. Q., Chen, W., and Wang, L. (2012). Quasi-stationary planetary wave-mean flow interactions in the Northern Hemisphere stratosphere and their responses to ENSO events. Science China-Earth Sci. 55 (3), 405–417. doi:10.1007/S11430-011-4345-4
Manzini, E., Giorgetta, M. A., Esch, M., Kornblueh, L., and Roeckner, E. (2006). The influence of sea surface temperatures on the northern winter stratosphere: ensemble simulations with the MAECHAM5 model. J. Clim. 19 (16), 3863–3881. doi:10.1175/Jcli3826.1
Perlwitz, J., and Graf, H.-F. (1995). The statistical connection between tropospheric and stratospheric circulation of the Northern Hemisphere in winter. J. Clim. 8 (10), 2281–2295. doi:10.1175/1520-0442(1995)008<2281:tscbta>2.0.co;2
Perlwitz, J., and Harnik, N. (2003). Observational evidence of a stratospheric influence on the troposphere by planetary wave reflection. J. Climate. 16 (18), 3011–3026.
Polvani, L. M., and Waugh, D. W. (2004). Upward wave activity flux as a precursor to extreme stratospheric events and subsequent anomalous surface weather regimes. J. Clim. 17 (18), 3548–3554. doi:10.1175/1520-0442(2004)017<3548:uwafaa>2.0.co;2
Rao, J., Garfinkel, C. I., and White, I. P. (2020). Predicting the downward and surface influence of the February 2018 and January 2019 sudden stratospheric warming events in subseasonal to seasonal (S2S) models. J. Geophy. Res.: Atmos. 125 (2), e2019JD031919. doi:10.1029/2019jd031919
Rao, J., and Ren, R. C. (2016a). Asymmetry and nonlinearity of the influence of ENSO on the northern winter stratosphere: 1. Observations. J. Geophy. Res.-Atmos. 121 (15), 9000–9016. doi:10.1002/2015JD024520
Rao, J., and Ren, R. C. (2016b). Asymmetry and nonlinearity of the influence of ENSO on the northern winter stratosphere: 2. Model study with WACCM. J. Geophy. Res.-Atmos. 121 (15), 9017–9032. doi:10.1002/2015JD024521
Ren, H. L., and Jin, F. F. (2013). Recharge oscillator mechanisms in two types of ENSO. J. Clim. 26 (17), 6506–6523. doi:10.1175/jcli-d-12-00601.1
Ren, R. C., Cai, M., Xiang, C. Y., and Wu, G. X. (2012). Observational evidence of the delayed response of stratospheric polar vortex variability to ENSO SST anomalies. Clim. Dyn. 38 (7–8), 1345–1358. doi:10.1007/s00382-011-1137-7
Richter, J. H., Deser, C., and Sun, L. (2015). Effects of stratospheric variability on El Nino teleconnections. Environ. Res. Lett. 10 (12), 124021. doi:10.1088/1748-9326/10/12/124021
Scaife, A., and Knight, J. (2008). Ensemble simulations of the cold European winter of 2005–2006. Quart. J. R. Meteor. Soc. 134 (636), 1647–1659. doi:10.1002/qj.312
Sillmann, J., Kharin, V. V., Zhang, X., Zwiers, F. W., and Bronaugh, D. (2013). Climate extremes indices in the CMIP5 multimodel ensemble: Part 1. Model evaluation in the present climate. J. Geophy. Res.: Atmos. 118 (4), 1716–1733. doi:10.1002/jgrd.50203
Simpson, I. R., Hitchcock, P., Shepherd, T. G., and Scinocca, J. F. (2011). Stratospheric variability and tropospheric annular-mode timescales. Geophy. Res. Lett. 38 (20). doi:10.1029/2011GL049304
Smith, K. L., Fletcher, C. G., and Kushner, P. J. (2010). The role of linear interference in the annular mode response to extratropical surface forcing. J. Clim. 23 (22), 6036–6050. doi:10.1175/2010jcli3606.1
Sung, M. K., Kim, B. M., and An, S. I. (2014). Altered atmospheric responses to eastern Pacific and central Pacific El Nios over the North Atlantic region due to stratospheric interference. Climate Dyn. 42 (1–2), 159–170. doi:10.1007/s00382-012-1661-0
Takaya, K., and Nakamura, H. (2001). A formulation of a phase-independent wave-activity flux for stationary and migratory quasigeostrophic eddies on a zonally varying basic flow. J. Atmos. Sci. 58 (6), 608–627. doi:10.1175/1520-0469(2001)058<0608:afoapi>2.0.co;2
Thompson, D. W., Baldwin, M. P., and Wallace, J. M. (2002). Stratospheric connection to Northern Hemisphere wintertime weather: implications for prediction. J. Clim. 15 (12), 1421–1428. doi:10.1175/1520-0442(2002)015<1421:sctnhw>2.0.co;2
Tippett, M. K., Barnston, A. G., and Li, S. (2012). Performance of recent multimodel ENSO forecasts. J. Applied Meteor. Clim. 51 (3), 637–654. doi:10.1175/jamc-d-11-093.1
Trascasa-Castro, P., Maycock, A. C., Yiu, Y. Y. S., and Fletcher, J. K. (2019). On the linearity of the stratospheric and euro-atlantic sector response to ENSO. J. Clim. 32 (19), 6607–6626. doi:10.1175/JCKI-D-18-0746.1
WMO (2003). Scientific assessment of ozone depletion: 2002. Global Ozone Research and Monitoring Project Rep. 47, 498. Available at: https://www.wmo.int/pages/prog/arep/gaw/ozone_2002/ozone_2002.html
Wu, Y., and Smith, K. L. (2016). Response of Northern Hemisphere midlatitude circulation to Arctic amplification in a simple atmospheric general circulation model. J. Climate. 29 (6), 2041–2058.
Xie, F., Li, J., Tian, W., Feng, J., and Huo, Y. (2012). Signals of El Niño Modoki in the tropical tropopause layer and stratosphere. Atmos. Chem. Phy. 12 (11), 5259–5273. doi:10.5194/acp-12-5259-2012
Xie, J., Hu, J., Xu, H., Liu, S., and He, H. (2020). Dynamic diagnosis of stratospheric sudden warming event in the boreal winter of 2018 and its possible impact on weather over north America. Atmosphere 11 (5), 438. doi:10.3390/atmos11050438
Yu, Y., Cai, M., Ren, R., and Rao, J. (2018a). A closer look at the relationships between meridional mass circulation pulses in the stratosphere and cold air outbreak patterns in northern hemispheric winter. Clim. Dyna. 51 (7–8), 3125–3143. doi:10.1007/s00382-018-4069-7
Yu, Y., Cai, M., Ren, R., and Van Den Dool, H. M. (2015a). Relationship between warm airmass transport into the upper polar atmosphere and cold air outbreaks in winter. J. Atmos. Sci. 72 (1), 349–368. doi:10.1175/jas-d-14-0111.1
Yu, Y., Cai, M., Shi, C., and Ren, R. (2018b). On the linkage among strong stratospheric mass circulation, stratospheric sudden warming, and cold weather events. Monthly Weath. Review. 146 (9), 2717–2739. doi:10.1175/mwr-d-18-0110.1
Yu, Y., Ren, R., and Cai, M. (2015b). Dynamic linkage between cold air outbreaks and intensity variations of the meridional mass circulation. J. Atmos. Sci. 72 (8), 3214–3232. doi:10.1175/jas-d-14-0390.1
Zhang, J., Tian, W., Chipperfield, M. P., Xie, F., and Huang, J. (2016). Persistent shift of the Arctic polar vortex towards the Eurasian continent in recent decades. Nature Clim. Change 6 (12), 1094–1099. doi:10.1038/nclimate3136
Zhang, X., Hegerl, G., Zwiers, F. W., and Kenyon, J. (2005). Avoiding inhomogeneity in percentile-based indices of temperature extremes. J. Clim. 18 (11), 1641–1651. doi:10.1175/jcli3366.1
Zhou, X., Chen, Q., Wang, Z., Xu, M., Zhao, S., Cheng, Z., et al. (2020). Longer duration of the weak stratospheric vortex during extreme El Niño events linked to spring eurasian coldness. J. Geophy. Res.: Atmos. 125 (16), e2019JD032331. doi:10.1029/2019jd032331
Zhou, X., Li, J. P., Xie, F., Chen, Q. L., Ding, R. Q., Zhang, W. X., et al. (2018). Does extreme El nino have a different effect on the stratosphere in boreal winter than its moderate counterpart? Journal of Geophysical Research-Atmospheres 123 (6), 3071–3086. doi:10.1175/JCLI-D-17-0575.1
Keywords: extreme El Niño, stratospheric pathway, north America, spring coldness, WACCM4
Citation: Zhou X, Chen Q, Li Y, Yang Y, Zhang S, Zhao Y, Qi Y and Zhou J (2021) The North American Spring Coldness Response to the Persistent Weak Stratospheric Vortex Induced by Extreme El Niño Events. Front. Earth Sci. 9:626244. doi: 10.3389/feart.2021.626244
Received: 05 November 2020; Accepted: 15 January 2021;
Published: 25 February 2021.
Edited by:
Yueyue Yu, Nanjing University of Information Science and Technology, ChinaReviewed by:
Jian Rao, Nanjing University of Information Science and Technology, ChinaKe Wei, Institute of Atmospheric Physics (CAS), China
Copyright © 2021 Zhou, Chen, Li, Yang, Zhang, Zhao, Qi and Zhou. This is an open-access article distributed under the terms of the Creative Commons Attribution License (CC BY). The use, distribution or reproduction in other forums is permitted, provided the original author(s) and the copyright owner(s) are credited and that the original publication in this journal is cited, in accordance with accepted academic practice. No use, distribution or reproduction is permitted which does not comply with these terms.
*Correspondence: Quanliang Chen, Y2hlbnFsQGN1aXQuZWR1LmNu