 Anna Haberkorn
 Robert Kenner
 Jeannette Noetzli
 Marcia Phillips
- WSL Institute for Snow and Avalanche Research SLF, Davos, Switzerland
Rising air temperatures and increasingly intense precipitation are being observed in the Swiss Alps. These changes strongly affect the evolution of the temperature regime and the dynamics of mountain permafrost. Changes occur at different rates depending on ground ice content. Long-term monitoring reveals progressive warming and degradation of permafrost and accelerating rock glacier velocities. This study analyses changes occurring in ice-rich (excess-ice) and ice-poor mountain permafrost in Switzerland between 1997 and 2019 on the basis of ground temperature and rock glacier dynamics measurements carried out by the WSL Institute for Snow and Avalanche Research SLF at seven sites. Long-term borehole data indicate an increase of ground temperatures at all depths, in particular at ice-poor and nearly snow-free sites. Active layers are thickening at most sites and prolonged periods of active layer thaw are observed. Long autumn zero curtains are observed in ice-rich permafrost, possibly leading to an overall acceleration of rock glaciers. All these changes point towards ongoing permafrost warming and permafrost degradation in future.
1 Introduction
On a global scale, permafrost temperatures increased by approximately 0.3°C during the last decade (Biskaborn et al., 2019). In mountain regions the rapid warming of the atmosphere (e.g., Ceppi et al., 2012; Pepin et al., 2015; Scherrer et al., 2016) induces significant changes in mountain permafrost and consequently, rising ground temperatures are being observed (Biskaborn et al., 2019; Hock et al., 2019; PERMOS, 2019; Etzelmüller et al., 2020; Noetzli et al., 2020; Phillips et al., 2020). The modelled surface area of mountain permafrost in Switzerland covers about 3% (Kenner et al., 2019a). Rising ground temperatures (Biskaborn et al., 2019; PERMOS, 2019), active layer thickening, varying ice- and water contents (Mollaret et al., 2019) and strongly increasing rock glacier deformation rates (PERMOS, 2019) have been observed in the (Swiss) Alps during the last two decades and are attributed to climate warming. Recent intra-permafrost talik formation in some rock glaciers (Zenklusen Mutter and Phillips, 2012b; Boaga et al., 2020) signal the onset of permafrost degradation. Induced by climate warming, higher water contents contribute to the acceleration of rock glaciers (Wirz et al., 2016; Buchli et al., 2018; Cicoira et al., 2019b). Short-term accelerations of rock glaciers are caused by intense summer rainfall (Jansen and Hergarten, 2006; Wirz et al., 2014; Kenner et al., 2017a), while on an annual basis the duration of the freezing period in the active layer controls the water budget and is thus decisive for rock glacier velocity (Kenner et al., 2019b). Although the reaction of rock glaciers to climate change is complex and superimposed by other, local phenomena, rock glacier velocity and zero curtain duration are valuable indicators, particularly regarding changes in ice/water content taking place in 0°C isothermal permafrost, which cannot be distinguished on the basis of temperature data. Rock glacier kinematics also reveal one of the geotechnical consequences of warming permafrost, highlighting the relevance of alpine permafrost beyond its role as a climate indicator. As a consequence of rock glacier velocity increase, rock glaciers transport more sediments downslope and when their fronts reach steep terrain, rock fall or debris flows can be triggered with higher frequencies and/or volumes (Kummert and Delaloye, 2018).
The Swiss climate change scenarios for the Alps predict rising air temperatures, more frequent summer heat waves (CH2018, 2018; NCCS, 2018) and indicate that heavy precipitation will intensify and be more frequent in future (Rajczak et al., 2013; Scherrer et al., 2016; NCCS, 2018). Long-term permafrost monitoring data is thus essential to analyse the impact of ongoing climate change on mountain permafrost and to provide information allowing efficient management of mass movements originating in permafrost terrain in the densely populated Alps.
Long-term mountain permafrost monitoring in Switzerland is ensured by the Swiss Permafrost Monitoring Network PERMOS (e.g., PERMOS, 2019) on the basis of borehole temperature logging, ground surface temperature observations, geophysical investigations (electrical resistivity tomography) and terrestrial geodetical slope deformation monitoring, using for example, total stations, and Global Navigation Satellite System (GNSS) receivers. Various sub-networks run by Swiss research institutions contribute data to the PERMOS network and complement the latter with measurements from additional sites as well as with methods and variables not (yet) included in the national monitoring.
Here, we present borehole ground temperature and complementing data, such as terrestrial laser scans (TLS) measured by the WSL Institute for Snow and Avalanche Research SLF. Terrestrial laser scans and some of the borehole data are not submitted to PERMOS. We describe and quantify changes which have occurred in mountain permafrost at measurement sites covering a variety of different climatic and topographic conditions, located in different landforms with varying ground ice contents. Global assessments such as those presented by Biskaborn et al. (2019) or Hock et al. (2019) typically consider mountain permafrost as one type or region and do not distinguish between different landforms in mountain permafrost, i.e., sites located in ice-rich (excess-ice) and ice-poor mountain permafrost as do Kenner et al. (2019a). Ground ice content, however, significantly influences warming rates due to latent heat effects (e.g., Romanovsky et al., 2010; Hock et al., 2019; Noetzli et al., 2019) as well as the potential consequences of permafrost degradation. Throughout this publication we therefore distinguish between (1) ice-rich permafrost with an ice content exceeding the pore volume of the ground (Harris et al., 1998), (2) ice-poor permafrost with ice occurring only in pores and joints (Murton et al., 2006; Krautblatter et al., 2012), and (3) permafrost-free ground.
The evolution of ground temperatures, the active layer thickness and the dynamics of three rock glaciers are analysed at selected mountain permafrost sites operated by SLF (section “2 Test Sites”) and their changes in the last two decades are shown. The analysis is based on data measured at sites in different regions of the Swiss Alps between 1997 and 2019 (section “3 Methods”). Data from 9 of 25 high alpine boreholes maintained by SLF are analysed (section “4 Results”), seven of which are incorporated in the PERMOS network (PERMOS, 2019). Data from the other SLF boreholes are not included for reasons such as their vicinity to infrastructure (disturbed measurements), confidentiality of the data or quality issues such as sensor drift. We further introduce the concept of mean annual active layer thickness as a proxy for active layer duration and intensity. The evolution of annual minima and maxima and the duration of the zero curtain at the permafrost table are also analysed and in the absence of data on ground ice and water contents, borehole temperatures are used to discern the formation of taliks in ice-rich permafrost. To analyse rock glacier velocities (section “4.4 Rock Glacier Dynamics”) the geodetic measurement methods terrestrial laser scanning (TLS) and photogrammetry are used here. Similarities and differences to established methods, used for example within the PERMOS network are discussed in section “5 Discussion.” Finally, the need for additional permafrost monitoring data, particularly regarding ground water contents is emphasised, to better understand ongoing processes in mountain permafrost induced by climate change (section “6 Conclusions and Outlook”).
2 Test Sites
2.1 Ground Temperature Measurements in Boreholes
We show a detailed analysis of ground temperatures measured in 9 SLF boreholes at 7 sites located between approximately 2400 m and 3600 m a.s.l. in different regions of the Swiss Alps and in different landforms with varying ice contents (Table 1 and Figure 1): rock walls and crests, talus slopes, and rock glaciers. Permafrost is not present at all observation sites (Table 1), but permafrost-free boreholes are located close to the lower fringe of mountain permafrost. Some boreholes are close to high mountain infrastructure and were drilled in the context of construction activity. An overview of the analysed data-sets is shown in Figure 2A.
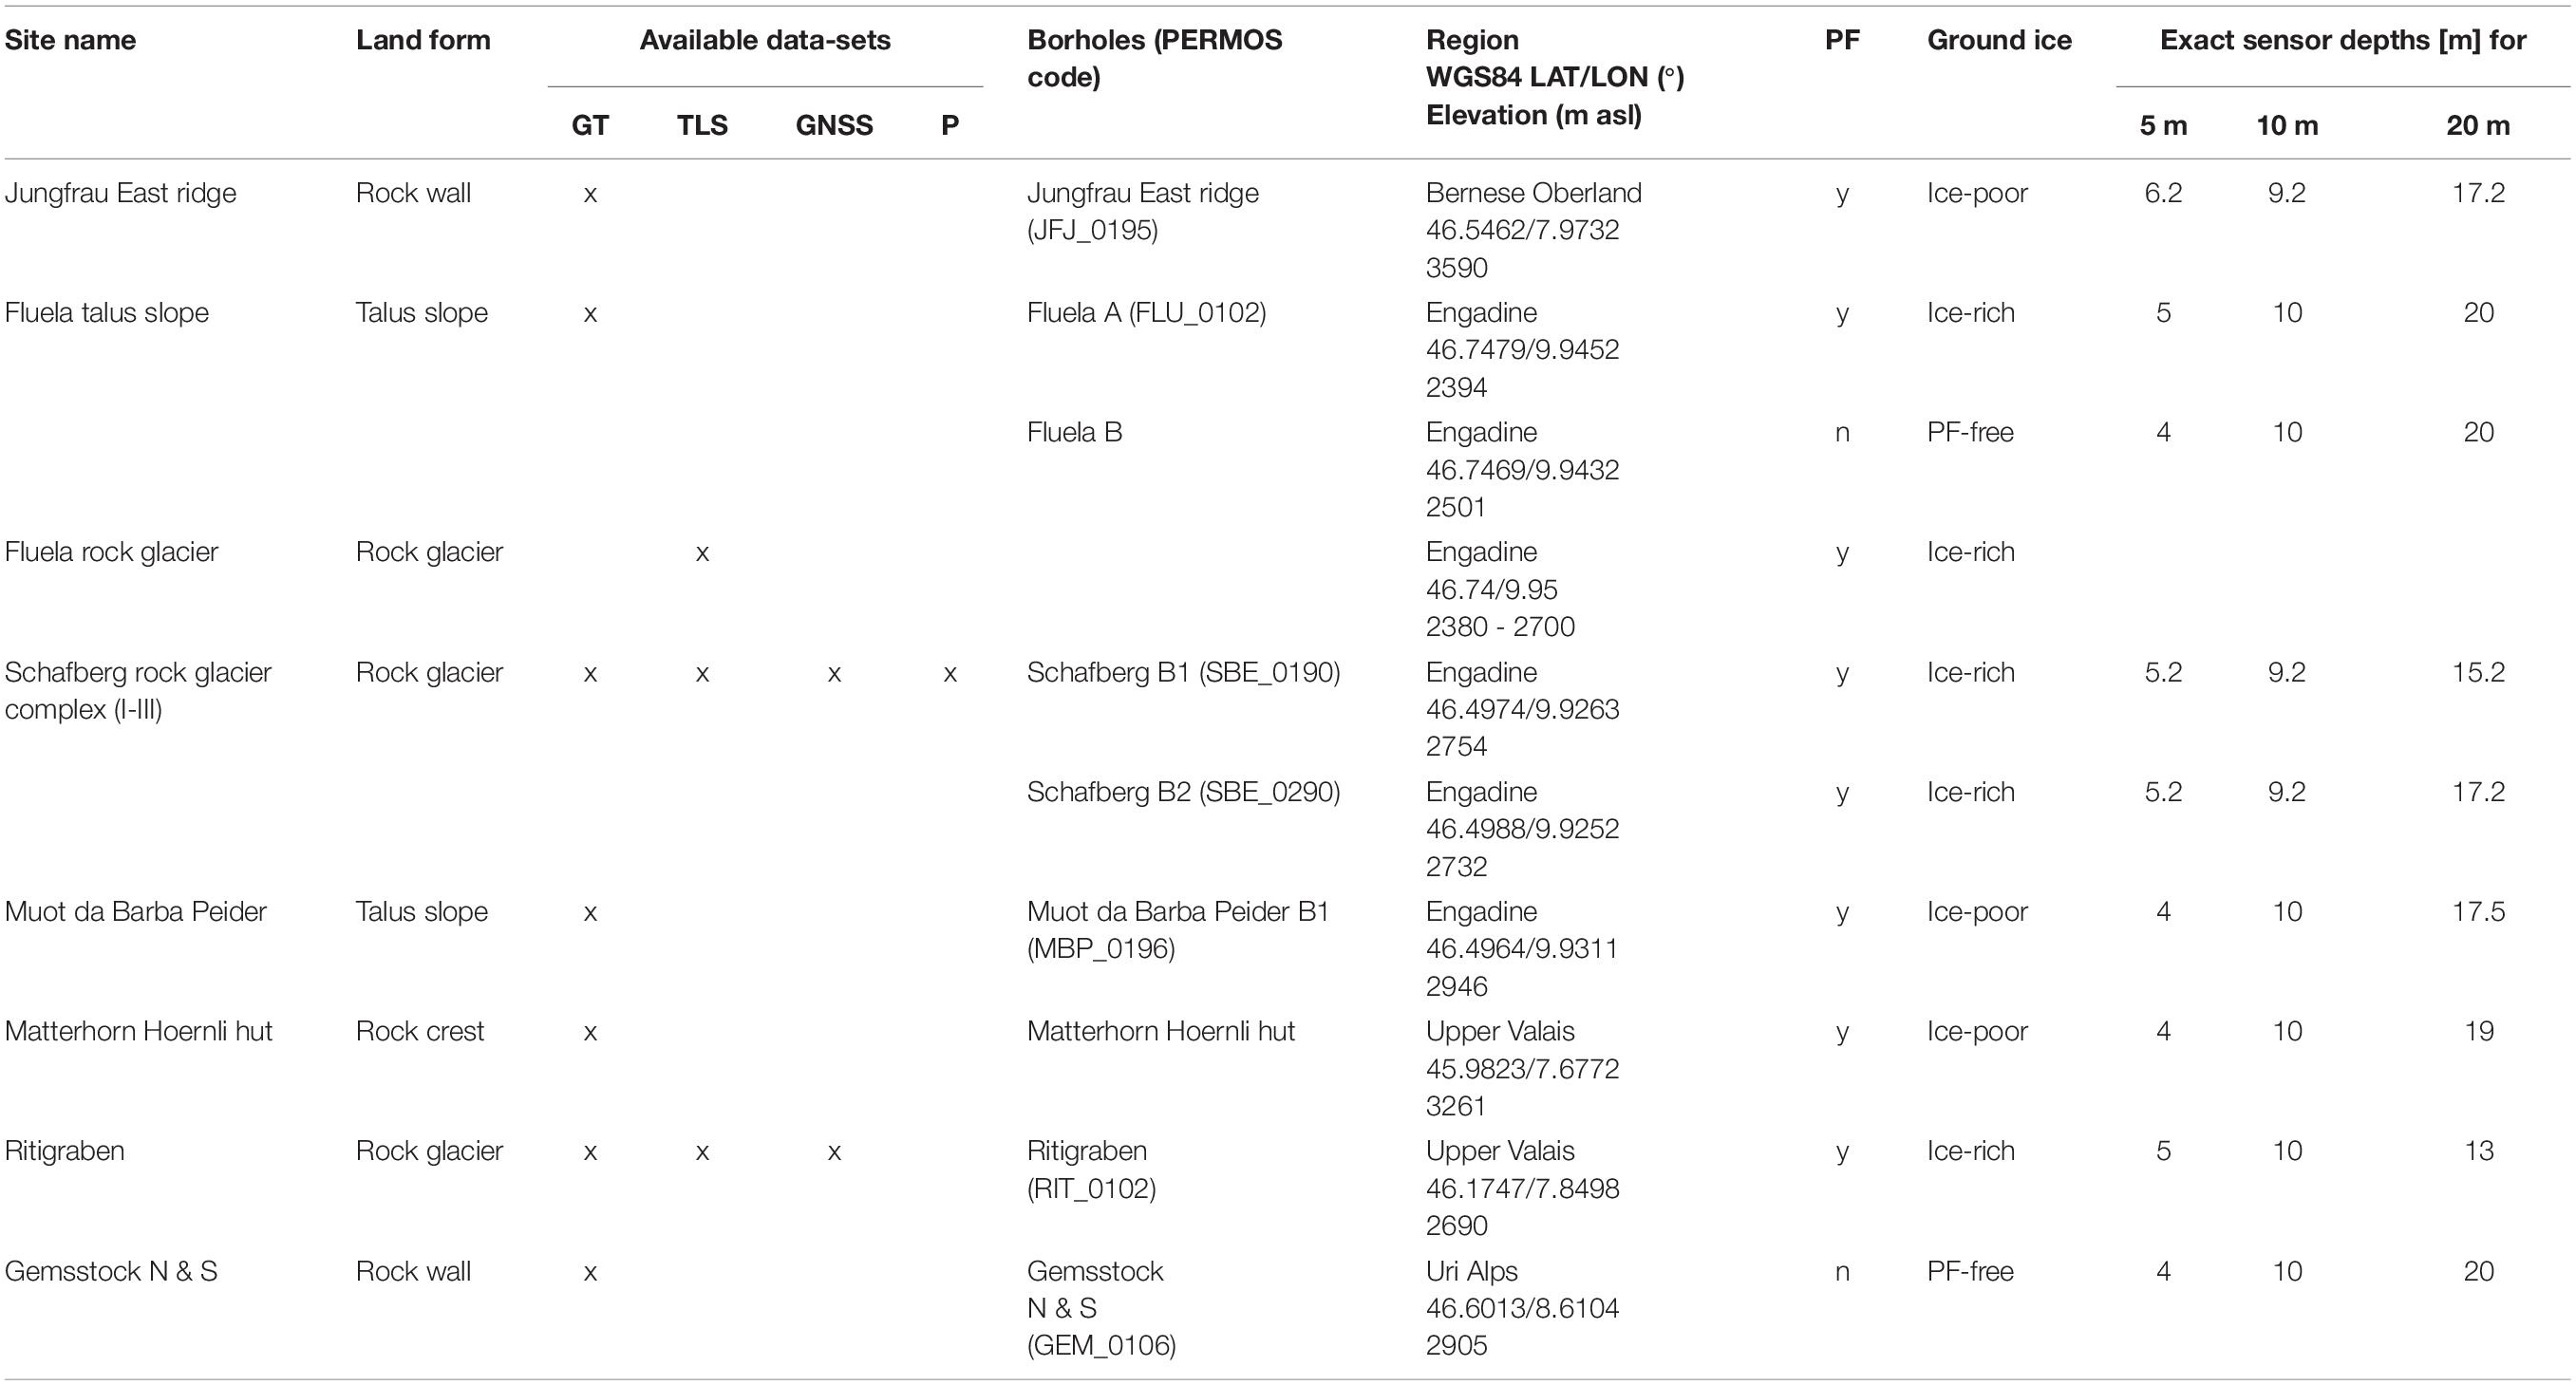
Table 1. Overview of the sites and data presented. The measurement methods carried out at each site are indicated with an “x.” The analyses of ground temperatures are based on measurements at depths around 5, 10, and 20 m. Here, the exact sensor depths are given. Abbreviations used: GT, ground temperature; PF, permafrost; y, yes; n, no; P, photogrammetry; N, north-west; S, south-east.
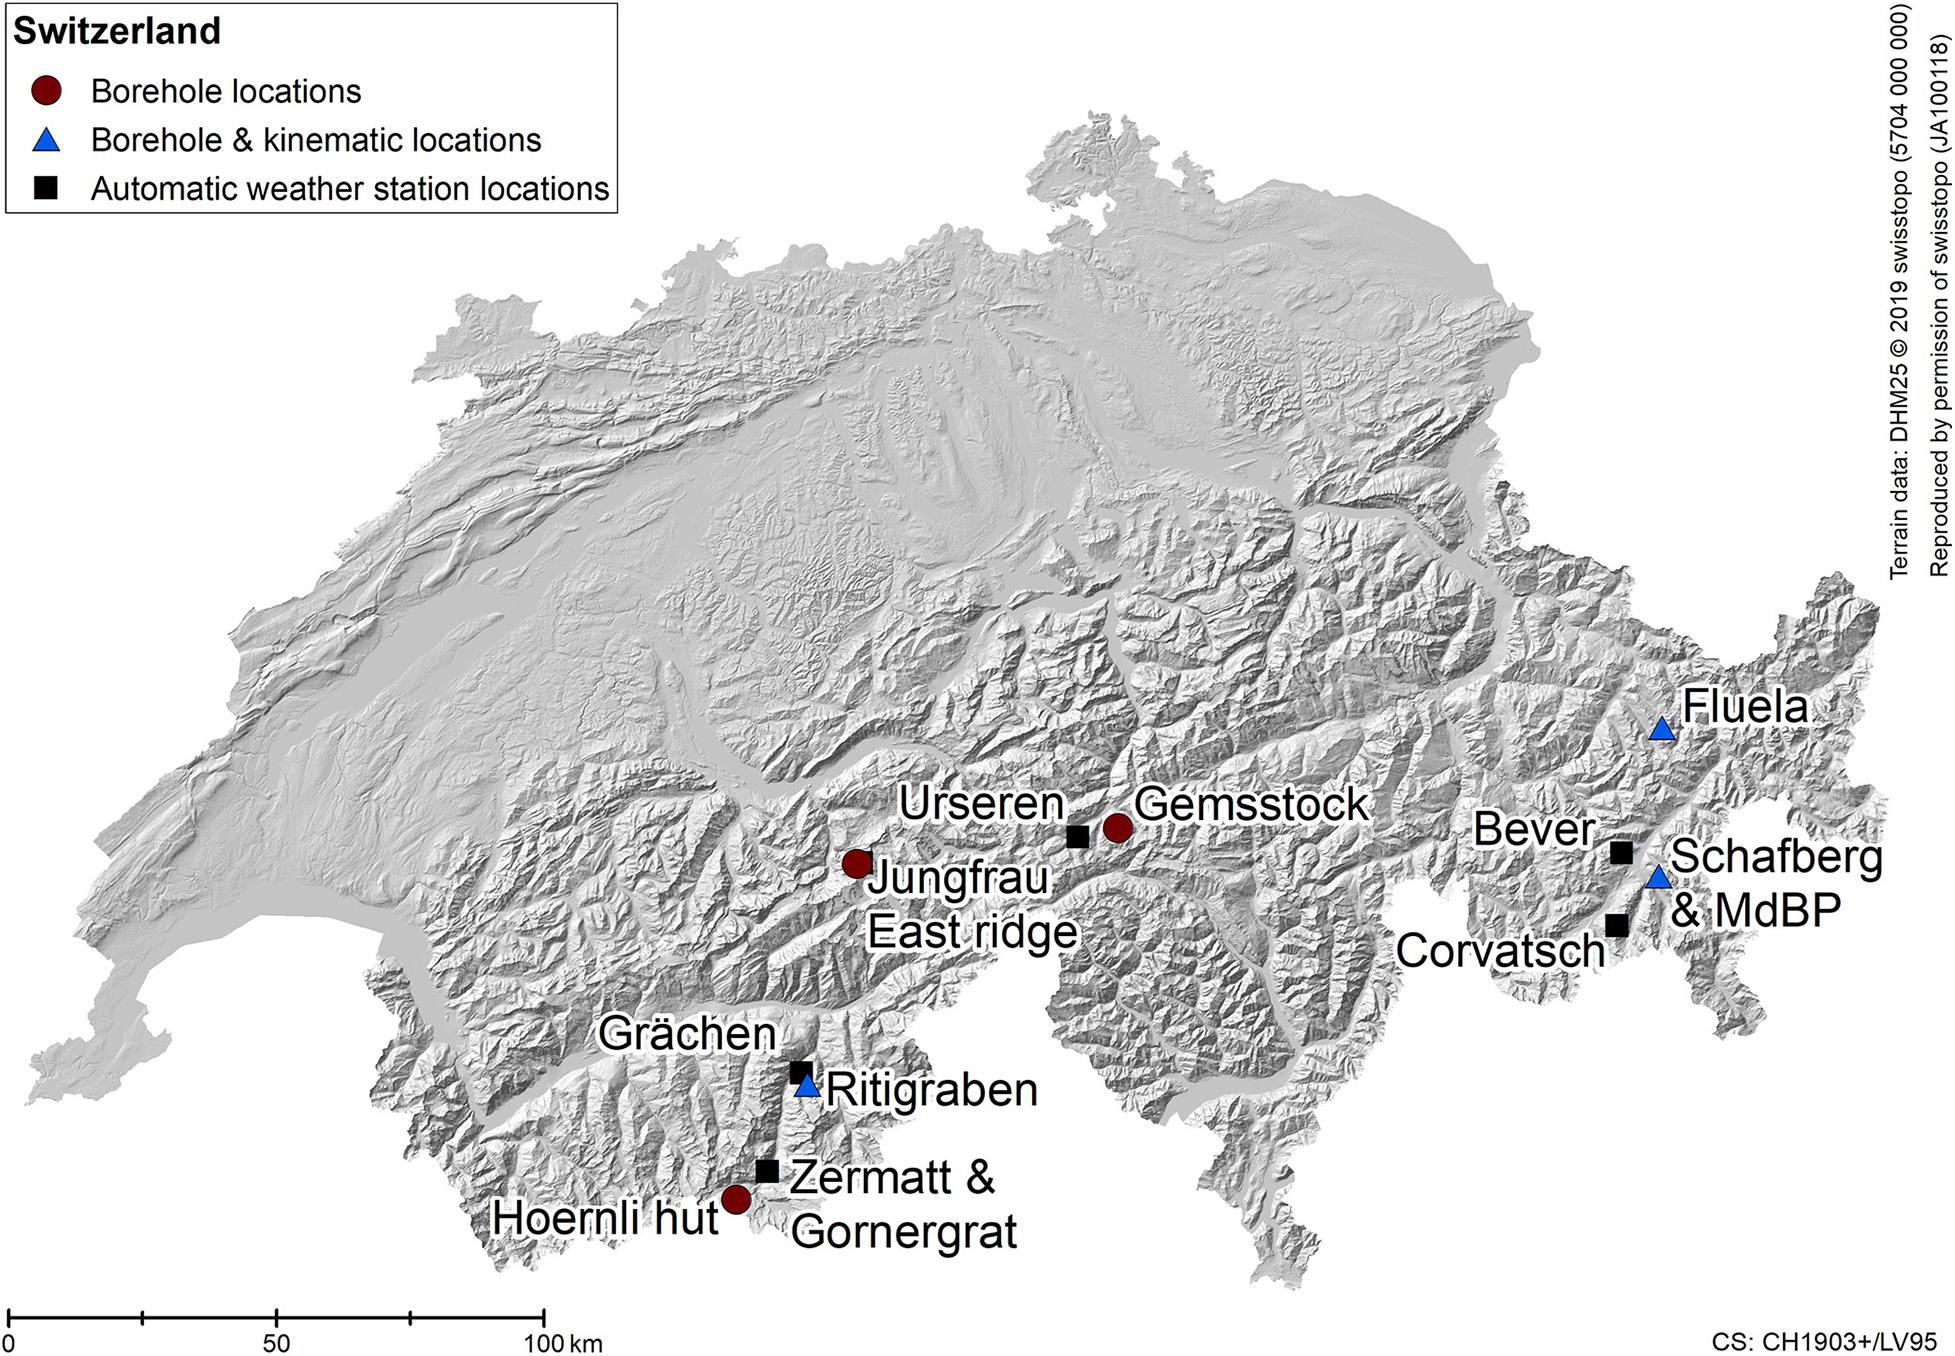
Figure 1. Overview of the borehole and kinematic sites presented here (Table 1) as well as the automatic weather stations used. Temperature and kinematic monitoring sites (blue triangles) include: ground temperature data, TLS, and GNSS observations. At borehole locations (red dots) only borehole temperature measurements exist. The Schafberg & MdBP site includes the boreholes Schafberg B1 and B2 as well as Muot da Barba Peider B1 (MdBP). The Jungfrau East ridge site includes the borehole as well as the automatic weather station at Jungfraujoch.
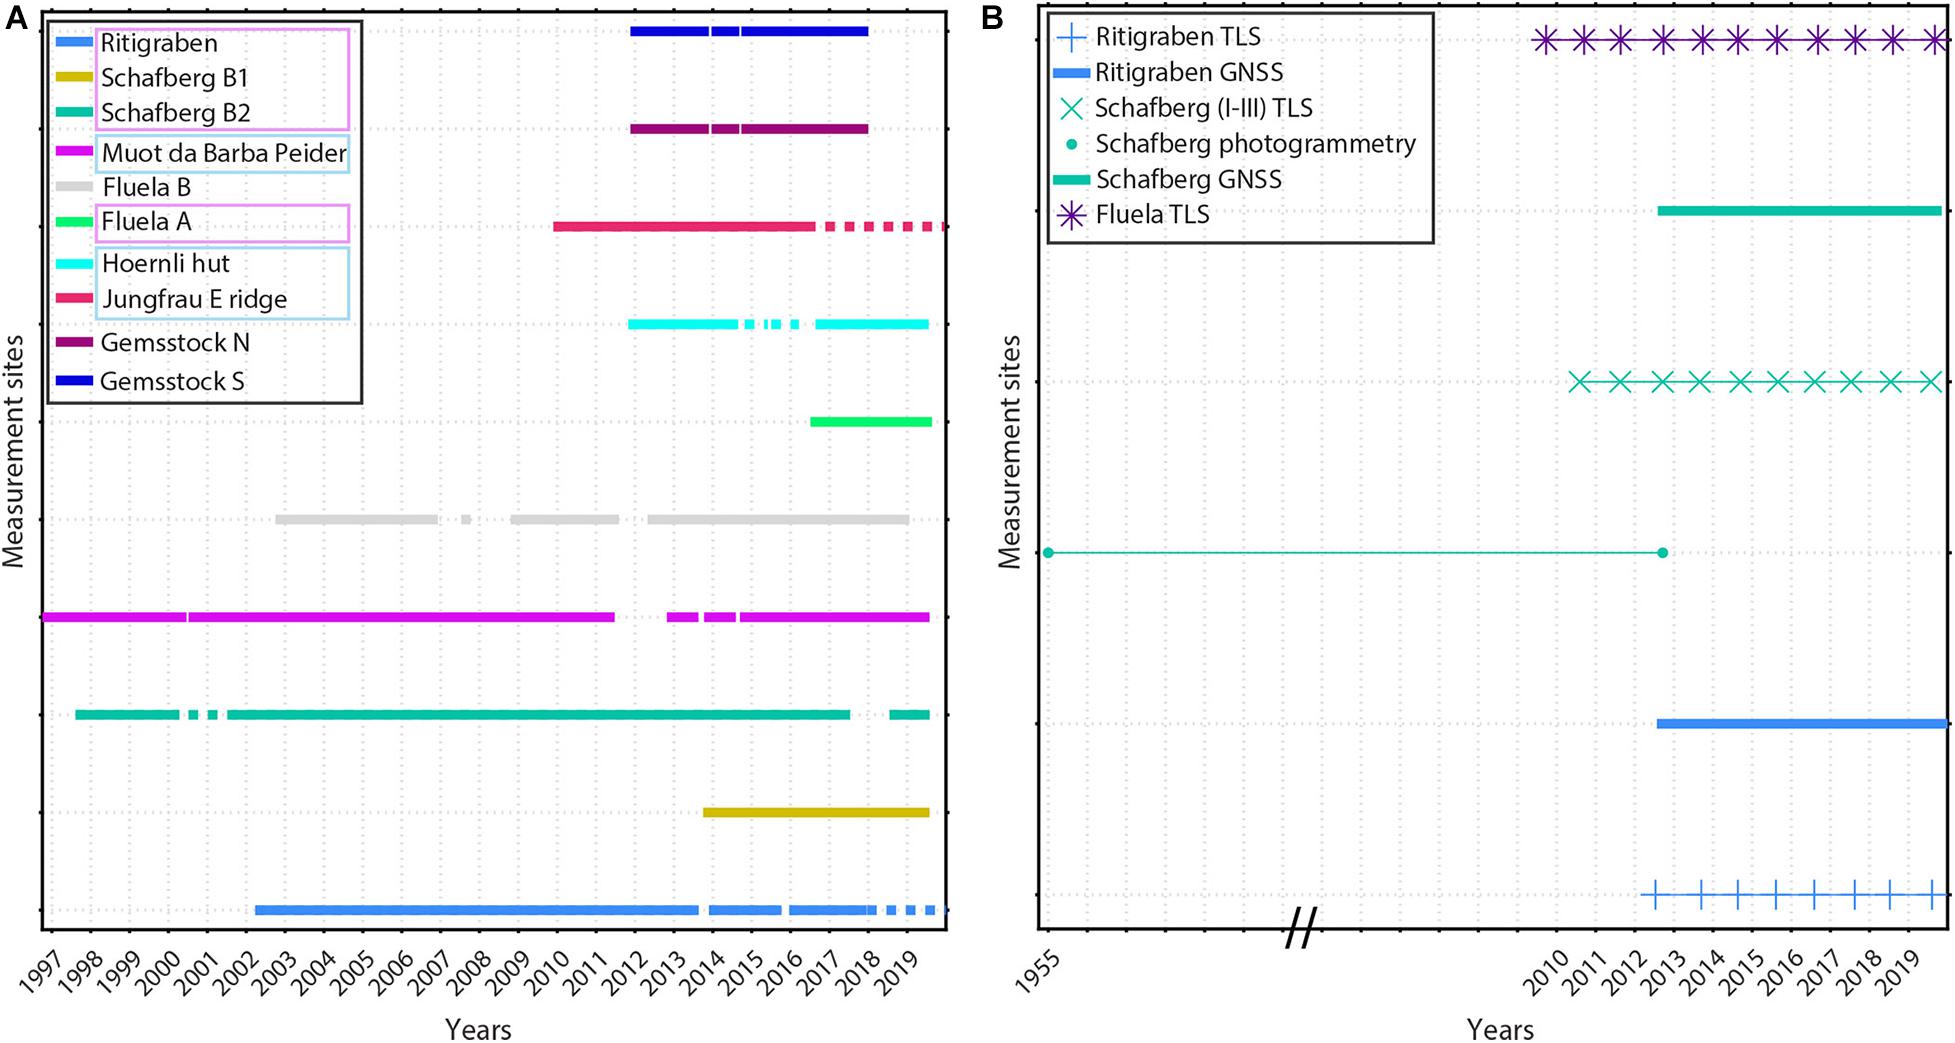
Figure 2. Overview of the data availability at the measurement sites. In (A) the continuous borehole ground temperature measurements are shown. Dotted lines denote that some data is missing, but not in all depths. The coloured frames indicate the ice content of the boreholes: pink for ice-rich, light blue for ice-poor, and no frame for permafrost-free locations. In (B) yearly observations with TLS and continuous data observations using GNSS are shown for the ice-rich rock glacier sites. At Schafberg data between 1955 and 2012 originates from swisstopo airborne images (photogrammetry). Please note that the x-axis scale is not linear between 1955 and 2012, as indicated by the two slashes.
The boreholes are mostly vertical, except in the Jungfrau East ridge, where the borehole was drilled sub-horizontally from a tunnel towards the outer ridge surface, and at Gemsstock, where a horizontal borehole pierces the ridge.
2.2 Geodetic Measurements
Terrestrial laser scanning was carried out once annually at the rock glaciers Ritigraben, Fluela and Schafberg to observe their kinematics (Figure 1). The Schafberg site contains a rock glacier complex with three independent rock glacier sections called Schafberg I-III according to their deformation vector fields and the geomorphologic characteristics. Two boreholes called Schafberg B1 and B2 are located in the Schafberg rock glacier. At Ritigraben and Schafberg annual TLS surveys are complemented by permanent GNSS devices installed on the rock glaciers. Thus, both annual and intra-annual signals can be captured. At Schafberg rock glacier historical aerial images are also available (section “3.3 Geodetic Measurements,” Figure 2B for data availability).
2.3 Meteorological Measurements
Homogenised data series of mean annual air temperature anomalies from the long-term climatic mean 1981–2010 are provided by MeteoSwiss. The MeteoSwiss automatic weather stations Jungfraujoch (Bernese Oberland, 3580 m a.s.l.), Piz Corvatsch (Engadine, 3302 m a.s.l.), Grächen (Upper Valais, 1605 m a.s.l.) and Zermatt (Upper Valais, 1638 m a.s.l.) are used in the analysis. Further, snow depth data from the Intercantonal Measurement and Information System (IMIS) are used from the IMIS automatic weather stations Bever (Engadine, 2510 m a.s.l.), Gornergrat (Upper Valais, 2950 m a.s.l.) and Urseren (Uri Alps, 2170 m a.s.l.) for the four winter seasons 2016–2019 in order to show the influence of the snow cover on ground temperatures. These stations are closest to and most representative for our study sites (Figure 1).
3 Methods
3.1 Ground Temperature Measurements in Boreholes
All boreholes are instrumented with high precision thermistors (e.g., Yellow Springs Instruments 48006/8 thermistors) or digital temperature sensors (Campbell CS225) measuring temperature at various depths. Temperatures are recorded by a Campbell CR10X or C1000 data logger, powered by two 12-volt crystal lead batteries.
In addition to the above described thermistor chains, miniature-temperature loggers Type UTL-3 (www.utl.ch) or BLE (‘Bluetooth Low Energy’, developed at SLF) are installed in several boreholes for duplicate measurements allowing to backup or validate the data recorded by the temperature sensor strings.
All temperature sensors and miniature temperature loggers were single-point calibrated at 0°C in an ice-water bath before installation and all measurement systems have a precision of ± 0.1°C. Wherever possible, the original temperature sensor chains are recalibrated if the data look questionable and if the sensors can be extracted from the borehole. This allows to determine whether the sensors are still functioning well or drifting and thus which data has to be discarded (section “3.2.2 Sensor Drift”).
Ground temperature evolution varies considerably at different borehole depths. We focus on the following depths: 5, 10, and 20 m (see Table 1 for exact depths). At 5 m depth short-term and intra-annual ground temperature variations (e.g., weekly) can be observed, which are mostly driven by atmospheric fluctuations (changes in air temperature or snow cover). 10 and 20 m are established depths for permafrost assessments (PERMOS, 2019). While at around 10 m depth seasonal ground temperature variations can be observed, at 20 m depth ground temperature changes are governed by long-term changes at the surface and a seasonal signal is hardly visible (zone of zero annual amplitude).
3.2 Ground Temperature Data Processing
3.2.1 Pre-processing
Recording intervals of ground temperatures range between 1 and 24 hours depending on the borehole instrumentation. Data gaps shorter than 72 hours are filled by linear interpolation at the original measurement intervals. Data gaps exceeding 72 hours are filled by linear interpolation for depths below 4 m and time periods shorter than 30 days. Ground temperature data were aggregated to daily means for our analysis.
The evolution of annual minimum and maximum ground temperatures (section “4.2.3 Minimum and Maximum Ground Temperatures at 10 m Depth”) is shown at 10 m depth because amplitudes are damped and seasonal variations are best visible here. For the detection of temperature minima and maxima ground temperatures cannot be interpolated.
3.2.2 Sensor Drift
It is important to exclude measurement errors caused by sensor drift when assessing warming permafrost ground (e.g., climate-induced or artificially induced by infrastructure) (Luethi and Phillips, 2016). A validation of the temperature data and rough in-situ ‘calibration’ at 0°C can be done in the active layer, where phase change occurs twice a year. In the case of the Hoernli hut borehole (Figure 3) increasing positive deviations from 0°C clearly indicate sensor drift. Duplicate measurements were therefore carried out in the borehole using additional miniature UTL-3 loggers (section “3.1 Ground Temperature Measurements in Boreholes”) from 2016 onwards for comparison with the measurements of the installed thermistor string (Figure 3; Noetzli et al., 2021). The UTL-3 loggers measured an active layer thickness of 1.5 to 2.0 m between 2016 and 2019, which is in the range of the active layer thickness observations before 2014 (section “4.2.2.1 Active Layer Thickness”). The duplicate measurements confirmed the occurrence of drift and ‘active layer thickening’ from 2014 onwards was thus proven false. Therefore, all data analysed here from the Hoernli hut borehole include thermistor data in the years 2012 and 2013, while from 2016 onwards UTL-3 logger data is used.
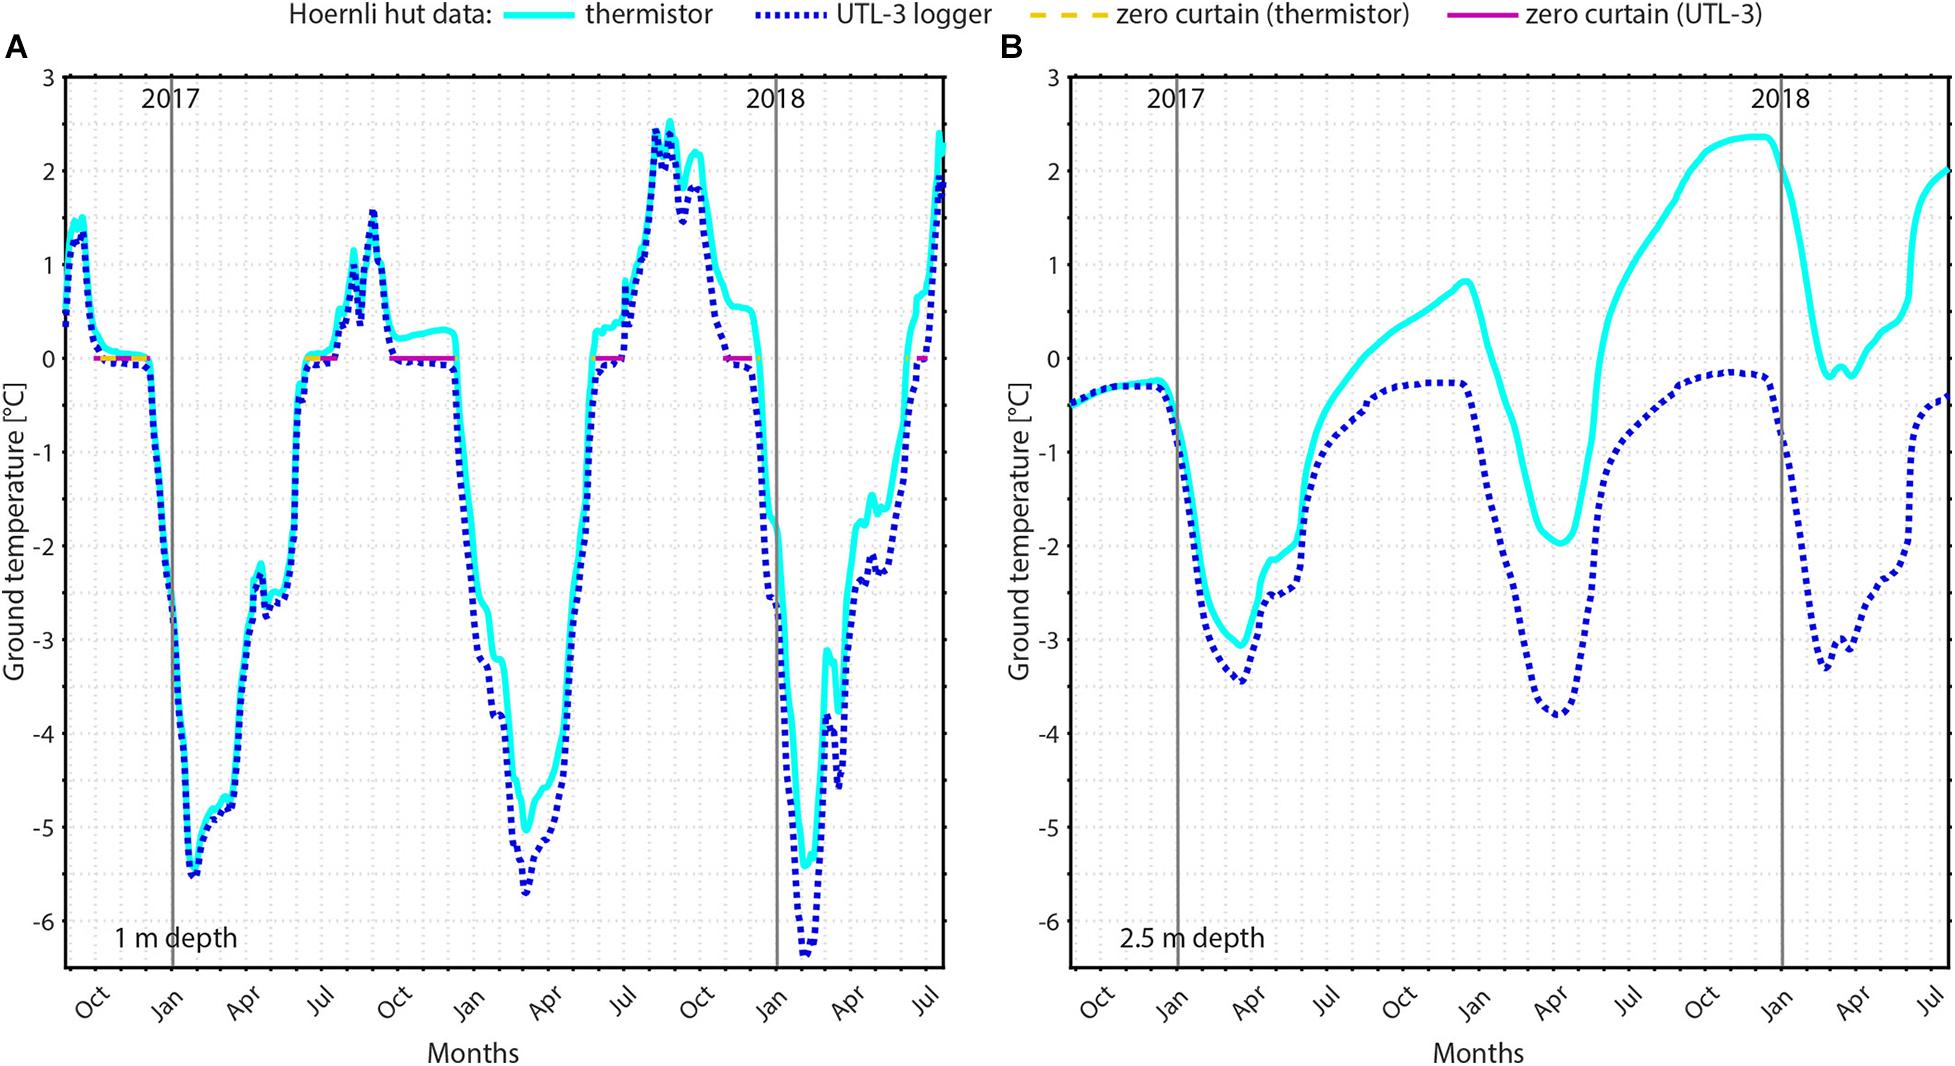
Figure 3. Evolution of ground temperatures measured in the Hoernli hut borehole at (A) 1 m and (B) 2.5 m depth between September 2016 and July 2019. To verify the thermistor measurements (light blue lines) temporary UTL-3 loggers (dark blue dotted lines) were installed in parallel. Yellow dashed (thermistor) and solid purple (UTL-3) lines indicate zero curtains.
3.2.3 Running Means and Linear Trends
The centered 365-day running mean of ground temperatures measured at varying depths in the different boreholes are calculated, meaning that ground temperatures for a specific date and borehole reflect the mean of the 182-day period before and after the date. Based on these running means, linear ground temperature trends are calculated and periods without data are ignored.
3.2.4 Determination of Active Layer Thickness
The active layer thickness is the maximum annual thawing thickness of the ground above the permafrost body. The active layer thickness is calculated by linear interpolation between adjacent temperature sensors in a borehole: one located in the active layer and the nearest sensor in the underlying permafrost. The closer the active layer thickness is to the lower of the two thermistors, the higher the accuracy of the interpolated active layer thickness is, especially for ice-rich sites (section “4.2.2.1 Active Layer Thickness”). It must be emphasised that this linear method does not account for latent heat effects due to phase change at the permafrost table nor for non-linear temperature profiles (section “5.1 Evolution of Ground Temperatures”). Results should be considered approximations to the actual active layer thickness, but nonetheless represent the order of magnitude of the active layer thickness and portray the active layer thickness evolution for a borehole. To verify the active layer thickness calculation done using linear interpolation, in the borehole Fluela A multiple miniature BLE temperature loggers (section “3.1 Ground Temperature Measurements in Boreholes”) were temporarily installed between the lowest thermistor located in the active layer at 2 m depth and the highest thermistor located in permafrost at 3 m depth with a spacing of 0.2 m (section “4.2.2.1 Active Layer Thickness”). Active layer thickness could not be calculated for sites lacking sensors in the active layer (Jungfrau East ridge; partly Muot da Barba Peider B1) and for permafrost-free sites. Although this linear interpolation method has its limitations, it is widely used in ground temperature analyses in mountain permafrost regions where active layer thickness has to be determined based on interpolation from borehole temperature measurements (e.g., PERMOS).
3.2.5 Mean Annual Active Layer Thickness
We introduce and calculate the mean annual active layer thickness for all the permafrost boreholes. The mean annual active layer thickness is calculated as the mean of the daily active layer thickness during one calendar year using Equation 1, although the linear interpolation method has its limitations especially at ice-rich sites, as discussed above. Mean annual active layer thickness is used as a proxy for the duration and intensity of the annual ground thawing and its inter-annual variations. While the active layer thickness provides only the maximum depth of the seasonally thawed ground (section “3.2.4 Determination of Active Layer Thickness”), the mean annual active layer thickness additionally accounts for the length and intensity of the ground thawing period.
t is the time in [days], MAALT is the mean annual active layer thickness in [m] and ALT is the active layer thickness in [m]. Note that in some boreholes taliks occur below the active layer (section “4.3 Taliks in Permafrost”), and these have not been considered, as they are not part of the active layer. In addition, years with missing active layer data have been discarded.
3.2.6 Zero Curtain
The zero curtain was determined at the depth of the lowest sensor in the active layer for days with ground temperatures varying between ± 0.1°C. No zero curtain is shown for sites without sensors in the active layer (Jungfrau East ridge, partly Muot da Barba Peider B1) and permafrost-free sites, as well as during years with one continuous zero curtain (e.g., at Schafberg B1 and B2).
3.3 Geodetic Measurements
3.3.1 Terrestrial Laser Scans
Terrestrial laser scanning was used to quantify surface changes such as the rock glacier velocity or subsidence due to ground ice loss. Scans were performed annually and provided high resolution (<0.1 m) point clouds, representing the terrain surface. The point clouds were co-registered in the commercial software RiScanPro provided by Riegl using a modification of the iterative closest point algorithm (Chen and Medioni, 1991). Grid-based vertical and vector-based horizontal surface changes were calculated in ESRI ArcGis and Matlab according to Kenner et al. (2014). From 2009 to 2012 the Riegl long-range laser scanner LPM321 was used, and from 2013 onward the Riegl long-range laser scanner VZ6000. The change of instrument induced an increase in accuracy and a better representation of surface structures (smaller laser footprints).
From the TLS deformation vector fields relative rock glacier velocity time series were calculated for the rock glaciers Fluela, Schafberg and Ritigraben. Depending on the threshold for the smallest deformation value included in the calculation, results can significantly disturb the relative rock glacier velocity time series because of: (1) the accuracy of the TLS measurement and (2) the difference in weighting between slow and fast sectors of the rock glacier (different parts often show varying annual variations of movement). Considering these points, we applied two assumptions to determine the threshold for the smallest vector used for calculation: (1) the standard deviation between a relative rock glacier velocity time series calculated with this threshold and a relative value time series calculated with a 1 cm higher threshold is lower than 10%. (2) The threshold is higher than 10% of the maximal rock glacier velocity. Thus, relative rock glacier velocity time series have been calculated while excluding the vectors smaller than: 4 cm (Fluela and Schafberg I); 30 cm (Ritigraben); and 2 cm (Schafberg II and III).
3.3.2 Photogrammetry
Multi-annual rock glacier velocity between 1955 and 2012 at rock glacier Schafberg was quantified using historical aerial images provided by the Swiss Federal Office of Topography (swisstopo). These images were orthorectified with the help of locally defined ground control points using the photogrammetric software Erdas Imagine. Horizontal deformations between the multi-temporal, orthorectified images were defined correlating the colour pattern of the images (Kenner et al., 2014).
3.3.3 In-situ Global Navigation Satellite System
At the study sites Schafberg and Ritigraben, single-frequency GNSS receivers were installed. They were mounted on 1.5 m high poles together with a two−axis inclinometer and located on large boulders which are snow free all year round. The GNSS data was processed with the Bernese GNSS Software (Dach et al., 2015), based on single-frequency differential carrier phase techniques. Reference data for the differential processing was provided by a local base station 5.8 km away from Ritigraben and by the GNSS station SAM2 of the Automated GNSS Network for Switzerland (AGNES), 5.2 km away from the Schafberg site. While the Ritigraben base station has almost no elevation difference to the Rover, the GNSS station SAM2 is about 1100 m lower than the Schafberg Rover. The GNSS velocities analysed here are based on daily static coordinates. The uncertainty (standard deviation) of the daily GNSS coordinate computation is about 1–2 mm in the horizontal component and 2–3 mm (Ritigraben) or 4 mm (Schafberg) in the vertical one.
The GNSS data time series of daily coordinates was smoothed using an 11-day (at Ritigraben) and 31-day (at Schafberg) running mean to filter small scale measurement noise. Subsequently, horizontal rock glacier velocities were calculated between the first and the last coordinates of an 11- or 31-day window. These different time intervals proved to be long enough to provide significant rock glacier velocities as well as seasonal variations. The 31-day window was used for the Schafberg rock glacier because of its lower velocity (section “4.4 Rock Glacier Dynamics”) and the stronger measurement noise, caused by the lack of a local reference station at this site. In addition, continuously measured GNSS data is used to normalise the rock glacier deformation rates derived from TLS to a 365-day interval at Ritigraben and Schafberg rock glaciers, while linear interpolation is used where no GNSS data is available (Fluela rock glacier).
4 Results
4.1 Meteorological Conditions (Climate)
The last two decades have been the warmest at a global scale since the start of the meteorological records in the 18th century (Dunn et al., 2019; WMO, 2019). The same applies for Switzerland, where the air temperature increase is particularly strong at MeteoSwiss automatic weather stations above 1000 m a.s.l. (MeteoSwissWeb, 2020). During our observation period (1997–2019) only 5 years had mean annual air temperature below the climatic average 1981–2010. All Swiss regions show a similar air temperature evolution with an increase of frequency and magnitude of positive temperature anomalies, especially during the end of the observation period (Figure 4). Summer heat waves and drought clearly increased, such as in 2003, 2015 and 2018 (MeteoSwissWeb, 2020), which were the warmest summers registered since the start of measurements in Switzerland in 1864.
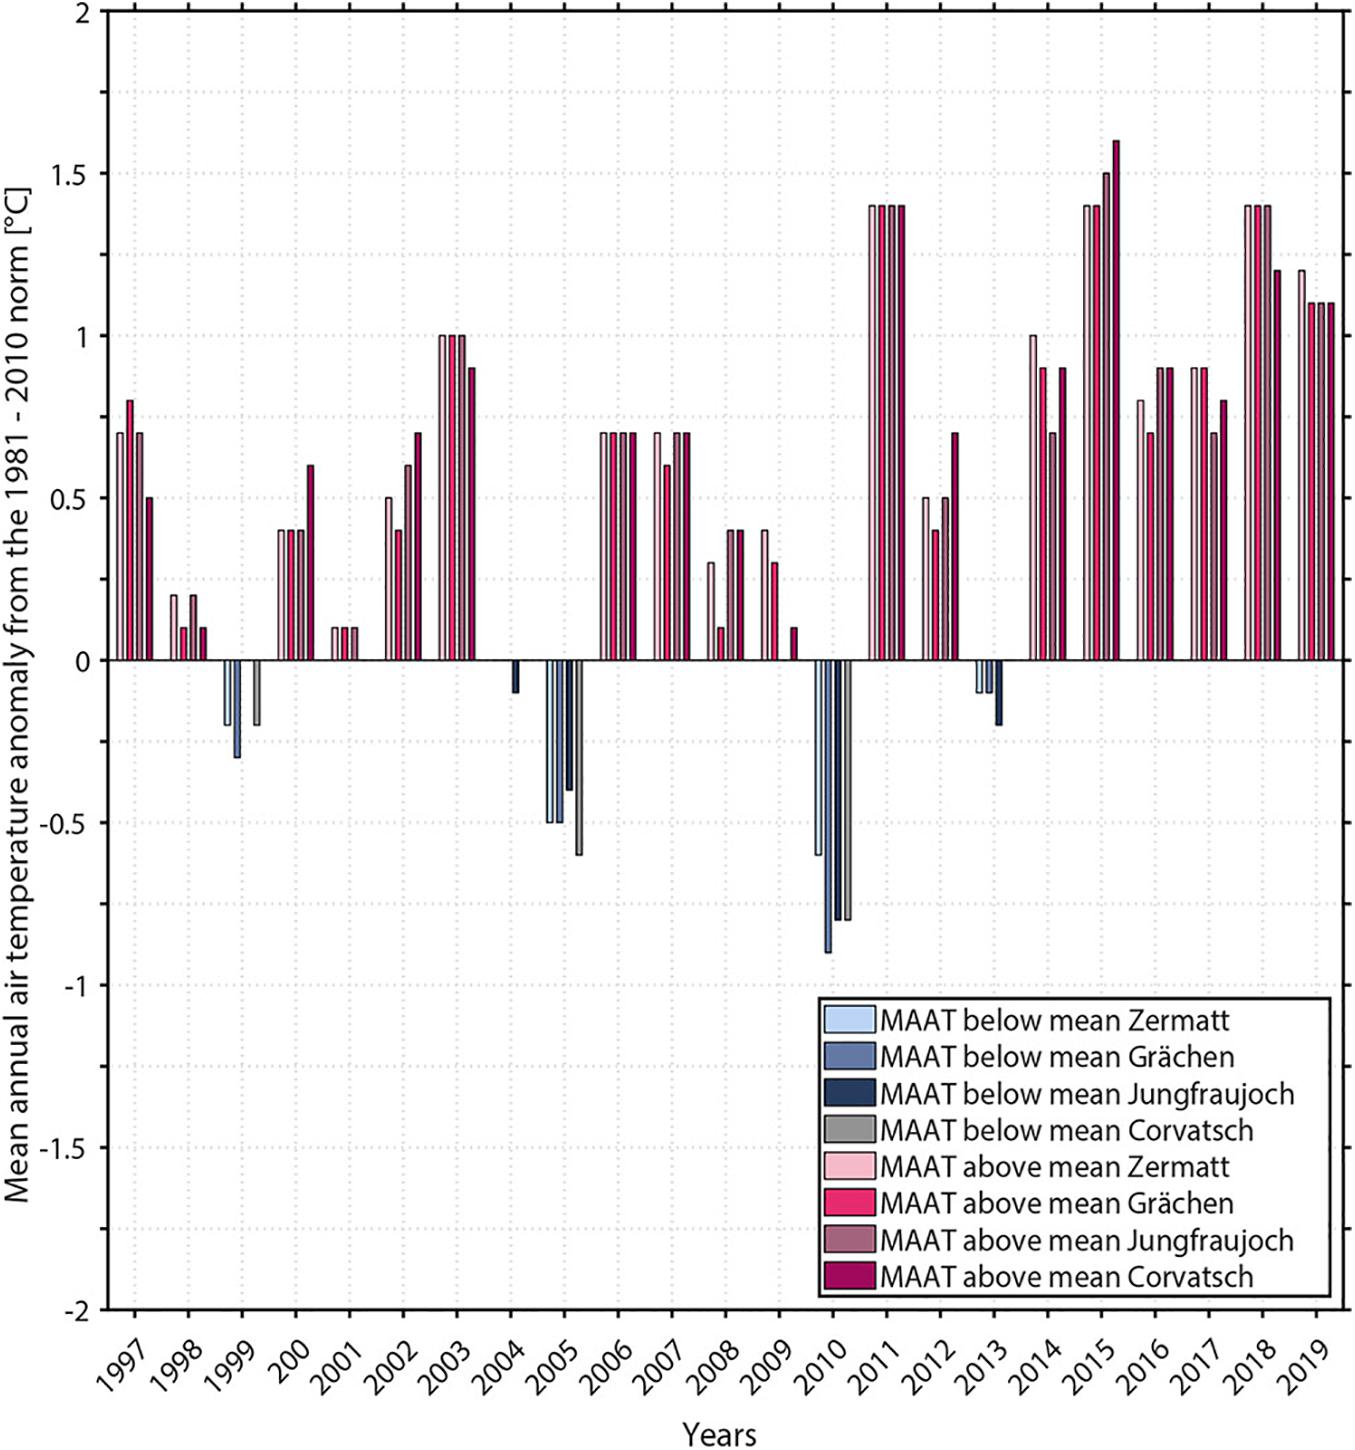
Figure 4. Mean annual air temperature (MAAT) anomalies from the 1981–2010 norm based on homogenised data series from the MeteoSwiss automatic weather stations Jungfraujoch, Piz Corvatsch, Grächen, and Zermatt. All reddish bars show temperatures above and all bluish bars below the respective climate station mean.
In Figure 5 snow depth evolution during four consecutive winters (2016–2019) with strongly varying snow conditions is shown and its strong influence on ground temperatures and thus permafrost conditions is discussed in section “4.2 Ground Temperatures” and section “5.1 Evolution of Ground Temperatures.” In the hydrological years 2015–2016 and 2016–2017 a continuous snow cover established towards the end of January and beginning of February in the Swiss Alps (except in the Western Alps in 2015–2016). Snow depths were below average throughout the winter season. In combination with very low air temperatures in January 2015 and 2016, the ground cooled effectively. In contrast, in the hydrological years 2017–2018 and 2018–2019 a continuous snow cover was already established in November, enabling early and efficient ground insulation. Snow-rich Decembers and Januaries contributed to above average snow depths in the entire Swiss Alps.
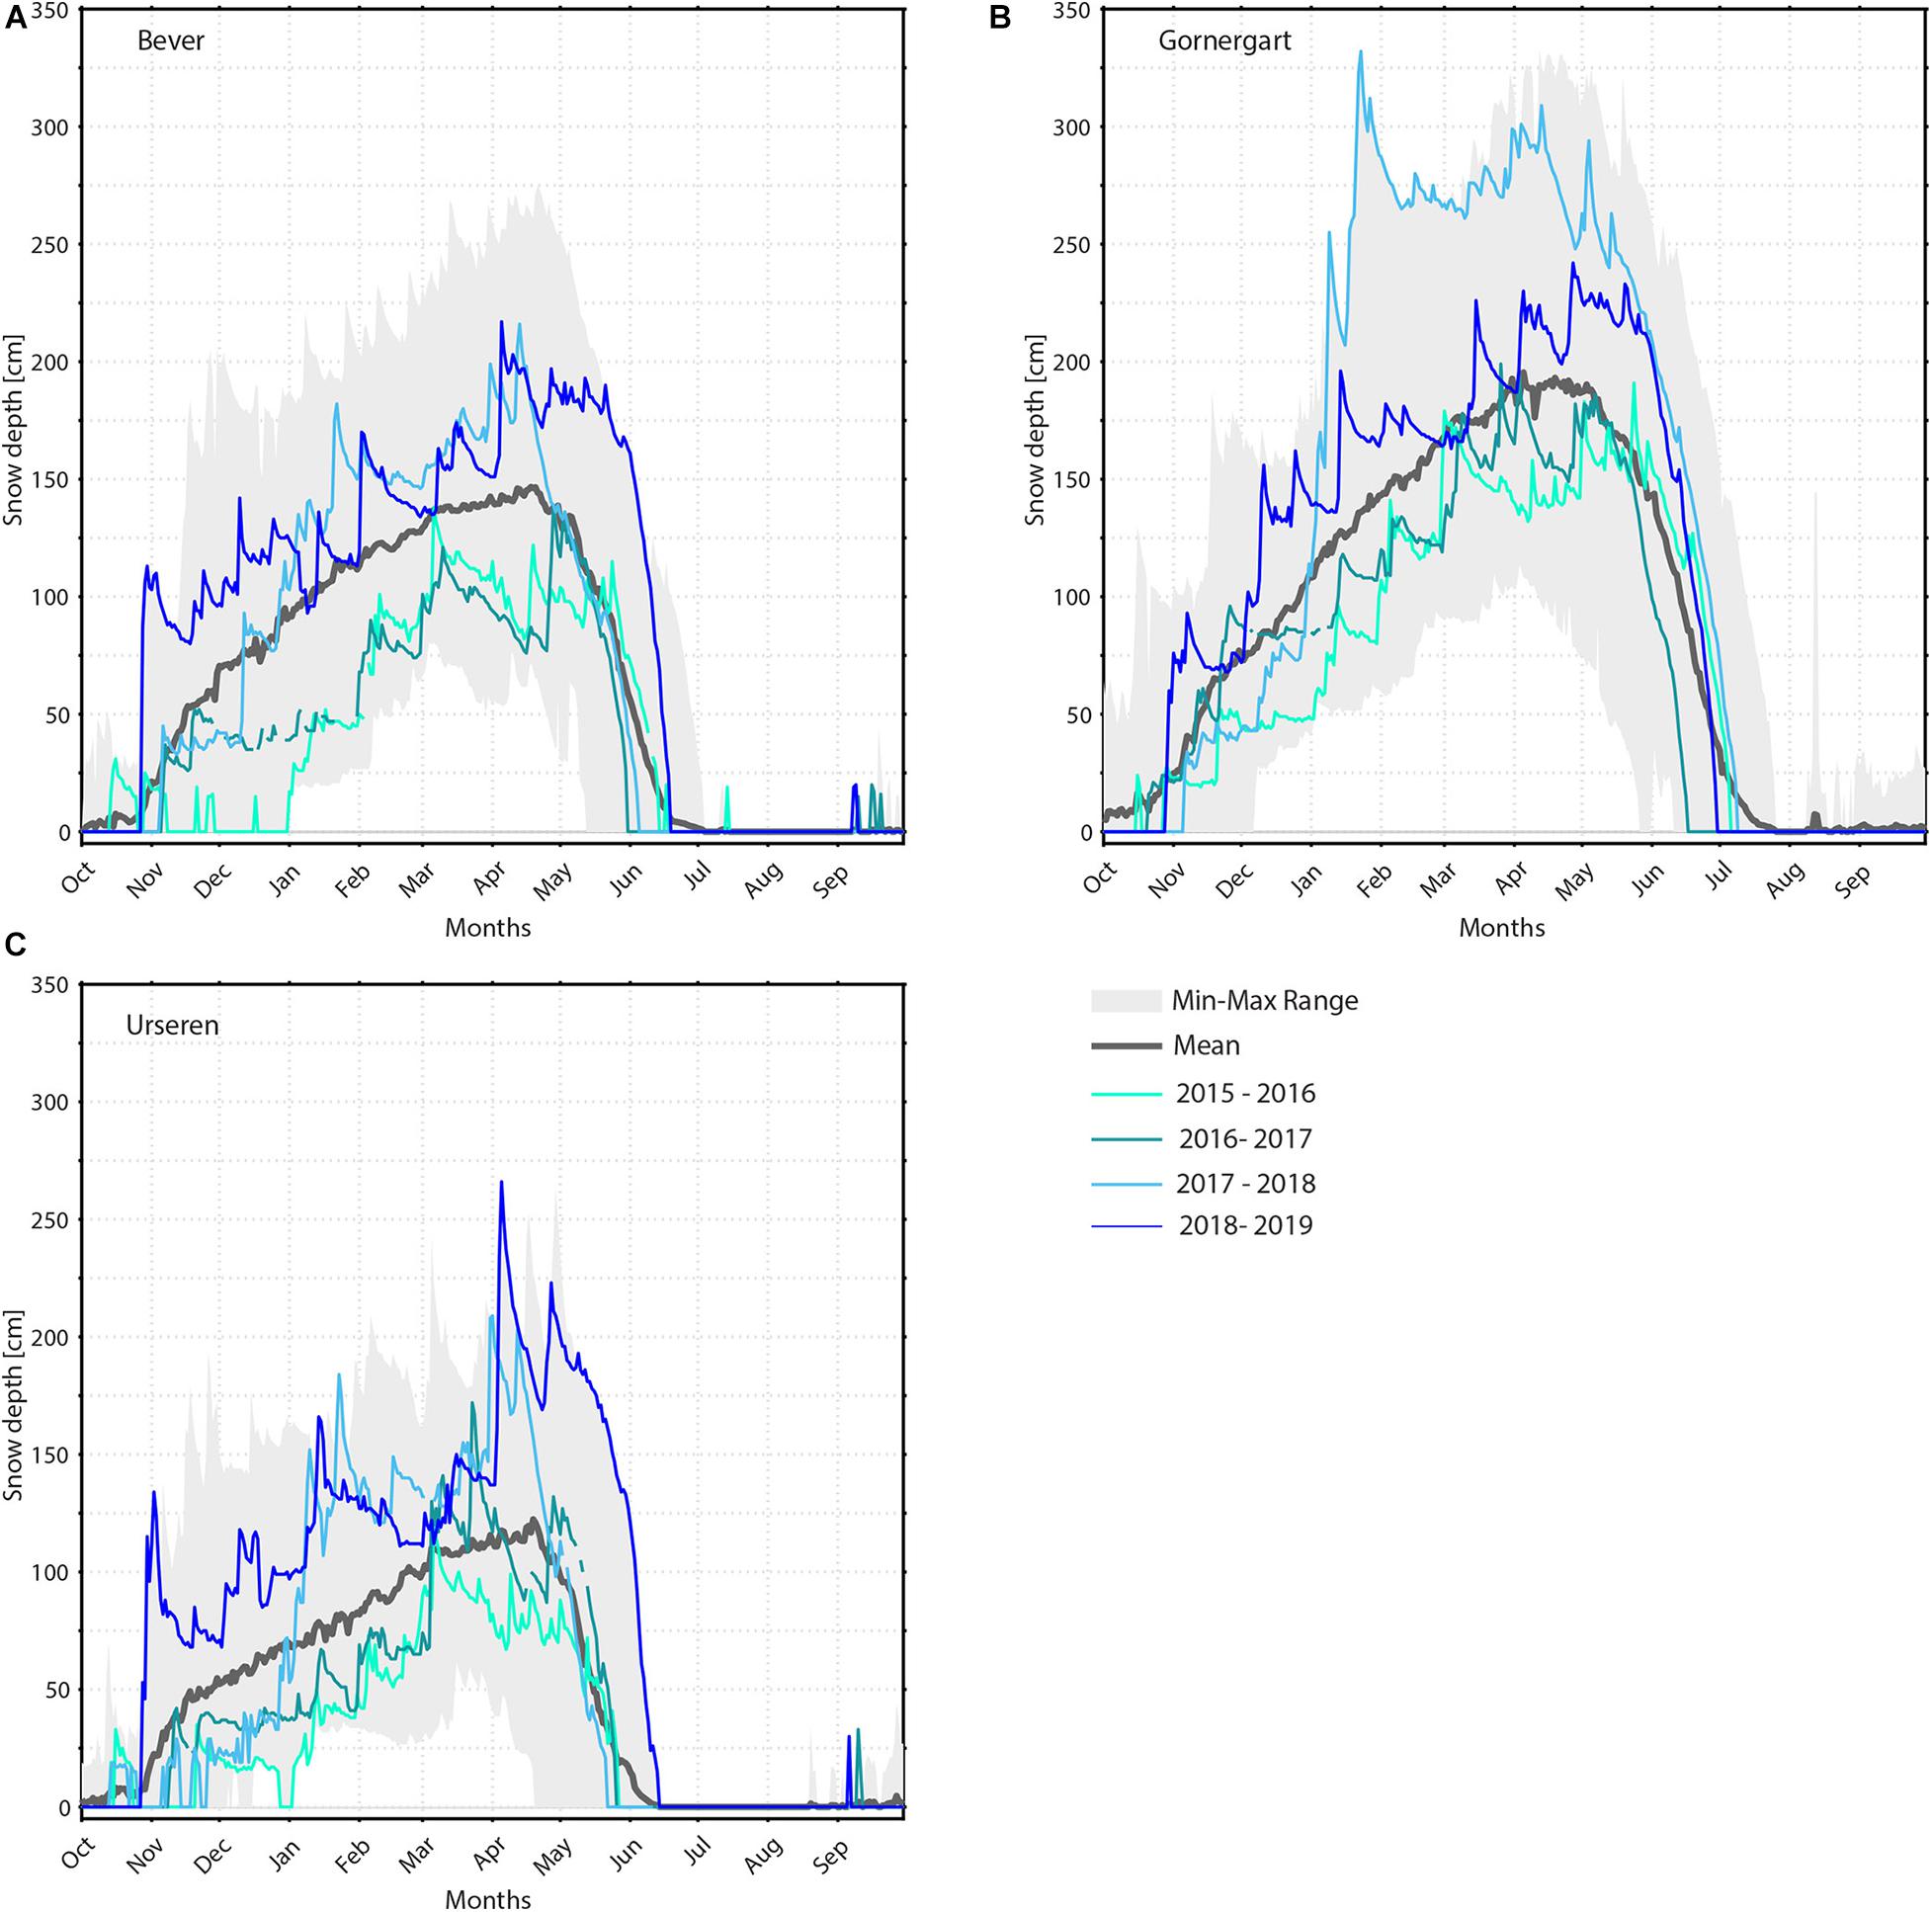
Figure 5. Snow depth at three IMIS stations during the four winter seasons 2016–2019 with both snow-poor and snow-rich conditions: (A) Bever (Engadine), (B) Gornergrat (Upper Valais), and (C) Urseren (Uri Alps). The grey thick line is the mean snow depth and the grey shaded area the minimum and maximum range (Min–Max Range) for the entire observation period 1997–2019. Data is shown for the hydrological year.
4.2 Ground Temperatures
4.2.1 Evolution of Ground Temperatures
In the ice-rich permafrost boreholes Ritigraben, Schafberg B1, Schafberg B2 and Fluela A (Table 1) ground temperature evolution is similar at varying depths with rather small seasonal ground temperature variations (Figure 6). Here ground temperatures are close to 0°C. Latent heat is consumed during phase change before ground temperatures can rise above the melting point, thus reducing temperature variations. Ground temperatures undergo higher variations at ice-poor permafrost locations (Figure 6). Ground temperatures measured in ice-poor permafrost (Muot da Barba Peider B1, Hoernli hut, Jungfrau East ridge; Table 1) as well as at permafrost-free sites (Gemsstock, Fluela B; Table 1) mainly increase for the entire ground temperature series, with only short interruptions. The ground temperature increase is especially pronounced in the ice-poor rocky Jungfrau East ridge. Here ground temperature increases stagnated, however, between 2016 and 2018 (section “5.1 Evolution of Ground Temperatures”).
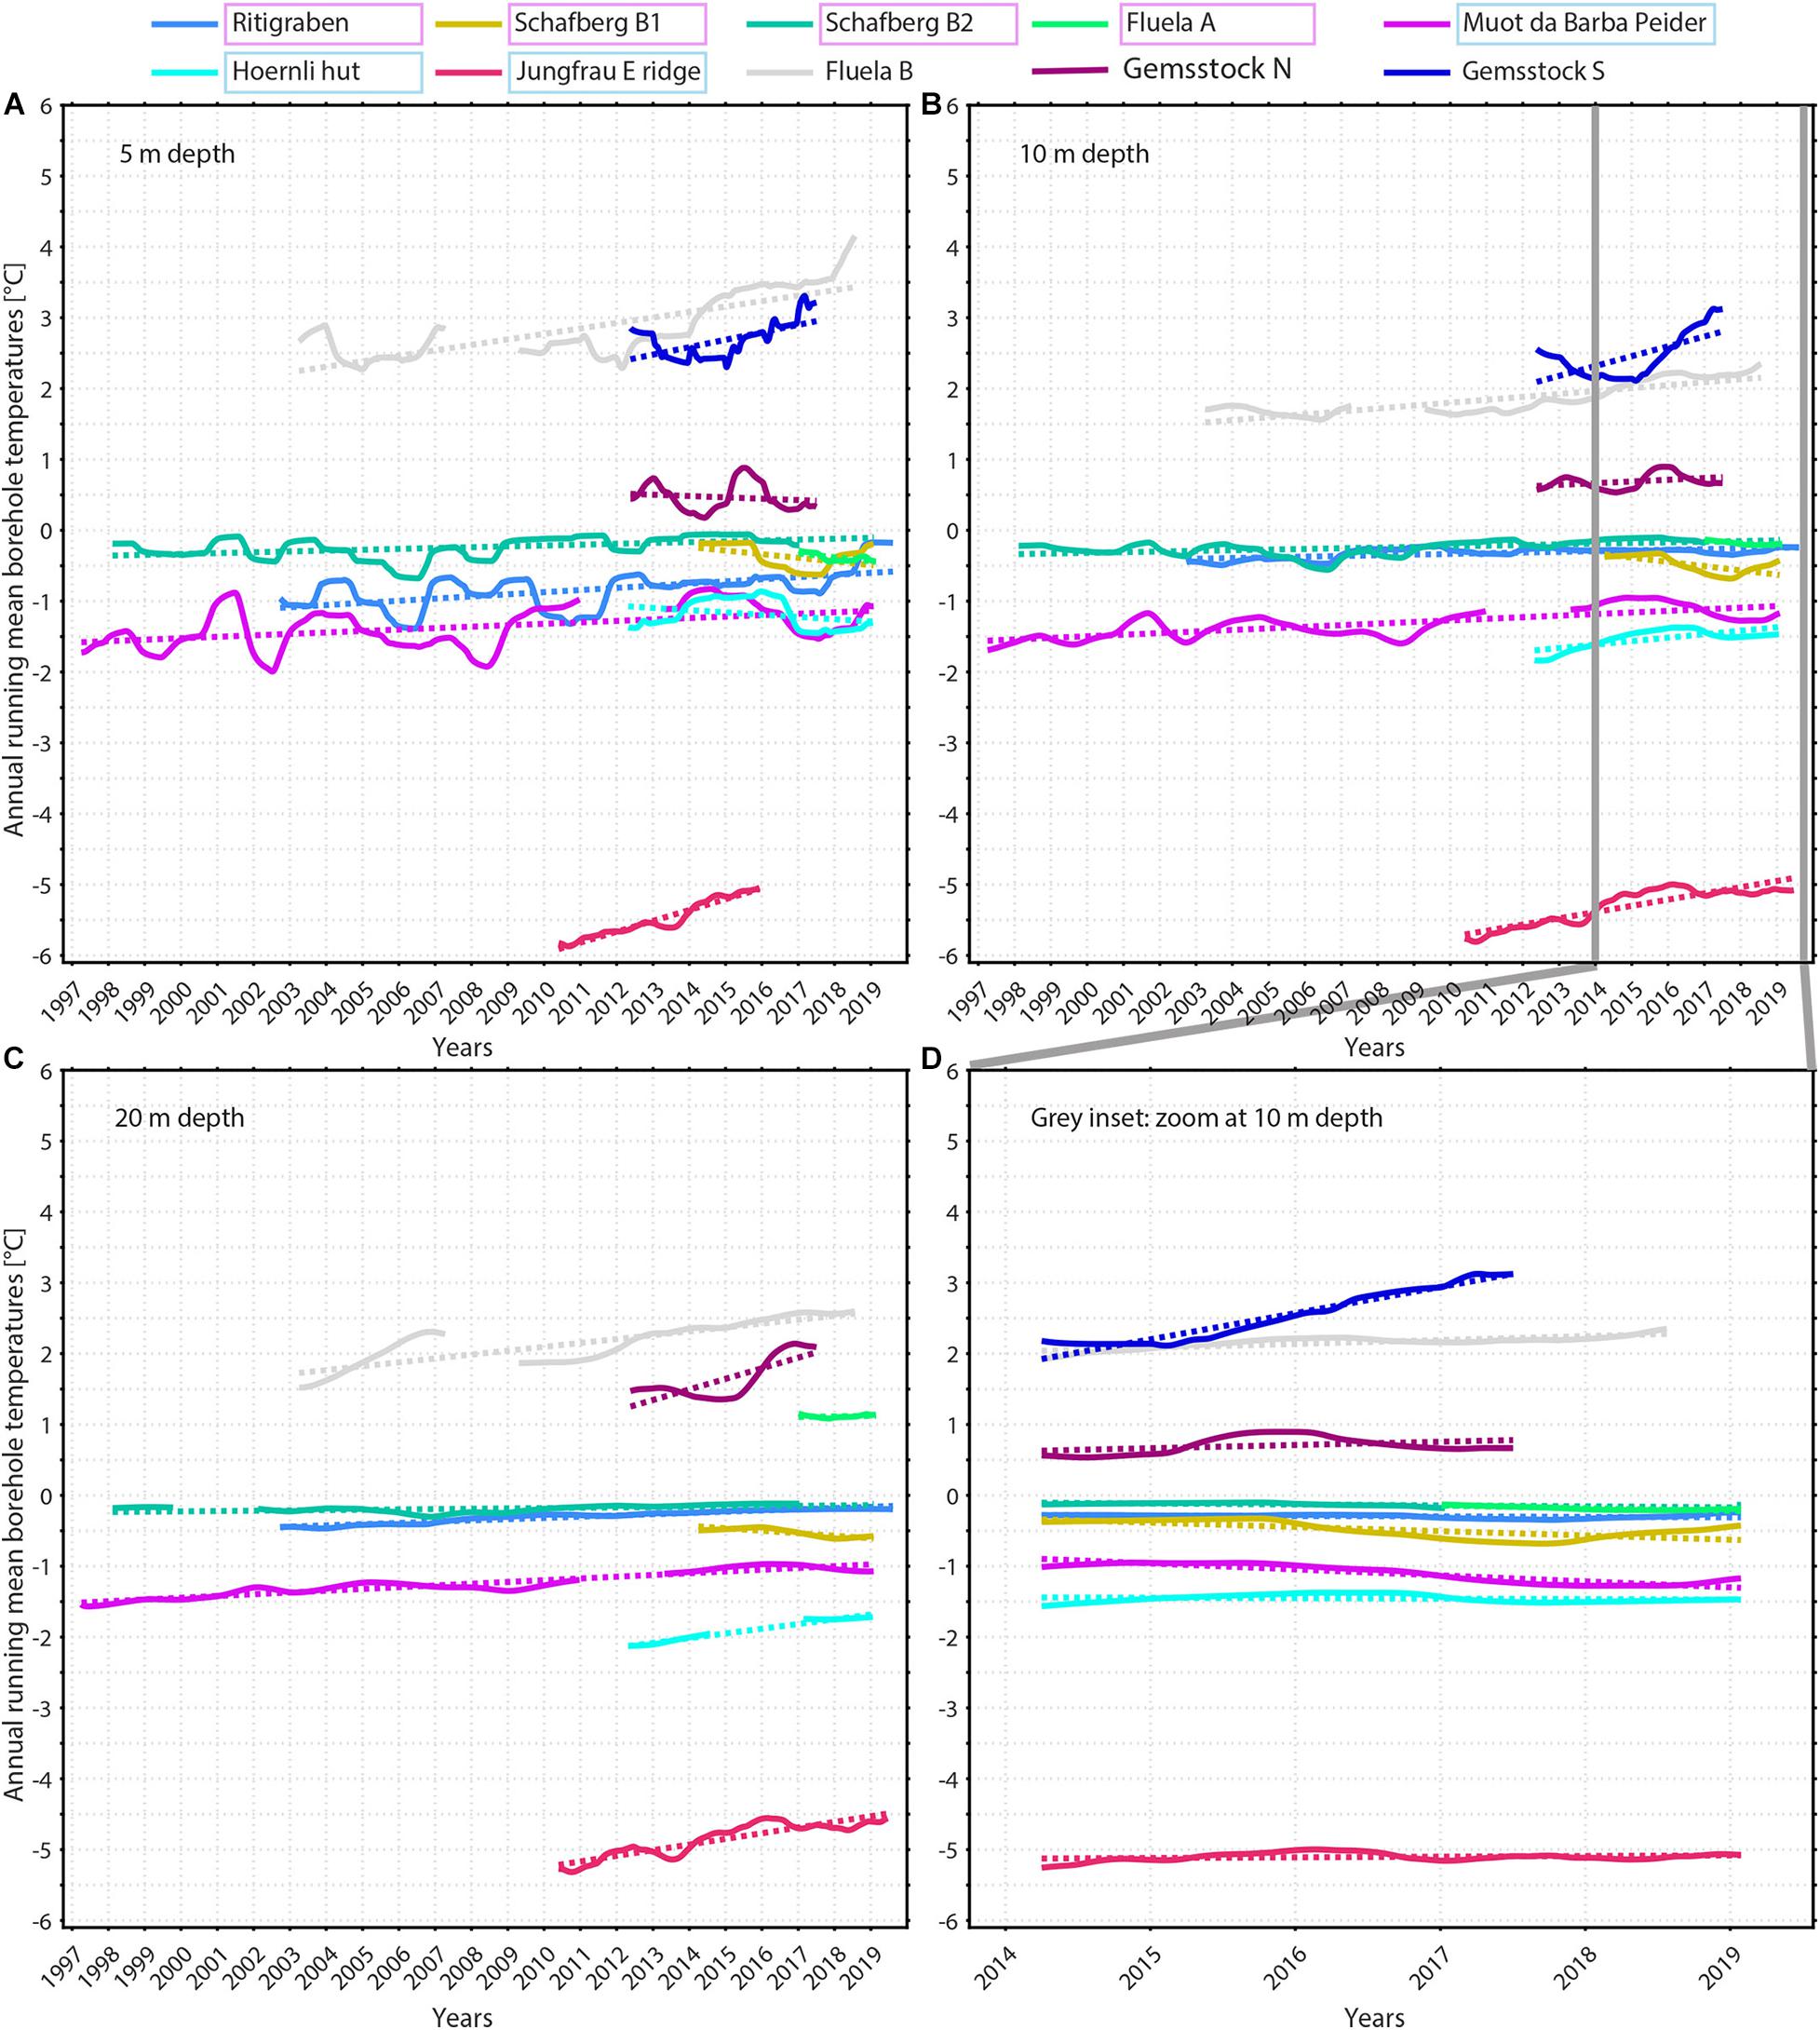
Figure 6. Running 365-day means of ground temperatures (solid lines) measured in various high alpine SLF boreholes at approximately (A) 5 m, (B) 10 m, and (C) 20 m depth (see Table 1 for exact sensor depths). In addition, linear ground temperature trends (dotted lines) are calculated based on annual running mean ground temperatures, including those in non-permafrost locations. (D) Zoom into the grey inset in (B) at 10 m depth: here short-term ground temperature changes are additionally calculated for all boreholes for the same time period as of borehole Schafberg B1 (if applicable). The coloured frames indicate the ice content of the boreholes: pink for ice-rich, light blue for ice-poor, and no frame for permafrost-free locations.
At all borehole locations influenced by snow, ground temperature decreases induced by snow-poor winters is observed with varying timing and magnitude (section “5.1 Evolution of Ground Temperatures”). While in all boreholes located in the Eastern Swiss Alps (especially Engadine) ground temperature decrease already started in winter 2015–2016 (Figures 5A, 6; Zweifel et al., 2016) and reached a depth of 20 m, ground temperature decreases were observed to a depth of 10 m in the snow-poor winter 2016–2017 (Figures 5, 6; Zweifel et al., 2017) in all boreholes in the Swiss Alps.
4.2.1.1 Linear Ground Temperature Trends
Linear ground temperature trends in varying depths are shown in Figure 6. The three borehole data series that cover more than 15 years (Muot da Barba Peider B1, Schafberg B2, Ritigraben) show positive temperature differences between the beginning and end of the analysis period (Table 2) and indicate an increase of ground temperature in all depths. Positive ground temperature trends even occur at 20 m depth, where the long-term signal is more relevant than at or above 10 m depth because it is not overprinted by seasonal variations. Shorter data series partly show negative ground temperature trends (e.g., Schafberg B1, Fluela A; Table 2, section “5.1 Evolution of Ground Temperatures”), because short-term weather fluctuations (in particular timing and depth of snow cover, summer air temperature) superimpose the long-term climate signal.
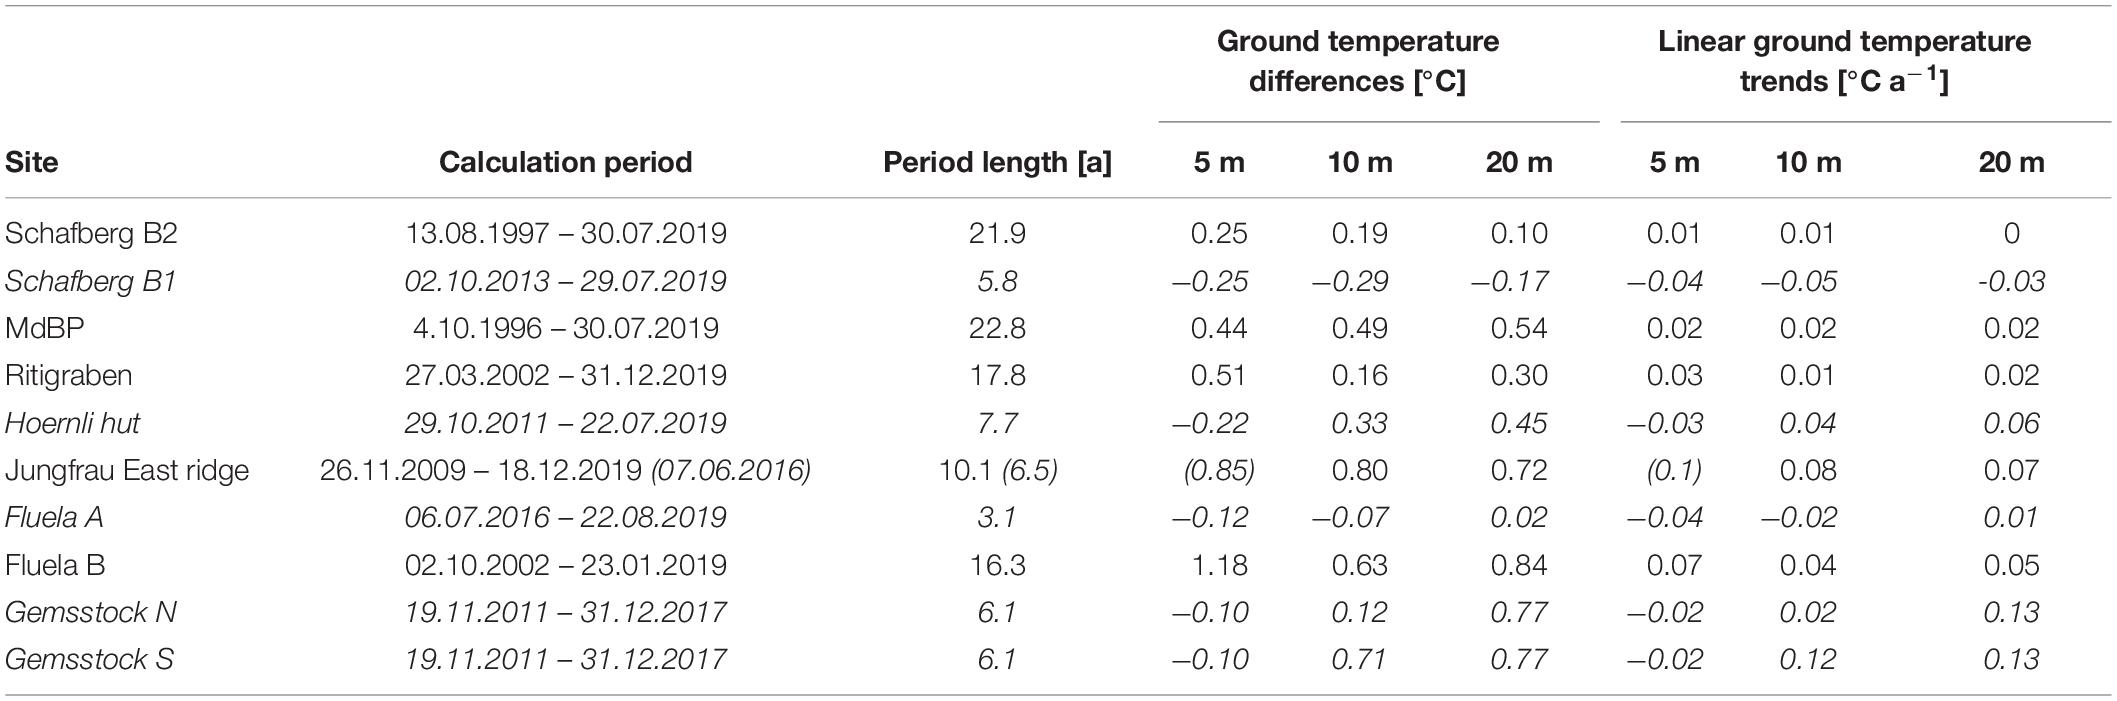
Table 2. Ground temperature differences calculated from linear trends of 365-day running means of ground temperatures in varying depths between the start and end of the temperature series of each borehole. Annual ground temperature trends [°C a−1] are also shown. Muot da Barba Peider B1 is abbreviated as MdBP. At Jungfrau East ridge the analysed data time series at 5 m depth (values in brackets and italic) is shorter than at 10 and 20 m depth due to sensor failure. Results from time series shorter than 10 years are written in italics. See Figure 6 for illustration.
To understand short-term ground temperature changes (less than 10 years) within a longer time perspective, linear ground temperature trends are additionally calculated for all boreholes simultaneously having data for the same time period as borehole Schafberg B1. During these 5.8 years ground temperature trends at 10 m depth (Figure 6D) are negative for all boreholes located in permafrost, except for Jungfrau East ridge. It can therefore be assumed that in the long-term, these permafrost boreholes will continue to behave similarly and thus also show increasing ground temperature trends. We thus show that shorter data time series can be useful for trend assessments but have to be set in a broader context.
4.2.1.2 Vertical Ground Temperature Profiles
Vertical temperature profiles of mean annual ground temperatures illustrate particularly well how temperatures are evolving at all depths over time and how they react differently, depending on ice content. In Figure 7 the mean annual ground temperature increase over time is clearly visible in all boreholes. Further, the effect of summer heat waves as well as snow-poor years on mean annual ground temperature is clearly visible in most boreholes, although local and regional differences exist. At ice-rich locations (Figures 7A–D), mean annual ground temperatures have tended towards 0°C at all depths below the active layer, with exceptions in snow-poor years. Accordingly, mean annual ground temperatures are higher here compared to ice-poor locations (Figures 7E–G). In the active layer an increasingly marked positive offset is evident. At Ritigraben (Figure 7D) mean annual ground temperature increases particularly strongly in 2018 and 2019 at all depths. In ice-poor frozen rock walls there are greater inter-annual mean annual ground temperature differences (Figures 7F,G) compared to ice-rich locations. Especially in the Jungfrau East ridge, mean annual ground temperatures are clearly increasing at similar rates at all depths. In the rocky Gemsstock crest the mean annual ground temperature profiles display the transient effect of a warmer south-east (S) face on the colder north-west (N) face (Figure 7I). The exceptionally high temperatures near the surface in 2016 and 2017 at Gemsstock S (Figure 7I) may indicate sensor drift. This is, however, yet not clear, highlighting the practical challenges of long-term borehole measurements (section “3.2.2 Sensor Drift”).
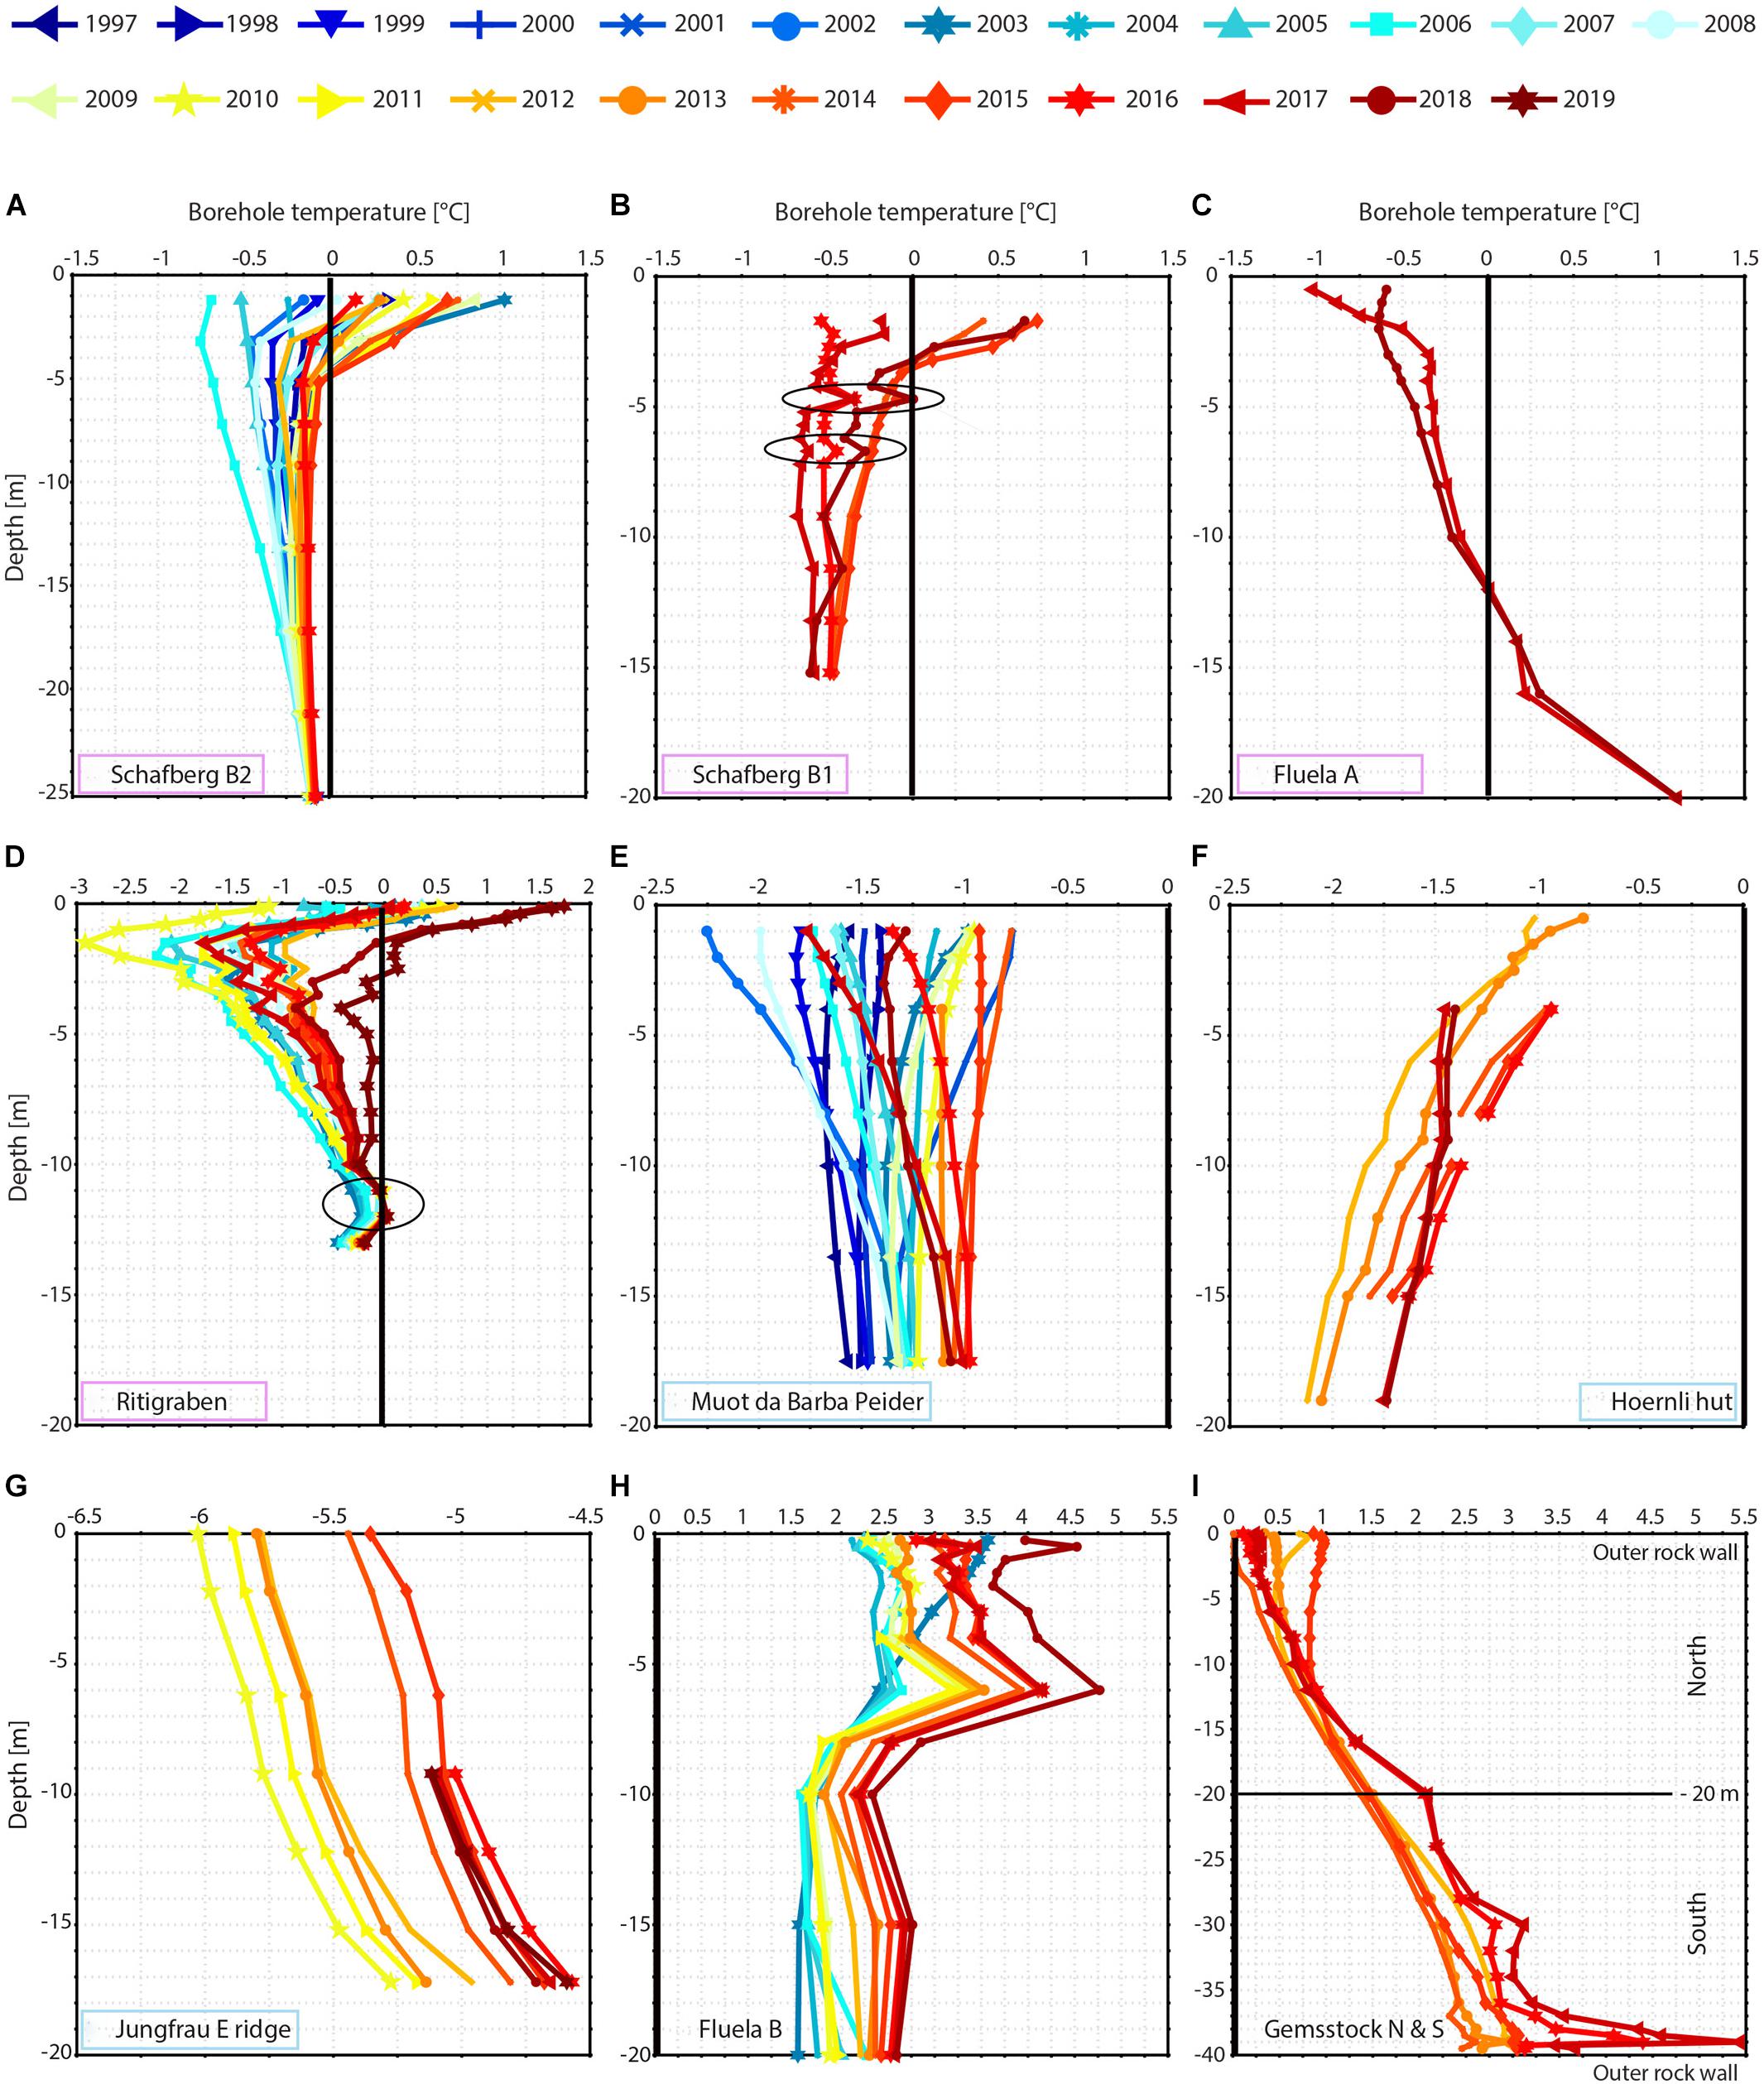
Figure 7. Vertical temperature profiles of mean annual ground temperatures in all permafrost boreholes. Thermistor depths in the boreholes are given (not the distance to the ground surface). The black vertical line denotes the 0°C isotherm (where applicable). Note the different x- and y-axis scales. Temperatures at depths of seasonal taliks (black circles) are below 0°C because mean annual ground temperatures are presented. The coloured frames indicate the ice content of the boreholes: (A–D) pink for ice-rich, (E–G) light blue for ice-poor, and (H,I) no frame for permafrost-free locations.
4.2.2 Active Layer
4.2.2.1 Active Layer Thickness
Active layer increased at all sites (Figure 8). At ice-poor locations (Figures 8E,F) variations in active layer thickness are common and active layer thickening is reversible. In contrast, at ice-rich locations active layer thickness remains rather stable at the sites considered (Figures 8A–D; section “5.1 Evolution of Ground Temperatures”). Here the gradual active layer increase is small, but if it occurs it appears to be irreversible (Zenklusen Mutter and Phillips, 2012a; Mollaret et al., 2019).
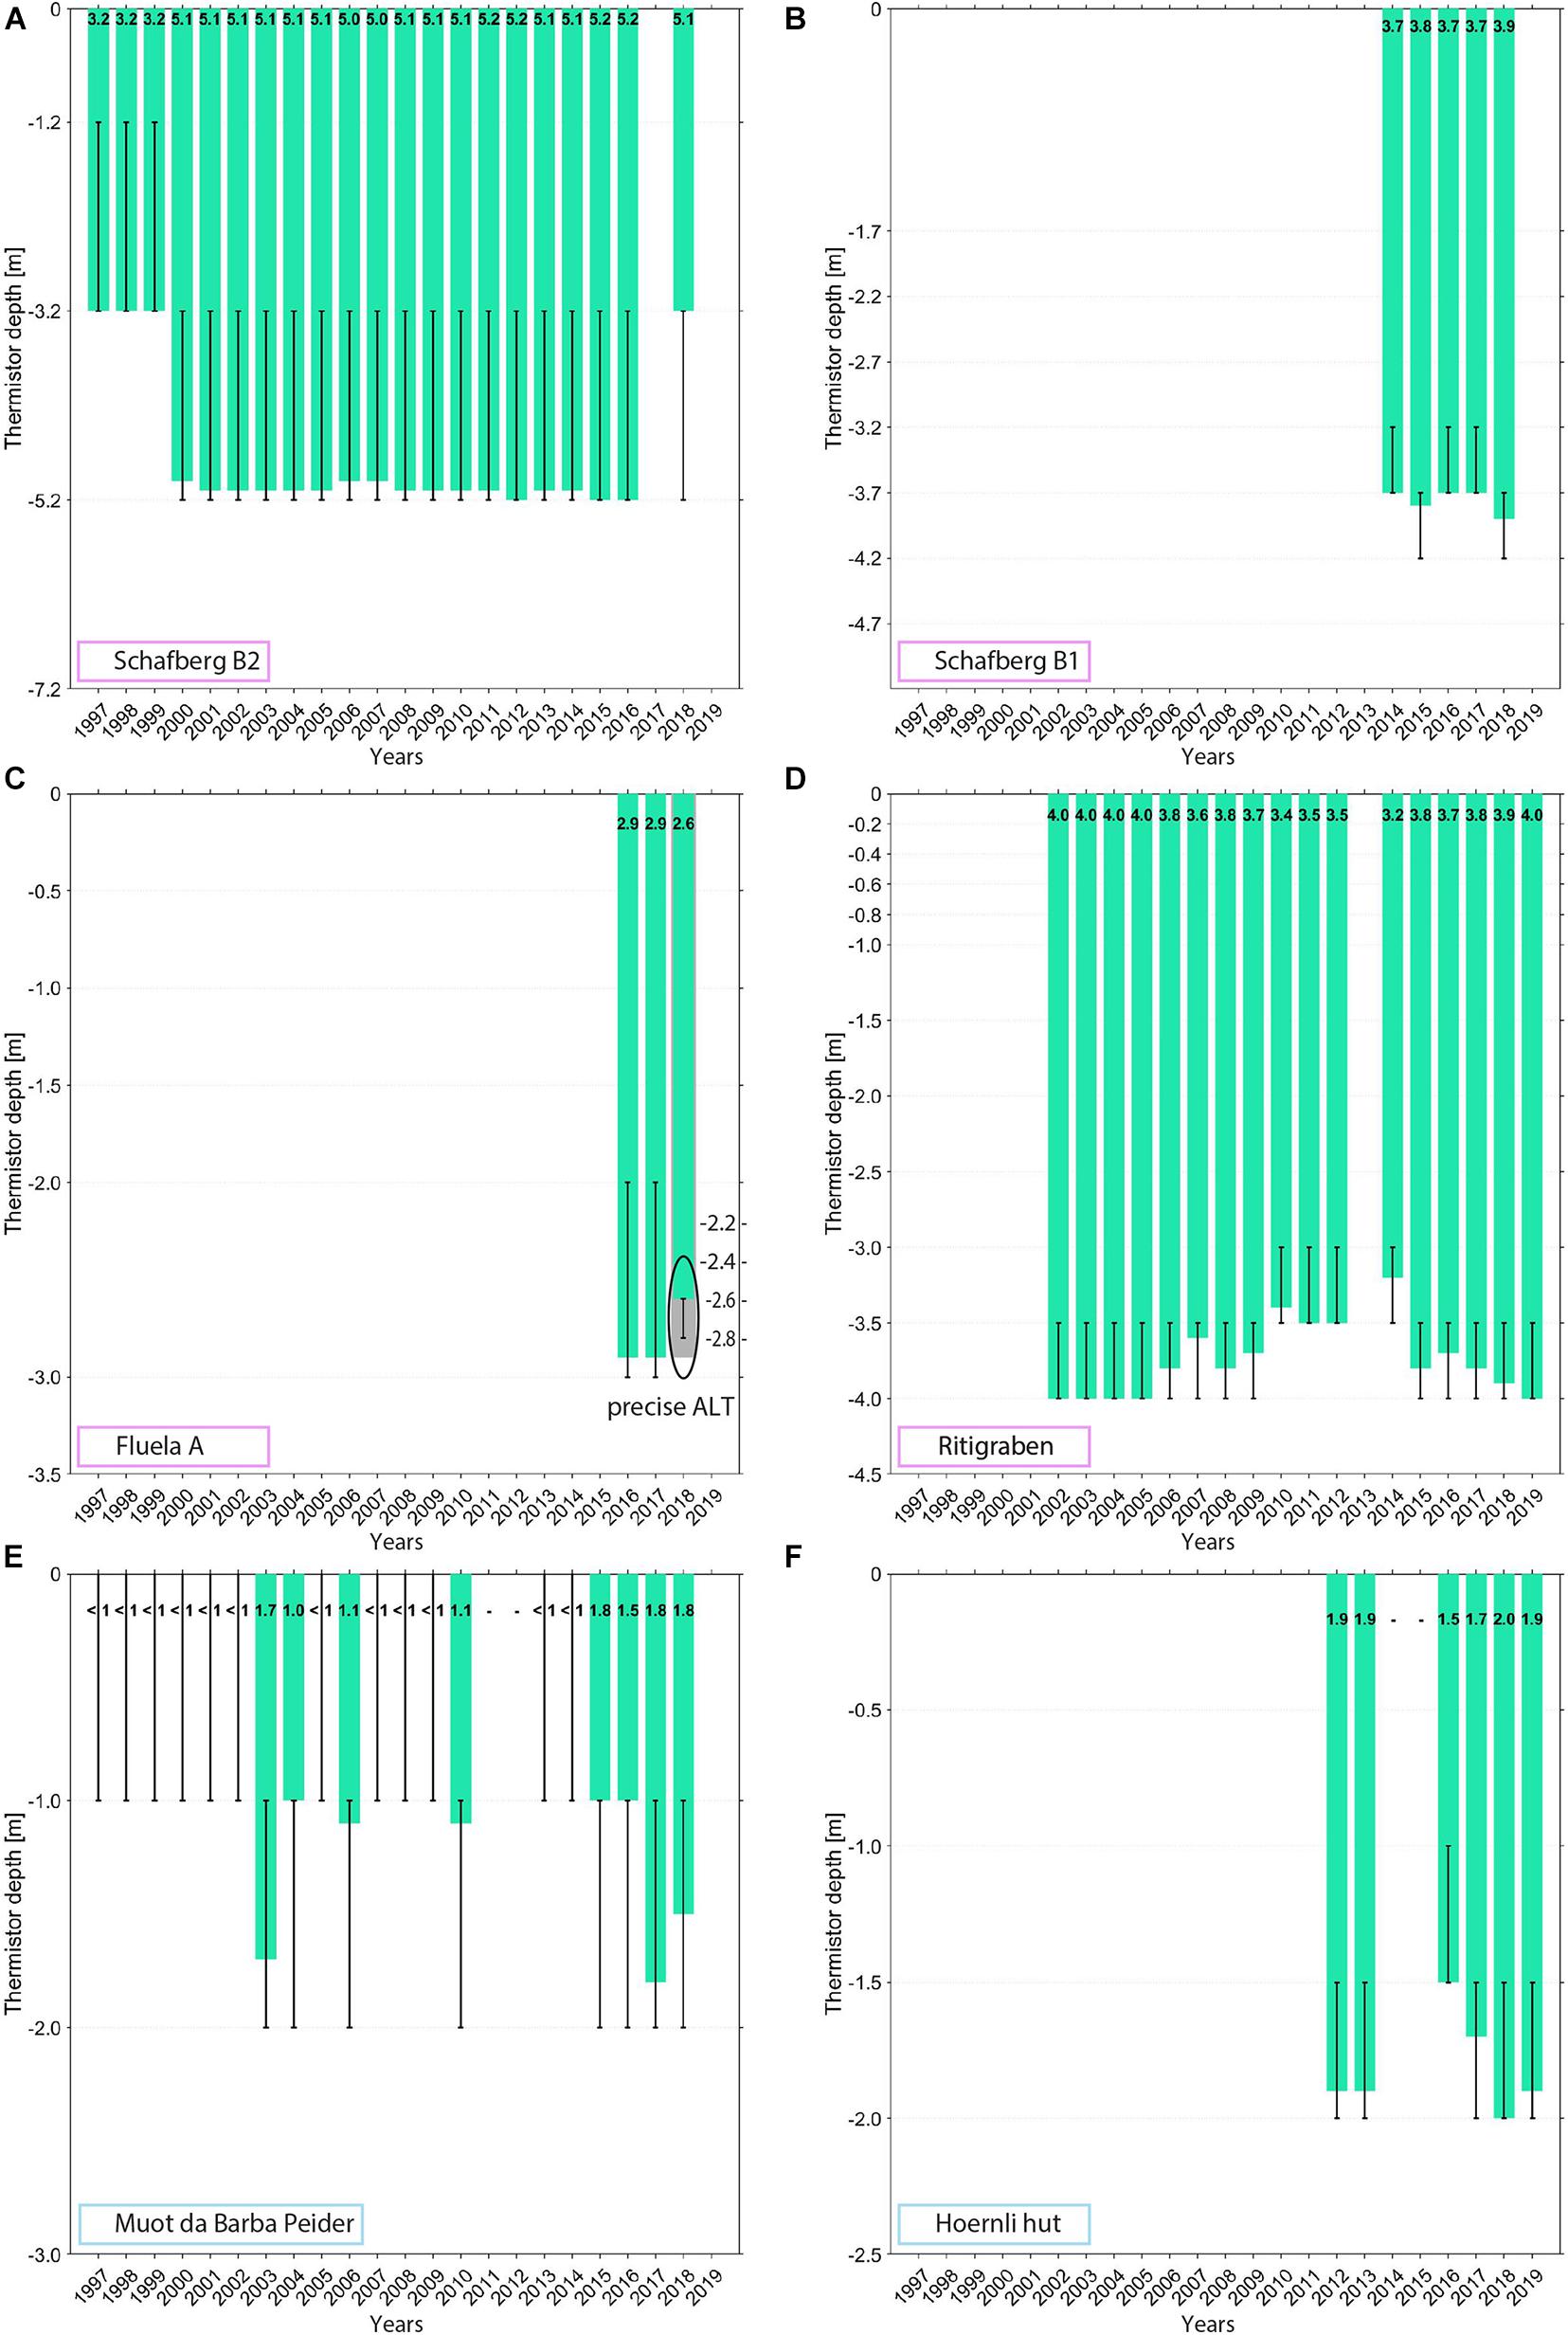
Figure 8. Active layer thickness (green bars) for all boreholes located in permafrost. The thin black bars indicate the depths of the sensors used for linear interpolation (upper sensor in active layer, lower sensor in permafrost). (C) The grey bar below the green one indicates the advantage of more detailed active layer thickness calculation due to denser sensor spacing (black circle). The coloured frames indicate the ice content of the boreholes: (A–D) pink for ice-rich, and (E,F) light blue for ice-poor locations.
The uncertainty of active layer thickness calculation by linear interpolation (section “3.2.4 Determination of Active Layer Thickness”) is demonstrated in the ice-rich borehole Schafberg B2 (Figure 8A). It seems that the calculated active layer thickness strongly increased by 2 m between 1999 and 2000, which is presumably an artefact caused by large thermistor spacing in the active layer (thermistors at 3.2 m and 5.2 m depth). Active layer thickening at ice-rich locations occur, however, gradually from year to year and at Schafberg B2 active layer thickness ranges between 3.2 m and 5.2 m.
The need for dense thermistor spacing in the active layer (section “3.2.4 Determination of Active Layer Thickness”) is highlighted in the borehole Fluela A. While linear interpolation between the thermistors suggested an active layer thickness of 2.9 m, the more detailed active layer thickness measured using additional BLE loggers was around 2.6 m (Figure 8C).
4.2.2.2 Mean Annual Active Layer Thickness
Mean annual active layer thicknesses are considerably high at the ice-rich locations Schafberg B1 and B2 and Ritigraben (Figure 9). In accordance with the active layer thickness, mean annual active layer thickness is smallest in the ice-poor talus slope Muot da Barba Peider B1. For all boreholes, mean annual active layer thickness increased strongly from 2017 onwards although active layer thickness remained nearly the same, indicating prolonged periods of active layer thaw (section “5.1 Evolution of Ground Temperatures”).
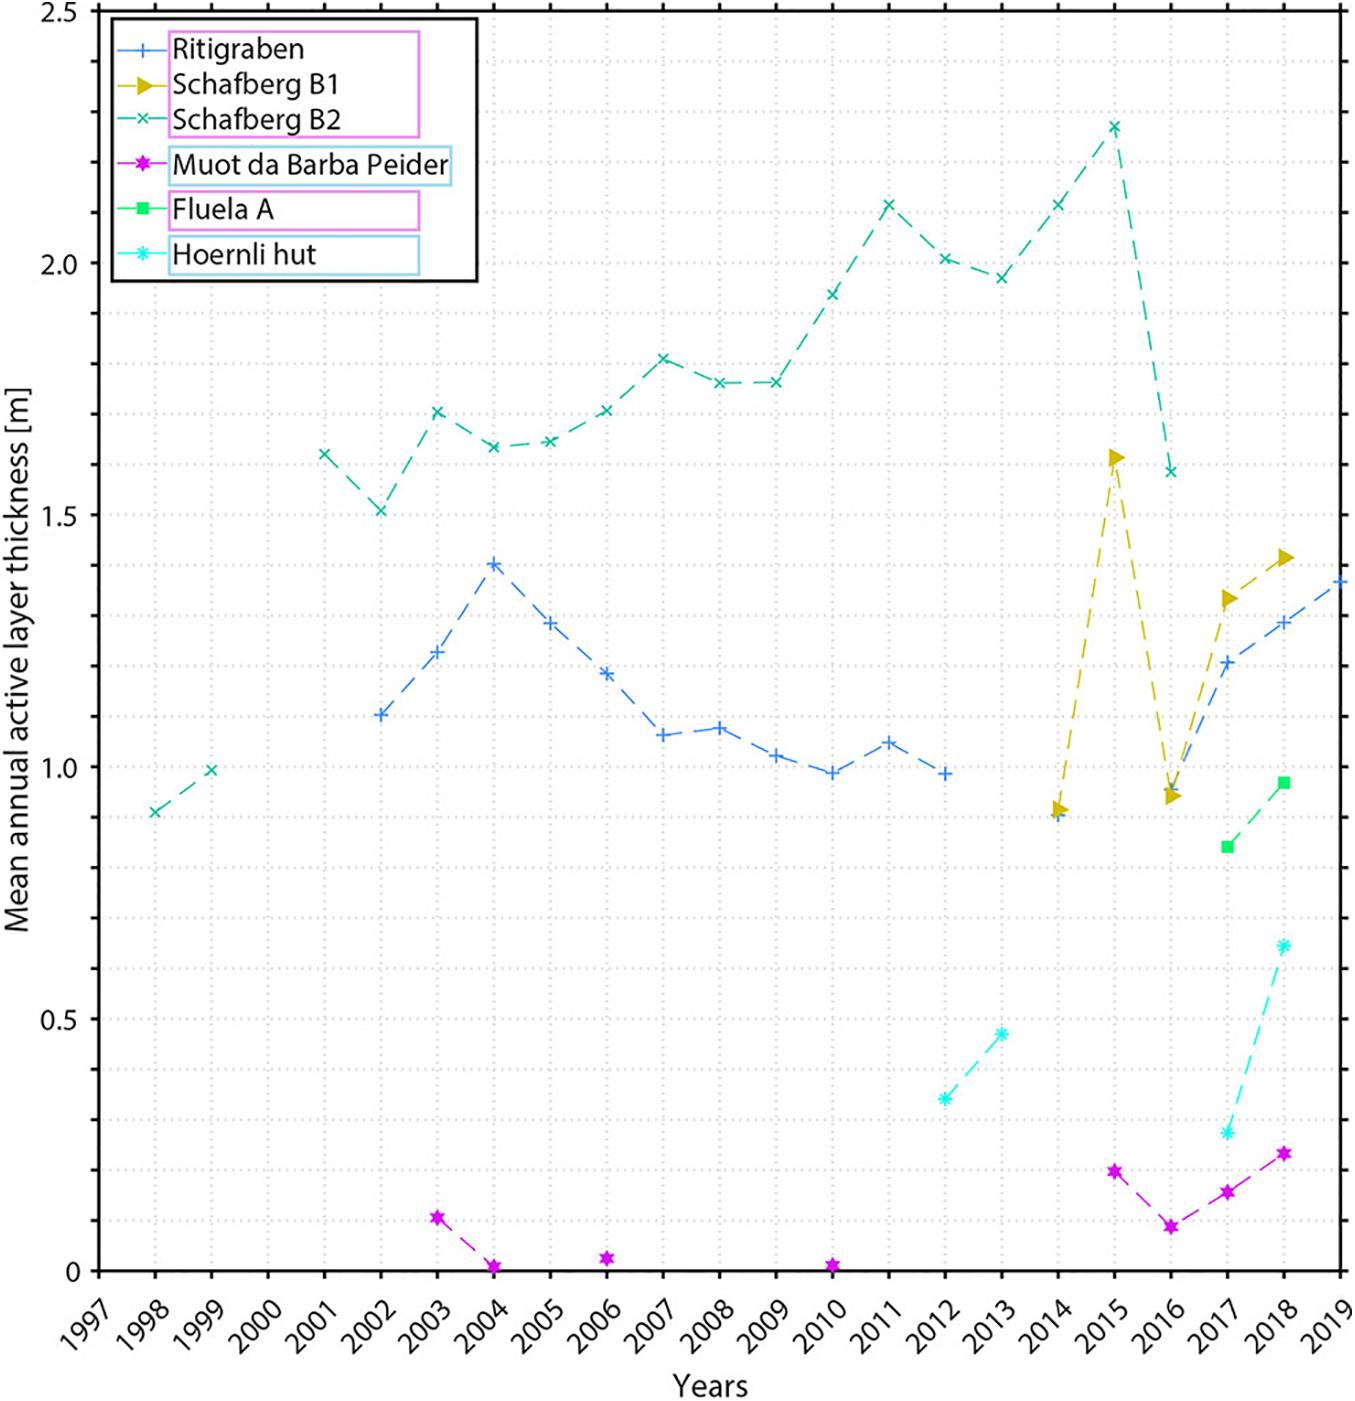
Figure 9. Mean annual active layer thickness calculated for all boreholes with permafrost. Mean annual active layer thickness could not be calculated for sites lacking sensors in the active layer (partly Muot da Barba Peider B1, see Figure 8). The coloured frames indicate the ice content of the boreholes: pink for ice-rich, and light blue for ice-poor locations.
4.2.3 Minimum and Maximum Ground Temperatures at 10 m Depth
The evolution of annual minimum and maximum ground temperatures is shown at 10 m depth (Figure 10A). At the ice-rich sites maximum ground temperatures are close to 0°C with annual variations smaller than 0.15°C. In contrast, stronger annual minima variations up to 0.6°C are common between successive years. Long-term trends over two decades show, however, an increase of minimum temperatures of up to 0.5°C (temperature differences between the start and end of the linear ground temperature trends of each borehole) causing a convergence of minima and maxima, and inducing an isothermal permafrost during an increasing number of years. At shorter time scales, there is no such warming trend due to individual cooling events (section “4.2.1 Evolution of Ground Temperatures” and section “5.1 Evolution of Ground Temperatures”). At ice-poor sites linear trends show both increasing maxima and minima (Figures 10A,B) and both increase at nearly the same rate. These increases are highest at Jungfrau East ridge and range around 0.08°C a–1 (maxima and minima). At the permafrost-free locations Fluela B and Gemsstock linear trends also show an increaseof both maxima and minima, but in contrast to permafrost sites seasonal variations are stronger for maximum temperatures compared to minimum temperatures here.
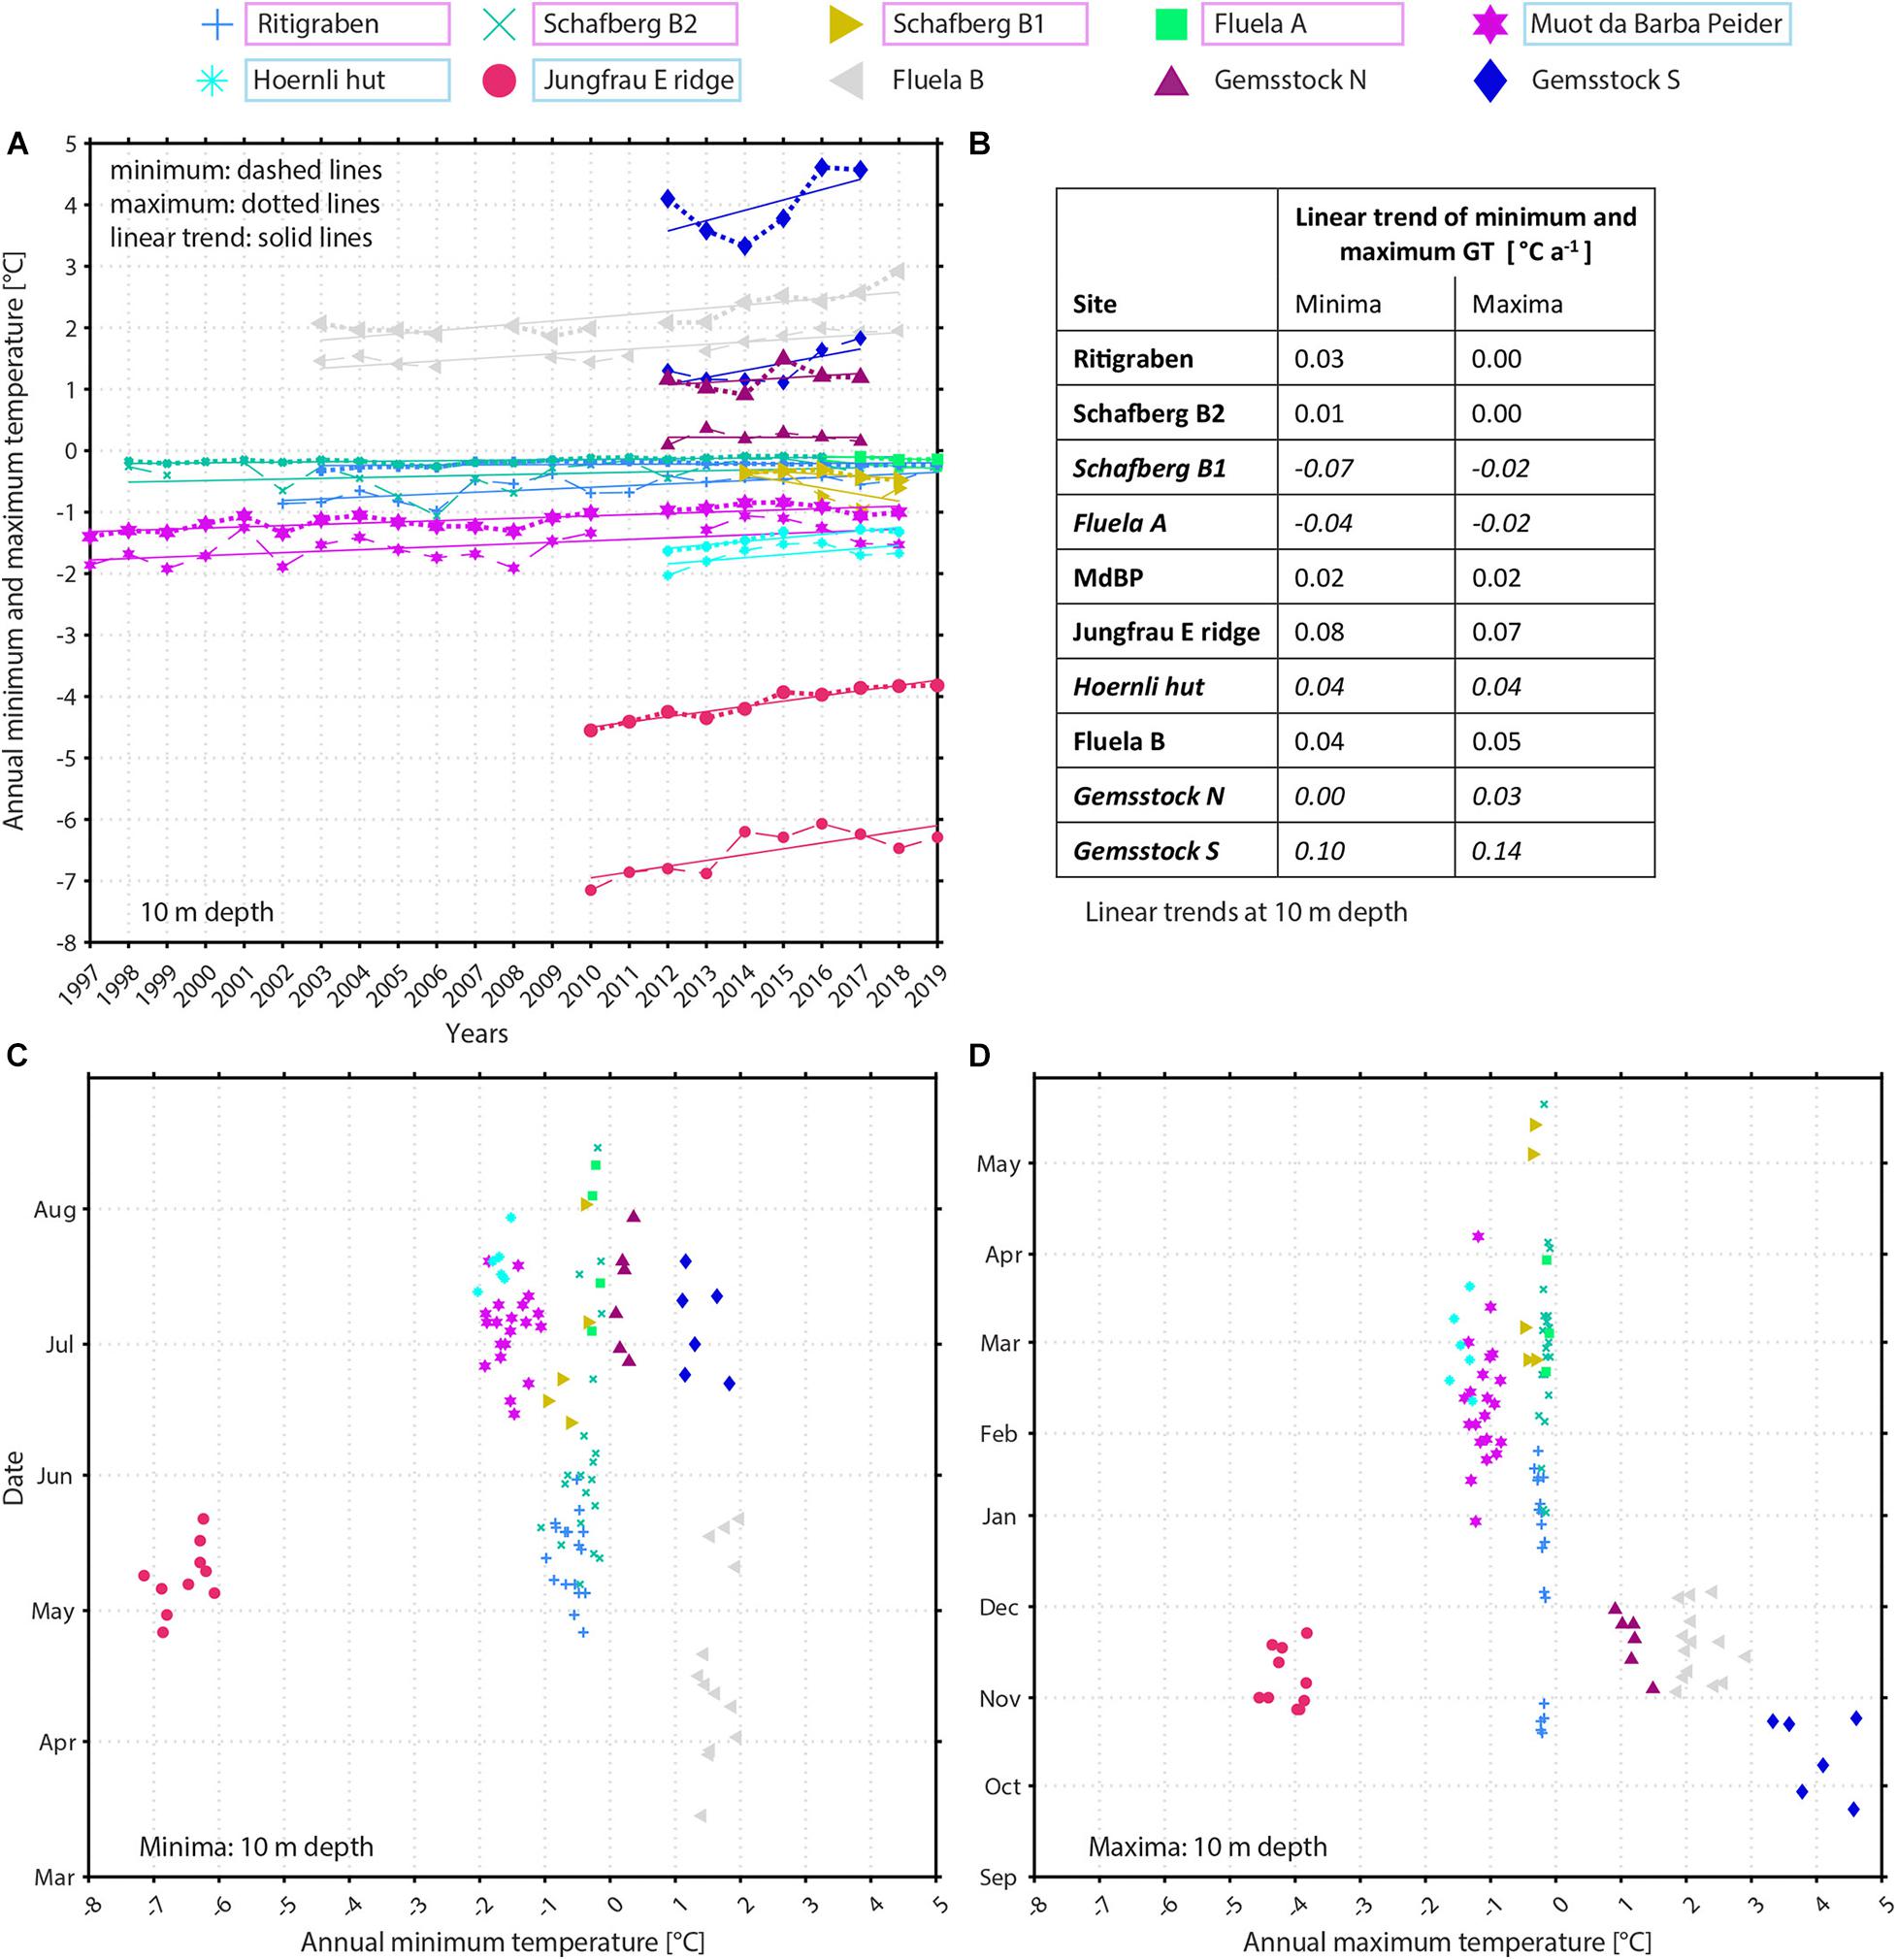
Figure 10. (A) Evolution of annual minimum (dashed lines) and maximum (dotted lines) ground temperatures at 10 m depth. In addition, linear trends (solid lines) are calculated based on the evolution of annual minima and maxima. (B) Annual minimum and maximum ground temperature trends [°C a−1] at 10 m depth. Muot da Barba Peider B1 is abbreviated as MdBP. Results for boreholes with only short data time series are written in italics. (C,D) Timing as a function of (C) annual minimum and (D) maximum ground temperatures at 10 m depth: the dates for each borehole and each year on the y-axis versus minimum or maximum ground temperatures on the x-axis are shown. Note the different y-axis scales for minima and maxima. The coloured frames indicate the ice content of the boreholes: pink for ice-rich, light blue for ice-poor, and no frame for permafrost-free locations.
No typical temporal distribution of minima and maxima in connection with the appropriate minimum and maximum ground temperature can be observed (Figures 10C,D), but clear clusters are obvious, depending on ground ice content. At most sites located in permafrost the time lag at 10 m depth compared to the surface is 5 to 7 months, with minima occurring in summer (mostly between May and July) and maxima in the following winter. Maxima are reached between January and March at ice-poor sites, while the spread in maxima timing is wider at ice-rich locations. Due to the complex geometry of the Jungfrau East ridge borehole no comparable depth dependency of minima and maxima timing is possible here. Differences in minimum and maximum ground temperature at individual boreholes are only around 1°C (Figures 10C,D) with smaller variations for maximum ground temperatures. At permafrost-free sites hardly any depth dependent time lag occurs and minima and maxima at 10 m depth are delayed by only 1 month. This is, however, not true for minima timing in borehole Fluela B (Figure 10C). Here the abnormal pattern is due to subsurface ventilation leading to thermal anomalies (Phillips et al., 2009; Kenner et al., 2017b).
4.2.4 Zero Curtain
Spring snow melt causes water infiltration into the ground and thus triggers the spring zero curtain, whereby temperatures in the active layer remain at 0°C. Both latent phase change and convective water fluxes rapidly change ground temperatures, usually leading to shorter spring than autumn zero curtain periods (Figure 11). The duration of the autumn zero curtain depends on the amount of water in the ground that needs to freeze.
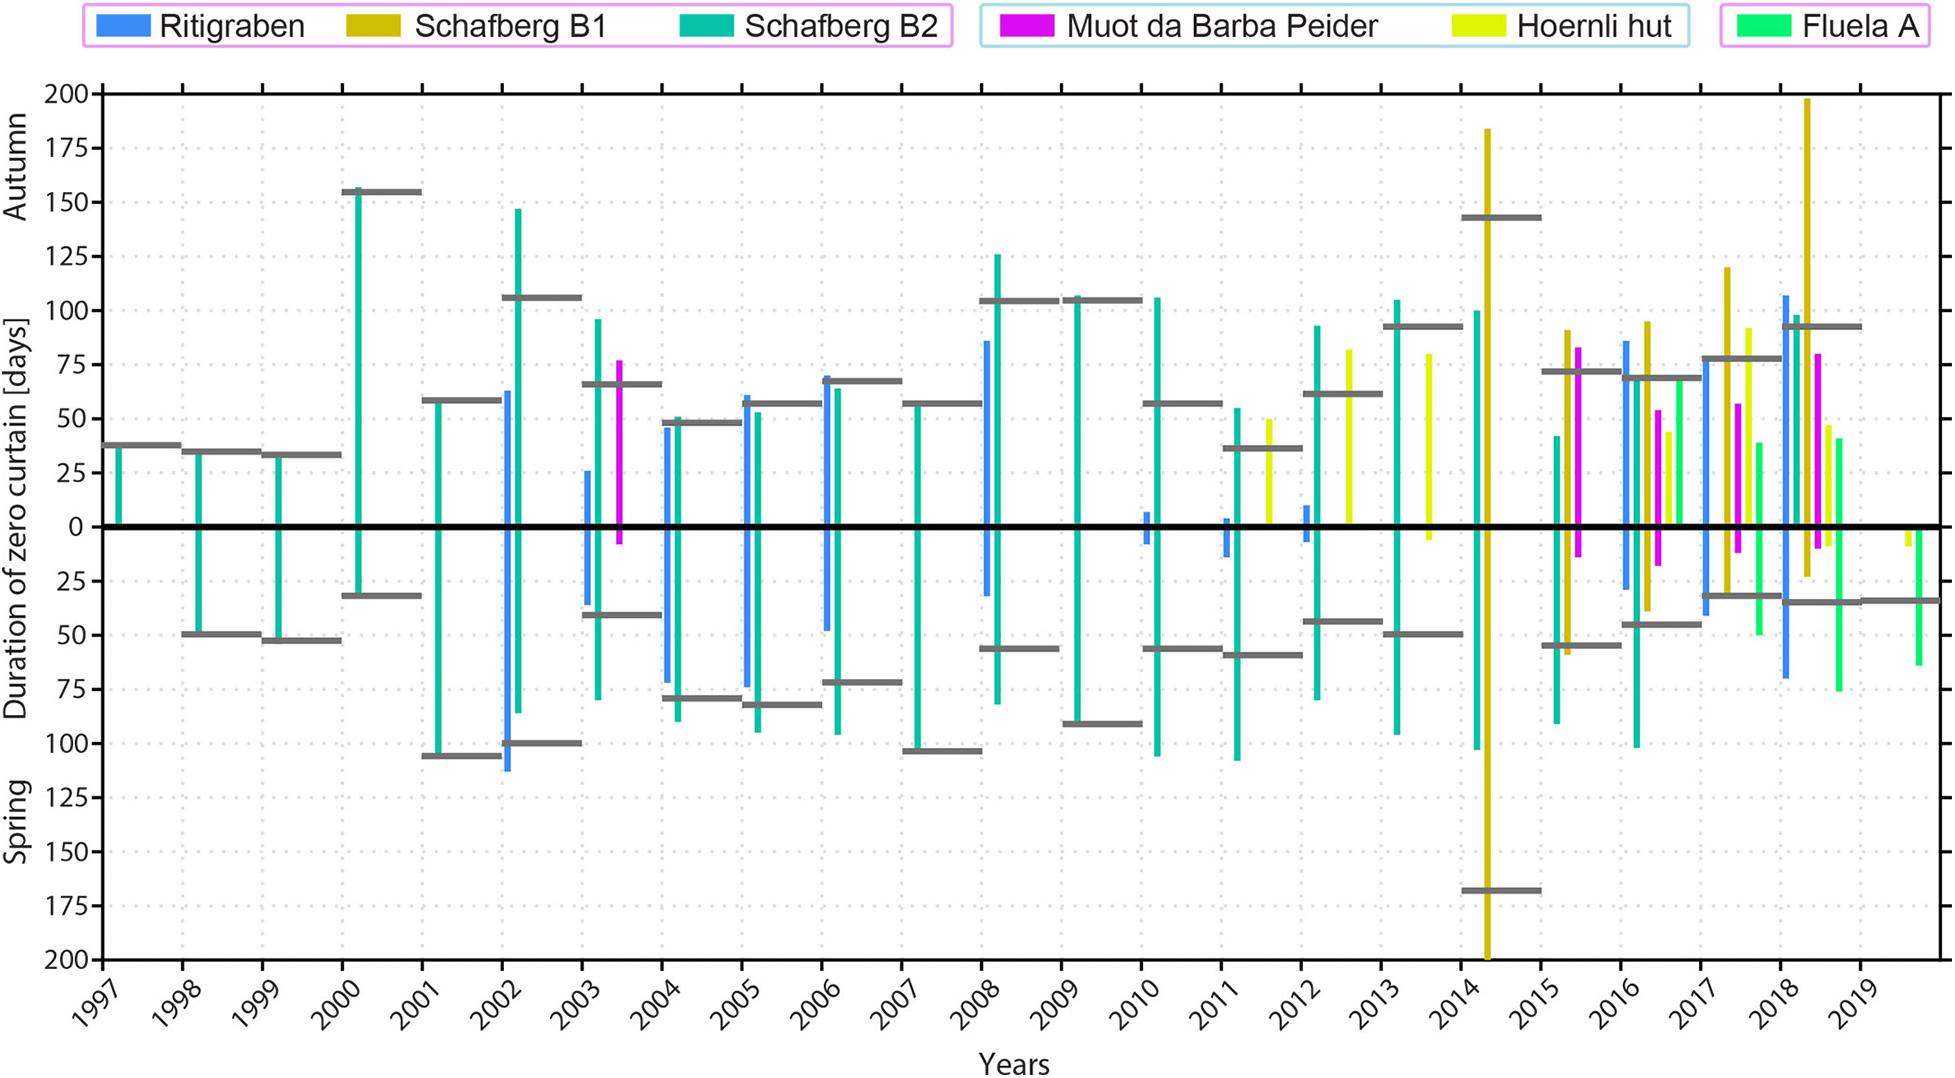
Figure 11. Duration in days of spring zero curtains (downward pointing bars) and autumn zero curtains (upward pointing bars). Bars represent the time periods in all permafrost boreholes and when both spring and autumn zero curtains exist at the lowest sensor in the active layer (section “3.2.6 Zero Curtain”). Grey horizontal bars represent the mean of all (autumn respectively spring) zero curtain days over all boreholes that have data in that year. The coloured frames indicate the ice content of the boreholes: pink for ice-rich, and light blue for ice-poor locations.
The durations of the zero curtains vary strongly depending on the location. At locations less influenced by snow spring zero curtains are short as is the case for the rather steep talus slope Muot da Barba Peider as well as for the Hoernli hut site. At sites in flatter terrain with more snow (e.g., boreholes Schafberg B1 and B2, Ritigraben, Fluela A) prolonged spring zero curtains are observed. Long autumn zero curtains are observed at most locations (Figure 11), in particular at rock glacier Schafberg (B1, B2). Further, a high temporal variability of zero curtain duration is visible between the different years at all permafrost sites.
4.3 Taliks in Permafrost
Ground temperature data at certain depths indicate the presence of taliks (positive temperature anomalies in permafrost) in some boreholes, e.g., shown in the vertical temperature profiles (Figures 7B,D). Talik formation can be seen very clearly in the Ritigraben borehole (Figures 7D, 12), where a seasonal talik first formed in 2007 at 11–12 m depth.
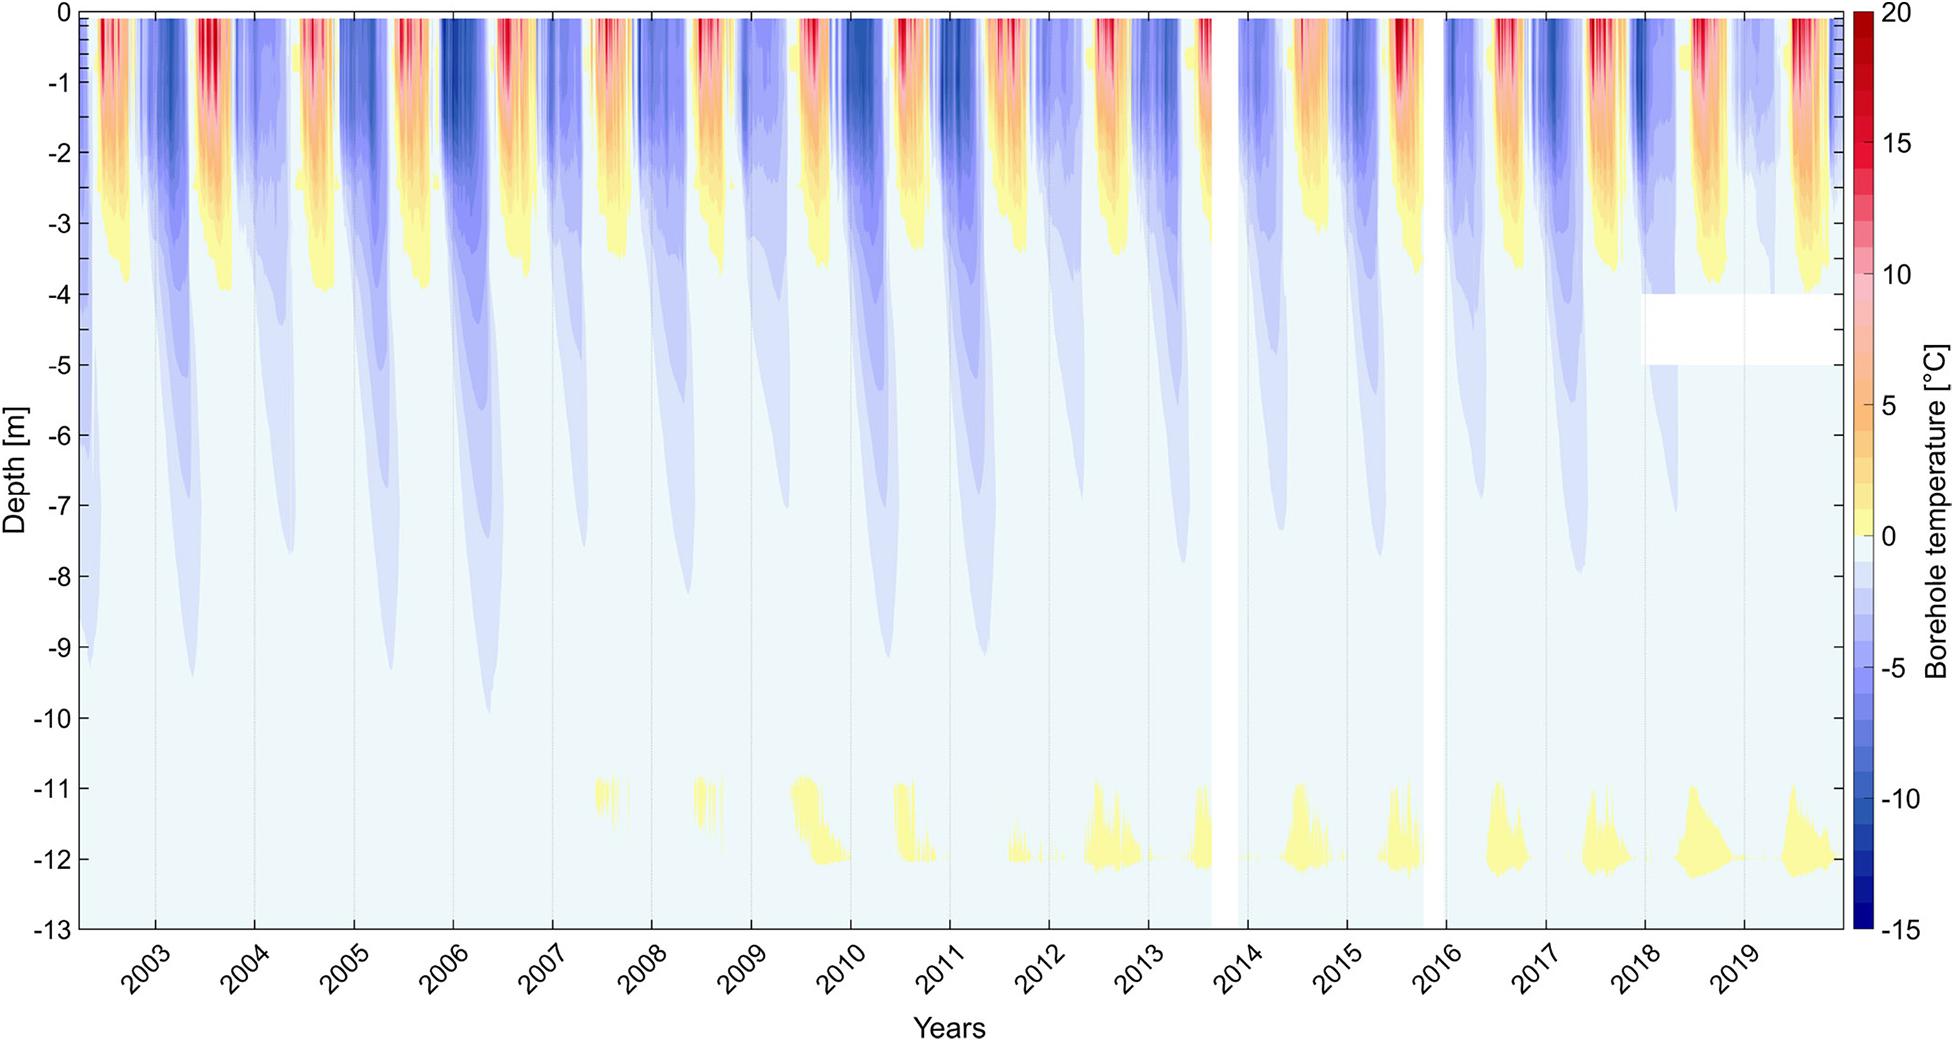
Figure 12. Contour plot of borehole temperatures in Ritigraben rock glacier (2002–2019). The talik is located at 11–12 m depth and started in 2007. The seasonal freezing (bluish colours) and thawing (reddish colours) periods (active layer thickness) at this ice-rich site are also shown. Gaps (white areas) are due to logger or battery failure.
A similar phenomenon can be observed in borehole B1 in the Schafberg rock glacier. Unfrozen zones are present around 4.7 m from 2016 onward (Figure 7B). In the beginning of 2019 a second talik started to form at 6.7 m depth and one appears to be forming at 11.2 m depth. The presence of taliks was confirmed by frequency domain electromagnometry measurements carried out in summer 2019 (Boaga et al., 2020). According to TLS data, only small signs of subsidence are visible directly at the borehole, but a stronger loss in surface height is occurring in the wider surroundings and the entire rock glacier shows a negative volume balance according to TLS measurements (Noetzli and Phillips, 2019). All taliks at Ritigraben and Schafberg B1 intensified in the years following their initial appearance.
4.4 Rock Glacier Dynamics
The rock glaciers Fluela, Schafberg and Ritigraben are located in different regions of the Alps (Figure 1). Rock glacier Fluela shows typical maximum rock glacier velocities in the range of a few dm a–1, while rock glacier Ritigraben is faster, reaching velocities up to 3 m a–1 at its front. The rock glacier sections Schafberg II and III of the Schafberg rock glacier complex move relatively slowly at a few cm a–1, while the front of Schafberg I reaches velocities of about 20 cm a–1.
All rock glaciers show a clear seasonal velocity signal with minima in spring and maxima in autumn (Figure 13; section “5.2 Rock Glacier Dynamics”). This signal is superimposed on inter-annual and multi-annual velocity changes. Although the absolute rock glacier velocities of Fluela, Schafberg I and Ritigraben differ strongly, similar patterns of inter-annual rock glacier velocity variations have been observed during the last decade (Figure 14A), which is also true for other rock glaciers in the Alps (PERMOS, 2019). There is a strong acceleration of all three rock glaciers between the years 2013 and 2015. This is followed by a pronounced deceleration in 2016 and 2017, as a consequence of snow-poor winters (Figure 5). Since 2017, all three rock glaciers have been accelerating again. Ritigraben rock glacier accelerated particularly strongly in the last 6 years, clearly exceeding the acceleration rates observed at the majority of rock glaciers monitored by the PERMOS network (PERMOS, 2019).
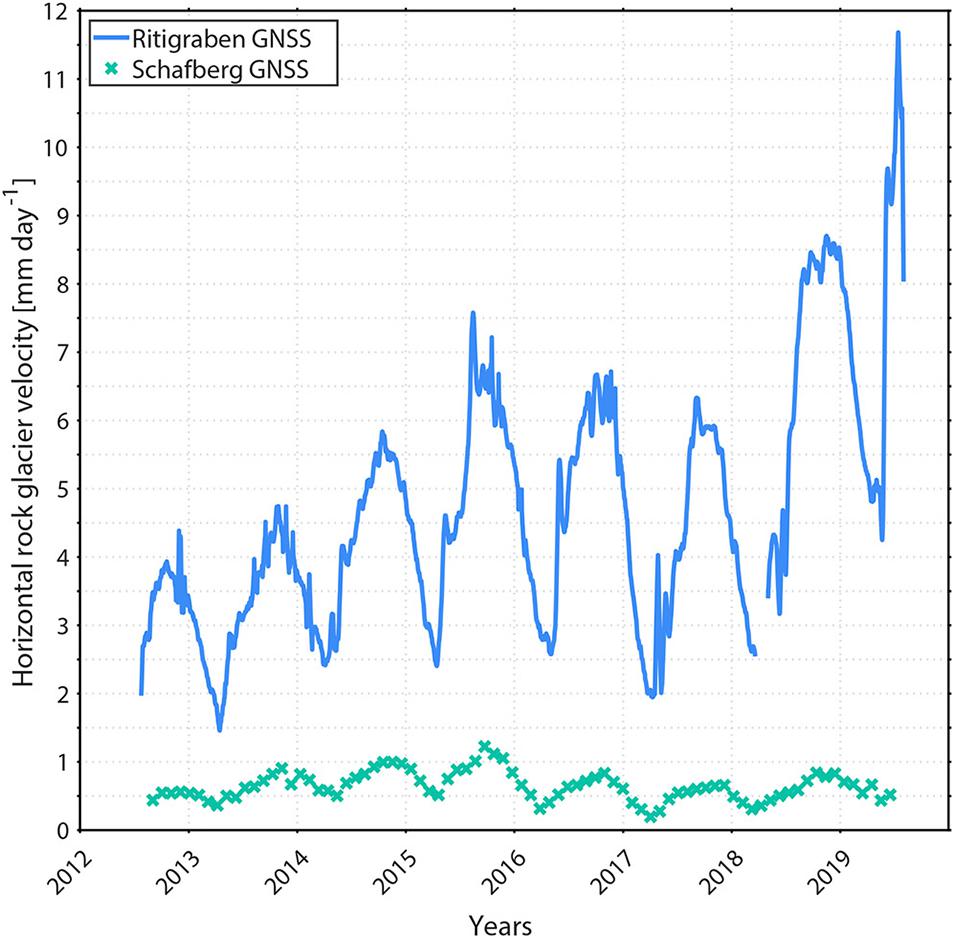
Figure 13. Horizontal rock glacier velocities [mm day–1] on the ice-rich rock glaciers Schafberg and Ritigraben from 2012 to 2019 derived from permanent GNSS observations. For Schafberg a 31-day moving mean and for the fast moving Ritigraben rock glacier an 11-day moving mean is shown (section “3.3.3 In-situ Global Navigation Satellite System”).
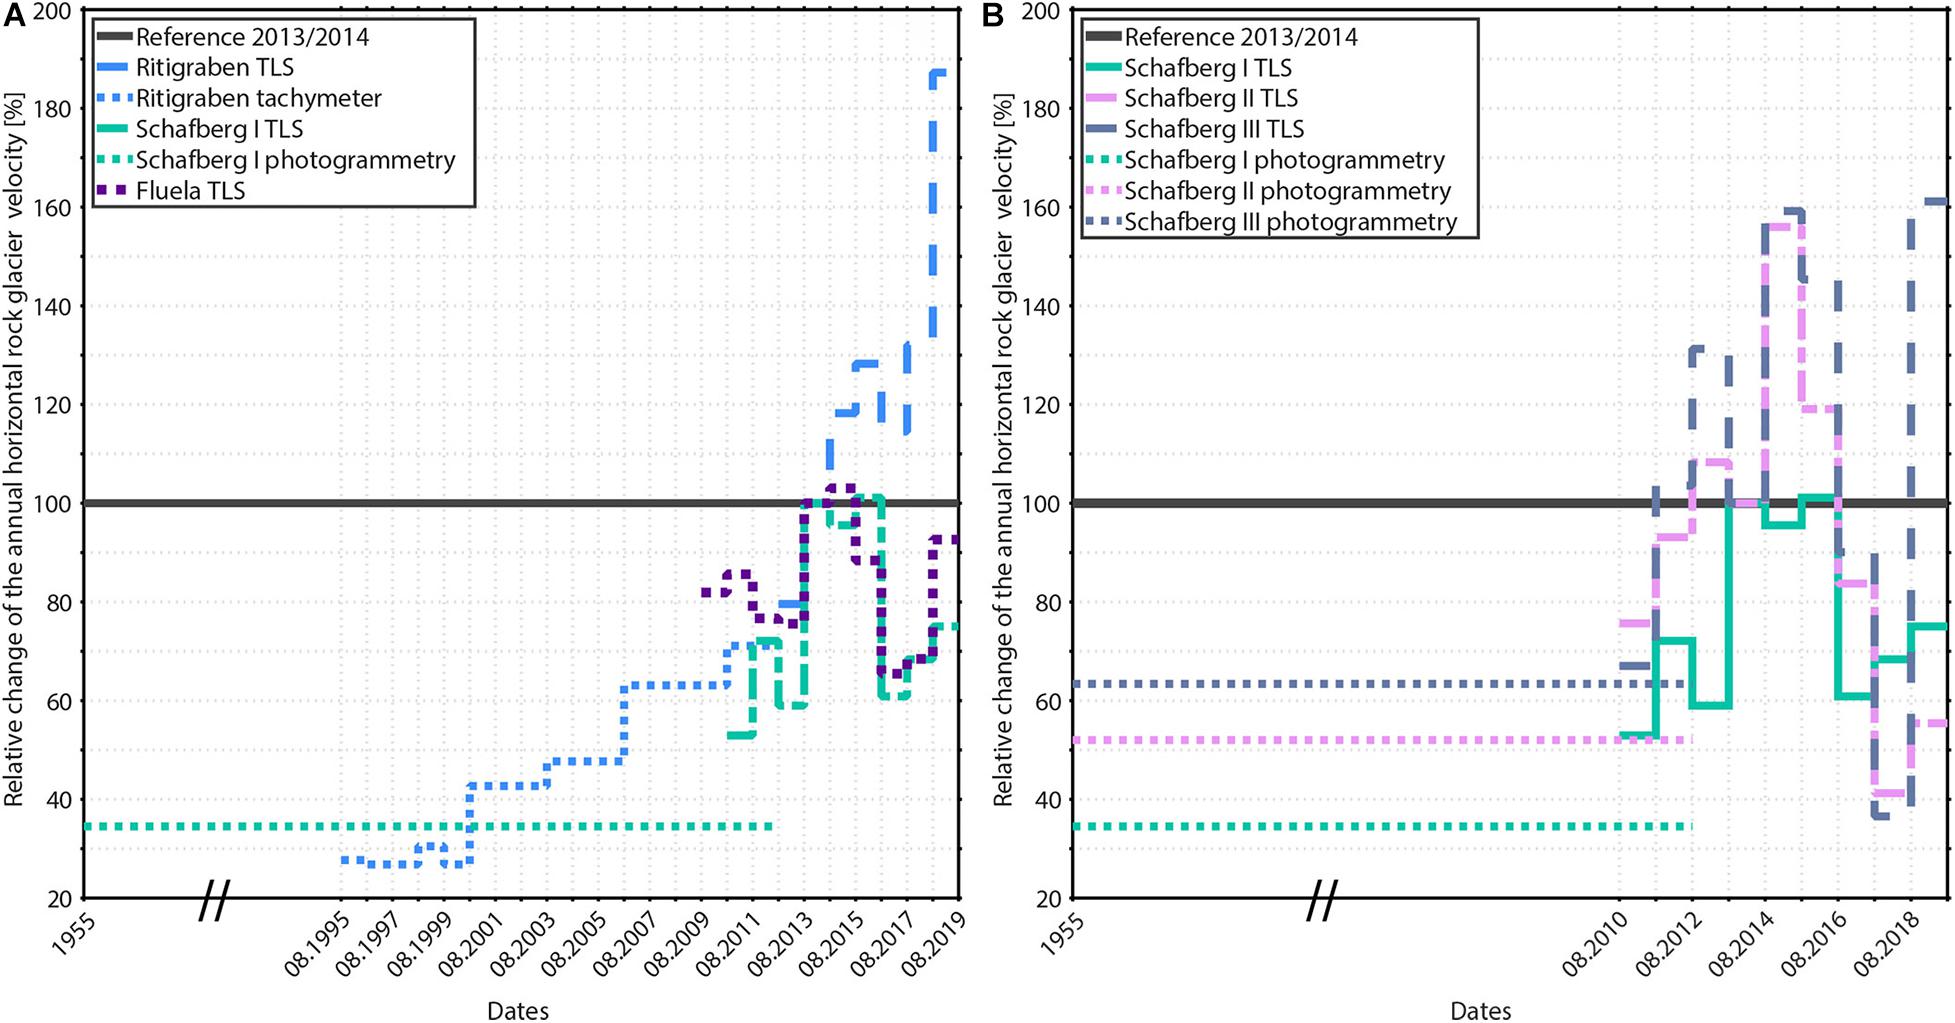
Figure 14. Mean annual horizontal rock glacier velocity in [%] relative to the reference period 2013/2014 at (A) the ice-rich rock glaciers Fluela, Schafberg I and Ritigraben from 1955 to August 2019. (B) The three different rock glacier sections I, II, and III of the Schafberg complex. Data is derived from TLS since 2010. Earlier velocities are from swisstopo airborne images (photogrammetry) at Schafberg rock glacier and from tachymeter observations (data from Rovina & Partner AG) at Ritigraben rock glacier. Irregular tachymeter observations are shown for completeness and are discussed in Kenner et al. (2017a). Please note that the x-axis scale is not linear between 1955 and 2012, as indicated by the two slashes.
In Figure 14B the variability of rock glacier velocity of the three Schafberg rock glacier sections are shown. Although the annual variations of horizontal rock glacier velocity usually have the same sign, they can differ significantly within a site (just as they can between regions).
5 Discussion
5.1 Evolution of Ground Temperatures
The effects of atmospheric changes and snow cover timing and depth (Keller and Gubler, 1993; Bernhard et al., 1998; Zhang, 2005) on permafrost conditions are various and strongly affect ground temperature, active layer, and zero curtain evolution. At snow-influenced monitoring sites snow-poor winters with a delayed snow cover onset (e.g., 2015–2016, 2016–2017; Figure 5) lead to efficient ground cooling and strong ground temperature decreases (e.g., years 2016, 2017 in Figure 6). In contrast, strong ground temperature increases (e.g., 2018, 2019 in Figures 6, 7) as well as prolonged autumn zero curtains (Figure 11) are caused by efficient ground insulation during winters with an early onset of a thick snow cover (e.g., 2017–2018, 2018–2019; Figure 5). During these years (2018, 2019), however, the active layer thickness remained nearly the same (Figure 8), but mean annual active layer thickness increased strongly (Figure 9). This shows that an early onset of an insulating snow cover does not necessarily involve active layer thickening, but causes longer periods with positive ground temperatures in the active layer, which were additionally prolonged by the long and warm summer periods. In contrast to snow-influenced sites, ground temperature and active layer thickness at the snow-poor and ice-poor steep rocky crests at Jungfrau East ridge and Hoernli hut increased over the past decade, which agrees with other observations in the European Alps (Magnin et al., 2015; PERMOS, 2019). These steep slopes are influenced very little by snow and ground temperatures closely follow air temperature evolution (Gruber et al., 2004; Haberkorn et al., 2015). At the rocky ridge sites Hoernli hut and Jungfrau East ridge ground temperature increases are only damped or interrupted during years with a comparatively low mean annual atmospheric 0°C isotherm, as was the case in 2016 and 2017 (MeteoSchweiz, 2020).
In the Alps as well as globally, ground temperature warming rates are higher the lower permafrost temperatures are (Etzelmüller et al., 2020). Changes in ice-rich and ice-poor mountain permafrost occur at different rates and with different consequences (Kenner et al., 2019a). At ice-poor locations a fast reaction of the active layer and of the uppermost part of the permafrost to atmospheric conditions is evident. Summer heat waves can immediately result in active layer thickening. At the ice-poor talus slope Muot da Barba Peider B1 active layer thickness only exceeded 1 m three times during our monitoring period, during the summer heat waves in 2003, 2015, and 2018 (Figures 8E, 9). In contrast to ice-poor sites, the temperature of ice-rich permafrost is nowadays often close to or at 0°C (Figure 6) and ground temperature variations are damped, as shown by the minimum and maximum ground temperature evolution (Figures 10C,D) and prolonged zero curtains (Figure 11) during which ground temperatures remain close to 0°C (Zenklusen Mutter and Phillips, 2012b). The effects of latent heat in ice-rich ground prevent further warming unless the ground ice has melted, which is indicated by small changes in active layer thickness (Figures 8, 9). However, in ice-rich ground the onset of permafrost warming and degradation is shown by talik formation and intensification (Figures 7B,D, 12). The timing of positive ground temperatures in the permafrost body of Ritigraben rock glacier correlates with the infiltration of snow melt water and precipitation pointing towards advective heat flow caused by lateral water flow (Zenklusen Mutter and Phillips, 2012b). The talik formation at borehole Schafberg B1 at 4.7 m depth (Figure 7B) surprisingly started between two winters with a delayed snow cover onset, suggesting that permafrost degradation is self-enforcing once critical amounts of ground ice are melted, and providing space for the establishment of advective heat fluxes.
The calculation of linear temperature trends at different depths can only be reliably assessed based on long-term ground temperature data as shown in Figure 6 (section “4.2.1 Linear Ground Temperature Trends”). The three longest time series of ground temperature measurements presented here cover more than 15 years and thus are still only half as long as the typical 30-year period used in climate change related studies to describe climate norms. These long-term data indicate an increase of ground temperature in all depths. In contrast, data series shorter than ten years partly show negative ground temperature trends. Our results show, however, that it can be assumed that in the long-term, these permafrost boreholes will also show increasing ground temperature trends. Thus, it is shown that shorter data series (<10 years) are not suitable to detect trends, especially at greater depths, where ground temperature variations are driven by long-term changes in the surface energy balance. These changes can only be reliably assessed based on long-term ground temperature data (approximately 30 years). Long-term ground temperature observations are, however, challenging due to several reasons including sensor drift (section “3.2.2 Sensor Drift”), sensor and/or battery failure. For example, in the data-set presented here only 8 years of overlap data without any data gaps exist for only three boreholes (Muot da Barba Peider B1, Schafberg B2, Ritigraben between October 2002 and October 2010) and all indicate a slight positive annual ground temperature trend during this period (not shown).
5.2 Rock Glacier Dynamics
Although acquired by different monitoring methods, the main multi-annual velocity pattern of the rock glaciers investigated here corresponds closely to that of the rock glaciers included in the PERMOS network (PERMOS, 2019). Nevertheless, we found that the results of single point measurement systems (GNSS, total station), obtained in PERMOS, can systematically deviate from the results acquired by area covering methods such as TLS.
Recent literature on rock glacier dynamics highlights the dominant role of water supply as a controlling factor for rock glacier deformation velocities (Jansen and Hergarten, 2006; Kenner et al., 2017a; Buchli et al., 2018; Cicoira et al., 2019a). This becomes most evident in the seasonal velocity changes of rock glaciers (Figure 13) which generally show a minimum in velocity at the beginning of snow melt in spring, followed by a pronounced acceleration during snow melt and a velocity maximum around the date of surface freezing in autumn. The snow cover has a major influence on the water budget of a rock glacier and differences in the inter-annual deformation pattern of individual rock glaciers (Figure 14) can therefore often be explained by different snow regimes (Kenner et al., 2019b). Years with a late snow cover onset can allow active layer freezing several months earlier compared to snow-rich winters with an early snow cover onset. The delayed snow cover causes a fast interruption of water supply into the rock glacier. Consequently, the winter deceleration is pronounced and the rock glacier velocity decreases on an annual basis (e.g., year 2017 in Figure 13). Further, the start of snow melt controls the beginning of the seasonal rock glacier acceleration (Kenner et al., 2019b). As the snow cover influences ground temperatures and the duration of the autumn zero curtain, the latter two can to a limited extent be used as a proxy for the amount and duration of water supply to a rock glacier as well as for rock glacier velocity (Kenner et al., 2019b).
Superimposed by high inter-annual variations, a general trend towards higher deformation velocities of ice-rich permafrost has become evident over the last decades (e.g., Ritigraben rock glacier). Causes are surmised to be a generally increasing water supply to the shear horizons of rock glaciers (e.g., through delayed freezing of the active layer in early winter and early snow melt in spring), induced by climate warming. Warming of the ground and ice melt can furthermore increase the permeability of permafrost bodies, causing a higher ratio of the precipitation runoff to reach the rock glacier shear horizon. In some rock glaciers such as Ritigraben, these processes might cause a self-intensifying acceleration which can in some cases lead to the collapse of large parts of the rock glacier body (Marcer et al., 2019). According to the ground temperature measurements, the strong acceleration of the Ritigraben rock glacier (Figure 14A) might be related to its isothermal state near 0°C during the last years and practically non-existent winter cooling, especially in 2018 and 2019 (Figures 6A–C, 7D).
6 Conclusions and Outlook
In this study the evolution of ground temperatures measured in 9 SLF boreholes and velocities of 3 rock glaciers measured using TLS, photogrammetry and GNSS stations are analysed. For the monitoring period between 1997 and 2019 Switzerland has experienced 18 of 23 years with mean annual air temperature above the 30-year climatic mean (1981–2010). Long-term ground temperature trends indicate an increase of ground temperatures at all depths, in particular at steep and nearly snow-free sites, while shorter data series (less than 10 years) partly show negative ground temperature trends due to short-term weather fluctuations (e.g., snow-poor winters). It is underlined that short data series are not suitable for trend detection, but can be used to see whether inter-borehole temperature variations show similar behaviour.
In addition, it is observed that the active layer is thickening at most sites. The mean annual active layer thickness increase since 2017 indicate prolonged periods of active layer thaw. Maximum and minimum ground temperatures are increasing (only interrupted by individual cooling events) and a considerable damping of annual minima variations at permafrost sites is observed, resulting in lower amplitudes between minima and maxima. Furthermore at most SLF permafrost sites long autumn zero curtains are observed, while spring zero curtains are shorter, in particular at steep, snow-poor sites. Taliks formed in two rock glaciers and spread in the years following their initial appearance.
In general, a strong acceleration of rock glacier velocities can be observed over the last decade, only interrupted in years with snow-poor winters. Within a site rock glacier velocity can differ significantly. Similar patterns of inter-annual rock glacier velocity variations are, however, apparent.
Recent climate change scenarios for the Swiss Alps predict further climate warming accompanied by more frequent weather extremes. This implies that permafrost degradation will continue, particularly in sensitive ice-poor permafrost and that rock glaciers will continue to accelerate in future due to increases in summer precipitation intensity. Mountain permafrost monitoring must therefore continue on a long-term basis. It is essential to complement existing measurements with new ones, for example to monitor changes in the water to ice ratio, especially in ice-rich permafrost. Although water fluxes and taliks can be detected thermally, temperature data do not allow to determine the proportion of water to ice in ice-rich permafrost, as both can be at 0°C due to latent heat effects. Water contents in ice-rich permafrost should be monitored in future using geophysical measurements (e.g., permanent electrical resistivity tomography, electromagnetometry), as rising water contents and water fluxes in shear horizons have likely led to the acceleration of rock glaciers in the past two decades. This might increase the frequency of active layer failure and debris released from steep rock glacier tongues. In addition, more information on ground temperature evolution in steep, ice-poor rock is urgently needed for both institutional and national permafrost monitoring networks, because our data reveal the strongest ground temperature increase here. This would allow to understand the complex interactions between the climate, ground temperatures and permafrost dynamics better and thus the prediction of natural hazards originating in permafrost areas could be improved.
Data Availability Statement
Borehole temperature data of boreholes Schafberg B1 and B2, Ritigraben, Fluela A, Muot da Barba Peider B1, Jungfrau East ridge and Gemsstock N and S are available on the Swiss Permafrost Monitoring Network PERMOS data portal (http://newshinypermos.geo.uzh.ch/app/DataBrowser/). Other borehole data, as well TLS, photogrammetry and GNSS data are available on request from WSL Institute for Snow and Avalanche Research SLF.
Author Contributions
MP designed the borehole measurement set-up. MP and AH carried out the borehole measurements. AH analysed the data including development of new data analysis and prepared the manuscript with contributions from RK, JN, and MP. RK was responsible for TLS, photogrammetry, GNSS, and analysis of this data. All authors contributed to the article and approved the submitted version.
Funding
This project was funded by the Swiss Permafrost Monitoring Network PERMOS, by the Federal Office for the Environment FOEN, and by the Cantons Valais and Grisons.
Conflict of Interest
The authors declare that the research was conducted in the absence of any commercial or financial relationships that could be construed as a potential conflict of interest.
Acknowledgments
We acknowledge Thiemo Theile for his constructive input on data analysis. We thank the entire SLF technical and administrative staff for their productive support. The teams working in the Grächen and Andermatt ski resorts are warmly thanked for their ongoing support with field logistics. The editor AB and the reviewers XB and AO are thanked for their constructive suggestions.
References
Bernhard, L., Sutter, F., Haeberli, W., and Keller, F. (1998). “Processes of snow/permafrost-interactions at a high-mountain site, Murtèl-Corvatsch, Eastern Swiss Alps,” in Proceedings of the 7th International Conference on Permafrost, eds A. G. Lewkowicz and M. Allard (Yellowknife, NT: Université Laval), 35–41.
Biskaborn, B. K., Smith, S. L., Noetzli, J., Matthes, H., Vieira, G., Streletskiy, D. A., et al. (2019). Permafrost is warming at a global scale. Nat. Commun. 10:264. doi: 10.1038/s41467-018-08240-4
Boaga, J., Phillips, M., Noetzli, J., Haberkorn, A., Kenner, R., and Bast, A. (2020). A comparison of frequency domain electro-magnetometry, electrical resistivity tomography and borehole temperatures to assess the presence of ice in a rock glacier. Front. Earth Sci. 8:586430. doi: 10.3389/feart.2020.586430
Buchli, T., Kos, A., Limpach, P., Merz, K., Zhou, X., and Springman, S. M. (2018). Kinematic investigations on the Furggwanghorn Rock Glacier, Switzerland. Permafrost Periglac. Process. 29, 3–20. doi: 10.1002/ppp.1968
Ceppi, P., Scherrer, S. C., Fischer, A. M., and Appenzeller, C. (2012). Revisiting Swiss temperature trends 1959–2008. Int. J. Climatol. 32, 203–213. doi: 10.1002/joc.2260
CH2018 (2018). CH2018 – Climate Scenarios for Switzerland, Technical Report. Zurich: National Centre for Climate Services, 271. doi: 10.18751/Climate/Scenarios/CH2018/1.0
Chen, Y., and Medioni, G. (1991). “Object modeling by registration of multiple range images,” in Proceedings of the IEEE International Conference on Robotics and Automation, (Sacramento, CA: IEEE), 2724–2729.
Cicoira, A., Beutel, J., Faillettaz, J., Gärtner-Roer, I., and Vieli, A. (2019a). Resolving the influence of temperature forcing through heat conduction on rock glacier dynamics: a numerical modelling approach. Cryosphere 13, 927–942. doi: 10.5194/tc-13-927-2019
Cicoira, A., Beutel, J., Faillettaz, J., and Vieli, A. (2019b). Water controls the seasonal rhythm of rock glacier flow. Earth Planet. Sci. Lett. 528:115844. doi: 10.1016/j.epsl.2019.115844
Dach, R., Lutz, S., Walser, P., and Fridez, P. (2015). Bernese GNSS Software Version 5.2. User Manual. Bern: Bern Open Publishing, doi: 10.7892/boris.72297
Dunn, R. J. H., Stanitski, D. M., Gobron, N., and Willett, K. M. (2019). “Global Climate. “State of the Climate in 2018”],” in Bulletin of the American Meteorological Society, Vol. 100, eds J. Blunden and D. S. Arndt (Boston, MA: AMS Publications), 5–19. doi: 10.1175/2019BAMSStateoftheClimate.1
Etzelmüller, B., Guglielmin, M., Hauck, C., Hilbich, C., Hoelzle, M., Isaksen, K., et al. (2020). Twenty years of European mountain permafrost dynamics—the PACE legacy. Environ. Res. Lett. 15:104070. doi: 10.1088/1748-9326/abae9d
Gruber, S., Hoelzle, M., and Haeberli, W. (2004). Rock-wall temperatures in the Alps: modelling their topographic distribution and regional differences. Permafr. Periglac. Process. 15, 229–307. doi: 10.1002/ppp.501
Haberkorn, A., Phillips, M., Kenner, R., Rhyner, H., Bavay, M., Galos, S. P., et al. (2015). Thermal regime of rock and its relation to snow cover in steep alpine rock walls: Gemsstock, Central Swiss Alps. Geografiska Ann. 97, 579–597. doi: 10.1111/geoa.12101
Harris, S. A., French, H. M., Heginbottom, J. A., Johnston, G. H., Ladanyi, B., Sego, D. C., et al. (1998). Glossary of Permafrost and Related Ground-Ice Terms. Technical Memorandum No. 142. Ottawa, ON: Associate Committee on Geotechnical Research.
Hock, R., Rasul, G., Adler, C., Cáceres, B., Gruber, S., Hirabayashi, Y., et al. (2019). “High mountain areas,” in IPCC Special Report on the Ocean and Cryosphere in a Changing Climate, eds H.-O. Pörtner, D. C. Roberts, V. Masson-Delmotte, P. Zhai, M. Tignor, E. Poloczanska, et al. (Geneva: IPCC), 131–202.
Jansen, F., and Hergarten, S. (2006). Rock glacier dynamics: Stick-slip motion coupled to hydrology. Geophys. Res. Lett. 33:L10502. doi: 10.1029/2006GL026134
Keller, F., and Gubler, H. (1993). “Interaction between snow cover and high mountain permafrost,” in Proceedings of the 6th International Conference on Permafrost, (Beijing: South China University of Technology Press), 332–337.
Kenner, R., Bühler, Y., Delaloye, R., Ginzler, C., and Phillips, M. (2014). Monitoring of high alpine mass movements combining laser scanning with digital airborne photogrammetry. Geomorphology 206, 492–504. doi: 10.1016/j.geomorph.2013.10.020
Kenner, R., Noetzli, J., Hoelzle, M., Raetzo, H., and Phillips, M. (2019a). Distinguishing ice-rich and ice-poor permafrost to map ground temperatures and ground ice occurence in the Swiss Alps. Cryosphere 13, 1925–1941. doi: 10.5194/tc-13-1925-2019
Kenner, R., Phillips, M., Beutel, J., Hiller, M., Limpach, P., Pointner, E., et al. (2017a). Factors controlling velocity variations at short-term, seasonal and multiyear time scales, ritigraben rock Glacier, Western Swiss Alps. Permafr. Periglac. Process. 28, 675–684. doi: 10.1002/ppp.1953
Kenner, R., Phillips, M., Hauck, C., Hilbich, C., Mulsow, C., Bühler, Y., et al. (2017b). New insights on permafrost genesis and conservation in talus slopes based on observations at Flüelapass. Eastern Switzerland. Geomorphol. 290, 101–113. doi: 10.1016/j.geomorph.2017.04.011
Kenner, R., Pruessner, L., Beutel, J., Limpach, P., and Phillips, M. (2019b). How rock glacier hydrology, deformation velocities and ground temperatures interact: examples from the Swiss Alps. Permafr. Periglac. Process. 31, 3–14. doi: 10.1002/ppp.2023
Krautblatter, M., Huggel, C., Deline, P., and Hasler, A. (2012). Research perspectives on unstable high-alpine bedrock permafrost: measurement, modelling and process understanding. Permafr. Periglac. Process. 23, 80–88. doi: 10.1002/ppp.740
Kummert, M., and Delaloye, R. (2018). Mapping and quantifying sediment transfer between the front of rapidly moving rock glaciers and torrential gullies. Geomorphology 309, 60–76. doi: 10.1016/j.geomorph.2018.02.021
Luethi, R., and Phillips, M. (2016). Challenges and solutions for long-term permafrost borehole temperature monitoring and data interpretation. Geograph. Helvet. 71, 121–131. doi: 10.5194/gh-71-121-2016
Magnin, F., Deline, P., Ravanel, L., Noetzli, J., and Pogliotti, P. (2015). Thermal characteristics of permafrost in the steep alpine rock walls of the Aiguille du Midi (Mont Blanc Massif, 3842 m a.s.l). Cryosphere 9, 109–121. doi: 10.5194/tc-9-109-2015
Marcer, M., Serrano, C., Brenning, A., Bodin, X., Goetz, J., and Schoeneich, P. (2019). Evaluating the destabilization susceptibility of active rock glaciers in the French Alps. Cryosphere 13, 141–155. doi: 10.5194/tc-13-141-2019
MeteoSchweiz (2020). “Langjährige klimaentwicklung: freie atmosphäre,” in Klimareport 2019, Vol. 70, (Zürich: Bundesamt für Meteorologie und Klimatologie MeteoSchweiz).
MeteoSwissWeb (2020). MeteoSwissWeb. Available online at: https://www.meteoswiss.admin.ch/home/climate/climate-change-in-switzerland/temperature-and-precipitation-trends.html (accessed October 27, 2020).
Mollaret, C., Hilbich, C., Pellet, C., Flores-Orozco, A., Delaloye, R., and Hauck, C. (2019). Mountain permafrost degradation documented through a network of permanent electrical resistivity tomography sites. Cryosphere 13, 2557–2578. doi: 10.5194/tc-13-2557-2019
Murton, J. B., Peterson, R., and Ozouf, J.-C. (2006). Bedrock fracture by ice segregation in cold regions. Science 314, 1127–1129. doi: 10.1126/science.1132127
NCCS (2018). CH2018 – Climate Scenarios for Switzerland. Zurich: NCCS National Centre for Climate Services, 24.
Noetzli, J., Arenson, L., Bast, A., Delaloye, R., Farinotti, D., and Gubler, H. U., et al. (2021). Best practice for measuring permafrost temperature in boreholes based on the experience in the Swiss Alps. Front. Earth Sci. 607875. doi: 10.3389/feart.2021.607875
Noetzli, J., Biskaborn, B. K., Christiansen, H. H., Isaksen, K., Schoeneich, P., Smith, S., et al. (2019). Permafrost thermal state. [in “State of the Climate 2018”]. Am. Meteorol. Soc. 100, 21–22.
Noetzli, J., Christiansen, H. H., Isaksen, K., Smith, S., Zhao, L., and Streletskiy, D. A. (2020). Permafrost thermal state. [in “State of the Climate in 2019”]. Am. Meteorol. Soc. 101, 34–36. doi: 10.1175/2020BAMSStateoftheClimate.1
Noetzli, J., and Phillips, M. (2019). Mountain permafrost hydrology, Hydro-CH2018 Project. Bern: Federal Office for the Environment, 18. doi: 10.16904/slf.1
Pepin, N., Bradley, R. S., Diaz, H. F., Baraer, M., Caceres, E. B., Forsythe, N., et al. (2015). Elevation-dependent warming in mountain regions of the world. Nat. Clim. Change 5, 424–430. doi: 10.1038/nclimate2563
PERMOS (2019). “Permafrost in Switzerland 2014/2015 to 2017/2018,” in Glaciological Report (Permafrost) No. 16-19 of the Cryospheric Commission of the Swiss Academy of Sciences, eds J. Noetzli, C. Pellet, and B. Staub (Bern: Swiss Academy of Sciences), 104. doi: 10.13093/permos-rep-2019-16-19
Phillips, M., Haberkorn, A., Kenner, R., and Noetzli, J. (2020). Current changes in mountain permafrost based on observations in the Swiss Alps. Swiss Bull. angew. Geol. 25, 53–63.
Phillips, M., Zenklusen Mutter, E., Kern-Luetschg, M., and Lehning, M. (2009). Rapid degradation of ground ice in a ventilated talus slope: Flüela Pass, Swiss Alps. Permafr. Periglac. Process. 20, 1–14. doi: 10.1002/ppp.638
Rajczak, J., Pall, P., and Schär, C. (2013). Projections of extreme precipitation events in regional climate simulations for Europe and the Alpine Region. J. Geophys. Res. Atmos. 118, 3610–3626. doi: 10.1002/jgrd.50297
Romanovsky, V. E., Smith, S. L., and Christiansen, H. H. (2010). Permafrost thermal state in the polar Northern Hemisphere during the international polar year 2007–2009: a synthesis. Permafr. Periglac. Process. 21, 106–116. doi: 10.1002/ppp.689
Scherrer, S. C., Fischer, E. M., Posselt, R., Liniger, M. A., Croci-Maspoli, M., and Knutti, R. (2016). Emerging trends in heavy precipitation and hot temperature extremes in Switzerland. J. Geophys. Res. Atmos. 121, 2626–2637. doi: 10.1002/2015jd024634
Wirz, V., Beutel, J., Gruber, S., Gubler, S., and Purves, R. S. (2014). Estimating velocity from noisy GPS data for investigating the temporal variability of slope movements. Nat. Hazards Earth Syst. Sci. 14, 2503–2520. doi: 10.5194/nhess-14-2503-2014
Wirz, V., Gruber, S., Purves, R. S., Beutel, J., Gärtner-Roer, I., Gubler, S., et al. (2016). Short-term velocity variations at three rock glaciers and their relationship with meteorological conditions. Earth Surface Dyn. 4, 103–123. doi: 10.5194/esurf-4-103-2016
WMO (2019). WMO Provisional Statement on the State of the Global Climate in 2019. Available online at: https://library.wmo.int/doc_num.php?explnum_id=10108
Zenklusen Mutter, E., and Phillips, M. (2012a). Active layer characteristics at ten borehole sites in Alpine permafrost terrain, Switzerland. Permafr. Periglac. Process. 23, 138–151. doi: 10.1002/ppp.1738
Zenklusen Mutter, E., and Phillips, M. (2012b). “Thermal evidence of recent talik formation in Ritigraben rock glacier: Swiss Alps,” in Proceedings of the 10th International Conference on Permafrost, (Salekhard), 479–483.
Zhang, T. (2005). Influence of the seasonal snow cover on the ground thermal regime: an overview. Rev. Geophys. 43:RG4002. doi: 10.1029/2004RG000157
Zweifel, B., Pielmeier, C., Marty, C., and Techel, F. (2017). Schnee und Lawinen in den Schweizer Alpen. Hydrologisches Jahr 2016/17, WSL Berichte 61. Davos: WSL-Institut für Schnee- und Lawinenforschung SLF, doi: 10.3929/ethz-a-000008971
Keywords: mountain permafrost, permafrost degradation, active layer characteristics, rock glacier velocities, ground warming, ground temperature
Citation: Haberkorn A, Kenner R, Noetzli J and Phillips M (2021) Changes in Ground Temperature and Dynamics in Mountain Permafrost in the Swiss Alps. Front. Earth Sci. 9:626686. doi: 10.3389/feart.2021.626686
Received: 06 November 2020; Accepted: 22 March 2021;
Published: 19 April 2021.
Edited by:
Annett Bartsch, b.geos GmbH, AustriaReviewed by:
Alexandru Onaca, West University of Timiş oara, RomaniaXavier Bodin, Centre National de la Recherche Scientifique (CNRS), France
Copyright © 2021 Haberkorn, Kenner, Noetzli and Phillips. This is an open-access article distributed under the terms of the Creative Commons Attribution License (CC BY). The use, distribution or reproduction in other forums is permitted, provided the original author(s) and the copyright owner(s) are credited and that the original publication in this journal is cited, in accordance with accepted academic practice. No use, distribution or reproduction is permitted which does not comply with these terms.
*Correspondence: Anna Haberkorn, YW5uYS1oYWJlcmtvcm5AZ214LmRl