 Bo-Ye Fu
 Li-Yun Fu
 Tongcheng Han2,4
 Chenghao Cao
- 1Key Laboratory of Earth and Planetary Physics, Institute of Geology and Geophysics, Chinese Academy of Sciences, Beijing, China
- 2Key Laboratory of Deep Oil and Gas, China University of Petroleum (East China), Qingdao, China
- 3Institutions of Earth Science, Chinese Academy of Sciences, Beijing, China
- 4Laboratory for Marine Mineral Resources, Qingdao National Laboratory for Marine Science and Technology, Qingdao, China
- 5School of Transportation Engineering, Nanjing Tech University, Nanjing, China
Crack surfaces are usually rough on various scales, and are sensitive to loading stresses and hence significantly affecting the mechanical properties of cracked rocks. We design a number of dry- and fluid-saturated numerical cracked samples to investigate the roughness influence of crack surfaces on the elastic stiffness. The fracture surface roughness is characterized by non-uniform fracture radii. We calculate the elastic moduli of cracked samples by finite-element simulation. Comparisons with the theoretical predictions by Gassmann and C&S (Ciz and Shapiro) (Ciz and Shapiro, Geophysics, 2007, 72(6), A75–A79) substitution equations demonstrate that the rough crack surfaces for both dry- and fluid-saturated samples can induce a stress concentration around the crack that reduces the elastic moduli and decreases the stiffness of rocks. For the fluid/solid-saturated cracks under the normal (shear) loading stresses, because the stress-concentration can induce shear (normal) strains around fracture, shear (bulk) modulus of the filling material will have contributions to the effective bulk (shear) modulus of rocks. The extra contribution, however, makes the Gassmann equation and C&S equation invalid.
Introduction
The characterization of fracture geometry is essential for a wide range of applications, such as geothermal production, hydrocarbon exploration, nuclear waste disposal, and CO2 storage (Pruess, 2006; Hyman et al., 2015). The medium stiffness can be an effective tool for characterizing their surface geometry because of the sensitivity of medium stiffness to the fracture surface geometry, (e.g. Liu, 2005; Sevostianov and Kachanov, 2008; Gao and Gibson, 2012), which has been a strong interest of researchers.
Techniques aiming to detect fracture networks and surfaces in formations have attracted many attentions, (e.g. Kawahara, 1992; Sevostianov and Kachanov, 2008; Guo et al., 2018a). Fracture networks and surface geometry will influence the effective elastic moduli of rocks, which, in turn, can be used to detect the fracture networks and surface geometry features, (e.g. Zimmerman et al., 1986; Kachanov, 1993; Sevostianov and Kachanov, 2008). Researches on these issues can be traced back to around 1970s. Toksöz et al. (1976) take pores and flaws in porous rocks as oblate spheroids with varying aspect ratios, which tend to be closed under differential pressures, and the change of fracture density will influence the stiffness of rocks. Cheng and Toksöz. (1979) conduct a comprehensive investigation of stress-induced velocity variations using fractures with varying aspect ratios, and confirm that the deformation of fractures significantly influences elastic wave velocities. Then, more researchers have focused on the influence of fractures on the rock stiffness properties, (e.g. Zimmerman et al., 1986; Zimmerman, 1991; Shapiro, 2003; David and Zimmerman, 2012; Fu and Fu, 2017, Fu and Fu, 2018). According to these studies, in conclusion, the open or closure of fractures will influence the fractured rock stiffness. The tectonic stress controls the closure or open of the fractures, and therefore changes the stiffness of the fractured rocks (Shapiro, 2003; Grechka and Kachanov, 2006; David and Zimmermann, 2012; Fu and Fu, 2018; Zong et al., 2020). However, many investigations are based on phenomenological models, relating the fracture geometry influence to its stiffness by empirical equations. The parameters of the empirical equations are obtained by fitting experimental measurements, which do not really explain the influencing mechanism of the fracture geometry on the rock effective elastic moduli.
To approach the elastic properties of fractured rocks more theoretically, the compliance of ellipsoidal fractures becomes a major issue, (e.g. Eshelby, 1957; Budiansky and O’connell, 1976; Kachanov, 1980; Sevostianov and Kachanov, 2002a). Hudson (1981); Hudson. (1988) takes fractures as circular inclusions in an elastic host medium and formulates the fracture influence on the elastic properties. Kawahara et al., (e.g. Kawahara, 1992; Kawahara and Yamashita, 1992; Kawahara, 2011) further regard fractures as first-order perturbations on the host medium and propose a model of frequency-dependent elastic moduli for aligned slit fractured sample based on the Foldy approximation (Foldy, 1945). This method has been extended to poroelastic media (Galvin and Gurevich, 2007; Galvin and Gurevich, 2009; Song et al., 2017a; Song et al., 2017b; Fu et al., 2020), focusing on the fracture lengths influence on the elastic moduli. Guo et al. (2018d) and Song et al. (2019); Song et al. (2020c) further study the fracture thicknesses influence on the frequency-dependent elastic moduli for fluid-saturated fractured rocks. Recently, Song et al. (2020a), Song et al. (2020b) have further researched the frequency-dependent elastic moduli for fluid-saturated fractured rocks with rectangular cracks and compressible fluid. However, these researches focus on the analytical solutions with the assumption of aligned fractures of the same scale.
Because fractures are distributed randomly with complex networks and rough surface, numerical simulations have been widely used to calculate effective elastic moduli, for example, finite-difference method (FDM) simulation for the variation of effective elastic moduli vs. fracture density (Saenger and Shapiro, 2002; Saenger et al., 2004), and the scattering effect of fractures (Vlastos et al., 2003; Vlastos et al., 2006; Vlastos et al., 2007). Recently, poroelastic finite-element method (FEM) simulation has been used to investigate the frequency-dependent elastic properties of porous rocks with intersecting fractures (Rubino et al., 2008; Rubino et al., 2016), and has indicated that the attenuation of P- and S-waves becomes dominant in the presence of fluid diffusion in the connected fractures, (e.g. Quintal et al., 2014; Rubino et al., 2015). Zhu and Shao. (2017) have done a complete review of the models describing the fractured rock effective moduli. However, all the researches studying the fractured rock effective elastic moduli above assume the fractures are penny-shaped or slit, with smooth surface.
The fracture surfaces in real rocks are rough, (e.g., Sevostianov and Kachanov, 2002b; Zong et al., 2017, Zong et al., 2020). The surface roughness significantly affects the fracture stiffness. Although the fracture surfaces are complex for natural rocks, their characteristics can be described by random functions, (e.g. Brown and Scholz, 1985; Gao and Gibson, 2012). Greenwood and Williamson. (1966) investigate the normal contact deformation problem of a rough surface and a flat surface based on the Hertzian contact theory, by assuming the Gaussian and exponential distribution of the asperity heights. Walsh and Grosenbaugh. (1979) apply the assumptions and methods of Greenwood and Williamson (1966) to study the effective compressibility of the two contacted rough surfaces and conclude that the effective stiffness is linearly proportional with the pressure. After that, more attentions are paid to the elastic mechanisms of rough fracture surfaces, (e.g. Johnson et al., 1972; Brown and Scholz, 1985; Priest and Taylor, 2000). A comprehensive review on these researches is made by Johnson (1985). The fracture compliance has been calculated for several types of irregularities, (e.g. Gao and Gibson, 2012; Sevostianov and Kachanov, 2012). However, these researches are limited to a single fracture with rough surface. For real rocks, the fractures are existent in rocks as fracture cluster, (e.g. Saenger and Shapiro, 2002; Saenger et al., 2004). However, there are no detailed researches about the fracture cluster with rough surface influence on the effective elastic properties of the fractured rocks.
In this paper, we study the dependency of fractured rock effective elastic moduli on the fracture surface roughness. We design seven fractured numerical samples. Each sample contains a series of fractures with the same perturbation of the square of the radius of the fracture. Different samples have fractures with different perturbation of the square of the radius. The square of fracture radius is controlled by the normal distribution function (Brown and Scholz, 1985; Adler and Thovert, 1999). To focus on the perturbation of the square of fracture radius influence on the fractured medium, we maintain the expectance of the square of the fracture radius and the aspect ratios of the fractures as constants, and vary the standard square of the fracture radius deviation to change the roughness of the fracture. We use the perturbation of square of fracture radius to represent the fracture surface roughness. The FEM simulation is used to compute the effective elastic moduli of each sample. We also assume the orientation and distribution of fractures are uniform to eliminate their effects. The calculated elastic moduli can be correlated to different levels of surface roughness. Comparisons with the Gassmann and C&S substitution equations predictions are conducted to evaluate the influence of the fracture surfaces roughness.
Methodology
The rough fracture surfaces can be generated by random functions, (e.g. Gangi, 1978; Sevostianov and Kachanov, 2008; Fu et al., 2020). On the other hand, the ellipses are widely used to characterize the fractures, (e.g. Eshelby, 1957; Cheng, 1978; Hudson, 1981; Kachanov, 1992; Guo et al., 2018a). In this work, fractures are considered as ellipses with the square of radii controlled by random functions, (e.g., Eshelby, 1957; Budiansky and O’connell, 1976; Sevostianov and Kachanov, 2012), as formed by Eq. 1,
where x and y are the coordinates of the point in 2D surface. a = 1, b = 0.4. The aspect ratio (α = bR/aR = b/a) of the fracture is 0.4. In this research, we focus on the influence of the perturbation of square of factures radius (R2) on the effective elastic moduli of the sample. We maintain the mean area of the fractures in the sample as a constant value, and vary R2 using the normal distribution function with the expectation of R2 as 9 mm2. Seven numerical samples, containing fractures with standard R2 deviation (perturbation of R2) ranging from 0 to 2.1 mm2, are generated. The side length L of each sample is fixed at 60 mm. The area of each fracture is a constant as πab < R2>, equaling 11.304 mm2, where < > represents the expectation value. Twenty-five fractures are inserted in each sample. The total fracture area for each sample is 282.600 mm2. We assume there are no other pores in the host medium, and the porosity of the sample is the ratio between the total fracture area and the sample area, determined to be 7.85%. We consider the orientations of fractures are distributed uniformly. The uniform distribution of the centers of fractures are also assumed, so the rock samples are macroscopically isotropic. The samples with different perturbation of R2 are shown in Figures 1A,B.
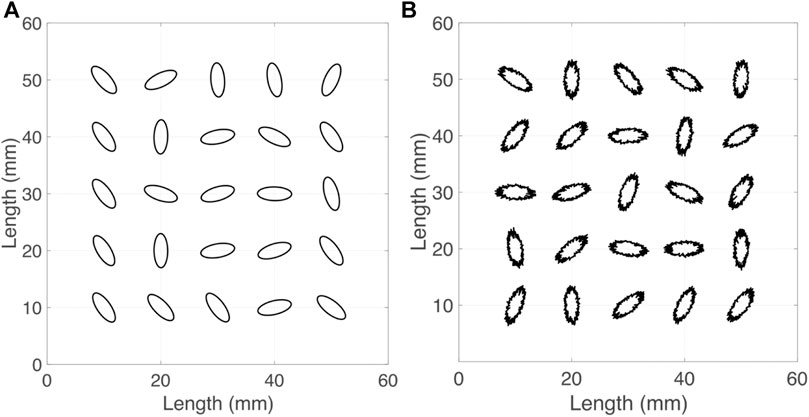
FIGURE 1. The cracked rock models. (A) The crack with the standard deviation of R2 as 0 mm2(B) The crack with the standard deviation of R2 as 2.1 mm2.
For the fractures with rough surfaces, among the parameters describing fracture surface roughness, (e.g. Joint Roughness Coefficient (JRC), Z2, and fractal dimension), Z2 is one of the most widely used statistical parameters in surface roughness analysis, and is shown to correlate well with JRC. The equation calculating Z2 is given by (Barton et al., 1985)
where n is the number of surface profiles, L is the profile length, and xi is the coordinate of the surface profile in the point i. zi is the height of fracture surface at point i. If the value of xi-1-xi is a constant, as C. Eq. 2 can be simplified as
In this research, we use the radius in point i, Ri, replacing zi, and Eq. 3 can be rewritten as
Therefore, it can be obtained that
According to Zhao et al. (2019), surface with higher value of Z2 is rougher. We have calculated the relation between Z2 and perturbation of R2 as shown in Figure 2. There is a positive linear relation between the perturbation of R2 and Z2. Therefore, the perturbation of R2 can represent the roughness of the fracture surface.
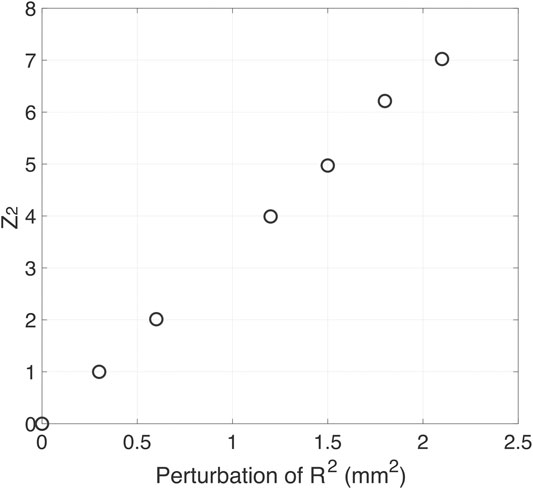
FIGURE 2. The relation between perturbation of R2 and Z2.
To compute the effective elastic moduli of the fractured samples, we load the static homogeneous stresses on the samples, and solve the static elastic equation at each node by FEM simulation (Saxena and Mavko, 2014), with the static elastic equations as
and the stress σij is expressed as
where eij is the strain tensor, given by
and
where ui is the displacement of each node of the sample, K and μ are the bulk and shear moduli of each node in the sample, respectively. The elastic moduli of fractures are different from those of the host medium. The elastic moduli of the host medium are the same for the all samples. Combining equations from Eqs. 6–9, we can calculate the stress σij and strain eij in each node of the samples, by FEM simulation. Through the stress distribution, we can observe the stress concentration directly.
All the FEM numerical simulations are conducted using commercial software (COMSOL 5.5), which can mesh the fractures automatically, and satisfy the stable condition. This kind of commercial software has been used widely (Li et al., 2009). To maintain the accuracy of the simulation, the smallest scale of the mesh is 0.05 mm, as shown in Figure 3. It should be noted that, although the 3-D simulation is more suitable for modeling real rocks, according to Rubino et al. (2008); Rubino et al. (2015); Rubino et al. (2016), and Saxena and Mavko (2014), the accuracy of 2-D numerical simulation is acceptable to extract the effects of fracture surface roughness on effective elastic moduli. In this research, we conduct numerical simulation on 2-D model.
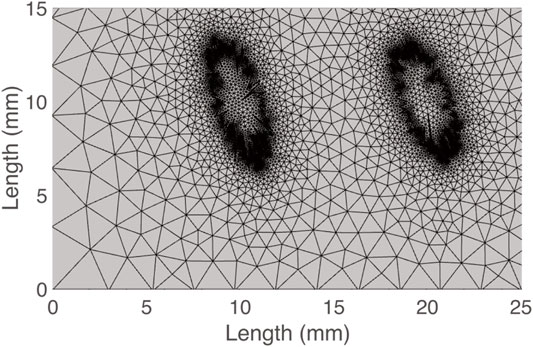
FIGURE 3. The mesh around the fracture.
To compute the effective bulk moduli of isotropic samples, we load a homogenous confining pressure P, as presented in Figure 4A. By solving Eqs. 6–9, the strain eij and e at each node are obtained, and the effective bulk modulus Ke of each sample is
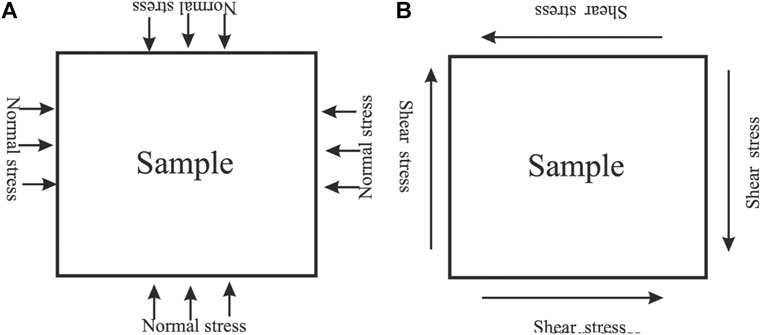
FIGURE 4. The test models, (A) The confining pressure test, (B) the pure shear stress test.
Similarly, we obtain the effective shear modulus μe from the shear tests, by loading the homogenous pure shear stress τ12, as shown in Figure 4B. The effective shear modulus μe is expressed as
The fractures are important channels and spaces for water/kerogen diffusion and enrichment. Especially for the rocks with low porosity and permeability, (e.g., Gale et al., 2014; Guo et al., 2018c), fractures are usually saturated with water or kerogen. It is important to study the fracture surface roughness influence on fluid/solid substitution process of fractured samples. The elastic moduli of dry sample are computed by FEM simulation, and then, we calculate the elastic moduli of the water- and kerogen-saturated samples by FEM simulation, Gassmann equation and C&S (Ciz and Shapiro) equation (e.g., Gassmann, 1951; Ciz and Shapiro, 2007), respectively.
Gassmann equation (Gassmann, 1951) is expressed as
where Ksatw and μsatw are the bulk and shear moduli of the water-saturated sample, respectively. Kdry and μdry are the bulk and shear moduli of the dry sample calculated by FEM, respectively, in this research. The pore space modulus M is given as
where α = 1-Kdry/KB is the Biot-Willis coefficient (Biot and Willis, 1957). KB is the bulk modulus of the host medium. Kf is the bulk modulus of water.
The C&S equation (Ciz and Shapiro, 2007) is summarized as
where Ksatk and μsatk are the bulk and shear moduli of the kerogen saturated medium. Kk and μk are the bulk and shear moduli of kerogen. μB is the shear modulus of the host medium. Because Gassmann equation and C&S equation are valid to predict the effective elastic moduli of homogenous saturated rocks, comparison between the FEM simulation results and the Gassmann equation/C&S equation results will verify whether the two equations are valid, and whether the samples are homogenous. The difference between FEM simulation results and the Gassmann equation/C&S equation results indicates the changing of the heterogeneity of the sample, (e.g. Brown and Korringa, 1975; Saxena and Mavko, 2014). The differences should be increasing with the increase of the heterogeneity of the samples.
According to Saxena and Mavko. (2014), both Gassmann equation and C&S equations are set up based on reciprocal theory. These two kinds of equations assume samples are homogenous (Mavko and Mukerji, 2013). When confining pressure is loaded on samples, there are only elastic energy and normal strain induced by the normal stress of the sample, and only the bulk modulus of the inclusion has contributions to the effective bulk modulus. It is the same for the effective shear modulus. However, as verified by Saxena and Mavko. (2014), when the sample is heterogenous (the heterogeneity is induced by the distribution or geometry of the inclusion), if the normal stress is loaded on the sample, it will induce shear stress around the inclusions, and shear strain will be generated. Therefore, the shear modulus of the inclusions will have contribution to the effective bulk modulus. It is also the same for the effective shear modulus. All the explanations above mean the distribution or geometry of the inclusion maybe will make the Gassmann equation and C&S equation invalid (Mavko and Mukerji, 2013).
Results
The effective elastic moduli Ke and μe are obtained by FEM simulation. The host medium bulk modulus KB = 29.78 GPa, the host medium shear modulus μB = 22.30 GPa. For the dry numerical samples, the elastic moduli of filling material are zero. In the first stage, effective elastic moduli of dry samples are computed. Then, the water- and kerogen-saturated sample are considered. The bulk modulus of water Kf is 2.25 GPa, and the shear modulus is zero. The bulk modulus of kerogen Kk is 2.9 GPa, and shear modulus of kerogen μk is 2.70 GPa (Mavko et al., 2009). Before doing the calculation, we do verify that all the numerical samples maintain the isotropic assumption, first. We conduct the numerical tests as shown in Appendix A. According to the results in Appendix A, the macroscopic isotropic assumption of each sample is maintained. In addition, we should also test the consistency between FEM simulation and Gassmann equation/C&S equation for homogenous and isotropic medium. The numerical test sample is presented in Figure 5. To maintain homogeneity and isotropy of the sample, all fractures are perfect circles, with radius as 1.895 mm to maintain the fracture area as 11.304 mm2. The total porosity of the test sample is the same as the numerical samples in the study as 7.85%.
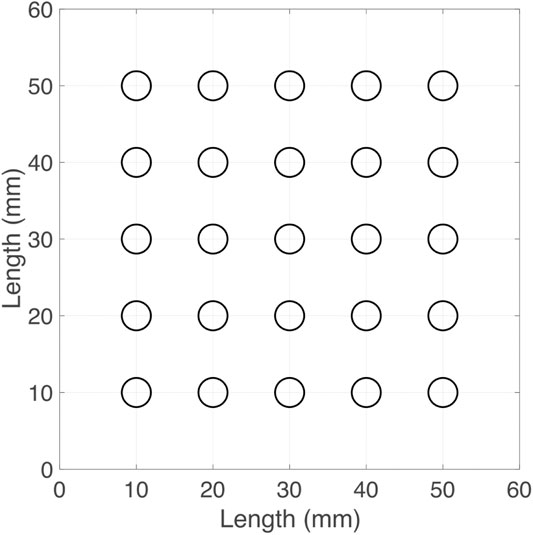
FIGURE 5. The model for the test.
We use FEM simulation to calculate the elastic moduli of dry sample, first. Then, we use FEM simulation, Gassmann equation and C&S equation to calculate the elastic moduli of water- and kerogen-saturated samples, respectively. The results are given by Table 1. The numerical error between the substitution equations and numerical results are less than 0.4% for the elastic moduli of kerogen-saturated sample, and the shear modulus of water-saturated sample. The numerical error between Gassmann equation and numerical result is 1.5% for the bulk modulus of water-saturated sample. The error in the bulk modulus might be induced by the interaction between fractures (Guo et al., 2018a). Both Gassmann and C&S equations are valid for homogenous and isotropic and homogenous medium. When we compare the difference between the FEM simulation results and substitution equation, if the differences between the numerical and substitution equation results are larger than the numerical errors, it should be induced by the fracture surface roughness.

TABLE 1. The simulation and substitution equation results of the test sample.
Elastic Moduli of Dry Cracked Sample
In this section, we calculate the elastic moduli of dry numerical samples. Through FEM simulation, we obtain the variation of bulk and shear moduli of dry samples. As presented in Figures 6A,B, both bulk and shear moduli of the dry samples are decreasing sharply with the increase of the perturbation of R2. Because porosity is a constant, and there are no fluid or solid filling the fractures, the decrease of the bulk and shear moduli are resulting solely from the increase of the perturbation of R2. The sample with higher fracture surface roughness has lower stiffness.
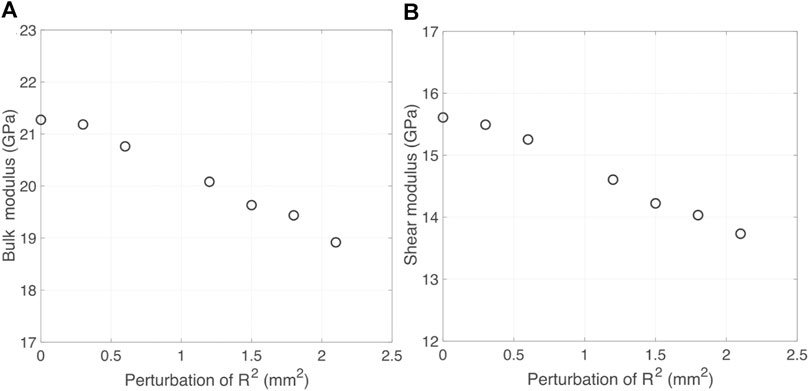
FIGURE 6. (A) the variation of bulk modulus of dry samples vs. the perturbation of R2, (B) the variation of shear modulus of dry samples vs. the perturbation of R2.
Elastic Moduli of Samples Saturated With Water
We further calculate the bulk and shear moduli of water-saturated sample by FEM and Gassmann equation based on the elastic moduli of dry numerical sample calculated in the last subsection, respectively. Figures 7A,B show the bulk and shear moduli variations vs. perturbation of R2 of the water-saturated samples for both Gassmann equation predictions and FEM results. The comparisons between the results of FEM simulation (circle) and the Gassmann equation (square) show that the bulk moduli calculated by FEM simulation are less than those from Gassmann equation with a constant value. This kind of difference may be caused by the interaction between the fractures, which is as also observed by Zhao et al. (2016); Guo et al. (2018a); Guo et al. (2018b); Cao et al. (2019); Cao et al. (2020); Zhao et al. (2020) have also used the stress amplification and stress shielding to explain the influence of the interaction. Because the relative difference between the two kinds of bulk moduli are at about 1.5%, similar to the numerical error, we do not focus on the bulk modulus variation of water-saturated sample. We mainly focus on the shear modulus. The difference in shear modulus is obvious, and is larger than numerical error. The shear moduli obtained from FEM simulation are higher than the value of Gassmann equation (Figure 7B). As shown in Figure 7D, the rough fracture surfaces will induce normal stress around the fractures, when shear stress is loaded. Because the saturated fluid has bulk modulus, and the normal stress around fractures will interact with the fluid, the bulk modulus of the filling fluid will increase the effective shear modulus. However, for Gassmann equation, as shown in Eq. 13, the effective shear modulus is only related to the shear modulus of dry samples. Therefore, the effective shear moduli of water-saturated samples obtained by Gassmann equation are less than the values of FEM simulation. As plotted in Figure 7B, with the increase of the perturbation of R2, the differences of shear moduli between Gassmann equation and FEM simulation are increasing. This indicates the contribution of the bulk modulus of the filling fluid to the shear modulus is increasing. In this study, the porosity of each sample is maintained as a constant, and the orientations of the fractures are also uniformly randomly distributed (the probability of different orientations are the same). Only the fracture surface roughness can generate this difference. The fracture with rougher surface will cause more normal stress around the fractures. The contribution of the bulk modulus of the filling fluid will also be increased.
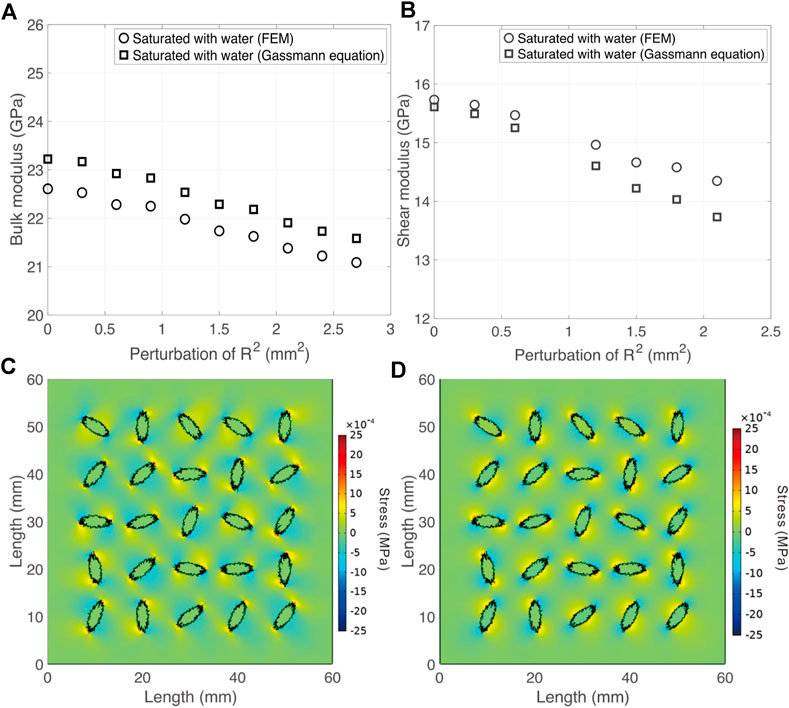
FIGURE 7. (A) the variation of bulk moduli of water-saturated samples vs. perturbation of R2, (B) the variation of shear moduli of water-saturated samples vs. perturbation of R2, (C) the distribution of shear stress when the sample loaded by normal stress, (D) the distribution of normal stress when the sample loaded by shear stress.
Gassmann equation is valid for homogenous medium (Saxena and Mavko, 2014). However, the difference between the numerical simulation and Gassmann equation results and the stress distribution in Figures 7A–D verify that the ellipsoidal fractures with rough surfaces will induce the local stress heterogeneity and strain heterogeneity of the sample. The local stress heterogeneity and strain heterogeneity will lead to the failure of the Gassmann equation (Mavko and Mukerji, 2013; Saxena and Mavko, 2014).
Elastic Moduli of Samples Saturated With Kerogen
We continue to analyze the two sets of kerogens-saturated results predicted by FEM simulation and C&S equation (Ciz and Shapiro, 2007) in this subsection, respectively. In Figures 8A,B, both bulk and shear moduli are decreasing with the increasing perturbation of R2. The results of FEM simulation are higher than the results of C&S equation. C&S equation is only valid for homogenous sample. According to Eq. 15, the effective bulk modulus is only influenced by the bulk moduli of the host medium and the filling solid. However, for the fractured sample in this research, as shown in Figure 8C, there are shear stresses around the fractures, when the normal stress is loaded. The shear stress will interact with the inclusions, and the shear modulus of the inclusion will have contributions to the effective bulk modulus of the sample. Therefore, the effective bulk modulus calculated by FEM simulation is higher than the result of C&S equation. To analyze the variation of shear modulus as plotted in Figure 8B, we also calculate the normal stress around the fractures. According to the normal stress distribution in Figure 8D, the bulk modulus of kerogen will also increase the effective shear modulus, and generate higher shear modulus, as calculated by the FEM simulation. Additionally, compared with the elastic moduli calculated by C&S equation, the variation of the elastic moduli calculated by FEM simulation are more stable. One reason for this phenomenon is that, although the perturbation of R2 will decrease the stiffness of dry samples, when we load normal (or shear) stress around the fractures, the fractures with rougher surfaces will induce more shear (or normal) stress around the fractures, and the shear (or bulk) modulus of the filling solid will also have contribution to the effective elastic moduli. C&S equation does not calculate the contribution of the shear (bulk) modulus of the inclusions. Therefore, the effective elastic moduli calculated by the FEM simulation is higher than that obtained by C&S equation, and the FEM simulated elastic moduli are more stable.
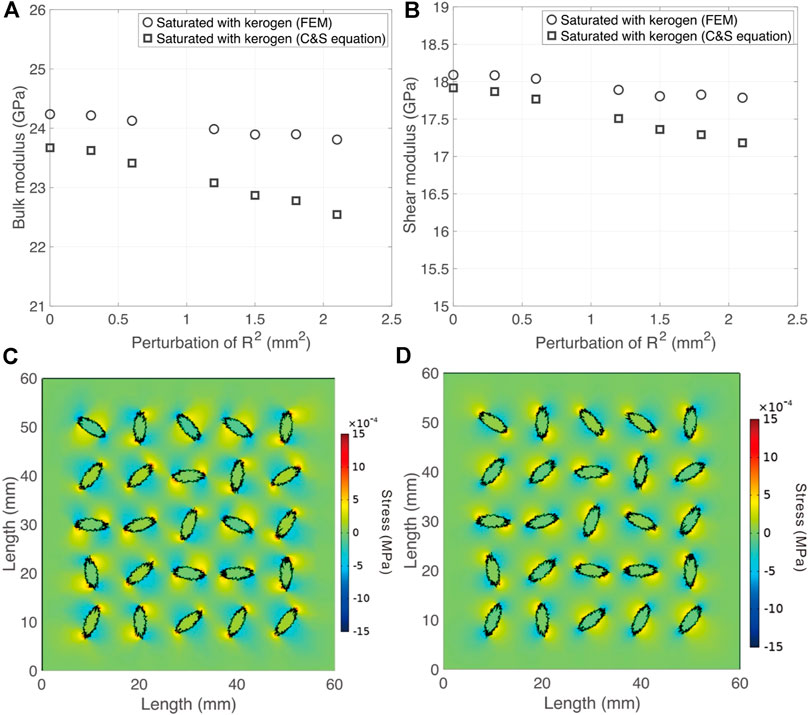
FIGURE 8. (A) The variation of bulk moduli of kerogen-saturated samples vs. the perturbation of R2, (B) the variation of shear moduli of kerogen-saturated samples vs. the perturbation of R2, (C) the distribution of shear stress when the sample loaded by normal stress, (D) the distribution of normal stress when the sample loaded by shear stress.
As verified by Saxena and Mavko. (2014), only when samples are homogeneous and isotropic, C&S equation is valid (Eqs. 15, 16). According to the results in Figures 8C,D, because of the stress concentration around the fractures induced by the rough fracture surface (Kubair and Bhanu-Chandar, 2008), the strain distributions of saturated samples are heterogenous, and the C&S equation is invalid.
Discussions
From the simulation results of dry numerical samples, we have observed linear decrease of elastic moduli of dry samples vs. the perturbation of R2 of the fractures, as presented in Figures 6A,B. When samples are saturated with water and kerogen, because of the stress concentration caused by the rough fracture surfaces, the shear and bulk moduli of the inclusions will have contributions to the effective bulk and shear moduli, respectively. The fracture with rougher surface will generate higher stress concentration, and the shear and bulk moduli of the inclusions will have more contributions to the effective bulk and shear moduli, which will decrease the reducing speed of the elastic moduli.
In this study, we have also calculated the stress distribution of the dry samples with different fracture surface roughness, as shown in Figures 9A–D. Figures 9A,B show normal and shear stress distribution for the dry rock sample with the fracture radius standard deviation as 0 mm, for confining pressure and shear stress loaded tests respectively. Because there is no fluid or solid in the sample, the elastic moduli of fractures are zero, and the stress inside the fracture is low. Because the fracture surface is smooth, the stresses concentration around the fracture is low. The stress distribution heterogeneity is also low, and the elastic moduli is higher, as shown in Figures 6A,B. With the increase in the perturbation of R2, the stress concentration around fractures become larger, as shown in Figures 9C,D (standard R2 deviation is 2.1 mm2). As a result, the heterogeneity of the stress distribution of the sample is increasing, and the elastic moduli become lower (Figures 6A,B). In this research, we have maintained the porosity unchanged, and the orientations of fractures are uniform. The increase of the stress concentration is induced by the increase of fracture surface roughness (perturbation of R2). It also can be known that the stress concentration induces the decrease of elastic moduli of dry samples.
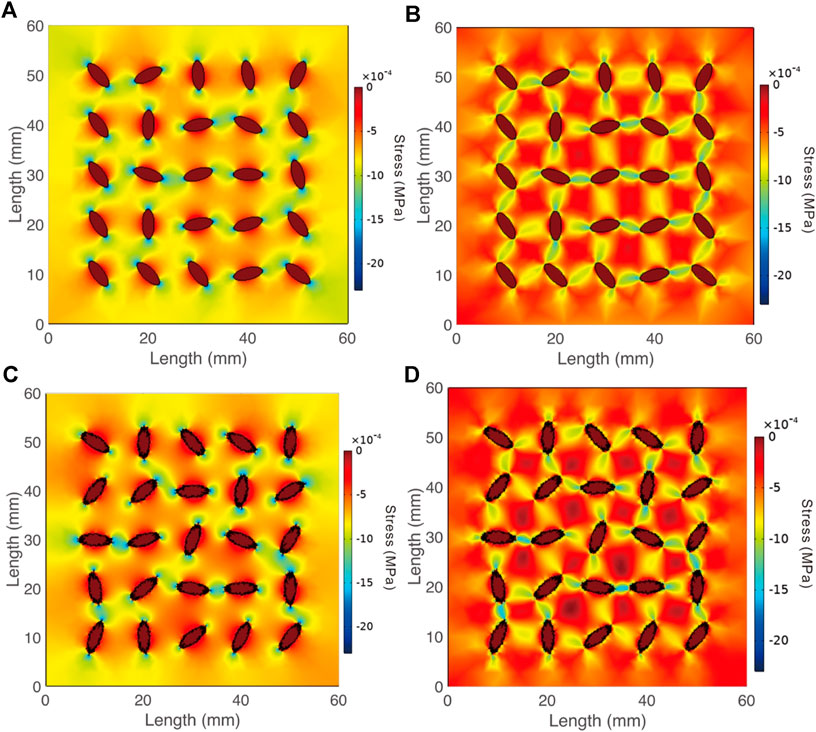
FIGURE 9. The stress distribution of cracked rock models, (A) normal stress distribution of the crack rock model with deviation as 0, (B) shear stress distribution of the crack rock model with deviation as 0, (C) normal stress distribution of the crack rock model with deviation as 2.1 mm2, (D) shear stress distribution of the crack rock model with deviation as 2.1 mm2.
According to the analysis above, fracture surface roughness controls the stress concentration around the fracture surface and the heterogeneity of the stress. The higher perturbation of R2 of fracture will induce higher stress concentration. The stress will concentrate around the peak of the fractures with large ratio between its length and its thickness (Kubair and Bhanu-Chandar, 2008). When the perturbation of R2 (roughness) of the fracture is higher, it will generate more peaks with larger ratio, as well as higher stress concentration. Stress concentration will induce strain concentration around the fracture, and increase the strain in local region. When the loaded stress is the same, (e.g. Kubair and Bhanu-Chandar, 2008; Fu and Fu, 2018), the total strain will increase, because of the strain concentration. Therefore, the sample, with larger stress concentration, will be softer, and the elastic moduli will decrease.
According to the results in Figures 7, 8, the elastic moduli variation of saturated samples predicted by Gassmann and C&S equations are more drastic. According to Gassmann equation and C&S equation, the effective bulk moduli of samples saturated with fluid or solid are only related to the bulk moduli of the inclusions and host medium, and the effective shear moduli are only related to the shear moduli of the inclusions and host medium. However, because of the surface roughness of the ellipsoidal fractures, when stress is loaded on the sample, there is stress concentration around the fractures, the shear and bulk moduli of the filling medium will also have contributions to the effective bulk and shear moduli, respectively. The fractures with higher perturbation of R2 will induce higher stress concentration, and the filling medium will have more contribution to the effective bulk and shear moduli. As a result, the elastic moduli obtained by FEM simulation is larger than that predicted by Gassmann equation and C&S equation, and the variation of the elastic moduli obtained by FEM are the more stable.
It should be noted that, the bulk moduli of the water-saturated samples obtained by FEM simulation is less than that obtained by Gassmann equation with a constant value. The difference may be caused by the interaction between fractures. This kind of difference are also observed in previous studies, (e.g. Guo et al., 2018a; Guo et al., 2018b; Cao et al., 2019; Cao et al., 2020).
According to the works of Zhao et al. (2016); Zhao et al. (2020), the interaction of the cracks (stress amplification) will induce the inconsistency between the substitution equations and numerical simulation in the elastic moduli of the sample. Comparing the stress distribution as shown in Figures 9A–D, the crack interaction is stronger for the cracks with rougher surface. The difference between the substitution equation results and the numerical simulation is also increasing with the crack surface roughness as shown in Figure 7B and Figures 8A,B. Therefore, there the difference between the substitution equation results and the numerical simulation is also induced by the interaction between the interaction between the cracks, and the rougher crack surface will induce higher interaction.
In this research, we study the substitution process in the limitation of linear elastic problem, and we do not consider the fracture surface slipping and the intersection between factures, when stress is loaded. Although fracture surface slipping and the intersection between factures will change fracture stiffness a lot, it is a kind of nonlinear elastic/hypoplasticity problem (Jiang and Liu, 2008; Khidas and Jia, 2010; Jia et al., 2011). Generally speaking, both fracture surface slipping and the intersection between factures can increase the facture porosity and change the connection of the fractures (Shapiro 2003; Guo et al., 2018c), and they will change the structure and decrease the stiffness of the dry sample. In this research, we focus on the influence of fracture surface roughness on the substitution process, and we should maintain the fracture porosity and the stiffness of the dry sample as a constant during the stress loaded. Therefore, the fracture surface slipping, and the intersection influence are out of the region of this research. However, it should be noted that because the fracture surface slipping and the intersection between factures will change the stiffness of the dry sample and connection of the fracture during the stress loading process, it will also influence the substitution process. In addition, to focus on the fracture surface roughness influence, we assume all fractures are isolated to each other. However, for the for fractures in the natural world, it is possible that the fractures are intersecting to each other. When fractures are intersecting to each other, the interaction between the fractures will increase, and the stiffness of both dry and saturated samples will decrease. All the problem about the slip of fracture surface and fracture intersection will be researched in the future.
Conclusions
In this paper, we have studied the dependency of fractured sample elastic moduli on the fracture surface roughness. We design seven fractured numerical samples. Each sample contains twenty-five fractures with the same surface roughness. Different samples have different fracture surface roughness. The square of fracture radius is controlled by the normal distribution law. The FEM simulation is used to compute the effective elastic moduli of each sample. The resulting elastic moduli can be correlated to different levels of fracture surface roughness. Comparisons between the FEM simulation and theoretical predictions by the Gassmann and C&S substitution equations demonstrate that the fracture surface roughness could induce stress concentration, and thus reduce the elastic moduli of samples. For the sample with fractures orientated radomy uniformly, the factures with higher rough surface will induce more stress concentration around the fractures, and the interaction between fractures will increase, making the Gassmann and C&S equation invalid.
Data Availability Statement
The original contributions presented in the study are included in the article/Supplementary Material, further inquiries can be directed to the corresponding authors.
Author Contributions
L-YF and B-YF conceive this research. B-YF writes the manuscript and prepares the figures. L-YF and TH reviews and supervises the manuscript. The co-authors CC are involved in the discussion of the manuscript. All authors finally approve the manuscript and thus agree to be accountable for this work.
Conflict of Interest
The authors declare that the research was conducted in the absence of any commercial or financial relationships that could be construed as a potential conflict of interest.
Acknowledgments
The authors would like to thank the sponsors of the Strategic Priority Research Program of the Chinese Academy of Sciences, Grant No. XDA14010303, National Natural Science Foundation of China (Grant No.41821002) for the financial support. In this research, all the data are numerical simulation result, and there are no experiment data.
Appendix a. the verification of the isotropy of the sample
In this research, we make the orientations of the fractures are unform, assuming the samples are isotropic. To verify the correction of this assumption, we conduct the numerical test as shown in Figure A-1.
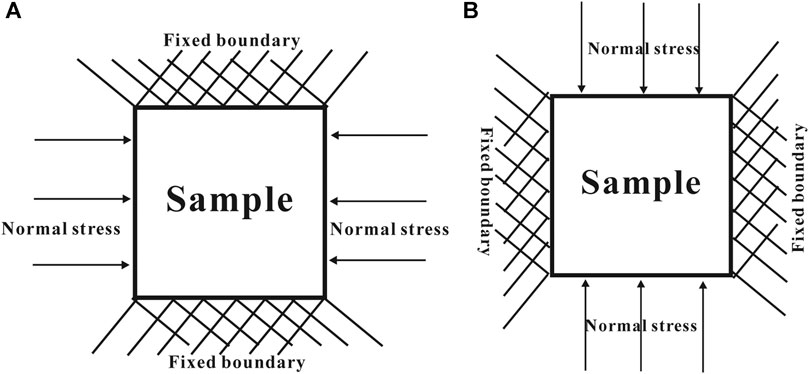
FIGURE A-1. The test model to verify the isotropy of the sample.
We load normal stress P in the two boundaries of the sample, for the dry rocks, and the other boundaries are made to be fixed, and we calculate the strain exx and eyy for the test in Figures A-1A, 1B respectively, and the elastic moduli in the two tests are given by
and
where C11 and C22 are the elastic moduli of the samples in the two directions as shown in Figures A-1A, 1B. Then we calculate the relative error between C11 and C22 by Eq. A3 as
The variation of the relative error vs. perturbation of R2 is shown in Figure A-2. According to the results in Figure A-2, the relative errors are all less than 5%. Therefore, the samples can be regarded as isotropic.
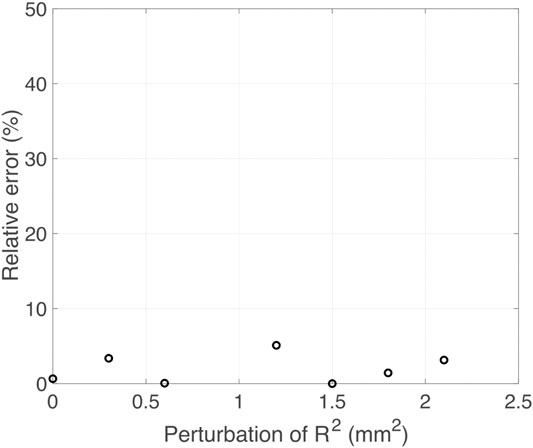
FIGURE A-2. The Relative error between C11 and C22.
References
Adler, P. M., and Thovert, J. F. (1999). Fractures and fracture networks. Berlin, Germany: Springer Science and Business Media, Vol. 15.
Barton, N., Bandis, S., and Bakhtar, K. (1985). Strength, deformation and conductivity coupling of rock joints. Int. J. Rock Mech. Mining Sci. Geomechanics Abstr., 22 (3), 121–140. doi:10.1016/0148-9062(85)93227-9
Biot, M. A., and Willis, D. G. (1957). The elastic coefficients of the theory of consolidation. J. Appl. Mech. 24, 594–601.
Brown, R. J. S., and Korringa, J. (1975). On the dependence of the elastic properties of a porous rock on the compressibility of the pore fluid. Geophysics 40 (4), 608–616. doi:10.1190/1.1440551
Brown, S. R., and Scholz, C. H. (1985). Closure of random elastic surfaces in contact. J. Geophys. Res. 90 (B7), 5531–5545. doi:10.1029/jb090ib07p05531
Budiansky, B., and O’connell, R. J. (1976). Elastic moduli of a cracked solid. Int. J. Solids Struct. 12 (2), 81–97. doi:10.1016/0020-7683(76)90044-5
Cao, C., Fu, L.-Y., Ba, J., and Zhang, Y. (2019). Frequency- and incident-angle-dependent P-wave properties influenced by dynamic stress interactions in fractured porous media. Geophysics 84 (5), MR173–MR184. doi:10.1190/geo2018-0103.1
Cao, C., Chen, F., Fu, L. Y., Ba, J., and Han, T. (2020). Effect of stress interactions on anisotropic P‐SV‐wave dispersion and attenuation for closely spaced cracks in saturated porous media. Geophys. Prospect. 68 (8), 2536–2556. doi:10.1111/1365-2478.13007
Cheng, C. H. A. (1978). Seismic velocities in porous rocks: direct and inverse problems. Doctoral dissertation. Cambridge, United States: Massachusetts Institute of Technology.
Cheng, C. H., and Toksöz, M. N. (1979). Inversion of seismic velocities for the pore aspect ratio spectrum of a rock. J. Geophys. Res. 84 (B13), 7533–7543. doi:10.1029/jb084ib13p07533
Ciz, R., and Shapiro, S. A. (2007). Generalization of Gassmann equations for porous media saturated with a solid material. Geophysics 72 (6), A75–A79. doi:10.1190/1.2772400
David, E. C., and Zimmerman, R. W. (2012). Pore structure model for elastic wave velocities in fluid‐saturated sandstones. J. Geophys. Res. Solid Earth 117 (B7), 185–201. doi:10.1029/2012jb009195
Eshelby, J. D. (1957). The determination of the elastic field of an ellipsoidal inclusion, and related problems. Proc. R. Soc. Lond. Ser. A. Math. Phys. Sci. 241 (1226), 376–396. doi:10.1098/rspa.1957.0133
Foldy, L. L. (1945). The multiple scattering of waves. I. General theory of isotropic scattering by randomly distributed scatterers. Phys. Rev. 67 (3-4), 107. doi:10.1103/physrev.67.107
Fu, B. Y., and Fu, L. Y. (2017). Poro-acoustoelastic constants based on Padé approximation. The J. Acoust. Soc. Am. 142 (5), 2890–2904. doi:10.1121/1.5009459
Fu, B. Y., and Fu, L. Y. (2018). Poro-acoustoelasticity with compliant pores for fluid-saturated rocks. Geophysics 83 (3), WC1–WC14. doi:10.1190/geo2017-0423.1
Fu, B. Y., Fu, L. Y., Guo, J., Galvin, R. J., and Gurevich, B. (2020). Semi-analytical solution to the problem of frequency dependent anisotropy of porous media with an aligned set of slit cracks. Int. J. Eng. Sci. 147, 103209. doi:10.1016/j.ijengsci.2019.103209
Gale, J. F. W., Laubach, S. E., Olson, J. E., Eichhuble, P., and Fall, A. (2014). Natural Fractures in shale: a review and new observations. Bulletin 98 (11), 2165–2216. doi:10.1306/08121413151
Galvin, R. J., and Gurevich, B. (2007). Scattering of a longitudinal wave by a circular crack in a fluid-saturated porous medium. Int. J. Solids Struct. 44 (22-23), 7389–7398. doi:10.1016/j.ijsolstr.2007.04.011
Galvin, R. J., and Gurevich, B. (2009). Effective properties of a poroelastic medium containing a distribution of aligned cracks. J. Geophys. Res. 114 (B7), B07305. doi:10.1029/2008jb006032
Gangi, A. F. (1978). Variation of whole and fractured porous rock permeability with confining pressure. Int. J. Rock Mech. Mining Sci. Geomech. Abstr. 15 (5), 249–257. doi:10.1016/0148-9062(78)90957-9
Gao, K., and Gibson, R. L. (2012). Pressure-dependent seismic velocities based on effective compliance theory and an asperity deformation model. Geophysics 77 (6), D229–D243. doi:10.1190/geo2012-0041.1
Gassmann, F. (1951). Uber die elastizitat poroser medien. Vier. Der Natur. Gesellschaft in Zurich 96, 1–23.
Grechka, V., and Kachanov, M. (2006). Effective elasticity of cracked rocks. A snapshot work Prog. Geophys. 71 (6), 0016–8033. doi:10.1190/1.2360212
Greenwood, J. A., and Williamson, J. P. (1966). Contact of nominally flat surfaces. Proc. R. Soc. Lond. Ser. A. Math. Phys. Sci. 295 (1442), 300–319. doi:10.1098/rspa.1966.0242
Guo, J., Germán Rubino, J., Barbosa, N. D., Glubokovskikh, S., and Gurevich, B. (2018a). Seismic dispersion and attenuation in saturated porous rocks with aligned fractures of finite thickness: theory and numerical simulations—Part 1: P-wave perpendicular to the fracture plane. Geophysics 83 (1), WA49–WA62. doi:10.1190/geo2017-0065.1
Guo, J., Germán Rubino, J., Barbosa, N. D., Glubokovskikh, S., and Gurevich, B. (2018b). Seismic dispersion and attenuation in saturated porous rocks with aligned fractures of finite thickness: theory and numerical simulations—Part 2: frequency-dependent anisotropy. Geophysics 83 (1), WA63–WA71. doi:10.1190/geo2017-0066.1
Guo, J., Rubino, J. G., Glubokovskikh, S., and Gurevich, B. (2018c). Dynamic seismic signatures of saturated porous rocks containing two orthogonal sets of fractures: theory versus numerical simulations. Geophys. J. Int. 213 (2), 1244–1262. doi:10.1093/gji/ggy040
Guo, J., Shuai, D., Wei, J., Ding, P., and Gurevich, B. (2018d). P-wave dispersion and attenuation due to scattering by aligned fluid saturated fractures with finite thickness: theory and experiment. Geophys. J. Int. 215 (3), 2114–2133. doi:10.1093/gji/ggy406
Hudson, J. A. (1981). Wave speeds and attenuation of elastic waves in material containing cracks. Geophys. J. Int. 64 (1), 133–150. doi:10.1111/j.1365-246x.1981.tb02662.x
Hudson, J. A. (1988). Seismic wave propagation through material containing partially saturated cracks. Geophys. J. Int. 92 (1), 33–37. doi:10.1111/j.1365-246x.1988.tb01118.x
Hyman, J. D., Karra, S., Makedonska, N., Gable, C. W., Painter, S. L., and Viswanathan, H. S. (2015). dfnWorks: a discrete fracture network framework for modeling subsurface flow and transport. Comput. Geosci. 84, 10–19. doi:10.1016/j.cageo.2015.08.001
Jia, X., Brunet, T., and Laurent, J. (2011). Elastic weakening of a dense granular pack by acoustic fluidization: slipping, compaction, and aging. Phys. Rev. E 84 (2), 020301. doi:10.1103/physreve.84.020301
Jiang, Y., and Liu, M. (2008). Incremental stress-strain relation from granular elasticity: comparison to experiments. Phys. Rev. E 77 (2), 021306. doi:10.1103/physreve.77.021306
Johnson, K. L., Greenwood, J. A., and Poon, S. Y. (1972). A simple theory of asperity contact in elastohydro-dynamic lubrication. Wear 19 (1), 91–108. doi:10.1016/0043-1648(72)90445-0
Kachanov, M. (1980). Continuum model of medium with cracks. J. Engrg. Mech. Div. 106 (5), 1039–1051. doi:10.1061/jmcea3.0002642
Kachanov, M. (1992). Effective elastic properties of cracked solids: critical review of some basic concepts. Appl. Mech. Rev. 45 (8), 304–335. doi:10.1115/1.3119761
Kachanov, M. (1993). Elastic solids with many cracks and related problems. Adv. Appl. Mech. 30, 259–445. doi:10.1016/S0065-2156(08)70176-5
Kawahara, J. (1992). Scattering of P, SV waves by random distribution of aligned open cracks. J. Phys. Earth 40 (3), 517–524. doi:10.4294/jpe1952.40.517
Kawahara, J. (2011). Scattering attenuation of elastic waves due to low-contrast inclusions. Wave Motion 48 (3), 290–300. doi:10.1016/j.wavemoti.2010.11.004
Kawahara, J., and Yamashita, T. (1992). Scattering of elastic waves by a fracture zone containing randomly distributed cracks. Pure Appl. Geophys. 139 (1), 121–144. doi:10.1007/bf00876828
Khidas, Y., and Jia, X. (2010). Anisotropic nonlinear elasticity in a spherical-bead pack: influence of the fabric anisotropy. Phys. Rev. E 81 (2), 021303. doi:10.1103/physreve.81.021303
Kubair, D. V., and Bhanu-Chandar, B. (2008). Stress concentration factor due to a circular hole in functionally graded panels under uniaxial tension. Int. J. Mech. Sci. 50 (4), 732–742. doi:10.1016/j.ijmecsci.2007.11.009
Li, Q., Ito, K., Wu, Z., Lowry, C. S., and Loheide II, S. P. (2009). COMSOL Multiphysics: a novel approach to ground water modeling. Groundwater 47 (4), 480–487. doi:10.1111/j.1745-6584.2009.00584.x
Liu, E. (2005). Effects of fracture aperture and roughness on hydraulic and mechanical properties of rocks: implication of seismic characterization of fractured reservoirs. J. Geophys. Eng. 2 (1), 38–47. doi:10.1088/1742-2132/2/1/006
Mavko, G., Mukerji, T., and Dvorkin, J. (2009). The rock physics handbook: tools for seismic analysis of porous media. England: Cambridge University Press.
Mavko, G., and Mukerji, T. (2013). Estimating Brown-Korringa constants for fluid substitution in multimineralic rocks. Geophysics 78 (3), L27–L35. doi:10.1190/geo2012-0056.1
Priest, M., and Taylor, C. M. (2000). Automobile engine tribology—approaching the surface. Wear 241 (2), 193–203. doi:10.1016/s0043-1648(00)00375-6
Pruess, K. (2006). Enhanced geothermal systems (EGS) using CO2 as working fluid-A novel approach for generating renewable energy with simultaneous sequestration of carbon. Geothermics 35 (4), 351–367. doi:10.1016/j.geothermics.2006.08.002
Quintal, B., Jänicke, R., Rubino, J. G., Steeb, H., and Holliger, K. (2014). Sensitivity of S-wave attenuation to the connectivity of fractures in fluid-saturated rocks. Geophysics 79 (5), WB15–WB24. doi:10.1190/geo2013-0409.1
Rubino, J. G., Ravazzoli, C. L., and Santos, J. E. (2008). Equivalent viscoelastic solids for heterogeneous fluid-saturated porous rocks. Geophysics 74 (1), N1–N13. doi:10.1190/1.3008544
Rubino, J. G., Caspari, E., Milani, M., Holliger, K., Müller, T. M., and Holliger, K. (2015). “Seismic anisotropy in fractured low-permeability formations: the effects of hydraulic connectivity,” in SEG Technical Program Expanded Abstracts 2015; New Orleans, Louisiana, October 8–23, 2015 (Tulsa, Oklahoma: Society of Exploration Geophysicists), 3219–3223.
Rubino, J. G., Caspari, E., Müller, T. M., Milani, M., Barbosa, N. D., and Holliger, K. (2016). Numerical upscaling in 2-D heterogeneous poroelastic rocks: anisotropic attenuation and dispersion of seismic waves. J. Geophys. Res. Solid Earth 121 (9), 6698–6721. doi:10.1002/2016jb013165
Saenger, E. H., Krüger, O. S., and Shapiro, S. A. (2004). Effective elastic properties of randomly fractured soils: 3D numerical experiments. Geophys. Prospect. 52 (3), 183–195. doi:10.1111/j.1365-2478.2004.00407.x
Saenger, E. H., and Shapiro, S. A. (2002). Effective velocities in fractured media: a numerical study using the rotated staggered finite-difference grid. Geophys. Prospect. 50 (2), 183–194. doi:10.1046/j.1365-2478.2002.00309.x
Saxena, N., and Mavko, G. (2014). Exact equations for fluid and solid substitution. Geophysics 79 (3), L21–L32. doi:10.1190/geo2013-0187.1
Sevostianov, I., and Kachanov, M. (2002a). Explicit cross-property correlations for anisotropic two-phase composite materials. J. Mech. Phys. Sol. 50 (2), 253–282. doi:10.1016/s0022-5096(01)00051-5
Sevostianov, I., and Kachanov, M. (2002b). On elastic compliances of irregularly shaped cracks. Int. J. Fract. 114 (3), 245–257. doi:10.1023/a:1015534127172
Sevostianov, I., and Kachanov, M. (2008). Normal and tangential compliances of interface of rough surfaces with contacts of elliptic shape. Int. J. Solids Struct. 45 (9), 2723–2736. doi:10.1016/j.ijsolstr.2007.12.024
Sevostianov, I., and Kachanov, M. (2012). Is the concept of “average shape” legitimate, for a mixture of inclusions of diverse shapes?. Int. J. Sol. Struct. 49 (23-24), 3242–3254. doi:10.1016/j.ijsolstr.2012.06.018
Shapiro, S. A. (2003). Elastic piezosensitivity of porous and fractured rocks. Geophysics 68 (2), 482–486. doi:10.1190/1.1567215
Song, Y., Hu, H., and Rudnicki, J. W. (2017a). Dynamic stress intensity factor (Mode I) of a permeable penny-shaped crack in a fluid-saturated poroelastic solid. Int. J. Solids Struct. 110-111, 127–136. doi:10.1016/j.ijsolstr.2017.01.034
Song, Y., Hu, H., and Rudnicki, J. W. (2017b). Normal compression wave scattering by a permeable crack in a fluid-saturated poroelastic solid. Acta Mech. Sin. 33 (2), 356–367. doi:10.1007/s10409-016-0633-8
Song, Y., Hu, H., and Han, B. (2019). Elastic wave scattering by a fluid-saturated circular crack and effective properties of a solid with a sparse distribution of aligned cracks. J. Acoust. Soc. Am. 146 (1), 470–485. doi:10.1121/1.5116917
Song, Y., Hu, H., and Han, B. (2020a). Effective properties of a porous medium with aligned cracks containing compressible fluid. Geophys. J. Int. 221 (1), 60–76. doi:10.1093/gji/ggz576
Song, Y., Hu, H., and Han, B. (2020b). P-wave attenuation and dispersion in a fluid-saturated rock with aligned rectangular cracks. Mech. Mater. 147, 103409. doi:10.1016/j.mechmat.2020.103409
Song, Y., Rudnicki, J. W., Hu, H., and Han, B. (2020c). Dynamics anisotropy in a porous solid with aligned slit fractures. J. Mech. Phys. Sol. 137, 103865. doi:10.1016/j.jmps.2020.103865
Toksöz, M. N., Cheng, C. H., and Timur, A. (1976). Velocities of seismic waves in porous rocks. Geophysics 41 (4), 621–645. doi:10.1190/1.1440639
Vlastos, S., Liu, E., Main, I. G., and Li, X.-Y. (2003). Numerical simulation of wave propagation in media with discrete distributions of fractures: effects of fracture sizes and spatial distributions. Geophys. J. Int. 152 (3), 649–668. doi:10.1046/j.1365-246x.2003.01876.x
Vlastos, S., Liu, E., Main, I. G., Schoenberg, M., Narteau, C., Li, X. Y., et al. (2006). Dual simulations of fluid flow and seismic wave propagation in a fractured network: effects of pore pressure on seismic signature. Geophys. J. Int. 166 (2), 825–838. doi:10.1111/j.1365-246x.2006.03060.x
Vlastos, S., Liu, E., Main, I. G., and Narteau, C. (2007). Numerical simulation of wave propagation in 2-D fractured media: scattering attenuation at different stages of the growth of a fracture population. Geophys. J. Int. 171 (2), 865–880. doi:10.1111/j.1365-246x.2007.03582.x
Walsh, J. B., and Grosenbaugh, M. A. (1979). A new model for analyzing the effect of fractures on compressibility. J. Geophys. Res. 84 (B7), 3532–3536. doi:10.1029/jb084ib07p03532
Zhao, L., Yao, Q., Han, D.-h., Yan, F., and Nasser, M. (2016). Characterizing the effect of elastic interactions on the effective elastic properties of porous, cracked rocks. Geophys. Prospecting 64 (1), 157–169. doi:10.1111/1365-2478.12243
Zhao, Z., Dou, Z., Xu, H., and Liu, Z. (2019). Shear behavior of Beishan granite fractures after thermal treatment. Eng. Fract. Mech. 213, 223–240. doi:10.1016/j.engfracmech.2019.04.012
Zhao, L., Cao, C., Yao, Q., Wang, Y., Li, H., Yuan, H., et al. (2020). Gassmann consistency for different inclusion‐based effective medium theories: implications for elastic interactions and poroelasticity. J. Geophys. Res. Solid Earth 125 (3), e2019JB018328. doi:10.1029/2019jb018328
Zhu, Q., and Shao, J. (2017). Micromechanics of rock damage: advances in the quasi-brittle field. J. Rock Mech. Geotech. Eng. 9 (1), 29–40. doi:10.1016/j.jrmge.2016.11.003
Zimmerman, R. W. (1991). Elastic moduli of a solid containing spherical inclusions. Mech. Mater. 12 (1), 17–24. doi:10.1016/0167-6636(91)90049-6
Zimmerman, R. W., Somerton, W. H., and King, M. S. (1986). Compressibility of porous rocks. J. Geophys. Res. 91 (B12), 12765–12777. doi:10.1029/jb091ib12p12765
Zong, J., Stewart, R. R., Dyaur, N., and Myers, M. T. (2017). Elastic properties of rock salt: laboratory measurements and Gulf of Mexico well-log analysis. Geophysics 82 (5), D303–D317. doi:10.1190/geo2016-0527.1
Keywords: effective medium, cracked rock, crack surface, elastic modulus, rock physics model
Citation: Fu B-Y, Fu L-Y, Han T and Cao C (2021) Roughness Effects of Crack Surfaces on the Elastic Moduli of Cracked Rocks. Front. Earth Sci. 9:626903. doi: 10.3389/feart.2021.626903
Received: 11 November 2020; Accepted: 18 February 2021;
Published: 08 April 2021.
Edited by:
Sung Keun Lee, Seoul National University, South KoreaReviewed by:
Yongjia Song, Harbin Institute of Technology, ChinaLuanxiao Zhao, Tongji University, China
Copyright © 2021 Fu, Fu, Han and Cao. This is an open-access article distributed under the terms of the Creative Commons Attribution License (CC BY). The use, distribution or reproduction in other forums is permitted, provided the original author(s) and the copyright owner(s) are credited and that the original publication in this journal is cited, in accordance with accepted academic practice. No use, distribution or reproduction is permitted which does not comply with these terms.
*Correspondence: Bo-Ye Fu, ZnVib3llQG1haWwuaWdnY2FzLmFjLmNu; Li-Yun Fu, bGZ1QHVwYy5lZHUuY24=