 Resul Comert
- Department of Geomatics Engineering, Faculty of Engineering and Natural Sciences, Gumushane University, Gumushane, Turkey
Rapid mapping of landslides that occur after an earthquake is important for rapid crisis management. In this study, experimental research was conducted on the size of the model area and the data types used in developing classifiers for the supervised classification approaches used in rapid landslide mapping. The Hokkaido Iburu earthquake zone that occurred on September 6, 2018, was selected as the study area. PlanetScope pre-event and post-event images and ALOS-PALSAR Digital Elevation Model (DEM) were used in the analysis processes. In this context, five model areas with different sizes and one test area were determined. Object-based image analysis (OBIA) was used as a landslide mapping approach. Random Forest classifier, which is a supervised classification algorithm, was performed in the mapping of image objects produced by the segmentation stage of OBIA. Two different data sets were created for landslide mapping: change-based dataset and post-event dataset. The change-based dataset is generated from change data such as the difference of normalized difference vegetation index (δNDVI), change detection Image (CDI), princiable component analysis (PCA), and Independent component analysis (ICA) which are used in change detection applications. The post-event dataset was created from data generated from post-event image bands. When the obtained results were examined, higher accuracy results were obtained with the post-event dataset. Increasing the size of the model area, in other words, increasing the training data slightly increases the accuracy of landslide mapping. However, a model area that represents the region to be mapped in small sizes to make rapid decisions provides a 94% F-measure accuracy for earthquake-triggered landslide detection.
Introduction
Earthquakes are natural events that cause great damage to nature, buildings, engineering structures, and cause human death (Gorum and Carranza 2015). Moderate and severe magnitude earthquakes trigger thousands of landslides, especially in rugged and high-slope mountainous regions (Gorum et al., 2013; Tanyaş et al., 2017). For example, in the 2008 Wenchuan, China Mw 7.9 earthquake, there were about 200,000 landslides (Tian et al., 2019), about 5,000 landslides in the January 12, 2010 Mw 7.0 Haiti earthquake (Gorum et al., 2013), more than 2,000 landslides in the 2015 Gorkha, Nepal Mw 7.8 earthquake, and about 6,000 landslides in the 2018 Hokkaido Iburu Mw 6.7 earthquake (Yamagishi and Yamazaki 2018). Landslides that appear as a secondary effect of earthquakes cause human deaths and economic losses. Fatal landslides occurred in 76 of the 196 earthquakes between 1811 and 2016. These fatalities correspond to 17.7% (213,913 people) of deaths caused by earthquakes (Jessee et al., 2020). Earthquake-triggered landslides accounted for 5.2% ($ 170 billion) of economic damage from earthquakes between 1900 and 2016 (Daniell et al., 2017). Therefore, rapid mapping of landslides is important for rapid response to disaster areas and crisis management.
Active and passive remote sensing systems offer great advantages in rapid landslide mapping (Aimaiti et al., 2019). With remote sensing systems, Optical images (Zhao et al., 2017; Shao et al., 2019), synthetic aperture radar (SAR) (Aimaiti et al., 2019; Adriano et al., 2020), LIDAR systems (Liu et al., 2019), Unmanned Aerial Vehicle (UAV) systems (Comert et al., 2019) or synthesis of optical and SAR images (Shirvani et al., 2019) can be used in the landslide mapping. The most common method preferred in mapping landslides is visual image interpretation (Guzzetti et al., 2012; Rosi et al., 2018). Although the image interpretation provides high accuracy, it is a slow method that is not suitable at the time of rapid intervention since the landslides are mapped by the expert with image interpretation and manual digitization (Guzzetti et al., 2012). Therefore, automatic landslide mapping is an important factor for post-disaster crisis management. Image classification approaches (Vamsee et al., 2018) and change detection methods (Lu et al., 2019) are used in automatic landslide mapping. Since change detection methods require pre-event images, they present a disadvantage in mapping the landslide events triggered by the earthquake. However, it is a useful method in case of the pre-event image available (Yang and Chen 2010; Lu et al., 2019). Classification methods are generally carried out on post-event images (Stumpf and Kerle 2011; Dou et al., 2015). The disadvantage of this method in making rapid decisions is that it takes time to generate the training dataset. However, when the classification model is developed over the appropriate training dataset, the mapping process is shortened (Danneels et al., 2007; Stumpf and Kerle 2011; Mondini et al., 2011).
Image classification is used in landslide mapping in two approaches, pixel-based image analysis (PBIA) (Danneels et al., 2007) and object-based image analysis (OBIA) (Martha et al., 2010; Stumpf and Kerle 2011; Hölbling et al., 2015; Shirvani et al., 2019). After the landslide events, different sizes of landslides can occur in the relevant area. High spatial resolution images offer great advantages to detect landslides of different sizes. OBIA has become more popular in landslide mapping in the last decade since misclassified pixels have emerged from the landslide mapping from high spatial resolution images with PBIA (Guzzetti et al., 2012; Zhong et al., 2020). OBIA is applied in two different ways in landslide mapping: rule-based (Martha et al., 2010; Hölbling et al., 2012; Comert et al., 2019) and supervised mapping (Stumpf and Kerle 2011; Shirvani et al., 2019). In the landslide mapping process, landslides should be separated from different land use classes. A large number of object features must be used for this process. Rule-based mapping is a slow method for complex areas. since the object features and threshold values that separate the classes must be determined by an expert (Stumpf and Kerle, 2011). In supervised mapping performed with a selected algorithm such as random forest, the features used to separate the classes are automatically determined, and rapid results are produced by the mapping process made on the training data to be produced in the appropriate size and number (Stumpf and Kerle 2011; Shirvani et al., 2019; Shirvani, 2020). Therefore, supervised mapping process will give rapid results in rapid intervention in crisis management.
In this study, the success of the size of the model area selected for training data, and the dataset type to be used in classification in the rapid detection of earthquake-triggered landslides were investigated. In particular, the following questions have been addressed:
• How enlarging the model area selected for training data affect earthquake-triggered landslide mapping accuracy?
• Which of the datasets used in the classification stage is more useful?
• Which image object feature from the selected data sets is important for landslide mapping?
For these purposes, the Hokkaido Iburu earthquake zone in Japan was chosen as the study area. PlanetScope images and ALOS-PALSAR Digital Elevation Model (DEM) were used as analysis data. OBIA was preferred as the mapping approach and the Random Forest (RF) algorithm was used as the classification method in the OBIA. RF algorithm, which is a fast machine learning classifier, was preferred in this study because it gives successful results in many areas such as landslide susceptibility mapping (Dou et al., 2019; Shirvani 2020), landslide mapping (Stumpf and Kerle 2011; Chen et al., 2017; Shirvani et al., 2019; Maxwell et al., 2020), burnt area mapping (Ramo and Chuvieco 2017).
Study Area and Dataset
Study Area
The study area is located in the southwest of the Hokkaido region (Figure 1A). The dominant land cover of the study area consists of forests and paddy fields and has a rugged, mountainous, and high slope topography (Zhang et al., 2019; Adriano et al., 2020). Hokkaido, which includes the study area, is a tectonically active region in the world. The faults and active faults in the region develop near the north-south strike (Zhang et al., 2019).
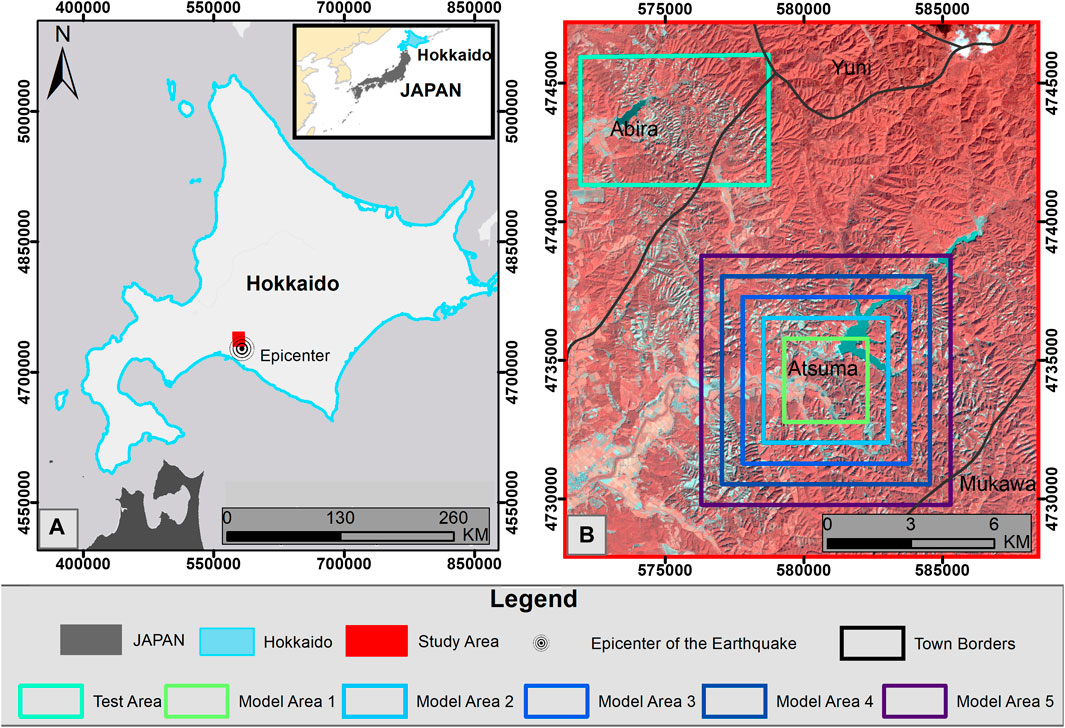
FIGURE 1. The study area selected for analysis: (A) The location of the epicenter of the earthquake and the study area (red polygon) in Hokkaido, (B) Model development and test areas determined for landslide mapping.
On September 6, 2018, an earthquake with a magnitude of 6.7 Mw and a depth of 37 km occurred in the Iburu subprefecture of the southern Hokkaido province of Japan. With the powerful ground motion of the event, structural damage in buildings, liquefaction on the ground, and thousands of landslides occurred in areas close to the epicenter (42.691°N, 142.007°E) of the earthquake. Due to the earthquake, 41 people died and 691 people were injured; 390 buildings were destroyed, 1061 buildings were damaged, approximately 6000 landslides occurred (Yamagishi and Yamazaki 2018; Zhang et al., 2019). The reason for the large number of landslides triggered by the earthquake in the region is that the earthquake occurred one day after the typhoon Jebi, which accumulated approximately 100 mm of precipitation in the region (Yamagishi and Yamazaki 2018). The majority of the coseismic landslides in the region consist of typical shallow debris landslides with a width of approximately 250 m. The types of landslides are classified as planar and spoon type landslides such as rainfall-induced landslides (Yamagishi and Yamazaki 2018; Zhang et al., 2019). The areas selected within the scope of this study are located in the towns of Atsuma and Abira, where slope failures are densely distributed (Figure 1B).
Data Sets
PlanetScope is a satellite constellation operated by Planet Labs that contains 130+ CubeSats (size: 10 cm by 10 cm by 30 cm; weight: 4 kg) that move in the sun-synchronous orbit. Using this satellite constellation, images are collected in an area of 200 M + km2/day. PlanetScope images consist of 4 spectral bands with 3.7 m spatial, 16-bit radiometric, and 1-day temporal resolution (Table 1) (Planet, 2017). In this study, PlanetScope Level 3B multispectral surface reflectance products were used to create the change-based dataset and the post-event datasets. Level 3B surface reflectance products, which are orthorectified, are geometrically corrected images using Ground Control Points (GCPs) and fine Digital Elevation Models (DEMs) (Wicaksono and Lazuardi 2018; Planet, 2017). Also, the atmospheric corrections of these products were made by Planet Labs using the 6S radiative transfer model with ancillary data from MODIS (Cheng et al., 2020). After atmospheric and geometric corrections, the orthorectified images are presented to users by Planet Labs at 3 m spatial resolution (Planet 2017). Within the scope of the study, images belonging to two different dates as pre-event (August 03, 2018) and post-event (September 21, 2018) were used (Table 1). These images were selected as the dates closest to each other, with no clouds on the study area. Also, ALOS-PALSAR 30 m spatial resolution DEM data dated July 14, 2006 were used as auxiliary data to obtain the slope map of the study area.

TABLE 1. PlanetScope Leve 3 B product specification and image dates.
Five different model areas have been created to develop classifiers to be used in the mapping of landslides over the area chosen as the study area (Figure 1B). The smallest of these model areas (Model Area 1) is 3 × 3 km in size. While determining this area, it has been taken into consideration that the test area has similar land use characteristics such as water, agricultural areas, roads, small settlements, landslides, and forest. Other model areas were obtained by enlarging the edges of the previous model area by 1.5 km. The largest model area (Model Area 5) created in the area is 9 × 9 km in size.
Methods
The methodology applied within the scope of the study is shown in Figure 2. The landslide mapping process was carried out using the OBIA approach. OBIA and PBIA are two different approaches used in image classification. Spectral values of pixels are used when classifying images with PBIA, while spectral, geometric, textural, and spatial values of image objects are used for classification with OBIA. OBIA was preferred in this study because it reduces the problem of misclassification error in high spatial resolution images includes different image object metrics in addition to spectral features and reduces the data size (Zhong et al., 2020).
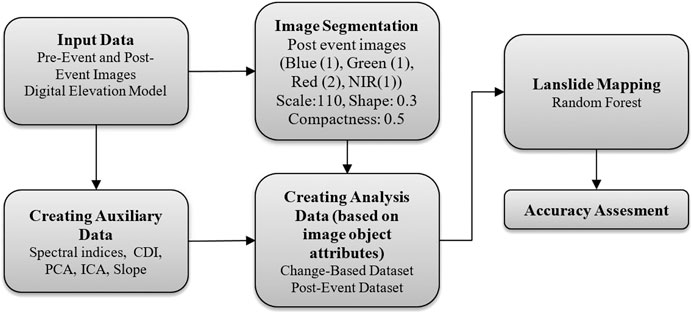
FIGURE 2. The methodology applied for the rapid detection of earthquake-triggered landslides in the study.
Creating Auxiliary Data
Auxiliary data such as band indices and change detection indices were generated to achieve change-based dataset and post-event datasets. Normalized difference vegetation index (NDVI), normalized difference water index (NDWI) and brightness index (BI), principal component analysis (PCA), change detection image (CDI), independent component analysis (ICA) were additional data generated.
NDVI (Tucker 1979) is an effective index used in the separation of green vegetation area from landslides. Therefore, it is used both in landslide mapping with change detection (Lu et al., 2019) and in landslide mapping from post-event images (Martha et al., 2010). NDVIpost was used for the post-event dataset,
where ρGreen, ρRed, and ρNIR are green, red, and near-infrared (NIR) bands of images, respectively.
BI has been used in post-event landslide mapping from satellite images in many studies. This index is obtained by dividing the sum of the spectral values of the bands (ci(vis)) by the total number of bands (nvis) (Stumpf and Kerle 2011). BI was calculated using the four bands of PlanetScope post-event image bands.
PCA, a linear transformation method, converts a set of correlated numerical variables into non-correlated variables in a different orthogonal coordinate system. When a data set with N bands is given with PCA, the desired number of main components is calculated. The first PCA component contains the largest variance between the input bands, the second contains the second major variance not defined in the first component, and so on. In the calculation of the principal components, the n-dimensional data set is defined by the
ICA is a geometric transformation that transforms variables used as inputs into statistically independent components. ICA is calculated by Eq. 6. Where A is the mixing matrix, s is the matrix of independent components and X represents the vector of input variables (Hyvärinen and Oja 2000).
CVA is a method used for mapping landslides from pre-and post-event images (Li et al., 2016; Lu et al., 2019). In this method, a change detection image (CDI) is created by determining the changes between multi-temporal image bands. The value of a pixel in the CDI is calculated by Eq. 7. where, the pixel value at pre-event t1 time is It1, the pixel value at post-event time t2 is lt2. b represents the number of satellite images band being processed.
Image Segmentation
Image segmentation is the first step of the OBIA process. At this stage, it is aimed to produce meaningful image objects from the layers subjected to segmentation. Multi-resolution segmentation (MRS) is the most preferred segmentation method in OBIA. In this method, the segmentation process starts at a pixel level, and the merging process takes place according to the spatial and spectral heterogeneity of the candidate selected image object with neighboring image objects (Benz and Schreier 2001; Jensen 2005). To create optimum image objects with the MRS method, the scale, shape, compactness, and layer weights must be determined by the user. The scale parameter controls the size or heterogeneity level of the image objects to be formed. If the scale parameter is defined as a large value, large image objects are produced, if a small value is defined, small image objects are produced. The shape parameter, which takes values between 0–1, is used to determine the weights of spatial and spectral functions in the calculation of the merging factor. The compactness parameter controls the compactness and smoothness of the resulting image objects in the calculation of the shape function. Layer weights are used to define the importance of segmentation layers compared to other layers (Baatz et al., 2000). MRS parameters can be determined by automatic methods such as Estimation Scale Parameter-2 (ESP-2) (Drăguţ et al., 2014), optimum scale parameter selector (OSPS) (Vamsee et al., 2018), or by the trial and error method (Martha et al., 2010; Hölbling et al., 2012; Shirvani et al., 2019) based on visual analysis. In this study, the trial-error method was used to determine the appropriate segmentation parameters.
Creating Analysis Data
After the segmentation steps, image object attributes (features) were calculated. Image object attributes are the features used in classifying image objects. Textural, spectral, spatial, geometric, and contextual metrics can be used in landslide mapping (Martha et al., 2010; Shirvani et al., 2019). Two different data sets containing image object features were created for the mapping of landslides. These were change-based dataset and post-event dataset. Layers produced from pre-event and post-event bands were used in the creation of the change-based dataset, post-event bands and layers produced from them were used in the creation of the post-event dataset. The features of both datasets used in mapping landslides were selected using eCognition Developer 9.0 software. As a result of the literature review (Martha et al., 2010; Shirvani et al., 2019) and visual analysis, 40 image object features were selected for the change-based dataset (Table 2) and 43 for the post-event dataset (Table 3). Since it does not provide any discrimination in visual analysis, geometric features are not included in the datasets.
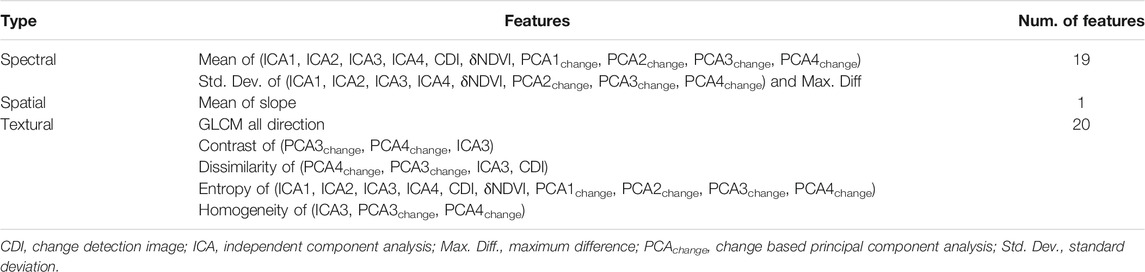
TABLE 2. Selected image object features used for the change-based dataset.
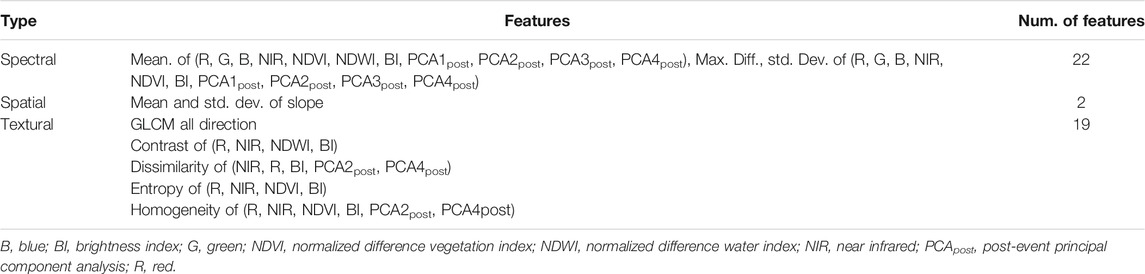
TABLE 3. Selected image object features used for the post-event dataset.
Landslide Mapping
The random forest (RF) algorithm was used for the landslide mapping. RF is an ensemble learning algorithm that generates multiple decision trees using randomly selected variables and subsets in a dataset. To generate the decision tree with the RF classifier, the user must determine the number of variables (m) used in each node and the number of randomly generated trees (N) to determine the best split. For a dataset consisting of M variables, the number of m variables to be randomly selected is determined as a value equal to or close to the
Accuracy Assessment
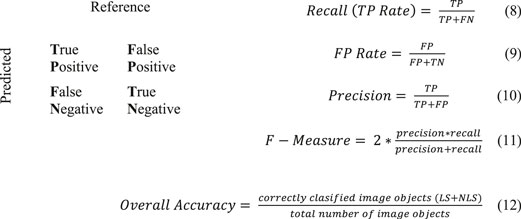
The success of the created classifiers on the test area was calculated according to the accuracy measures developed on the confusion matrix used in two-class classification applications (Eqs 8–11) (Sokolova and Lapalme 2009). The correctly classified of LS and NLS image objects on the test data of the developed models were achieved by using the overall accuracy measures (Eq. 12) (Banko 1998).
Results
In the segmentation stage, different combinations of post-event image bands and layers produced for image difference were tried to identify appropriate input bands to create image objects representing landslides. As a result of the experiments, it was seen that the landslide objects were best obtained from the post-event R, G, B, NIR bands. Therefore, these layers were used as input bands in the segmentation process for all data sets. Different scale parameters (from 10 to 150 by 10), shape, compactness, and layer weights were tested in determining the optimum parameters for MRS. As a result of trial and error, suitable parameters were determined as a scale: 110, shape: 0.3, compactness: 0.7, layer weights as B = G = NIR = 1, R = 2. These values have been applied to be the same for all data sets. These values were used to create image objects for all data sets. Landslides in the image objects obtained result of the segmentation process consists of more than one image object. When the scale parameter was set to more than 110, it has been observed that especially small landslides mix with other land use classes. Image objects created by segmentation for model and test areas were labeled as Landslide (LS) and Non-Landslide (NLS) using pre-event and post-event images. The data sets created for the RF classifier and the numbers of image objects belonging to LS and NLS included in them are shown in Table 4.

TABLE 4. The number of Landslide (LS) and Non-Landslide (NLS) image objects labeled for the models and test datasets to be used in the analysis process.
The RF classifier development process was carried out using WEKA (Waikato Environment for Knowledge Analysis) data mining software. The process of determining the optimum number of trees and the minimum variable was carried out separately for each model area. The number of random trees was applied as different values from 100 to 1500. The number of m variables was applied to the model data sets as 6, 7, 8, 9 values. As a result of the experiments, the m value was determined as 8 for all data sets. The number of trees was defined as 600 for model areas 2 and model area 3 in the change-based dataset. The number of trees in model area 4 was determined as 400 for both the change-based dataset and the post-event dataset. The number of trees was set as 500 for the remaining classifiers. The success of the RF classifiers created for model areas according to the determined parameters on the test area is shown in Table 5. The overall accuracy success of RF classifiers on the test site for separating LS and NLS areas has been achieved by over 95% with all classifiers in both datasets (Table 5).
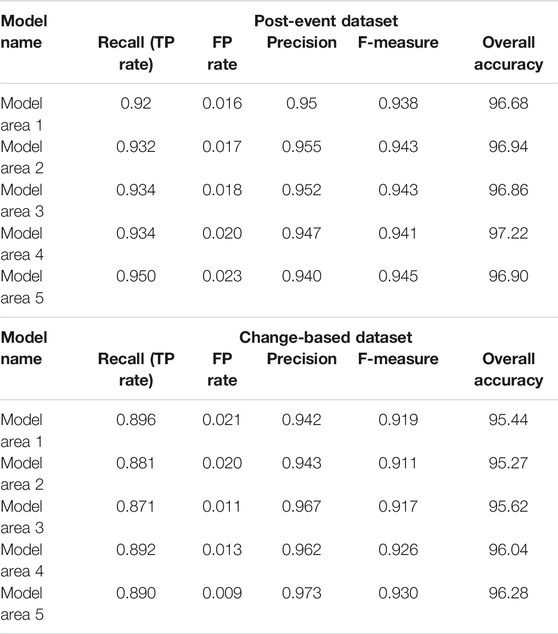
TABLE 5. Accuracy assessment on the test area with RF classifiers developed for model areas.
When the accuracy results were examined (Table 5), it was seen that TP Rate increases in the post-event dataset when the model area expands. With the classifier developed for Model Area 1, 92% of the image objects belonging to the LS in the test area were successfully mapped. This ratio was obtained with 3% more accuracy in the largest dataset. When the number of training data is increased by expanding the model area, the FP rate, which defines the mapping rate of NLS image objects as LS, slightly increased. This change had reduced the precision rate of classifiers. When the success of the developed classifiers for landslide mapping was evaluated, it is observed that very close F-measure values were obtained, but a little more success was achieved in the largest dataset.
When the accuracies for the change-based datasets are investigated, the TP ratio of LS image objects was obtained approximately 90% for the smallest dataset. This ratio decreased by 1 and 2% in model area 2 and model area 3, respectively. In the largest dataset, very close results were obtained with model area 1. When the size of the model dataset was increased, it was seen that the sensitivity of the FP ratio increased and the extraction of NLS objects as LS decreased. This condition has increased the precision ratio and the F-measure value of the developed classifiers.
Comparing the results obtained for the change-based dataset and post-event dataset, landslides were obtained with a higher TP Rate in all model areas where RF classifiers were developed. When the FP Rate values were compared, it was seen that when the data size was increased, the classification of NLS image objects as LS with the change-based data set decreased, and the developed classifiers map the NLS areas with higher accuracy. When the overall success of the classifiers for two datasets was evaluated according to F-measure, it was indicated that landslide mapping with post-event dataset gave higher accuracy values.
In this study, 40 different features were used for the change-based dataset and 43 different features for the post-event dataset. When the feature importance of the variables was investigated, it was observed that the same variables were effective in all model areas. δNDVI in change-based RF classifiers and slope and NDVI in post-event RF classifiers were the most effective features. In Figure 3, the top ten features in the classifier created for the model area 5 based on change-based datasets were shown according to the mean decrease of accuracy and mean decrease of Gini index. When Figure 3 is examined, it is seen that the most important parameters in classification according to mean decrease accuracy were mean values of δNDVI, slope, PCA3, and ICA2. The most important variables that affect the purity of the classifier when extracted from the dataset were mean values of δNDVI, ICA3, PCA3, and PCA4. In Figure 4, the top ten features obtained for Model Area 5 with the post-event dataset were given. The most important features for the developed classifier were obtained as mean values of the slope, NDVI, PCA4, PCA3, and Maximum Difference. The most important parameters that increase the purity of the model were NDVI, PCA2, NDWI, Max Difference, and Red (Figure 4). When the importance of properties for different datasets is evaluated, it is seen that spectral properties and spatial properties are more effective in mapping landslides according to textural properties.
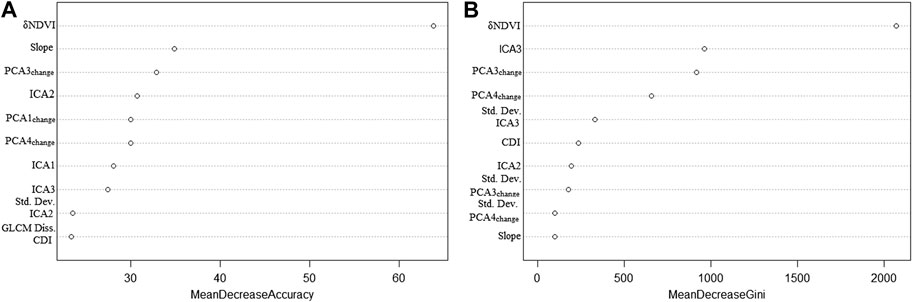
FIGURE 3. The ten most important features for the classifier developed with change-based dataset in model area 5: (A) shows how selected features affect model accuracy when removed from the dataset, (B) indicates how selected features affect model purity when removed from the dataset.
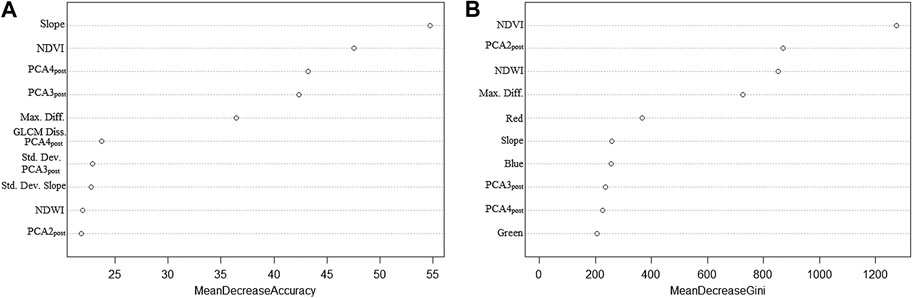
FIGURE 4. The ten most important features for the classifier developed with post-event dataset in model area 5: (A) shows how selected features affect model accuracy when removed from the dataset, (B) indicates how selected features affect model purity when removed from the dataset.
Discussion
In this study, the influence of model development area size and dataset types in landslide mapping during the post-earthquake crisis management phase was investigated. In this context, ten landslide mapping models have been developed with OBIA-RF classifier using two different datasets, namely change-based and post-event dataset, at five model development areas with different sizes. The success of the developed classifier models has been investigated on a determined test area. When the obtained results were examined, although landslide mapping results were obtained with high accuracy from all developed models, higher accuracy values were obtained in classifier models using post-event datasets (Table 5). These results show that while pre-event and post-event images are useful to create or update the landslide inventory maps (Yang and Chen, 2010; Đurić et al., 2017), post-event images without the need for any archive images in crisis management are sufficient in detecting the locations where the dense landslide events occurred. In the comparison of dataset size in this study, it was observed that increasing the dataset size slightly increased the mapping accuracy (Table 5). Therefore, large model areas are not required in the post-disaster decision-making phase. The model development process, which is carried out on a small area that best represents the area to be mapped, is useful for rapid decision-making.
The RF algorithm for landslide mapping was applied to datasets produced by using PlanetScope images and ALOS-PALSAR DEM data in the study. The RF algorithm, which gives successful results in extracting the desired feature in datasets with large sizes and many variables in different application areas (Stumpf and Kerle, 2011; Ramo and Chuvieco, 2017; Shirvani et al., 2019; Maxwell et al., 2020; Shirvani, 2020), has also produced high accuracy results from the datasets used (Table 5). With this research, it has been demonstrated that PlanetScope satellites, which offer daily high spatial resolution images, provide successful results in the detection of earthquake-triggered landslide areas with high accuracy. To produce the slope map of the study area, 30 m resolution ALOS-PALSAR DEM data were used as elevation data. Although this DEM is sufficient for this application in terms of presenting the general slope characteristics of topographic surfaces where landslides occur in the study area, it is insufficient in terms of producing induvial landslide inventory mapping. During the segmentation phase, landslides were obtained as multiple image objects. By merging these image objects, holistic landslides can be obtained (Figure 5). However, these landslides were not individual. The main reason for this is the high reflection of fresh landslides in satellite bands. In the segmentation stage, adjacent landslides with the same spectral value fall into the same image object. For these landslides to be used in susceptibility and hazard maps, the necessary ones should be converted into individual landslides. For this process, post-event high-resolution DEM data of the area is required (Marc and Hovius 2015).
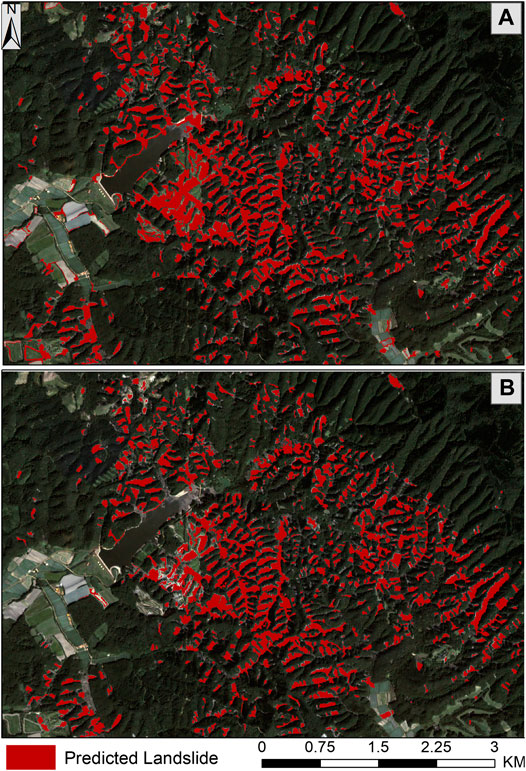
FIGURE 5. Estimated landslides on the test area for model area 5 with RF classifier: (A) post-event dataset result, (B) change-based dataset result.
While determining the object features in the datasets, firstly, the visual evaluation of the image object features to be included in the datasets on the image objects created as a result of the segmentation stage was made. Since the landslide areas consist of more than one image object, geometric features such as length/width, size, shape were not added in the datasets because there was no distinctive finding was observed on these features. Variable importance analysis was performed for the image object features used in datasets. The ten most important features for the datasets were shown in Figures 3, 4. NDVI, which is an effective feature in separating green vegetation areas from landslides, is a frequently preferred feature in landslide mapping with change detection (Mondini et al., 2011; Hölbling et al., 2015; Lu et al., 2019) and classification method (Martha et al., 2010; Shirvani et al., 2019). Since the application areas were chosen in this study were covered with dense forest areas and agricultural land, it has been revealed that NDVI and δNDVI were important features in both the change-based dataset and the post-event dataset (Figures 3, 4). The slope value is especially in the separation of low-slope areas such as roads and bare soil spectrally similar to landslides from landslides (Comert et al., 2019). The slope feature was seen to be an important feature that increases the accuracy of landslide mapping for both the change-based dataset and post-event dataset in this study (Figures 3, 4).
PCA and ICA, which are non-parametric feature extraction methods, are the preferred approaches in landslide mapping with change detection (Mondini et al., 2011; Lu et al., 2019). PCA4, ICA2, ICA3, and ICA4 components produced from pre-event and post-event NIR and Red bands gave successful results (Lu et al., 2019). In this study, PCA1change, PCA3change, and PCA4change, which were among the PCA components produced for the change-based dataset, were found to be important features that increase the accuracy of the classifiers and ensure the purity of the decision trees used in landslide mapping (Figure 3). ICA3, one of the ICA components produced for the change-based dataset, has been seen to be the second most important component that provides the homogeneity of decision trees used in the separation of LS and NLS areas (Figure 3). Also, ICA2 was the fourth feature that positively affects classifier accuracy (Figure 3). In the study, four PCA components were generated from post-event image bands and included in the post-event dataset. Among these features, PCA2post, PCA3post, and PCA4post were found to be important features that increase classification accuracy and provide decision tree purity (Figure 4). According to the variable important results, it shows that the non-parametric components obtained by PCA analysis can be used in landslide mapping studies based on the post-event images.
When examining other features obtained by variable important analysis, it was seen that the Max. Diff. the feature was important in both classifier accuracy and model homogeneity for the post-event dataset. Also, Red, Green Blue bands were obtained as important properties in providing model purity for the post-event dataset. CDI is used in landslide mapping with change detection from multi-temporal images (Li et al., 2016; Lu et al., 2019). In this study, it was seen that for the change-based data set, it was an important parameter in terms of classifiers model homogeneity, although not as much as, δNDVI, PCA, and ICA components.
Conclusion
In this study, the success of different datasets and different data sizes produced from remote sensing images in rapid earthquake-triggered landslide mapping were investigated. In this context, change-based and post-event datasets were created for five model areas and one test area. When RF classifiers developed on model areas were applied to the test area, high accuracies are obtained for all model areas and datasets. However, slightly higher accuracy results have been achieved with post-event datasets compared to change-based dates. Similarly, slightly higher accuracy was obtained when the model area size was increased. When these results are evaluated, in rapid detection of the location where earthquake-triggered landslides occur: 1) models to be used in mapping landslides can be developed over a small area that best represents the area to be mapped, 2) in the landslide mapping process, landslides can be successfully detected from the post-event images without the archive image of the relevant area. In the study, the importance of image object features used in datasets in the mapping process was investigated. When the importance levels of the object features are examined, it has been observed that the highly important features are similar to the features used in the literature. Also, PCA components generated from post-event images are included in the post-event data. Since these components positively affect the classification accuracies, they can be included in the post-event datasets in future studies. The approach presented in this study is an appropriate method for detecting large landslide areas that occur after a natural disaster and to respond rapidly. The presented method needs improvement to create landslide inventory maps. In future studies, both crisis management and inventory mapping research will be conducted from platforms that offer higher spatial resolution images and DEMs such as Unmanned Aerial Vehicle.
Data Availability Statement
The original contributions presented in the study are included in the article/Supplementary Material, further inquiries can be directed to the corresponding author.
Author Contributions
This study was prepared individually by RC.
Conflict of Interest
The author declares that the research was conducted in the absence of any commercial or financial relationships that could be construed as a potential conflict of interest.
Acknowledgments
The author thanks PlanetScope for providing satellite images. I also thank ALOS for providing Digital Elevation Data.
References
Adriano, B., Yokoya, N., Miura, H., Matsuoka, M., and Koshimura, S. (2020). A semiautomatic pixel-object method for detecting landslides using multitemporal ALOS-2 intensity images. Rem. Sens. 12 (3), 561. doi:10.3390/rs12030561
Aimaiti, Y., Liu, W., Yamazaki, F., and Maruyama, Y. (2019). Earthquake-induced landslide mapping for the 2018 Hokkaido eastern iburi earthquake using PALSAR-2 data. Rem. Sens. 11 (20), 2351. doi:10.3390/rs11202351
Baatz, M., Schäpe, A., Strobl, J., Blaschke, T., and Griesebner, G. (2000). Multiresolution Segmentation-an optimization approach for high quality multi-scale image segmentation. Angewandte Geographische Informationsverarbeitung 12 12–23.
Banko, G. (1998). Report No.: IR-98-081. “A review of assessing the accuracy of classifications of remotely sensed data and of methods including remote sensing data in forest inventory Laxenburg, Austria: International Institute for Applied Systems Analysis (IIASA) Interim Report.
Belgiu, M., and Drăguţ, L. (2016). Random forest in remote sensing: a review of applications and future directions. ISPRS J. Photogrammetry Remote Sens. 114, 24–31. doi:10.1016/j.isprsjprs.2016.01.011
Benz, U., and Schreier, G. (2001). Definiens Imaging GmbH: object oriented classification and feature detection. IEEE Geoscience and Remote Sensing Society Newsletter 9, 16–20.
Chen, T., Trinder, J., and Niu, R. (2017). Object-oriented landslide mapping using ZY-3 satellite imagery, random forest and mathematical morphology, for the Three-Gorges Reservoir, China. Rem. Sens. 9 (4), 333. doi:10.3390/rs9040333
Cheng, Y., Vrieling, A., Fava, F., Meroni, M., Marshall, M., and Gachoki, S. (2020). Phenology of short vegetation cycles in a Kenyan rangeland from PlanetScope and Sentinel-2. Remote Sens. Environ. 248, 112004. doi:10.1016/j.rse.2020.112004
Comert, R., Avdan, U., Gorum, T., and Nefeslioglu, H. A. (2019). Mapping of shallow landslides with object-based image analysis from unmanned aerial vehicle data. Eng. Geol. 260, 105264. doi:10.26833/ijeg.455595
Daniell, J. E., Schaefer, A. M., and Wenzel, F. (2017). Losses associated with secondary effects in earthquakes. Front. Built. Environ. 3 (30), 1–4. doi:10.3389/fbuil.2017.00030
Danneels, G., Pirard, E., and Havenith, H.-B. (2007). “Automatic landslide detection from remote sensing images using supervised classification methods,” in IEEE International Geoscience and Remote Sensing Symposium, Barcelona, Spain, July, 2007.
Dou, J., Yunus, A. P., Tien Bui, D., Merghadi, A., Sahana, M., Zhu, Z., et al. (2019). Assessment of advanced random forest and decision tree algorithms for modeling rainfall-induced landslide susceptibility in the Izu-Oshima Volcanic Island, Japan. Sci. Total Environ. 662, 332–346. doi:10.1016/j.scitotenv.2019.01.221
Dou, J., Chang, K.-T., Chen, S., Yunus, A., Liu, J.-K., Xia, H., et al. (2015). Automatic case-based reasoning approach for landslide detection: integration of object-oriented image analysis and a genetic algorithm. Rem. Sens. 7 (4), 4318–4342. doi:10.3390/rs70404318
Drăguţ, L., Csillik, O., Eisank, C., and Tiede, D. (2014). Automated parameterisation for multi-scale image segmentation on multiple layers. ISPRS J. Photogramm. Remote Sens. 88, 119–127. doi:10.1016/j.isprsjprs.2013.11.018
Đurić, D., Mladenović, A., Pešić-Georgiadis, M., Marjanović, M., and Abolmasov, B. (2017). Using multiresolution and multitemporal satellite data for post-disaster landslide inventory in the Republic of Serbia. Landslides 14 (4), 1467–1482. doi:10.1007/s10346-017-0847-2
Gorum, T., and Carranza, E. J. M. (2015). Control of style-of-faulting on spatial pattern of earthquake-triggered landslides. Int. J. Environ. Sci. Technol. 12 (10), 3189–3212. doi:10.1007/s13762-015-0752-y
Gorum, T., van Westen, C. J., Korup, O., van der Meijde, M., Fan, X., and van der Meer, F. D. (2013). Complex rupture mechanism and topography control symmetry of mass-wasting pattern, 2010 Haiti earthquake. Geomorphology. 184, 127–138. doi:10.1016/j.geomorph.2012.11.027
Guzzetti, F., Mondini, A. C., Cardinali, M., Federica, F., Santangelo, M, and Chang, K.-T. (2012). Landslide inventory maps: new tools for an old problem. Earth Sci. Rev. 112 (1-2), 42–66. doi:10.1016/j.earscirev.2012.02.001
Hölbling, D., Friedl, B., and Eisank, C. (2015). An object-based approach for semi-automated landslide change detection and attribution of changes to landslide classes in northern Taiwan. Earth Sci. India 8 (2), 327–335. doi:10.1007/s12145-015-0217-3
Hölbling, D., Füreder, P., Antolini, F., Cigna, F., Casagli, N., and Lang, S. (2012). A semi-automated object-based approach for landslide detection validated by persistent scatterer interferometry measures and landslide inventories. Rem. Sens. 4 (5), 1310–1336. doi:10.3390/rs4051310
Hyvärinen, A., and Oja, E. (2000). Independent component analysis: algorithms and applications. Neural Network 13 (4-5), 411–430. doi:10.1016/s0893-6080(00)00026-5
Jensen, J. R. (2005). “Thematic information extraction: pattern recognition,” in Introductory Digital Image Processing: A Remote Sensing Perspective. Upper Saddle River, NJ: Prentice Hall, 337–406.
Jessee, M. A. N., Hamburger, M. W., Ferrara, M. R., McLean, A., and FitzGerald, C. (2020). A global dataset and model of earthquake-induced landslide fatalities. Landslides 187, 1363–1376. doi:10.1007/s10346-020-01356-z
Karlson, M., Ostwald, M., Reese, H., Sanou, J., Tankoano, B., and Mattsson, E. (2015). Mapping tree canopy cover and aboveground biomass in Sudano-Sahelian woodlands using Landsat 8 and random forest. Rem. Sens. 7 (8), 10017–10041. doi:10.3390/rs70810017
Li, Z., Shi, W., Lu, P., Yan, L., Wang, Q., and Miao, Z. (2016). Landslide mapping from aerial photographs using change detection-based Markov random field. Remote Sens. Environ. 187, 76–90. doi:10.1016/j.rse.2016.10.008
Liu, W., Yamazaki, F., and Maruyama, Y. (2019). Detection of earthquake-induced landslides during the 2018 kumamoto earthquake using multitemporal airborne lidar data. Rem. Sens. 11 (19), 2292. doi:10.3390/rs11192292
Lu, P., Qin, Y., Li, Z., Mondini, A. C., and Casagli, N. (2019). Landslide mapping from multi-sensor data through improved change detection-based Markov random field. Remote Sens. Environ. 231, 111235. doi:10.1016/j.rse.2019.111235
Marc, O., and Hovius, N. (2015). Amalgamation in landslide maps: effects and automatic detection. Nat. Hazards Earth Syst. Sci. 15, 723–733. doi:10.5194/nhess-15-723-2015
Martha, T. R., Norman, K., Jetten, V., Cees, J. v. W., and Kumar, K. V. (2010). Characterising spectral, spatial and morphometric properties of landslides for semi-automatic detection using object-oriented methods. Geomorphology 116 (1-2), 24–36. doi:10.1016/j.geomorph.2009.10.004
Maxwell, A. E., Sharma, M., Kite, J. S., Donaldson, K. A., Thompson, J. A., Bell, M. L., et al. (2020). Slope failure prediction using random forest machine learning and LiDAR in an eroded folded mountain belt. Rem. Sens. 12 (3), 486. doi:10.3390/rs12030486
McFeeters, S. K. (1996). The use of the normalized difference water index (NDWI) in the delineation of open water features. Int. J. Rem. Sens. 17 (7), 1425–1432. doi:10.1080/01431169608948714
Mondini, A. C., Chang, K.-T., and Yin, H.-Y. (2011). Combining multiple change detection indices for mapping landslides triggered by typhoons. Geomorphology 134 (3-4), 440–451. doi:10.1016/j.geomorph.2011.07.021
Ramo, R., and Chuvieco, E. (2017). Developing a random forest algorithm for MODIS global burned area classification. Rem. Sens. 9 (11), 1193. doi:10.3390/rs9111193
Rosi, A., Tofani, V., Tanteri, L., Tacconi Stefanelli, C., Agostini, A., Catani, F., Casagli, N., et al. (2018). The new landslide inventory of Tuscany (Italy) updated with PS-InSAR: geomorphological features and landslide distribution. Landslides 15 (1), 5–19. doi:10.1007/s10346-017-0861-4
Shao, X., Ma, S., Xu, C., Zhang, P., Wen, B., Tian, Y., et al. (2019). Planet image-based inventorying and machine learning-based susceptibility mapping for the landslides triggered by the 2018 Mw6.6 tomakomai, Japan earthquake. Rem. Sens. 11 (8), 978. doi:10.3390/rs11080978
Shirvani, Z. (2020). A holistic analysis for landslide susceptibility mapping applying geographic object-based random forest: a comparison between protected and non-protected forests. Rem. Sens. 12 (3), 434. doi:10.3390/rs12030434
Shirvani, Z., Abdi, O., and Buchroithner, M. (2019). A synergetic analysis of sentinel-1 and -2 for mapping historical landslides using object-oriented random forest in the hyrcanian forests. Rem. Sens. 11 (19), 2300. doi:10.3390/rs11192300
Sokolova, M., and Lapalme, G. (2009). A systematic analysis of performance measures for classification tasks. Inf. Process. Manag. 45 (4), 427–437. doi:10.1016/j.ipm.2009.03.002
Stumpf, A., and Kerle, N. (2011). Object-oriented mapping of landslides using random forests. Remote Sens. Environ. 115 (10), 2564–2577. doi:10.1016/j.rse.2011.05.013
Tanyaş, H., CeesVan Westen, J., E Allstadt, K., Anna Nowicki Jessee, M., Görüm, T., Jibson, R. W., et al. (2017). Presentation and analysis of a worldwide database of earthquake‐induced landslide inventories. J. Geophys. Res.: Earth Surface 122 (10), 1991–2015. doi:10.1002/2017JF004236
Tian, Y., Xu, C., Hong, H., Zhou, Q., and Wang, D. (2019). Mapping earthquake-triggered landslide susceptibility by use of artificial neural network (ANN) models: an example of the 2013 minxian (China) Mw 5.9 event. Geomatics, Nat. Hazards Risk 10 (1), 1–25. doi:10.1080/19475705.2018.1487471
Tucker, C. J. (1979). Red and photographic infrared linear combinations for monitoring vegetation. Remote Sens. Environ. 8 (2), 127–150. doi:10.1016/0034-4257(79)90013-0
Vamsee, A. M., Kamala, P., Martha, T. R., Kumar, K. V., Sankar, G. J., and Amminedu, E. (2018). A tool assessing optimal multi-scale image segmentation. J. Indian Soc. Remote. Sens. 46 (1), 31–41. doi:10.1007/s12524-017-0685-7
Wicaksono, P., and Lazuardi, W. (2018). Assessment of PlanetScope images for benthic habitat and seagrass species mapping in a complex optically shallow water environment. Int. J. Rem. Sens. 39 (17), 5739–5765. doi:10.1080/01431161.2018.1506951
Yamagishi, H., and Yamazaki, F. (2018). Landslides by the 2018 Hokkaido iburi-tobu earthquake on september 6. Landslides 15 (12), 2521–2524. doi:10.1007/s10346-018-1092-z
Yang, X., and Chen, L. (2010). Using multi-temporal remote sensor imagery to detect earthquake-triggered landslides. Int. J. Appl. Earth Obs. Geoinf. 12 (6), 487–495. doi:10.1016/j.jag.2010.05.006
Zhang, S., Li, R., Wang, F., and Iio, A. (2019). Characteristics of landslides triggered by the 2018 Hokkaido eastern iburi earthquake, northern Japan. Landslides 16 (9), 1691–1708. doi:10.1007/s10346-019-01207-6
Zhao, W., Li, A., Nan, X., Zhang, Z., and Lei, G. (2017). Postearthquake landslides mapping from Landsat-8 data for the 2015 Nepal earthquake using a pixel-based change detection method. IEEE J. Sel. Top. Appl. Earth Observations Remote Sensing 10 (5), 1758–1768. doi:10.1109/jstars.2017.2661802
Keywords: OBIA (object based image analysis), random forest, landslide mapping, hokkaido earthquake, planetScope
Citation: Comert R (2021) Investigation of the Effect of the Dataset Size and Type in the Earthquake-Triggered Landslides Mapping: A Case Study for the 2018 Hokkaido Iburu Landslides. Front. Earth Sci. 9:633665. doi: 10.3389/feart.2021.633665
Received: 25 November 2020; Accepted: 11 January 2021;
Published: 25 February 2021.
Edited by:
Tolga Gorum, Istanbul Technical University, TurkeyReviewed by:
Fushun Balik Sanli, Yıldız Technical University, TurkeyZeinab Shirvani, Technische Universität Dresden, Germany
Copyright © 2021 Comert. This is an open-access article distributed under the terms of the Creative Commons Attribution License (CC BY). The use, distribution or reproduction in other forums is permitted, provided the original author(s) and the copyright owner(s) are credited and that the original publication in this journal is cited, in accordance with accepted academic practice. No use, distribution or reproduction is permitted which does not comply with these terms.
*Correspondence: Resul Comert, cmNvbWVydEBndW11c2hhbmUuZWR1LnRy