 Nicholas D. Perez
 Ryan B. Anderson
 Brian K. Horton
 Bailey A. Ohlson
 Amanda Z. Calle3
- 1Department of Geology & Geophysics, Texas A&M University, College Station, TX, United States
- 2Department of Geosciences, Idaho State University, Pocatello, ID, United States
- 3Department of Geological Sciences, Institute for Geophysics, Jackson School of Geosciences, The University of Texas at Austin, Austin, TX, United States
The Bolivian Andes are an archetypal convergent margin orogen with a paired fold-thrust belt and foreland basin. Existing chronostratigraphic constraints highlight a discrepancy between unroofing of the Eastern Cordillera and Interandean Zone fold-thrust systems since 40 Ma and the onset of rapid sediment accumulation in the Subandean Chaco foreland after 11 Ma, previously attributed to Miocene climate shifts. New results from magnetostratigraphic, backstripping, erosional volumetric calculations, and flexural modeling efforts are integrated with existing structural and thermochronologic datasets to investigate the linkages between shortening, exhumation, and subsidence. Magnetostratigraphic and backstripping results determine tectonic subsidence in the Chaco foreland basin, which informs flexural models that evaluate topographic load and lithospheric parameters. These models show that Chaco foreland subsidence is consistent with a range of loading scenarios. Eroded volumes from the fold-thrust belt were sufficient to fill the Chaco foreland basin, further supporting the linkage between sediment source and sink. Erosional beveling of the Eastern Cordillera, local intermontane sediment accumulation after 30–25 Ma, and regional development of the high-elevation San Juan del Oro geomorphic surface from 25 to 10 Ma suggest that the western Eastern Cordillera did not store the large sediment volume expected from erosion of the fold-thrust belt, which arrived in the Subandean Zone after 11 Ma. Eocene to middle Miocene foreland basin accumulation was likely focused between the Eastern Cordillera and Interandean Zone, and has been almost completely recycled into the modern Subandean foreland basin. The delay between initial fold-thrust belt exhumation (early Cenozoic) and rapid Subandean subsidence (late Cenozoic) highlights the interplay between protracted shortening, underthrusting, and foreland basin recycling. Only with sufficient crustal shortening, accommodated by eastward advance of the fold-thrust belt and attendant underthrusting of Brazilian Shield lithosphere beneath the Subandes, did the Subandean zone enter proximal foreland basin deposystems after ca. 11 Ma. Prior to the late Miocene, the precursor flexural basin was situated westward and not wide enough to incorporate the distal Subandean Zone. These results highlight the interplay between a range of crustal and surface processes linked to tectonics and Miocene climate shifts on the evolution of the southern Bolivian Andes.
Introduction
Paired fold-thrust belts and foreland basins in retroarc contractional systems archive the interactions between convergent plate boundary dynamics and surface processes spanning deep time to the present. The fold-thrust belt and foreland basin system in the central Andes have served as a conceptual model for thin-skinned retroarc systems with large magnitudes of shortening, crustal thickening, and protracted foreland basin system development. In Bolivia, the structural geometries, kinematics, and timing of fold-thrust belt development (Dunn et al., 1995; Kley, 1996; Baby et al., 1997; McQuarrie, 2002; Müller et al., 2002; Oncken et al., 2006; Ege et al., 2007; Barnes et al., 2008; Perez et al., 2016; Anderson et al., 2017, 2018) have been linked to geophysical estimates on crustal thickness and possible removal of lithosphere (Beck and Zandt, 2002). These crustal processes may reflect Cordilleran cyclicity (DeCelles et al., 2009; DeCelles and Graham, 2015) or interactions with fluctuating subducting slab geometries (e.g., Ramos and Folguera, 2009; Horton, 2018a,b), and have implications for surface uplift (Garzione et al., 2006, 2017; Saylor and Horton, 2014), foreland and hinterland basin development (Horton, 2005; Uba et al., 2006), and orogenic plateau genesis (e.g., Isacks, 1988; Allmendinger et al., 1997; Lamb and Hoke, 1997).
Despite the wealth of information on the tectonic development of the central Andes, a full integration of the varied structural, thermochronological, stratigraphic, and geomorphologic datasets remains challenging. Specifically, the lack of Cenozoic mass balance constraints highlights challenges in understanding the linkages among shortening, erosion, and deposition within this paired fold-thrust belt and foreland basin system (Barnes and Heins, 2009). Key discrepancies underscore this persistent problem. For example, although the Eastern Cordillera recorded protracted shortening spanning the Eocene to Miocene (McQuarrie, 2002; Barnes et al., 2006, 2008; Gillis et al., 2006; Ege et al., 2007; Anderson et al., 2018), Subandean basin fill recorded punctuated sediment accumulation since the middle to late Miocene, possibly attributable to climate shifts (Strecker et al., 2007). This contrast highlights a mismatch between active deformational phases in the Eastern Cordillera fold-thrust belt and the main phase of subsidence in the accompanying foreland basin (Echavarria et al., 2003; Uba et al., 2006, 2009; Calle et al., 2018).
The present study is motivated by key datasets and geologic relationships that facilitate investigation of shortening, erosional exhumation, and sediment accumulation. A series of accurate, incrementally balanced cross sections (McQuarrie, 2002; Anderson et al., 2017, 2018) are complemented by rich thermochronologic records (Barnes et al., 2006, 2008; Gillis et al., 2006; Ege et al., 2007; McQuarrie et al., 2008; Rak et al., 2017; Anderson et al., 2018) (Figure 1) that document the timing and location of contraction, and provide constraints on the magnitude of erosional unroofing. Relict foreland basin fill preserved within the orogenic interior (Kennan et al., 1995; Horton, 1998, 2005; Mosolf et al., 2011), hinterland plateau (Sempere et al., 1990; Baby et al., 1997; Horton et al., 2001, 2002; Murray et al., 2010), and Subandean Zone (Uba et al., 2006, 2009; Calle et al., 2018) determine the timing and magnitude of sediment accumulation. The San Juan del Oro surface (Figure 1) is an ancient geomorphic surface that remains relatively undeformed and is currently situated at ca. 3 km elevation (Gubbels et al., 1993; Hérail et al., 1996; Kennan et al., 1997; Müller et al., 2002). The surface marks the cessation of shortening across the Eastern Cordillera, and presents a datum against which to gauge erosion and incision since final surface construction at roughly 10 Ma. The colocation of these features provide a unique opportunity to investigate mass balance in the context of regional shortening and basin subsidence.
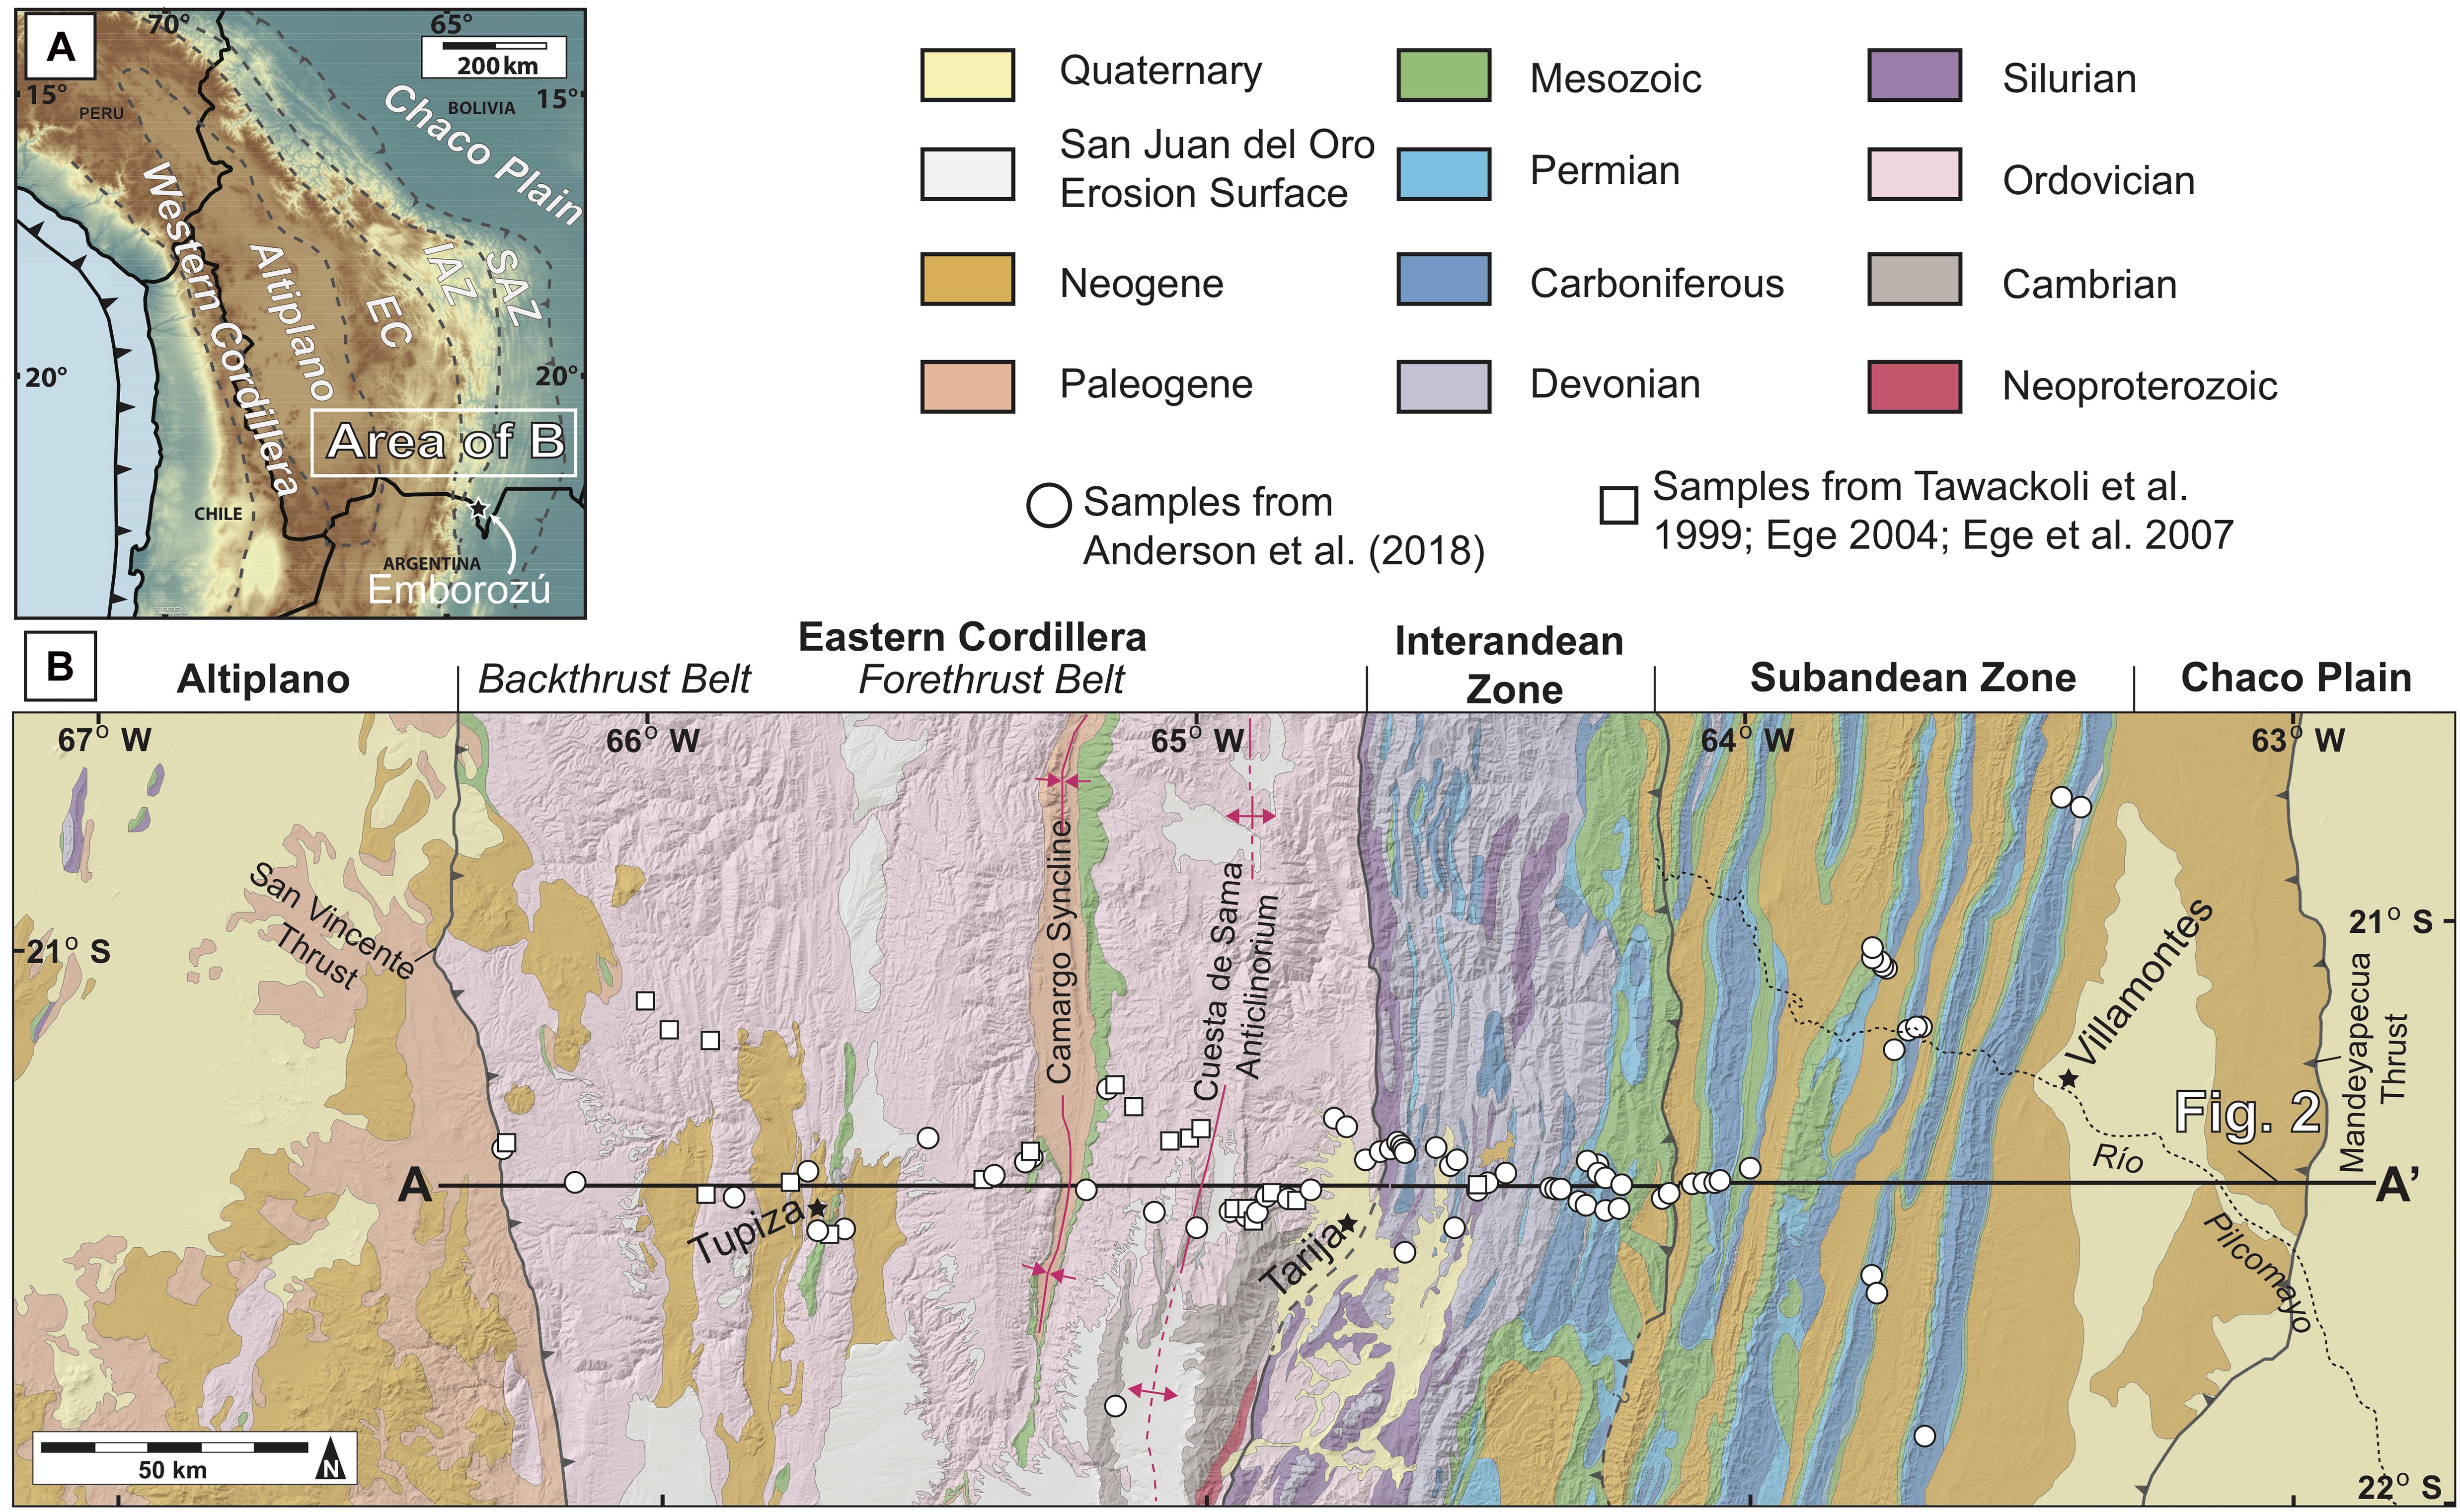
Figure 1. (A) Overview map of the central Andes, showing the location of major tectonomorphic features, Western Cordillera, Altiplano, Eastern Cordillera (EC), Interandean Zone (IAZ), Subandean Zone (SAZ), and the Chaco Plain. (B) Geologic map showing the location of cross section A–A′ in Figures 3, 6, 8, and thermochronologic data. Villamontes succession shows the approximate site of magnetostratigraphic investigation. Modified from Anderson et al. (2018).
Here, multiple new datasets are combined: magnetostratigraphic results from a Miocene stratigraphic section in the Subandean Zone to facilitate a new backstripping analysis; estimates of the volume of material eroded from the Eastern Cordillera and Interandean Zone fold-thrust belt; and estimates of the eroded volume beneath the San Juan del Oro surface and the volume of sediment preserved in the Chaco foreland basin (as restricted to the southern Bolivian transect considered here). Coupled with existing results on the timing, magnitude, and kinematics of shortening in the Eastern Cordillera, Interandean Zone, and Subandean Zone, the following questions are addressed for southern Bolivia. (1) What are the timing and magnitude of tectonic subsidence in the Subandean foreland basin? (2) Is the magnitude of tectonic subsidence comparable to flexural modeling predictions? (3) Are eroded rock volumes from potential source regions consistent with the volume of preserved foreland basin fill? (4) Why did the Subandean foreland basin experience rapid subsidence 10s of Myrs after the onset of fold-thrust belt contraction?
Geologic Background
The Central Andean fold-thrust belt can be divided into distinct structural zones defined by major changes in topographic elevation, stratigraphic exposure level, and structural style (Kley, 1996; McQuarrie, 2002; Anderson et al., 2017). From west to east, these include the Eastern Cordillera, the Interandean Zone, the Subandean Zone, and the Chaco Plain (Figure 1). The Eastern Cordillera is divided into a backthrust belt in the west and a forethrust belt in the east, centered about a north–south axis through the Tupiza region (Kley et al., 1997; McQuarrie, 2002; Müller et al., 2002; Sempere et al., 2002; Anderson et al., 2017). The western backthrust belt is characterized by closely spaced faults and short wavelength folds (<2 km), along with fault-bounded late Oligocene to Miocene intermontane basins (Horton, 1998; Müller et al., 2002; Anderson et al., 2017). The eastern forethrust belt is characterized by more widely spaced structures, and the presence of two significant regional features: the Camargo syncline, and the ca. 55 km wide Cuesta de Sama anticlinorium. The latter persists for hundreds of kilometers along strike from northern Argentina to central Bolivia (Kley, 1996; McQuarrie, 2002; Anderson et al., 2017). East of the Cuesta de Sama anticlinorium, shallower structural levels are exposed in the Interandean Zone as the basal decollement cuts up from Cambrian–Ordivician rocks to a regional decollement within Silurian shales (Baby et al., 1992; Dunn et al., 1995). Similar to the Eastern Cordillera, the Interandean Zone can be divided into a western backthrust zone and eastern forethrust zone (Anderson et al., 2017). However, the structural style in the Interandean Zone is characterized by more closely spaced thrust faults accompanied by tight fault bend folds (1–3 km), stratigraphic exposures of predominantly Silurian and Devonian rocks, and a distinct lack of any Cenozoic synorogenic sediments (Kley, 1996; Anderson et al., 2017). The Subandean Zone is defined by a valley-and-ridge topography, with broad wavelength folds (5–10 km) bound on their eastern limbs by east-vergent thrust faults that are continuous along strike for hundreds of kilometers (Baby et al., 1992; Dunn et al., 1995; Anderson et al., 2017). Stratigraphic exposure levels transition from Silurian–Devonian rocks in the Interandean Zone to mainly Carboniferous–Neogene rocks in the Subandean Zone, with Carboniferous strata exposed in cores of anticlinal ranges and Neogene synorogenic rocks in the intervening synclinal valleys (Anderson et al., 2017). In the western Chaco plain, the active frontal thrust (Mandeyapecua thrust) lies ca. 60 km east of the Subandean topographic front (Figure 1) (Costa et al., 2006; Brooks et al., 2011). The structure of the intervening region is characterized by gentle folds and low-offset thrust faults concealed beneath low-relief Quaternary sedimentary cover (Baby et al., 1992; Dunn et al., 1995; Horton and DeCelles, 1997; Anderson et al., 2017).
Shortening in the Eastern Cordillera began in the Eocene. The oldest zircon (U-Th)/He cooling ages suggest exhumation and cooling of the Cuesta de Sama anticlinorium potentially as early as ca. 40–39 Ma. However, these samples have relatively large errors (Anderson et al., 2018). Alternatively, thermal modeling of paired zircon (U-Th)/He, apatite fission track, and apatite (U-Th)/He samples indicate rapid exhumation of the Cuesta de Sama anticlinorium may have occurred as late as ca. 32 Ma (Ege et al., 2007; Anderson et al., 2018). Despite uncertainty regarding the precise timing and position of initial contraction, upper crustal shortening advanced westward across the Eastern Cordillera backthrust belt primarily in late Eocene and Oligocene time (McQuarrie and DeCelles, 2001; DeCelles and Horton, 2003; Ege et al., 2007; Anderson et al., 2018), and reached the San Vicente thrust along the Eastern Cordillera–Altiplano boundary by ca. 27 Ma (Müller et al., 2002; Ege et al., 2007; Anderson et al., 2018). The end of upper crustal shortening in the Eastern Cordillera is marked by diminished sedimentation rates and deposition of intermontane basin fill unconformably on deformed Paleozoic strata of the Eastern Cordillera (Horton, 2005). At this time, rapid cooling propagated eastward into the Interandean Zone from 25 to 18.5 Ma (Ege et al., 2007; Anderson et al., 2018). Depositional ages of Neogene strata determined from interbedded tuffs and apatite (U-Th)/He cooling ages show the thrust front migrated into the western Subandean Zone by ca. 8 Ma, propagated eastward to the Villamontes section by 1.5–2 Ma, and reached the active thrust front (Mandeyapecua thrust) after 2.1 Ma (Costa et al., 2006; Uba et al., 2009; Hulka and Heubeck, 2010; Lease et al., 2016; Anderson et al., 2018; Calle et al., 2018).
This study reports new magnetostratigraphic and backstripping results for the Angosto del Pilcomayo section (Uba et al., 2005) ca. 4 km west of Villamontes, Bolivia in the Chaco foreland basin (Figure 1). Along the banks of the Río Pilcomayo, ca. 1,370 m of exposed stratigraphic section spans the Petaca, Yecua, Tariquia, and Guandacay Formations. These Neogene sedimentary rocks represent retroarc foreland basin fill of the Chaco basin. The western third of the basin has been incorporated into fold-thrust structures of the Subandean Zone. The basin continues to the east where it onlaps distally onto the Brazilian shield. Sediment accumulation began in the late Oligocene synchronous with shortening in the Eastern Cordillera (Uba et al., 2005).
The synorogenic sedimentary wedge disconformably overlies Cretaceous eolian sandstones containing large-scale trough-cross bedding. The Angosto del Pilcomayo section is composed of the non-marine Petaca, Yecua, Tariquia, Guandacay, and Emborozú Formations (Figure 2) (Uba et al., 2005). A brief synthesis of these formations from Uba et al. (2006) follows. The Oligocene to middle Miocene Petaca Formation comprises fluvial sandstones, abundant pedogenic horizons, and reworked pedogenic conglomerates. The Miocene Yecua Formation has been interpreted as spanning marginal marine, lacustrine to fluvial conditions across the Subandean Zone. In the study area, the middle Miocene Yecua Formation overlies the Petaca Formation, possibly with a subtle low-angle unconformity, and hosts fluvial overbank and channel facies. The upper Miocene Tariquia Formation contains interbedded thin- and thick-bedded sandstone, mudstone, and fine-grained sandstone, as well as poorly developed pedogenic horizons and abundant mudcracks. This has been interpreted as a product of a distal fluvial megafan environment. The upper Miocene to Pliocene Guandacay Formation contains conglomerate, sandstone, and mudstone consistent with braided streams in a medial fluvial megafan environment. The upper Pliocene to Pleistocene Emborozú Formation contains upward-coarsening thick-bedded conglomeratic strata displaying laterally continuous sheetlike bedding geometries attributed to deposition in a proximal fluvial environment.
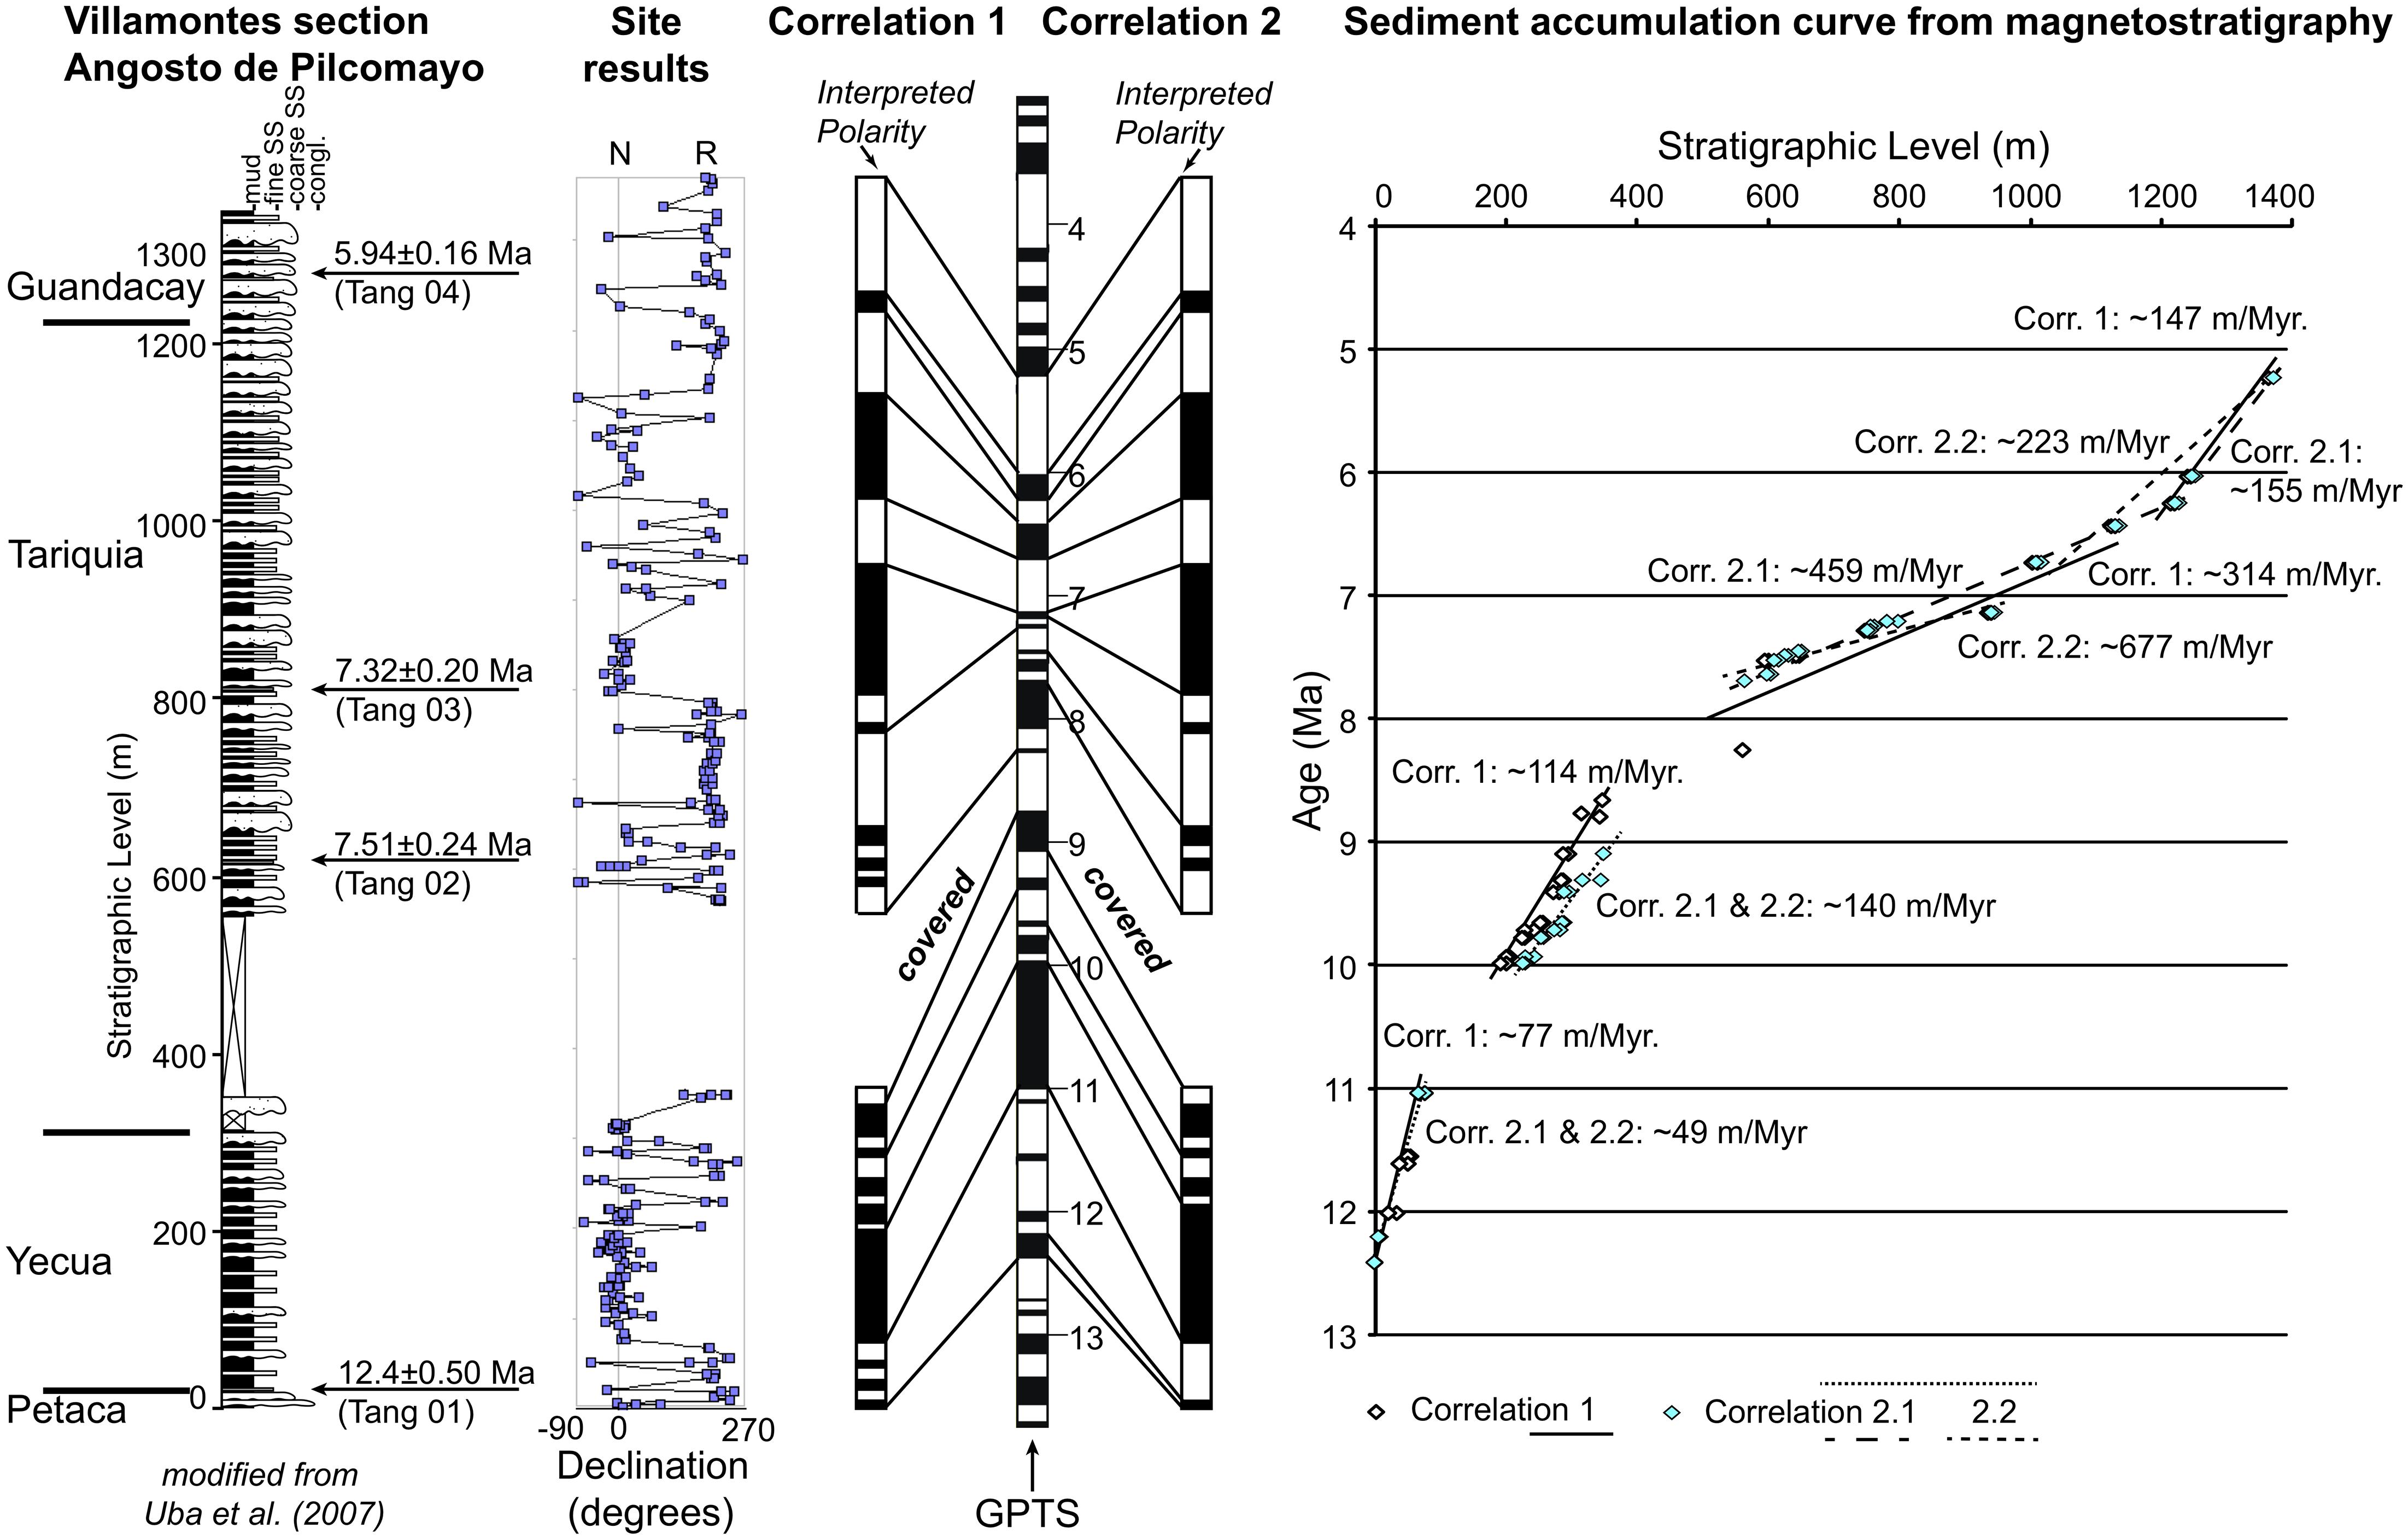
Figure 2. Synthesis of magnetostratigraphic results. On the left, stratigraphic section geochronologic results from U-Pb geochronology at four positions (Uba et al., 2007) in the Angosto del Pilcomayo section near Villamontes, Bolivia. Site results from magnetostratigraphic investigation, showing the tilt-corrected declination of the primary magnetization vector determined for specimens at each site. N denotes normal polarity with a declination of 0°, and R denotes reversed polarity with a declination of 180°. Two possible interpreted polarity results are correlated with the Global Polarity Time Scale, pinned by the geochronologic ages shown. The ages and stratigraphic levels of the chrons in each correlation are plotted to define sediment accumulation curves. Correlation 1 is shown with white symbols, and average sediment accumulation rates are shown as linear interpolations (undecompacted). Correlation 2 is shown with light blue symbols. Two slightly different average sediment accumulation rates are shown, resulting in correlations 2.1 and 2.2.
Materials and Methods
Magnetostratigraphy
Presented here is an overview of the magnetostratigraphic sampling and analytical methods. A detailed summary is provided in the Supplementary Materials. In the field, individual beds were selected as potential sample sites on the basis of lithology and stratigraphic level. The stratigraphic position of sampled beds are anchored to dated volcanic tuff horizons (Uba et al., 2005, 2006, 2007, 2009), providing foundational geochronologic constraints. Sampling focused on the Yecua, Tariquia, and lower ca. 100 m of the Guandacay Formation, which contain continuous exposures of siltstone to fine-grained sandstone lithologies best suited for magnetostratigraphic analysis. Samples were not collected from coarse-grained, discontinuous exposures intervals, including the underlying Petaca Formation and the overlying main body of the Guandacay or Emborozú Formations. Sample cores were obtained using a modified chainsaw with a circular 1-inch diameter, diamond tipped drill bit. At each sample site, a minimum of three separate cores (A, B, and C) were collected over a restricted stratigraphic range (generally less than 10–20 cm) and lateral distance (less than 1 m). The orientation of each core was measured before extraction using an orientation stage and compass. A total of 207 sites were collected from different stratigraphic horizons within the 1,370 m section, yielding an average stratigraphic spacing of ca. 6.5 m between successive sites. Using a customized trim saw with three circular, parallel, diamond tipped blades, each cylindrical core was cut into one or more half-inch thick disk-shaped specimens. To measure the remanent magnetization of the sample cores, each specimen was placed on the automated sample handling tray linked to a 2-G rock magnetometer in the Paleomagnetics Laboratory at The University of Texas at Austin. After measurement of the natural remanent magnetization (NRM), each specimen underwent a series of systematic thermal demagnetization steps using a shielded oven, measuring the thermal remanent magnetization (TRM) after each heating experiment. Due to instrument issues, only the A cores from all sites, and sites 1–136 of B cores could be analyzed. After progressive thermal demagnetization, the primary magnetization orientation for each specimen was analyzed using Paleomag X software. The resulting sequence of normal and reversed polarity intervals was then correlated to the Geomagnetic Polarity Time Scale (GPTS) (Gradstein et al., 2004), tied to stratigraphic horizons with known chronostratigraphic ages (Figure 2) (Uba et al., 2007). Two slightly different correlations (1 and 2) to the GPTS are presented. For correlation 2, average rates of deposition may be interpreted in two ways, leading to correlations 2.1 and 2.2.
Backstripping
The new magnetostratigraphic results were used to conduct 1D Airy backstripping with exponential reduction of porosity to determine the magnitude of tectonic subsidence at the Villamontes section. OSXBackstrip software by N. Cardozo was used to implement methods described in Watts (2001) and Allen and Allen (2013). The sections were modeled as non-marine basins. Two scenarios were conducted, one with pure sandstone lithology, and one with pure shale lithology. This was done to investigate the relative importance of lithology on final magnitudes of tectonic subsidence, which are minimal (see section “Results” below). For sandstone, a density of 2,600 kg/m3, porosity coefficient c of 0.270 km–1, and original porosity of 49% were used. For shale, density of 2,500 kg/m3, porosity coefficient c of 0.510 km–1, and original porosity of 63% were used. Published ages and maximum stratigraphic thicknesses were used to model the Emborozú section (Calle et al., 2018). Tectonic subsidence was also estimated at two other positions east of the Villamontes succession along the line of section. These two additional locations lack chronostratigraphic control, and were used strictly to assess lateral variations in the total magnitude of tectonic subsidence. At these locations, we applied the ratio of tectonic subsidence magnitude to total sediment accumulation determined from the Villamontes section to determine equivalent tectonic subsidence at points B and C (Figure 3). The magnitude of tectonic subsidence is used for all three localities (Villamontes and point B and C) to constrain flexural modeling results.
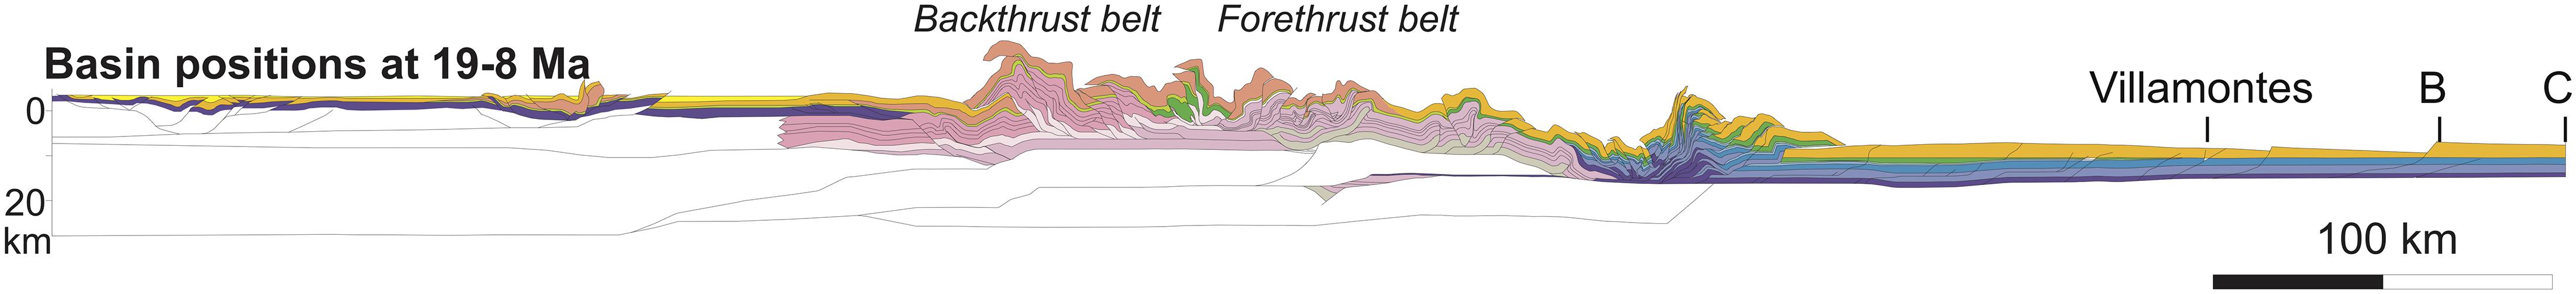
Figure 3. Partially restored balanced cross section showing the positions of stratigraphic sections at Villamontes, and positions B and C, which were used in the flexural modeling. Modified from Anderson et al. (2018).
Eroded and Deposited Volume
In Eastern Cordillera, Interandean Zone, and Chaco Foreland
AreaErrorProp software (Judge and Allmendinger, 2011; Allmendinger and Judge, 2013) was used to calculate the cross-sectional area of material eroded from the Eastern Cordillera and Interandean Zone, and the cross-sectional area of basin fill in the Chaco foreland. Eroded area was determined from the portions of the balanced cross section of Anderson et al. (2017) projected above the present surface. Eroded areas that belong to the Eastern Cordillera or the Interandean Zone are distinguished from each other and calculated separately based on the kinematic designation of each morphotectonic zone, as defined by Anderson et al. (2017, 2018). In the Chaco foreland, the pre-Cenozoic basement slope was projected eastward to the approximate pinchout of Cenozoic basin fill in the distal Chaco foreland, constrained from the regional dip observed in seismic data and depicted in cross sections (e.g., Dunn et al., 1995; Tankard et al., 1995; Uba et al., 2009; Anderson et al., 2017). This projection agrees with maps of the foreland basin geometry (Horton and DeCelles, 1997). Once determined, cross-sectional areas were multiplied by 146 km, the strike-parallel (north–south) extent of the geologic map from Anderson et al. (2018), to determine the volume of material eroded from the Eastern Cordillera and Interandean Zone, as well as the volume of material preserved in the Chaco foreland basin. These calculations are restricted to the study area and do not apply to other latitudes of the orogenic belt. The 3D rugose nature of the basement-cover interface was not considered in the volumetric calculations of foreland basin fill. A north–south transect through the Subandean Zone based on subsurface datasets shows 1–2 km amplitude irregularities of this contact and an average depth of ca. 2.5 km depth below sea level (McGroder et al., 2015), although there is no systematic dip of the basement contact within the study area.
From Beneath the San Juan del Oro Surface
The geologic map of Anderson et al. (2018) was georeferenced in ArcMap to guide the interpolation of the high-elevation San Juan del Oro surface. The mapped distribution of the San Juan del Oro surface was extrapolated onto the MERIT DEM (multi-error-removed improved terrain digital elevation model; Yamazaki et al., 2017). A slope map calculated from the MERIT DEM was used to aid mapping, which shows low-relief portions of the surface. By defining multiple points delimiting the preserved boundaries of the San Juan del Oro surface, the elevation was extracted from the MERIT DEM and added as an attribute field to the point feature class that defined the surface. Using these points, kriging interpolation was used to define the original low-relief surface geometry. The parameters for the kriging tool include the point feature class that indicates the boundary of the San Juan del Oro surface, and the z-value field, which indicates the attribute field in the point feature class that contains the elevation data. Additionally, the search radius, which defines the points used to interpolate the value for each cell of the output raster, was set at 100 points. All other kriging parameters were left as default values. Finally, to calculate the volume of material eroded from beneath the San Juan del Oro surface since its formation, the Raster Calculator tool was used to determine the difference between the interpolated San Juan del Oro surface raster and the MERIT DEM. All locations where the MERIT DEM was at a higher elevation than the kriged surface were excluded from these calculations.
Flexural Modeling
Matlab-based software FlexMC (Saylor et al., 2018) was used to perform Monte Carlo simulations that investigate a range of possible flexural loading configurations (variable dimensions and densities) and lithospheric conditions that could explain the magnitude of tectonic subsidence at three positions in the Bolivian foreland basin: Villamontes succession, and points B and C. The selected model space was defined as 800 km wide by 20 km high (10 km above and below a horizontal reference surface). The loads were allowed to vary between 50 and 300 km in width, and between 1 and 8 km in height. Elastic thickness could vary between 10 and 100 km. Three possible lateral patterns in effective elastic thickness (EET) were explored: laterally constant, linearly laterally variable, and exponentially laterally variable. Two possible geometries of the topographic load were explored: a rectangular load and a foreland-sloping load. The front (right) edge of the load was pinned at the 300 km position, and the load was situated to the left of the pin. The horizontal position of the three basin localities (Villamontes, B, and C) were measured from the Andean deformation front in the sequentially restored cross section of Anderson et al. (2018) at 8 Ma (Figure 3), and are depicted in the model (Figure 4; yellow points). Subsidence uncertainties of 500 m were implemented for the three basin localities. For each of the 6 model runs, 1,000 trials were conducted.
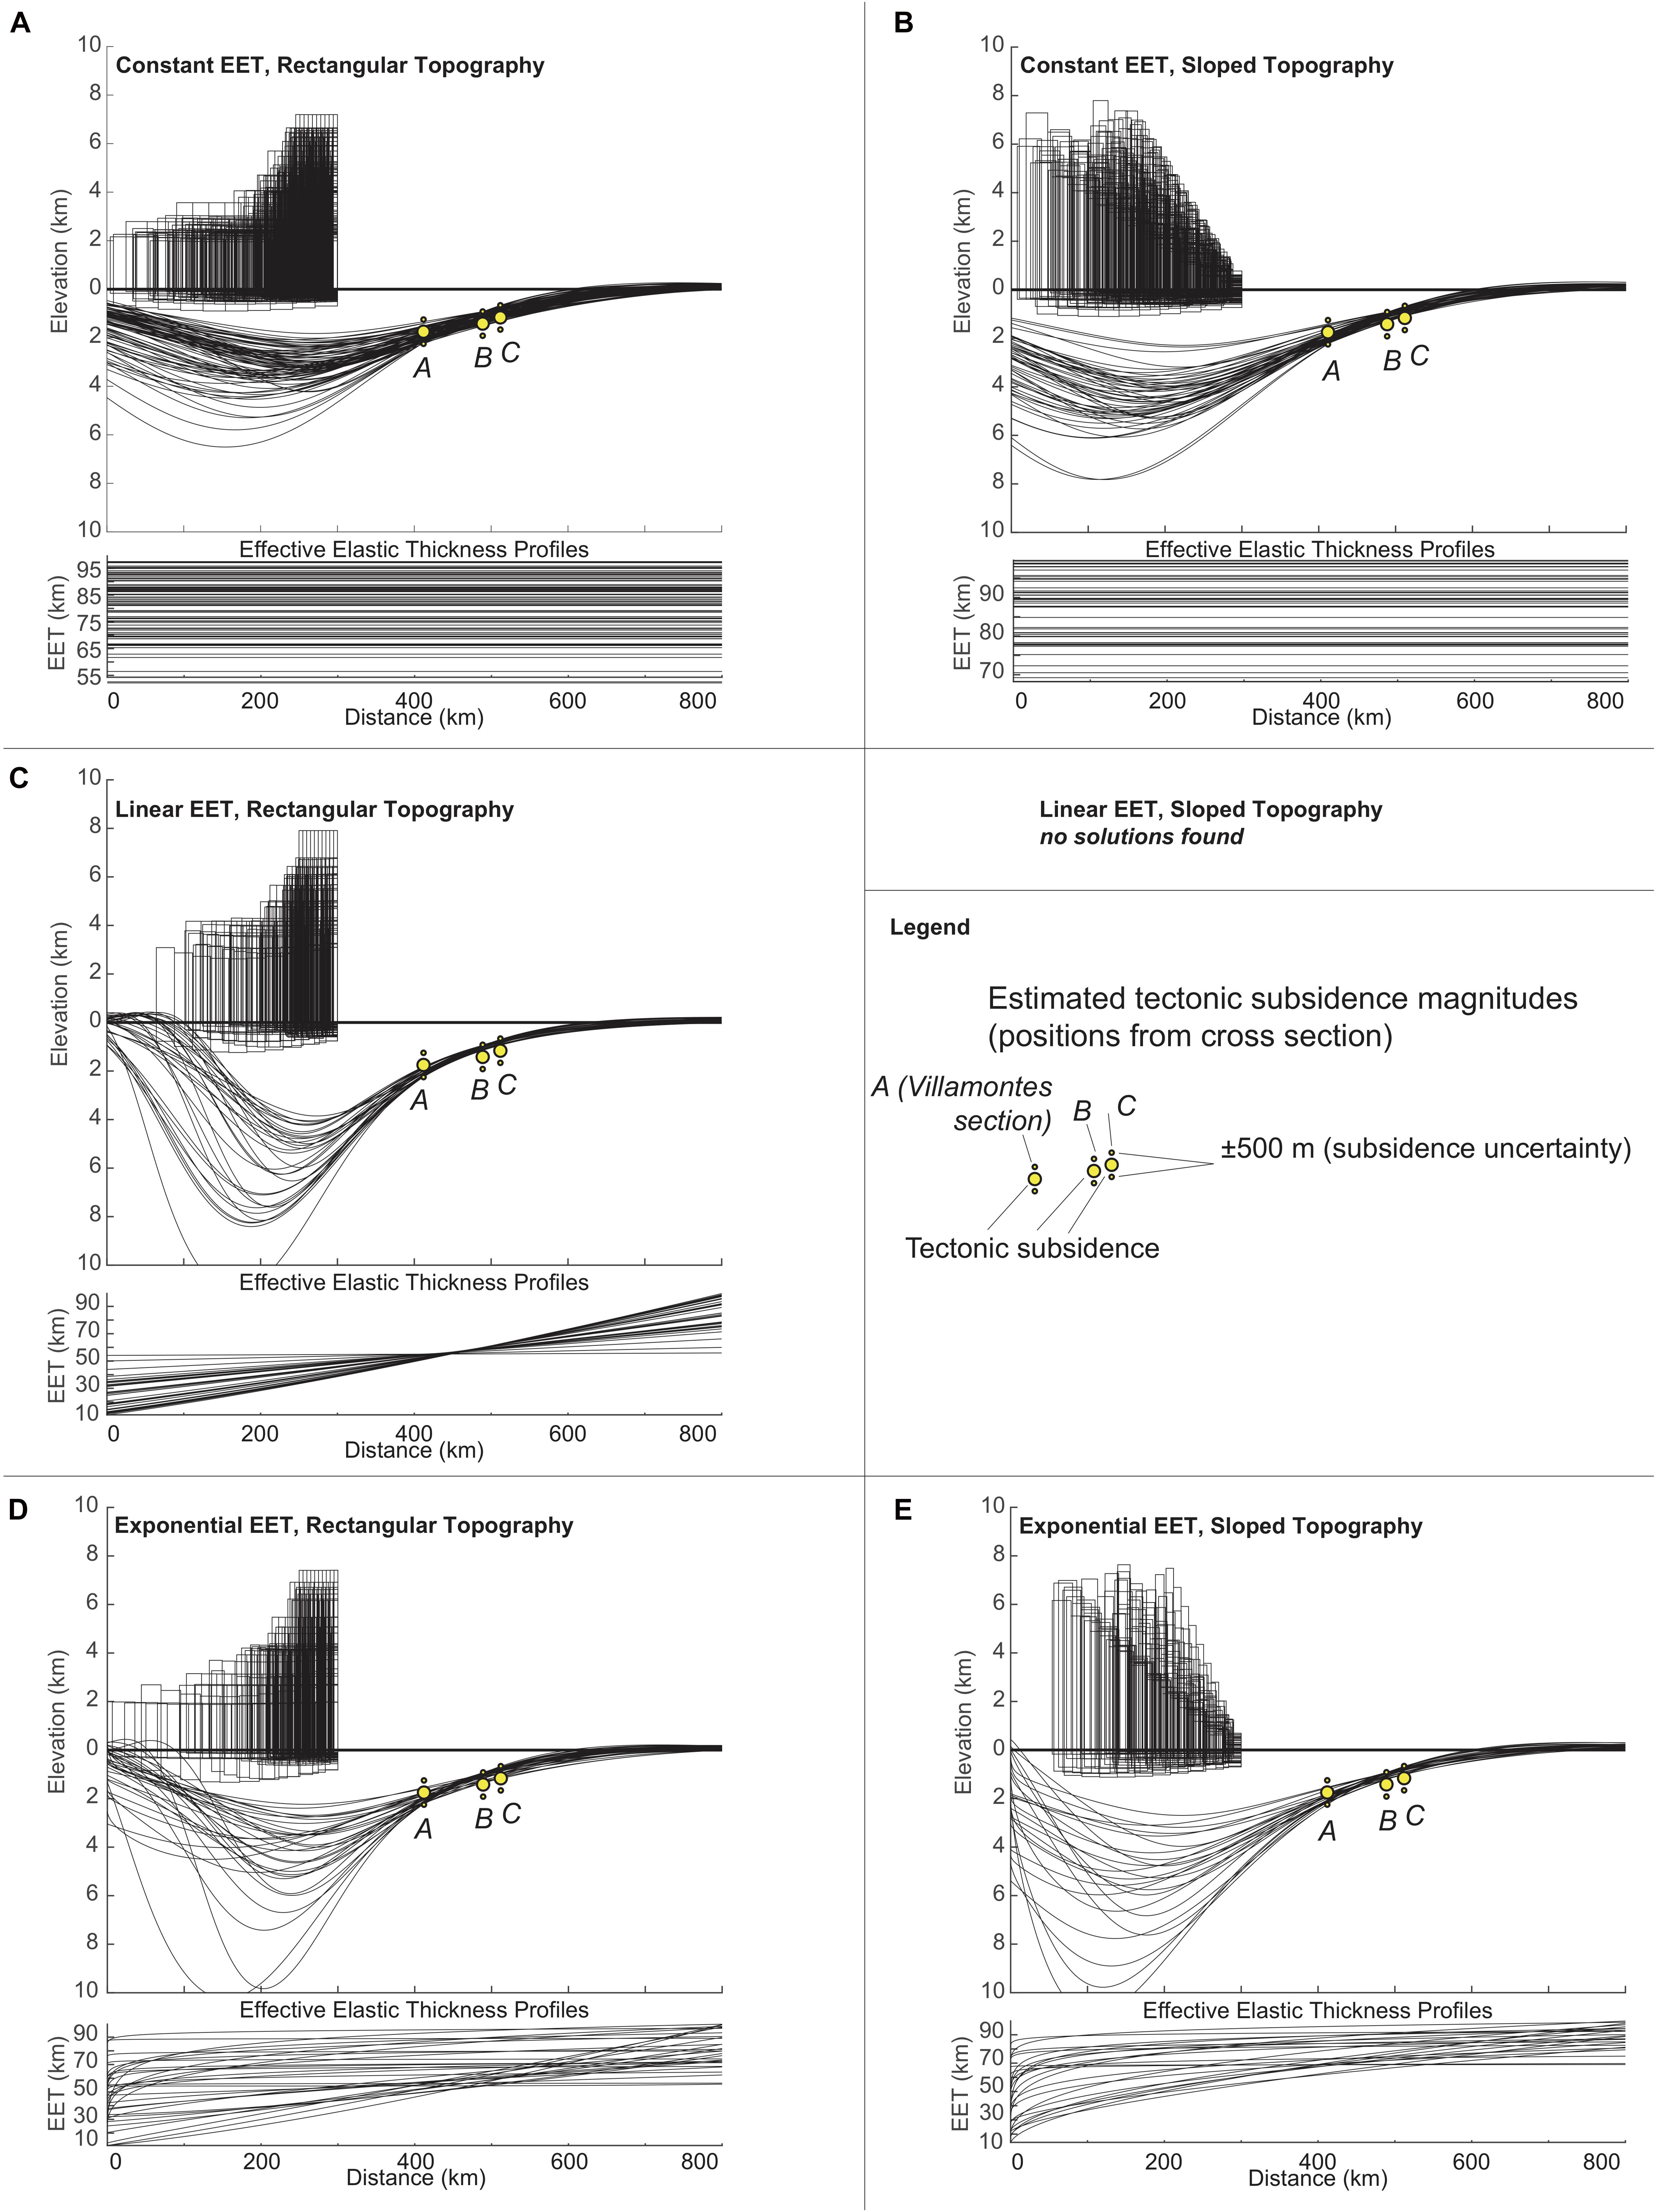
Figure 4. Results from flexural modeling. Parts (A,B) show results from linear effective elastic thickness, (C) shows linearly changing effective elastic thickness, and parts (D,E) show exponentially changing effective elastic thickness. Panels on the left have rectangular topographic loads prescribed, while panels on the right have loads that slope toward the foreland. The positions of the sections at Villamontes, B, and C are situated at the same distance measured from the thrust front at 8 Ma in Figure 3.
Results
Magnetostratigraphy
Measured tilt-corrected declinations were used to determine magnetic polarity for 207 sites for all A specimens and sites 1–136 for all B specimens within the 1,370 m stratigraphic section (Figure 2). Using the magnetic polarity determined here and available geochronologic results from dated tuffs, two slightly different correlations 1 and 2 are presented. We define 30 polarity zones (15 normal, 15 reverse) in correlation 1, and 22 polarity zones (11 normal, 11 reverse) in correlation 2. These two correlations are consistent with independent U-Pb geochronologic results. Differences between correlations 1 and 2 come from the decision to include or exclude those polarity zones that are defined by a single site. In instances where a polarity zone is defined by a single site, this could be considered provisional until further tested. The two correlations are plotted to determine the sediment accumulation curve. Average sediment accumulation rates for intervals between inflection points in the curve are shown (Figure 2). For correlation 2, we explored the impact of selecting different inflection points (for example, between 800-1000 m) on average sediment accumulation rates. Despite this range of possible correlations and rates, there is general consistency among the different interpretations. The lowest interval (0–77 m) from both correlations shows an average accumulation rate of ca. 49 to ca. 77 m/Myr. The following interval, up to ca. 330 m, has an average accumulation rate of ca. 114 to ca. 140 m/Myr. The covered interval occupies the ca. 350–560 m level of stratigraphic section and prevents detailed magnetostratigraphic analysis of this part of the succession. Above the covered interval, the average accumulation rate ca. 314, ca. 677, and ca. 459 m/Myr for correlations 1, 2.1, and 2.2, respectively. This represents a 2 × (correlation 1) to 4.8 × (correlation 2.1) increase in sedimentation rate. Correlation 2.1 shows an average accumulation rate of ca. 677 m/Myr at ca. 8–7 Ma, consistent with the 628 m/Myr rate reported by Uba et al. (2007) for strata of the same age. The uppermost section, encompassing the 1,250–1,370 m interval, has an average accumulation rate of ca. 147 to ca. 233 m/Myr, which represents a slight reduction but is still higher than the rates for the lower interval. Overall, the sediment accumulation curve defined by new magnetostratigraphic data agrees with existing chronostratigraphic results from Uba et al. (2007), and provides higher resolution control on intervals between horizons with dated volcanic tuffs.
Backstripping
The magnetostratigraphic results define a series of magnetic chrons for the Villamontes section. The ages for the base and top of each chron, and associated stratigraphic level, were used for backstripping. The backstripping results show that the lithology chosen (sandstone or shale) predicts subtle differences in the decompacted sediment accumulation curves (Figure 5). However, the difference in total tectonic subsidence between the two is minimal: 1,741 m (sandstone), and 1,759 m (shale). For the purposes of flexural modeling, a value of 1,750 m was used for the tectonic subsidence at the Villamontes succession. At the Emborozú section, results show sediment accumulation between 10.5 and 8.3 Ma only in the Tariquia and Emborozú Formations. The accumulation rate is similar to that observed in Pliocene–Pleistocene strata at the Villamontes section.
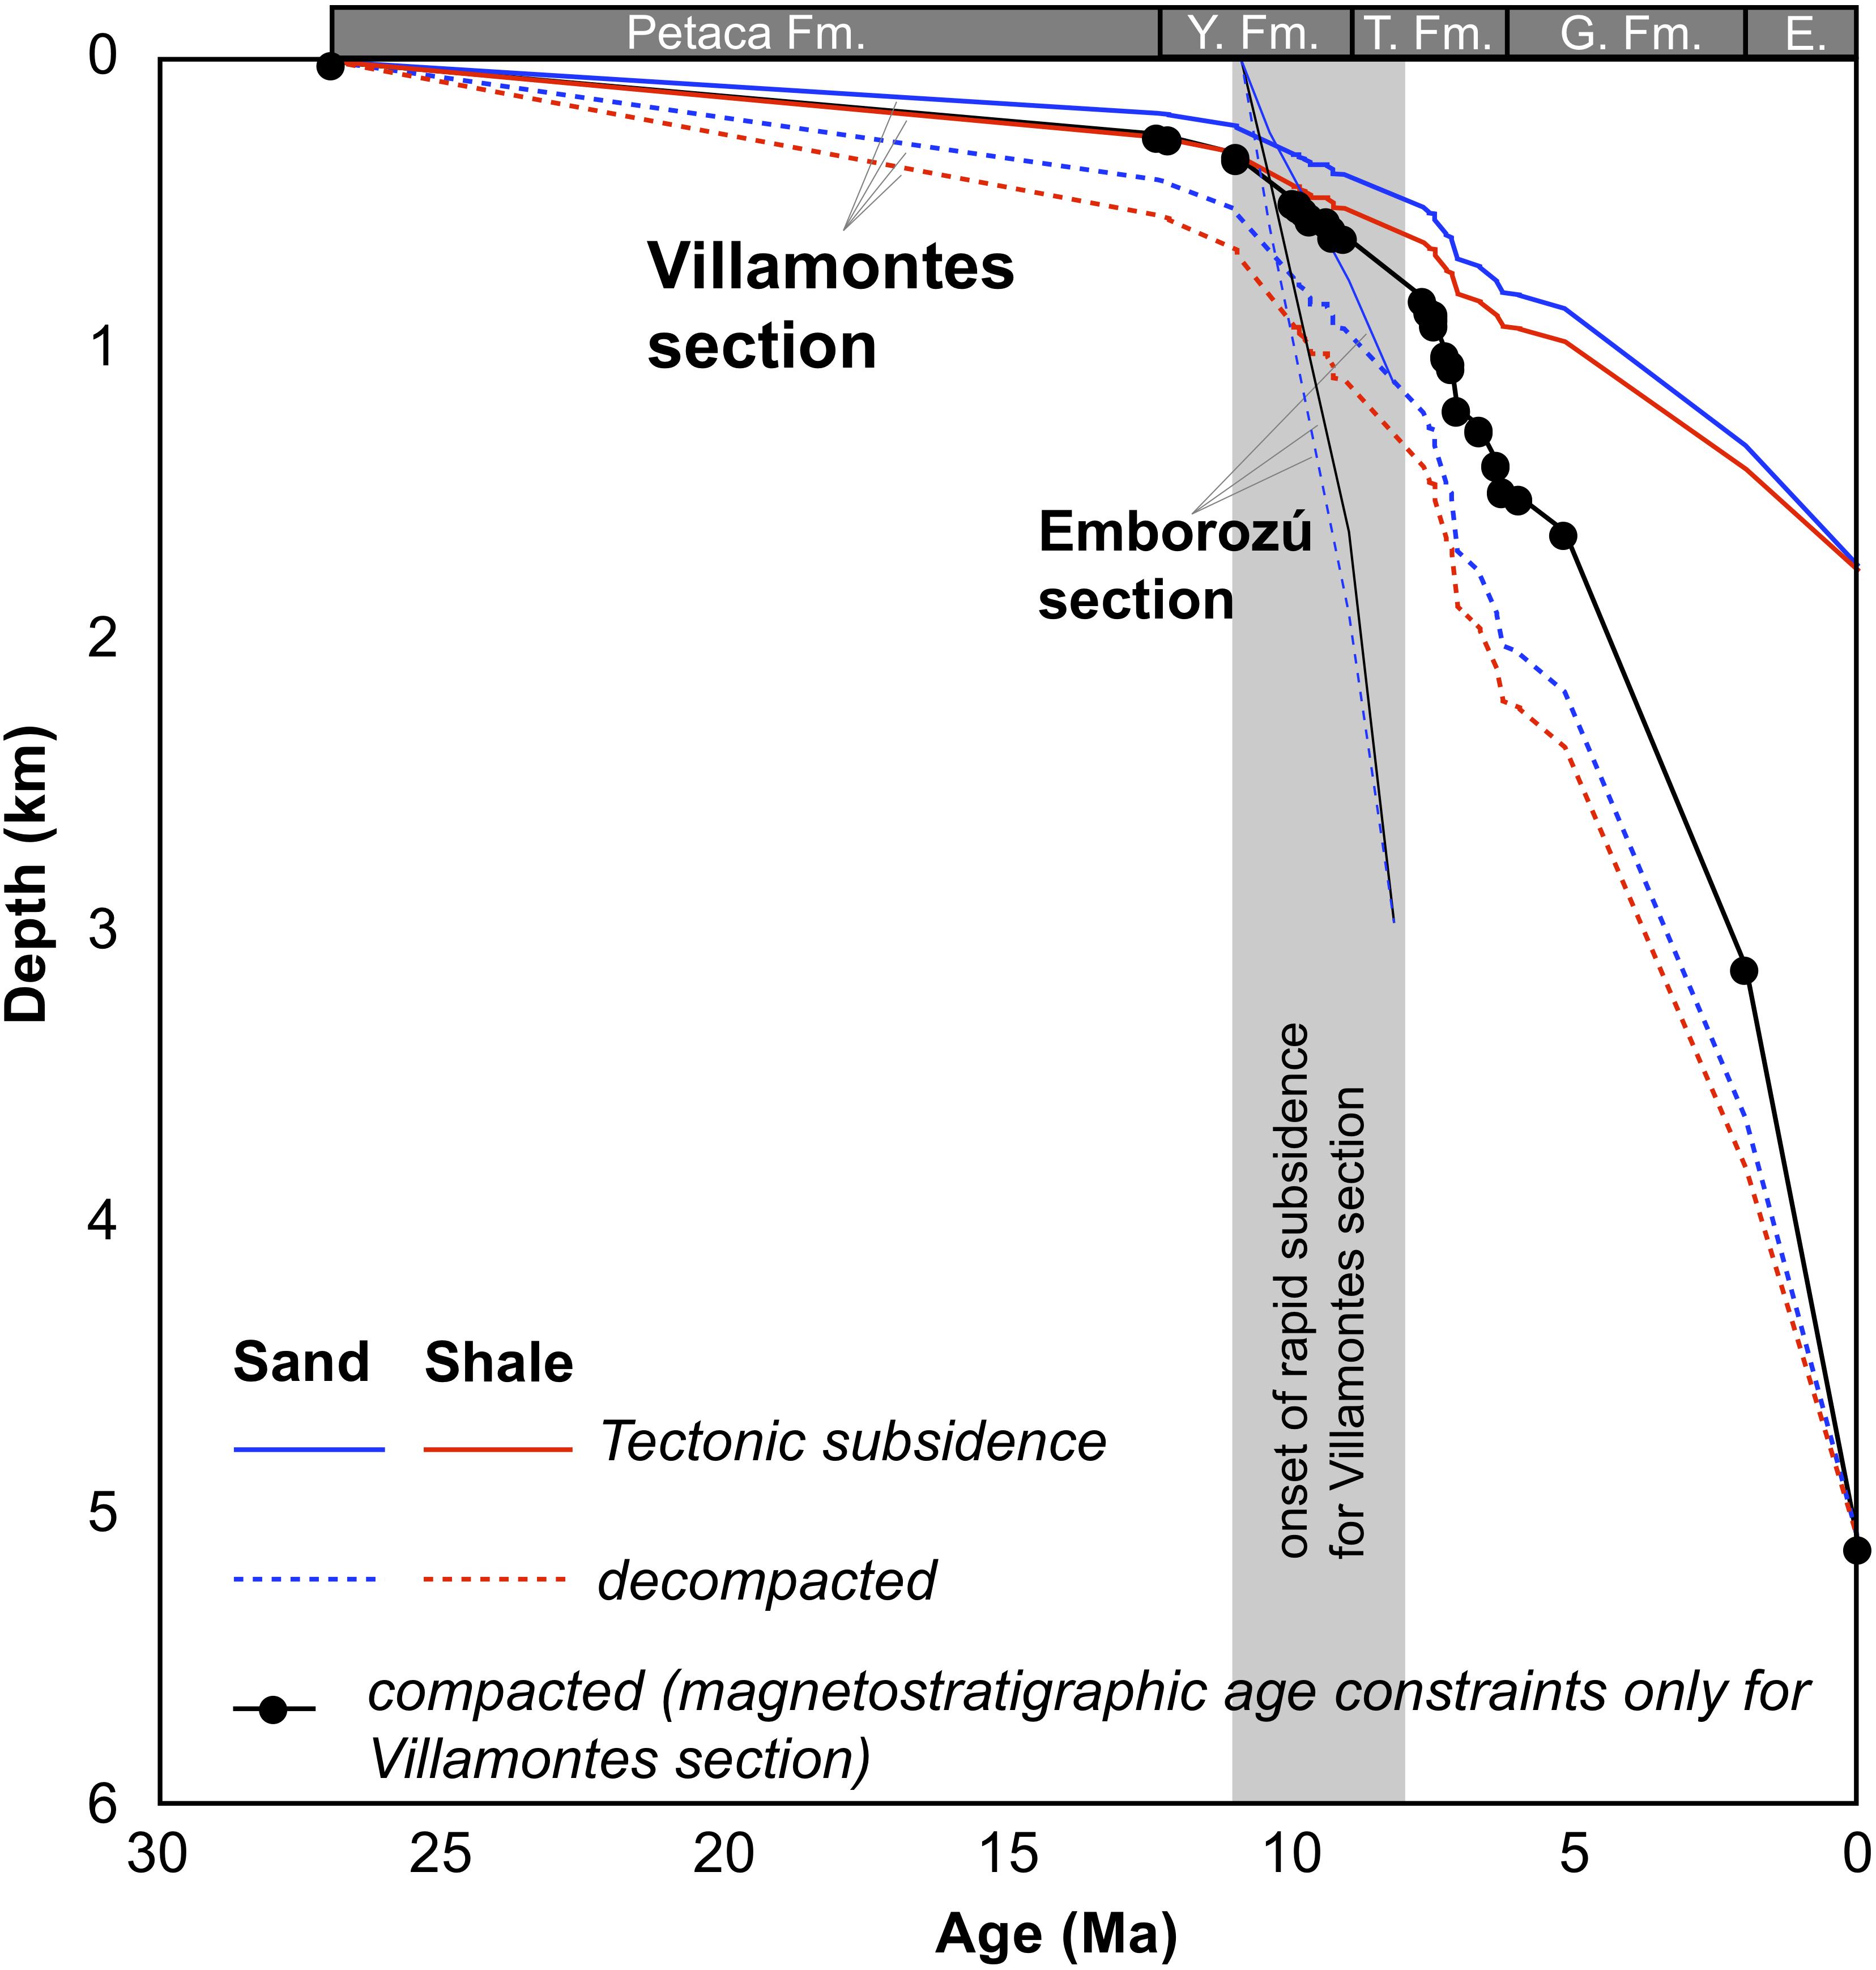
Figure 5. Backstripping results for the Villamontes and Emborozú sections. Villamontes succession combines magnetostratigraphic results for 1,370 m of section spanning ca. 12–5 Ma depositional age, dominantly the Yecua (Y. Fm.) and Tariquia Formations (T. Fm.), and adds the general age and maximum thickness estimates for the underlying Petaca Formation, and overlying Guandacay (G. Fm.) and Emborozú Formations (E.) (from Uba et al., 2007). The Emborozú site has limited chronostratigraphic constraints, and no attempt was made to include the under- or overlying strata. At the Villamontes site, the impact of pure sandstone and pure shale lithologies on backstripping results was assessed, with minor differences in total tectonic subsidence between the lithologies, and recognizing that the Villamontes section is not a single lithology. For the Emborozú site, only sandstone lithology was used. Note that rapid sediment accumulation was ongoing at ca. 11 Ma, and similar rates of sediment accumulation are not observed at the Villamontes succession until ca. 8 Ma and later.
These results confirm the overall convex-upward sediment accumulation curve at the Villamontes section (Uba et al., 2007), consistent with flexural foreland basin deposition. At the incomplete Emborzú section, only a record of rapid sediment accumulation is preserved. At the Villamontes section, there is an inflection in the sediment accumulation curve at ca. 11–8 Ma, marking the transition to more rapid sediment accumulation in the foredeep depozone.
Eroded Volume
Eroded volumes (Figure 6) were calculated for the study area using the geologic map of Anderson et al. (2018). No attempt was made to determine whether the calculated volumes are appropriate for other segments of the Andes along strike to the north or south. No attempt was made to account for changes in volume and density associated with breakdown of solid rock into detritus, or the impact of compaction on volumetric changes after deposition. A comparison of density differences between sedimentary basin fill (2,500–2,600 kg/m3) and potential Eastern Cordillera parent rocks such as slate (ca. 2,691 kg/m3) and granite (ca. 2,750 kg/m3) suggests that volume and density changes during weathering and erosion could have minor effects on volumetric comparisons between rock eroded from the fold-thrust belt and sediment deposited in the Subandean Zone.
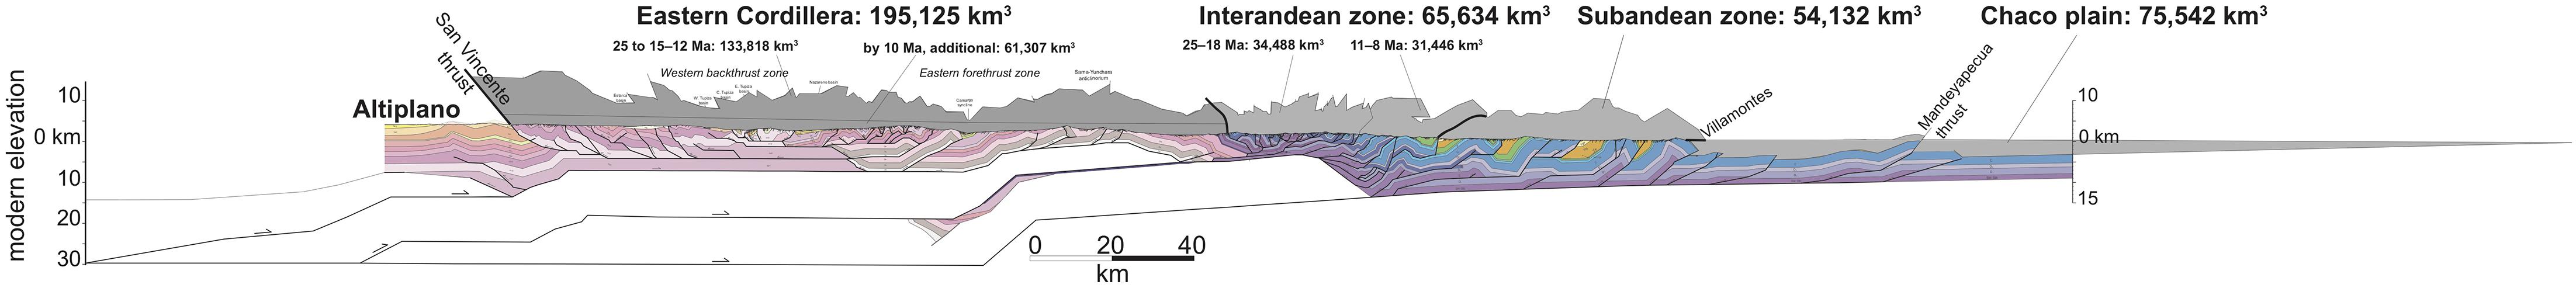
Figure 6. Gray polygons showing the areas that represent eroded material from different portions of the cross section. The areas were multiplied by the north–south extent of the map in Figure 1 to determine the eroded sediment volumes shown in this figure. Note that the Eastern Cordillera shows estimates for two distinct time intervals, and the Interandean Zone differentiates material eroded from the western and eastern segments. The basal dip of the foreland was continued eastward to determine the approximate position of the pinchout of the foredeep.
In Eastern Cordillera, Interandean Zone, and Chaco Foreland
Using the eroded area from the balanced cross-section of Anderson et al. (2017) and the distribution of ages from various thermochronologic datasets used to infer timing of erosional exhumation (Ege et al., 2007; Anderson et al., 2018), the volume of material eroded from the Eastern Cordillera can be calculated for two time intervals. Across the Eastern Cordillera, rapid cooling was well underway by ca. 25 Ma and all apatite (U-Th)/He results show cooling below closure temperature by 15–12 Ma (Ege et al., 2007; Anderson et al., 2018). However, final exhumation of these samples may not have occurred until ca. 10 Ma development of the San Juan del Oro surface. Based on reasonable estimates of the paleogeothermal gradient in the region (e.g., Ege et al., 2007; Anderson et al., 2018), samples could have been at depths of up to ca. 2.5 km at 12 Ma, and subsequently brought to the surface by 10 Ma. Thus, between ca. 25 and 15–12 Ma, 133,818 km3 was exhumed and removed from the Eastern Cordillera (Figure 6). By 10 Ma, an additional 61,307 km3 had been eroded, totaling 195,125 km3 of material removed from the Eastern Cordillera.
In the Interandean Zone, Triassic and younger rocks are no longer preserved (Kley et al., 1996; Anderson et al., 2017). However, reset apatite fission track (U-Th)/He ages for Permian and older rocks require burial heating by a >4 km thick section of Mesozoic–Cenozoic rocks by late Oligocene–early Miocene time (Ege et al., 2007; Anderson et al., 2018). The eroded volumes from the western and eastern portions were calculated separately because they have distinct cooling ages determined from thermochronological data. In the western Interandean Zone, 34,488 km3 material was removed between 25 and 18 Ma. In the eastern Interandean Zone, 31,446 km3 was removed between 11 and 8 Ma.
In the Subandean Zone, remnants of the Cenozoic basin are preserved in the synclinal valleys between eroded anticlinal ranges. Erosion of the frontal fold-thrust belt contributed 54,132 km3 material. To the east, the Chaco foreland has primarily been a region of sediment accumulation, with very little shortening and exhumation. Calculations show a minimum volume of ca. 75,542 km3 of preserved Cenozoic basin fill. This volume occupies the foreland basin between the Andean deformation front (near Villamontes) to the distal pinchout of the foreland basin projected ca. 190 km to the east (Figure 6).
From Beneath the San Juan del Oro Surface
After the preserved remnants of the San Juan del Oro surface were mapped (Figure 7A) and interpolated to approximate the original geometry of the surface (Figure 7B), differencing the interpolated surface and the MERIT DEM yielded a ca. 96.5 km3 volume of material eroded from beneath the San Juan del Oro surface (Figure 7C). The mapping of the San Juan del Oro surface is consistent with previous workers (Kennan et al., 1997; Anderson et al., 2018). These results show that the remnants of the surface today are not consistent with a horizontal or flat surface, but instead, an undulatory surface with a component of northward plunge. Whether this irregular surface represents the original geometry, or reflects subtle folding and deformation after the surface formed, remains unclear. Regardless, material removed from river valleys and gorges incised into the San Juan del Oro surface (Figure 7C, black polygons) provides a minimum estimate of material supplied to the foreland since final construction of the surface.
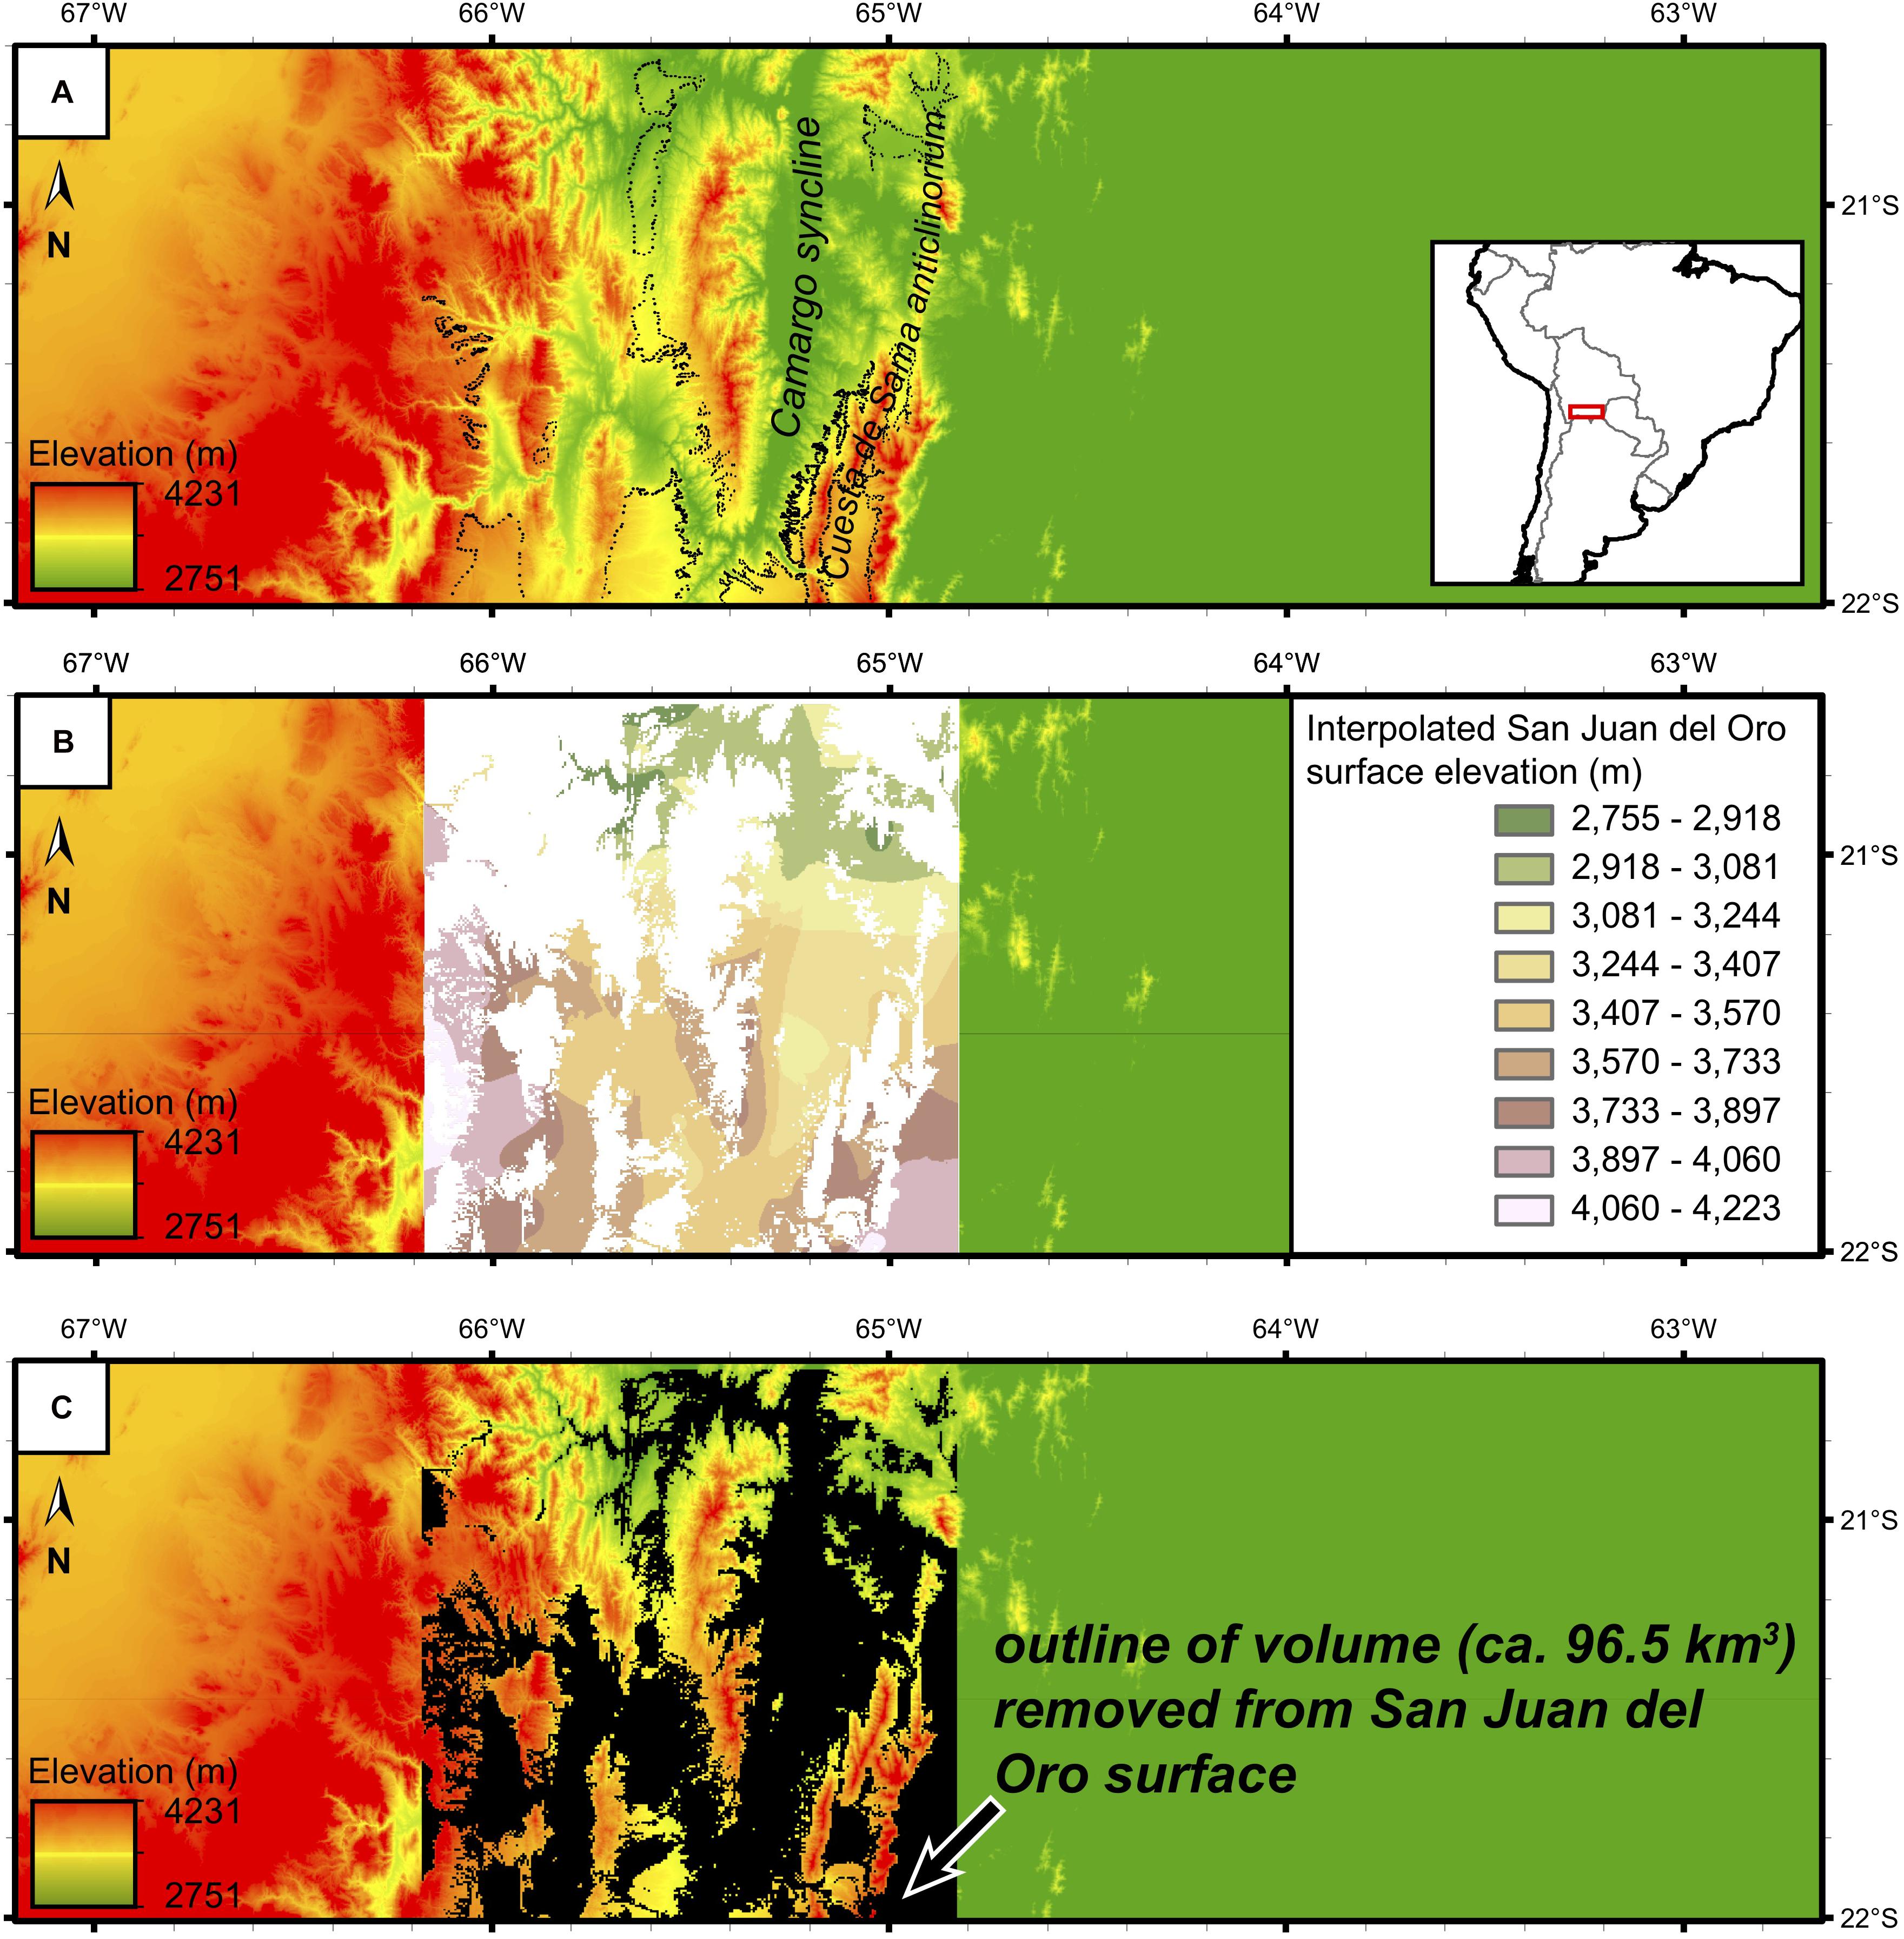
Figure 7. (A) Digital elevation model of the study area showing the control points (black outlined dots) mapped to the boundaries of the high-elevation San Juan del Oro surface. (B) Results from kriging interpolation of the San Juan del Oro control points showing the approximate elevation of the surface prior to erosion. White polygons show regions of positive bedrock relief above the interpolated San Juan del Oro surface. (C) Black polygons show the outline of locations where the DEM is lower than the interpolated San Juan del Oro surface. The volume between the two surfaces (the DEM from A and the kriged surface from B) is ca. 96.5 km3.
Flexural Modeling
Five of six scenarios yielded viable flexural models (Figure 4). Only the scenario with linearly changing EET and foreland-sloping topography did not yield any model results. In scenarios with constant EET (Figures 4A,B), modeled EET varied between 55 and 95 km. In the linearly changing case (Figure 4C), the left (west) side of the model had EET between ca. 10–50 km, and these increase to ca. 50–95 km on the right (east) side of the model. In the cases of exponentially changing EET (Figures 4D,E), the left (west) side of the model predicts a range of 5–90 km, and ca. 50–90 km on the right (west) side of the model.
Discussion
Foreland Basin Subsidence
Results from magnetostratigraphic and backstripping analyses confirm that the Chaco foreland basin experienced an increase in sediment accumulation rate between ca. 11 and 8 Ma, recording ca. 1,750 m of tectonic subsidence. The parameters tested with the flexural models were assigned a large range of potential values in order to minimize bias in possible solutions. The purpose of these models was not to predict the exact values of specific parameters governing the evolution of the Chaco foreland basin, but to explore the range of conditions that could have generated the observed sediment accumulation patterns. The models are simplified (Figure 4), as they simulate emplacement of a load instantaneously, whereas the Eastern Cordillera and Interandean Zone developed over 10s of Myr, and have been translated hundreds of kilometers eastward during protracted shortening and underthrusting of the Brazilian craton. These results show that a range of load configurations could generate basin profiles outlined by backstripping and tectonic subsidence analyses. Likewise, the results show that a broad range of lithospheric conditions could have produced the observed magnitudes of tectonic subsidence (Figures 2, 5). The broad range of viable solutions gives support to previous interpretations of the Chaco foreland as a flexural foreland basin (e.g., Horton and DeCelles, 1997).
Given the dimensions of the Eastern Cordillera, some flexural model solutions are geologically unreasonable. For example, Figure 4A shows that one modeled solution (the narrowest, highest rectangular loads that could generate viable flexural profile) is unrealistically high (>7 km) and narrow (<100 km), because it is inconsistent with dimensions of the Eastern Cordillera.
It remains challenging to reconstruct ancient lateral changes in effective elastic thickness. However, these results highlight that left to right (west to east) increases in EET provide viable model solutions, consistent with the west to east increase in EET predicted across the western margin of South America (Tassara et al., 2007), and predicted for other segments of the Andes (Fosdick et al., 2014), although the majority of EET values predicted here are greater than those predicted by Tassara et al. (2007). The results from linear and exponential changes EET could be further explored to refine the paired shortening and subsidence histories of the Bolivian Andes. Regardless of remaining challenges with modeling and reconstructions, these results demonstrate that the tectonic subsidence observed in the southern Bolivian Chaco foreland are consistent with flexural subsidence predicted from a range of plausible Eastern Cordillera and Interandean Zone topographic loads.
The calculations of eroded volumes (Figure 7) in the study area support a genetic link between topographic loading and flexural subsidence. The amount of material removed from the Eastern Cordillera is 195,125 km3, which occurred before development of the high-elevation San Juan del Oro geomorphic surface. The sum of material eroded from the Interandean Zone and Subandean Zone is 119,766 km3. The volume of material removed from beneath the San Juan del Oro surface is 96.5 km3. The Chaco foreland contains at least 75,542 km3. These results are consistent with sediment provenance analyses showing that the fold-thrust belt was the primary source of sediment (Calle et al., 2018), and was capable of supplying all of the sediment in the Chaco foreland basin, even if the precise balance of material supplied westward to the Altiplano remains unconstrained. Barnes and Heins (2009) investigated a broader region spanning the Plio-Quaternary to recent, and demonstrated that incision into the San Juan del Oro surface provided 40–60% of Chaco foreland basin fill since ca. 2.1 Ma. These results show that there was ample additional sediment available from erosion of the fold-thrust belt to fill the Chaco basin since the middle Miocene.
Reconciling Foreland Basin and Fold-Thrust Belt Timing
Despite agreement between observed magnitudes of tectonic subsidence in the Chaco foreland (Figures 2, 5) and basin subsidence profiles predicted from various flexural models (Figure 4), and new recognition of ample detritus supplied from the thrust belt to the foreland basin (Figures 6, 7), there is an apparent discrepancy between the timing of exhumation in the fold-thrust belt beginning in the Eocene and the onset of rapid subsidence in the Subandean foreland basin in the Miocene (Figure 8). The incomplete Emborozú section shows rapid sediment accumulation was ongoing at 11 Ma (Calle et al., 2018), whereas the Villamontes section, situated eastward of the Emborozú section, experienced the shift to rapid sediment accumulation by ca. 8 Ma (Uba et al., 2007; this study) (Figure 2). This is consistent with eastward migration of a flexural foreland basin in front of an advancing fold-thrust belt.
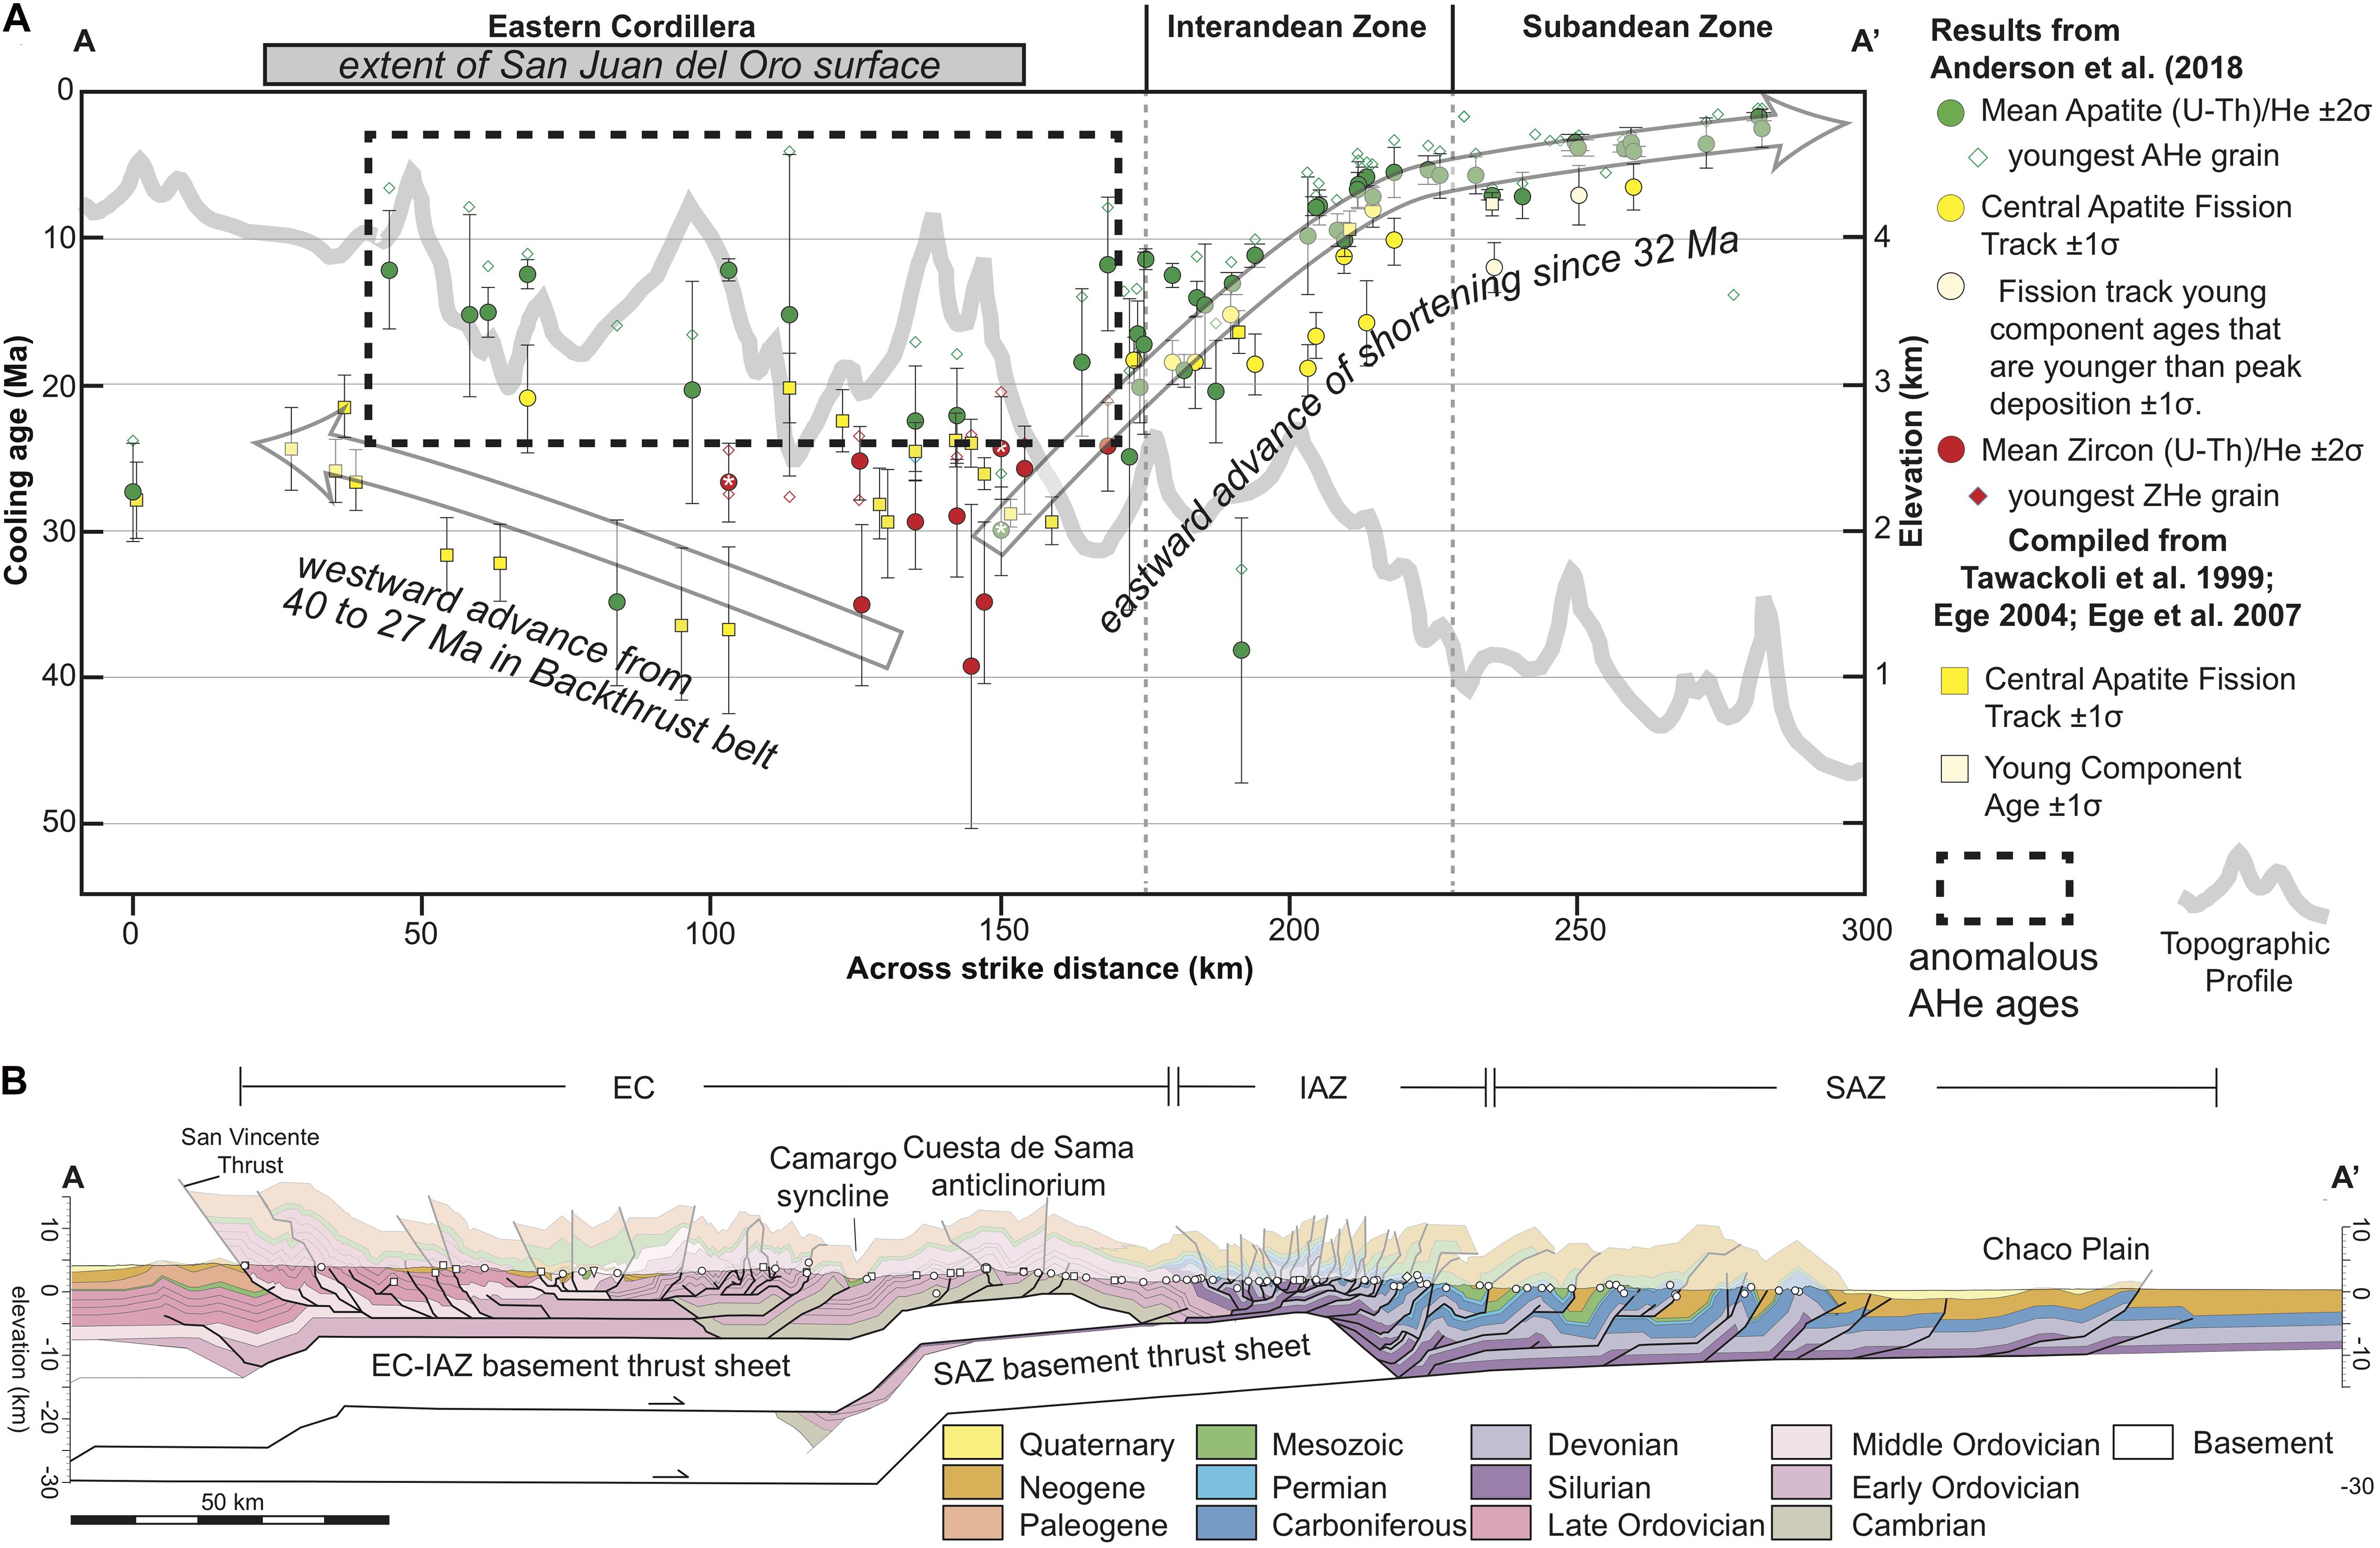
Figure 8. (A) Synthesis of thermochronologic data from Anderson et al. (2018) emphasizing westward- and eastward-advancing contraction in the backthrust and forethrust portions of the Eastern Cordillera and Interandean/Subandean Zones, respectively. Dashed box highlights anomalous apatite (U-Th)/He results with varied ages and uncertainties. These data correspond to the region where the San Juan del Oro surface is developed, shown by the gray bar. (B) Balanced cross-section from Anderson et al. (2018) showing the location of tectonomorphic regions and thermochronology samples.
We reassessed the thermochronologic results of Anderson et al. (2018) to compare exhumation in the fold-thrust belt with the known timing of rapid foreland basin sedimentation in the Chaco foreland. Broad trends in the thermochronologic data are consistent with the interpretations from Anderson et al. (2018) (Figure 8): after initial shortening along the axis of the Eastern Cordillera at ca. 40–35 Ma, which was focused just west of the Camargo syncline (Figures 1, 8), shortening propagated both westward and eastward. Westward (trenchward) verging contraction was accommodated by the Central Andean Backthrust Belt, which advanced to the Altiplano margin by ca. 27 Ma (San Vicente Thrust). Eastward (foreland) verging contraction advanced generally through the Cuesta de Sama anticlinorium, which may have been rapidly exhuming by 30–32 Ma, into the Interandean Zone by ca. 25–20 Ma, and into the Subandean Zone after 10 Ma. In this scenario, the limited chronostratigraphic results for foreland basin fill of the Camargo syncline region fall within the accepted range of possible depositional ages (between 55 and 25 Ma; DeCelles and Horton, 2003; Horton, 2005). Specifically, deposition near the Camargo syncline overlapped with early Eastern Cordillera shortening at ca. 40 Ma, and ceased by ca. 30 Ma when the Cuesta de Sama anticlinorium began to be uplifted east of the Camargo syncline depocenter. Deposition of the 2–3 km Camargo syncline succession over this time frame is consistent with the rapid accumulation rates observed in other proximal foreland basins.
In this reassessment of thermochronologic results, we highlight the assortment of apatite (U-Th)/He ages in the Eastern Cordillera. While higher temperature thermochronometers support westward advance of the backthrust belt, apatite (U-Th)/He ages from this same area have a range of reproducibility. Some samples show age uncertainties >15 Myr, while others show low uncertainties comparable to apatite (U-Th)/He results from the Interandean and Subandean Zones. This region of the Eastern Cordillera with higher age uncertainties is also where the San Juan del Oro surface developed. The contrast in style and magnitude of apatite (U-Th)/He thermochronologic cooling signals between the Eastern Cordillera and Interandean/Subandean Zones reflects a dichotomy of processes active during the Miocene across the fold-thrust belt. In the Eastern Cordillera, the varied reproducibility among apatite (U-Th)/He samples occurs irrespective of mapped structures or proposed basement structural geometries. We suggest that the character of the apatite (U-Th)/He results in the Eastern Cordillera is more consistent with sedimentary processes, such as the infilling of intermontane basins and formation of geomorphic surfaces. Final construction of the San Juan del Oro surface was complete by ca. 10 Ma, but it may have begun developing earlier, after ca. 25 Ma cessation of most upper-crustal shortening in the Eastern Cordillera. Although the precise formation mechanisms of such high-elevation low-relief hinterland surfaces remain unclear (e.g., Fox et al., 2020) we envision a combination of erosional beveling, surface leveling, local deposition, relief reduction, and overall topographic homogenization. The combination of such processes would result in irregular cooling patterns expressed by thermochronologic datasets, attributable to alternating periods of localized erosion and deposition as topography was smoothed. Additionally, the structural restoration predicts lateral translation of this region over a long basement flat (Anderson et al., 2017), arguing against a clear structural control on cooling ages. The combination of a range of possible mechanisms associated with formation of the San Juan del Oro surface, and structural restorations, are consistent with the apatite (U-Th)/He results from the region. Thermokinematic modeling in central and northern Bolivia illustrate rapid cooling is focused above basement ramps, whereas cooling ages above basement flats are more variable because material is passively transported and exhumation rates are much lower (e.g., Rak et al., 2017; Buford Parks and McQuarrie, 2019).
In contrast with the Eastern Cordillera and San Juan del Oro region, apatite (U-Th)/He (and other thermochronometric) results from the Interandean and Subandean Zones display lower uncertainty and a clear eastward younging age signatures. This is consistent with eastward advance of Neogene shortening while the Eastern Cordillera was experiencing minimal upper-crustal shortening, developing the San Juan del Oro surface, and being transported along basement flats. The apatite (U-Th)/He results from the Eastern Cordillera suggest partial resetting during shallow burial but preclude the deep burial that might be expected from the volume of material known to have been removed from the Eastern Cordillera since 25 Ma. We are left with a question – where was the sediment eroded from the Eastern Cordillera and Interandean Zone being stored, if it was not sequestered in the Eastern Cordillera or deposited in the Subandean Zone before 11 Ma?
Addressing this question also requires satisfying other observations: (1) bivergent (westward and eastward) shortening in the Eastern Cordillera/Interandean zone fold-thrust belt that spanned ca. 40 and 10 Ma; (2) a contrast in apatite (U-Th)/He results from the Eastern Cordillera and Interandean/Subandean Zones suggestive of different processes acting in these regions to yield contrasting cooling ages; (3) combined investigations of eroded volumes, flexural modeling, magnetostratigraphic results, and backstripping that confirm that the fold-thrust belt provided sufficient sediment and topographic loading to explain observed Subandean basin volumes, despite (4) a temporal lag between the main phase of Eastern Cordillera/Interandean Zone shortening and subsidence in the adjacent foreland.
The following scenario is proposed. During initial shortening in the Eastern Cordillera, and until contraction reached the Cuesta de Sama anticlinorium by 32–30 Ma, structural restorations predict a >291 km distance between the deformation front and the Villamontes section. The Eocene foreland basin that developed in the Eastern Cordillera and Interandean Zone (best preserved in the Camargo syncline; DeCelles and Horton, 2003) likely received a significant volume of the material eroded from the axial and western segments of the Eastern Cordillera. During this time, these segments of the Eastern Cordillera were eroded to Paleozoic levels, such that subsequent Cenozoic intermontane basin fill was deposited on Ordovician strata in angular unconformity (Horton, 1998, 2005), and flanked by development of the San Juan del Oro surface between ca. 25 and 10 Ma. While the initial foreland basin was accumulating sediment, the future Subandean zone was not. The Subandes may not have received sediment at this time even in the backbulge depozone if the flexural wave was damped out (DeCelles and Horton, 2003). Passage of the forebulge depozone, recorded as paleosols in the Oligocene to middle Miocene Petaca formation, suggest that the Subandes were not in the foredeep depozone in the Eocene. To constrain the basin width and lithospheric parameters, we assume that the distance to the Villamontes section, 291 km, represents the maximum foredeep width. Assuming Young’s modulus of 70 GPa, Poisson’s ratio of 0.25, mantle and crust density of 3,300 and 2,600 kg/m3, respectively, an effective elastic thickness >40 km would have been required to generate a foredeep depozone ca. 291 km wide. Tassara et al. (2007) report the effective elastic thickness of the modern lithosphere under the Andean orogen to be generally less than 15 km. This suggests that the effective elastic thickness of the lithosphere during initial shortening would have been between 40 and 15 km. Even as shortening advanced eastward, the Villamontes locality remained far to the east, beyond the flexural wavelength of the foredeep depozone basin, until the late Miocene. The Villamontes succession would have entered the rapidly subsiding foredeep depozone only after significant advance of the fold-thrust belt and underthrusting of the Brazilian Craton, which would have decreased the distance between the Eastern Cordillera topographic load and the Subandean zone, and increased the effective elastic strength of the lithosphere, making the depozone wider. Between 40 and 10 Ma, material eroded from the fold-thrust belt was continuously recycled in the advancing foreland basin, as demonstrated by sediment provenance results (Calle et al., 2018). Since 10 Ma, additional erosion of the Subandean Zone, and incision into the San Juan del Oro surface further supplemented sediment delivery to the basin. A migrating foreland basin system is consistent with past interpretations of an advancing flexural load and progradational depositional systems (e.g., Uba et al., 2006). This work is consistent with previous findings (DeCelles and Horton, 2003; Uba et al., 2006), and reconciles apparent temporal inconsistencies among the timing and position of shortening, eroded sediment volume and sediment accumulation timing, and geomorphic observations.
In addition to the clear tectonic mechanisms the controlled foreland basin evolution in the central Andes, Miocene climate shifts must also be considered. Various changes in depositional setting and style at ca. 8 Ma, including a switch from braided streams to a progradational fluvial megafan setting in the Villamontes section, led Uba et al. (2005) to postulate that climate change played a dominant role in modifying foreland sedimentation rates. Strecker et al. (2007) stated that the South American monsoon began between 12 and 8 Ma, and that the central Andean region changed from a semi-arid or arid system to a humid environment by middle to late Miocene time. The links among shortening, erosion, and foreland basin sedimentation discussed in this manuscript provide a mechanism to explain the shifts in sedimentation rate apart from climate. A foreland-younging pattern of rapid sediment accumulation is revealed by comparison of separate localities (the Camargo syncline, Emborozú, and Villamontes sections). This time-transgressive history is consistent with a continuous eastward advance of the fold-thrust belt, and inconsistent with a single shift in sediment accumulation rate by a climate-driven process. We envision that Miocene climate shifts modified sediment erosion, transport, and depositional processes that further amplified tectonic processes. These include protracted fold-thrust belt advance toward the foreland, exhumation and sediment recycling, and flexural subsidence, which acted on development of the Chaco foreland basin. The results presented here bolster the recognition that interactions between climate, tectonic, and surface processes on orogen development are key, despite persistent challenges disentangling their precise contributions.
Conclusion
This study investigated the linkages among shortening, erosion, sediment transport, and foreland basin subsidence in the southern Bolivian Andes. Numerous datasets were brought to bear on the problem: structural geometries and exhumation timing provided by thermochronologic datasets spanning the Altiplano to Subandean Zone; new magnetostratigraphic results from a Subandean section at the Villamontes succession to generate a detailed chronostratigraphic framework; backstripping of the Villamontes and Emborozú sections to determine the magnitude of tectonic subsidence and quantify rates of sediment accumulation; flexural modeling to investigate the load dimensions and lithospheric parameters that accommodated observed foreland basin geometries; and eroded volume calculations to determine the magnitude of material removed from different sections of the Andean fold-thrust belt, and the minimum volume of sediment stored in the modern Chaco foreland.
This work shows that the magnitude of foreland basin sediment accumulation is consistent with reasonable fold-thrust belt geometries and lithospheric conditions. Further, the fold-thrust belt would have been the dominant sediment source by volume and provided sufficient material to fill the foreland basin. Material excavated from beneath the San Juan del Oro surface contributed minor sediment volume to the foreland basin. Despite these consistencies, a key discrepancy remains. Specifically, how the modern foreland basin could display middle Miocene and younger onset of rapid sediment accumulation, despite evidence for fold-thrust belt shortening and erosion since ca. 40 Ma. We propose that the large magnitude of shortening and attendant lateral translation of the fold-thrust belt, coupled with flexural subsidence over a weak lithosphere, created an initial foreland basin that was too narrow to induce sediment accumulation in the distal Subandean Zone. The early flexural foreland basin has been largely erosionally recycled as the fold-thrust belt advanced eastward. Remnants of this early foreland basin have been identified in the eastern segment of the Eastern Cordillera (Camargo syncline and related sections). Only in the past ca. 11 Myr has a combination of crustal shortening, attendant underthrusting of the Brazilian Shield, and foreland advance of the fold-thrust belt been sufficient to bring the Subandean localities (Villamontes and other sections) into the proximal foredeep depozone. An interesting possibility emerges, such that once the early foreland basin is entirely eroded away, this segment of the Andes may have a foreland basin stratigraphic record that does not preserve the initial 10s of Myrs of early Andean orogenesis.
Data Availability Statement
The original contributions generated for this study are included in the article/Supplementary Material, further inquiries can be directed to the corresponding author.
Author Contributions
All authors were involved in the conception of this manuscript. NP and BH conducted the magnetostratigraphic analyses. NP conducted the backstripping, flexural modeling, most figure creation, and most manuscript writing. RA calculated the eroded areas from the cross section. BO conducted the San Juan del Oro eroded volume work.
Funding
This research was supported by the University of Texas at Austin, Texas A&M University, and NSF EAR-1847392 (NP), NSF EAR-1250510, University of Texas at Austin (RA), NSF EAR-1250510, EAR-0908518 (BH), Texas A&M University (BO), and University of Texas at Austin (AC).
Conflict of Interest
The authors declare that the research was conducted in the absence of any commercial or financial relationships that could be construed as a potential conflict of interest.
Acknowledgments
Magnetostratigraphic data in this study comes from the undergraduate thesis of NP, who thanks undergraduate honors program mentors Chris Bell, Bill Carlson, Jack Holt, Isaac Smith, and John Kappelman from the UT Austin Paleomagnetics Laboratory. NP and BH especially thank Cornelius Uba for leading us through Cenozoic sections in Bolivia, field discussions, and assistance with magnetostratigraphic sampling. BO thanks George Allen for assistance with ArcGIS methods.
Supplementary Material
The Supplementary Material for this article can be found online at: https://www.frontiersin.org/articles/10.3389/feart.2021.636269/full#supplementary-material
References
Allen, P. A., and Allen, J. R. (2013). Basin Analysis Principles and Application to Petroleum Play Assessment (third edition). Chichester, UK: Wiley-Blackwell Publishing, 619.
Allmendinger, R. W., and Judge, P. A. (2013). Stratigraphic uncertainty and errors in shortening from balanced sections in the North American Cordillera. Geolog. Soc. Am. Bull. 125, 1569–1579. doi: 10.1130/B30871.1
Allmendinger, R. W., Jordan, T. E., Kay, S. M., and Isacks, B. L. (1997). The evolution of the Altiplano-Puna plateau of the Central Andes. Ann. Rev. Earth Planetar. Sci. 25, 139–174. doi: 10.1146/annurev.earth.25.1.139
Anderson, R. B., Long, S. P., Horton, B. K., Calle, A. Z., and Ramirez, V. (2017). Shortening and structural architecture of the Andean fold-thrust belt of southern Bolivia (21°S): Implications for kinematic development and crustal thickening of the central Andes. Geosphere 13:GES01433.1. doi: 10.1130/GES01433.1
Anderson, R. B., Long, S. P., Horton, B. K., Thomson, S. N., Calle, A. Z., and Stockli, D. F. (2018). Orogenic wedge evolution of the central Andes, Bolivia (21°S): Implications for Cordilleran cyclicity. Tectonics 37:5132. doi: 10.1029/2018TC005132
Baby, P., Hérail, G., Salinas, R., and Sempere, T. (1992). Geometry and kinematic evolution of passive roof duplexes deduced from cross section balancing: Example from the foreland thrust sys- tem of the southern Bolivian Subandean. Tectonics 11, 523–536. doi: 10.1029/91TC03090
Baby, P., Rochat, P., Mascle, G., and Hérail, G. (1997). Neogene shortening contribution to crustal thickening in the back arc of the Central Andes. Geology 25, 883–886. doi: 10.1130/0091-76131997025<0883:NSCTCT<2.3.CO;2
Barnes, J. B., and Heins, W. A. (2009). Plio−Quaternary sediment budget between thrust belt erosion and foreland deposition in the central Andes, southern Bolivia. Bas. Res. 21, 91–109. doi: 10.1111/j.1365-2117.2008.00372.x
Barnes, J. B., Ehlers, T. A., McQuarrie, N., O’Sullivan, P. B., and Tawackoli, S. (2008). Thermochronometer record of central Andean Plateau growth, Bolivia (19.5°S). Tectonics 27:TC3003. doi: 10.1029/2007TC002174
Barnes, J. B., Ehlers, T. A., McQuarrie, N., O’Sullivan, P. B., and Pelletier, J. D. (2006). Eocene to recent variations in erosion across the central Andean fold-thrust belt, northern Bolivia: Implications for plateau evolution. Earth Planetar. Sci. Lett. 248, 118–133. doi: 10.1016/j.epsl.2006.05.018
Beck, S. L., and Zandt, G. (2002). The nature of orogenic crust in the central Andes. J. Geophys. Res. 107:2230. doi: 10.1029/2000JB000124
Brooks, B. A., Bevis, M., Whipple, K., Arrowsmith, J. R., Foster, J., Zapata, T., et al. (2011). Orogenic-wedge deformation and potential for great earthquakes in the central Andean backarc. Nat. Geosci. 4, 380–383. doi: 10.1038/ngeo1143
Buford Parks, V. M., and McQuarrie, N. (2019). Kinematic, flexural, and thermal modelling in the Central Andes: Unravelling age and signal of deformation, exhumation, and uplift. Tectonophysics 766, 302–325. doi: 10.1016/j.tecto.2019.06.008
Calle, A. Z., Horton, B. K., Limachi, R., Stockli, D. F., Uzeda-Orellana, G. V., Anderson, R. B., et al. (2018). Cenozoic provenance and depositional record of the Subandean foreland basin during growth and advance of the central Andean fold-thrust belt, southern Bolivia, in Zamora, G., McClay, K., and Ramos, V., Petroleum Basins and Hydrocarbon Potential of the Andes of Peru and Bolivia. Am. Assoc. Petrol. Geolog. Memoir 117:1173777. doi: 10.1306/13622132m1173777
Costa, C. H., Audemard, F. A. M., Bezerra, F. H. R., Lavenu, A., Machette, M. N., and París, G. (2006). An overview of the main Quaternary deformation of South America. Revista de la Asocia- ción Geológica Argentina 61, 461–479.
DeCelles, P. G., and Graham, S. A. (2015). Cyclical processes in the North American Cordilleran orogenic system. Geology 43, 499–502. doi: 10.1130/g36482.1
DeCelles, P. G., and Horton, B. K. (2003). Early to middle Tertiary foreland basin development and the history of Andean crustal shortening in Bolivia. Geolog. Soc. Am. Bull. 115, 58–77. doi: 10.1130/0016-7606(2003)115<0058:etmtfb>2.0.co;2
DeCelles, P. G., Ducea, M. N., Kapp, P., and Zandt, G. (2009). Cyclicity in Cordilleran orogenic systems. Nat. Geosci. 2, 251–257. doi: 10.1038/ngeo469
Dunn, J., Hartshorn, K., and Hartshorn, P. (1995). Structural styles and hydrocarbon potential of the Sub-Andean thrust belt of southern Bolivia. In A. J. Tankard, R. Suarez Soruco, and H. J. Welsink (Eds.). Petrol. Bas. South Am. 62, 523–543.
Echavarria, L., Hernández, R., Allmendinger, R., and Reynolds, J. (2003). Subandean thrust and fold belt of northwestern Argentina: Geometry and timing of the Andean evolution. Am. Assoc. Petrol. Geolog. Bull. 87, 965–985. doi: 10.1306/01200300196
Ege, H., Sobel, E. R., Scheuber, E., and Jacobshagen, V. (2007). Exhumation history of the southern Altiplano plateau (southern Bolivia) constrained by apatite fission track thermochronology. Tectonics 26:TC1004. doi: 10.1029/2005TC001869
Fosdick, J. C., Graham, S. A., and Hilley, G. E. (2014). Influence of attenuated lithosphere and sediment loading on flexure of the deep-water Magallanes retroarc foreland basin, Southern Andes. Tectonics 33, 2505–2525. doi: 10.1002/2014TC003684
Fox, M., Carter, A., and Dai, J. (2020). How continuous are the “Relict” landscapes of Southeastern Tibet? Front. Earth Sci. 8:587597.
Garzione, C. N., McQuarrie, N., Perez, N. D., Ehlers, T. A., Beck, S. L., Kar, N., et al. (2017). The tectonic evolution of the Central Andean Plateau and geodynamic implications for the growth of plateaus. Ann. Rev. Earth Planetar. Sci. 45, 529–559. doi: 10.1146/annurev-earth-063016-020612
Garzione, C. N., Molnar, P., Libarkin, J. C., and MacFadden, B. J. (2006). Rapid late Miocene rise of the Bolivian Altiplano: Evidence for removal of mantle lithosphere. Earth Planetar. Sci. Lett. 241, 543–556. doi: 10.1016/j.epsl.2005.11.026
Gillis, R. J., Horton, B. K., and Grove, M. (2006). Thermochronology, geochronology, and upper crustal structure of the Cordillera Real: Implications for Cenozoic exhumation of the central Andean plateau. Tectonics 25:TC6007.
Gradstein, F. M., Ogg, J. G., and Smith, A. G. (2004). A geologic time scale 2004, Vol. 86. Cambridge, MA: Cambridge University Press.
Gubbels, T. L., Isacks, B. L., and Farrar, E. (1993). High-level surfaces, plateau uplift, and foreland development, Bolivian central Andes. Geology 21, 695–698. doi: 10.1130/0091-7613(1993)021<0695:hlspua>2.3.co;2
Hérail, G., Oller, J., Baby, P., Bonhomme, M., and Soler, P. (1996). Strike-slip faulting, thrusting and related basins in the Cenozoic evolution of the southern branch of the Bolivian Orocline. Tectonophysics 259, 201–212. doi: 10.1016/0040-1951(95)00108-5
Horton, B. K. (1998). Sediment accumulation on top of the Andean orogenic wedge: Oligocene to late Miocene basins of the Eastern Cordillera, southern Bolivia. Geolog. Soc. Am. Bull. 110, 1174–1192. doi: 10.1130/0016-7606(1998)110<1174:SAOTOT>2.3.CO;2
Horton, B. K. (2005). Revised deformation history of the central Andes: Inferences from Cenozoic foredeep and intermontane basins of the Eastern Cordillera, Bolivia. Tectonics 24:TC3011. doi: 10.1029/2003TC001619
Horton, B. K. (2018a). Sedimentary record of Andean mountain building. Earth-Sci. Rev. 178, 279–309. doi: 10.1016/j.earscirev.2017.11.025
Horton, B. K. (2018b). Tectonic regimes of the central and southern Andes: Responses to variations in plate coupling during subduction. Tectonics 37, 402–429. doi: 10.1002/2017tc004624
Horton, B. K., and DeCelles, P. G. (1997). The modern foreland basin system adjacent to the Central Andes. Geology 25, 895–898. doi: 10.1130/0091-76131997025<0895:TMFBSA<2 .3.CO;2
Horton, B. K., Hampton, B. A., and Waanders, G. L. (2001). Paleogene synorogenic sedimentation in the Altiplano plateau and implications for initial mountain building in the central Andes. GSA Bull. 113, 1387–1400. doi: 10.1130/0016-7606(2001)113<1387:pssita>2.0.co;2
Horton, B. K., Hampton, B. A., LaReau, B. N., and Baldellon, E. (2002). Tertiary provenance history of the northern and central Altiplano (central Andes, Bolivia): A detrital record of plateau-margin tectonics. J. Sediment. Res. 72, 711–726. doi: 10.1306/020702720711
Hulka, C., and Heubeck, C. (2010). Composition and provenance history of late Cenozoic sedi- ments in southeastern Bolivia: Implications for Chaco foreland basin evolution and Andean uplift. J. Sediment. Res. 80, 288–299. doi: 10.2110/jsr.2010.029
Isacks, B. L. (1988). Uplift of the central Andean plateau and bending of the Bolivian orocline. J. Geophys. Res. 93, 3211–3231. doi: 10.1029/jb093ib04p03211
Judge, P. A., and Allmendinger, R. W. (2011). Assessing uncertainties in balanced cross sections. J. Struct. Geol. 33, 458–467. doi: 10.1016/j.jsg.2011.01.006
Kennan, L., Lamb, S. H., and Hoke, L. (1997). High-altitude palaeosurfaces in the Bolivian Andes: evidence for late Cenozoic surface uplift. Geolog. Soc. 120, 307–323. doi: 10.1144/gsl.sp.1997.120.01.20
Kennan, L., Lamb, S., and Rundle, C. (1995). K-Ar dates from the Altiplano and Cordillera Oriental of Bolivia: Implications for Cenozoic stratigraphy and tectonics. J. South Am. Earth Sci. 8, 163–186. doi: 10.1016/0895-9811(95)00003-x
Kley, J. (1996). Transition from basement-involved to thin-skinned thrusting in the Cordillera Oriental of southern Bolivia. Tectonics 15, 763–775. doi: 10.1029/95TC03868
Kley, J., Gangui, A. H., and Krüger, D. (1996). Basement-involved blind thrusting in the eastern Cordillera Oriental, southern Bolivia: evidence from cross-sectional balancing, gravimetric and magnetotelluric data. Tectonophysics 259, 171–184. doi: 10.1016/0040-1951(95)00067-4
Kley, J., Müller, J., Tawackoli, S., Jacobshagen, V., and Manutsoglu, E. (1997). Pre-Andean and Andean-age deformation in the Eastern Cordillera of southern Bolivia. J. S. Am. Earth Sci. 10, 1–19. doi: 10.1016/S0895-9811(97)00001-1
Lamb, S., and Hoke, L. (1997). Origin of the high plateau in the Central Andes, Bolivia, South America. Tectonics 16, 623–649. doi: 10.1029/97tc00495
Lease, R. O., Ehlers, T. A., and Enkelmann, E. (2016). Large along-strike variations in the onset of Subandean exhumation: Implications for Central Andean orogenic growth. Earth Planetar. Sci. Lett. 451, 62–76. https://doi.org/10.1016/j.epsl.2016.07.004, doi: 10.1016/j.epsl.2016.07.004
McGroder, M. F., Lease, R. O., and Pearson, D. M. (2015). “Along-strike variation in structural styles and hydrocarbon occurrences, Subandean fold-and-thrust belt and inner foreland, Colombia to Argentina,” in Geodynamics of a Cordilleran Orogenic System: The Central Andes of Argentina and Northern Chile, Vol. 212, eds P. G. DeCelles, M. N. Ducea, B. Carrapa, and P. A. Kapp (Boulder: Geological Society of America Memoir), doi: 10.1130/2015.1212(05)
McQuarrie, N. (2002). The kinematic history of the central Andean fold-thrust belt, Bolivia: Impli- cations for building a high plateau. Geolog. Soc. Am. Bull. 114, 950–963. doi: 10.1130/0016-76062002114<0950
McQuarrie, N., and DeCelles, P. (2001). Geometry and structural evolution of the central Andean backthrust belt. Bolivia. Tectonics 20, 669–692. doi: 10.1029/2000tc001232
McQuarrie, N., Barnes, J. B., and Ehlers, T. A. (2008). Geometric, kinematic, and erosional history of the central Andean Plateau, Bolivia (15–17 S). Tectonics 27:3.
Mosolf, J. G., Horton, B. K., Heizler, M. T., and Matos, R. (2011). Unroofing the core of the central Andean fold-thrust belt during focused late Miocene exhumation: Evidence from the Tipuani-Mapiri wedge-top basin, Bolivia. Basin Res. 23, 346–360. doi: 10.1111/j.1365-2117.2010.00491.x
Müller, J. P., Kley, J., and Jacobshagen, V. (2002). Structure and Cenozoic kinematics of the Eastern Cordillera, southern Bolivia (21°S). Tectonics 21:1037. doi: 10.1029/2001TC001340
Murray, B. P., Horton, B. K., Matos, R., and Heizler, M. T. (2010). Oligocene-Miocene basin evolution in the northern Altiplano, Bolivia: Implications for evolution of the central Andean backthrust belt and high plateau. Geolog. Soc. Am. Bull. 122, 1443–1462. doi: 10.1130/B30129.1
Oncken, O., Hindle, D., Kley, J., Elger, K., Victor, P., and Schemmann, K. (2006). Deformation of the Central Andean upper plate system—Facts, fiction, and constraints for plateau models, in Oncken, O., et al., eds, The Andes—Active Subduction Orogeny: Frontiers in Earth Sciences. Berlin: Springer, 3–27. doi: 10.1007/978-3-540-48684-8_1
Perez, N. D., Horton, B. K., McQuarrie, N., Stübner, K., and Ehlers, T. A. (2016). Andean shortening, inversion, and exhumation associated with thin- and thick-skinned deformation in southern Peru. Geolog. Magaz. 153, 1013–1041. doi: 10.1017/S0016756816000121
Rak, A. J., McQuarrie, N., and Ehlers, T. A. (2017). Kinematics, exhumation, and sedimentation of the north central Andes (Bolivia): An integrated thermochronometer and thermokinematic modeling approach. Tectonics 36, 2524–2554. doi: 10.1002/2016tc004440
Ramos, V. A., and Folguera, A. (2009). “Andean flat-slab subduction through time,” in Ancient Orogens and Modern Analogues, Vol. 327, eds J. B. Murphy, J. D. Keppie, and A. J. Hynes (London: Geological Society of London Special Publication), 31–54. doi: 10.1144/sp327.3
Saylor, J. E., and Horton, B. K. (2014). Nonuniform surface uplift of the Andean plateau revealed by deuterium isotopes in Miocene volcanic glass from southern Peru. Earth Planetar. Sci. Lett. 387, 120–131. doi: 10.1016/j.epsl.2013.11.015
Saylor, J. E., Jordan, J. C., Sundell, K. E., Wang, X., Wang, S., and Deng, T. (2018). Topographic growth of the Jishi Shan and its impact on basin and hydrology evolution. NE Tibetan Plateau. Basin Res. 30, 544–563. doi: 10.1111/bre.12264
Sempere, T., Carlier, G., Soler, P., Fornari, M., Carlotto, V., Jacay, J., et al. (2002). Late Permian-Middle Jurassic lithospheric thinning in Peru and Bolivia, and its bearing on Andean-age tectonics. Tectonophysics 345, 153–181. doi: 10.1016/S0040-1951(01)00211-6
Sempere, T., Heìrail, G., Oller, J., and Bonhomme, M. G. (1990). Late Oligocene-early Miocene major tectonic crisis and related basins in Bolivia. Geology 18, 946–949. doi: 10.1130/0091-7613(1990)018<0946:loemmt>2.3.co;2
Strecker, M. R., Alonso, R. N., Bookhagen, B., Carrapa, B., Hilley, G. E., Sobel, E. R., et al. (2007). Tectonics and climate of the southern central Andes. Annu. Rev. Earth Planet. Sci. 35, 747–787. doi: 10.1146/annurev.earth.35.031306.140158
Tankard, A., Uliana, M. A., and Welsink, H. J. (1995). Structural and tectonic controls of basin evolution in southwestern Gondwana during the Phanerozoic, in Tankard, A.J., et al., eds, Petroleum Basins of South America. Am. Assoc. Petrol. Geolog. Memoir 62, 5–52.
Tassara, A., Swain, C., Hackney, R., and Kirby, J. (2007). Elastic thickness structure of South America estimated using wavelets and satellite-derived gravity data. Earth Planetar. Sci. Lett. 253, 17–36. doi: 10.1016/j.epsl.2006.10.008
Uba, C. E., Heubeck, C., and Hulka, C. (2005). Facies analysis and basin architecture of the Neogene Subandean synorogenic wedge, southern Bolivia. Sedimentar. Geol. 180, 91–123. doi: 10.1016/j.sedgeo.2005.06.013
Uba, C. E., Heubeck, C., and Hulka, C. (2006). Evolution of the late Cenozoic Chaco foreland basin, southern Bolivia. Basin Res. 18, 145–170. doi: 10.1111/j.1365-2117.2006.00291
Uba, C. E., Kley, J., Strecker, M. R., and Schmitt, A. K. (2009). Unsteady evolution of the Bolivian Subandean thrust belt: The role of enhanced erosion and clastic wedge progradation. Earth Planetar. Sci. Lett. 281, 134–146. doi: 10.1016/j.epsl.2009.02.010
Uba, C. E., Strecker, M. R., and Schmitt, A. K. (2007). Increased sediment accumulation rates and climatic forcing in the central Andes during the late Miocene. Geology 35, 979–982. doi: 10.1130/g224025a.1
Watts, A. B. (2001). Isostasy and Flexure of the Lithosphere. Cambridge: Cambridge University Press.
Keywords: fold-thrust belt, foreland basin, thermochronology, backstripping analysis, flexural modeling, magnetostratigraphic correlation
Citation: Perez ND, Anderson RB, Horton BK, Ohlson BA and Calle AZ (2021) Reconciling Spatial and Temporal Patterns of Cenozoic Shortening, Exhumation, and Subsidence in the Southern Bolivian Andes. Front. Earth Sci. 9:636269. doi: 10.3389/feart.2021.636269
Received: 01 December 2020; Accepted: 29 March 2021;
Published: 20 May 2021.
Edited by:
Maryline Le Béon, National Central University, TaiwanReviewed by:
Feng Cheng, University of Rochester, United StatesShihu Li, Lancaster University, United Kingdom
Copyright © 2021 Perez, Anderson, Horton, Ohlson and Calle. This is an open-access article distributed under the terms of the Creative Commons Attribution License (CC BY). The use, distribution or reproduction in other forums is permitted, provided the original author(s) and the copyright owner(s) are credited and that the original publication in this journal is cited, in accordance with accepted academic practice. No use, distribution or reproduction is permitted which does not comply with these terms.
*Correspondence: Nicholas D. Perez, bmRwZXJlekB0YW11LmVkdQ==