 Nicolas Wynants-Morel
 Louis De Barros
 Frédéric Cappa
- 1Université Côte d’Azur, CNRS, Observatoire de la Côte d’Azur, IRD, Géoazur, Valbonne, France
- 2Institut Universitaire de France, Paris, France
Fluid pressure perturbations in subsurface rocks affect the fault stability and can induce both seismicity and aseismic slip. Nonetheless, observations show that the partitioning between aseismic and seismic fault slip during fluid injection may strongly vary among reservoirs. The processes and the main fault properties controlling this partitioning are poorly constrained. Here we examine, through 3D hydromechanical modeling, the influence of fault physical properties on the seismic and aseismic response of a permeable fault governed by a slip-weakening friction law. We perform a series of high-rate, short-duration injection simulations to evaluate the influence of five fault parameters, namely the initial permeability, the dilation angle, the friction drop, the critical slip distance, and the initial proximity of stress to failure. For sake of comparison between tests, all the simulations are stopped for a fixed rupture distance relative to the injection point. We find that while the fault hydraulic behavior is mainly affected by the change in initial permeability and the dilation angle, the mechanical and seismic response of the fault strongly depends on the friction drop and the initial proximity of stress to failure. Additionally, both parameters, and to a lesser extent the initial fault permeability and the critical slip distance, impact the spatiotemporal evolution of seismic events and the partitioning between seismic and aseismic moment. Moreover, this study shows that a modification of such parameters does not lead to a usual seismic moment-injected fluid volume relationship, and provides insights into why the fault hydromechanical properties and background stress should be carefully taken into account to better anticipate the seismic moment from the injected fluid volume.
Highlights
- During fluid injection, the friction drop, dilation angle, and initial proximity of stress to failure of a fault influence its mechanical behavior.
- Friction, initial permeability, and initial proximity of stress to failure of a fault act on the spatiotemporal evolution of injection-induced seismic events.
- Relationship between seismic moment and injected fluid volume strongly depends on fault hydromechanical properties and background stress.
Introduction
Fluid injection in the upper crust induces earthquakes (Keranen and Weingarten, 2018). Over the past 20 years, the question of injection-induced seismicity became more prominent as the rate of such events strongly increased worldwide (Ellsworth, 2013; Grigoli et al., 2017). This category of earthquakes includes large events such as the 2011 Mw 5.7 and 2016 Mw 5.8 wastewater-induced shocks in Oklahoma (Keranen et al., 2013; Yeck et al., 2017), and the 2017 Mw 5.5 earthquake close to a geothermal plant in Pohang, South Korea (Grigoli et al., 2018; Kim et al., 2018; Lee et al., 2019). Even though injection-induced seismicity is frequently associated with wastewater disposal or geothermal activities, hydraulic fracturing also induces seismic events with moment magnitudes up to 4.6 in the Western Canada sedimentary basin (WCSB) (Schultz et al., 2015; Atkinson et al., 2016; Bao and Eaton, 2016). Thus, understanding how fluid injection induces seismicity, or not, is important to reduce human-induced seismic risk and build a safer energy future.
Nonetheless, observations have shown that fluid injections do not always trigger seismic events. They can also induce aseismic slip related to a slow propagation of the rupture in and outside the injection zone (Guglielmi et al., 2015a; Bhattacharya and Viesca, 2019; Cappa et al., 2019; Eyre et al., 2019). Indeed, some studies show that the deformation induced by the injection is dominantly aseismic, with an area totally devoid of seismicity around the injection. These observations were made at reservoir scale (Cornet et al., 1997; Calò et al., 2011; Cornet, 2012, 2016; Zoback et al., 2012; Schmittbuhl et al., 2014; Wei et al., 2015; Lengliné et al., 2017; Eyre et al., 2019; Hopp et al., 2019), in laboratory (Goodfellow et al., 2015; Wang et al., 2020) and from meter-scale in-situ experiments (Guglielmi et al., 2015a; De Barros et al., 2016; Duboeuf et al., 2017). The aseismic deformation estimated in these small-scale experiments represents more than 95% of the total deformation released during injection (Goodfellow et al., 2015; De Barros et al., 2016, 2018, 2019; Duboeuf et al., 2017).
In the conventional model used to explain injection-induced seismicity, the fault ruptures when the Mohr-Coulomb failure criterion is reached through an increase of fluid pressure, which causes the decrease of effective normal stress and frictional resistance (Hubbert and Rubey, 1959). Within this framework, the ruptures are only driven by fluid pressure diffusion and are contained inside the pressurized zone (Shapiro et al., 1997, 2002, 2011; McGarr, 2014). Poroelastic stress changes and earthquake nucleation effects have been added later to this model (Segall, 1989; Segall and Lu, 2015). The triggering of the rupture therefore depends on the distance to injection: at short distances, fluid pressure dominates, while stress perturbations dominate at larger distances (Goebel et al., 2017). Recently, the role of aseismic deformation on injection-induced earthquakes was considered. Models proposed by Guglielmi et al. (2015a), Cappa et al. (2018, 2019), De Barros et al. (2018), Bhattacharya and Viesca (2019), and Wynants-Morel et al. (2020), show that fluid pressure primarily induces aseismic deformation. Then, the seismicity is triggered by the elastic stress perturbations transferred from aseismic slip. As the deformation may occur outside the pressurized zone, seismicity may outpace the pressure front, as observed at different scales (De Barros et al., 2018; Cappa et al., 2019; Eyre et al., 2019).
At the same time, the estimation of the maximum seismic moment that can be released during a fluid injection is crucial in seismic hazard and risk analysis (McClure and Horne, 2011; Eaton and Igonin, 2018; Norbeck and Horne, 2018). The most common method to evaluate the maximum seismic moment released during fluid injection is based on the injected fluid volume (McGarr, 1976, 2014; van der Elst et al., 2016; Galis et al., 2017; McGarr and Barbour, 2018). However, such models do not consider the contribution of the aseismic component of the deformation in the moment determination (De Barros et al., 2019). Moreover, the theoretical limit in the relationship between moment and volume is sometimes exceeded, as for the Mw 5.5 mainshock near Pohang, South Korea (Grigoli et al., 2018; Kim et al., 2018; Lee et al., 2019) or the Mw 3.3 mainshock that occurred during the test of the St-Gallen geothermal project (Zbinden et al., 2020). Therefore, seismic moment does not depend only on the fluid injected volume. Indeed, other authors showed that the seismic moment is also related to injection parameters (Weingarten et al., 2015; Almakari et al., 2019; De Barros et al., 2019) and fault properties (Weingarten et al., 2015; Schoenball and Ellsworth, 2017; De Barros et al., 2018; Hearn et al., 2018; Pei et al., 2018).
Several fault physical parameters are recognized to act on the released seismic moment and on the seismic or aseismic nature of the rupture on the fault (e.g., Chang and Segall, 2016; Fan et al., 2016; Kroll et al., 2017; Pei et al., 2018; Dublanchet, 2019b). In this study, we focus on five main independent parameters. The permeability is known to influence the spatio-temporal repartition of induced seismicity (Shapiro et al., 1997; Zhang et al., 2013; McNamara et al., 2015; Chang and Segall, 2016; Norbeck and Horne, 2016; Yeck et al., 2016) and is thought to influence the rupture mode of the fault (Guglielmi et al.,2015a,b; Wei et al., 2015; Cappa et al., 2018). The initial proximity of background stress to rupture of the fault also acts on the seismic-to-total moment ratio released during fluid injection (Garagash and Germanovich, 2012; Gischig, 2015; Bhattacharya and Viesca, 2019; Wynants-Morel et al., 2020). Similarly, the critical slip distance Dc influences this moment ratio (Cueto-Felgueroso et al., 2017). The effect of shear-induced dilation is known to induce a damping of the seismicity (Segall et al., 2010; McClure and Horne, 2011), while the moment magnitude of the induced seismicity gets higher with increasing friction drop (Rutqvist et al., 2015). Therefore, it is important to investigate the following key question: how do fault physical parameters influence the released seismic moment and the seismicity repartition in time and space during fluid injection?
In the following, we numerically explore the influence of these five fault parameters (namely, the initial permeability, the dilation angle, the initial state of stress, the friction drop and the critical slip distance) on the spatiotemporal distribution of seismicity and on the seismic and aseismic moment released during a fluid injection. The response of a permeable, slip-weakening fault to a short-duration injection is computed using a three-dimensional fully coupled hydromechanical model capable of simulating seismic and aseismic slip. We then analyze and discuss the seismic, hydrological and mechanical behaviors of the fault with varying properties. We show that shear stress perturbations over the fault are impacted by the friction drop, the initial stress state and the dilation angle. We also find, as expected, that the initial permeability and the dilation angle affect the hydrological behavior of the fault. Finally, we observe that the seismic moment released during injection is mostly influenced by the friction drop and the initial stress criticality, while the permeability and the critical slip distance have less influence. Therefore, such fault parameters should be considered in protocols and methods used to estimate the maximum seismic moment that can be released during a fluid injection.
Numerical Method and Model Setup
Numerical Method
We use a 3D Distinct Element Code (3DEC, Itasca Consulting Group, Inc, 2016) to model a fluid injection in a permeable, slip-weakening fault separating two three-dimensional (3D) elastic, impervious blocks (Figure 1). We consider the distinct element method (Cundall, 1988) to simulate the hydromechanical interactions and slip along the fault. The blocks are meshed in tetrahedral zones linked by nodes. The fault is discretized in 0.7 m-sized cells. Using an explicit time-marching procedure, the distinct element method considers force-displacement relations updated at each time step to describe the interaction between the blocks. Newton’s laws (i.e., the differential equations of motion) and constitutive relations are used to calculate the translation and rotation of the blocks at each time step, and thus their position, velocity, displacement and applied nodal forces. The discontinuities forces are updated through constitutive laws before next time step.
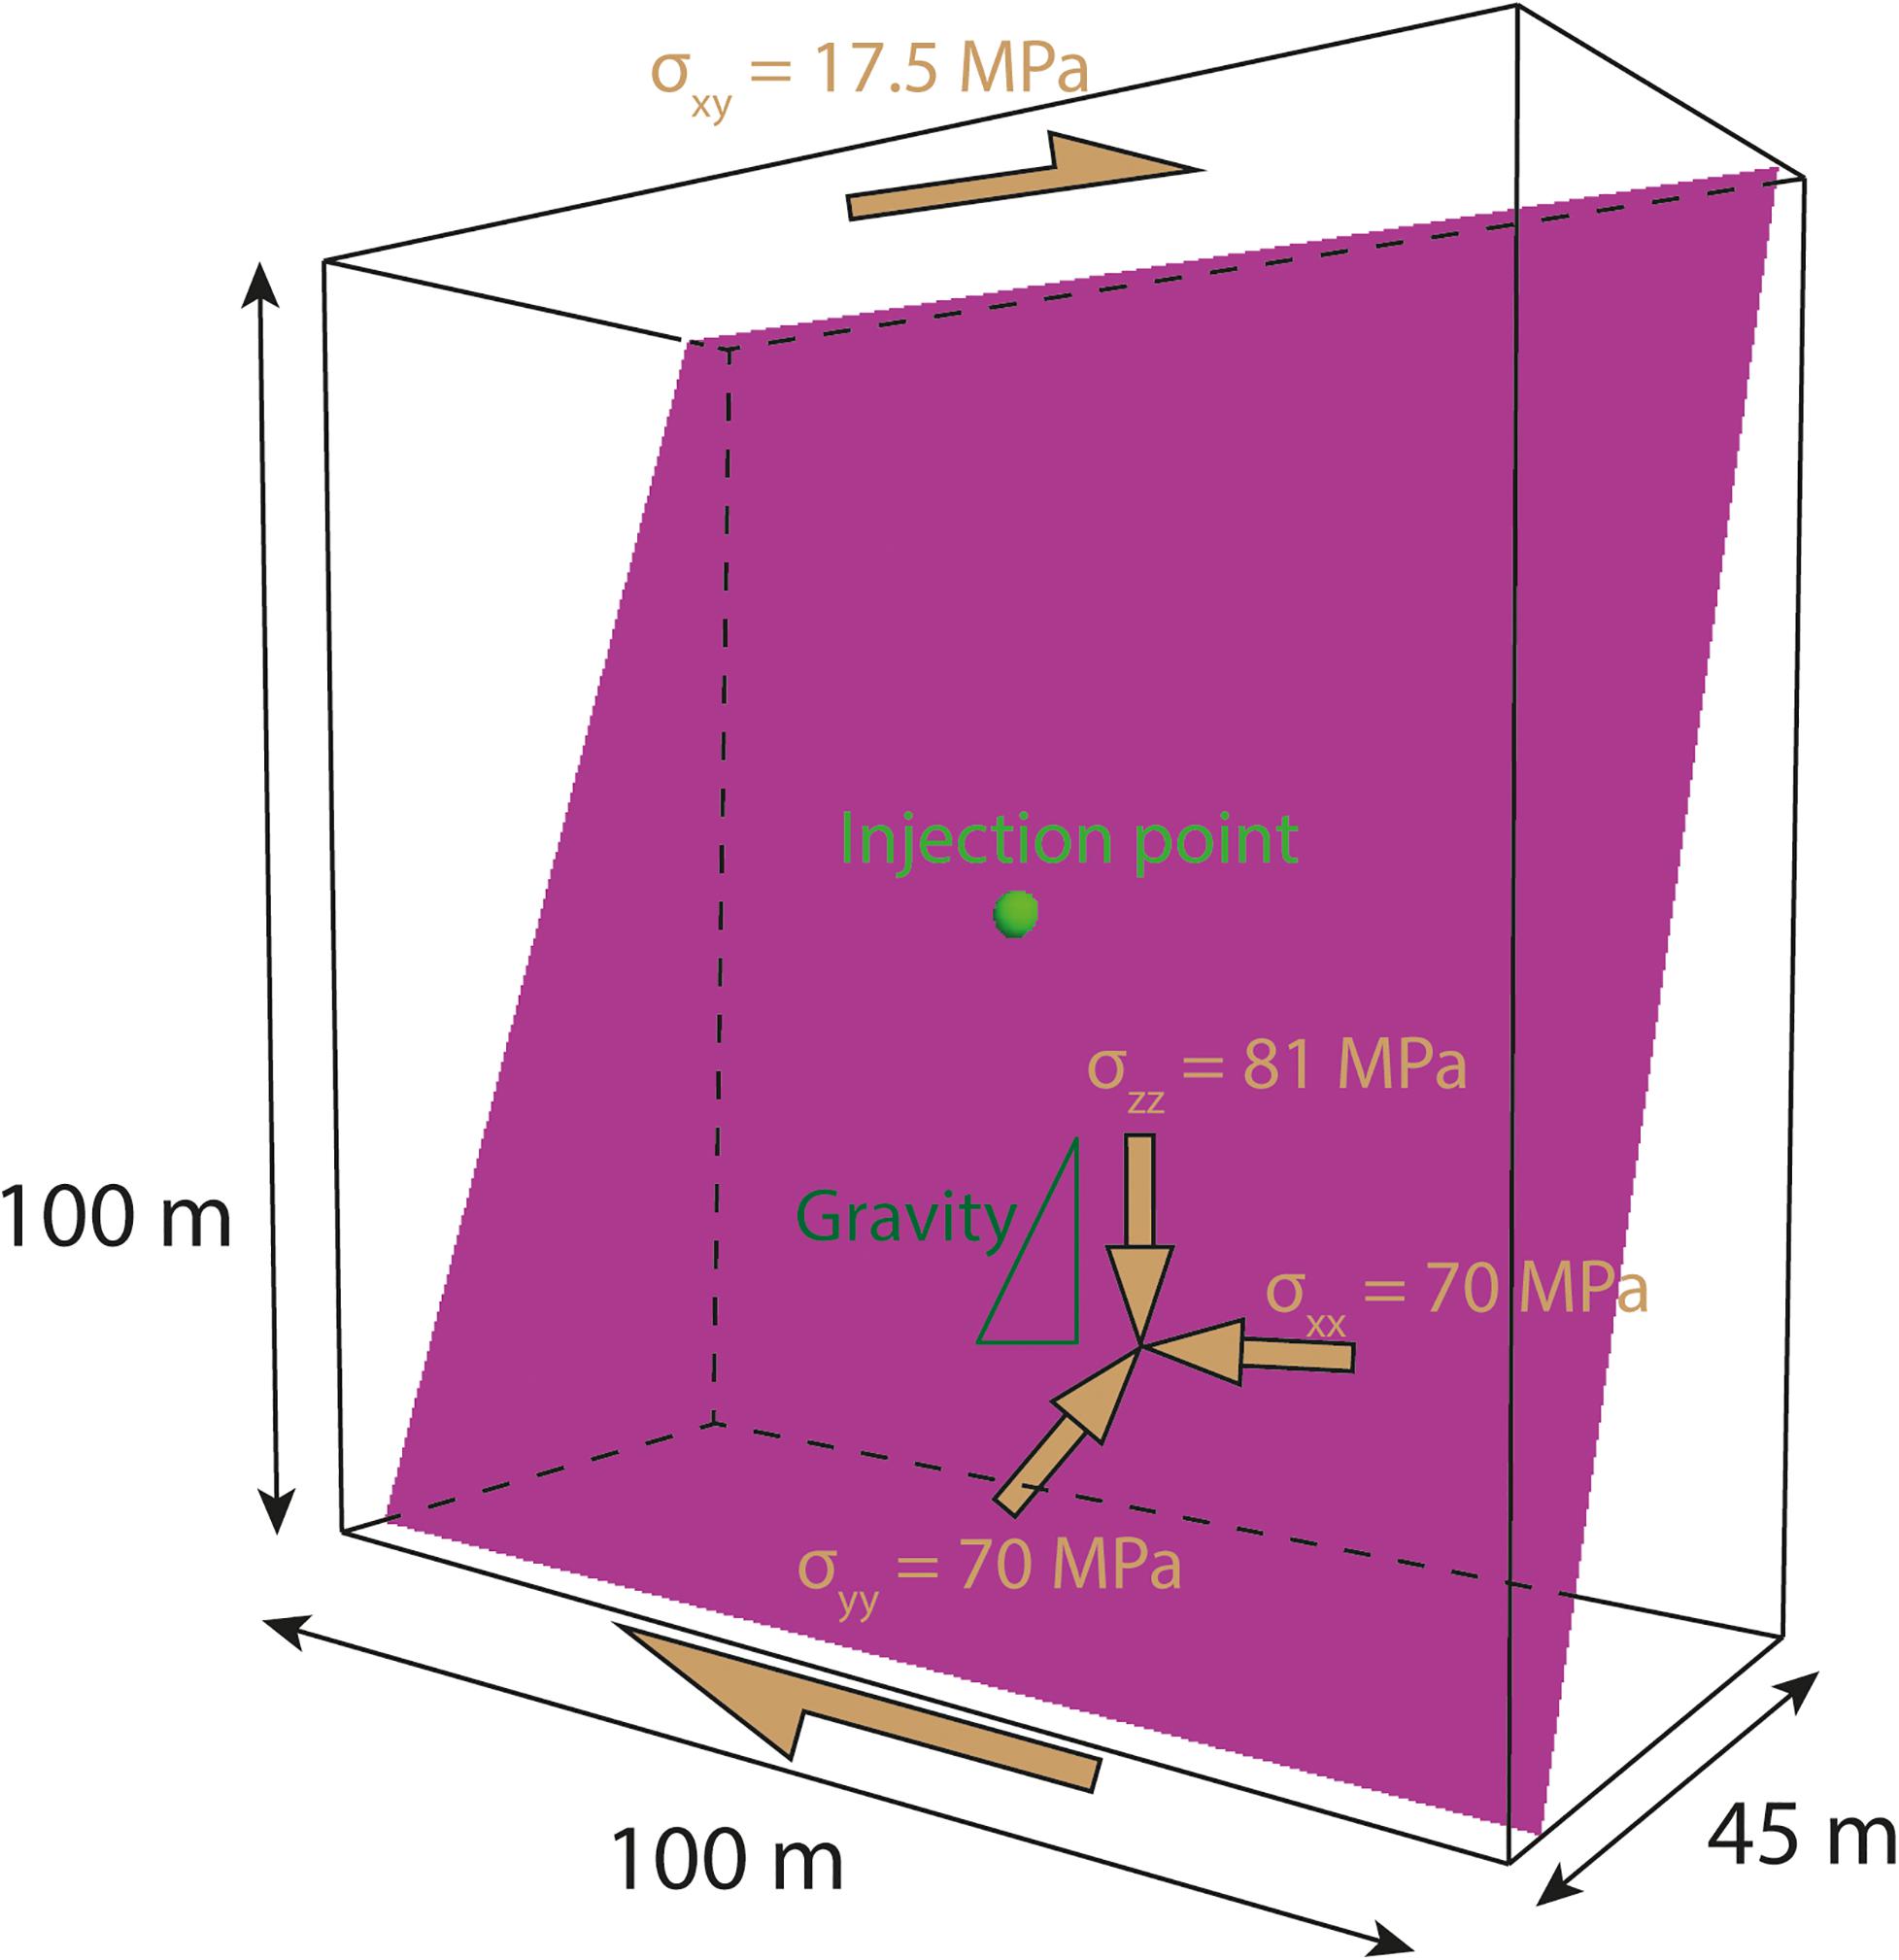
Figure 1. 3D model geometry of the 70° dipping fault represented in purple and the injection point in light green at the center of the fault. The initial state of stress has a vertical (σzz) and horizontal (σxx and σyy) stresses, plus a deviatoric component (σxy) to simulate dominantly strike-slip stress regime. The gradient of stress with depth and gravity is indicated as a dark green triangle that gets larger downwards.
The model is hydromechanically fully coupled, with hydraulic and frictional parameters that vary during injection. This affects the normal and shear displacement on the fault as well as the seismic and aseismic deformation during rupture. Seismicity is generated using an inherently discrete rupture model (Wynants-Morel et al., 2020). Given the values adopted in our model, the nucleation size of earthquakes for a slip-weakening fault (Uenishi and Rice, 2003) varies between 0.01 and 0.32 m, depending on the effective normal stress at rupture and the frictional fault properties (Tables 1, 2). It means that the nucleation phase of the earthquakes is smaller than the cell size, which prevents to compute it accurately, but the model allows to generate seismic events with rupture size of a m2 up to few tens of m2. We use an adaptive time step to be able to simulate both fast ruptures (i.e., seismic) and slow deformations (i.e., aseismic). The time step can decrease down to 10–6 second during co-seismic ruptures and increase to 1 s during aseismic periods. We then estimate earthquake source properties using classical seismological assumptions detailed in Wynants-Morel et al. (2020).
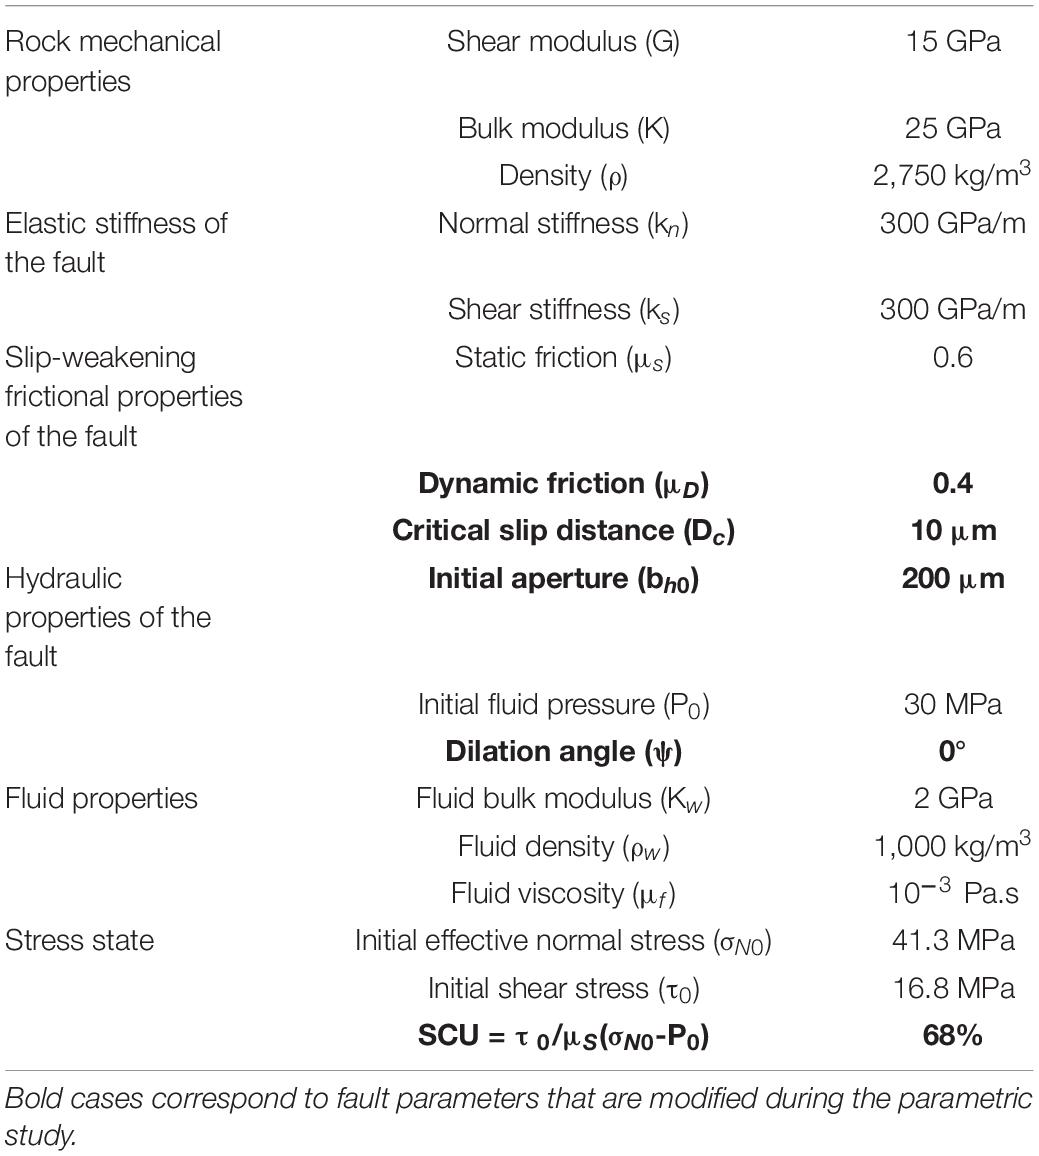
Table 1. Model parameters for the reference case.
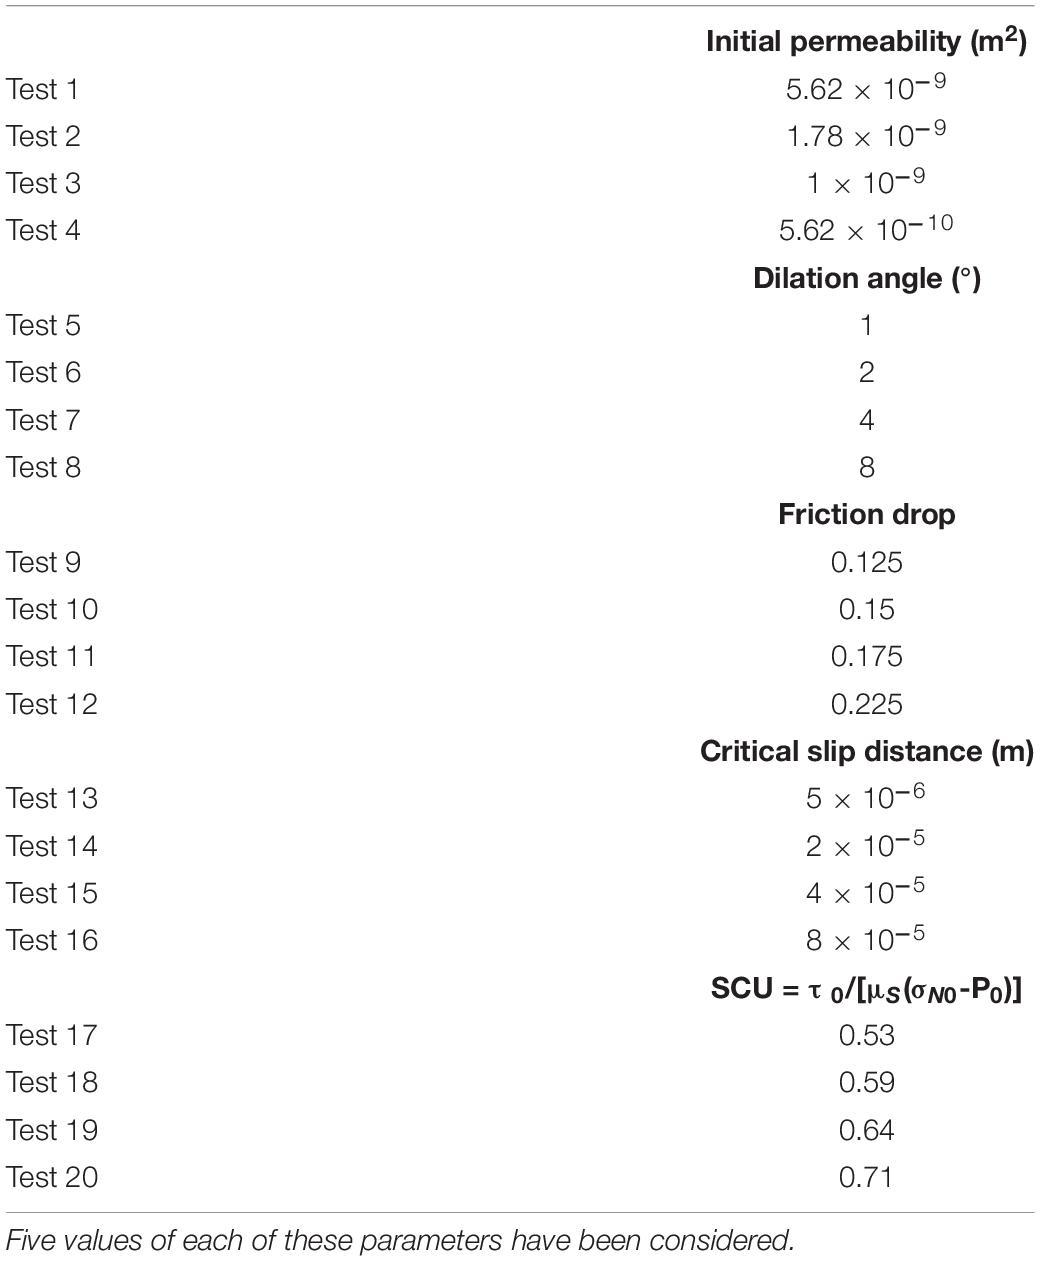
Table 2. Varying fault parameters (initial permeability, dilation angle, friction drop, critical slip distance, SCU) for the reference case and the other 20 simulations considered in this study.
Fluid Flow and Hydromechanical Coupling
During fluid injection into a fault, the pressure and fluid flow are related to the hydraulic aperture through the cubic law (Witherspoon et al., 1980). Before the injection, an initial hydraulic aperture (bho) is assigned to the fault within the initial background stress and pressure conditions. Variations of hydraulic aperture (Δbh) from initial aperture come from two main processes: (1) variations of effective normal stress and (2) dilations while the fracture slips. Thus, they can be expressed as:
where Δσn’ is the increment in effective normal stress (total normal stress minus fluid pressure) (Pa), kn is the normal stiffness (Pa/m), Δus (m) is the shear slip increment, and ψ is the dilation angle (°).
The permeability (k) is related to the square of the hydraulic aperture (Jaeger and Cook, 1984). Modeling studies show that the permeability on a fault affects the fault slip behavior (Cappa and Rutqvist, 2011; Yeo et al., 2020) but also the spatio-temporal distribution of seismic events (Shapiro et al., 1997). In addition, as the permeability increases with increasing pressure and fault slip, the evolution of permeability during injection can affect aseismic deformation developing outside the pressurized zone (Cappa et al., 2018) as well as induced seismicity at short and long distances from injection (Rinaldi and Nespoli, 2017). Thus, the study of the permeability and its variations are fundamental to understand the relationship between injection parameters and the seismic and aseismic slip released during fluid injection.
The existence of a strong coupling between permeability and shear failure is frequently observed in natural reservoirs and in-situ experiments (e.g., Guglielmi et al.,2015a,b; Zhang and Li, 2016). Previous studies showed that the dilation angle is adequate to model this coupling, that occurs during deep underground CO2 injection (Cappa and Rutqvist, 2011), the stimulation of a geothermal reservoir (Fomin et al., 2004) or in-situ injections (Guglielmi et al., 2015b; Tsopela et al., 2019). This parameter is commonly used to model the simulation of the geomechanical and hydraulic response of natural fracture systems (Latham et al., 2013; Lei et al., 2014, 2016). It is thus a critical parameter to understand hydromechanical coupling during fault deformation.
Rupture Initiation and Slip-Weakening Friction Law
The Mohr-Coulomb failure criterion (Jaeger and Cook, 1984) is given by:
where τf is the shear strength of the fault (Pa), σn is the normal stress (Pa), and P is the fluid pressure (Pa) acting on the fault. μS is the friction coefficient before failure. The fault is reactivated when the Mohr-Coulomb criterion is reached (i.e., when the shear stress and the shear strength of the faults are equal). Thus, slip begins and the slip velocity may increase. We assume here a null cohesive strength of the fault (c = 0).
The Shear Capacity Utilization (SCU), proposed in Buijze et al. (2019a), is a parameter that allows us to quantify the initial closeness to failure of the fault. It is defined as the ratio between initial shear stress (τ0) and initial strength on the fault (τf0), before the injection starts:
with σn_0 and P0 the initial normal stress and pressure acting on the fault. A maximal SCU (100%) corresponds to a fault at failure that can slip without any perturbation.
The Mohr-Coulomb criterion can be reached by increasing either the fluid pressure (and, thus decreasing the effective stress and the shear strength) or the shear stress. We use the Shear Stress Contribution (SSC) to quantify the respective role of the fluid pressure and the shear stress in the rupture:
where and are, respectively, the shear stress, the normal stress and the fluid pressure measured at position before injection. is the shear stress variation between the initial state and the state for which rupture occurs at the location . The SSC varies between 0 and 100%, respectively between a failure only triggered by fluid pressure changes and a failure only induced by shear stress perturbations.
During the slip periods, we consider that the friction coefficient only evolves with the shear slip, assuming a conventional linear slip-weakening model (Ida, 1972). In this law, a friction drop occurs as the friction coefficient decreases linearly over a critical slip distance (Dc) from a peak static value (μS) to a residual dynamic value (μD) (Figure 2A and Table 1). Both the friction drop (μS−μD) and Dc control the slip behavior (e.g., Ampuero et al., 2002; Mikumo et al., 2003; Uenishi and Rice, 2003; Dunham, 2007), and thus the seismic or aseismic nature of the fault response.
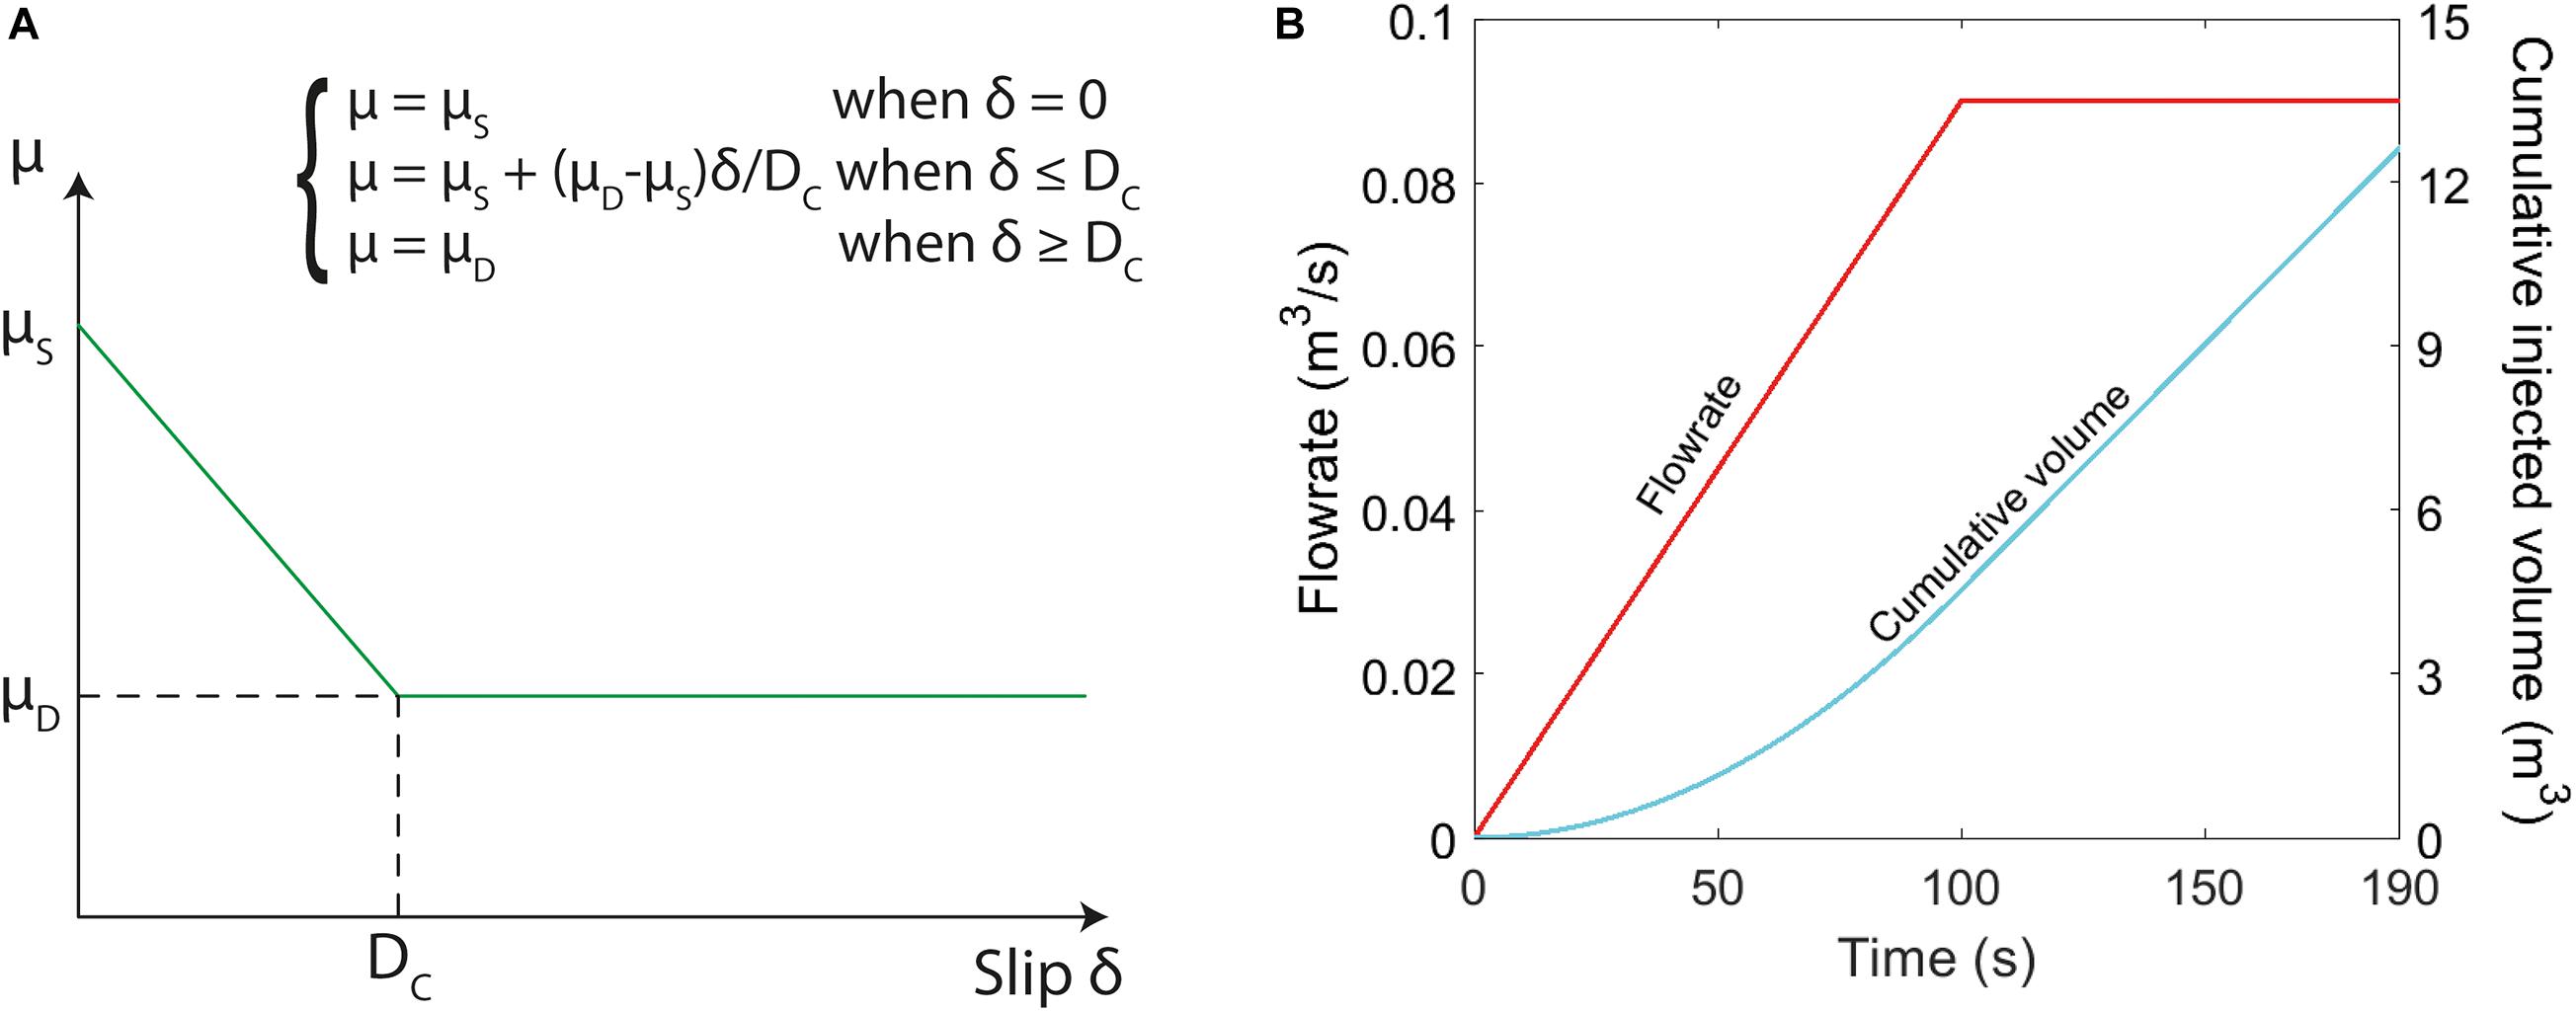
Figure 2. (A) Linear slip-weakening friction with slip (δ), static friction coefficient (μS), dynamic friction coefficient (μD), and critical slip distance (Dc). (B) Cumulative injected fluid volume and flowrate vs. time applied at injection in the fault.
In our modeling, the use of a linear slip-weakening friction law reflects of a simplified approach of fault slip and earthquake rupture modeling. However, for simplicity, the slip-weakening friction is here preferred to the more sophisticated rate-and-state friction law as our model is used to show a series of few seismic events in a large aseismic rupture (Wynants-Morel et al., 2020).
Model Set-Up: Geometry, Physical Properties, and Boundary Conditions
Our objective is to study the effect of fault physical properties on the distribution of seismic events and the seismic-to-total partitioning during fluid injection in a single fault, at a typical depth of storage reservoirs (3 km). This fault, with a dip angle of 70°, is 106 m long and 100 m large, along dip and strike, respectively. Around the fault, the rock medium is elastic and impervious (Figure 1). In the parametric analysis, we consider a reference case from which the other simulations differ by varying one parameter (Table 2).
We apply constant principal stresses to the model (σzz = 81 MPa, σxx = σyy = 70 MPa), which vary with depth through a lithostatic gradient due to gravity (g = 9.81 m/s2). We then test different initial stress state, varying the SCU of the fault between 53 and 71%. In order to do so, we add a deviatoric stress component σxy that varies between 13.5 and 18.5 MPa. It allows us to keep the normal stress constant among the tests and change the shear stress only. Before injection, we apply an initial fluid pressure (P0) of 30 MPa, which varies with depth with a hydrostatic gradient.
To activate the fault, we consider a fluid injection at the center of the fault (Figure 1). The applied flowrate linearly increases during the first hundred seconds of injection and it is then kept constant at a value of 0.09 m3/s (Figure 2B). This short-duration, high-rate injection leads to a fast pressurization of the fault at the injection point. Nonetheless, considering a single small injection point may not be pertinent in certain operational injection scenarios such as saltwater disposal where multiple wells are generally used. The simulations are stopped when the rupture over the fault reached a fixed distance from injection point (corresponding to 38 m and 76% of the length of the fault). Therefore, the simulation duration differs among tests, and lasts 190 s in our reference case (Figure 2B). However, considering an imposed rupture size implies that the behavior of the seismicity is well-represented at short distances from the injection, and therefore for very short duration lengths.
We set elastic properties for rocks to typical constant values for sedimentary material (Table 1). These values are standard in crustal reservoirs, as for instance in Oklahoma, a region of pronounced injection-induced seismicity (Barbour et al., 2017). We test different values of dilation angle (Table 2), which are consistent with previous simulations (Segall et al., 2010; McClure and Horne, 2011; Guglielmi et al., 2015b). Several values of fault initial permeability are also tested. Nonetheless, the considered values are very high, to explore the behavior of highly conductive channels that can be observed in subsurface reservoirs (Jeanne et al., 2012).
We consider a classical static friction coefficient for faults at crustal conditions (μS = 0.6; Byerlee, 1978). We then test different values of the dynamic friction coefficient μD in the range 0.375–0.475. The critical slip distance Dc also varies between 5 and 80 μm. Such values are consistent with laboratory observations (Marone, 1998; Rubino et al., 2017). No fault healing is considered as test durations are small in this study, and also because healing is not well-known during fluid injection.
In a simulation, the evolution of fluid pressure, fault opening, fault slip, stress, friction, and hydraulic aperture are monitored. Seismic ruptures are detected using a typical threshold on the slip velocity from Cochard and Madariaga (1994):
where cS is the shear wave speed (m/s) and G is the rock shear modulus (Pa). Usual velocity threshold values from literature go from 0.1 mm/s to 0.1 m/s (McClure and Horne, 2011; Gischig, 2015; McClure, 2015). We adopt here a 1 mm/s threshold.
Neighboring grid cells that show subsequent seismic slip velocities during an overlapping period of time are then grouped to form seismic events when at least seven cells are regrouped (Wynants-Morel et al., 2020). The seismic event stops when the slip velocity of the last cell drops under the threshold. Non-seismic ruptures are considered aseismic. At the end of a simulation, the location, timing and moment magnitude of seismic events are estimated using the criteria described in Wynants-Morel et al. (2020).
Results of the Parametric Study
This section presents the modeling results of the spatiotemporal evolution of injection-induced seismicity for different levels of five fault parameters.
Generalities in the Spatiotemporal Repartition of Seismic Events
First, we examine the common set of hydromechanical and seismological features between the 21 injection tests considered in our study. The first rupture occurred at the injection point, then the rupture starts expanding radially on the fault (Wynants-Morel et al., 2020). The resulting fault slip patch has an elliptic shape elongated in the maximal shear stress direction (Figure 3). Oppositely, the fluid diffuses with a circular shape in all cases (Wynants-Morel et al., 2020). The induced deformation is a combination of aseismic slip and seismic events. The maximum aseismic slip is located at the injection point (4.1–18.0 mm, depending on the simulation), and decreases progressively when getting closer to the rupture edge. Induced by the fluid injections, some seismic events occurred. In the simulations, a minimum threshold for the moment magnitude of seismic events has been fixed to –1.6 to have rupture on patches greater than 6 grid cells. This limit is equivalent to a detection threshold for induced seismicity recorded at reservoir-scale (e.g., Kwiatek et al., 2019). Thus, the distribution of seismic slip on the fault is sparse (Figure 4). We observe 7–73 events, depending on the test, with magnitude ranging from –1.6 to 0.3. Cumulated seismic slip is smaller than a few tens of microns (0.114–0.383 mm, depending on the simulation). It is 20–128 times smaller than the maximum aseismic slip (0.413–1,800 mm). Therefore, the calculated deformation is mostly aseismic, with at most 4% of the total moment that is seismic. This result is consistent with independent seismological observations in both in-situ decametric-scale and small-scale laboratory experiments (e.g., Goodfellow et al., 2015; De Barros et al., 2018). As the rupture is stopped at a fixed distance from injection, the ruptured area and final aseismic moment are very similar for all simulations.
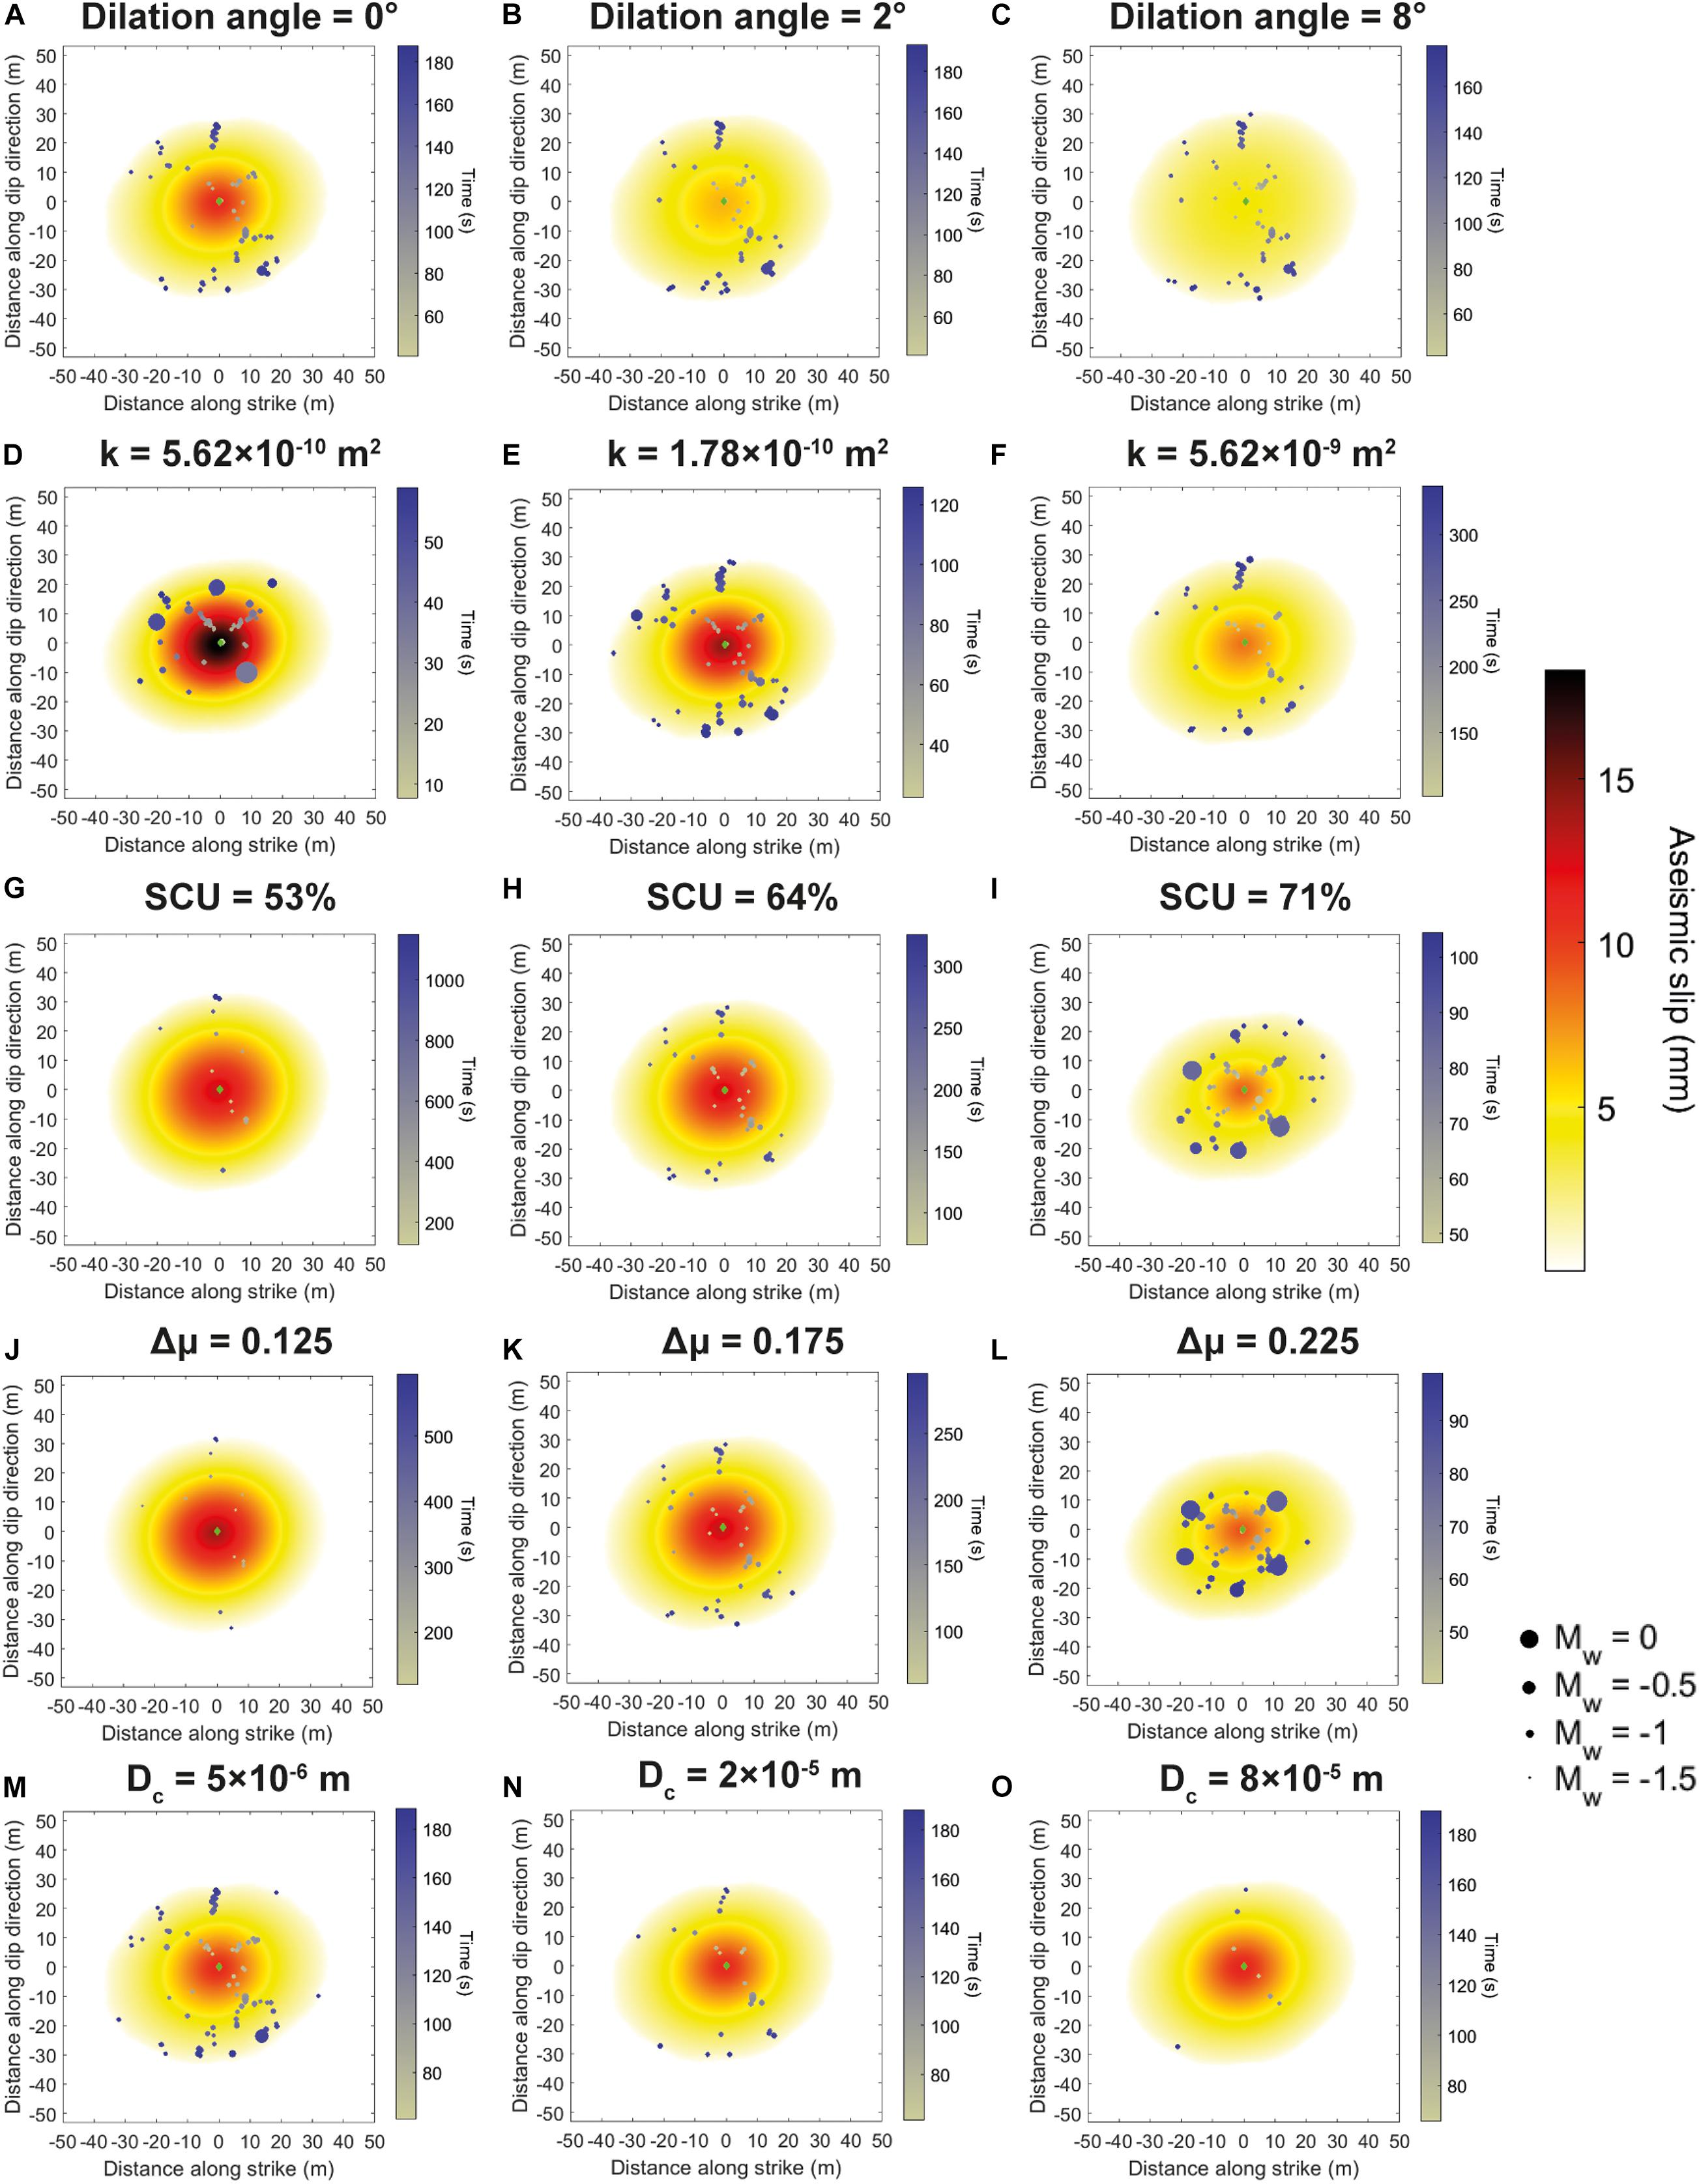
Figure 3. Aseismic slip on the fault at the end of the simulations for various dilation angles (A: 0°; B: 2°; C: 8°), permeabilities (D: 5.6 × 10⁻¹⁰ m2; E: 1.8 × 10⁻⁹ m2; F: 5.6 × 10⁻⁹ m2), stress criticalities (G: 53%; H: 64%; I: 71%), friction drops (J: 0.125; K: 0.175; L: 0.225), and critical slip distances (M: 5 × 10⁻⁶ m; N: 2 × 10⁻⁵ m; O: 8 × 10⁻⁵ m). The seismic events generated during the test are represented by black disks whose size is function of their magnitude.
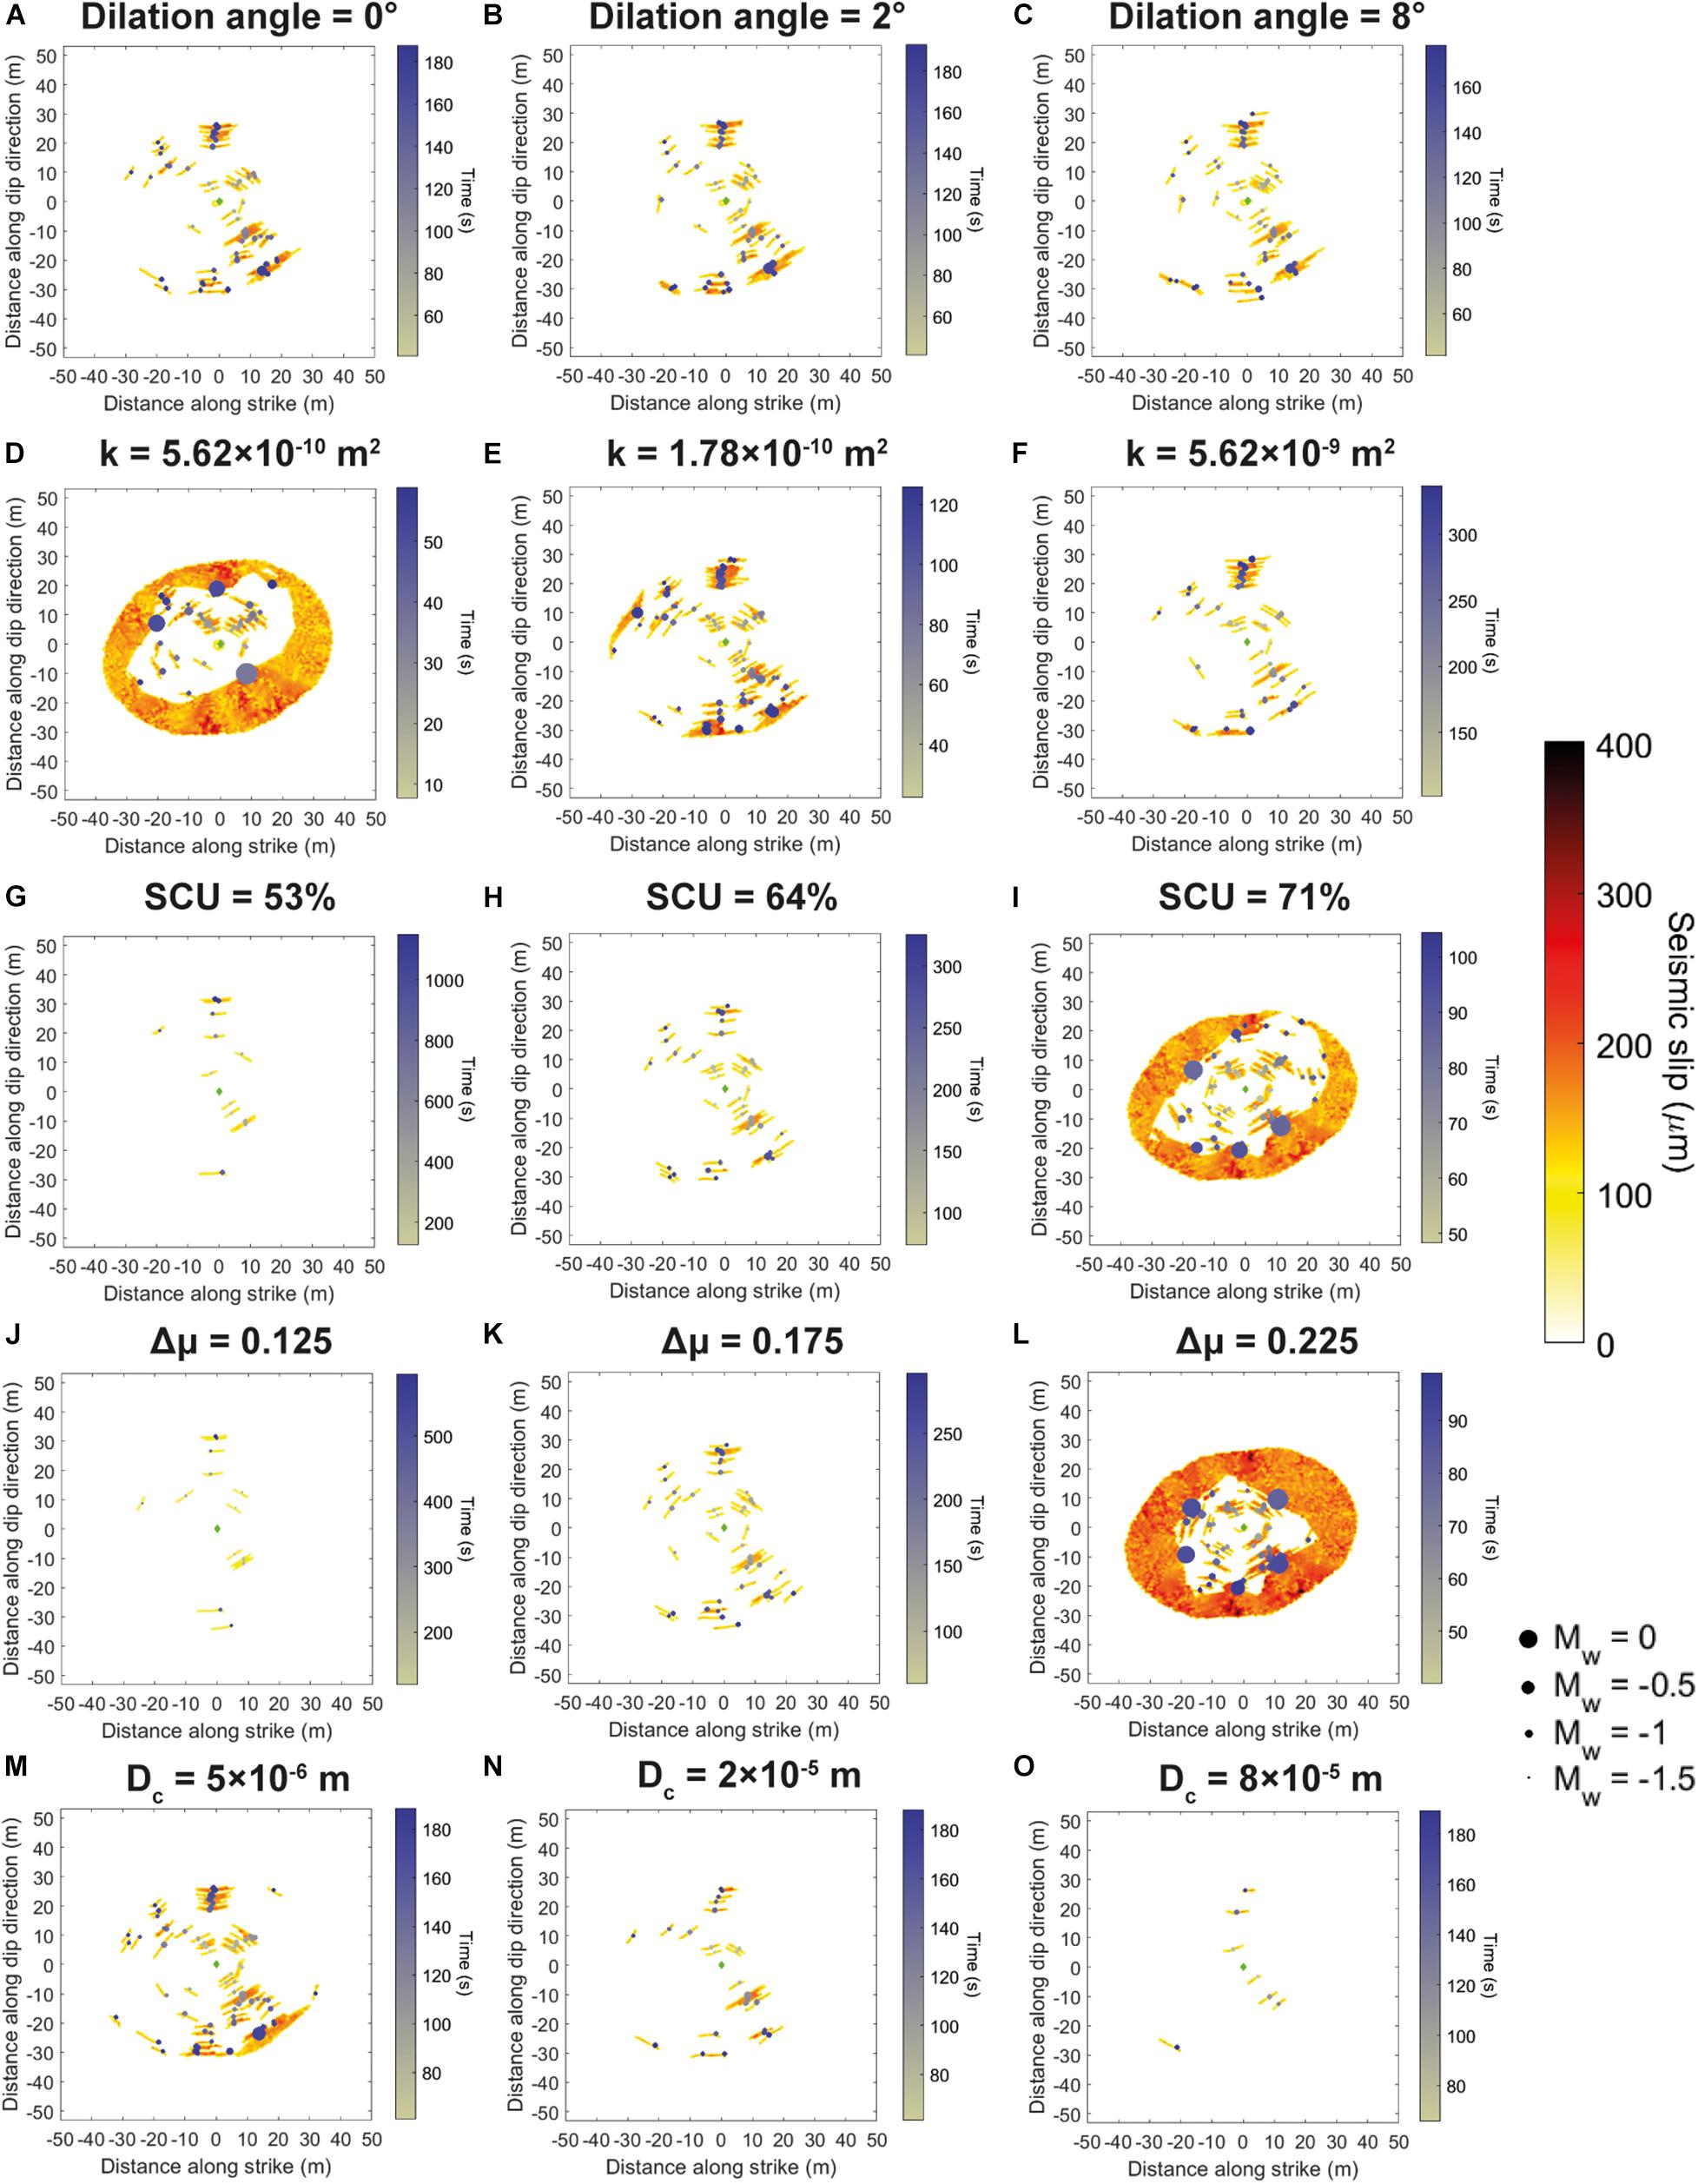
Figure 4. Seismic slip on the fault at the end of the simulations for various dilation angles (A: 0°; B: 2°; C: 8°), permeabilities (D: 5.6 × 10⁻¹⁰ m2; E: 1.8 × 10⁻⁹ m2; F: 5.6 × 10⁻⁹ m2), stress criticalities (G: 53%; H: 64%; I: 71%), friction drops (J: 0.125; K: 0.175; L: 0.225), and critical slip distances (M: 5 × 10⁻⁶ m; N: 2 × 10⁻⁵ m; O: 8 × 10⁻⁵ m). The seismic events generated during the test are represented by black disks whose size is function of their magnitude.
To better understand the relationship between seismicity, fluid pressure and shear stress, we represent the seismicity in a distance-time diagram (or r-t plot) (Figure 5). The pressure front, defined by an overpressure of 5% compared to the hydrostatic level, follows a diffusion curve of the form r = √4πDt (Shapiro et al., 1997) where D is a diffusivity coefficient (m2/s). As the fault friction reduces with slip (i.e., slip-weakening), when the rupture occurs, the slipping patch has a residual shear stress lower than the initial one, and is surrounded by an area with increased stress. We therefore define the shear stress front as the peak of stress at the edge of the slipping area. Since the rupture zone has an elliptical shape, the distance from the shear stress front to the injection varies with the angles on the fault. Therefore, in a r-t plot, the shear stress front varies within a band that gets wider as the rupture grows with time (Figure 5). The rupture front is defined as the largest distance of the shear stress front. We observe that the seismicity always occurs on the shear stress front and does not follow the pressure front (Figure 5). The shear stress front may or may not outpace the pressure front. When it does, the seismic front accelerates, and tends to have a constant or increasing migration velocity. This migration velocity corresponds to the propagation velocity of the aseismic rupture. A pronounced acceleration of the seismic moment rate is observed at the same time. This feature is observed for large SCU and friction drop tests (Figures 5I,L). On the contrary, when the shear stress front stays behind the pressure front, the seismic migration velocity slows down, and shows a diffusive shape.
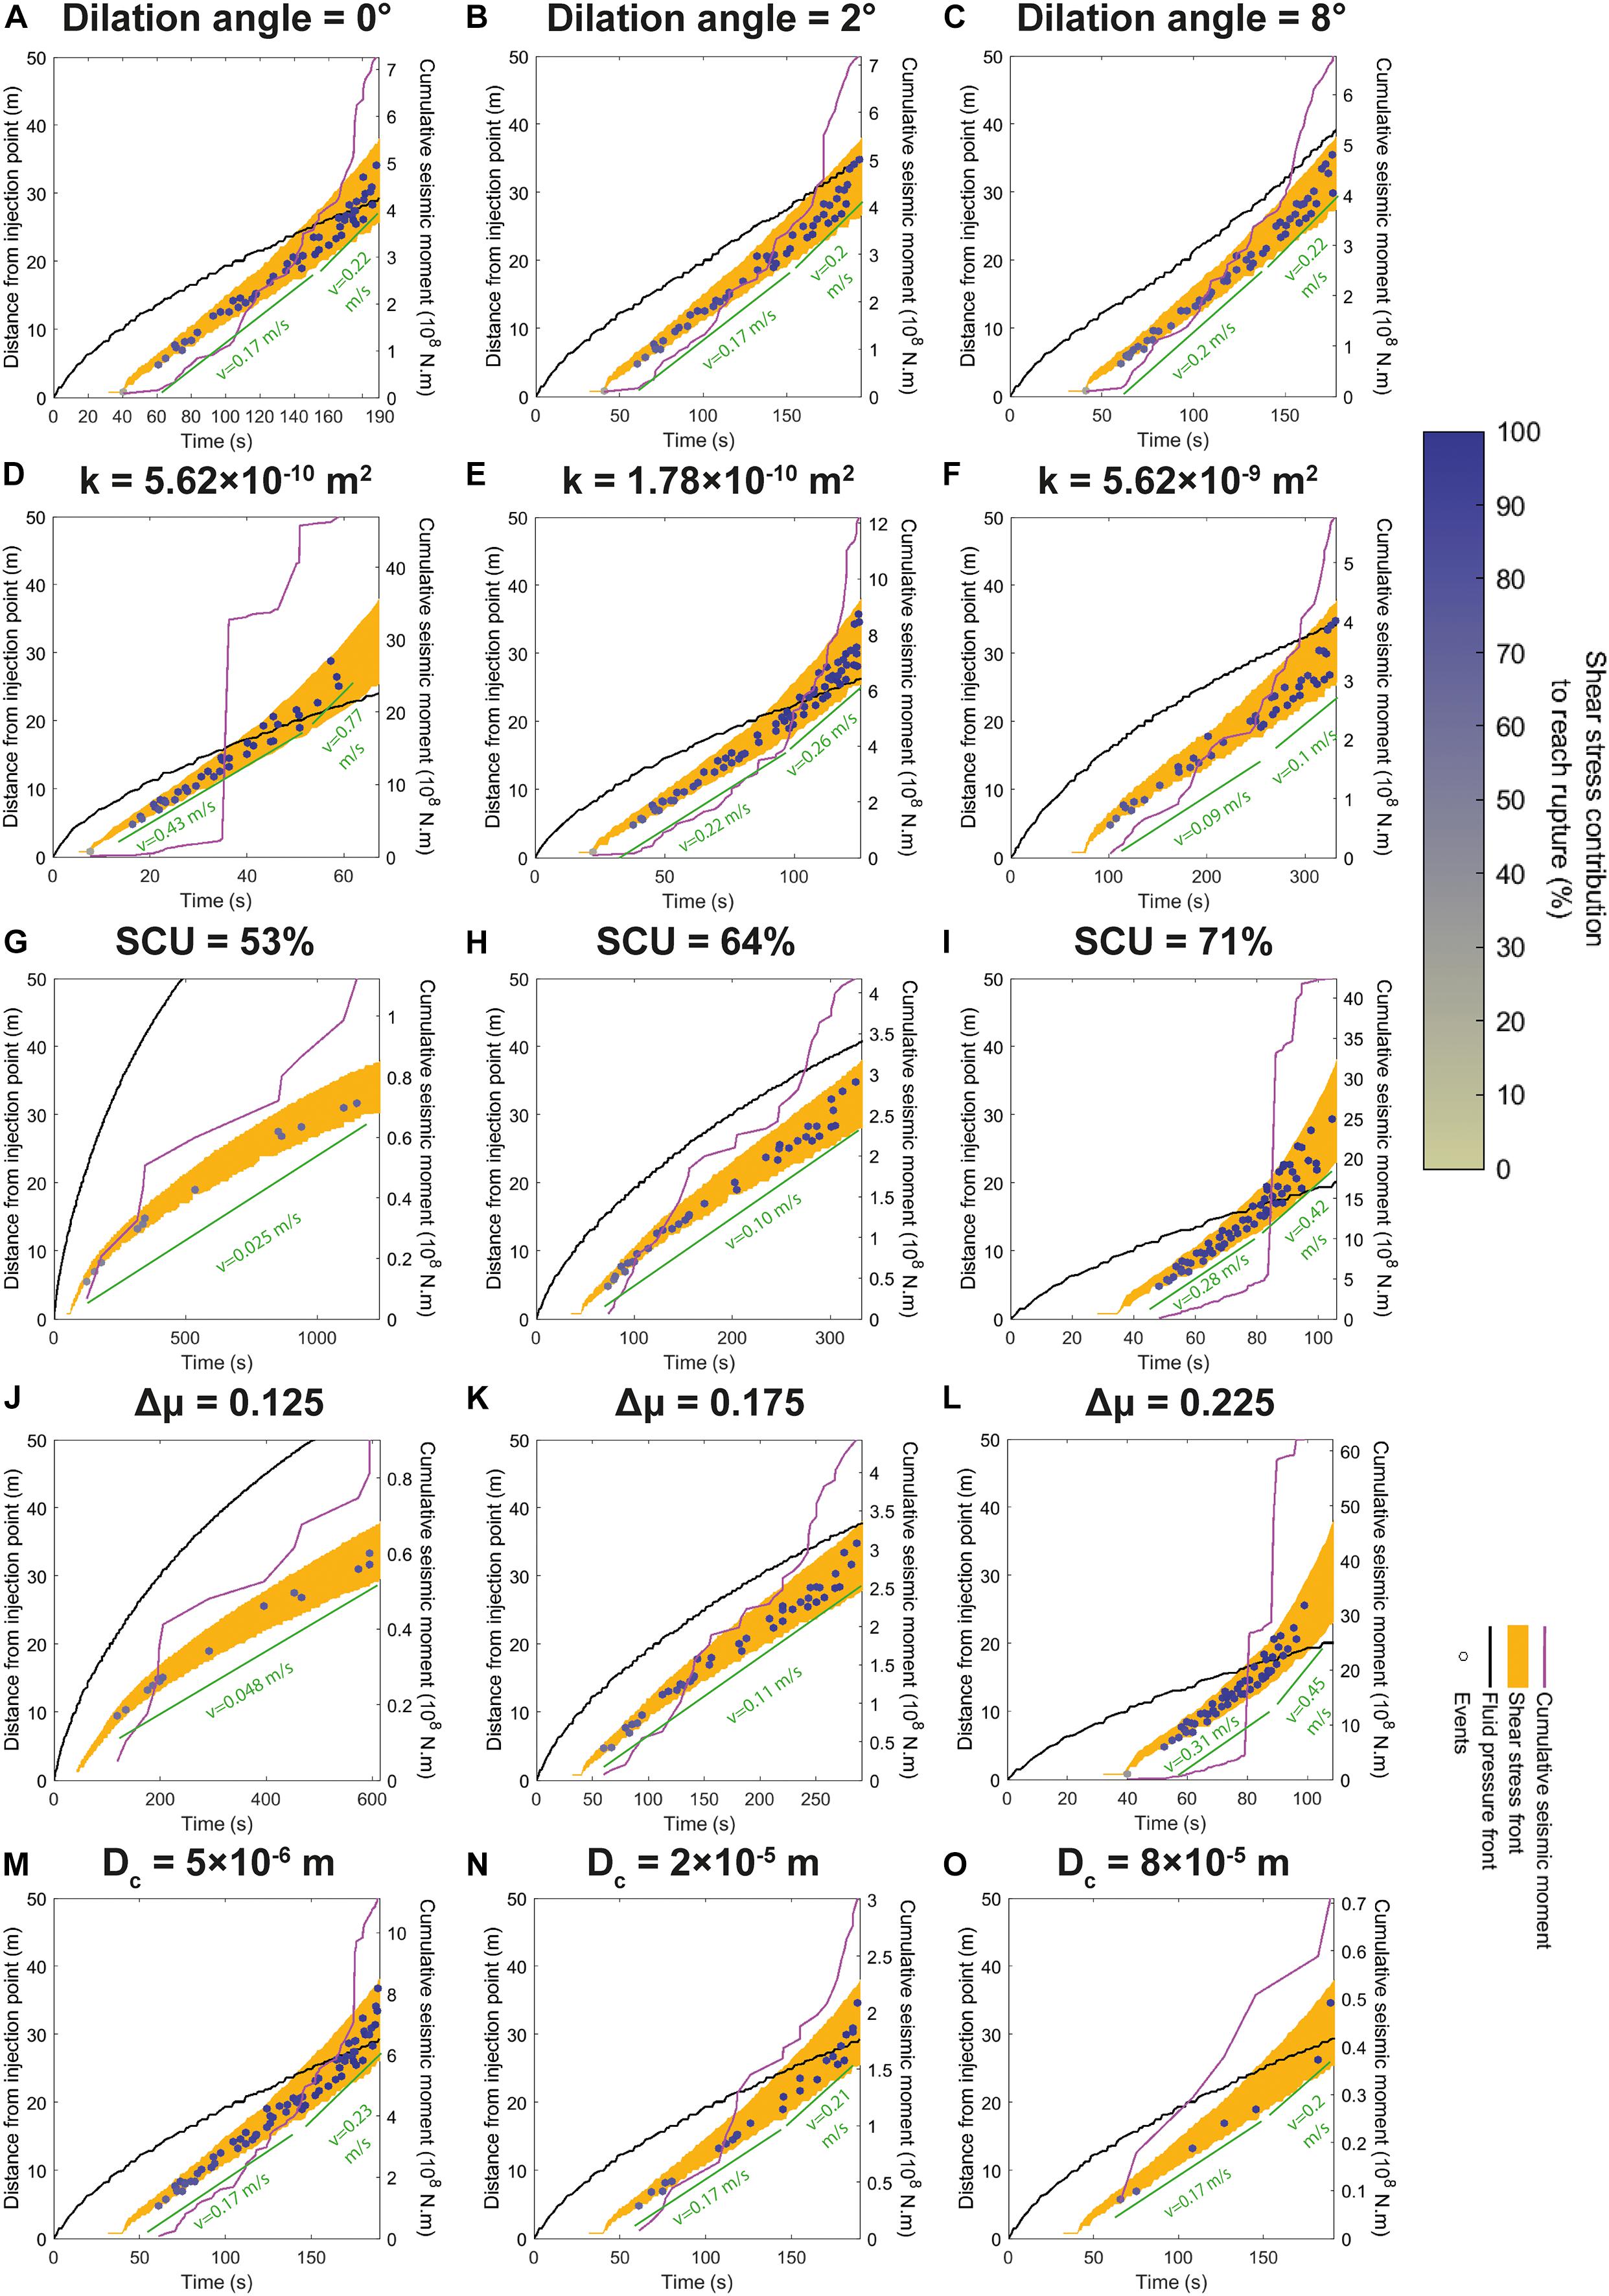
Figure 5. Distance between seismic events and injection point as a function of their time of occurrence for various dilation angles (A: 0°; B: 2°; C: 8°), initial permeabilities (D: 5.6 × 10⁻¹⁰ m2; E: 1.8 × 10⁻⁹ m2; F: 5.6 × 10⁻⁹ m2), stress criticalities (G: 53%; H: 64%; I: 71%), friction drops (J: 0.125; K: 0.175; L: 0.225) and critical slip distances (M: 5 × 10⁻⁶ m; N: 2 × 10⁻⁵ m; O: 8 × 10⁻⁵ m). The seismic events are represented by disks whose color is function of the shear stress transfer contribution (SSC) to reach rupture for each event. The cumulative seismic moment during the simulation is shown in magenta. The pressure front is defined as a black line, the shear stress front is represented in orange. The green straight line below seismicity indicates the mean migration velocity of seismic events. Note that time and moment scales differ among panels.
In this study, injection is flowrate-controlled. Thus, time and injected volume are interdependent (Figure 2B). Since the test duration evolves with the initial permeability, the friction drop and the SCU (Figures 5D–L), the injected volume needed to reach a same rupture size depends on these three fault properties. Moreover, since the rupture front at the end of the simulation is fixed, an increase in the test duration implies a decrease in the migration velocity of the shear stress and seismicity fronts.
The shear stress contribution required to induce failure (SSC, Eq. 4) is calculated to quantify the respective contribution of shear stress and fluid pressure in the triggering of seismic events. It increases with time and distance to injection (Figure 5). In 10 out of 21 simulations, the first 1–to–3 seismic events have a SSC under 50% during each test, which means they are mostly triggered by fluid overpressure. In the other simulations, the SSC is always between 50 and 99%, which corresponds to seismic events dominantly triggered by shear stress variations.
Influence of Fault Physical Properties on the Fault Sismo-Hydromechanical Responses
Variations in the SCU and friction drop lead to very similar behaviors (Figures 5G–L). First, increasing SCU or friction drops, leads to smaller fluid injected volume, and smaller test durations, without any changes in the pressure front shape (Table 3). For small SCU or friction drop, the shear stress front and thus the seismicity stay behind the pressure front. The seismicity migrates with small velocities (less than 0.1 m/s) which slow down with time (Figure 6F). For larger values, the shear stress front is first behind the pressure front, before accelerating and outpacing it. Therefore, the seismic migration velocity increases with increasing SCU or friction drop. The shear stress contribution (SSC, Eq. 4), the number of seismic events and the cumulative seismic moment at the end of injection also increase with increasing SCU and friction drop (Figures 6D–E, 7). Therefore, the seismic-to-total moment ratio also increases with increasing SCU (from 0.040 to 3.2%) and friction drop (from 0.034 to 4.2%).
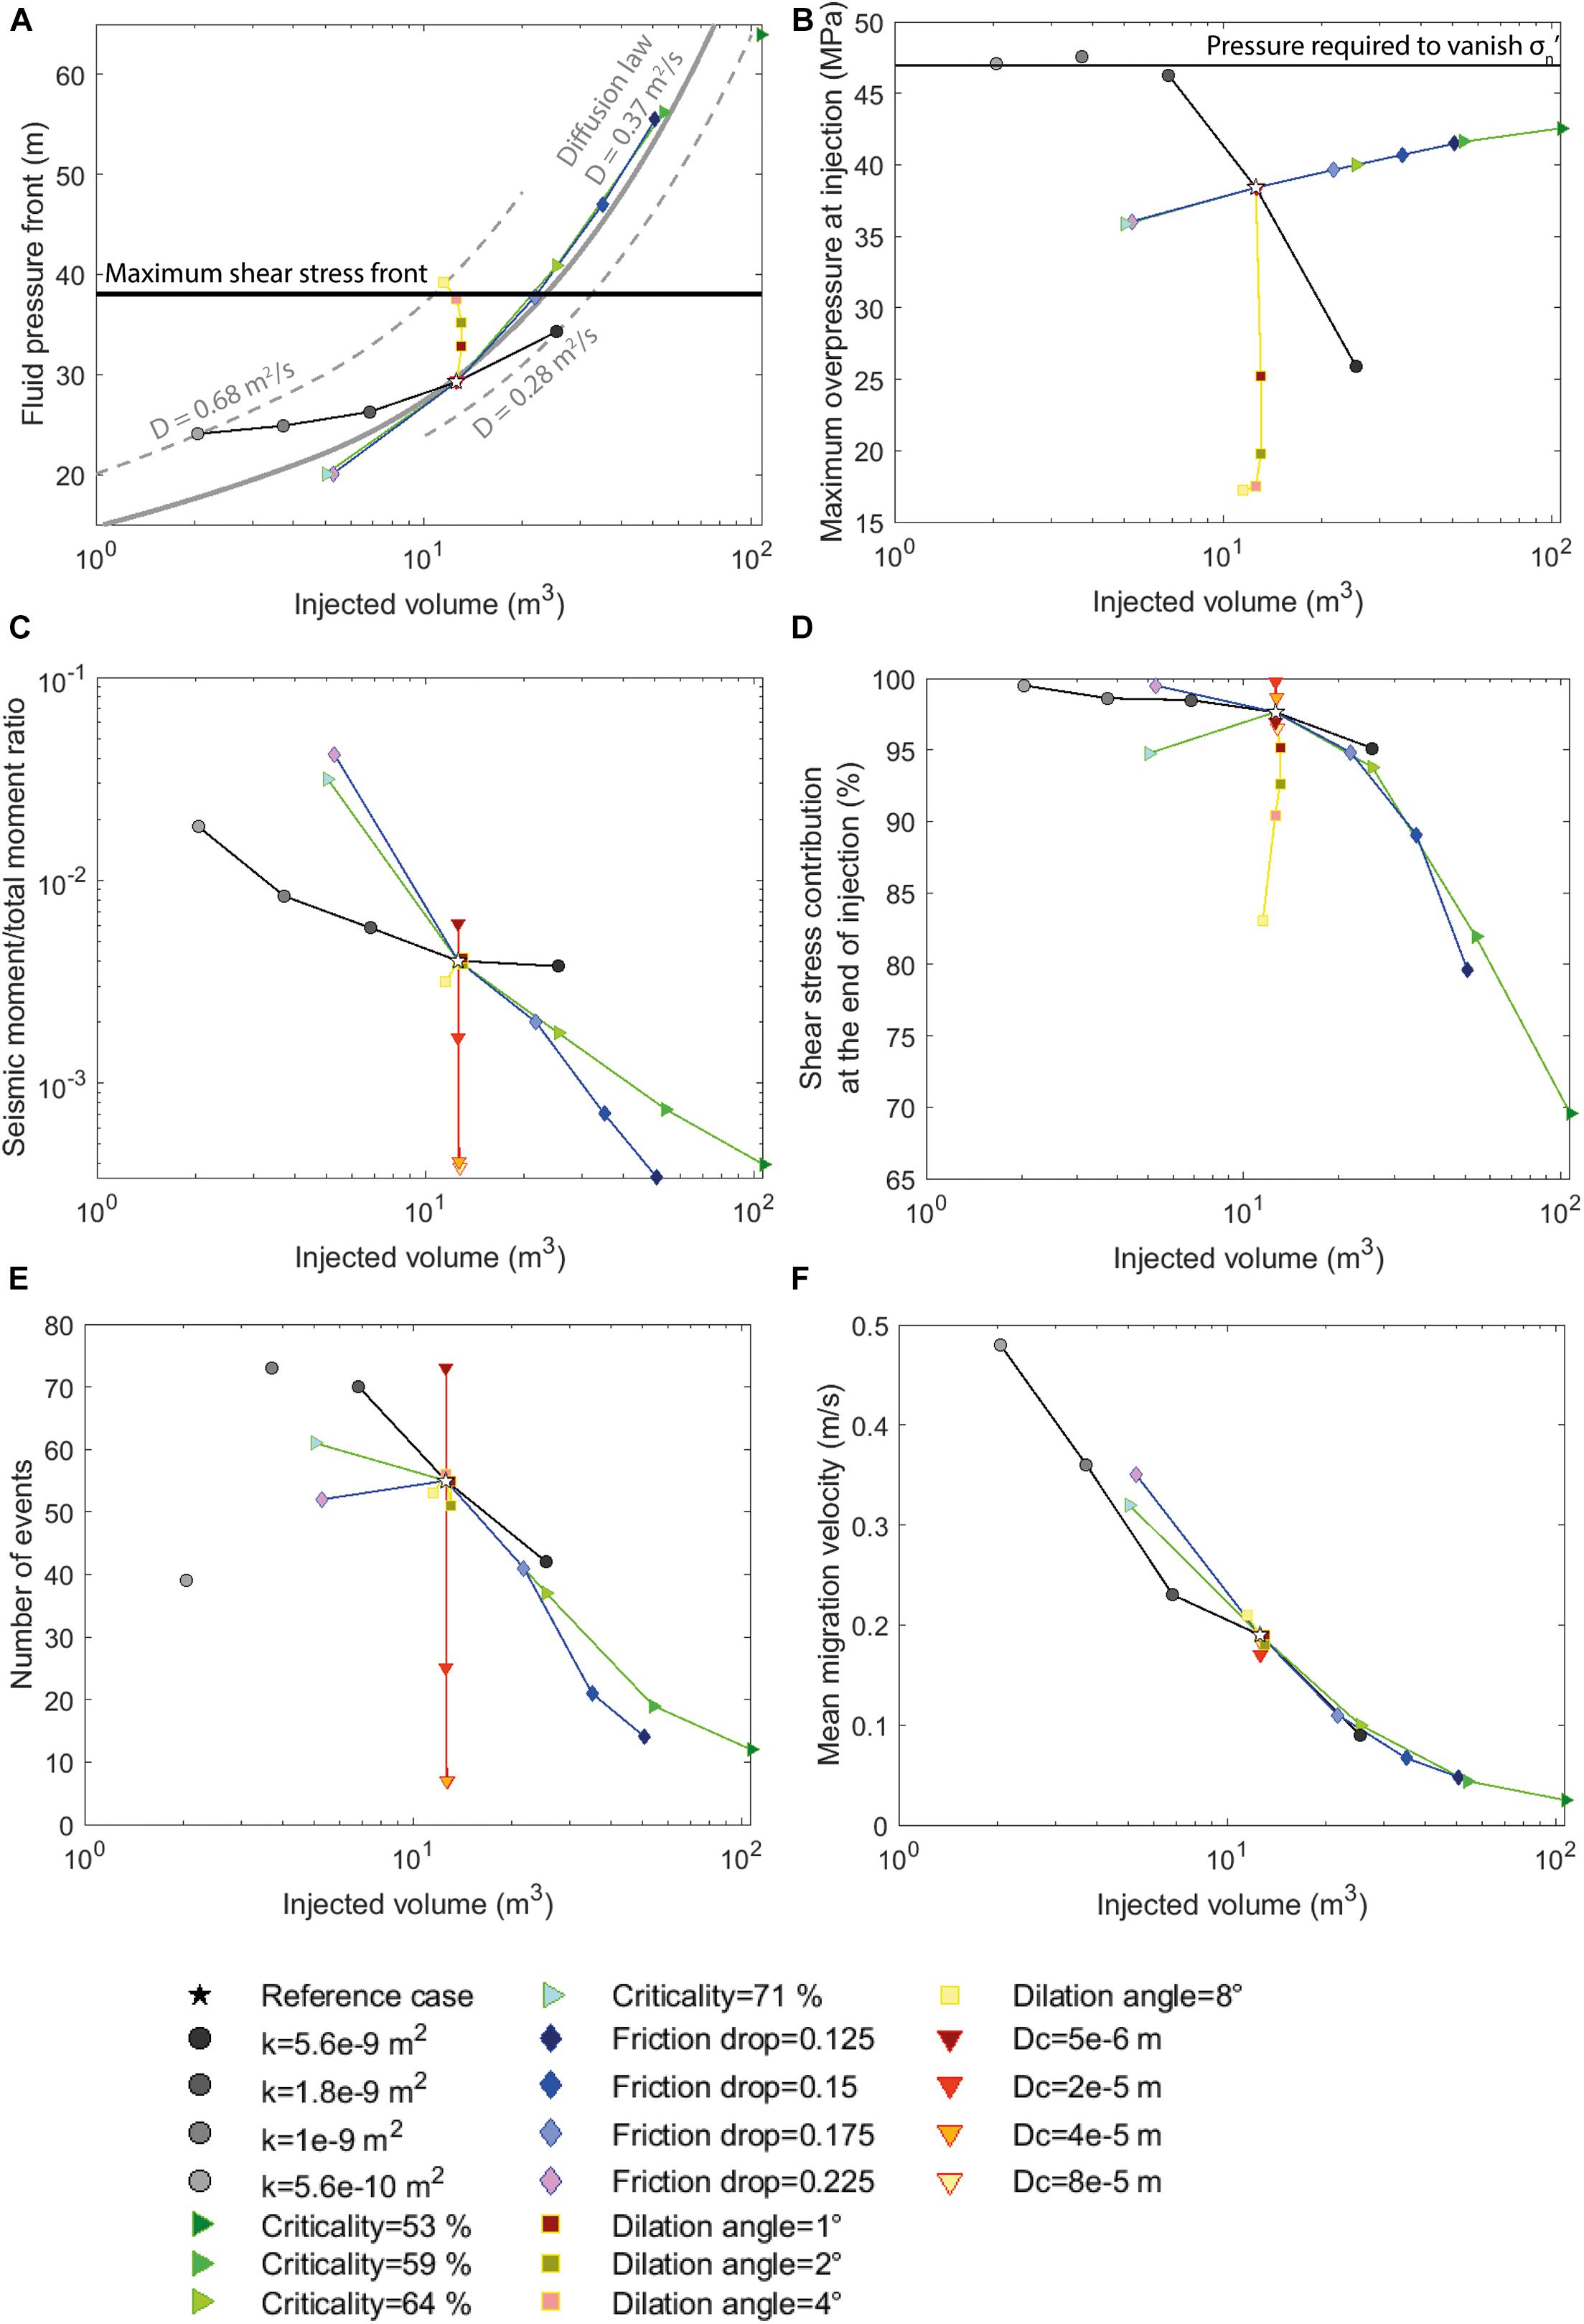
Figure 6. (A) Fluid pressure front, (B) maximum overpressure at injection, (C) seismic-to-total moment ratio, (D) shear stress contribution, (E) number of seismic events, and (F) mean migration velocity as a function of total injected fluid volume for the 21 simulations. Each simulation is defined by a color and a symbol. The reference case is represented by a star. Injection tests with a same varying parameter are linked by a single-colored line. In panel (A), the black horizontal line shows the position of the maximum shear stress front (fixed for all tests at 38 m from injection point) and the gray curves show theoretical diffusion profiles where D is the hydraulic diffusivity.
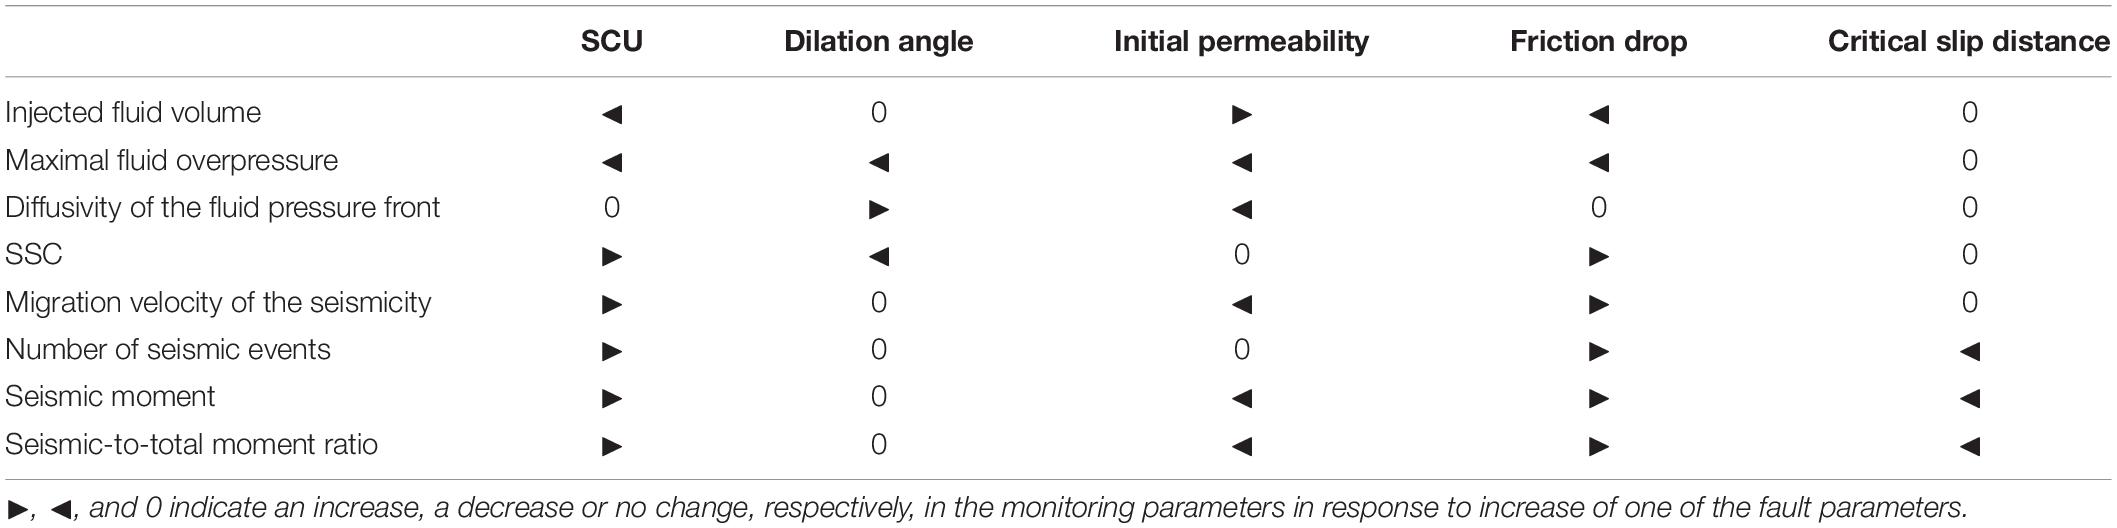
Table 3. Summary of the main modeling results of the sensitivity analysis.
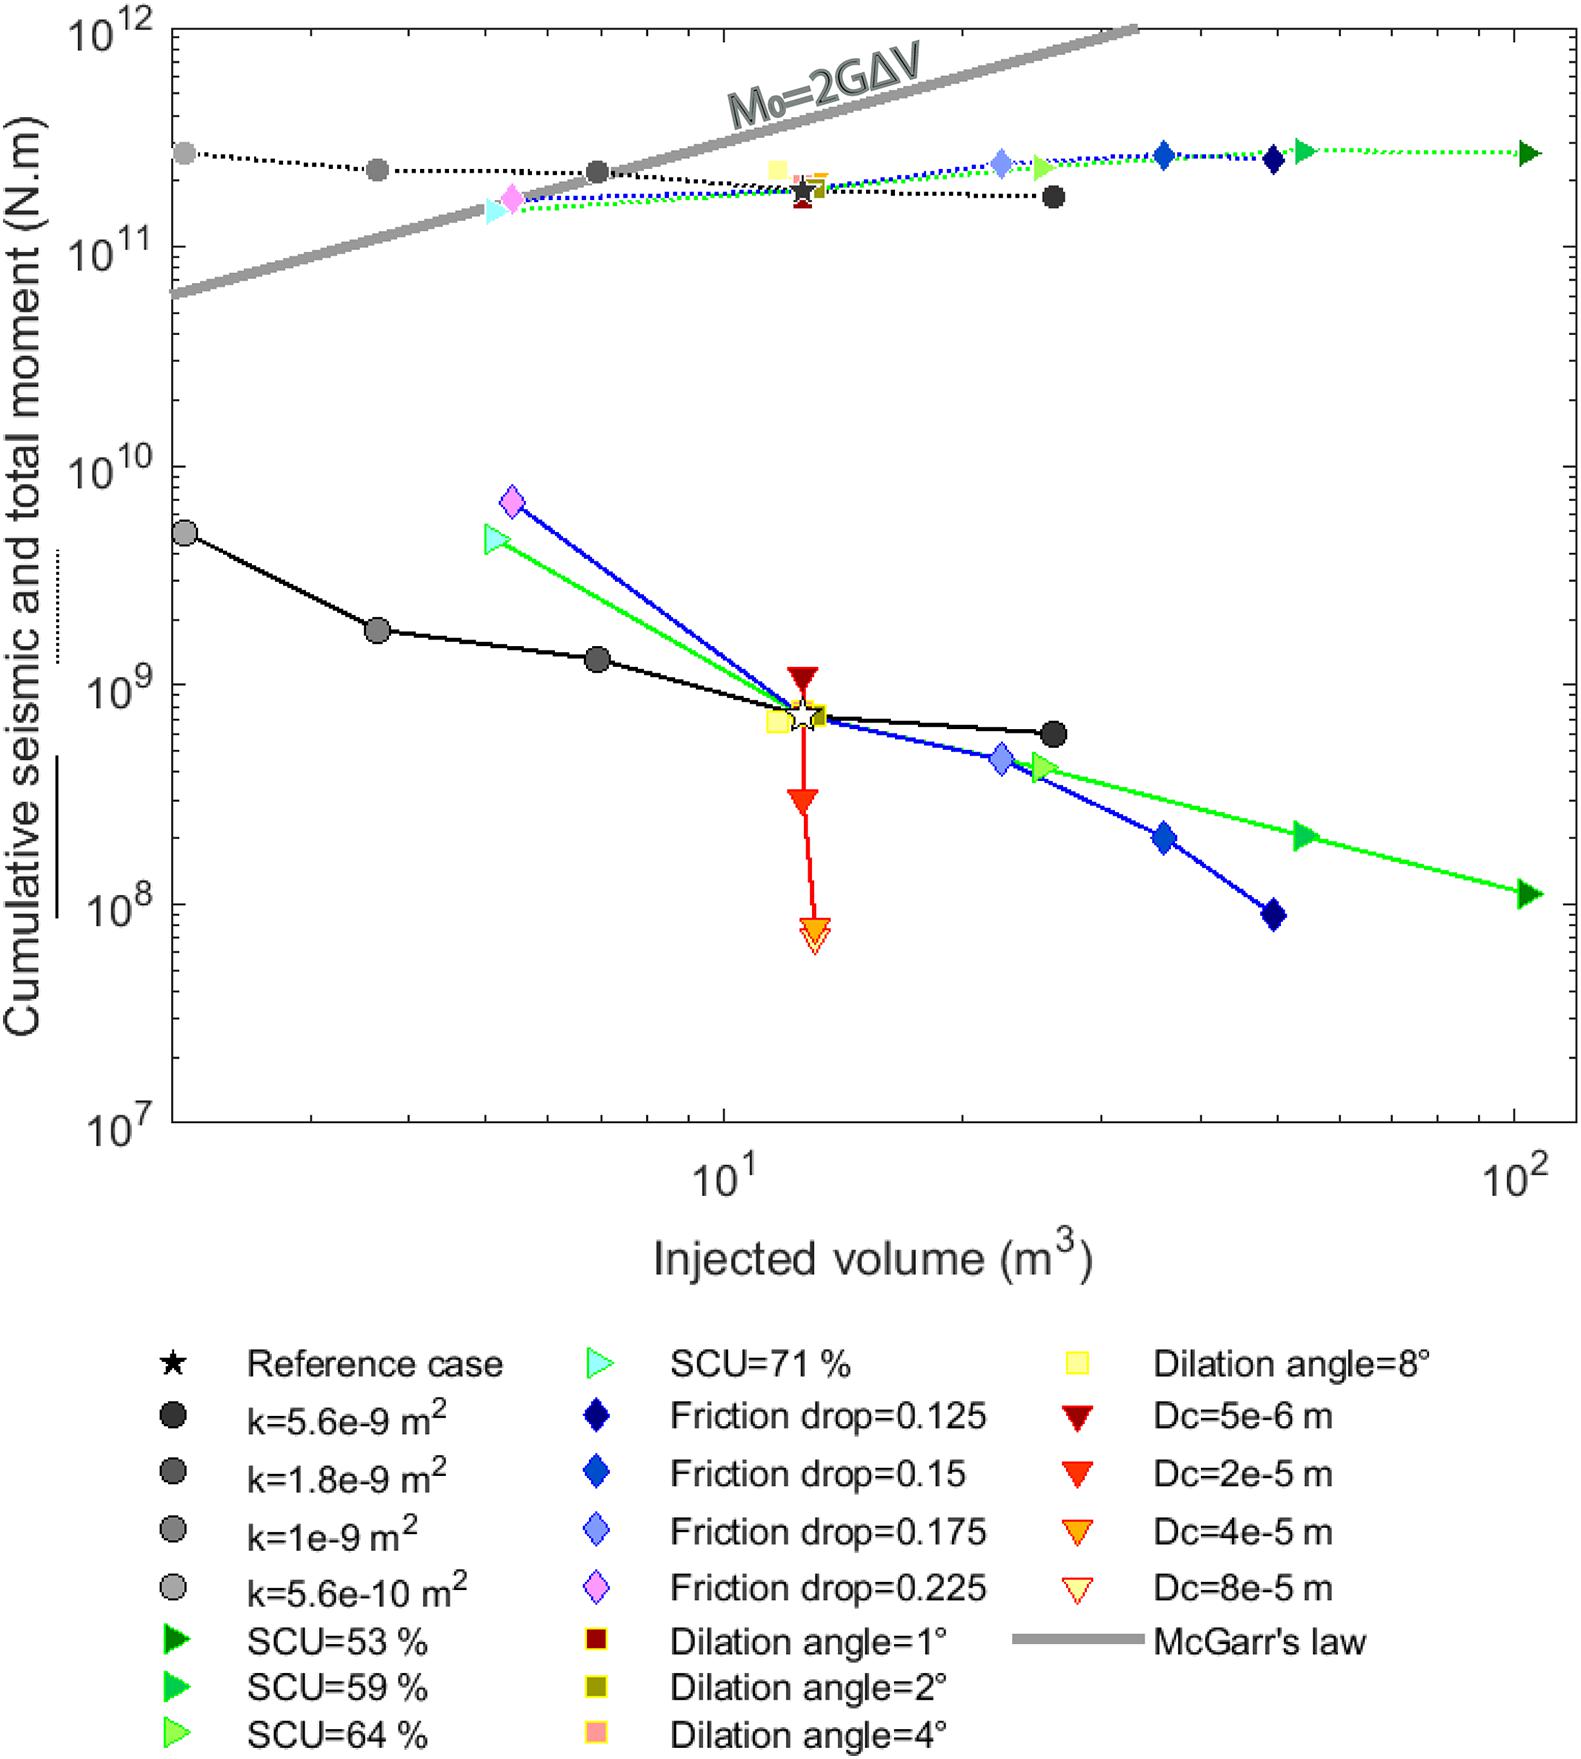
Figure 7. Cumulative seismic (solid line) and total moment (dashed line) as a function of total injected fluid volume for the 21 simulations (Table 2). Injection tests with a same varying parameter are linked by a single-colored line. Each test is defined by a color and a symbol. The reference case is represented by a white (for the seismic moment) or black (for the total moment) star. The gray thick diagonal line shows the upper bound given by Eq. (5) of McGarr and Barbour (2018).
Variations among tests with different dilation angle (Figures 5A–C, 6C–E, 7 and Table 2) are not observed in the spatio-temporal distribution of the seismicity, the shear stress front, the seismic moment, the seismic-to-total moment ratio, nor in the number of events. The main differences when varying the dilation angles concern the amplitude of the fluid pressure at the injection, and the shape of the pressure front. With a null dilation angle (i.e., no shear-induced dilation), the diffusive-like pressure front reaches 29 m at the end of injection (Figure 5A), while with a 8° dilation angle, it stops following a diffusion curve near 100 s and accelerates to reach 39 m (Figure 5C). Therefore, while the stress front outpaces the pressure front for low dilation angles, it stays behind for high dilation angles.
While an increase of initial fault permeability allows a faster diffusion of the fluid, it also reduces the migration velocity of the rupture (Figure 6F) and the seismicity (Table 3). Therefore, an increase of the initial permeability leads to an increase of the injected fluid volume and test duration to reach the same rupture size (Figures 5D–F). Moreover, permeability increases in the pressurized zone during the simulation. As shown in Figure 8A, the permeability variations increase at injection point with decreasing initial permeability (from 53 to 2,500% of its initial value) and increasing dilation angle (from 108 to 1,700%). Nonetheless, the seismicity and shear stress fronts still accelerate and outpace the pressure front during the injection simulation. Increasing initial permeability also induces a decrease in the final cumulative seismic moment released during the simulation (from 47.0 × 10⁸ N.m to 5.8 × 10⁸ N.m), as well as in the seismic-to-total moment ratio (from 1.8 to 0.38%). The initial permeability mainly acts on the fluid pressure at the injection, with a change of behavior that can be observed for k = 1.78 × 10⁻⁹ m2. For smaller values, the increase of pressure at the injection leads to a null effective normal stress before the end of the simulation (Figure 6B). Therefore, a maximum number of events is reached for this value (Figure 6E).
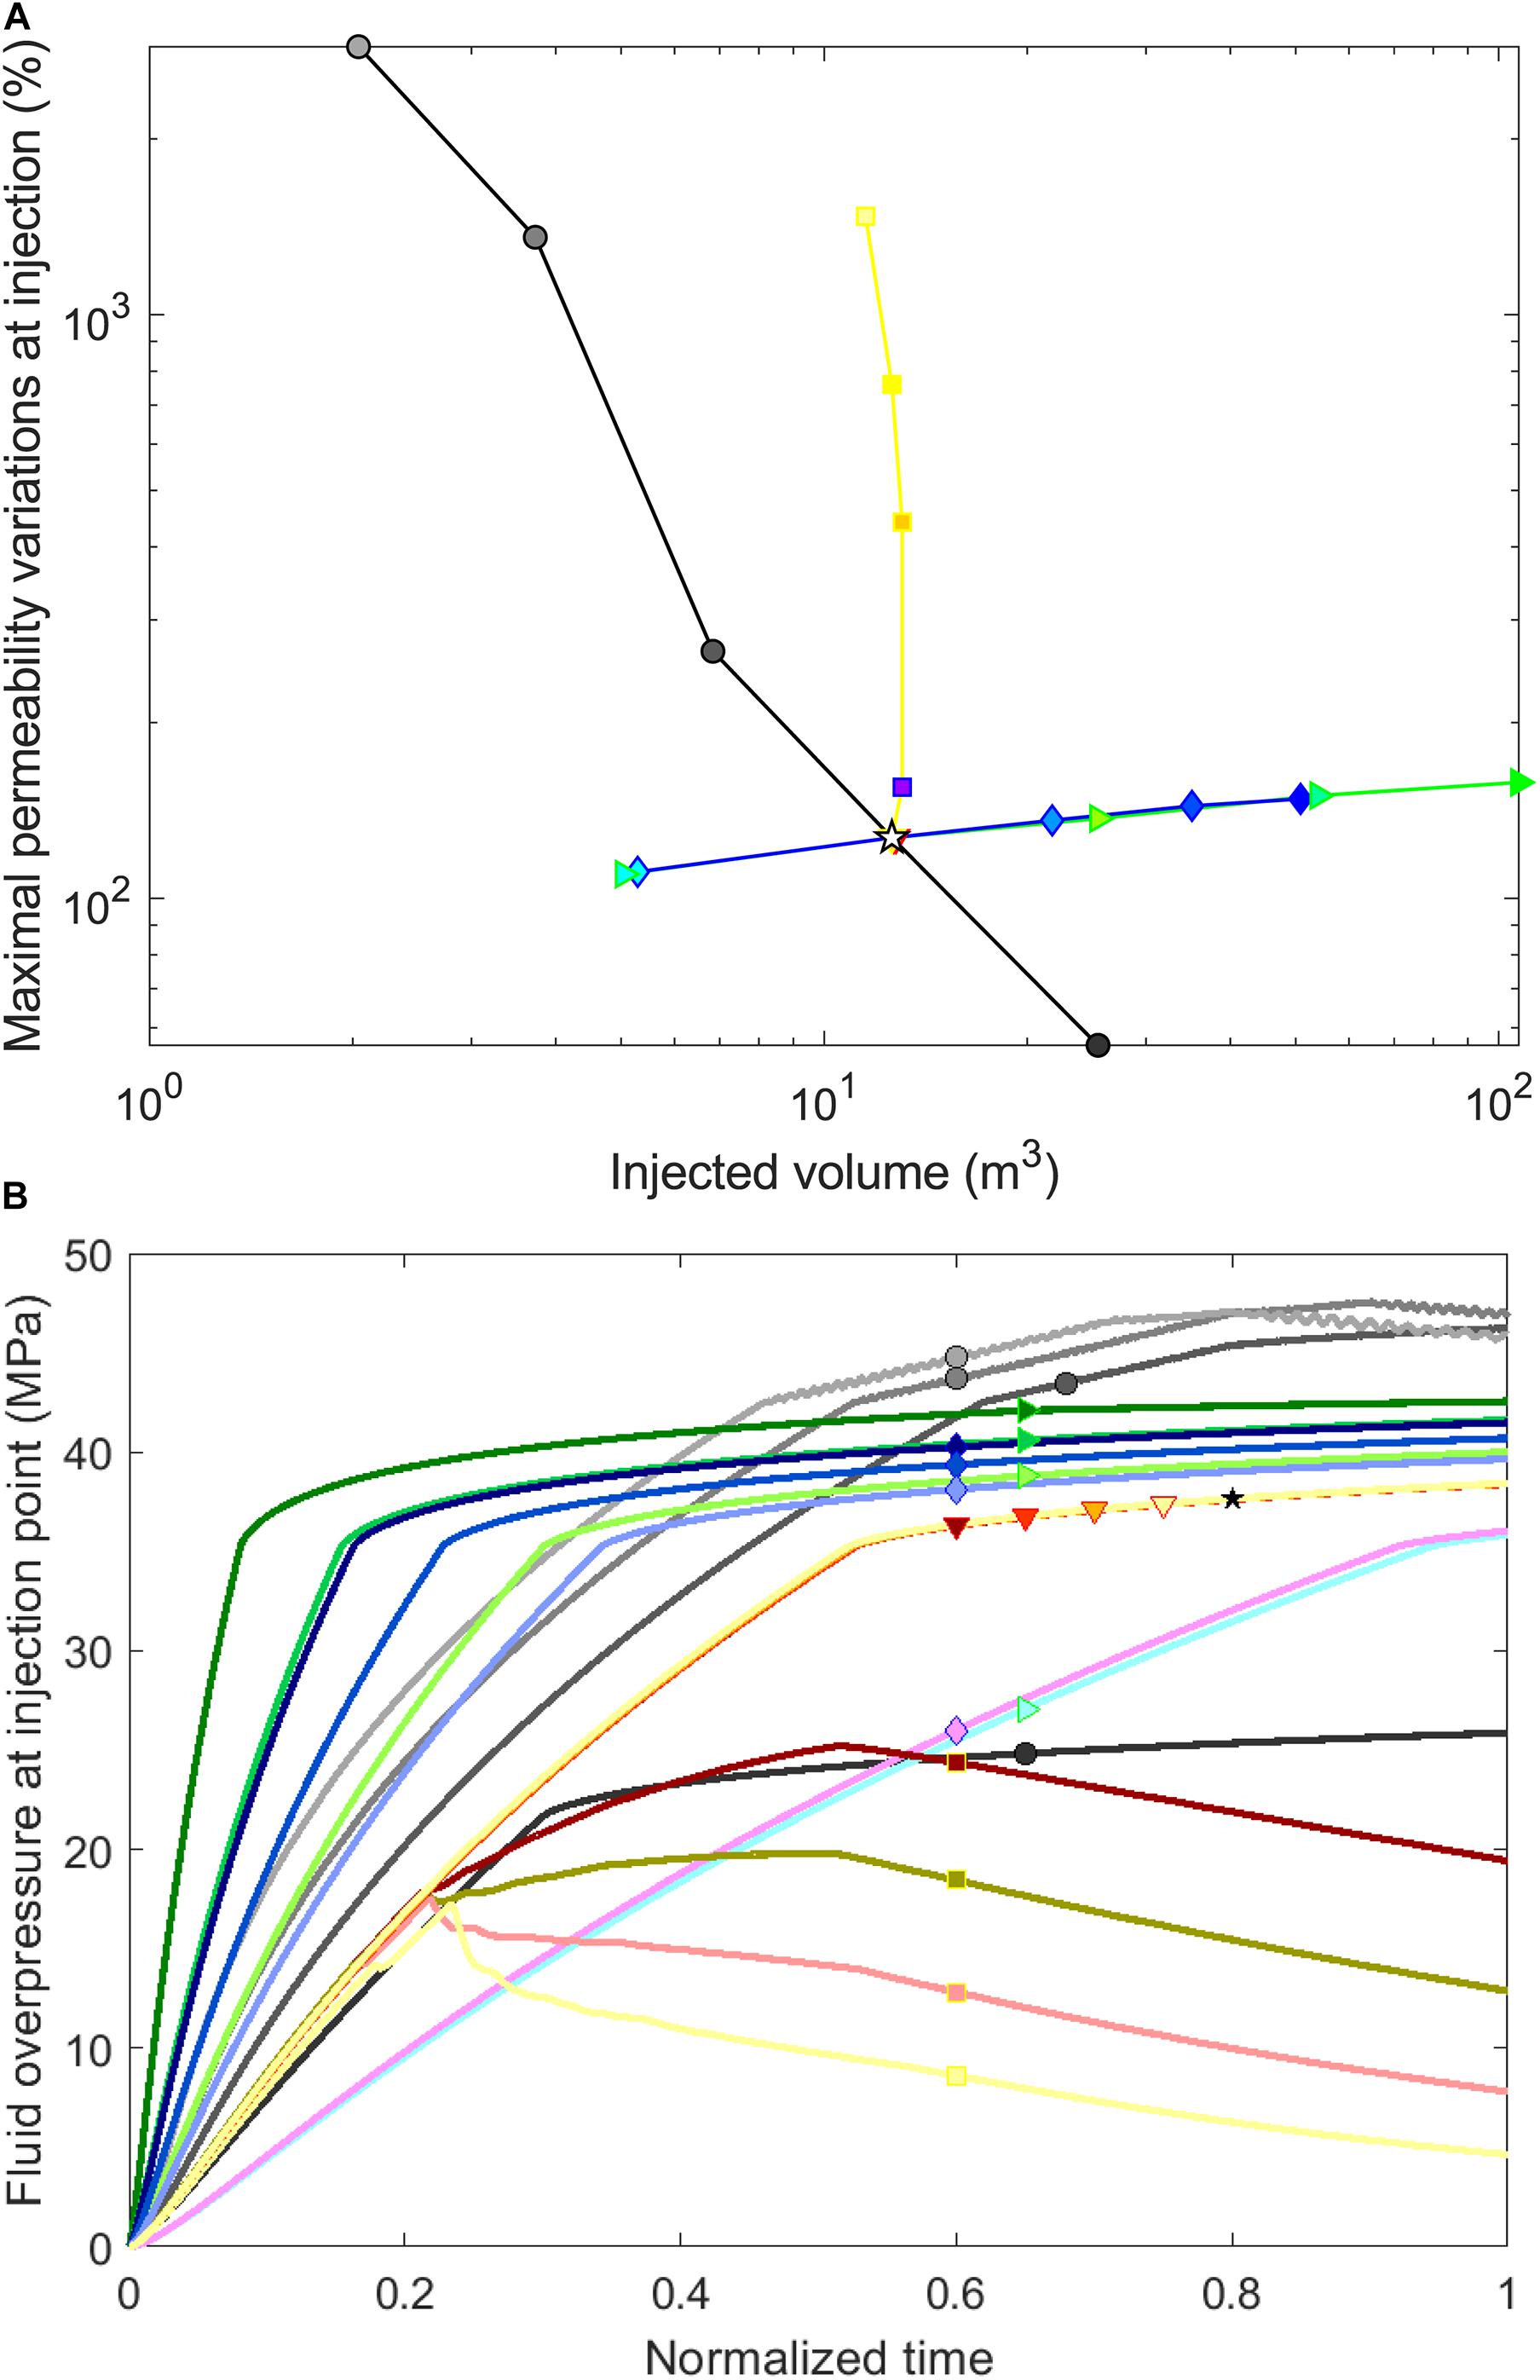
Figure 8. (A) Maximal permeability variations at the injection point as a function of total injected fluid volume for the 21 simulations (Table 2). Injection tests with a same varying parameter are linked by a single-colored line. Each test is defined by a color and a symbol. The reference case is represented by a star. (B) Fluid overpressure at injection point as a function of normalized time for the 21 simulations (Table 2). Each test is defined by a color and a symbol. The curves for the reference case, represented by a black star, and the critical slip test (down-pointing triangle symbol) are the same.
A factor of 10 increase in the critical slip distance Dc only affects the number of seismic events and the cumulative seismic moment which are, respectively, divided by 10 and 16 (Figures 6E, 7). Therefore, the seismic-to-total moment ratio is also strongly reduced when increasing critical slip distance. Neither the spatiotemporal repartition of the seismicity, the shear stress front nor the fluid pressure front are influenced by this parameter (Table 3).
Monitoring Parameters and Fault Properties
Here we examine how the operational parameters that can be monitored (i.e., injected fluid volume, seismicity) during reservoir stimulations depend on the fault properties.
First, for a same rupture size, the injected fluid volume is strongly modified by the friction drop, the SCU and the initial permeability (Figure 6), highlighting the importance of the hydromechanical coupling on the fault ruptured area. It is divided by 21.4 for a SCU multiplied by 1.3 and by 10.2 for a friction drop multiplied by 1.8. It is also multiplied by 12.75 for a 10-fold increase of the initial permeability. No significant injection volume variations are observed with dilation angle and critical slip distance simulations.
The pressure front at the end of the injections can be modeled using a single hydraulic diffusivity (D) equals to 0.37 m2/s for the simulations with varying friction drop, SCU and critical slip distance (Figure 6A). Therefore, these three fault properties do not influence the hydrological behavior of the fault. A saturation of the pressure front is nonetheless observed for the smallest SCU test (SCU = 53%), as the pressure front reaches the edges of the model. On the contrary, the diffusivity measured on the pressure front obviously varies with the initial permeability, from 0.28 to 0.68 m2/s. A non-null dilation angle also changes the shape of the pressure front, which cannot be modeled by a linear diffusion law anymore (see section “Influence of Fault Physical Properties on the Fault Sismo-Hydromechanical Responses”). Besides, both initial permeability and dilation angles strongly modify fluid pressure at the injection (Figure 6B). Indeed, after a sharp increase of the injection pressure leading to the first rupture, the pressure at the injection slowly increases when no dilation is considered, but it decreases with dilation angles larger than 2° (Figure 8B). For smaller dilation angles, the pressure at injection point decreases later, after the rupture of a larger zone around injection. Moreover, the maximum overpressure reached during the simulations decreases with an increasing dilation angle (38.4–17.2 MPa for a dilation angle rising from 0° to 8°) and with an increasing initial permeability (46.3–25.9 MPa from k = 5.62 × 10⁻¹⁰ m2 to k = 5.62 × 10⁻⁹ m2). The SCU and friction drop also influence the fluid pressure at the injection, but to a lesser extent.
A population of seismic events is induced during each simulation. The number of events is mostly impacted by the critical slip distance, the SCU and the friction drop (Figure 6E). It is divided by 10.4 for an 8-fold increase of the critical slip distance. This number is also multiplied by 5 and 3.7 for a SCU and friction drop, respectively, multiplied by 1.3 and 1.8. The initial permeability also acts on the number of events, but due to the pressure threshold reached in high permeability tests, no particular evolution can be shown regarding this fault property (see section “Influence of Fault Physical Properties on the Fault Sismo-Hydromechanical Responses”). No noticeable variations of the number of events are observed with dilation angle simulations.
The cumulative seismic moment is mostly influenced by the friction drop and the SCU, and, to a lesser extent, by the initial permeability and the critical slip distance (Figure 7). It is multiplied by 41.6 and 76.2 for a SCU and friction drop multiplied, respectively, by 1.3 and 1.8. It is also divided by 8.3 and 15.6 for an 8-fold increase of the critical slip distance and a 10-fold increase of the initial permeability, respectively. No significant seismic moment variations are observed with dilation angle simulations. As the total deformation is similar for all simulations, the seismic-to-total moment partitioning has the same sensitivity as the seismic moment, and is mainly modified by the friction drop and the SCU. The seismic-to-total moment ratio is indeed divided by 80 and 120 within the explored range of these two parameters. The critical slip distance and the initial permeability have a smaller influence (factor 16 and factor 5, respectively).
The shear stress contribution (SSC, Eq. 4) quantifies how much the shear stress (and conversely, the fluid pressure) contributes to the seismic rupture. Friction drop and SCU strongly influence the SSC. SSC decreases quickly for most events when friction drop and SCU decreases, meaning that the fluid pressure is playing a larger role in inducing seismic slips over the course of injection (Figure 6D). Besides, we also note an influence of the dilation angle on the SSC, which varies from 98 to 83% for dilation angles between 0° and 8°.
Therefore, the spatiotemporal distribution of induced seismicity as well as the partitioning between seismic and aseismic moment released during injection are deeply influenced by the initial proximity of stress to failure of the fault and by its friction drop with slip, and, to a lesser extent, by the initial permeability of the fault and the critical slip distance Dc. These behaviors are consistent with independent field observations (De Barros et al., 2016, 2018; Lund Snee and Zoback, 2016; Hearn et al., 2018).
During a fluid injection, the released seismic moment is usually related to the injected fluid volume (McGarr, 2014; Galis et al., 2017; McGarr and Barbour, 2018). The 21 simulations we have performed can be seen as the response of 21 different reservoirs. We showed that the volume depends on three fault parameters (i.e., the SCU, the friction drop, the initial permeability; Figure 7). The seismic moment also depends on these three parameters, as well as on the critical slip distance. In a moment-volume diagram (Figure 7), the dependence we observed between these two parameters is counter-intuitive, and not in agreement with classical laws. The seismic moment decreases with the injected volume when three parameters (the initial permeability, the SCU and the friction drop) are modified. Therefore, the effect of the considered parameters on the fault hydraulic, mechanical and seismic responses has to be considered in order to anticipate the released seismic moment from the injected fluid volume.
Discussion
This study presents a series of numerical simulations of the coupled seismo-hydro-mechanical response of a permeable, slip-weakening fault in which fluid is injected at high-rate over a short duration in a local point source. We investigate the influence of fault physical parameters on the induced seismicity sequences. Based on a range of five important fault parameters, which are the initial permeability, dilation angle, SCU, friction drop and critical slip distance Dc, we identified that:
(1) the seismic, mechanical and hydraulic responses of the fault are deeply influenced by these fault parameters;
(2) the observed relationship between the injected fluid volume and the cumulative seismic moment appear much more complex than the classical predictive analytical solutions (Galis et al., 2017; McGarr and Barbour, 2018).
We have to notice that these fault parameters and stress state may nonetheless be difficult to obtain in practice in the field, especially for deep faults that cannot be accessed or sampled easily.
Processes for the Different Fault Parameters
We find in our models that an increase in the friction drop or the SCU leads to a faster migration of the rupture and of the seismicity (Figures 5J–L) and to an increase of both the magnitude and the number of seismic events (Figure 7). These fault properties act on the background stress drop, defined as the difference between the initial stress state and the residual shear stress μd × σn after an aseismic or seismic rupture (e.g., Galis et al., 2017). The background stress drop represents the shear stress exceeding the dynamic strength of the fault before injection. It corresponds to an excess or a lack of stress, which can either lead or slow down the rupture, depending of the sign of the background stress drop. If the friction drop or the SCU are high, the background stress drop is positive. Therefore, the aseismic rupture, as well as the shear stress front, accelerates. The increase of the seismicity migration velocity with the SCU is observed in previous modeling studies considering a pressurized fault driven by a slip-weakening (Bhattacharya and Viesca, 2019; Wynants-Morel et al., 2020) or a rate-and-state friction (Gischig, 2015; Dublanchet, 2019a). Moreover, the acceleration of the seismicity migration in high SCU cases is also mentioned in previous studies (Dublanchet, 2019a; Wynants-Morel et al., 2020).
Both the number and magnitudes of induced earthquakes are larger with higher SCU and friction drop. This increase of the seismic moment with SCU and friction drop was observed in previous works (Gischig, 2015; Rutqvist et al., 2015; Dublanchet, 2019a; Wynants-Morel et al., 2020). Moreover, the SCU acts on the triggering of seismic events and on their spatial distribution (Keranen et al., 2014; Lund Snee and Zoback, 2016; Jin and Zoback,2018a,b; Buijze et al., 2019b). Indeed, for instance in Oklahoma (US), earthquakes are triggered even for stress and fluid pressure perturbations less than 3 MPa, because of the near-critical stress state of the faults (Lund Snee and Zoback, 2016; Schoenball and Ellsworth, 2017).
The initial permeability and the dilation angle both modify the hydraulic response of the fault. As shown by Eq. (1), while the evolution of permeability is related to the initial opening of the fault and the change in effective stress, the dilation angle only acts on the opening of the fault during the slip episodes. The initial permeability mainly acts on the migration velocity of seismic events, but oppositely to what is expected from poroelastic diffusion (Shapiro et al., 1997). An increase of initial permeability indeed decreases the seismic migration velocity (Figure 6F). It can be explained by the lower level of fluid pressure reached on the fault at a given time for higher initial permeability. As the injection is flowrate-controlled in this study (Figure 2B), the fluid pressure increases more slowly in a higher permeability simulation. Moreover, the SSC, and thus the pressure contribution, is not impacted by the initial permeability (Figure 6D). Consequently, the duration needed to reach a fixed level of fluid pressure at the maximum rupture distance increases with the permeability, which means a slower rupture migration velocity. This is in contradiction with Chang and Segall (2016) and Norbeck and Horne (2016), who showed that the rupture is faster with a higher permeability. Nonetheless, shear stress variations from aseismic slip is not considered in their studies, while it contributes to the majority of the rupture propagation in our model (Figure 6D; Wynants-Morel et al., 2020). It also supports the importance of full hydromechanical coupling, which is not taken into account in Chang and Segall (2016). Our study also shows that the cumulative seismic moment, and therefore the seismic-to-total ratio, increases with decreasing fault permeability (Figure 7). Such behavior has been observed in reservoir injection sites, for instance in Oklahoma (Shah and Keller, 2017; Hearn et al., 2018).
We observe that the Shear Stress Contribution to reach rupture (SSC) decreases with an increase of the dilation angle. This is due to a higher opening of the fault before rupture due to the slipping of close regions; therefore, fluid pressure can diffuse more easily and reaches higher values just before rupture. Thus, the pressure contribution to reach rupture is higher, which means a smaller SSC. Moreover, as the dilation angle does not influence the rupture itself, dilation angles have no effect on the seismic moment and the spatio-temporal evolution of the seismic front (Figure 7). This does not agree to what has been found in previous models (Segall et al., 2010; McClure and Horne, 2011; Ciardo and Lecampion, 2019), in which a damping of the seismicity is observed. However, these models do not consider shear stress variations from previous rupture as a mechanism to reach rupture. This highlights the importance of shear stress variations in the seismic triggering mechanism.
The cumulated seismic moment decreases with increasing critical slip distance Dc (Figure 7). Moreover, a high value of this frictional parameter means that the friction drops on a larger slip distance (Figure 2A). Therefore, the friction weakening rate (i.e., the ratio between the friction drop and the critical slip distance) is small, which impedes slip acceleration and reduces the possibilities of unstable, seismic slip (Hillers et al., 2009). Thus, a sparse seismicity is observed, leading to a small released seismic moment. A similar result is shown in Cueto-Felgueroso et al. (2017) for an injection in a rate-and-state fault. Rutqvist et al. (2015) observed a decrease of the maximal seismic moment for an increasing Dc, but also an increase of the number of events. Nonetheless, they do not consider aseismic rupture in their model; most of the events observed by Rutqvist et al. (2015) for high critical slip distance may be considered aseismic in our model.
Seismic Moment and Injected Fluid Volume Relationship
We now investigate the contribution and consequences of our modeling results on the seismic moment vs. injected fluid volume relationship (Figure 7) commonly used to estimate the maximum earthquake magnitude induced by a fluid injection (Galis et al., 2017; McGarr and Barbour, 2018).
McGarr (1976) first considered the seismic moment released during a fluid injection to be related at first order to the injected fluid volume (V) through the shear modulus (G) of the surrounding rock. Then, this relationship has been updated in McGarr and Barbour (2018) to incorporate the aseismic moment ( occurring during the injection:
This relationship stands for an upper bound that cannot be exceeded during a fluid injection.
Our results show that four fault parameters (i.e., the initial permeability, the SCU, the friction drop and the critical slip distance) modify the moment-volume relationship. Indeed, the seismic moment decreases with the injected volume when three parameters (the initial permeability, the SCU and the friction drop) are modified. The sensitivity to the critical slip distance of the fault leads to similar injected volume but different seismic moment (Figure 7). Assuming that these 21 tests are responses from different and independent reservoirs, the mean trend that shows up from this test is that the released moment decreases with injected volume. This is in total disagreement with the McGarr’s relations. Because our simulations are stopped for similar total moment, the latter does not follow either the eq. 6. However, even if the total moment was corrected to fit such a law, the seismic moment would not show an increasing dependency with the volume. Indeed, we here observed that seismic and total moment do not follow the same trend, i.e., that the seismic-to-total ratio globally decreases here with increasing injected fluid volume. It means that the fault physical properties have a significant impact on the moment-volume relationships by modifying the seismic-to-total ratio, at least within the small range of volume and seismic moment we have here explored. To better anticipate the released seismicity, the aseismic component of the deformation should be considered (De Barros et al., 2019). This motivates a reformulation of the available moment-volume models since most of them do not include the aseismic deformation that occurs during fluid injection. Nonetheless, we want to precise that the seismic moment does follow a power law with the injected volume in each individual test, as observed in the literature (Buijze et al., 2015; Bentz et al., 2020).
The relationship given by McGarr and Barbour (2018) (Eq. 6) is considering the total moment, that is the seismic plus aseismic deformation. However, it is exceeded for small values of initial permeability and it will probably be exceeded for values of SCU and friction drop larger than those adopted in this study (Figure 7). This is in agreement with reservoir stimulation cases in which the observed moment is far above the expected value obtained from Eq. (6) (Atkinson et al., 2016; Ellsworth et al., 2019). For instance, Chang et al. (2020) consider that the low permeability of the basement near the geothermal field of Pohang, South Korea, favored the triggering of the 2017 post-injection Mw 5.4 event. According to Atkinson et al. (2016), the diffusion of fluids from previous near injections brought a large zone in a critical state of stress close to the location of hydraulic fracturing exploitations in the WCSB. This may explain that 6 Mw > 3.5 events induced by these exploitations do not follow the prevision of the McGarr’s law (Atkinson et al., 2016). Therefore, seismic moment that largely exceeds prediction from the fluid volume may exist in case of low permeability or highly critical stress state.
As neither the seismic nor the total moment released during injection can be directly anticipated from the injected fluid volume only, we look for another measurable parameter that can be considered as a proxy of the released seismic moment. We observe that no detectable seismic event is observed close to injection point (Figure 5), which is consistent with De Barros et al. (2016) and Duboeuf et al. (2017) observations in in-situ controlled decametric scale experiments. We approximate the size of the aseismic slip patch around injection point as the distance between the injection point and the first seismic event with a magnitude above a magnitude threshold Mt = –1.15. Following the approach of De Barros et al. (2019), we observe that the induced moment of events with magnitude Mw ≥ Mt decreases with the distance to first seismic event for the 16 simulations (Figure 9) with seismic events with magnitude above –1.15. A scaling relating the seismic moment to the power –3 of the size of the aseismic patch around injection give a poor fit with the data at first order. Therefore, this parameter seems to be a possible probe to estimate the amount of aseismic deformation. Nonetheless, the power coefficient is lower to the coefficient proposed by De Barros et al. (2019), equal to –1.5. This difference can be explained by pressure or stress effects, as De Barros et al. (2019) find a different coefficient (equal to –1) by including the critical fluid pressure into the moment/distance relation. Therefore, such parameter, in combination with other parameters, might be useful to correct the moment-volume relationship for the fault properties and the aseismic deformation. Nonetheless, this parameter stays dependent to the knowing of the injection location, which may not be available in many deep injection cases.
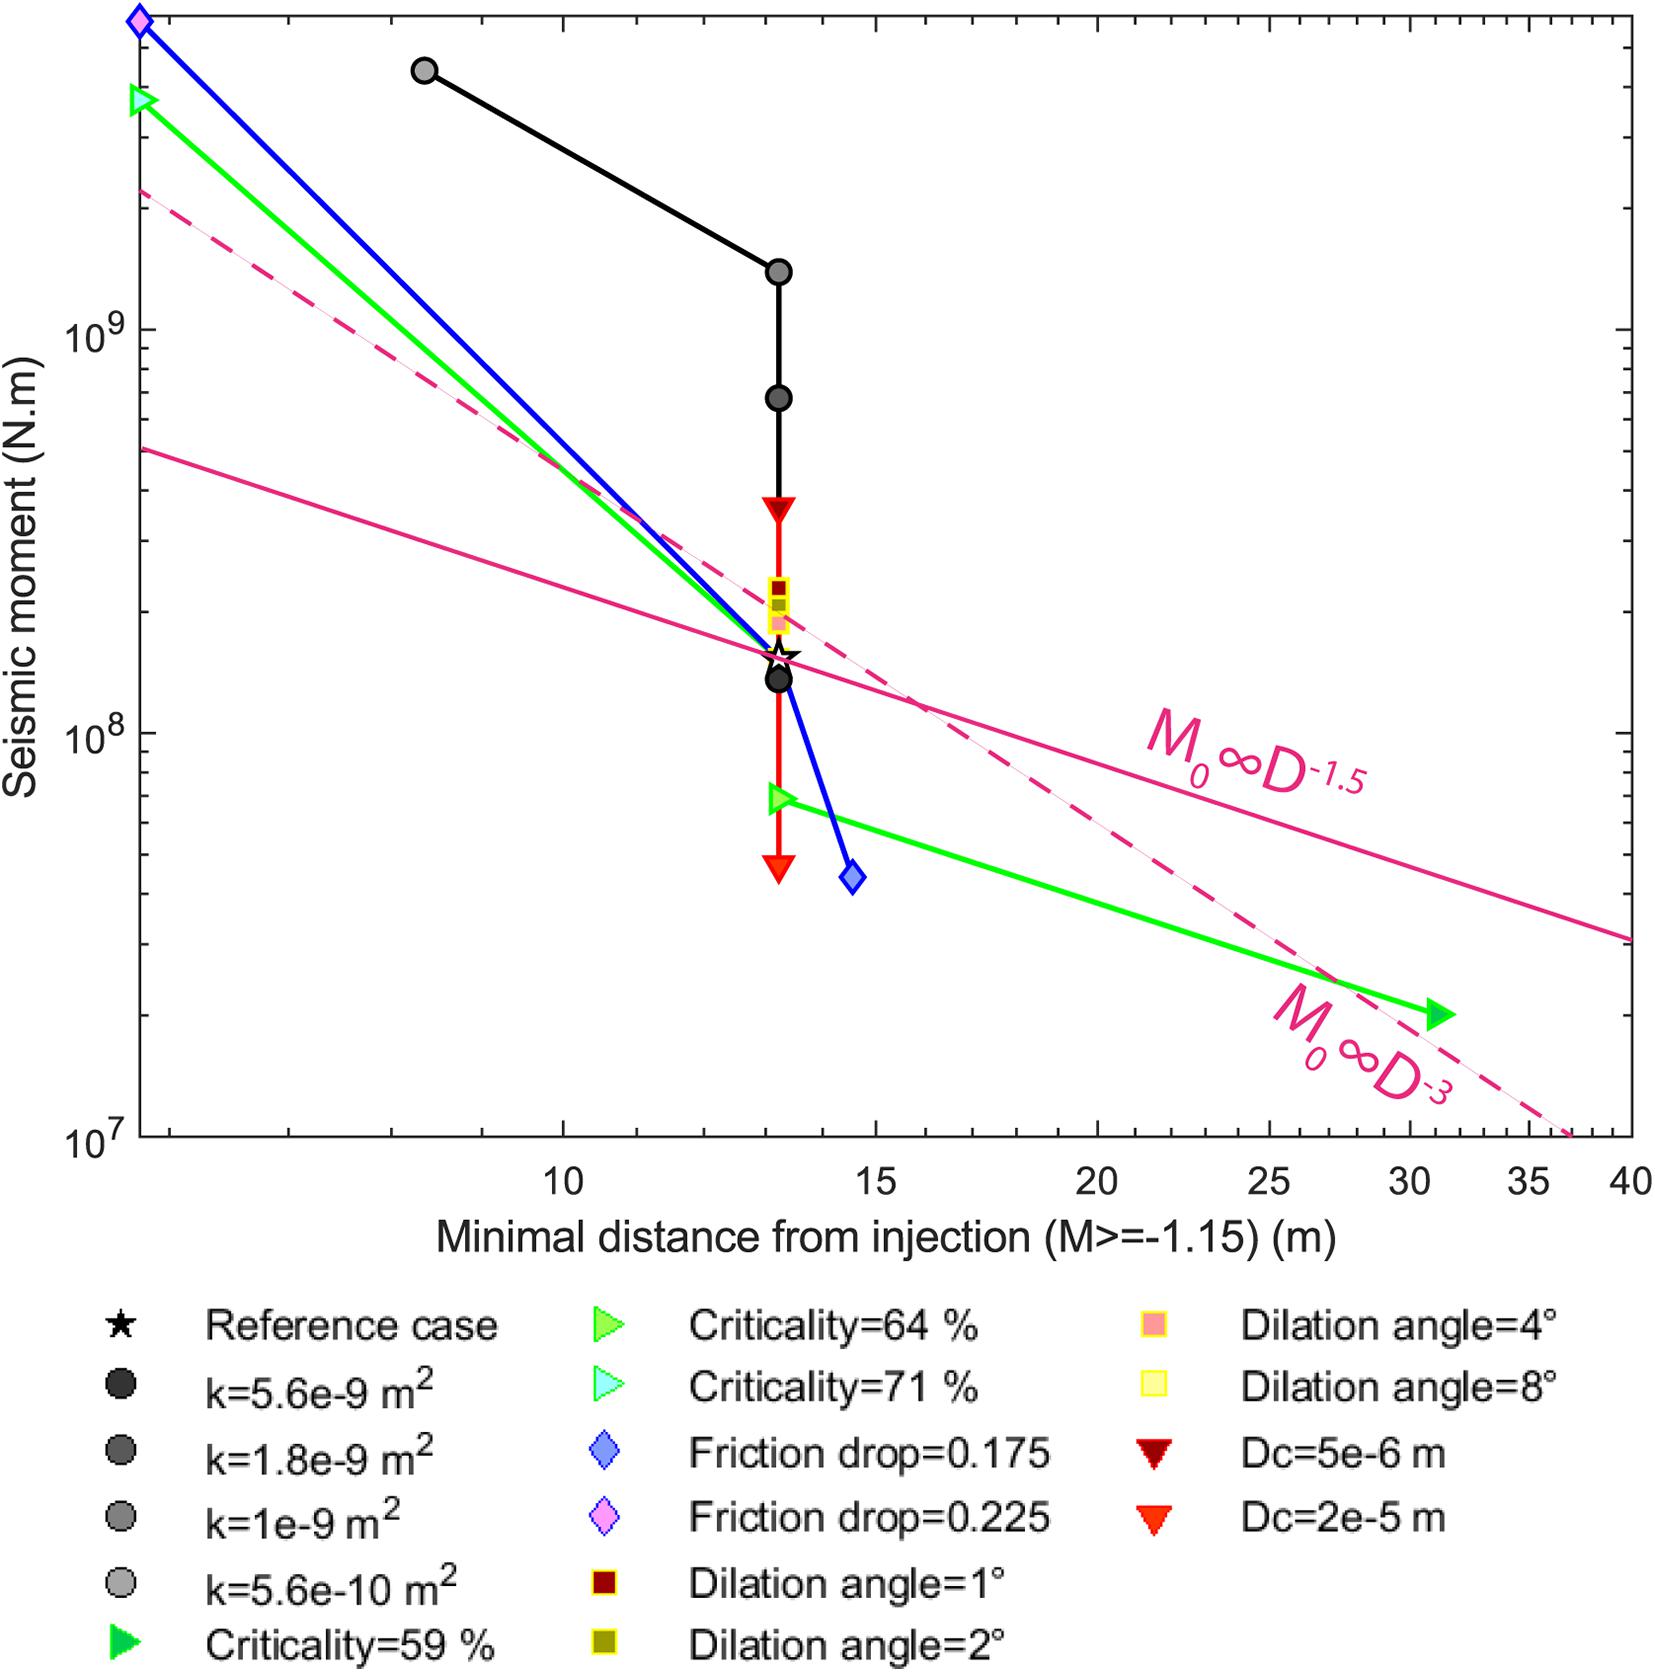
Figure 9. Seismic moment as a function of the minimal distance from injection to seismic events whose magnitude exceeds –1.15 for the 16 simulations having at least one event with a moment magnitude above this threshold. Injection tests with a same varying parameter are linked by a single-colored line. Each test is defined by a color and a symbol. The reference case is represented by a star. The pink diagonal line represents the relation between seismic moment and distance from injection of the first detectable seismic event found by De Barros et al. (2019).
Conclusion
This study focuses on the influence of fault physical properties during a fluid injection on the spatiotemporal distribution of the induced seismicity and on the moment partitioning between seismic and aseismic slip. Using a series of numerical simulations with a three-dimensional hydromechanical code, we considered an inherently discrete earthquake rupture model with a slip-weakening friction law. We carried out simulations testing a range of values for different fault hydraulic and mechanical properties. We obtained synthetic seismicity catalogs for each of these simulations.
Our observations showed that the mechanical behavior of the fault is impacted by the friction drop, initial proximity of stress to failure and dilation angle. These parameters influence the shear stress and fluid pressure perturbations that contribute to rupture. We found, as expected, that the hydrological behavior of the fault depends on the initial permeability and the dilation angle. Moreover, the spatiotemporal distribution of induced seismicity as well as the partitioning between seismic and aseismic moment released during injection are deeply influenced by the initial proximity of stress to failure of the fault and by its friction drop, and, to a lesser extent, by the initial permeability of the fault and the critical slip distance Dc. Moreover, the moment-volume relationship inferred from the fault sismo-hydromechanical responses when modifying these four parameters do not follow the classical relationship defined in McGarr and Barbour (2018). It means that the fault properties are important parameters to consider in order to anticipate the released seismic moment associated with injection. In particular, they are strongly modifying the seismic-to-total ratio, which impact on the relation between the seismic moment and the injected volume. This motivates the question to reformulate such models, considering other monitoring parameters, in order to improve the estimation of the maximum expected earthquake magnitude associated with a given injected fluid volume. We found that the distance between the injection point and the first detectable seismic event is a simple yet effective parameter to estimate the released seismic moment, as proposed by De Barros et al. (2019). Nonetheless, relationships between the seismic moment and other measurable parameters, such as the mineralogy of the surrounding rock (De Barros et al., 2016), the proximity to the crystalline basement (Hincks et al., 2018), or operational injection parameters (Kim, 2013; Weingarten et al., 2015; Almakari et al., 2019; De Barros et al., 2019), should be explored in future studies.
Data Availability Statement
The original contributions presented in the study are included in the article/supplementary material, further inquiries can be directed to the corresponding author/s.
Author Contributions
LD and FC designed the study. NW-M performed the numerical simulations. All authors contributed to the analysis of the data and simulations, and preparation of the manuscript.
Funding
This work was supported by the French Government, through the HYDROSEIS project under contract ANR-13-JS06-0004-01 and through the UCAJEDI Investments in the Future project managed by the National Research Agency (ANR) with the reference number ANR-15-IDEX-01. NW-M benefits from a financial support of the Université Côte d’Azur (UCA).
Conflict of Interest
The authors declare that the research was conducted in the absence of any commercial or financial relationships that could be construed as a potential conflict of interest.
Acknowledgments
We thank the associate editor, RH, and two reviewers for their constructive comments that improve our manuscript during the review process.
References
Almakari, M., Dublanchet, P., Chauris, H., and Pellet, F. (2019). Effect of the injection scenario on the rate and magnitude content of injection-induced seismicity: case of a heterogeneous fault. J. Geophys. Res. Solid Earth 124, 8426–8448. doi: 10.1029/2019JB017898
Ampuero, J.-P., Vilotte, J.-P., and Sánchez-Sesma, F. J. (2002). Nucleation of rupture under slip dependent friction law: simple models of fault zone. J. Geophys. Res. Solid Earth 107, ESE 2-1–ESE 2-19. doi: 10.1029/2001JB000452
Atkinson, G. M., Eaton, D. W., Ghofrani, H., Walker, D., Cheadle, B., Schultz, R., et al. (2016). hydraulic fracturing and seismicity in the Western Canada sedimentary basin. Seismol. Res. Lett. 87, 631–647. doi: 10.1785/0220150263
Bao, X., and Eaton, D. W. (2016). Fault activation by hydraulic fracturing in western Canada. Science 354, 1406–1409. doi: 10.1126/science.aag2583
Barbour, A. J., Norbeck, J. H., and Rubinstein, J. L. (2017). The effects of varying injection rates in Osage County, Oklahoma, on the 2016 Mw 5.8 Pawnee Earthquake. Seismol. Res. Lett. 88, 1040–1053. doi: 10.1785/0220170003
Bentz, S., Kwiatek, G., Martínez-Garzón, P., Bohnhoff, M., and Dresen, G. (2020). Seismic moment evolution during hydraulic stimulations. Geophys. Res. Lett 47:e2019GL086185. doi: 10.1029/2019GL086185
Bhattacharya, P., and Viesca, R. C. (2019). Fluid-induced aseismic fault slip outpaces pore-fluid migration. Science 364, 464–468. doi: 10.1126/science.aaw7354
Buijze, L., van Bijsterveldt, L., Cremer, H., Jaarsma, B., Paap, B., Veldkamp, H., et al. (2019b). Induced seismicity in geothermal systems: occurrences worldwide and implications for the Netherlands. Paper Presented at the European Geothermal Congress 2019, The Hague, Netherlands, The Hague.
Buijze, L., van den Bogert, P., Wassing, B. B. T., and Orlic, B. (2019a). Nucleation and arrest of dynamic rupture induced by reservoir depletion. J. Geophys. Res. Solid Earth 124, 3620–3645. doi: 10.1029/2018JB016941
Buijze, L., Wassing, B. B. T., Fokker, P. A., and van Wees, J. D. (2015). Moment partitioning for injection-induced seismicity: case studies and insights from numerical modeling. Paper Presented at the Proceedings World Geothermal Congress 2015, Melbourne, Australia, Melbourne, Vic.
Calò, M., Dorbath, C., Cornet, F. H., and Cuenot, N. (2011). Large-scale aseismic motion identified through 4-D P-wave tomography: temporal subsetting of the stimulation period. Geophys. J. Int. 186, 1295–1314. doi: 10.1111/j.1365-246X.2011.05108.x
Cappa, F., and Rutqvist, J. (2011). Impact of CO 2 geological sequestration on the nucleation of earthquakes. Geophys. Res. Lett. 38:L17313. doi: 10.1029/2011GL048487
Cappa, F., Guglielmi, Y., Nussbaum, C., and Birkholzer, J. (2018). On the relationship between fault permeability increases, induced stress perturbation, and the growth of aseismic slip during fluid injection. Geophys. Res. Lett 45, 11,012–11,020. doi: 10.1029/2018GL080233
Cappa, F., Scuderi, M. M., Collettini, C., Guglielmi, Y., and Avouac, J.-P. (2019). Stabilization of fault slip by fluid injection in the laboratory and in situ. Sci. Adv. 5:eaau4065. doi: 10.1126/sciadv.aau4065
Chang, K. W., and Segall, P. (2016). Injection-induced seismicity on basement faults including poroelastic stressing. J. Geophys. Res. Solid Earth 121, 2708–2726. doi: 10.1002/2015JB012561
Chang, K. W., Yoon, H., Kim, Y., and Lee, M. Y. (2020). Operational and geological controls of coupled poroelastic stressing and pore-pressure accumulation along faults: induced earthquakes in Pohang, South Korea. Sci. Rep 10:2073. doi: 10.1038/s41598-020-58881-z
Ciardo, F., and Lecampion, B. (2019). Effect of dilatancy on the transition from aseismic to seismic slip due to fluid injection in a fault. J. Geophys. Res. Solid Earth 124, 3724–3743. doi: 10.1029/2018JB016636
Cochard, A., and Madariaga, R. (1994). Dynamic faulting under rate-dependent friction. Pure Appl. Geophys. Pageoph. 142, 419–445. doi: 10.1007/BF00876049
Cornet, F. H. (2012). The relationship between seismic and aseismic motions induced by forced fluid injections. Hydrogeol. J. 20, 1463–1466. doi: 10.1007/s10040-012-0901-z
Cornet, F. H. (2016). Seismic and aseismic motions generated by fluid injections. Geomech. Energy Environ. 5, 42–54. doi: 10.1016/j.gete.2015.12.003
Cornet, F. H., Helm, J., Poitrenaud, H., and Etchecopar, A. (1997). Seismic and aseismic slips induced by large-scale fluid injections. Pure Appl. Geophys. 150, 563–583. doi: 10.1007/s000240050093
Cueto-Felgueroso, L., Santillán, D., and Mosquera, J. C. (2017). Stick-slip dynamics of flow-induced seismicity on rate and state faults. Geophys. Res. Lett. 44, 4098–4106. doi: 10.1002/2016GL072045
Cundall, P. A. (1988). Formulation of a three-dimensional distinct element model—Part I. A scheme to detect and represent contacts in a system composed of many polyhedral blocks. Int. J. Rock Mech. Min. Sci. Geomech. Abstr. 25, 107–116. doi: 10.1016/0148-9062(88)92293-0
De Barros, L., Cappa, F., Guglielmi, Y., Duboeuf, L., and Grasso, J.-R. (2019). Energy of injection-induced seismicity predicted from in-situ experiments. Sci. Rep. 9:4999. doi: 10.1038/s41598-019-41306-x
De Barros, L., Daniel, G., Guglielmi, Y., Rivet, D., Caron, H., Payre, X., et al. (2016). Fault structure, stress, or pressure control of the seismicity in shale? Insights from a controlled experiment of fluid-induced fault reactivation. J. Geophys. Res. Solid Earth 121, 4506–4522. doi: 10.1002/2015JB012633
De Barros, L., Guglielmi, Y., Rivet, D., Cappa, F., and Duboeuf, L. (2018). Seismicity and fault aseismic deformation caused by fluid injection in decametric in-situ experiments. Comptes Rendus Geosci. 350, 464–475. doi: 10.1016/j.crte.2018.08.002
Dublanchet, P. (2019a). Fluid driven shear cracks on a strengthening rate-and-state frictional fault. J. Mech. Phys. Solids 132:103672. doi: 10.1016/j.jmps.2019.07.015
Dublanchet, P. (2019b). Scaling and variability of interacting repeating earthquake sequences controlled by asperity density. Geophys. Res. Lett. 46, 11950–11958. doi: 10.1029/2019GL084614
Duboeuf, L., De Barros, L., Cappa, F., Guglielmi, Y., Deschamps, A., and Seguy, S. (2017). aseismic motions drive a sparse seismicity during fluid injections into a fractured zone in a carbonate reservoir. J. Geophys. Res. Solid Earth 122, 8285–8304. doi: 10.1002/2017JB014535
Dunham, E. M. (2007). Conditions governing the occurrence of supershear ruptures under slip-weakening friction. J. Geophys. Res. 112:B07302. doi: 10.1029/2006JB004717
Eaton, D. W., and Igonin, N. (2018). What controls the maximum magnitude of injection-induced earthquakes? Lead. Edge 37, 135–140. doi: 10.1190/tle37020135.1
Ellsworth, W. L. (2013). Injection-induced earthquakes. Science 341, 1225942–1225942. doi: 10.1126/science.1225942
Ellsworth, W. L., Giardini, D., Townend, J., Ge, S., and Shimamoto, T. (2019). Triggering of the Pohang, Korea, earthquake (Mw 5.5) by enhanced geothermal system stimulation. Seismol. Res. Lett. 90, 1844–1858. doi: 10.1785/0220190102
Eyre, T. S., Eaton, D. W., Garagash, D. I., Zecevic, M., Venieri, M., Weir, R., et al. (2019). The role of aseismic slip in hydraulic fracturing–induced seismicity. Sci. Adv. 5:eaav7172. doi: 10.1126/sciadv.aav7172
Fan, Z., Eichhubl, P., and Gale, J. F. W. (2016). Geomechanical analysis of fluid injection and seismic fault slip for the M w 4.8 Timpson, Texas, earthquake sequence. J. Geophys. Res. Solid Earth 121, 2798–2812. doi: 10.1002/2016JB012821
Fomin, S., Jing, Z., and Hashida, T. (2004). “The Effect of Thermal, Chemical, Hydrological, and Mechanical Factors on Water/Rock Interaction in HDR Geothermal Systems,” in Elsevier Geo-Engineering Book Series, ed. O. Stephanson (Amsterdam: Elsevier), 649–654. doi: 10.1016/S1571-9960(04)80113-7
Galis, M., Ampuero, J. P., Mai, P. M., and Cappa, F. (2017). Induced seismicity provides insight into why earthquake ruptures stop. Sci. Adv. 3:eaa7528. doi: 10.1126/sciadv.aap7528
Garagash, D. I., and Germanovich, L. N. (2012). Nucleation and arrest of dynamic slip on a pressurized fault. J. Geophys. Res. Solid Earth 117:B10310. doi: 10.1029/2012JB009209
Gischig, V. S. (2015). Rupture propagation behavior and the largest possible earthquake induced by fluid injection into deep reservoirs. Geophys. Res. Lett. 42, 7420–7428. doi: 10.1002/2015GL065072
Goebel, T. H. W., Weingarten, M., Chen, X., Haffener, J., and Brodsky, E. E. (2017). The 2016 Mw5.1 fairview, Oklahoma earthquakes: evidence for long-range poroelastic triggering at >40 km from fluid disposal wells. Earth Planet. Sci. Lett. 472, 50–61. doi: 10.1016/j.epsl.2017.05.011
Goodfellow, S. D., Nasseri, M. H. B., Maxwell, S. C., and Young, R. P. (2015). Hydraulic fracture energy budget: insights from the laboratory. Geophys. Res. Lett. 42, 3179–3187. doi: 10.1002/2015GL063093
Grigoli, F., Cesca, S., Priolo, E., Rinaldi, A. P., Clinton, J. F., Stabile, T. A., et al. (2017). Current challenges in monitoring, discrimination, and management of induced seismicity related to underground industrial activities: a European perspective. Rev. Geophys. 55, 310–340. doi: 10.1002/2016RG000542
Grigoli, F., Cesca, S., Rinaldi, A. P., Manconi, A., López-Comino, J. A., Clinton, J. F., et al. (2018). The november 2017 M w 5.5 Pohang earthquake: a possible case of induced seismicity in South Korea. Science 360, 1003–1006. doi: 10.1126/science.aat2010
Guglielmi, Y., Cappa, F., Avouac, J.-P., Henry, P., and Elsworth, D. (2015a). Seismicity triggered by fluid injection-induced aseismic slip. Science 348, 1224–1226. doi: 10.1126/science.aab0476
Guglielmi, Y., Elsworth, D., Cappa, F., Henry, P., Gout, C., Dick, P., et al. (2015b). In situ observations on the coupling between hydraulic diffusivity and displacements during fault reactivation in shales. J. Geophys. Res. Solid Earth 120, 7729–7748. doi: 10.1002/2015JB012158
Hearn, E. H., Koltermann, C., and Rubinstein, J. L. (2018). Numerical models of pore pressure and stress changes along basement faults due to wastewater injection: applications to the 2014 Milan, Kansas earthquake. Geochem. Geophys. Geosyst. 19, 1178–1198. doi: 10.1002/2017GC007194
Hillers, G., Carlson, J. M., and Archuleta, R. J. (2009). Seismicity in a model governed by competing frictional weakening and healing mechanisms. Geophys. J. Int. 178, 1363–1383. doi: 10.1111/j.1365-246X.2009.04217.x
Hincks, T., Aspinall, W., Cooke, R., and Gernon, T. (2018). Oklahoma’s induced seismicity strongly linked to wastewater injection depth. Science 359, 1251–1255. doi: 10.1126/science.aap7911
Hopp, C., Sewell, S., Mroczek, S., Savage, M., and Townend, J. (2019). Seismic response to injection well stimulation in a high-temperature, high-permeability reservoir. Geochem. Geophys. Geosyst. 20, 2848–2871. doi: 10.1029/2019GC008243
Ida, Y. (1972). Cohesive force across the tip of a longitudinal-shear crack and Griffith’s specific surface energy. J. Geophys. Res. 77, 3796–3805. doi: 10.1029/JB077i020p03796
Itasca Consulting Group, Inc. (2016). 3DEC — Three-Dimensional Distinct Element Code. Minneapolis: Itasca.
Jaeger, J. C., and Cook, N. G. (1984). Fundamentals of rock Mechanics, repr. ed, Science Paperbacks, 3. Edn. London: Chapman and Hall.
Jeanne, P., Guglielmi, Y., Lamarche, J., Cappa, F., and Marié, L. (2012). Architectural characteristics and petrophysical properties evolution of a strike-slip fault zone in a fractured porous carbonate reservoir. J. Struct. Geol. 44, 93–109. doi: 10.1016/j.jsg.2012.08.016
Jin, L., and Zoback, M. D. (2018a). Modeling induced seismicity: co-seismic fully dynamic spontaneous rupture considering fault poroelastic stress. Paper Presented at the 52th US Rock Mechanics/Geomechanics Symposium, American Rock Mechanics Association (ARMA), Seattle, WA.
Jin, L., and Zoback, M. D. (2018b). Hydromechanical–stochastic modeling of fluid-induced seismicity in fractured poroelastic media. EarthArXiv [Preprint]. doi: 10.31223/osf.io/8ynm7
Keranen, K. M., and Weingarten, M. (2018). Induced seismicity. Annu. Rev. Earth Planet. Sci. 46, 149–174. doi: 10.1146/annurev-earth-082517-010054
Keranen, K. M., Savage, H. M., Abers, G. A., and Cochran, E. S. (2013). Potentially induced earthquakes in Oklahoma, USA: links between wastewater injection and the 2011 Mw 5.7 earthquake sequence. Geology 41, 699–702. doi: 10.1130/G34045.1
Keranen, K. M., Weingarten, M., Abers, G. A., Bekins, B. A., and Ge, S. (2014). Sharp increase in central Oklahoma seismicity since 2008 induced by massive wastewater injection. Science 345, 448–451. doi: 10.1126/science.1255802
Kim, K.-H., Ree, J.-H., Kim, Y., Kim, S., Kang, S. Y., and Seo, W. (2018). Assessing whether the 2017 M w 5.4 Pohang earthquake in South Korea was an induced event. Science 360, 1007–1009. doi: 10.1126/science.aat6081
Kim, W.-Y. (2013). Induced seismicity associated with fluid injection into a deep well in Youngstown, Ohio. J. Geophys. Res. Solid Earth 118, 3506–3518. doi: 10.1002/jgrb.50247
Hubbert, M., and Rubey, W. W. (1959). Role of fluid pressure in mechanics of overthrust faulting. Geol. Soc. Am. Bull. 70:115.
Kroll, K. A., Cochran, E. S., and Murray, K. E. (2017). Poroelastic properties of the Arbuckle group in Oklahoma derived from well fluid level response to the 3 september 2016 M w 5.8 Pawnee and 7 november 2016 M w 5.0 cushing earthquakes. Seismol. Res. Lett. 88, 963–970. doi: 10.1785/0220160228
Kwiatek, G., Saarno, T., Ader, T., Bluemle, F., Bohnhoff, M., Chendorain, M., et al. (2019). Controlling fluid-induced seismicity during a 6.1-km-deep geothermal stimulation in Finland. Sci. Adv. 5:eaav7224. doi: 10.1126/sciadv.aav7224
Latham, J.-P., Xiang, J., Belayneh, M., Nick, H. M., Tsang, C.-F., and Blunt, M. J. (2013). Modelling stress-dependent permeability in fractured rock including effects of propagating and bending fractures. Int. J. Rock Mech. Min. Sci. 57, 100–112. doi: 10.1016/j.ijrmms.2012.08.002
Lee, K.-K., Ellsworth, W. L., Giardini, D., Townend, J., Ge, S., Shimamoto, T., et al. (2019). Managing injection-induced seismic risks. Science 364, 730–732. doi: 10.1126/science.aax1878
Lei, Q., Latham, J.-P., and Xiang, J. (2016). Implementation of an empirical joint constitutive model into finite-discrete element analysis of the geomechanical behaviour of fractured rocks. Rock Mech. Rock Eng. 49, 4799–4816. doi: 10.1007/s00603-016-1064-3
Lei, Q., Latham, J.-P., Xiang, J., Tsang, C.-F., Lang, P., and Guo, L. (2014). Effects of geomechanical changes on the validity of a discrete fracture network representation of a realistic two-dimensional fractured rock. Int. J. Rock Mech. Min. Sci. 70, 507–523. doi: 10.1016/j.ijrmms.2014.06.001
Lengliné, O., Boubacar, M., and Schmittbuhl, J. (2017). Seismicity related to the hydraulic stimulation of GRT1, Rittershoffen, France. Geophys. J. Int 208, 1704–1715. doi: 10.1093/gji/ggw490
Lund Snee, J.-E., and Zoback, M. D. (2016). State of stress in Texas: implications for induced seismicity. Geophys. Res. Lett 43, 208–210. doi: 10.1002/2016GL070974
Marone, C. (1998). Laboratory-derived friction laws and their application to seismic faulting. Annu. Rev. Earth Planet. Sci. 26, 643–696. doi: 10.1146/annurev.earth.26.1.643
McClure, M. W. (2015). Generation of large postinjection-induced seismic events by backflow from dead-end faults and fractures. Geophys. Res. Lett. 42, 6647–6654. doi: 10.1002/2015GL065028
McClure, M. W., and Horne, R. N. (2011). Investigation of injection-induced seismicity using a coupled fluid flow and rate/state friction model. Geophysics 76, WC181–WC198. doi: 10.1190/geo2011-0064.1
McGarr, A. (1976). Seismic moments and volume changes. J. Geophys. Res. 81, 1487–1494. doi: 10.1029/JB081i008p01487
McGarr, A. (2014). Maximum magnitude earthquakes induced by fluid injection. J. Geophys. Res. Solid Earth 119, 1008–1019. doi: 10.1002/2013JB010597
McGarr, A., and Barbour, A. J. (2018). Injection-induced moment release can also be aseismic. Geophys. Res. Lett. 45, 5344–5351. doi: 10.1029/2018GL078422
McNamara, D. E., Benz, H. M., Herrmann, R. B., Bergman, E. A., Earle, P., Holland, A., et al. (2015). Earthquake hypocenters and focal mechanisms in central Oklahoma reveal a complex system of reactivated subsurface strike-slip faulting. Geophys. Res. Lett. 42, 2742–2749. doi: 10.1002/2014GL062730
Mikumo, T., Olsen, K., Fukuyama, E., and Yagi, Y. (2003). Stress-breakdown time and slip-weakening distance inferred from slip-velocity functions on earthquake faults. Bull. Seismol. Soc. Am. 93, 264–282. doi: 10.1785/0120020082
Norbeck, J. H., and Horne, R. N. (2016). Evidence for a transient hydromechanical and frictional faulting response during the 2011 M w 5.6 Prague, Oklahoma earthquake sequence. J. Geophys. Res. Solid Earth 121, 8688–8705. doi: 10.1002/2016JB013148
Norbeck, J. H., and Horne, R. N. (2018). Maximum magnitude of injection-induced earthquakes: a criterion to assess the influence of pressure migration along faults. Tectonophysics 733, 108–118. doi: 10.1016/j.tecto.2018.01.028
Pei, S., Peng, Z., and Chen, X. (2018). Locations of injection-induced earthquakes in Oklahoma controlled by crustal structures. J. Geophys. Res. Solid Earth 123, 2332–2344. doi: 10.1002/2017JB014983
Rinaldi, A. P., and Nespoli, M. (2017). TOUGH2-seed: a coupled fluid flow and mechanical-stochastic approach to model injection-induced seismicity. Comput. Geosci. 108, 86–97. doi: 10.1016/j.cageo.2016.12.003
Rubino, V., Rosakis, A. J., and Lapusta, N. (2017). Understanding dynamic friction through spontaneously evolving laboratory earthquakes. Nat. Commun 8:15991. doi: 10.1038/ncomms15991
Rutqvist, J., Rinaldi, A. P., Cappa, F., and Moridis, G. J. (2015). Modeling of fault activation and seismicity by injection directly into a fault zone associated with hydraulic fracturing of shale-gas reservoirs. J. Pet. Sci. Eng. 127, 377–386. doi: 10.1016/j.petrol.2015.01.019
Schmittbuhl, J., Lengliné, O., Cornet, F., Cuenot, N., and Genter, A. (2014). Induced seismicity in EGS reservoir: the creep route. Geotherm. Energy 2:14. doi: 10.1186/s40517-014-0014-0
Schoenball, M., and Ellsworth, W. L. (2017). A systematic assessment of the spatiotemporal evolution of fault activation through induced seismicity in Oklahoma and Southern Kansas. J. Geophys. Res. Solid Earth 122, 10,189–10,206. doi: 10.1002/2017JB014850
Schultz, R., Stern, V., Novakovic, M., Atkinson, G., and Gu, Y. J. (2015). Hydraulic fracturing and the crooked lake sequences: insights gleaned from regional seismic networks. Geophys. Res. Lett. 42, 2750–2758. doi: 10.1002/2015GL063455
Segall, P. (1989). Earthquakes triggered by fluid extraction. Geology 17:942. doi: 10.1130/0091-76131989017<0942:ETBFE<2.3.CO;2
Segall, P., and Lu, S. (2015). Injection-induced seismicity: poroelastic and earthquake nucleation effects. J. Geophys. Res. Solid Earth 120, 5082–5103. doi: 10.1002/2015JB012060
Segall, P., Rubin, A. M., Bradley, A. M., and Rice, J. R. (2010). Dilatant strengthening as a mechanism for slow slip events. J. Geophys. Res 115:B12305. doi: 10.1029/2010JB007449
Shah, A. K., and Keller, G. R. (2017). Geologic influence on induced seismicity: constraints from potential field data in Oklahoma. Geophys. Res. Lett. 44, 152–161. doi: 10.1002/2016GL071808
Shapiro, S. A., Huenges, E., and Borm, G. (1997). Estimating the crust permeability from fluid-injection-induced seismic emission at the KTB site. Geophys. J. Int. 131, F15–F18. doi: 10.1111/j.1365-246X.1997.tb01215.x
Shapiro, S. A., Krüger, O. S., Dinske, C., and Langenbruch, C. (2011). Magnitudes of induced earthquakes and geometric scales of fluid-stimulated rock volumes. Geophysics 76, WC55–WC63. doi: 10.1190/geo2010-0349.1
Shapiro, S. A., Rothert, E., Rath, V., and Rindschwentner, J. (2002). Characterization of fluid transport properties of reservoirs using induced microseismicity. Geophysics 67, 212–220. doi: 10.1190/1.1451597
Tsopela, A., Donzé, F.-V., Guglielmi, Y., Castilla, R., and Gout, C. (2019). Hydromechanical reactivation of natural discontinuities: mesoscale experimental observations and DEM modeling. Acta Geotech. 14, 1585–1603. doi: 10.1007/s11440-019-00791-0
Uenishi, K., and Rice, J. R. (2003). Universal nucleation length for slip-weakening rupture instability under nonuniform fault loading. J. Geophys. Res. Solid Earth 108, ESE17.1–ESE17.14. doi: 10.1029/2001JB001681
van der Elst, N. J., Page, M. T., Weiser, D. A., Goebel, T. H. W., and Hosseini, S. M. (2016). Induced earthquake magnitudes are as large as (statistically) expected. J. Geophys. Res. Solid Earth 121, 4575–4590. doi: 10.1002/2016JB012818
Wang, L., Kwiatek, G., Rybacki, E., Bonnelye, A., Bohnhoff, M., and Dresen, G. (2020). Laboratory study on fluid-induced fault slip behavior: the role of fluid pressurization rate. Geophys. Res. Lett 47:e2019GL086627. doi: 10.1029/2019GL086627
Wei, S., Avouac, J.-P., Hudnut, K. W., Donnellan, A., Parker, J. W., Graves, R. W., et al. (2015). The 2012 Brawley swarm triggered by injection-induced aseismic slip. Earth Planet. Sci. Lett. 422, 115–125. doi: 10.1016/j.epsl.2015.03.054
Weingarten, M., Ge, S., Godt, J. W., Bekins, B. A., and Rubinstein, J. L. (2015). High-rate injection is associated with the increase in U.S. mid-continent seismicity. Science 348, 1336–1340. doi: 10.1126/science.aab1345
Witherspoon, P. A., Wang, J. S. Y., Iwai, K., and Gale, J. E. (1980). Validity of cubic law for fluid flow in a deformable rock fracture. Water Resour. Res. 16, 1016–1024. doi: 10.1029/WR016i006p01016
Wynants-Morel, N., Cappa, F., De Barros, L., and Ampuero, J. (2020). Stress perturbation from aseismic slip drives the seismic front during fluid injection in a permeable fault. J. Geophys. Res. Solid Earth 125:e2019JB019179. doi: 10.1029/2019JB019179
Yeck, W. L., Hayes, G. P., McNamara, D. E., Rubinstein, J. L., Barnhart, W. D., Earle, P. S., et al. (2017). Oklahoma experiences largest earthquake during ongoing regional wastewater injection hazard mitigation efforts. Geophys. Res. Lett. 44, 711–717. doi: 10.1002/2016GL071685
Yeck, W. L., Weingarten, M., Benz, H. M., McNamara, D. E., Bergman, E. A., Herrmann, R. B., et al. (2016). Far-field pressurization likely caused one of the largest injection induced earthquakes by reactivating a large preexisting basement fault structure. Geophys. Res. Lett. 43, 10,198–10,207. doi: 10.1002/2016GL070861
Yeo, I. W., Brown, M. R. M., Ge, S., and Lee, K. K. (2020). Causal mechanism of injection-induced earthquakes through the Mw 5.5 Pohang earthquake case study. Nat. Commun. 11:2614. doi: 10.1038/s41467-020-16408-0
Zbinden, D., Rinaldi, A. P., Diehl, T., and Wiemer, S. (2020). Hydromechanical modeling of fault reactivation in the St. Gallen Deep geothermal project (Switzerland): poroelasticity or hydraulic connection? Geophys. Res. Lett. 47:e2019GL085201. doi: 10.1029/2019GL085201
Zhang, F., Damjanac, B., and Huang, H. (2013). Coupled discrete element modeling of fluid injection into dense granular media. J. Geophys. Res. Solid Earth 118, 2703–2722. doi: 10.1002/jgrb.50204
Zhang, Z., and Li, X. (2016). The shear mechanisms of natural fractures during the hydraulic stimulation of shale gas reservoirs. Materials 9:713. doi: 10.3390/ma9090713
Zoback, M. D., Kohli, A., Das, I., and Mcclure, M. W. (2012). The importance of slow slip on faults during hydraulic fracturing stimulation of shale gas reservoirs. Paper Presented at the SPE Americas Unconventional Resources Conference: SPE Americas Unconventional Resources Conference, (Pittsburgh, PA: Society of Petroleum Engineers). doi: 10.2118/155476-MS
Keywords: induced seismicity, fluid injection, fault mechanics, hydromechanical modeling, aseismic slip
Citation: Wynants-Morel N, De Barros L and Cappa F (2021) Sensitivity of the Seismic Moment Released During Fluid Injection to Fault Hydromechanical Properties and Background Stress. Front. Earth Sci. 9:638723. doi: 10.3389/feart.2021.638723
Received: 07 December 2020; Accepted: 25 March 2021;
Published: 13 April 2021.
Edited by:
Rebecca M. Harrington, Ruhr University Bochum, GermanyReviewed by:
William B. Frank, Massachusetts Institute of Technology, United StatesDavid Eaton, University of Calgary, Canada
Copyright © 2021 Wynants-Morel, De Barros and Cappa. This is an open-access article distributed under the terms of the Creative Commons Attribution License (CC BY). The use, distribution or reproduction in other forums is permitted, provided the original author(s) and the copyright owner(s) are credited and that the original publication in this journal is cited, in accordance with accepted academic practice. No use, distribution or reproduction is permitted which does not comply with these terms.
*Correspondence: Nicolas Wynants-Morel, bmljb2xhcy53bUBvcmFuZ2UuZnI=; Louis De Barros, ZGViYXJyb3NAZ2VvYXp1ci51bmljZS5mcg==