 Per Avseth1*
 Ivan Lehocki1,2
- 1Dig Science, Oslo, Norway
- 2Lehocki GeoSpace, Oslo, Norway
A novel inter-disciplinary methodology for the generation of rock property and AVO feasibility maps or cubes to be used in subsurface characterization and prospect de-risking is presented. We demonstrate the workflow for 1D, 2D and 3D cases on data from the North Sea and the Barents Sea, offshore Norway. The methodology enables rapid extrapolation of expected rock physics properties away from well control along selected horizons, constrained by seismic velocity information, geological inputs (basin modeling, seismic stratigraphy and facies maps) and rock physics depth trend analysis. In this way, the expected rock physics properties of a reservoir sandstone (saturated with any pore fluid) can be predicted at any given location between or away from existing wells while honoring rock’s burial and thermal history at this same location. The workflow should allow for more rapid, seamless and geologically consistent subsurface mapping and de-risking of prospects in areas with complex geology and tectonic influence. The AVO feasibility results can furthermore be utilized to generate non-stationary training data for AVO classification.
Introduction
One of the key tasks within the field of geoscience is to obtain a better understanding of the subsurface using remote sensing techniques and/or selected modeling tools. Various geophysical data and observables are acquired to characterize or map the subsurface. In particular, seismic data have been utilized in great abundance for both petroleum exploitation and aquifer characterization (e.g., Mukerji et al., 2001; Rimstad et al., 2010; Liu and Grana, 2020). However, these data are often expensive to acquire, and the seismic data need to be converted to geological properties via rock physics relations. In this study, we propose a methodology to create a 3D subsurface feasibility model for rock properties constrained by local geology (e.g., available interpreted seismic stratigraphic horizons). This modeling can give valuable information before new or additional seismic data are acquired to decide whether certain types of data will be beneficial or not at a given depth (for instance, pre-stack data are only useful if we expect to see AVO signatures in a given area/target level). Furthermore, the feasibility modeling can constrain the pre-processing, imaging and inversion of seismic data. Finally, they can be used to help guide the quantitative seismic interpretation.
Another aspect that we would like to focus on in this study is that future oil and gas exploration will likely focus on increasingly more subtle stratigraphic and/or combination traps located down-flank or up-dip from drilled/explored structures (e.g., Biswal et al., 2012; Dolson et al., 2019). Quantitative seismic interpretation (Avseth et al., 2005) will be essential in hunting for new prospects away from existing wells. A key challenge will be to do facies and fluid classification/prediction from seismic data away from existing well control, especially in areas characterized by complex tectonic history. Rock physics combined with stratigraphic interpretation and basin modeling can improve the understanding of expected seismic signatures and create augmented elastic training data for AVO classification using machine learning methods (e.g., AlKawai et al., 2018; Qadrouh et al., 2019).
This study presents an innovative and seamless workflowwhere rock physics combined with burial history is used to create AVO feasibility maps away from well control. The methodology is a culmination of several studies conducted in the past few years. Avseth and Lehocki (2016) showed how to combine rock physics and diagenetic modeling to predict expected AVO signatures for a given burial history (1D), and Gatemann and Avseth (2016) and Johansen (2016) showed how this method could be combined with seismic velocities to obtain calibrated net-erosion (exhumation) maps, where net-erosion is the difference between maximum burial and present-day burial depth. Avseth et al. (2020a, b) demonstrated a new workflow where rock physics combined with burial history, the latter determined from net erosion maps, was used to create AVO feasibility maps/cubes away from well control (i.e., in 2D and 3D). First, combined rock physics and compactional modeling are integrated with seismic velocities and basin modeling to create regional uplift and maximum burial maps for selected horizons/intervals. Next, geologically consistent AVO feasibility maps/cubes are created from these maximum burials and net erosion maps, while also honoring key uncertainties (rock texture, mineralogy, heterogeneity, anisotropy, temperature, etc.). This is possible because the uplift and maximum burial maps constrain the modeling of sand and shale depth trends at any given location. These depth trends are then used to estimate the expected AVO signatures for shale-sand interfaces at any given depth. The feasibility maps/cubes can be used directly during prospect maturation and de-risking. Furthermore, they can be used as a fundament to create augmented, non-stationary training data for AVO classification and seismic reservoir prediction in areas with poor well control (c.f. Lehocki et al., 2020).
In this paper, the focus is on how we go from 1D combined rock physics and burial modeling to 2D and 3D feasibility maps/cubes that can be created in real-time for multiple scenarios, where we honor variability and uncertainties in key geological parameters, including grain size, clay content, temperature history, etc. We provide an overview of the suggested workflow and demonstrate the potential of this methodology in selected areas of the Barents Sea, where the geology is complex due to spatially varying burial and uplift history. Finally, we suggest some best practices to validate the methodology and assess the uncertainties in the AVO feasibility maps.
Geologically Consistent Rock-Physics Modeling
One of the most common methodologies in rock physics is investigating the relationships between seismic velocities and rock texture (i.e., porosity, clay, cement, grain size, etc.). The goal is either to interpret observed data in terms of geological factors, like clay content, rock texture, pressure or pore fluid saturations, or to be able to extrapolate from the data observations to predict certain “what-if” scenarios.
Figure 1 shows some useful rock physics models for high porosity sands and sandstones (sst) (Dvorkin and Nur, 1996; Avseth et al., 2000, 2005) used to quantify geologic trends and rock texture in the velocity vs. porosity domain. The models in Figure 1 (black lines) are based on contact theory combined with modified Hashin-Shtrikman (see also Mavko et al., 2020). A steep trend in this crossplot will indicate a diagenetic trend, as quartz cement at grain contacts will significantly stiffen the rock frame, even though porosity will not reduce much. This trend can be modeled using the Dvorkin-Nur contact cement model (Dvorkin and Nur, 1996). As cement is filling macro-porosity, the model can be extrapolated to lower porosities using modified upper Hashin-Shtrikman bound. The friable sand model is a combination of Hertz-Mindlin contact theory at high porosity end member and modified lower-bound Hashin-Shtrikman for decreasing porosities. The constant cement model is a combination of the contact cement model to a certain cement volume, and a lower-bound Hashin-Shtrikman. This is a useful model for a cemented sandstone reservoir at a given burial depth, assuming cement volume is more or less constant. In contrast, porosity at a given depth will vary as a function of depositional porosity. The model equations used in this study are found in Avseth et al. (2005) or Mavko et al. (2020).
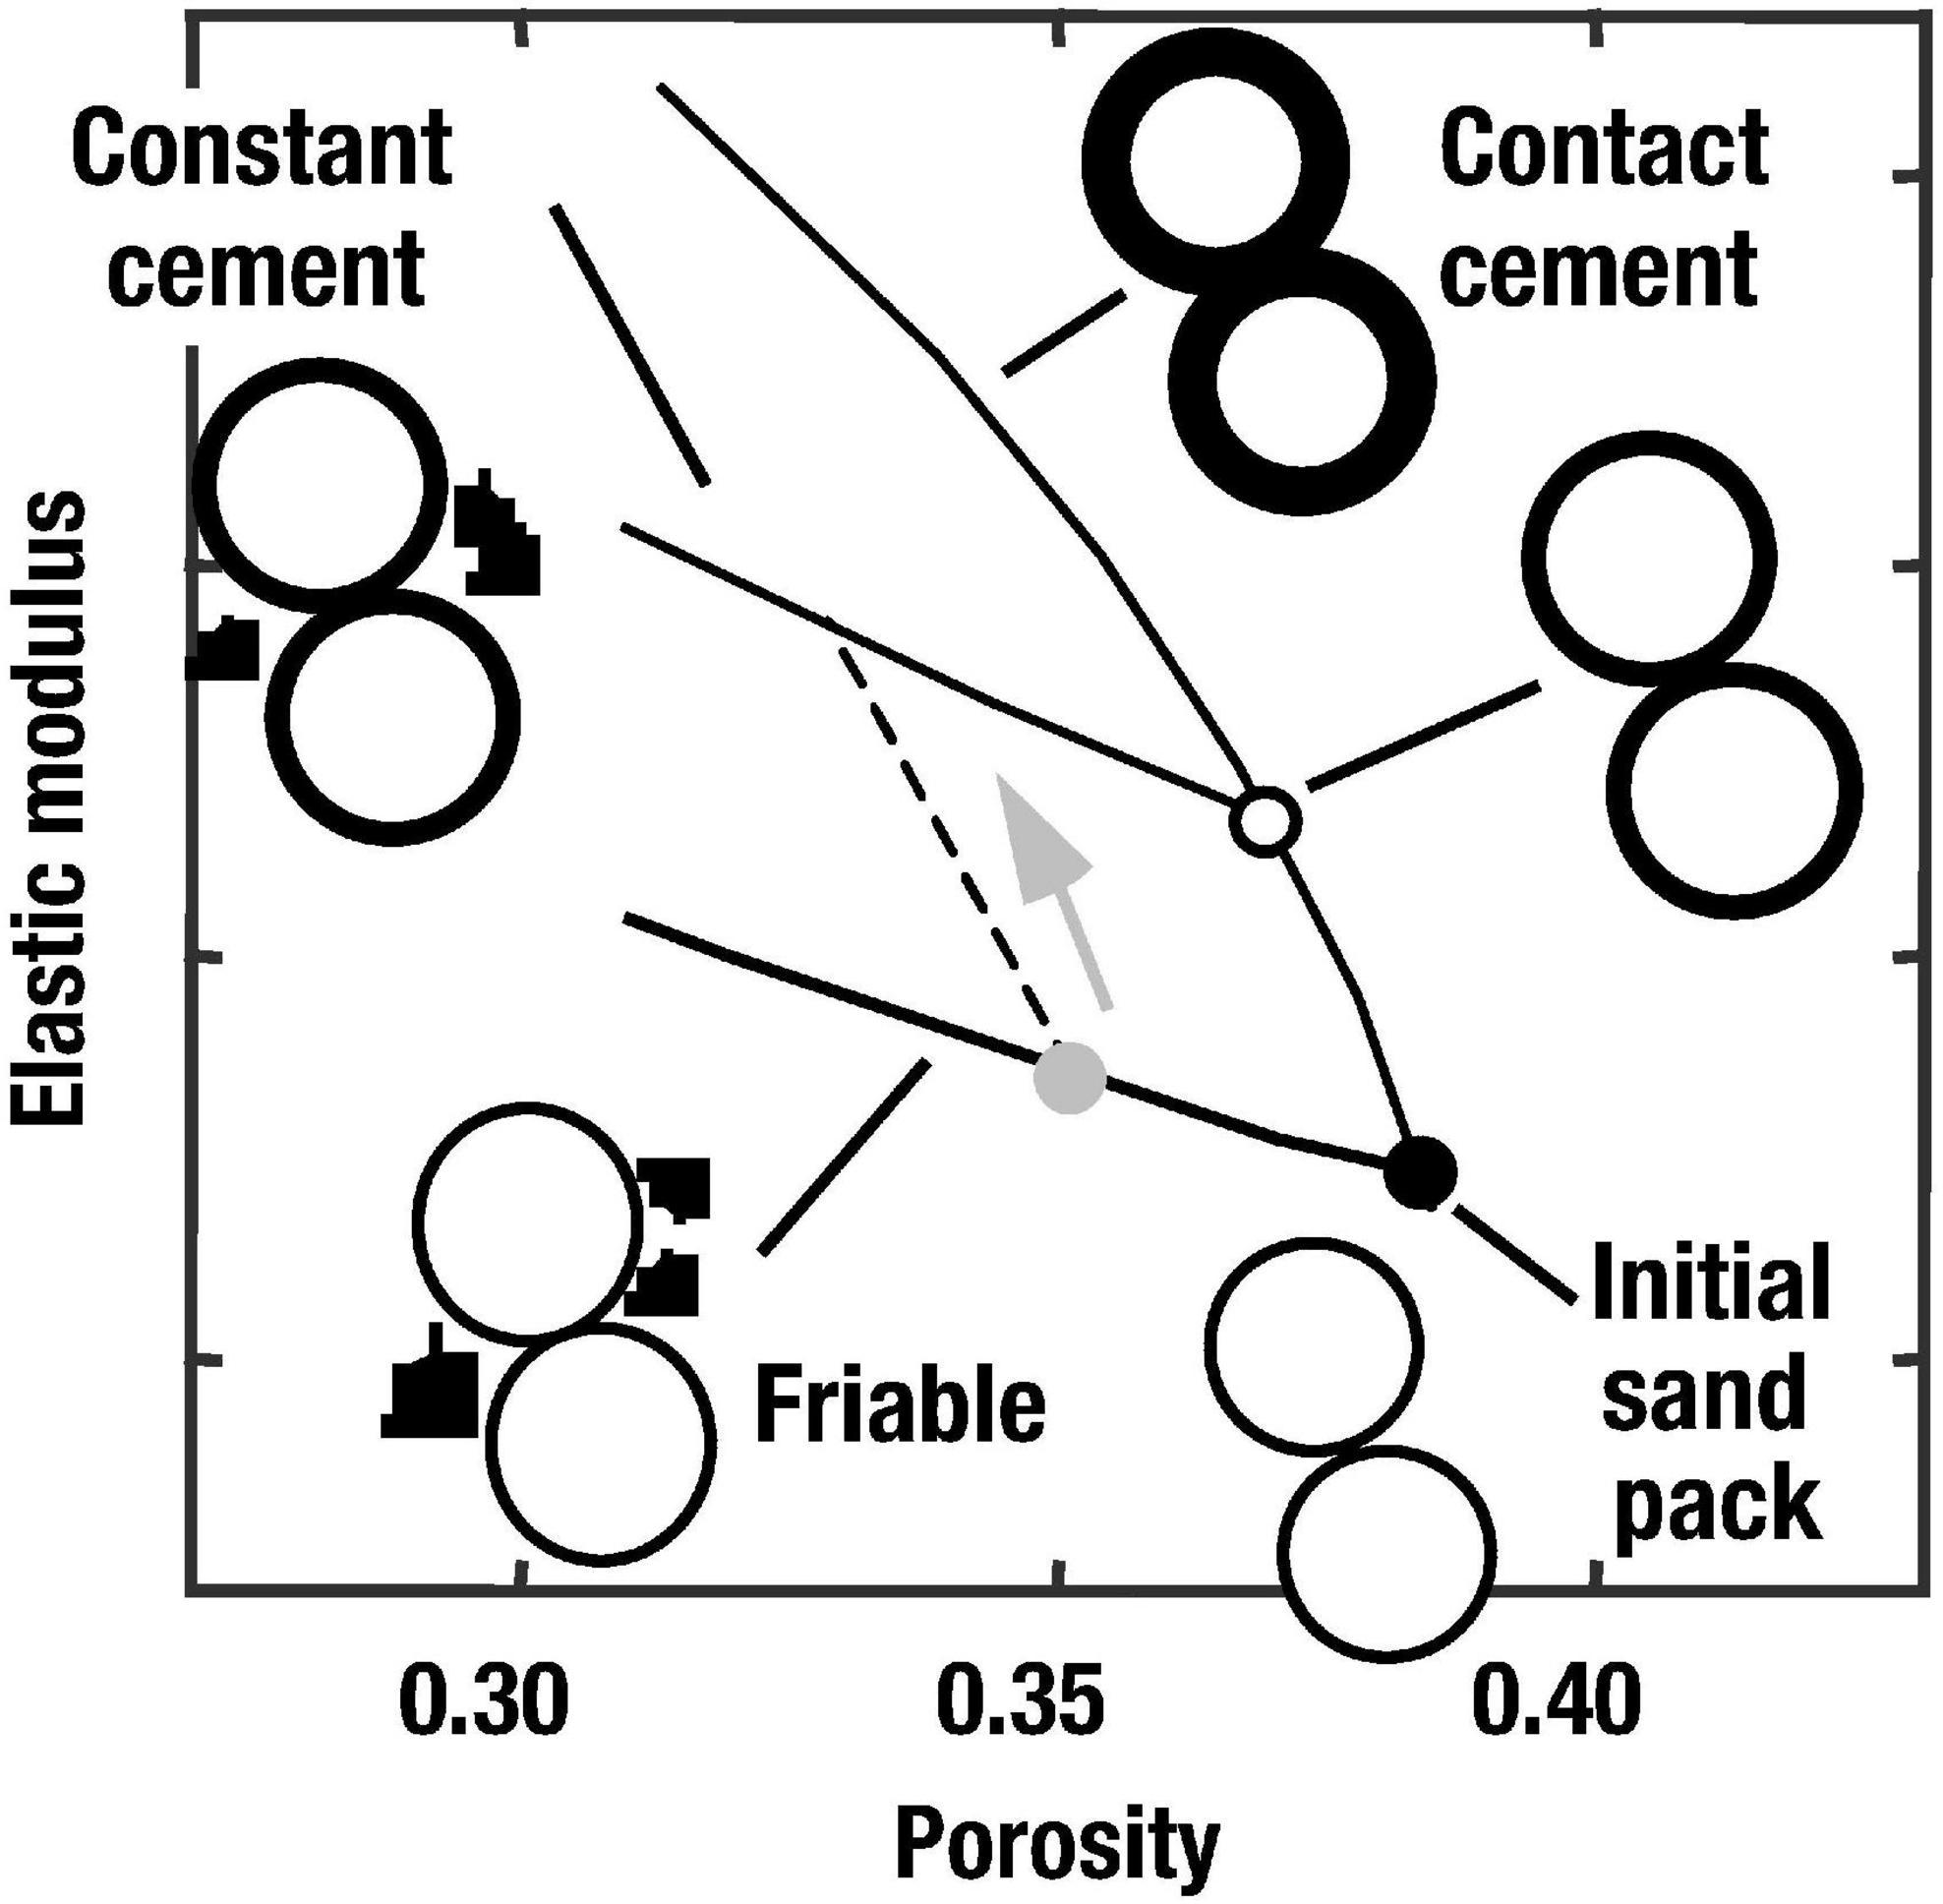
Figure 1. Rock physics diagnostic models used in this study, applicable for high porosity, poorly to moderately consolidated sandstones (Avseth et al., 2000).
For unconsolidated sediments, mechanical compaction is handled via empirical relationships between porosity and burial depth (e.g., Athy, 1930; Magara, 1980). The rate of porosity decrease for sands and shales is more rapid at shallow depths and slows at greater depths of burial. The porosity as a function of burial depth can be expressed with the following exponential function:
where ϕ is the porosity at burial depth z, ϕ0 is the depositional porosity (i.e., critical porosity) at the sea-floor (z = 0), and k is a compactional coefficient [m–1]. Both the depositional porosity and the constant k will vary depending on lithology and clay content. Equation 1 can be modified to include clay content in sandstones (see Ramm and Bjørlykke, 1994). Alternatively, it can be expressed in terms of effective stress instead of burial depth (e.g., Lander and Walderhaug, 1999). We assume hydrostatic pressure and normal compaction for both sands and shales, yet overpressure or underpressure may be included in the modeling. At any given depth, the porosity can be used as a “critical porosity” input for the Hertz-Mindlin contact theory, according to Eq. 1. Sorting variation in sands can then be modeled using the friable sand model. Note that effective stress indirectly controls the rock physics properties via porosity changes in the mechanical compaction domain, c.f., Eq. 1, and at the same time affects the velocities via Hertz-Mindlin contact theory (i.e., pure pressure effect at grain contacts and porosity effect).
Quartz cementation will typically start at temperatures around 70 °C, which generally corresponds to a burial depth of around 2 km. Avseth and Lehocki (2016) and Lehocki and Avseth (2021) showed how the Walderhaug diagenetic model (Walderhaug, 1996) could be combined with the rock physics models above to predict seismic properties as a function of chemical diagenesis for quartz-rich sandstones. Temperature and time are the key parameters controlling the cement volume (fraction), according to the Walderhaug cement model:
where
• Vcemi, Vcem(i−1) [–]: cumulative quartz cement volume fraction precipitated from t = 0 s to t = ti, and from t = 0 s to t = t(i–1), respectively,
• ϕ0cc [–]: porosity at the start of cementation,
• M [g/mol]: molar mass; the value used for quartz is Mqz = 60.09 g/mol,
• A(i–1) [cm2]: cumulative quartz surface area at t = t(i–1),
• ρma [g/cm3]: (quartz) matrix density,
• a, b: constant with a = 1.98⋅10–22 mol/(cm2s) and b = 0.022 1/C,
• ci [°C/s]: heating rate of the i-th segment, estimated from burial/thermal history curves for different stratigraphic intervals,
• di [°C]: initial temperature of the i-th segment of the burial/thermal history curve under scope.
Figure 2 (Lehocki and Avseth, 2021) shows examples of various scenarios for a given burial history, where the sand grain size, sorting and coating are the varied parameters. The initial quartz surface area can be expressed as the cumulative surface area of spheres with a diameter of D:
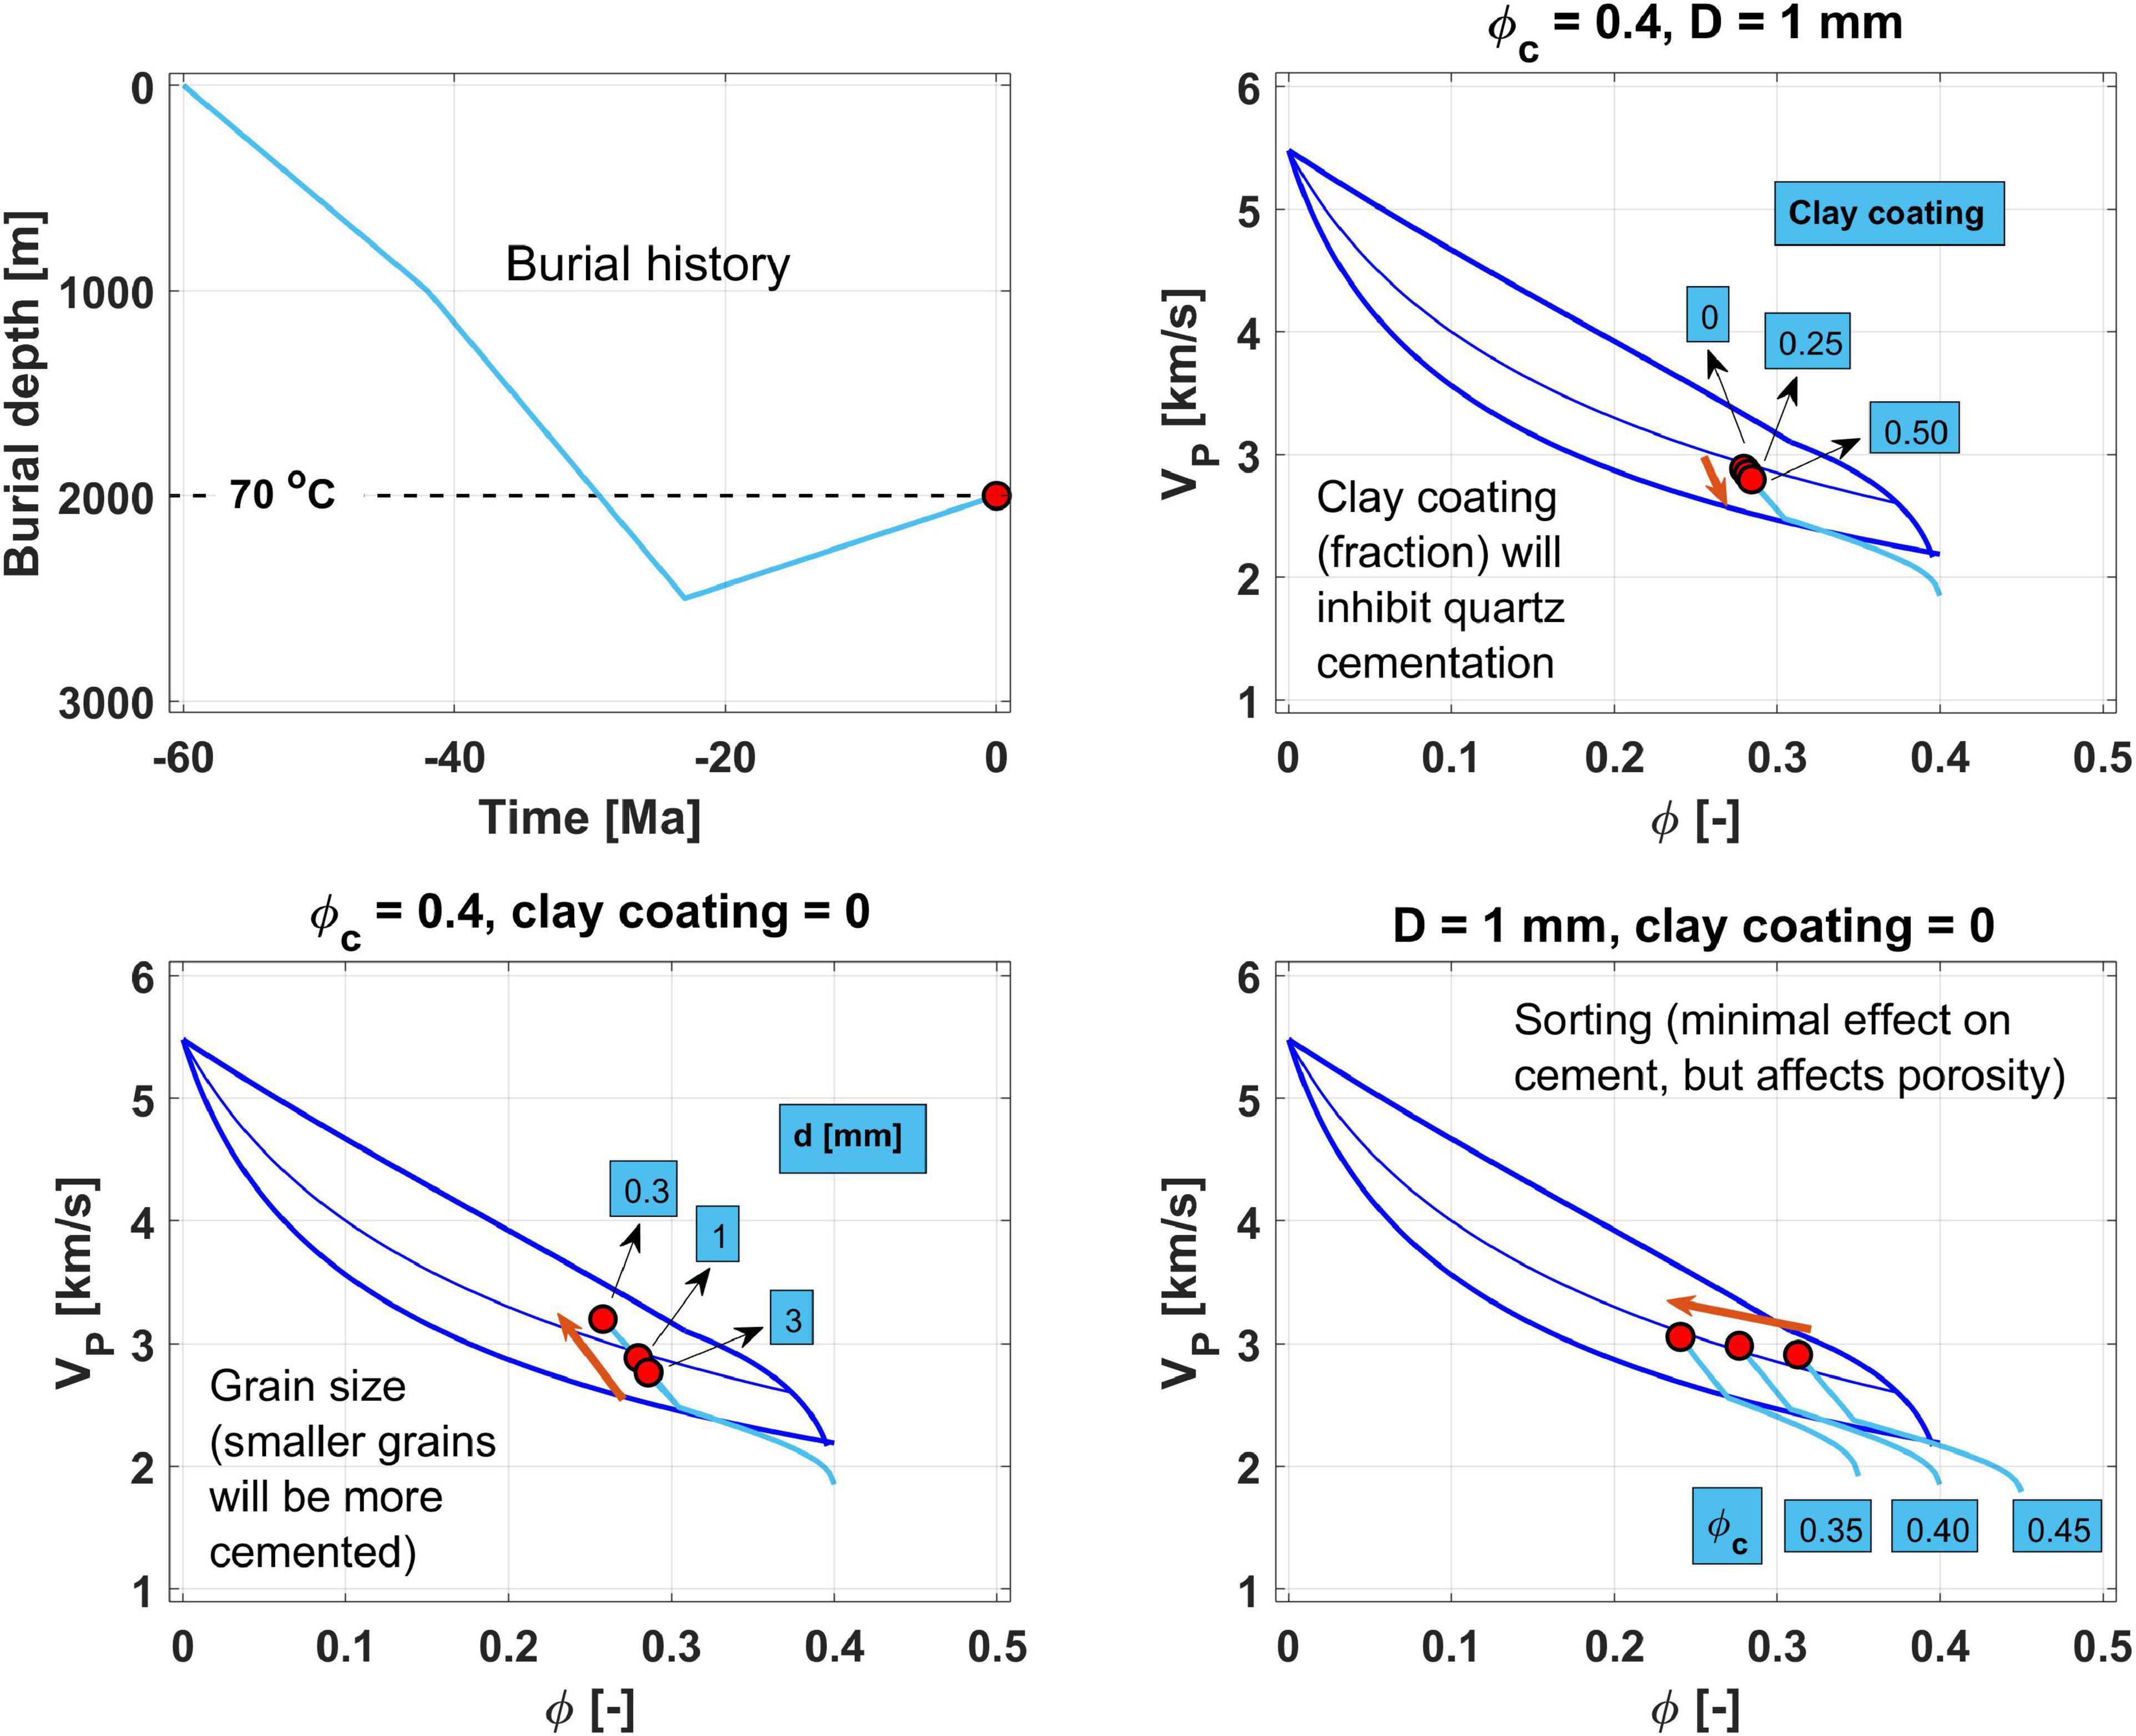
Figure 2. Combined burial (mechanical and chemical compaction) and rock physics modeling using contact theory. The end-points in red represent the present-day properties, whereas the light blue curves show the rock physics properties as a function of geological time. The modeled rock represents a Tertiary age sandstone deposited 60 Ma ago that reached the chemical compaction domain (>70°C) around 30 Ma ago, then maximum burial around 25 Ma ago before the rock was exposed to tectonic uplift (which would also erode a significant part of the overburden) and is presently buried at 2 km beneath the sedimentary surface. The various subplots show the combined burial and rock physics modeling sensitivity to various input geological parameters, comprising clay coating, grain size (D), and sorting (via varying critical porosity).
where
• f [–]— a fraction of detrital quartz
• V [cm3]—a unit volume of the sandstone
• D [cm]—a diameter (size) of the idealized sand sphere (grain)
• coat [–]—a fraction of coated quartz grains
Then, the quartz surface area, A, when Vcem volume fraction of quartz cement has precipitated, is calculated as:
Equation 4 mathematically expresses that the change in quartz surface area caused by precipitation of quartz cement is proportional to the porosity loss caused by quartz precipitation.
In particular, we see that grain size is an important parameter that will affect the cement volume, as it directly affects the specific surface area available for quartz overgrowths. Smaller grain size will have a larger specific surface area than larger grains (e.g., Carman, 1938; Salem and Chilingarian, 1999). Hence, fine-grained sandstones tend to be more cemented than medium- and coarse-grained sandstones for the same burial history. Clay coating will reduce the specific surface area available for nucleation of quartz cementation, commonly associated with authigenic illite and chlorite coatings (Shelukhina et al., 2021).
1D AVO Modeling Constrained by Burial History at Well Locations
The one-dimensional modeling of rock physics properties of sandstones and shales as a function of burial depth in continuously subsiding basins was first presented by Helset et al. (2004), and further developed by Avseth and Dræge (2011); Dræge et al. (2014), and Avseth and Lehocki (2016). An example is shown in Figure 3. Based on burial and temperature history (subplot 1), the Walderhaug (1996) model is used to predict quartz cement volume (subplot 2). This quartz volume will affect the porosity depth trends of the sandstones (subplot 3). Using the Hertz-Mindlin contact theory for the mechanical compaction domain and the Dvorkin-Nur contact cement model combined with modified upper bound Hashin-Shtrikman for the chemical compaction domain, the corresponding rock physics properties can be modeled corresponding to the burial, packing and quartz cement growth. The resulting acoustic impedances and VP/VS ratios are shown in subplots 4 and 5, respectively, including different fluid scenarios (gas, oil, and brine-filled sandstones). A crossplot of VP/VS vs. acoustic impedance for the modeled depth range is shown in subplot 6. The burial history can also be used to constrain the modeling of shale depth trends, either using inclusion based models (c.f. Dræge et al., 2006; Avseth et al., 2008; Carcione and Avseth, 2015) or calibrated contact theory (c.f., Avseth et al., 2003; Avseth and Lehocki, 2016), where the transition from smectite-rich to illite-rich shales is particularly important to honor. As we will show below, shale trends can also easily be modeled with empirical models, given that several wells are available. Shales constitute most of the subsurface in the first few kilometers depth, so even with a few wells, there should be empirical data available to constrain shale trends. Having established both sandstone and shale depth trends, one can create expected AVO signatures of a reservoir sandstone capped by a shale at any given depth (subplot 7 in Figure 3). In the example shown in Figure 3, there is a gradual change from a class 2–3 to class 1–2p (see Castagna and Swan, 1997) for hydrocarbon-filled sandstones when burial depth increases and reservoir rock becomes more consolidated.
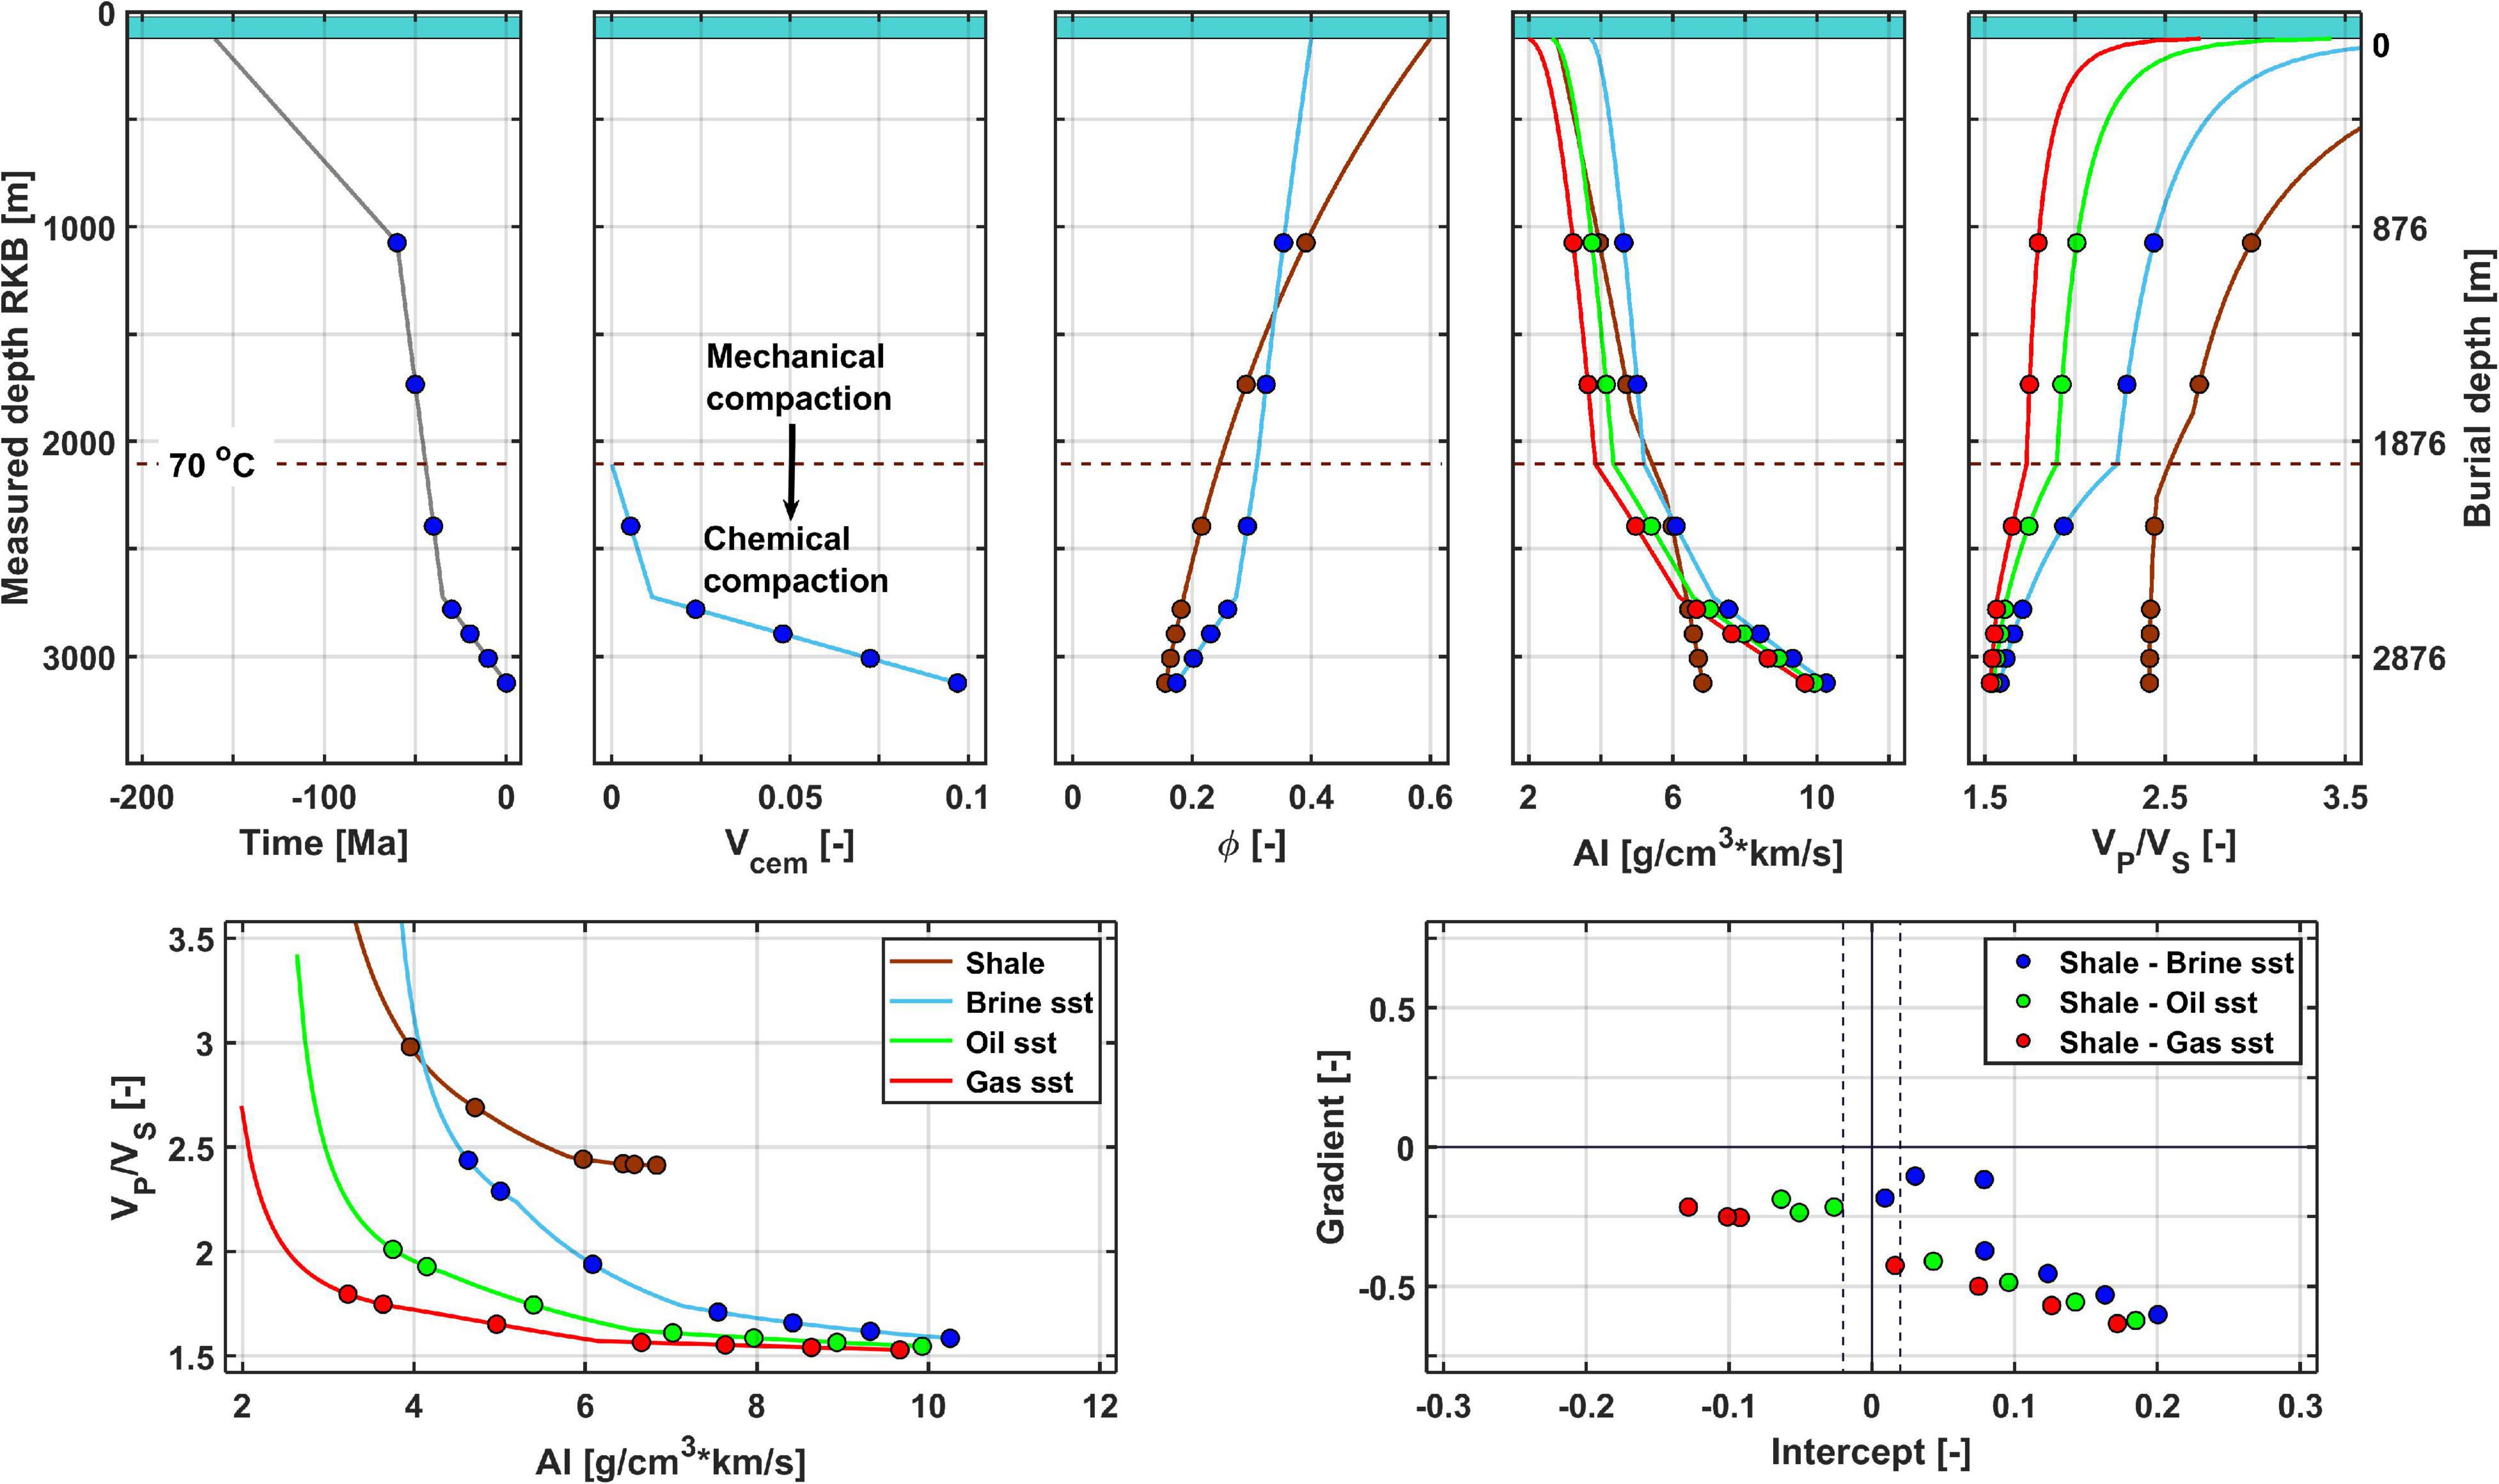
Figure 3. Combined burial and rock physics modeling for a Jurassic sandstone with continuous subsidence. Note the drastic change in rock-physics, and seismic properties as the burial goes from mechanical to chemical compaction domain (>ca. 70°C).
Figure 4 shows another synthetic example, where the burial history includes an uplift episode. Note that the maximum burial happens around 35 Ma ago, at ca. 2.1 km below the sea-floor. The dashed horizontal line in all five upper subplots indicates the 70°C thermocline where we assume that quartz cementation commences. The cementation happens both during subsidence and exhumation as long as the temperatures are higher than ca. 70°C (Bjørlykke, 2015). Hence, porosity decreases, and cement volume increases both during subsidence and uplift below the dashed line. The rock physics properties change drastically due to the cementation effect. Moreover, fluid sensitivities decrease. In this example, we assess uncertainties in input parameters during the AVO modeling of today’s rock physics properties (by adding 5% error to modeled elastic parameters both for reservoir sandstone and cap-rock shale; see Avseth et al. (2003) for the established methodology of depth-dependent AVO scatter-plots). However, for the modeled scenario, we still expect quite a good separation between oil-saturated and brine saturated sandstones, still with significant overlaps in the intercept-gradient subplot.
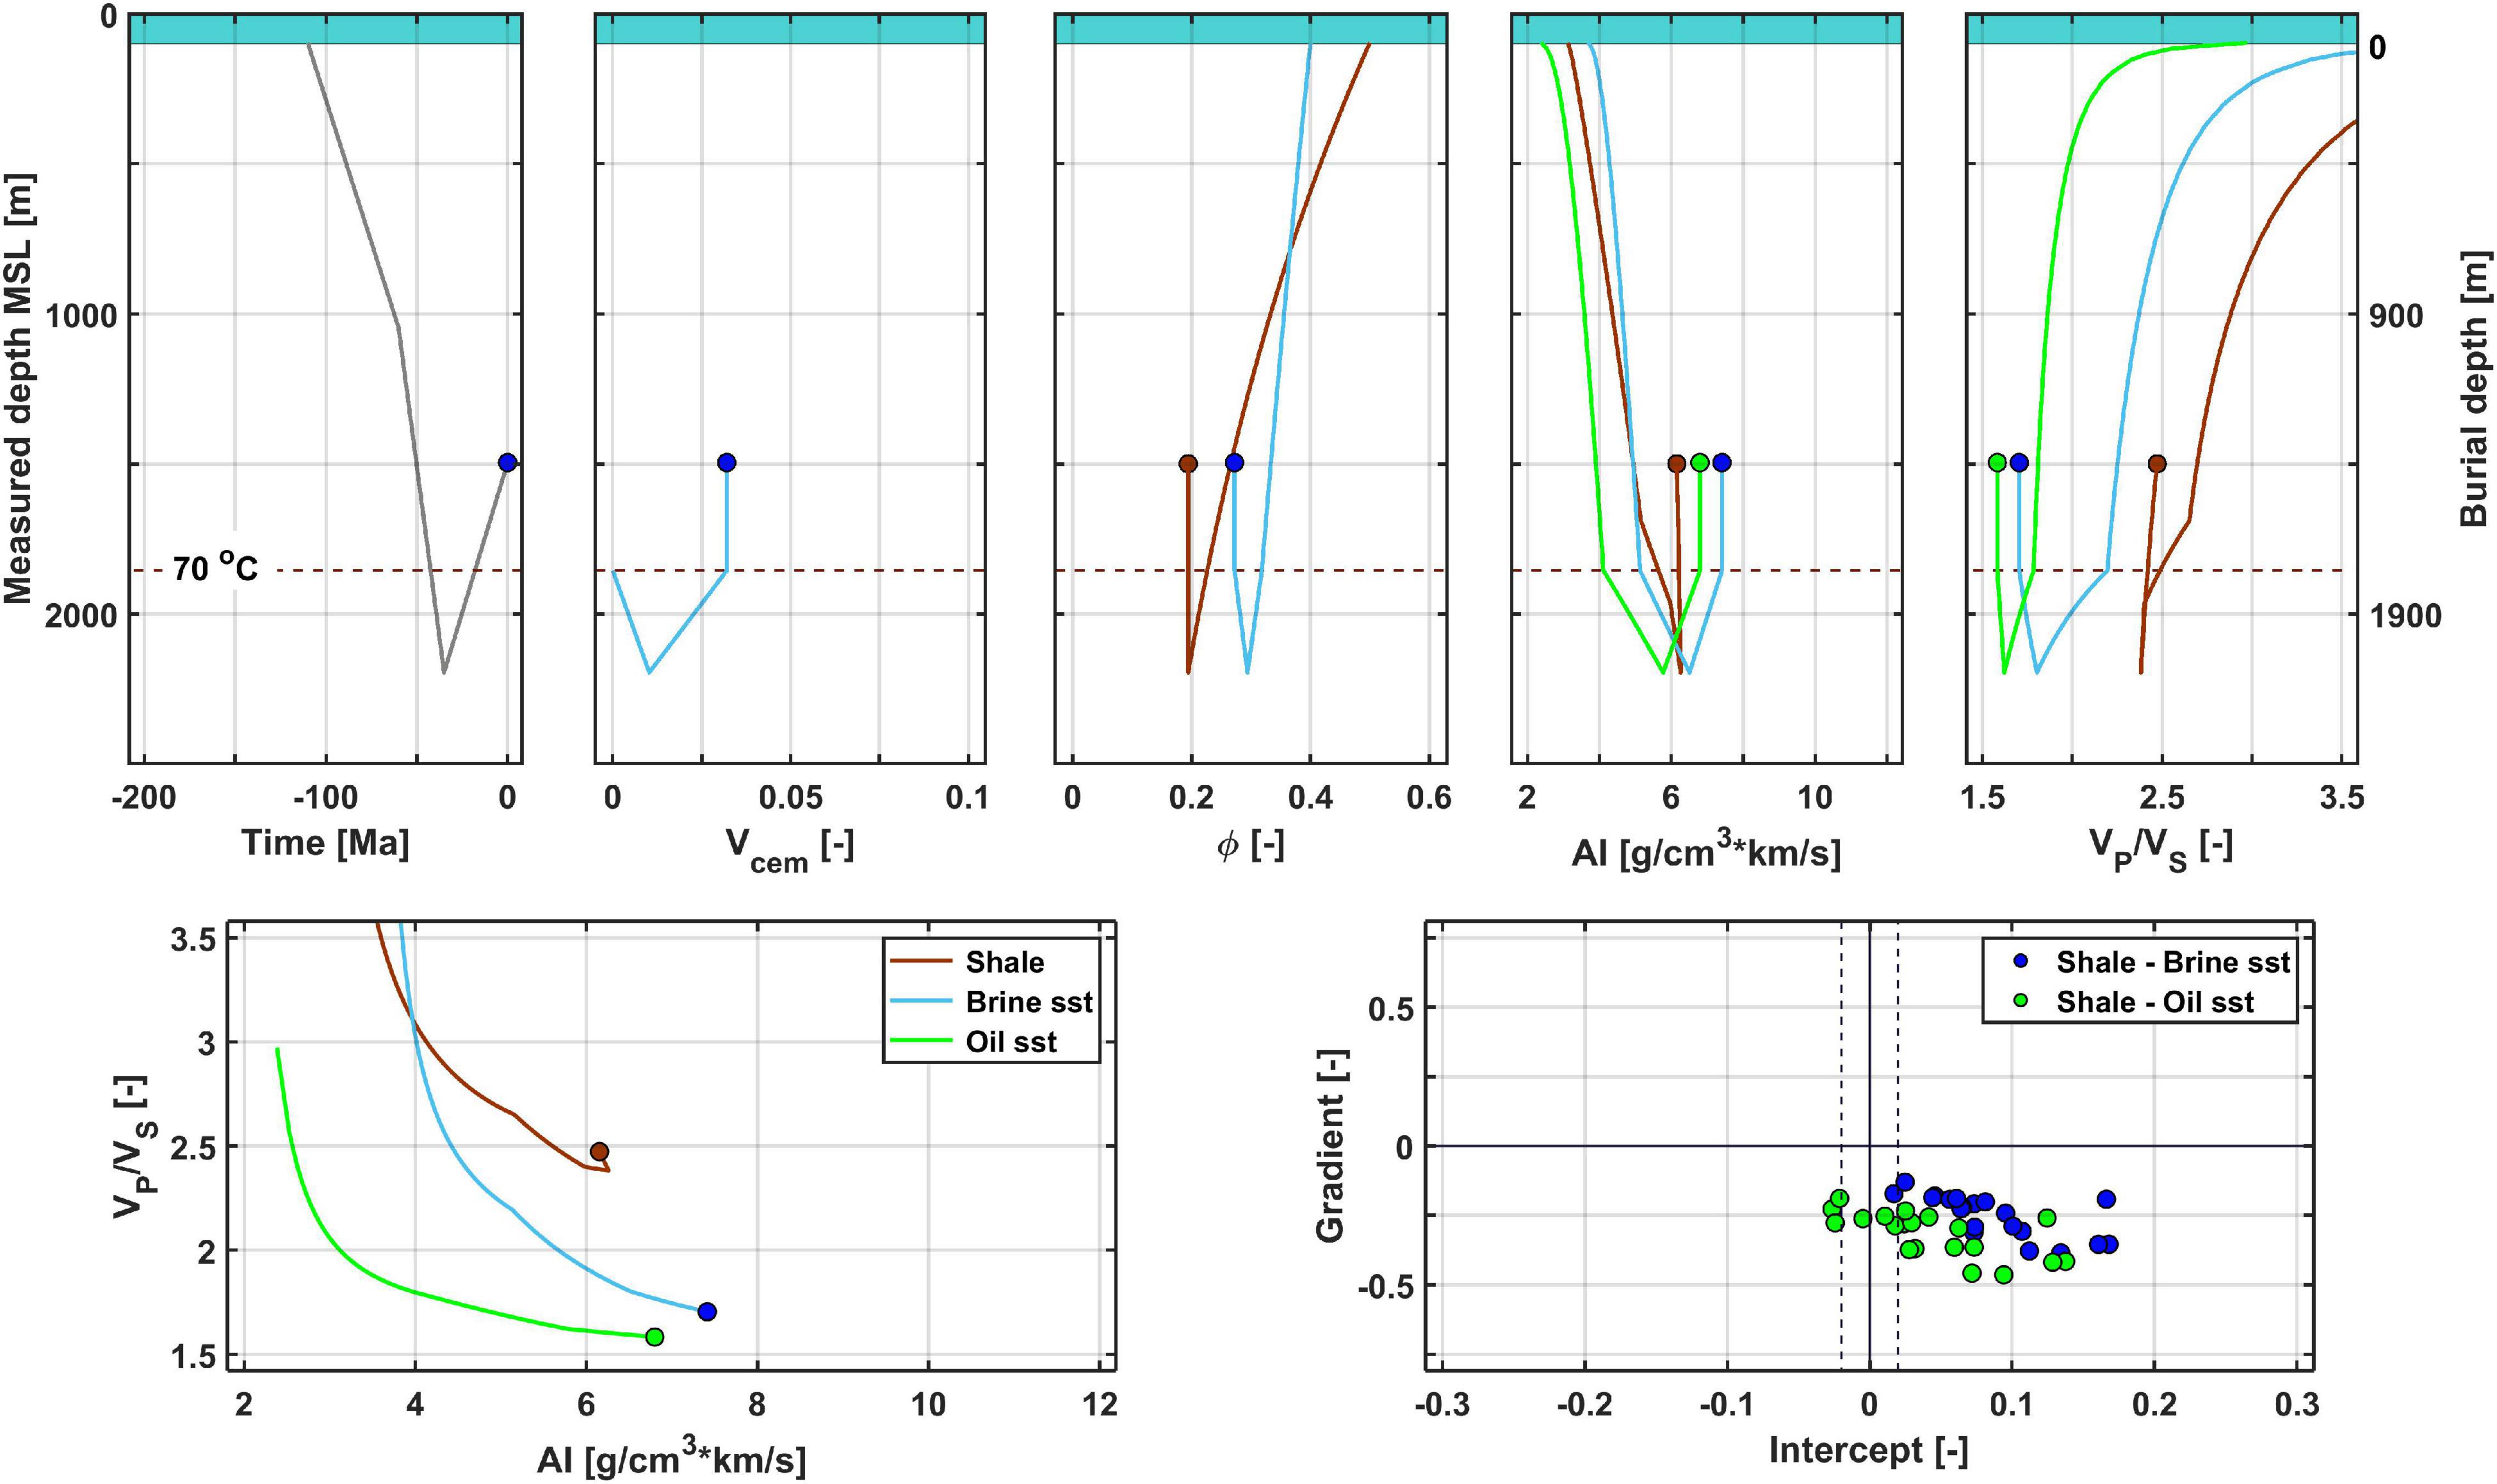
Figure 4. Combined burial and rock physics modeling for a Cretaceous sandstone with Cenozoic tectonic uplift. Note the drastic change in rock physics, and seismic properties as the burial goes from mechanical to chemical compaction domain (>ca. 70°C indicated by the dashed horizontal line).
Figure 5 shows a real data example of 1D AVO feasibility modeling performed at a well (15/5-5) in the Glitne Field, North Sea (see Avseth et al., 2001, for more background information about this field example). The temperature gradient in this well is estimated to be 34.4oC/km, and the average grain size in the target zone is 0.2–0.3 mm (fine-to-medium-grained sandstone), and clay content is around 10–15%. The rock physics modeling at the Top Heimdal Fm (upper) fits with observed well log data, and we expect AVO class 2p-2 for brine-saturated sandstones and class 2–3 for oil-saturated sandstones. The top reservoir is located just beneath the onset of chemical compaction, and the burial history is quite simple with continuous subsidence since the deposition of the Tertiary age turbidite sandstones. We also model the expected AVO signature at the slightly deeper Top Ty Fm (lower). Here we expect a slightly stiffer (i.e., more cemented) sandstone with AVO class 1 for brine-saturated sandstones and class 2p for oil-saturated sandstones. This real-data example illustrates how important control the burial history has on the expected AVO signatures (c.f. Avseth et al., 2008).
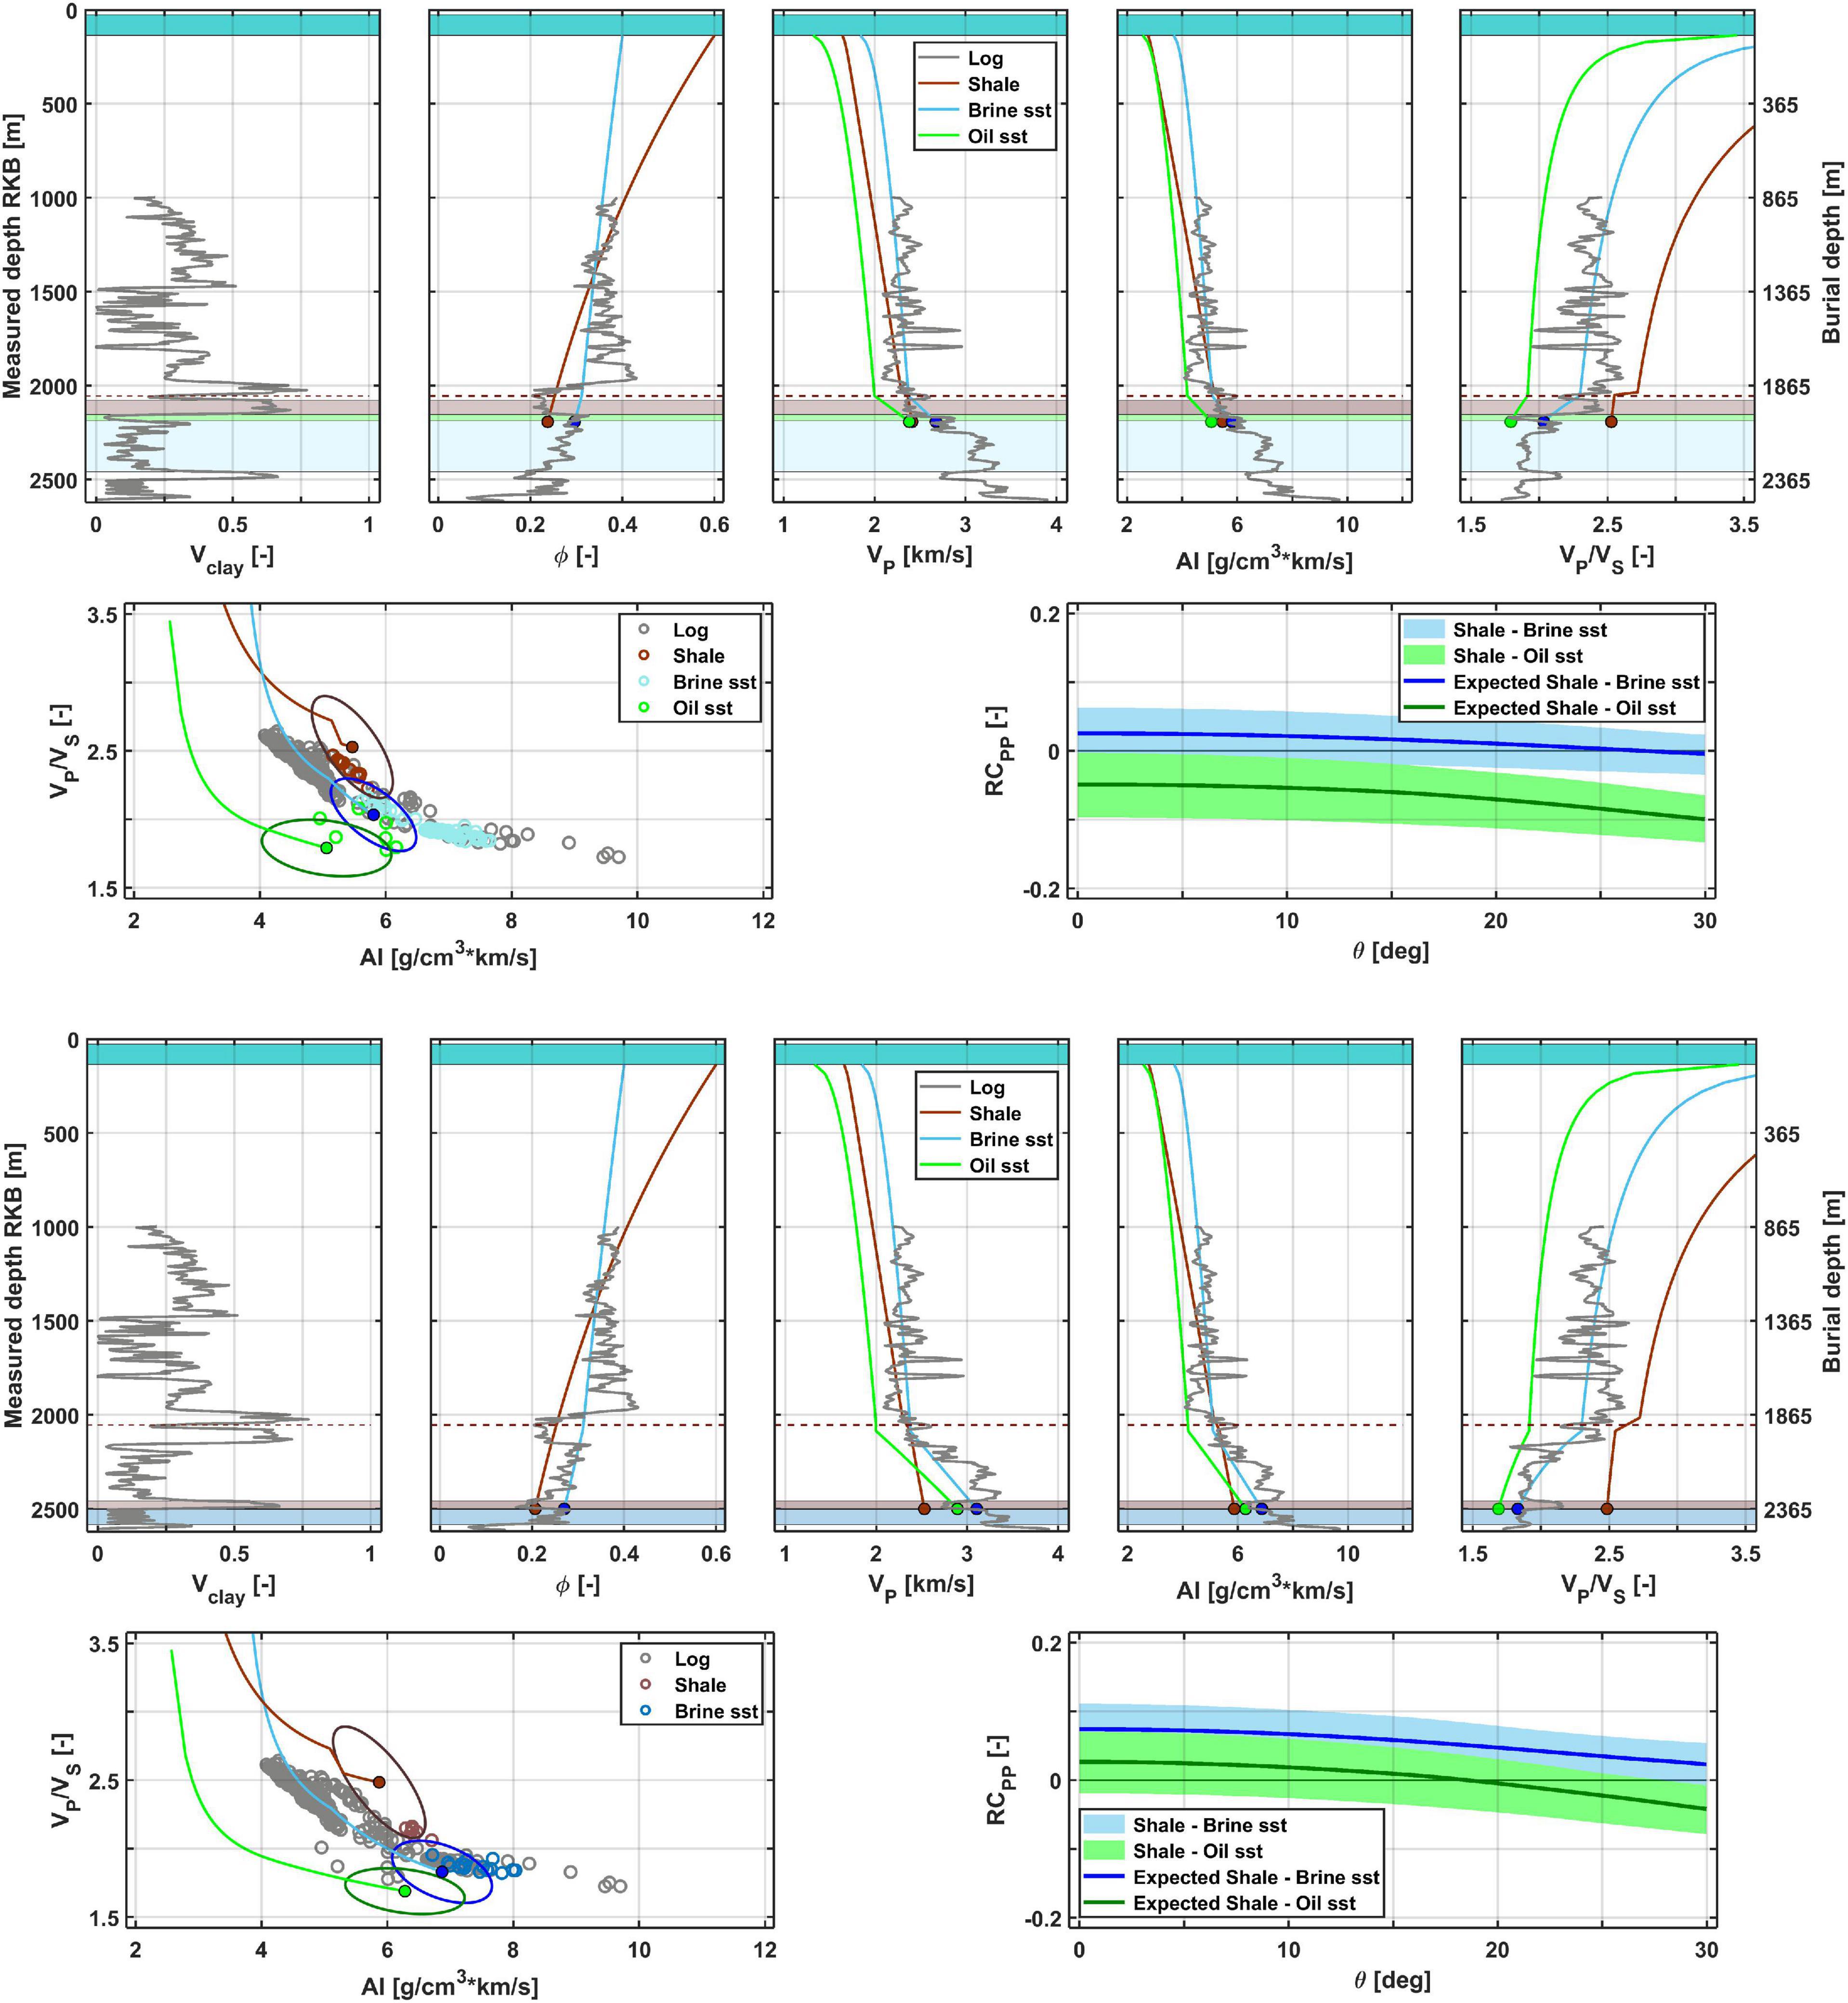
Figure 5. Combined burial and rock physics modeling for Paleocene sandstones in Well 15/5-5 in the Glitne Field, North Sea. Note the change in elastic properties as we go from mechanical to chemical compaction at around 2,000 m burial depth (indicated by dashed brown horizontal line). The expected AVO signatures change drastically as we go from the Top Heimdal Fm horizon (upper) to the slightly deeper Top Ty Fm horizon (lower). The expected oil response for the Ty Formation is similar to the expected brine response of the Heimdal Formation. This shows the importance of burial history as a key constraint in AVO analysis.
2D AVO Feasibility Modeling (Barents Sea Demonstration)
Deriving Burial History and Net Erosion From Seismic Velocities
The same approach, as described above, can be used to model expected AVO signatures along a given seismic horizon. The burial history can be derived from seismic velocities where a normal compaction curve is defined for an area, and the deviation from this reference trend at a given location will provide information about maximum burial (e.g., Hjelstuen et al., 1996; Japsen, 1999; Baig et al., 2016). This exercise can be done on well log data and/or on seismic velocity data. Additional geological information (basin modeling, stratigraphic analysis, vitrinite reflectance, etc.) can guide the calibration of velocities into maximum burial and net erosion or exhumation maps (e.g., Gatemann and Avseth, 2016). From a given horizon (or a defined interval around this horizon), one can then derive a net exhumation map from seismic velocity data (e.g., interval velocities, tomography, or FWI P-wave velocities), which will be input to the burial constrained AVO modeling at any location of this horizon (Figure 6). Here, we demonstrate this workflow on a data set from the Barents Sea.
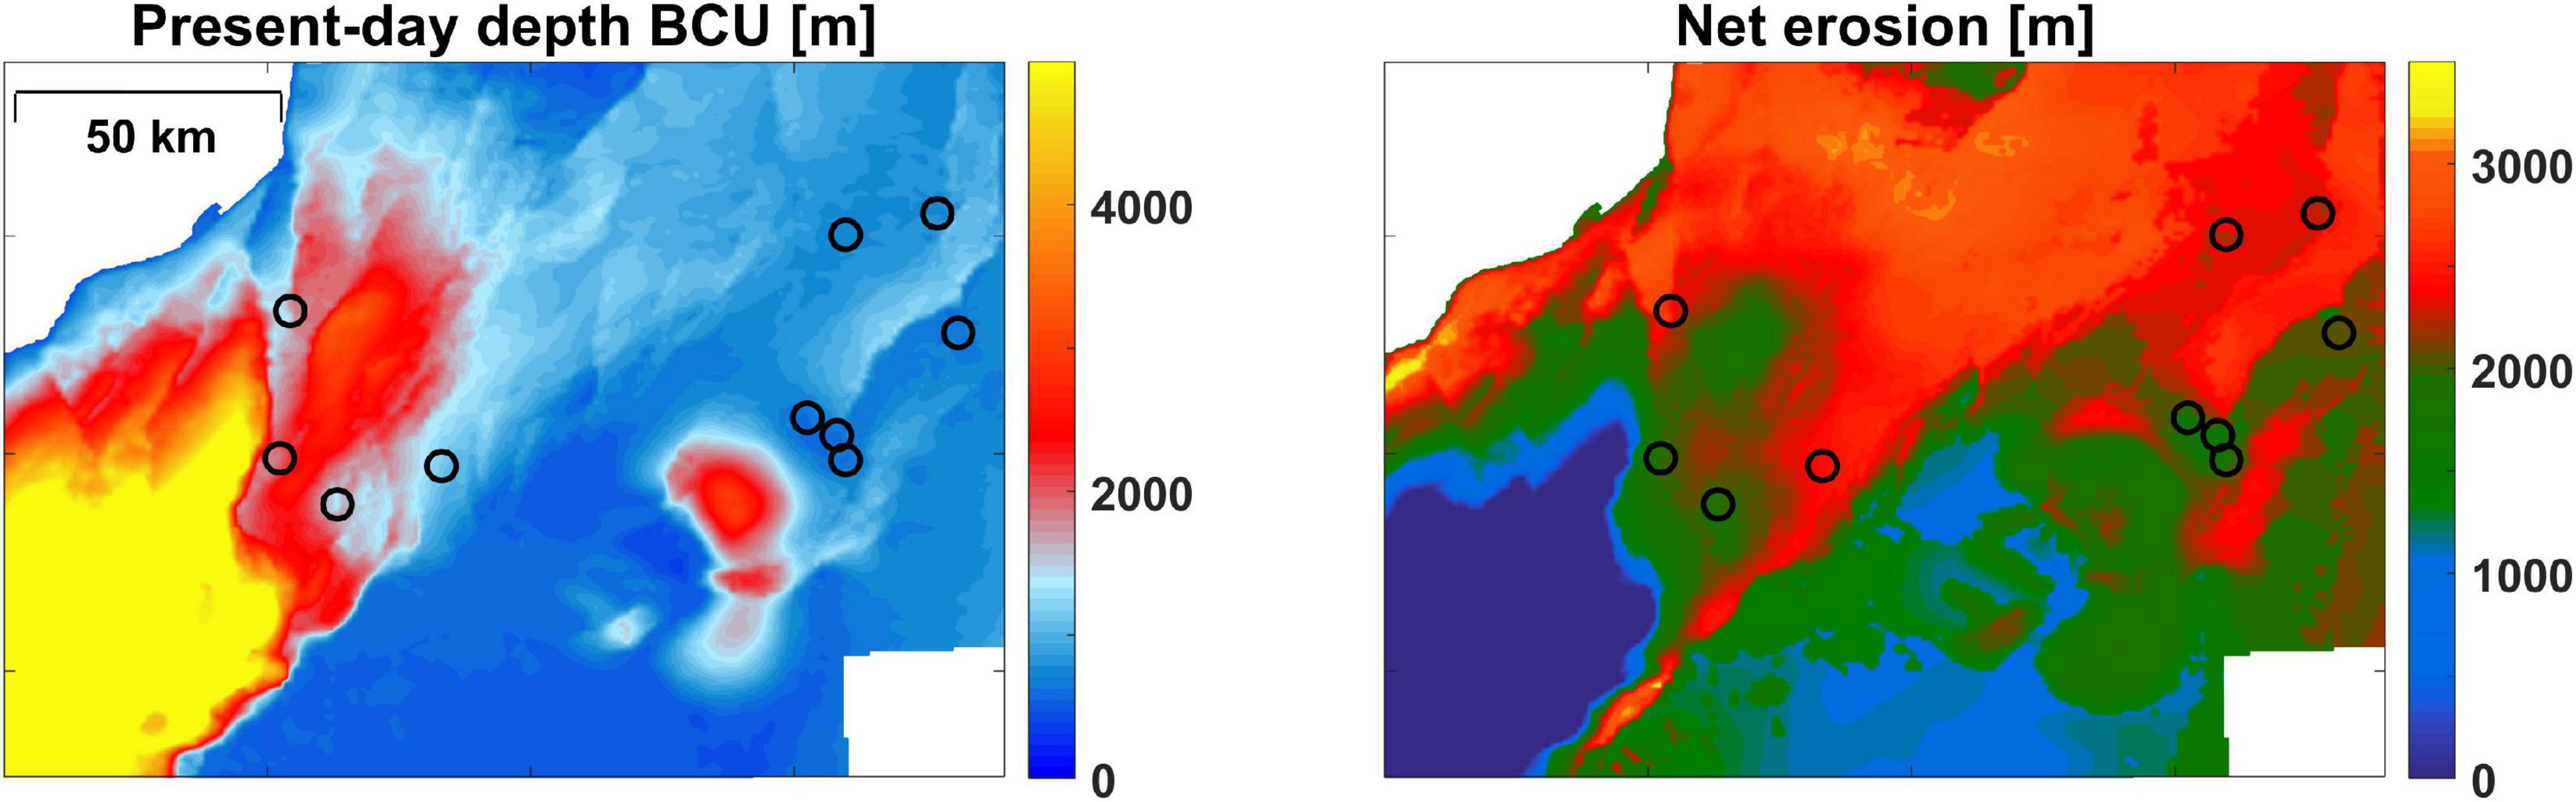
Figure 6. Left: Present-day Base Cretaceous Unconformity (BCU) horizon (which is close to the Top Stø Fm sandstone horizon) in the selected area in the southern Barents Sea (offshore Norway), and selected well locations used in the calibration study (black circles). Right: Estimated net erosion map derived from seismic velocities relative to a normal compaction trend (Adapted from Avseth et al., 2020b).
Temperature gradients vary both spatially and with time. Temperature gradient maps can be used directly as input in the modeling (Avseth et al., 2020b), or we can select constant temperature gradients during the modeling of feasibility maps. Then, via several plausible scenarios, we can test different temperature gradients. The modeling of the feasibility maps is performed in the same way as for the 1D modeling done at a well location in the previous section. In this way, we are extrapolating the AVO modeling away from well locations in agreement with the geological variation estimated from the seismic velocities via the net erosion and maximum burial maps.
Burial-Constrained Modeling of Sandstone Properties
Next, forward modeling of the expected rock physics properties and associated AVO responses for selected scenarios is performed, given the input burial history (Figure 7). The methodology introduced by Avseth and Lehocki (2016) for combined compaction and rock physics modeling in 1D (outlined in the previous section) is extended to perform 2D modeling of rock physics properties and associated AVO feasibility maps constrained by the net erosion map shown in Figure 6. In this way, the expected rock physics properties of a sandstone (saturated with any pore fluid) can be predicted at any given location of a 2D map while honoring the rock’s burial (and thermal) history at this very location. Each curve in any of the subplots of Figure 7, indicated by orange points representing both maximum burial and present-day depth, corresponds to a given X-Y location in the net-erosion map shown in Figure 6.
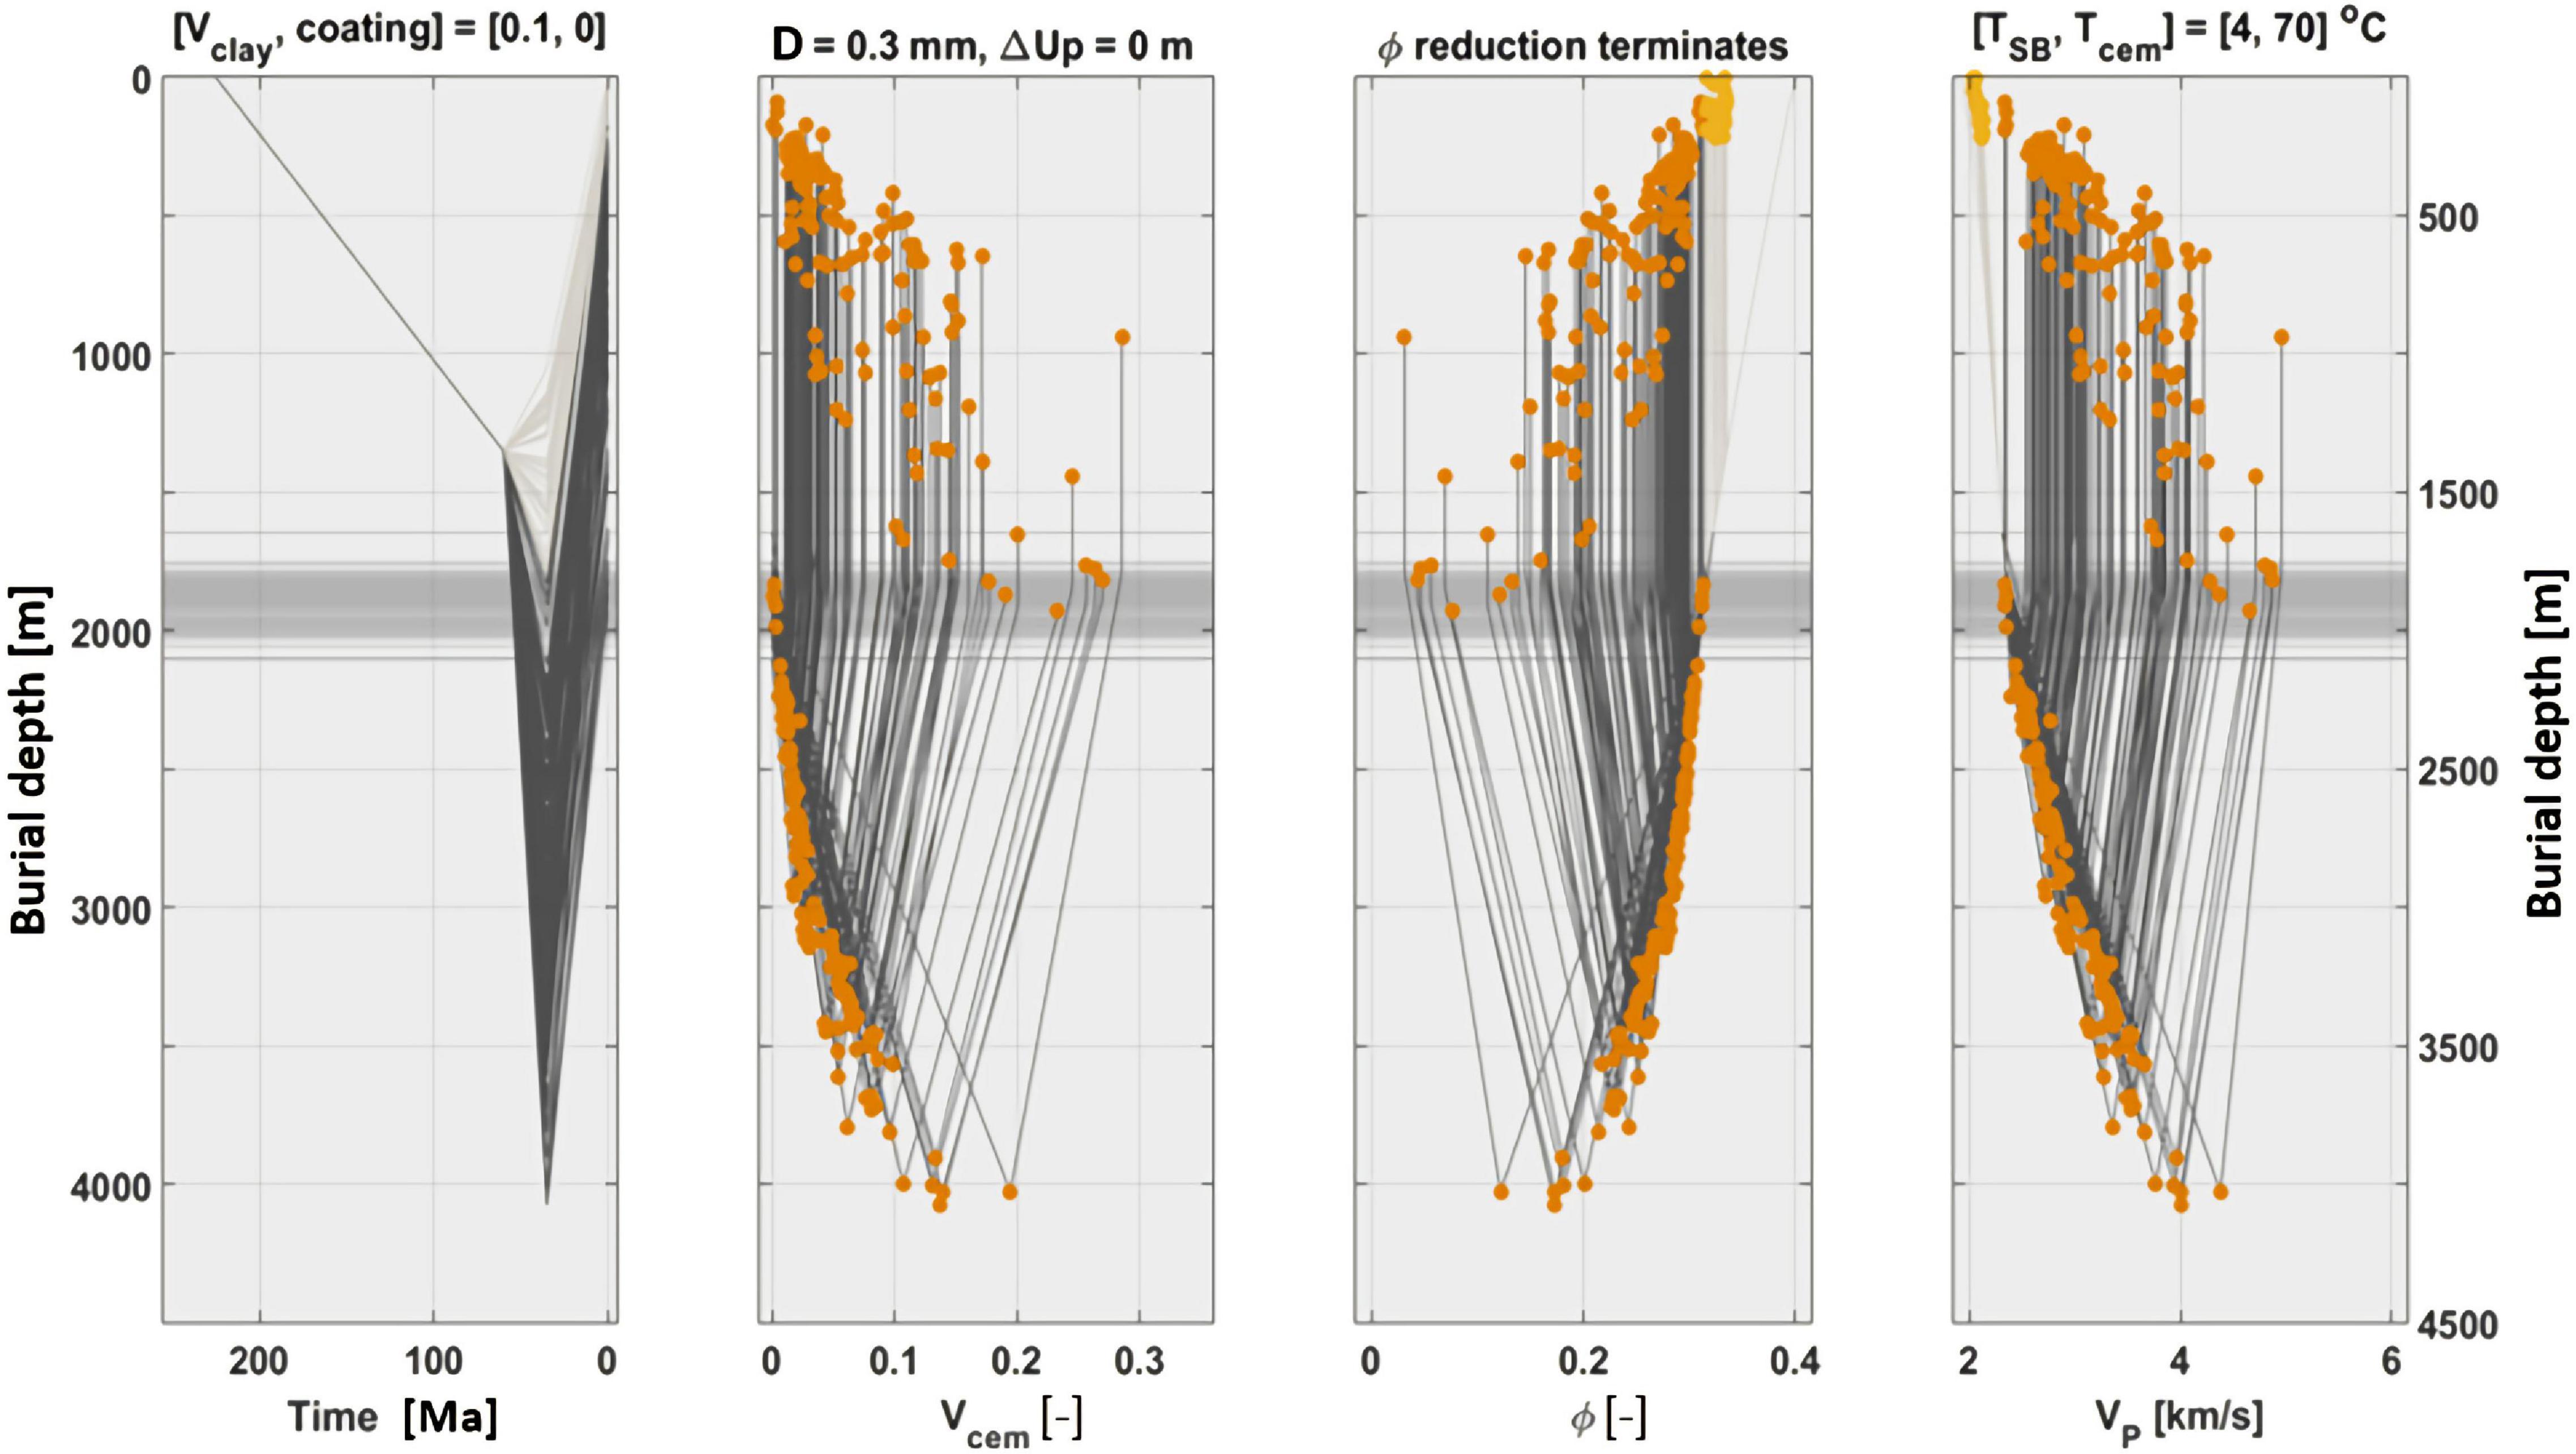
Figure 7. Combined burial and rock physics modeling for clean sandstone of a Jurassic sandstone with varying burial history at different locations of the map shown in Figure 6. Walderhaug model predicts the cement volume (subplot 2) for a given burial/temperature history (subplot 1), and the porosities are updated accordingly (subplot 3). Eventually, the seismic velocities are predicted using rock physics models (subplot 4). Note that the lighter burial history curves seen in subplot 1 are those that do not enter the cementation window (i.e., the T = 70 oC lower limit), not even at the time of their maximum burial. The corresponding end-points in porosity and VP subplots are marked by lighter orange color to discern them from the (majority of darker) orange points that have been at least slightly cemented. Note also that since the Tgrad varies from point-to-point, the depth of cementation onset can change from one X–Y point to another: this transition from a mechanical compaction domain to a chemical compaction domain for each curve is seen as a horizontal (gray) line in each subplot.
Empirical Shale Trends
Before we can conduct the AVO modeling at any given depth, we also need to establish shale depth trends. The rock physics modeling of shale depth trends is a challenging task. Several rock physics models have been used to model shale depth trends (e.g., Avseth et al., 2003, 2008; Dræge et al., 2006; Carcione and Avseth, 2015). However, the complexity of shale texture and the lack of knowledge related to chemical diagenesis in shales make it particularly challenging to create predictive models for shales using physical models. As shown in Figure 3, we see that the shale depth trends can be modeled heuristically using calibrated contact theory (see also Avseth et al., 2005). However, physical models for shales tend to work well in the mechanical compaction domain, but not very well for the chemical compaction domain, due to complex cementation processes in shales. The illitization of marine smectite-rich shales happens around the same burial depth and temperature as quartz cementation of sandstones (i.e., 60–80°C). Carcione and Avseth (2015) showed how to account for the transition from smectite-rich to illite-rich shales in the rock physics modeling of clay-rich organic-rich shales using a kinetic equation. However, this chemical diagenesis also produces micro-crystalline quartz as a by-product, in addition to extra water that is released into the pore-space. The water may cause overpressure and reduced velocities. On the contrary, the micro-crystalline quartz will likely stiffen the rock frame and lithify the shale into a mudrock and cause a significant increase in velocity and a drop in VP/VS (Thyberg et al., 2009).
As of today, there is no good holistic rock physics model to mimic all these complex geologic processes. Hence, we select to estimate empirical regression models for the shales from the well log data. Figure 8 shows the resulting empirical trends for separate key shale intervals and a regression model for all key shale intervals lumped together. We have plotted well log data corrected for uplift, according to the analysis above (i.e., against the maximum burial). We have also superimposed well-known regression models for Norwegian shelf shales published in the literature, including the model by Hjelstuen et al. (1996) and Japsen (1999). The green circles are average values from well log data (from the wells indicated in the map in Figure 6) for the various shale intervals. We test out both power-law regressions (of the form y = a⋅xb + c) and linear regression models (y = a⋅x + b). The power law seems to better describe the data in the Fuglen Fm. However, the two data points in the 2,300–2,500 m interval represent two wells where the Fuglen Fm is very silty, likely due to the early transgression availability of near-shore silty particles. Hence, we find it is better to describe the compaction trends in shales using the linear trends, even though the local fit to more silty shales is poorer. Care should be taken using a power-law, as this one can give large errors outside the observation span (particularly when doing extrapolation to more shallow depth). The empirical shale trends in Figure 8 are essential as inputs for the AVO modeling constrained by burial history.

Figure 8. Empirical shale trends. Models for separate shale intervals are shown from left to right, comprising Kolje, Fuglen, and Fruholmen Fm-s. Regression lines are also made for all shale intervals together (rightmost subplot). Published trends by Hjelstuen et al. (1996) and Japsen (1999) are superimposed.
Elastic Property Feasibility Maps
From the burial-constrained rock physics modeling, we create forward-modeled maps of elastic properties for the Fuglen Fm cap-rock shale and the Stø Fm reservoir sandstones (Figure 9). We test out various scenarios and the sensitivity of important input parameters. Figure 9 shows a scenario where the dominating grain size of sandstones is 0.3 mm (i.e., medium grain size), the pore-filling clay content is 0.1, the temperature gradient is 38°C/km, and the pore fluid is oil. Note the significant imprint of geologic structures and tectonics. This is geologic information brought into the modeling from the seismic velocity data and stratigraphic interpretations. The area in the west has the largest maximum burial, which explains the very high acoustic impedance values (>10 g/cm3⋅km/s). This is an area where we expect very low seismic fluid sensitivity. Eastward, the maximum burial is lower, and in some areas the rocks have not even been cemented (T < ca. 70°C at maximum burial). Here, the impedance values are significantly lower (<10 g/cm3⋅km/s), and we would expect better seismic detectability of oil.
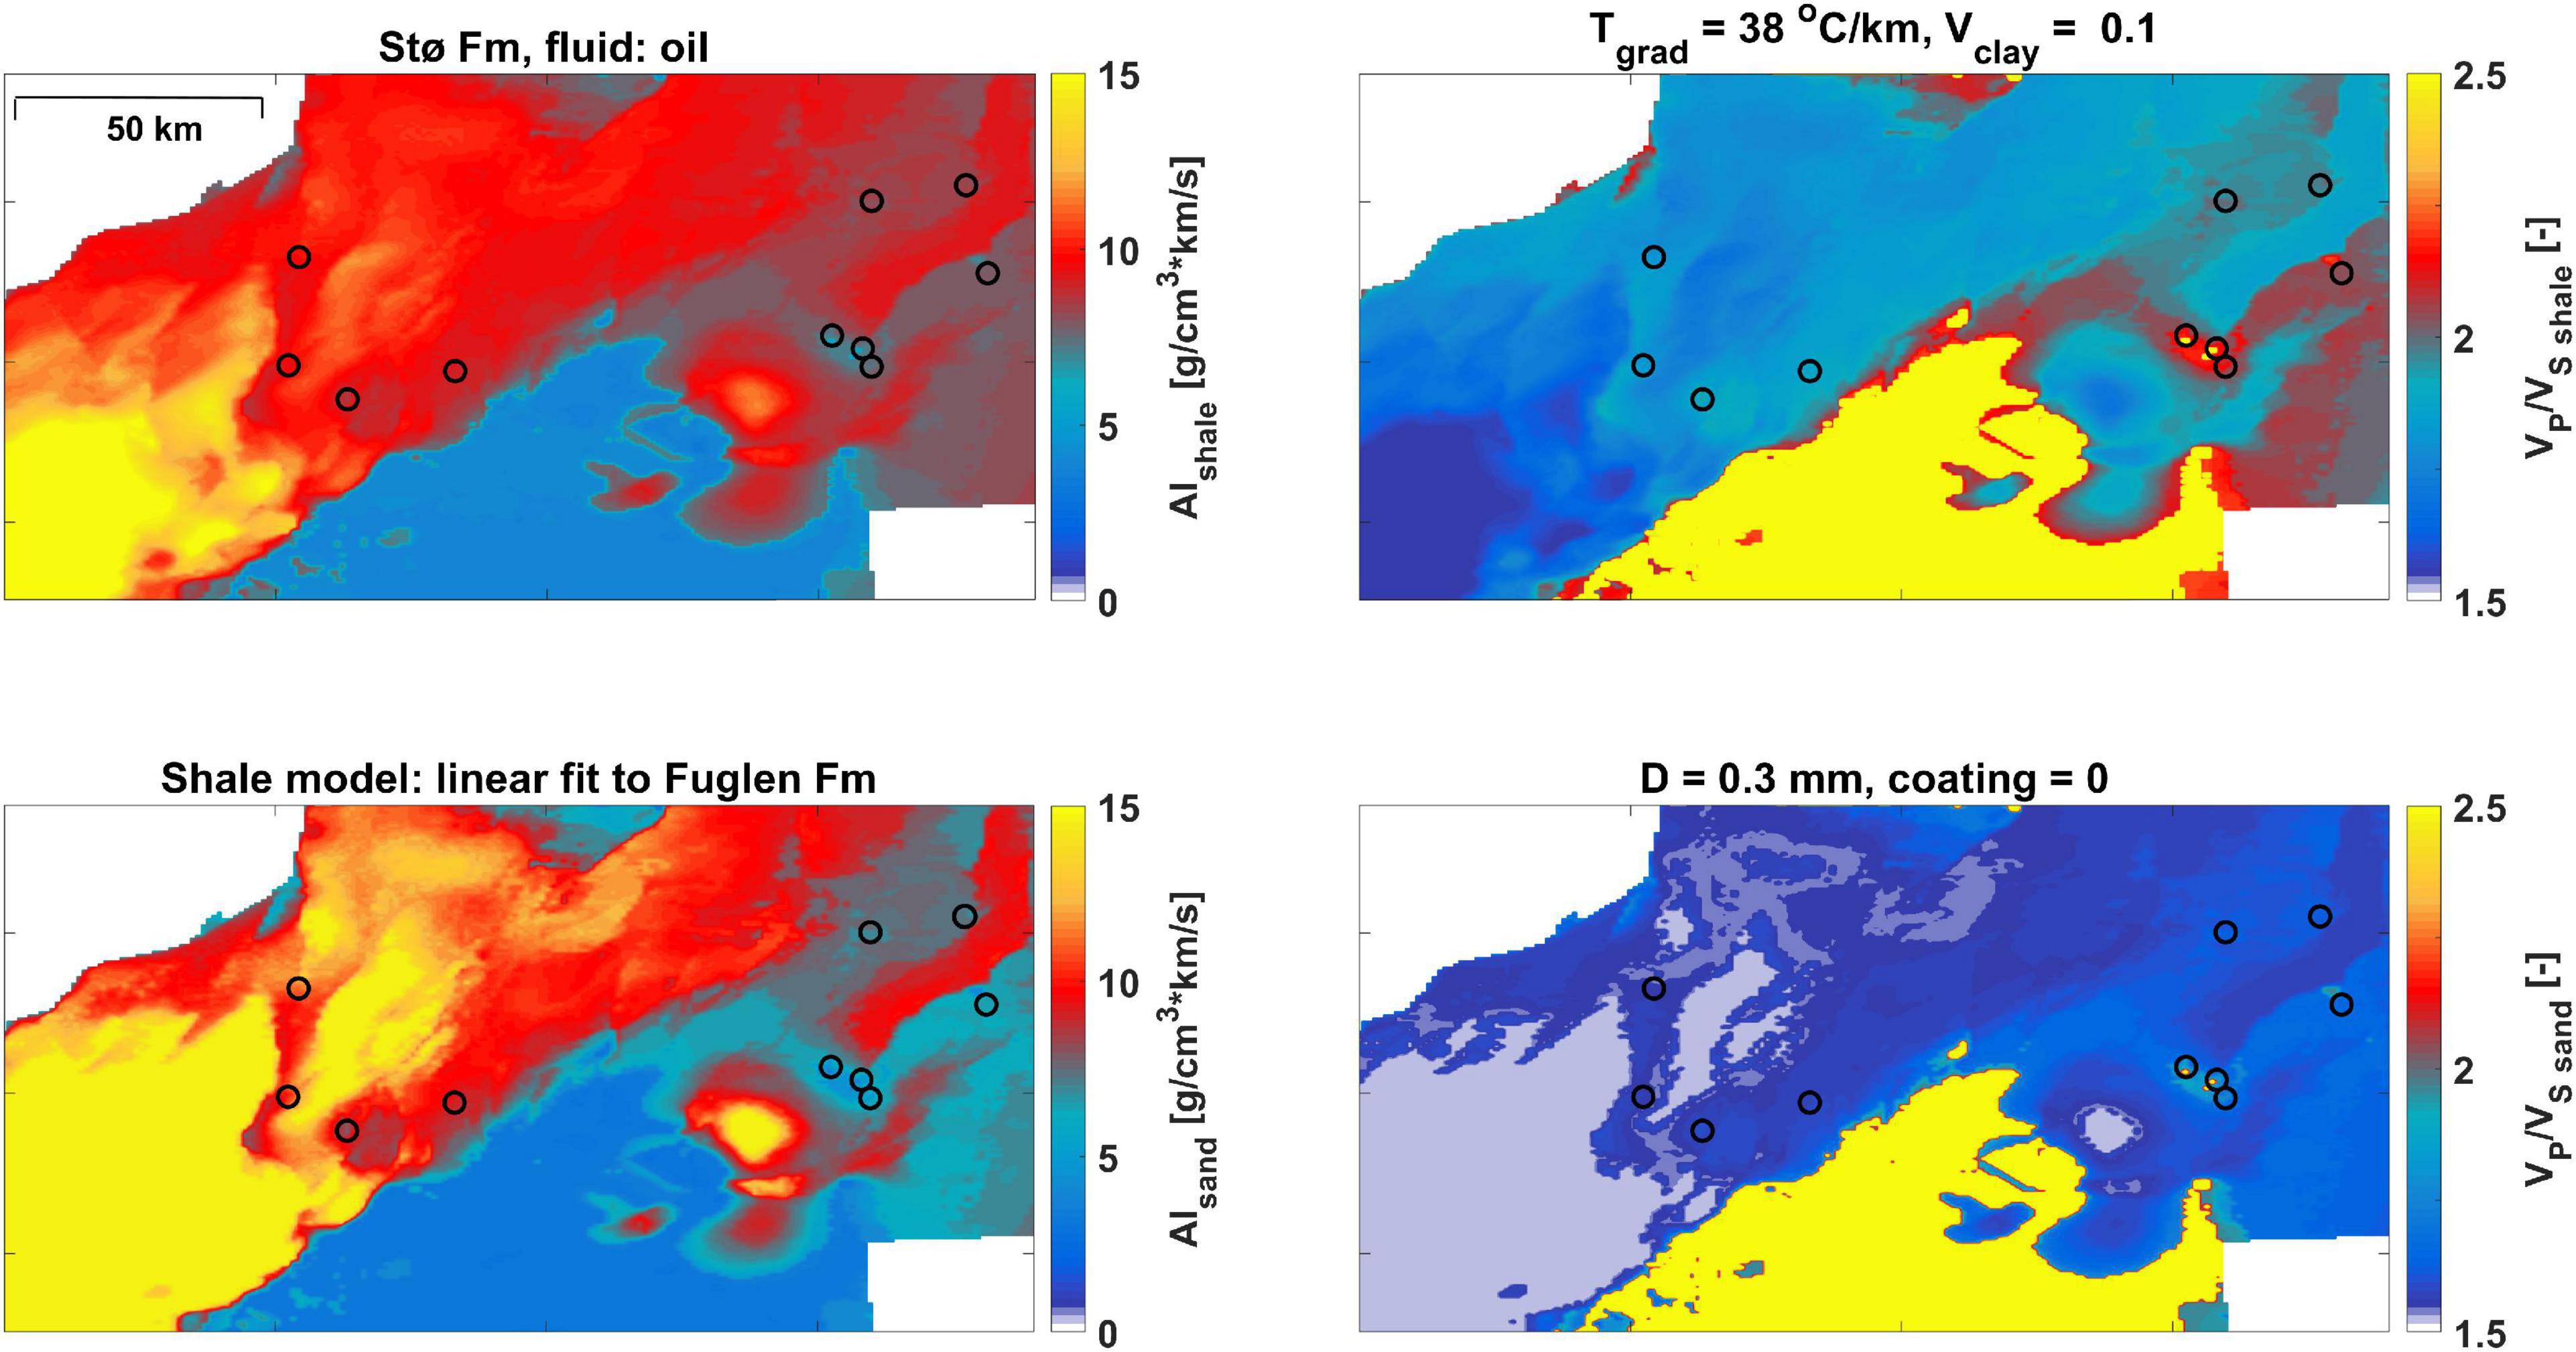
Figure 9. Elastic property feasibility maps for a given geological scenario. Upper: Expected acoustic impedance and VP/VS of cap-rock Fuglen Fm shale; Lower: Expected acoustic impedance and VP/VS for brine-filled reservoir sandstone of Stø Fm. Note that these maps are modeled values for shales and sandstones constrained by the burial maps (i.e., net erosion) in Figure 6, which are again derived from the seismic velocity data.
AVO Feasibility Maps
Next, we create the AVO feasibility maps (Figure 10) from the elastic property maps, using full Zoeppritz modeling (Zoeppritz, 1919). Here we show the expected AVO classes for various pore fluid scenarios. Oil-filled Stø Fm will predominantly show AVO class 1 in the western area, similar to what we expect for water-filled and gas-filled sandstones. We see a larger variability in expected AVO classes in the eastern part, but predominantly we expect AVO class 3 for oil and gas. Hence, there is a much better ability to seismically discriminate hydrocarbons from brine in the eastern part. Avseth et al. (2020a) also demonstrated how AVO feasibility maps could be generated for a given prospect, and showed how AVO classes could change with pore fluid depending on the input temperature gradient. In this way, they demonstrated the power of the proposed workflow to perform AVO de-risking of prospects away from well control.
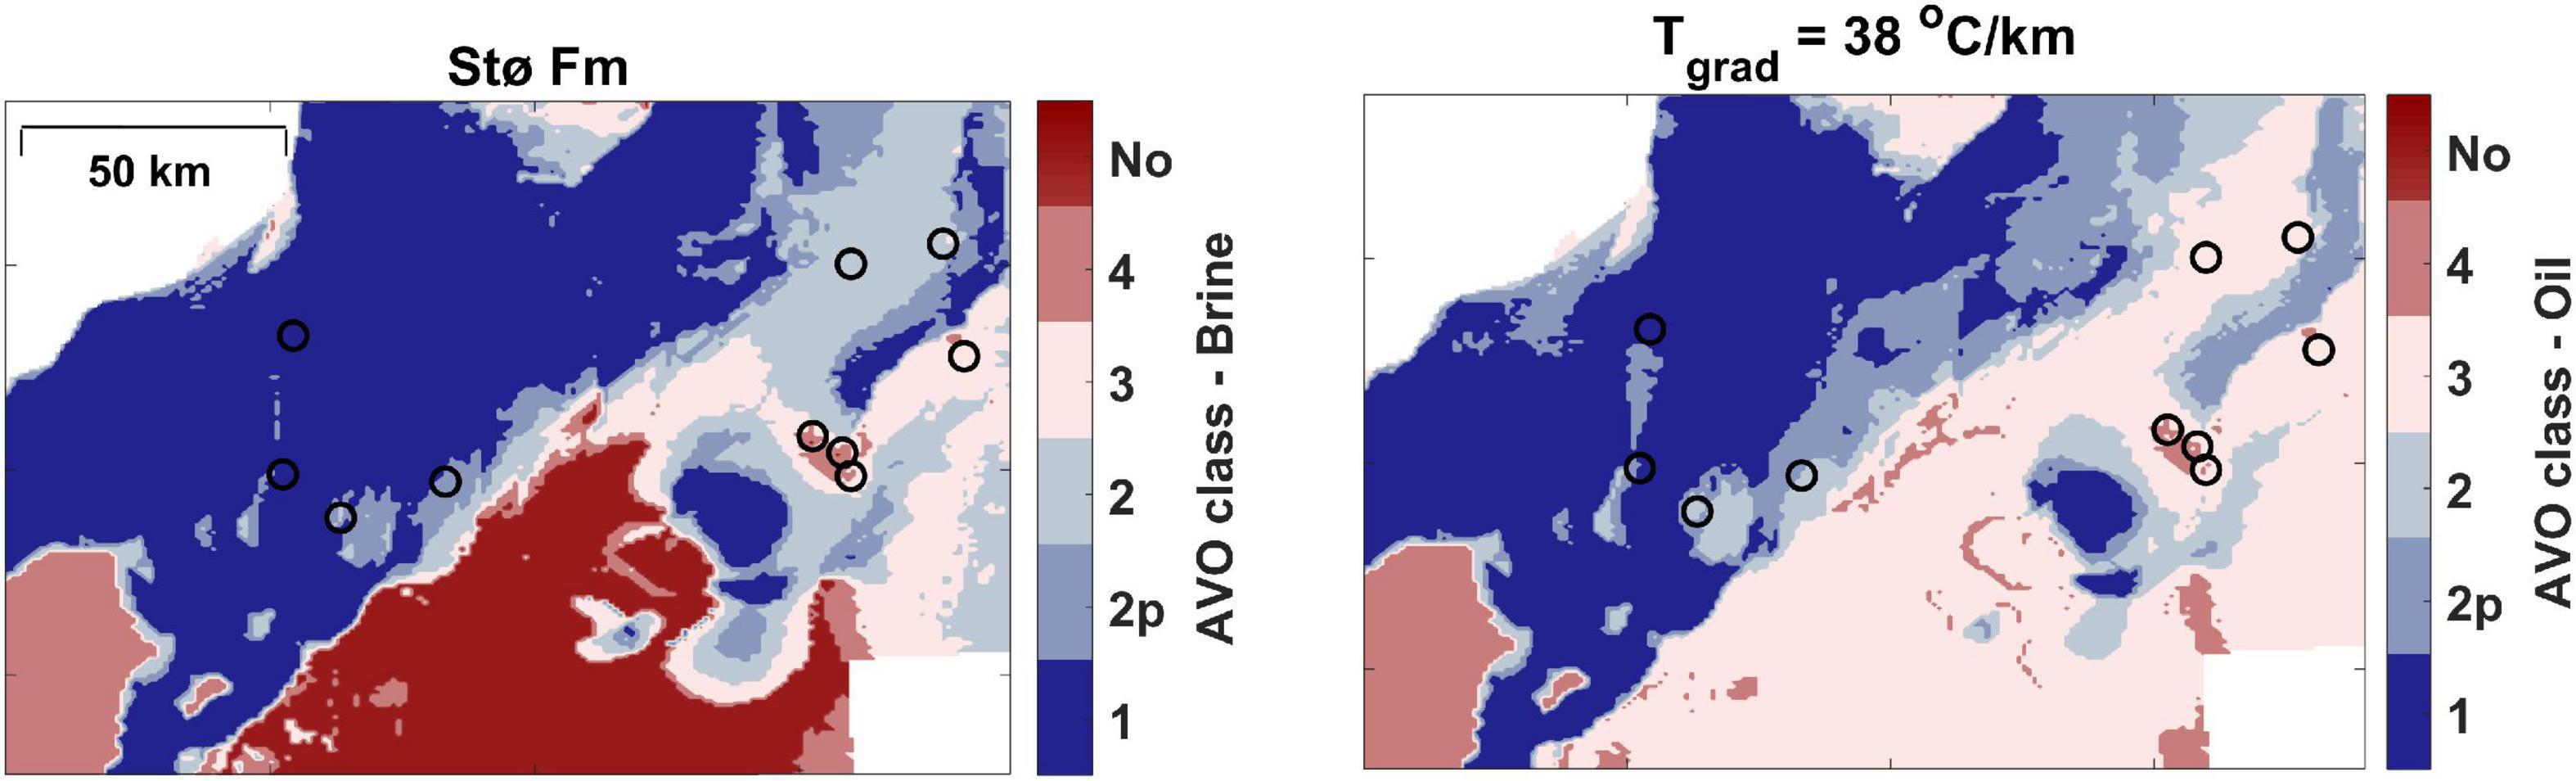
Figure 10. AVO feasibility maps, including AVO classes for brine saturated sandstones (left) and oil-saturated sandstones (right). Regional AVO feasibility maps that show significant geologic imprint on the expected AVO classes of different fluid scenarios.
3D AVO Feasibility Cubes (Barents Sea Demonstration)
Finally, we perform a full 3D modeling of rock physics properties and associated AVO feasibility cubes. We extrapolate between 2D maps using compaction/depth trends honoring the burial history at any given location. In this way, we can forecast the expected rock physics properties of a given rock, sandstone or shale, at any given location of a 3D cube, while honoring the burial (and thermal) history of the rock at this same location. By combining the elastic properties of sandstone and shale cubes, we can generate the so-called AVO feasibility cubes (in 3D) that predict the expected AVO response for a given pore fluid at any location in the cube.
Figure 11 shows a 3D AVO feasibility cube and associated rock properties, and we focus on a Tertiary age target interval, the Intra Torsk Fm sandstones of Paleocene/Eocene age, in a selected area in the Barents Sea. These sands are located in a deep-marine setting. As Figure 11 shows, we expect no quartz cementation in these sands toward the top of the formation, based on our modeling. This is because the sands have never reached a depth where temperatures are large enough (greater than ca. 70°C) to form quartz cement. However, we need to honor the mechanical compaction with porosity reduction and increasing effective stress with depth. The shale depth trends used for the AVO feasibilities in the Torsk Fm interval, are empirical trends derived from intra Torsk shales in nearby wells. We see that mainly AVO class 3 is expected for oil-filled Torsk Fm sands, whereas brine sands (not shown here) will give a class 1.

Figure 11. Rock property and AVO feasibility cubes in a selected area of the Barents Sea. Oil-filled Tertiary sands show mostly class 3 AVO response in the area, and cement volume is 0, as the sands are not buried deep enough to be cemented (figure adapted from Avseth et al., 2020a).
Validation and Uncertainty Assessment of AVO Feasibilities
The resulting AVO feasibility maps/cubes should be validated against real data observations, if available. The water-saturated signatures are often well constrained by the fact that most of the subsurface is indeed water-filled. The observed brine-filled AVO response in a down-flank area of a prospective structure, where one knows there must be water-filled sandstones, should match the modeled AVO brine response for this location. Furthermore, blind-well validations of expected rock properties and AVO signatures should be conducted if there are several wells inside the area of interest. If there is a mismatch with the observed (pre-stack seismic or well log) data, the AVO feasibility modeling input must be updated. In a scenario-based modeling, geological parameters like facies, grain size, temperature gradient, clay content, etc., can be edited. This exercise should be done in integrated teams with input from domain experts covering a range of different geological constraints (basin modeling, sedimentology, geochemistry). Note that the AVO feasibility maps could also highlight the poor quality or insufficient pre-conditioning of the seismic data.
Regardless of any validation, there are uncertainties associated with the AVO feasibility maps related to both geological variability and modeling bias/ambiguities (i.e., input parameters and model assumptions). The key geological uncertainties include uncertainties in burial history and net erosion from seismic velocities, both associated with the choice of shale reference trend and the seismic interval velocities. However, this information is better than no information and linear interpolation between wells. Furthermore, we can test uncertainties in uplift and how they will affect the AVO feasibility maps. Another key geological uncertainty is associated with the assumed sandstone texture for different intervals, including grain size, clay volume, sorting, and clay coating. Temperature gradients and their variation in space and time can also significantly impact the AVO feasibility maps/cubes. This variation can be associated with distances to the basement craton. It could also be related to tectonic uplift processes and the timing of uplift. One of the best ways to mitigate temperature-gradient-related uncertainties is to perform a probabilistic tectonic heat flow modeling (Van Wees et al., 2009).
In the 2D AVO feasibility map generated above, we focused on a scenario with a spatially constant temperature gradient of 38°C/km. Figure 12 shows a test where we simulate AVO feasibility maps for several cases where we vary the temperature gradient. Then, we test how this will affect the AVO classification for different fluid scenarios. Interestingly, we see that the classes stay constant regardless of temperature gradient in some parts of the map, but will change in other parts.

Figure 12. Uncertainty assessment of AVO feasibility maps testing a range of constant temperature gradients. The white areas in the three lower subplots indicate where AVO classes do not change (i.e., low uncertainty). In contrast, the gray areas indicate where AVO classes will change within this temperature range (i.e., higher uncertainty).
It should also be mentioned that we have used default values for brine, oil and gas in this study. These may indeed vary spatially and with burial depth (fluid pressure effect that will change with burial depth is accounted for already). Variability in salinity, oil API/GOR and gas gravity represents uncertainties that could be handled via scenarios or sensitivity studies, but in this study, we consider the variability of these properties to be second-order compared to other geological uncertainties.
Conclusion
We have demonstrated a new integrated workflow for generating AVO feasibility maps/cubes with data from the Barents Sea. The methodology enables rapid extrapolation of expected rock physics properties away from well control, along selected horizons, constrained by seismic velocity information, geological inputs (basin modeling, seismic stratigraphy and facies maps) and rock physics depth trend analysis. The workflow should allow for more rapid, seamless and geologically consistent DHI de-risking of prospects in areas with complex geology and tectonic influence. The AVO feasibility maps can furthermore be utilized to generate non-stationary training data for AVO classification.
Data Availability Statement
The data analyzed in this study is subject to the following licenses/restrictions: Confidential seismic velocity data have been used to generate maps/cubes. Well log data used in this study are released through Norwegian Petroleum Directorate, but permission requires membership of their Diskos database. Requests to access these datasets should be directed to www.npd.no/en/diskos.
Author Contributions
PA did concept and rock physics. IL did coding and implementation. Both authors have contributed equally.
Conflict of Interest
The authors declare that the research was conducted in the absence of any commercial or financial relationships that could be construed as a potential conflict of interest.
Acknowledgments
We thank Spirit Energy and partners of license PL962 on the Norwegian Continental Shelf for data and financial support for this study.
References
AlKawai, AlKawi, W., Mukerji, T., Scheirer, A. H., and Graham, S. A. (2018). Combining seismic reservoir characterization workflows with basin modeling in the deepwater Gulf of Mexico Mississippi Canyon area. AAPG Bull. 102, 629–652. doi: 10.1306/0504171620517153
Athy, L. (1930). Density, porosity, and compaction of sedimentary rocks. AAPG Bull. 14, 1–24. doi: 10.1306/3D93289E-16B1-11D7-8645000102C1865D
Avseth, P., and Dræge, A. (2011). Memory of rocks – how burial history controls present-day seismic properties. example from troll east, North Sea. Paper Presented at the 2011 SEG Annual Meeting: SEG Extended Abstract, San Antonio, TX. doi: 10.1190/1.3627620
Avseth, P., Dræge, A., van Wijngaarden, A.-J., Johansen, T. A., and Jørstad, A. (2008). Shale rock physics and implications for AVO analysis: a North Sea demonstration. Lead. Edge 27, 788–797. doi: 10.1190/1.2944164
Avseth, P., Dvorkin, J., Mavko, G., and Rykkje, J. (2000). Rock physics diagnostic of North Sea sands: link between microstructure and seismic properties. Geophys. Res. Lett. 27, 2761–2764. doi: 10.1029/1999GL008468
Avseth, P., and Lehocki, I. (2016). Combining burial history and rock-physics modeling to constrain AVO analysis during exploration. Lead. Edge 35, 528–534. doi: 10.1190/tle35060528.1
Avseth, P., Lehocki, I., Feuilleaubois, L., Hansen, T. N., Angard, K., and Reiser, C. (2020a). Exploration workflow for real-time modelling of rock property and AVO feasibilities in areas with complex burial history – a Barents Sea demonstration. First Break 38, 51–56. doi: 10.3997/1365-2397.fb2020065
Avseth, P., Lehocki, I., Hansen, T., Angard, K., Schjeldrup, S., and Shelavina, E. (2020b). “A new integrated workflow to generate AVO feasibility maps for prospect de-risking,” in Proceedings of the 82nd EAGE Annual Conference & Exhibition. EAGE Extended Abstract, Vol. 2020, (Houten: European Association of Geoscientists & Engineers), 1–5. doi: 10.3997/2214-4609.202010498
Avseth, P., Mukerji, T., Jørstad, A., Mavko, G., and Veggeland, T. (2001). Seismic reservoir mapping from 3-D AVO in a North Sea turbidite system. Geophysics 66, 1157–1176. doi: 10.1190/1.1487063
Avseth, P., Mukerji, T., and Mavko, G. (2005). Quantitative Seismic Interpretation – Applying Rock Physics Tools to Reduce Interpretation Risk. Cambridge: Cambridge University Press. doi: 10.1017/CBO9780511600074
Avseth, P., van Wijngaarden, A.-J., and Flesche, H. (2003). AVO classification of lithology and pore fluids constrained by rock physics depth trends. Lead. Edge 22, 1004–1011. doi: 10.1190/1.1623641
Baig, I., Faleide, J. I., Jahren, J., and Mondol, N. H. (2016). Cenozoic exhumation on the southwestern Barents Shelf: estimates and uncertainties constrained from compaction and thermal maturity analyses. Mar. Pet. Geol. 73, 105–130. doi: 10.1016/j.marpetgeo.2016.02.024
Biswal, S. K., Vachak, H. S., Rawat, D. S., Bhagat, S., Bharsakale, A., and Tandon, A. K. (2012). “Deliberate search for stratigraphic traps within Oligocene sediments of Central Graben in the Western Offshore Basin, India,” in Proceedings of the 9th Biennial International Conference and Exposition of Petroleum Geophysics, Hyderabad 2012, Hyderabad, 275.
Bjørlykke, K. (2015). Petroleum Geoscience: From Sedimentary Environments to Rock Physics. Berlin: Springer.
Carcione, J., and Avseth, P. (2015). Rock-physics templates for clay-rich source rocks. Geophysics 80, D481–D500. doi: 10.1190/geo2014-0510.1
Carman, P. C. (1938). The determination of the specific surface of powders. I. J. Soc. Chem. Indus. 57, 225–234. doi: 10.1190/1.1437626
Castagna, J. P., and Swan, H. W. (1997). Principles of AVO crossplotting. Lead. Edge 16, 337–344. doi: 10.1190/1.1437626
Dolson, J. C., Merrill, R., and Sternbach, C. (2019). Advances in stratigraphic trap exploration. GeoExPro Mag. 16, 74–76.
Dræge, A., Duffaut, K., Wiik, T., and Hokstad, K. (2014). Linking rock physics and basin history — Filling gaps between wells in frontier basins. Lead. Edge 33, 240–246. doi: 10.1190/tle33030240.1
Dræge, A., Jakobsen, M., and Johansen, T. (2006). Rock physics modelling of shale diagenesis. Pet. Geosci. 12, 49–57. doi: 10.1144/1354-079305-665
Dvorkin, J., and Nur, A. (1996). Elasticity of high−porosity sandstones: theory for two North Sea data sets. Geophysics 61, 1363–1370. doi: 10.1190/1.1444059
Gatemann, H., and Avseth, P. (2016). Net uplift estimation using both sandstone modeling and shale trends, on the Horda Platform area in the Norwegian North Sea. Paper Presented at the 2016 SEG International Exposition and Annual Meeting: SEG Extended Abstract, Dallas, TX. doi: 10.1190/segam2016-13865497.1
Helset, H. M., Matthews, J. C., Avseth, P., and van Wijngaarden, A.-J. (2004). “Combined diagenetic and rock physics modelling for improved control on seismic depth trends,” in Proceedings of the 66th Conference and Ex-hibition: EAGE Extended Abstract (Houten: EAGE).
Hjelstuen, B. O., Elverhøi, A., Faleide, J. I., Solheim, A., Riis, F., and Elverhoi, A., et al. (eds) (1996). “Cenozoic erosion and sediment yield in the drainage area of the Storfjorden Fan,” in Impact of Glaciations on Basin Evolution: Data and Models from the Norwegian Margin and Adjacent Areas. Global Planet. Change, Vol. 12, (Amsterdam: Elsevier), 95–117. doi: 10.1016/0921-8181(95)00014-3
Japsen, P. (1999). Overpressured Cenozoic shale mapped from velocity anomalies relative to a baseline for marine shale. North Sea. Pet. Geosci. 5, 321–336. doi: 10.1144/petgeo.5.4.321
Johansen, N. (2016). Regional Net Erosion Estimations and Implications for Seismic AVO Signatures in the Western Barents Sea. Master thesis, NTNU, Trondheim.
Lander, R., and Walderhaug, O. (1999). Predicting porosity through simulating sandstone compaction and quartz. AAPG Bull. 83, 433–449.
Lehocki, I., and Avseth, P. (2021). From cradle to grave: how burial history controls the rock-physics properties of quartzose sandstones. Geophys. Prospect. 69, 629–649. doi: 10.1111/1365-2478.13039
Lehocki, I., Avseth, P., and Mondol, N. (2020). Seismic methods for fluid discrimination in areas with complex geologic history – A case example from the Barents Sea. Interpretation 8, SA35–SA47. doi: 10.1190/INT-2019-0057.1
Liu, M., and Grana, D. (2020). Petrophysical characterization of deep saline aquifers for CO2 storage using ensemble smoother and deep convolutional autoencoder. Adv. Water Resour. 142:103634. doi: 10.1016/j.advwatres.2020.103634
Magara, K. (1980). Comparison of porosity-depth relationships of shales and sandstone. J. Pet. Geol. 3, 175–185. doi: 10.1111/j.1747-5457.1980.tb00981.x
Mavko, G., Mukerji, T., and Dvorkin, J. (2020). The Rock Physics Handbook, 3rd Edn. Cambridge: Cambridge University Press. doi: 10.1017/9781108333016
Mukerji, T., Jørstad, A., Avseth, P., Mavko, G., and Granli, J. R. (2001). Mapping lithofacies and pore−fluid probabilities in a North Sea reservoir: seismic inversions and statistical rock physics. Geophysics 66, 988–1001. doi: 10.1190/1.1487078
Qadrouh, A. N., Carcione, J. M., Alajmi, M., and Alyousif, M. M. (2019). A tutorial on machine learning with geophysical applications. Boll. Geofis. Teor. Appl. 60, 375–402.
Ramm, M., and Bjørlykke, K. (1994). Porosity/depth trends in reservoir sandstones: assessing the quantitative effects of varying pore-pressure, temperature history and mineralogy. Norwegian Shelf data. Clay Mineral. 29, 475–490. doi: 10.1180/claymin.1994.029.4.07
Rimstad, K., Avseth, P., and Omre, H. (2010). Bayesian lithology/fluid prediction constrained by spatial couplings and rock physics depth trends. Lead. Edge 29, 584–589. doi: 10.1190/1.3422457
Salem, H. S., and Chilingarian, G. V. (1999). Determination of specific surface area and mean grain size from well-log data and their influence on the physical behavior of offshore reservoirs. J. Pet. Sci. Eng. 22, 241–252. doi: 10.1016/S0920-4105(98)00084-9
Shelukhina, O., El-Ghali, M. A. K., Abbasi, I. A., Hersi, O. S., Farfour, M., Ali, A., et al. (2021). Origin and control of grain-coating clays on the development of quartz overgrowths: example from the lower Paleozoic Barik Formation sandstones, Huqf region, Oman. Arab. J. Geosci. 14:210. doi: 10.1007/s12517-021-06541-5
Thyberg, B., Jahren, J., Winje, T., Bjørlykke, K., and Faleide, J. I. (2009). From mud to shale: rock stiffening by micro-quartz cementation. First Break 27, 53–59. doi: 10.3997/1365-2397.2009003
Van Wees, J. D., van Bergen, F., David, P., Nepveu, M., Beekman, F., Cloetingh, S., et al. (2009). Probabilistic tectonic heat flow modeling for basin maturation: assessment method and applications. Mar. Pet. Geol. 26, 536–551. doi: 10.1016/j.marpetgeo.2009.01.020
Walderhaug, O. (1996). Kinetic modeling of quartz cementation and porosity loss in deeply buried sandstone reservoirs. AAPG Bull. 80, 731–745. doi: 10.1306/64ED88A4-1724-11D7-8645000102C1865D
Keywords: rock physics, subsurface characterization, AVO modeling, exploration, basin analysis/modeling
Citation: Avseth P and Lehocki I (2021) 3D Subsurface Modeling of Multi-Scenario Rock Property and AVO Feasibility Cubes—An Integrated Workflow. Front. Earth Sci. 9:642363. doi: 10.3389/feart.2021.642363
Received: 15 December 2020; Accepted: 23 February 2021;
Published: 15 March 2021.
Edited by:
Jing Ba, Hohai University, ChinaReviewed by:
José M. Carcione, National Institute of Oceanography and Experimental Geophysics (OGS), ItalyDa Shuai, China University of Petroleum, China
Copyright © 2021 Avseth and Lehocki. This is an open-access article distributed under the terms of the Creative Commons Attribution License (CC BY). The use, distribution or reproduction in other forums is permitted, provided the original author(s) and the copyright owner(s) are credited and that the original publication in this journal is cited, in accordance with accepted academic practice. No use, distribution or reproduction is permitted which does not comply with these terms.
*Correspondence: Per Avseth, cGVyLmF2c2V0aEBkaWdzY2llbmUubm8=; cGVyLmFhZ2UuYXZzZXRoQGdtYWlsLmNvbQ==