 Bruno Lauper1*
 Géraldine N. Zimmerli1
 David Jaeggi2
 Gaudenz Deplazes3Stephan Wohlwend4
 Johannes Rempfer5
 Anneleen Foubert1
- 1Department of Geosciences, University of Fribourg, Fribourg, Switzerland
- 2Federal Office of Topography Swisstopo, Wabern, Switzerland
- 3National Cooperative for the Disposal of Radioactive Waste (Nagra), Wettingen, Switzerland
- 4Geological Institute, ETH Zurich, Zurich, Switzerland
- 5geo7 AG, Bern, Switzerland
The Opalinus Clay is notable in Switzerland as being the selected host rock for deep geological disposal of radioactive waste. Since the early 1990’s, this argillaceous mudstone formation of Jurassic age has been intensively studied within the framework of national and international projects to characterize its geological, hydrological, mechanical, thermal, chemical, and biological properties. While there is no formal stratigraphic subdivision, the Opalinus Clay lithology is classically divided into several, dam- to m-scale sub-units (or facies), depending on location. Recent multi-proxy studies (combining petrographic, petrophysical, geochemical, and mineralogical analyses) have however demonstrated that high, intra-facies, lithological heterogeneity occurs at the dm- to cm-scale. To constrain this small-scale heterogeneity into distinct lithological units (subfacies), the present study aims at defining and presenting a convenient subfacies classification scheme covering the overall Opalinus Clay lithology across northern Switzerland. Petrographic (macro- and microfacies), mineralogical (X-ray diffraction) and textural (image analysis, machine learning and 3D X-ray computed tomography) analyses are performed on diverse drill cores from the Mont Terri rock laboratory (northwestern Switzerland), and results are extended further to the east (Riniken, Weiach, and Benken). Most of the investigated Opalinus Clay can be described by the use of five distinctive subfacies types (SF1 to SF5), which are visually and quantitatively distinguishable by texture (grain size, bedding, fabric, and color) and composition (nature and mineralogy of components). The five subfacies types can be further refined by additional attributes and sedimentary characteristics (biogenic, diagenetic, and structural). Eventually, the widespread and consistent use of standardized Opalinus Clay subfacies types provides the means to harmonize petrographic descriptions within multidisciplinary research projects, enhance reproducibility of in situ experiments, and further evidence the tight relations between lithology and various rock properties.
Introduction
In Switzerland, the Opalinus Clay (OPA) has been proposed as the potential host rock for deep geological disposal of radioactive waste (Nagra, 2014). Since the 1990s, the various properties of this mudstone succession have been intensively studied within the framework of the Nagra deep drilling campaigns (Nagra, 2002) and the Mont Terri Project, an international and multidisciplinary research program dedicated to the investigation of argillaceous rocks within the context of nuclear waste disposal and CO2 storage (Thury and Bossart, 1999). Over 140 in situ experiments have been conducted and more than 1300 boreholes have been drilled in an underground research facility, the Mont Terri rock laboratory (northwestern Switzerland; Figure 1A), to investigate the complex behavior of the OPA in response to coupled hydrological, mechanical, thermal, chemical and biological processes (see Bossart and Thury, 2007, 2008; Bossart et al., 2017 for an overview of past and on-going experiments).
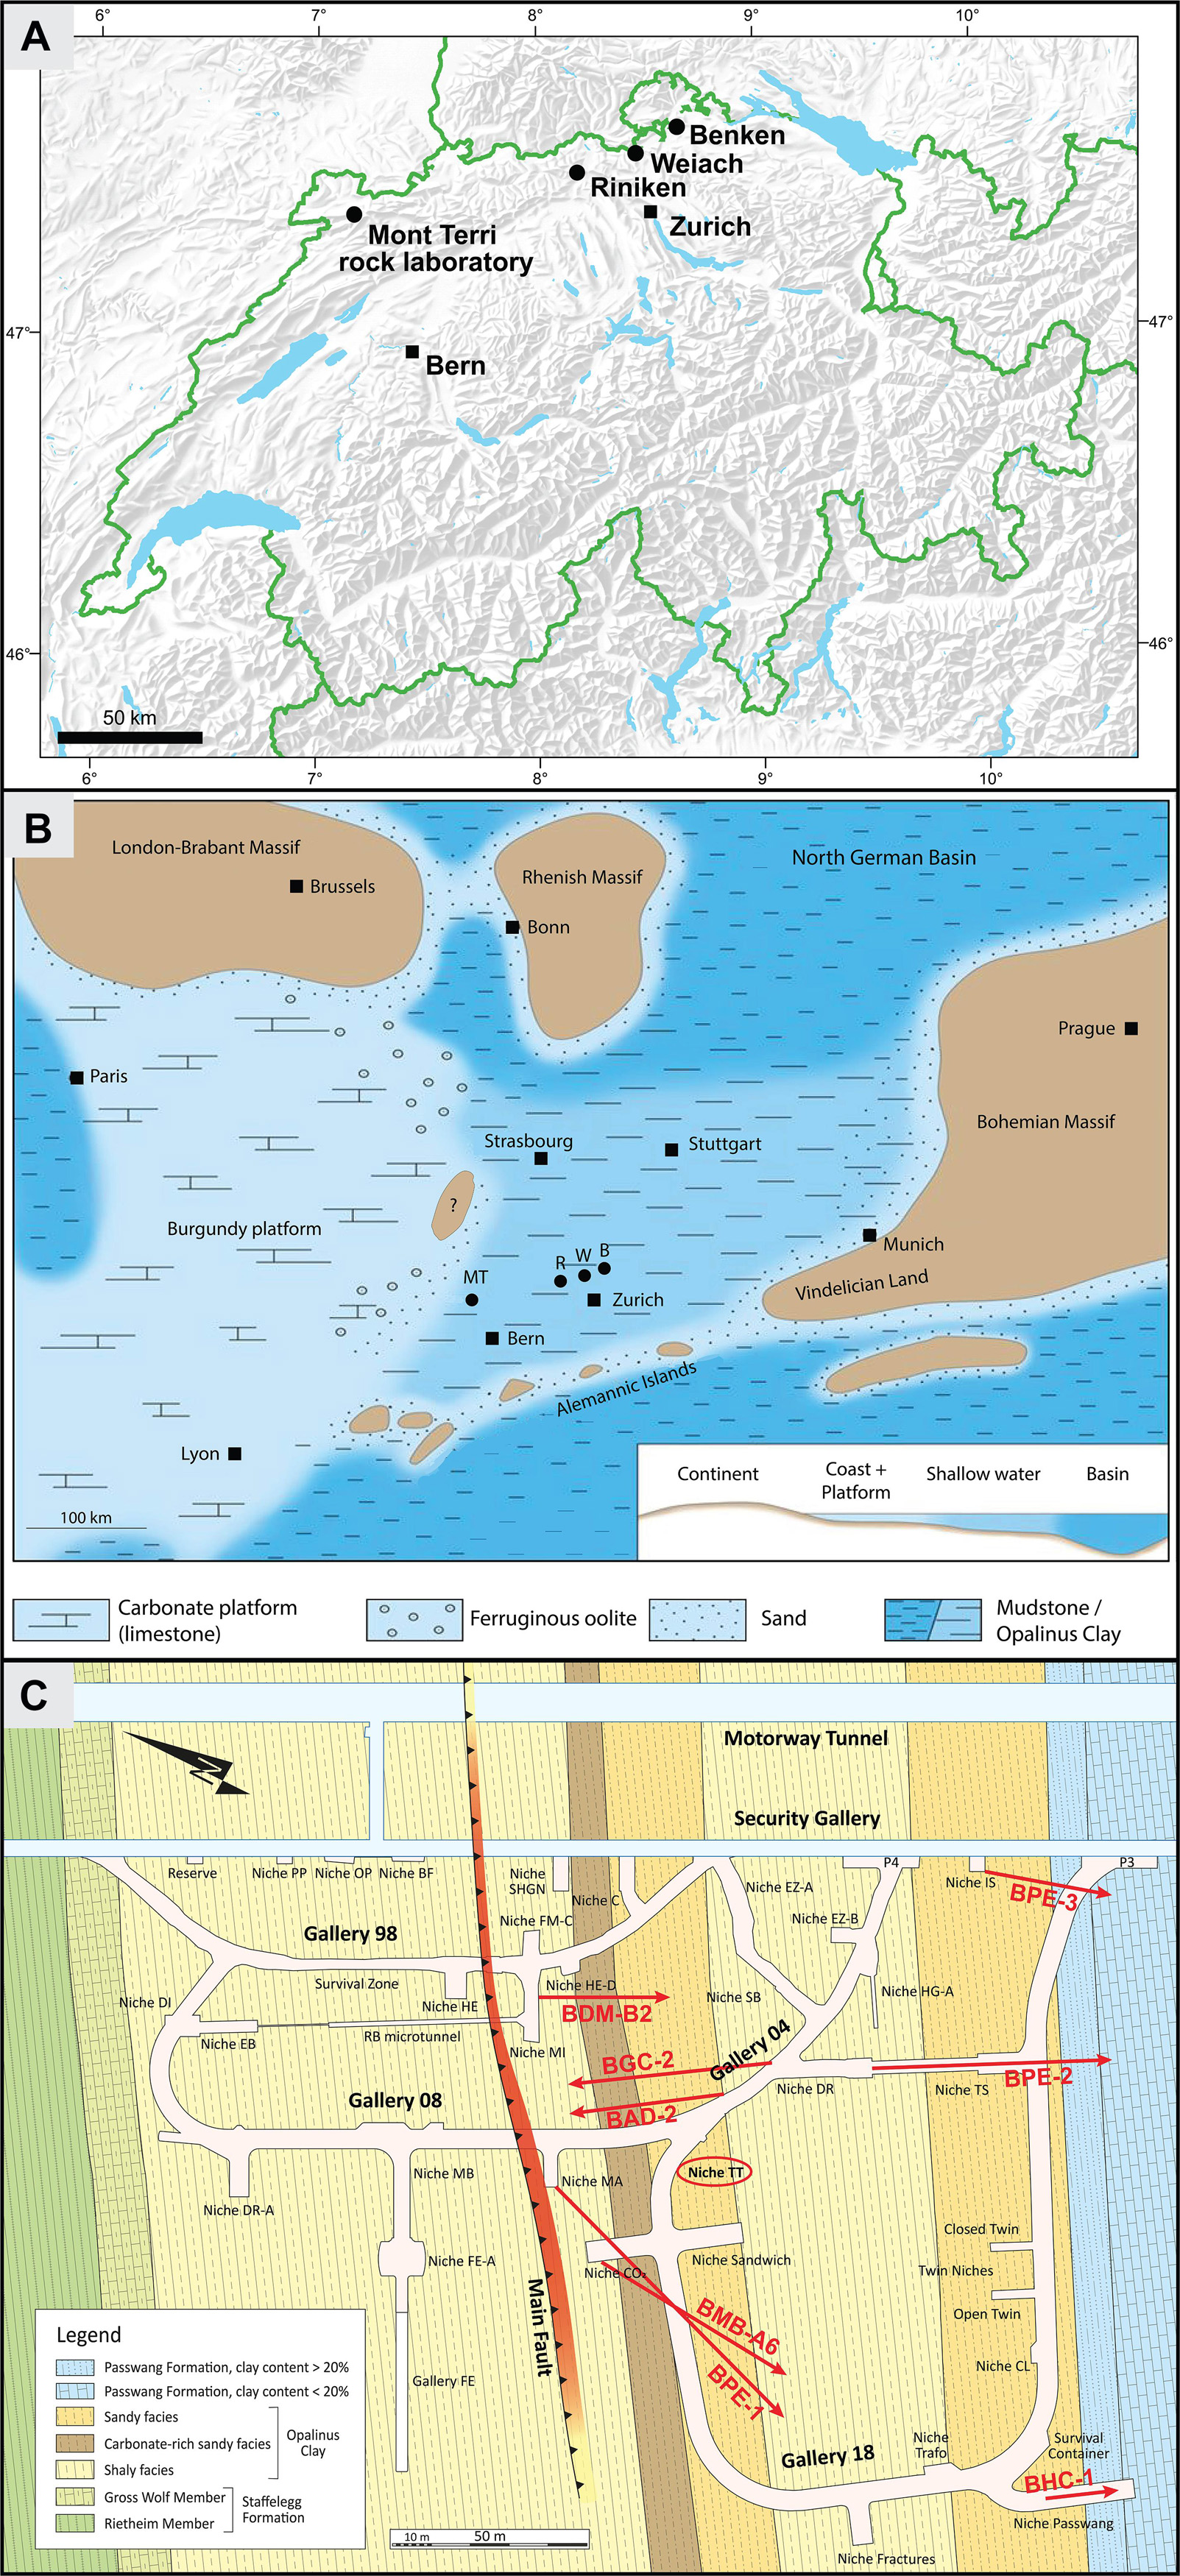
Figure 1. |(A) Map of Switzerland with location of major cities (Bern and Zurich), the Mont Terri rock laboratory and the Nagra deep drillings (Riniken, Weiach, and Benken). Source: Federal Office of Topography swisstopo. (B) Paleogeographic map of the Early Aalenian in central Europe. Approximate location of major cities (squares) and study sites (circles) are indicated; MT, Mont Terri rock laboratory; R, Riniken; W, Weiach; B, Benken. A possible temporary and partial emergence of the Vosges Massif is indicated with a question mark. Modified after Nagra (2002) and based on Etter (1990); Wetzel and Allia (2000) and references therein. (C) Schematic map of the Mont Terri rock laboratory with location of the investigated drill cores indicated in red. Arrow heads point to drilling direction. The BDB-1 borehole (not indicated on the map) was drilled perpendicularly to bedding plane and crosses the entire OPA succession. The borehole begins about 9 m above the Passwang Formation, southeast along the security gallery, and ends 10 m within the top members of the Staffelegg Formation (below the rock laboratory; Hostettler et al., 2017). Source: Mont Terri Project.
Considered as relatively homogeneous in comparison to other Mesozoic formations in northern Switzerland, the OPA displays nonetheless lithological heterogeneity. Although no formal stratigraphic subdivision has been established to date, the OPA is classically divided (informal) into several, dam- to m-scale sub-units (or facies), which vary regionally and depending on the believes and methods of investigation (e.g., Bläsi, 1987; Matter et al., 1987, 1988; Bläsi et al., 1991, 1996; Wetzel and Allia, 2003; Hostettler et al., 2017; Mazurek and Aschwanden, 2020). These sub-units are frequently used within geotechnical, geochemical, geophysical and hydrogeological investigations as basic lithological units to frame and characterize the studied OPA intervals (e.g., Bossart and Thury, 2008; Jaeggi and Bossart, 2014; Mazurek and Aschwanden, 2020). Detailed petrographic investigations, however, demonstrated that high, intra-facies, lithological heterogeneity occurs at smaller scales, and that rock properties may be significantly affected by such small-scale variations (Klinkenberg et al., 2009; Jaeggi et al., 2011; Peters et al., 2011; Müller and Jaeggi, 2012; Kaufhold et al., 2013; Jaeggi and Bossart, 2014; Philipp et al., 2017; Lauper et al., 2018; Kneuker et al., 2020). Moreover, the characterization of smaller, identifiable, lithological units increases the accuracy of correlation studies, which is essential for the elaboration of predictive lithological models.
Yet, no standard OPA subfacies classification model exists. Scientists from diverse professional background refer to the OPA using a variety of existing petrographic classification models and terminologies for describing fine-grained sedimentary rocks (Picard, 1971; Folk, 1974; Pettijohn, 1975; Lundegard and Samuels, 1980; Potter et al., 1980; Spears, 1980; Füchtbauer, 1988; Macquaker and Adams, 2003; Lazar et al., 2015, among others). With the aim to improve the reproducibility and consistency of OPA descriptions within the framework of the Mont Terri Project, Lauper et al. (2018) identified five distinct, dm- to cm-scale subfacies along a drill core crossing the major OPA facies at Mont Terri, based on dominant grain size, bedding, fabric, color, mineralogy and level of bioturbation. The vertical and lateral validity of the fivefold subfacies classification has however not been evidenced yet, and only rare subfacies analyses were performed on additional OPA successions (Kneuker et al., 2020).
Within the present study, a petrographic subfacies analysis comparable to Lauper et al. (2018) is performed at a larger, interregional scale, and combined with (semi-)quantitative mineralogical and image analyses. The goal is to define and present a uniform subfacies classification scheme covering most of the OPA lithology across northern Switzerland, from the Mont Terri rock laboratory to the east (i.e., Nagra deep drillings at Riniken, Weiach, and Benken). The defined subfacies types aim at being the smallest, lithologically coherent units that can be recognized visually on drill core sections and outcrops. Further analytical techniques are used to cross-validate the subfacies identification in a more objective way, and an automated OPA subfacies recognition tool based on drill core images is tested and discussed. The use of such image-based tool aims not only at improving the efficiency and reproducibility of lithological descriptions by decreasing the subjectivity related to human perception, but also to allow a consistent subfacies identification from locations remote from the field and/or core storage site.
Depositional Setting, Stratigraphy, and Mineralogy of the Opalinus Clay
The OPA was deposited during Late Toarcian to Early/Middle Aalenian times in a shallow-marine epicontinental sea covering central Europe (Ziegler, 1990; Wetzel and Allia, 2003). The basin, situated in the lower part of the Laurasian Seaway (Ziegler, 1990; Bjerrum et al., 2001), was bordered by the Rhenish Massif and the German Basin to the north, by the Bohemian Massif to the east, by the Alemannic Islands to the south, and by the Burgundy platform to the west (Figure 1B). At that time, central Europe was situated about 30° north from the equator (Irving, 1977) and governed by a subtropical to tropical climate (Etter, 1990). Generally, it is assumed that the OPA sedimentation was primarily controlled by spatial and temporal changes in clastic delivery, storm-reworking, infaunal bioturbation, and diagenesis (Bläsi, 1987; Etter, 1990; Wetzel and Allia, 2000, 2003; Lerouge et al., 2014; Lauper et al., 2018, 2021). Based on (storm-)wave oscillation structures found in OPA successions, Wetzel and Allia (2003) interpreted the average water depth at the time of deposition to be about 20 to 50 m. To provide sufficient accommodation space for the 80- to 130-m-thick OPA (estimated as 2.5 times thicker before compaction; Wetzel and Allia, 2000), differential subsidence has been considered (Wetzel and Allia, 2000, 2003; Wetzel et al., 2003). During the Early Jurassic, the opening of the Tethys and the Atlantic Ocean induced the reactivation of pre-existing basement structures (Permo-Carboniferous troughs: Wildi et al., 1989; Wetzel et al., 2003; Reisdorf and Wetzel, 2018), which in turn led to a depositional area morphologically differentiated into swells and depressions, contributing highly to the OPA facies diversity and thickness variations (Wetzel and Allia, 2000, 2003; Nagra, 2002; Wetzel and Meyer, 2006; Lauper et al., 2018, 2021). The hypothesis of synsedimentary differential subsidence during sediment deposition is strengthened by paleoflow directions (inferred from sedimentary structures) pointing toward OPA thickness maxima, and which are spatially related to the Late Paleozoic basins (Allia, 1996; see also isopach maps in Wetzel and Allia, 2000, 2003). Although poorly understood, the clastic delivery is considered to be derived from multiple sources, including the neighboring, crystalline massifs and emerged lands (Wetzel and Allia, 2003; Figure 1B). Based on quartz grain size, Burkhalter (1996) suggested nonetheless a dominant (north)west-(south)east sediment transport direction for the area between Mont Terri and Riniken.
In contrast to Germany, where the OPA-equivalent is formally defined as the Opalinuston Formation, and partly as the Achdorf Formation (Franz and Nitsch, 2009), the OPA in Switzerland remains an informal lithostratigraphic unit, although well-established and long in use (e.g., Quenstedt, 1843, 1858; Schmidt et al., 1924). It comprises the lithologies residing between the marly section of the Early Jurassic Staffelegg Formation (Reisdorf et al., 2011) and the muddy, calcareous and Fe-oolitic basal lithology of the Middle Jurassic Passwang Formation (Burkhalter, 1996) and its eastern equivalents («Murchisonae-Oolith Formation»; Bläsi et al., 2013). While the lower lithostratigraphic boundary shows in most cases a clear facies change (e.g., Bläsi, 1987; Reisdorf et al., 2011), the upper limit of the OPA is more transitional in several locations and can be subject to discussion (Wohlwend et al., 2019b; Lauper et al., 2021).
The OPA consists mainly of argillaceous to silty shales. Its overall thickness varies between 80 and 130 m across northern Switzerland (Nagra, 2002; Wetzel and Allia, 2003; Hostettler et al., 2017). Mazurek and Aschwanden (2020) provide an overview and refined subdivision of the OPA lithology in northern Switzerland based on the existing literature and technical reports of several key drillings (e.g., Bläsi, 1987; Matter et al., 1987, 1988; Nagra, 2001). Hence, from stratigraphic base to top, the OPA can be subdivided into several informal sub-units: (i) the «clay-rich sub-unit», (ii) the «carbonate-rich silty sub-unit» (only at Mont Terri), (iii) the «lower silty sub-unit» (only in the western part), (iv) the «mixed clay-silt-carbonate sub-unit», (v) the «upper silty sub-unit», and (vi) the «sub-unit with silty calcareous beds» (only in the central and eastern part). Regional variations occur. At Mont Terri, different sub-unit names are in use: (i) the lower shaly facies, (ii) the carbonate-rich sandy facies, (iii) the lower sandy facies, (iv) the upper shaly facies, and (v) the upper sandy facies, while (vi) has never been reported at Mont Terri (Bossart and Thury, 2008; Hostettler et al., 2017; Figure 1C).
The OPA composition consists of detrital terrigenous and biogenic minerals, as well as diagenetic phases from various burial stages (Bläsi, 2002; Pearson et al., 2003; Peters et al., 2011; Lerouge et al., 2014, 2015; Wohlwend et al., 2019a; Mazurek and Aschwanden, 2020). It mostly comprises, in varying proportions, clay minerals (illite, kaolinite, illite-smectite mixed layers, and chlorite), quartz and carbonates. Clay minerals form clay-sized flakes and/or aggregates. Quartz occurs essentially as silt- to fine sand-sized grains. Carbonates consist primarily of calcite, although siderite, and dolomite/ankerite occur locally. Carbonate components have various sizes and are of both, biogenic and authigenic origin (micrite, cement, or replacive phases). Minor and accessory components include further phyllosilicates (muscovite and biotite), pyrite, K-feldspar, albite/plagioclase, organic matter, as well as traces of rutile, zircon, apatite, and monazite (Peters, 1962; Pearson et al., 2003; Lerouge et al., 2014, 2015; Mazurek, 2017; Yu, 2017). Some secondary minerals include Ba-Sr-sulfates and anhydrite in veins, and elemental sulfur (Lerouge et al., 2014). Gypsum commonly forms as an alteration product at the surface of exposed or drilled OPA sections due to the evaporation of pore water at the interface to atmosphere (Mäder and Mazurek, 1998).
Materials and Methods
Petrography
A literature review of existing petrographic descriptions has been performed to evaluate the lithological heterogeneity within the OPA at different scales, such as described and highlighted by different authors (Bläsi, 1987, 2002; Matter et al., 1987, 1988; Etter, 1990; Bläsi et al., 1991, 1996; Allia, 1996; Wetzel and Allia, 2000, 2003; Nagra, 2001, 2002; Peters et al., 2011; Houben et al., 2013, 2014; Jaeggi and Bossart, 2014, 2016; Lerouge et al., 2014, 2015; Reisdorf et al., 2014, 2016; Hostettler et al., 2017; Kneuker et al., 2017, 2020; Lauper et al., 2018; Mazurek and Aschwanden, 2020).
OPA drill cores from different parts of the Mont Terri rock laboratory (BDM-B2, BGC-2, BHC-1, BMB-A6, BPE-2 and BPE-3; Figure 1C) were investigated, and recurrent, dm- to cm-scale lithological units (subfacies) were visually identified by a combination of macroscopic, textural characteristics (grain size, bedding, fabric and color; approach similar to Lauper et al., 2018). A comparable, visual identification of recurrent, small-scale subfacies units was performed on images (of varying quality) of further drill cores from Mont Terri (BAD-2, BDB-1 and BPE-1) and northern Switzerland (Nagra deep drillings at Riniken, Weiach and Benken; Matter et al., 1987, 1988; Nagra, 2001; Figure 1) to refine and validate the previously identified subfacies, and to develop the subfacies classification scheme. All investigated drill cores (both physically and through images solely) were mapped and visualized in a uniform way.
Representative intervals from each identified subfacies type were selected from the Mont Terri BGC-2 drill core for visualization and microfacies analysis. The cores from the selected intervals (two to three per subfacies type) were split in half, photographed, and further sampled for thin sections preparation at the University of Fribourg (Department of Geosciences). Thin sections were embedded into an epoxy resin prior to preparation, and polished with petrol instead of water in order to avoid disintegration of the material by swelling clay minerals. They were studied by classical optical microscopy. Grain size of the coarser fraction (silt- to sand-sized; longest grain diameter) was evaluated on the basis of photomicrographs using ImageJ (Schneider et al., 2012).
Mineralogy
Bulk volumes of about 8 cm3 from cores BGC-2 (6 samples per subfacies; n = 30), BDM-B2 (n = 6) and BPE-2 (n = 5) were grinded into fine powders with a zinc mortar mill. The powders were analyzed with the Rigaku Ultima IV X-ray diffractometer at the University of Fribourg (Department of Geosciences). This system is equipped with a D/teX detector and a Cu X-ray tube (Cu-Kα radiation) operated at 40 kV and 40 mA. The samples were scanned from 5° to 75° 2θ, with a scan speed of 1° 2θ/min and a step size of 0.02° 2θ/step. Peak fitting, identification and Rietveld refinement were carried out with the Rigaku PDXL 2 software package and the ICDD database (International Centre for Diffraction Data).
For comparison purposes, the newly acquired X-ray diffraction (XRD) datasets have been supplemented with existing mineralogical data from Mont Terri and northern Switzerland, which are compiled in different reports (Lerouge et al., 2015; Mazurek, 2017; Waber and Rufer, 2017; Huber, 2018). The mineralogical data were normalized to 100% for the three main mineralogical groups: carbonates (including calcite, dolomite/ankerite, and siderite); quartz + feldspars; and clay minerals (including illite, kaolinite, illite-smectite mixed layers, chlorite, and muscovite). Accessory minerals such as pyrite, apatite, gypsum, and Fe-oxides, etc, were not taken into account into the subfacies quantification.
Image Analyses
Bimodal Differentiation of “Lenses” and “Matrix” Fractions
By definition, “lenses” refer to the brighter area fraction of the rock texture (Figure 2). This fraction is composed of coarser components, mainly silt- to sand-sized siliciclastic grains and bioclasts, as well as carbonate cement phases (mostly sparite). These components typically form individual lenses, laminae and layers, as well as single dispersed grains, which are typically observed within a darker groundmass (“matrix”). The “matrix” represents the dark-gray, background fraction (rock texture minus “lenses” fraction), which is composed mainly of fine-grained clay minerals and minor micrite. In some subfacies, however, the bright area fraction may constitute the dominant part of the rock texture, without forming distinguishable lenses, laminae or layers, and the “matrix” may be scarce or absent. The definition of “lenses” does not include clearly distinguishable diagenetic/epigenetic structures, such as identifiable carbonate concretions, nodules, veins or cone-in-cones layers, which are considered herein as additional attributes (see Lithology and Subfacies Type Classification).
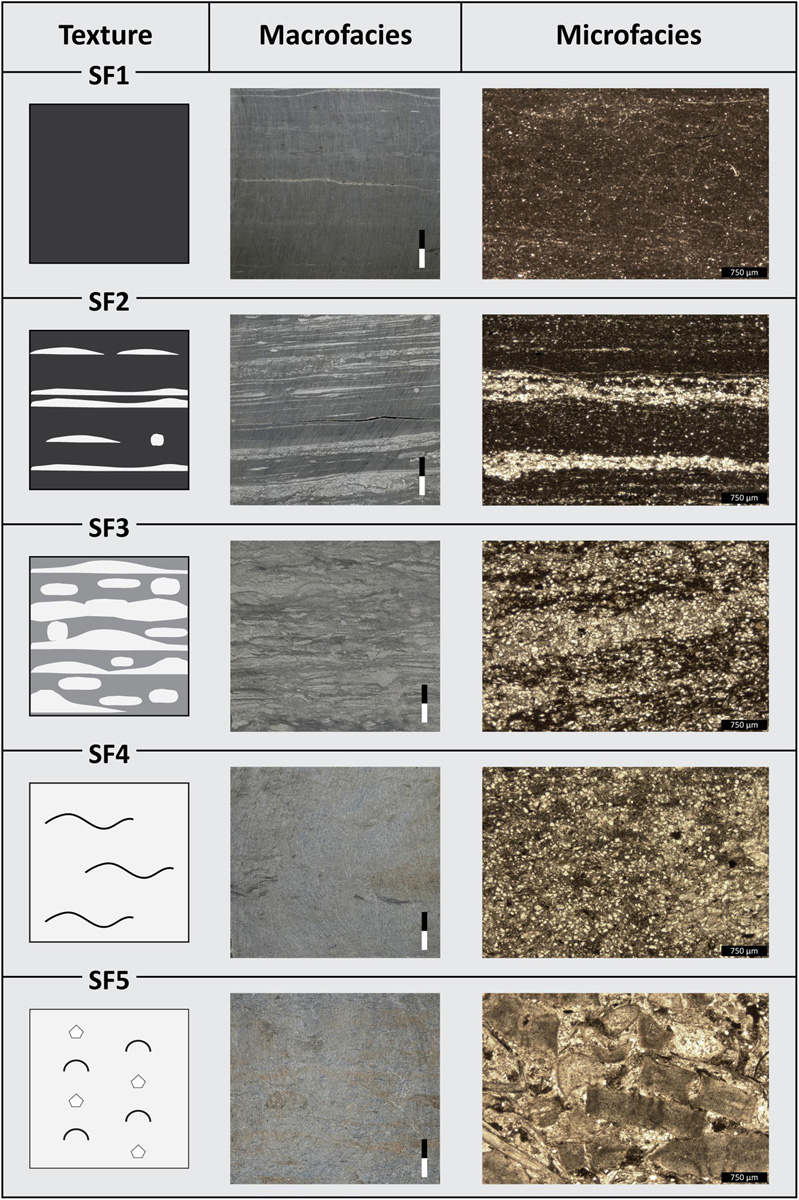
Figure 2. Symbolized texture and typical macro- and microfacies for each subfacies type. SF1 shows a homogeneous, argillaceous “matrix.” Few dispersed, coarser silt grains occur. SF2 shows an argillaceous “matrix” with lenticular bedding. Thickness, length and origin of “lenses” vary; the “matrix” remains the dominant part. SF3 shows a coarser, argillaceous-siliceous “matrix” with non-regular “lenses.” The “lenses” are disturbed, rendering the distinction between “lenses” and “matrix” diffuse. SF4 shows a poorly sorted texture, dominated by silt- to sand-sized components, including quartz grains and bioclasts. Few argillaceous flasers may occur. SF5 resembles SF4, but displays a brighter aspect due to the high content of coarser (up to 2-mm-thick) bioclastic debris. Texture symbols: dark-gray, argillaceous; medium-gray, mixed, argillaceous-siliceous; light-gray, siliceous-calcareous; wavy line (SF4), occasional argillaceous flaser; pentagon (SF5), echinoderm fragment; semicircle (SF5), mollusk shell fragment. Thin sections were photographed in plane-polarized light at × 25 magnification. Scale bar for macrofacies = 2 cm; for microfacies = 750 μm.
Bimodal Quantification of “Lenses” and “Matrix” Fractions – 2D
“Lenses” and “matrix” surfaces within each subfacies type were quantified based on 25 photographs of representative split core intervals (5 images per subfacies type, from the BDM-B2 and BGC-2 drill cores). The photographs (JPEG-format) were converted into 8-bit images with ImageJ (Schneider et al., 2012). The same software was used to segment the “lenses” and “matrix” surface fractions, and to convert the images to binary images (black and white); the threshold was set manually to fit best the visually identified “lenses” versus “matrix” contents (see examples in the Supplementary Figure 1). Automatic segmentation was not possible with the analyzed datasets due to heterogeneous quality of the available images and to the existence of artificial cracks within certain intervals, which consequently modify the image properties. “Lenses” and “matrix” were then quantified as surface fraction of the overall image (in %).
Bimodal Quantification of “Lenses” and “Matrix” Fractions – 3D
To up-scale and evaluate the 3D textural representativeness of the defined subfacies types, representative core intervals of each subfacies type from the BMB-A6 drill core were scanned with the multiscale micro-computed tomography (μ-CT) scanner (Bruker Skyscan 2211) installed at the University of Fribourg (Department of Geosciences). The sampled intervals (drill core diameter = 67 mm; length = between 50 and 70 mm) were measured in high-power mode using an X-ray source at 190 kV and 135 μA with Tungsten target, and using an additional Cu-filter. Images were reconstructed and filtered (ring artifacts, noise removal and beam hardening reduction) with the NRecon software. The resulting voxel resolution was 55 ∗ 55 ∗ 55 μm. Additional filtering of the reconstructed datasets was performed in Avizo (noise removal, contrast enhancement, and additional ring artifact correction). “Matrix” and “lenses” volume fractions, as well as pyrite and porosity, were segmented on the filtered datasets through combined single thresholding and watershed segmentation. After segmentation and labeling, the surface % for the “lenses” + pyrite fraction and the “matrix” fraction per reconstructed slice were quantified.
Representative Elementary Core Length
The representative elementary surface (RES) and volume (REV) were calculated for each subfacies type, based on the BMB-A6 CT-scans used for the 3D quantification. The “lenses”/”matrix” ratio was used as representative parameter for defining the RES and REV. Starting at the top of the scanned core intervals, the “lenses”/“matrix” ratio was calculated for every additional 5-mm-step (z-values; direction of the drill core) on single 2D-slices (vertical, central scan-slice; x-value = constant = 5.5 cm; y-value = 0). The same procedure was applied to the full 3D scans (cylinder-form; x- and y-values = constant = 5.5 cm; incremental z-value = 5-mm-step). Constant x- and y-values instead of increasing values to evaluate the REV were chosen in order to be representative of the elementary core length (REL). Between 10 and 14 data points were obtained for each selected core interval.
Automated Pattern Recognition
Within the framework of a collaborative project (SO-B Experiment, Mont Terri Project; Rempfer et al., 2018; Rempfer et al., in review), a script-based application was developed for the automated recognition of OPA subfacies types. The software is based on drill core images and uses a deep convolutional neural network (DCNN). Such networks are currently considered as state-of-the-art in the field of computer vision and are widely used for diverse image analysis tasks (Russakovsky et al., 2015). Generally, a DCNN consists of a variable number of filters and layers based on defined variables, through which the input images are passed one after the other (for more details on DCNN, see LeCun et al., 2015; Goodfellow et al., 2016).
The scripts and development steps of the automated subfacies type recognition software are documented in Rempfer et al. (in review). Identically sized images, acquired with a DMT core scanner (CoreScan3), displaying single or multiple drill core sections stored in wooden boxes (n = 18; core sections of various quality and drilling orientation; from the BAD-2, BGC-2, BHC-1 and BPE-1 cores, all Mont Terri) were used to train, evaluate and test a pre-trained DCNN ResNet-50 (He et al., 2016). Five subfacies types (labeled SF1 to SF5) were manually assigned to the core sections (ground truthing), as shown in Figures 3A,B. The images were further segmented for parts that should not be identified as any subfacies type (denoted SF0; e.g., depth labeling, broken core sections, wooden boxes and image background). Before processing, the original drill core images were downscaled to numerous sub-images, which were assigned to the distinct subfacies classes based on the corresponding ground truth images. Different parameter values (i.e., image down-sampling step size and scaling, different filter/kernel size; see parameter values in Rempfer et al., in review) were tested with the aim to increase the subfacies class recovery rate. Transformations, such as random rotation and horizontal flips, were applied to the resulting sub-images during the training of the DCNN (Rempfer et al., in review).
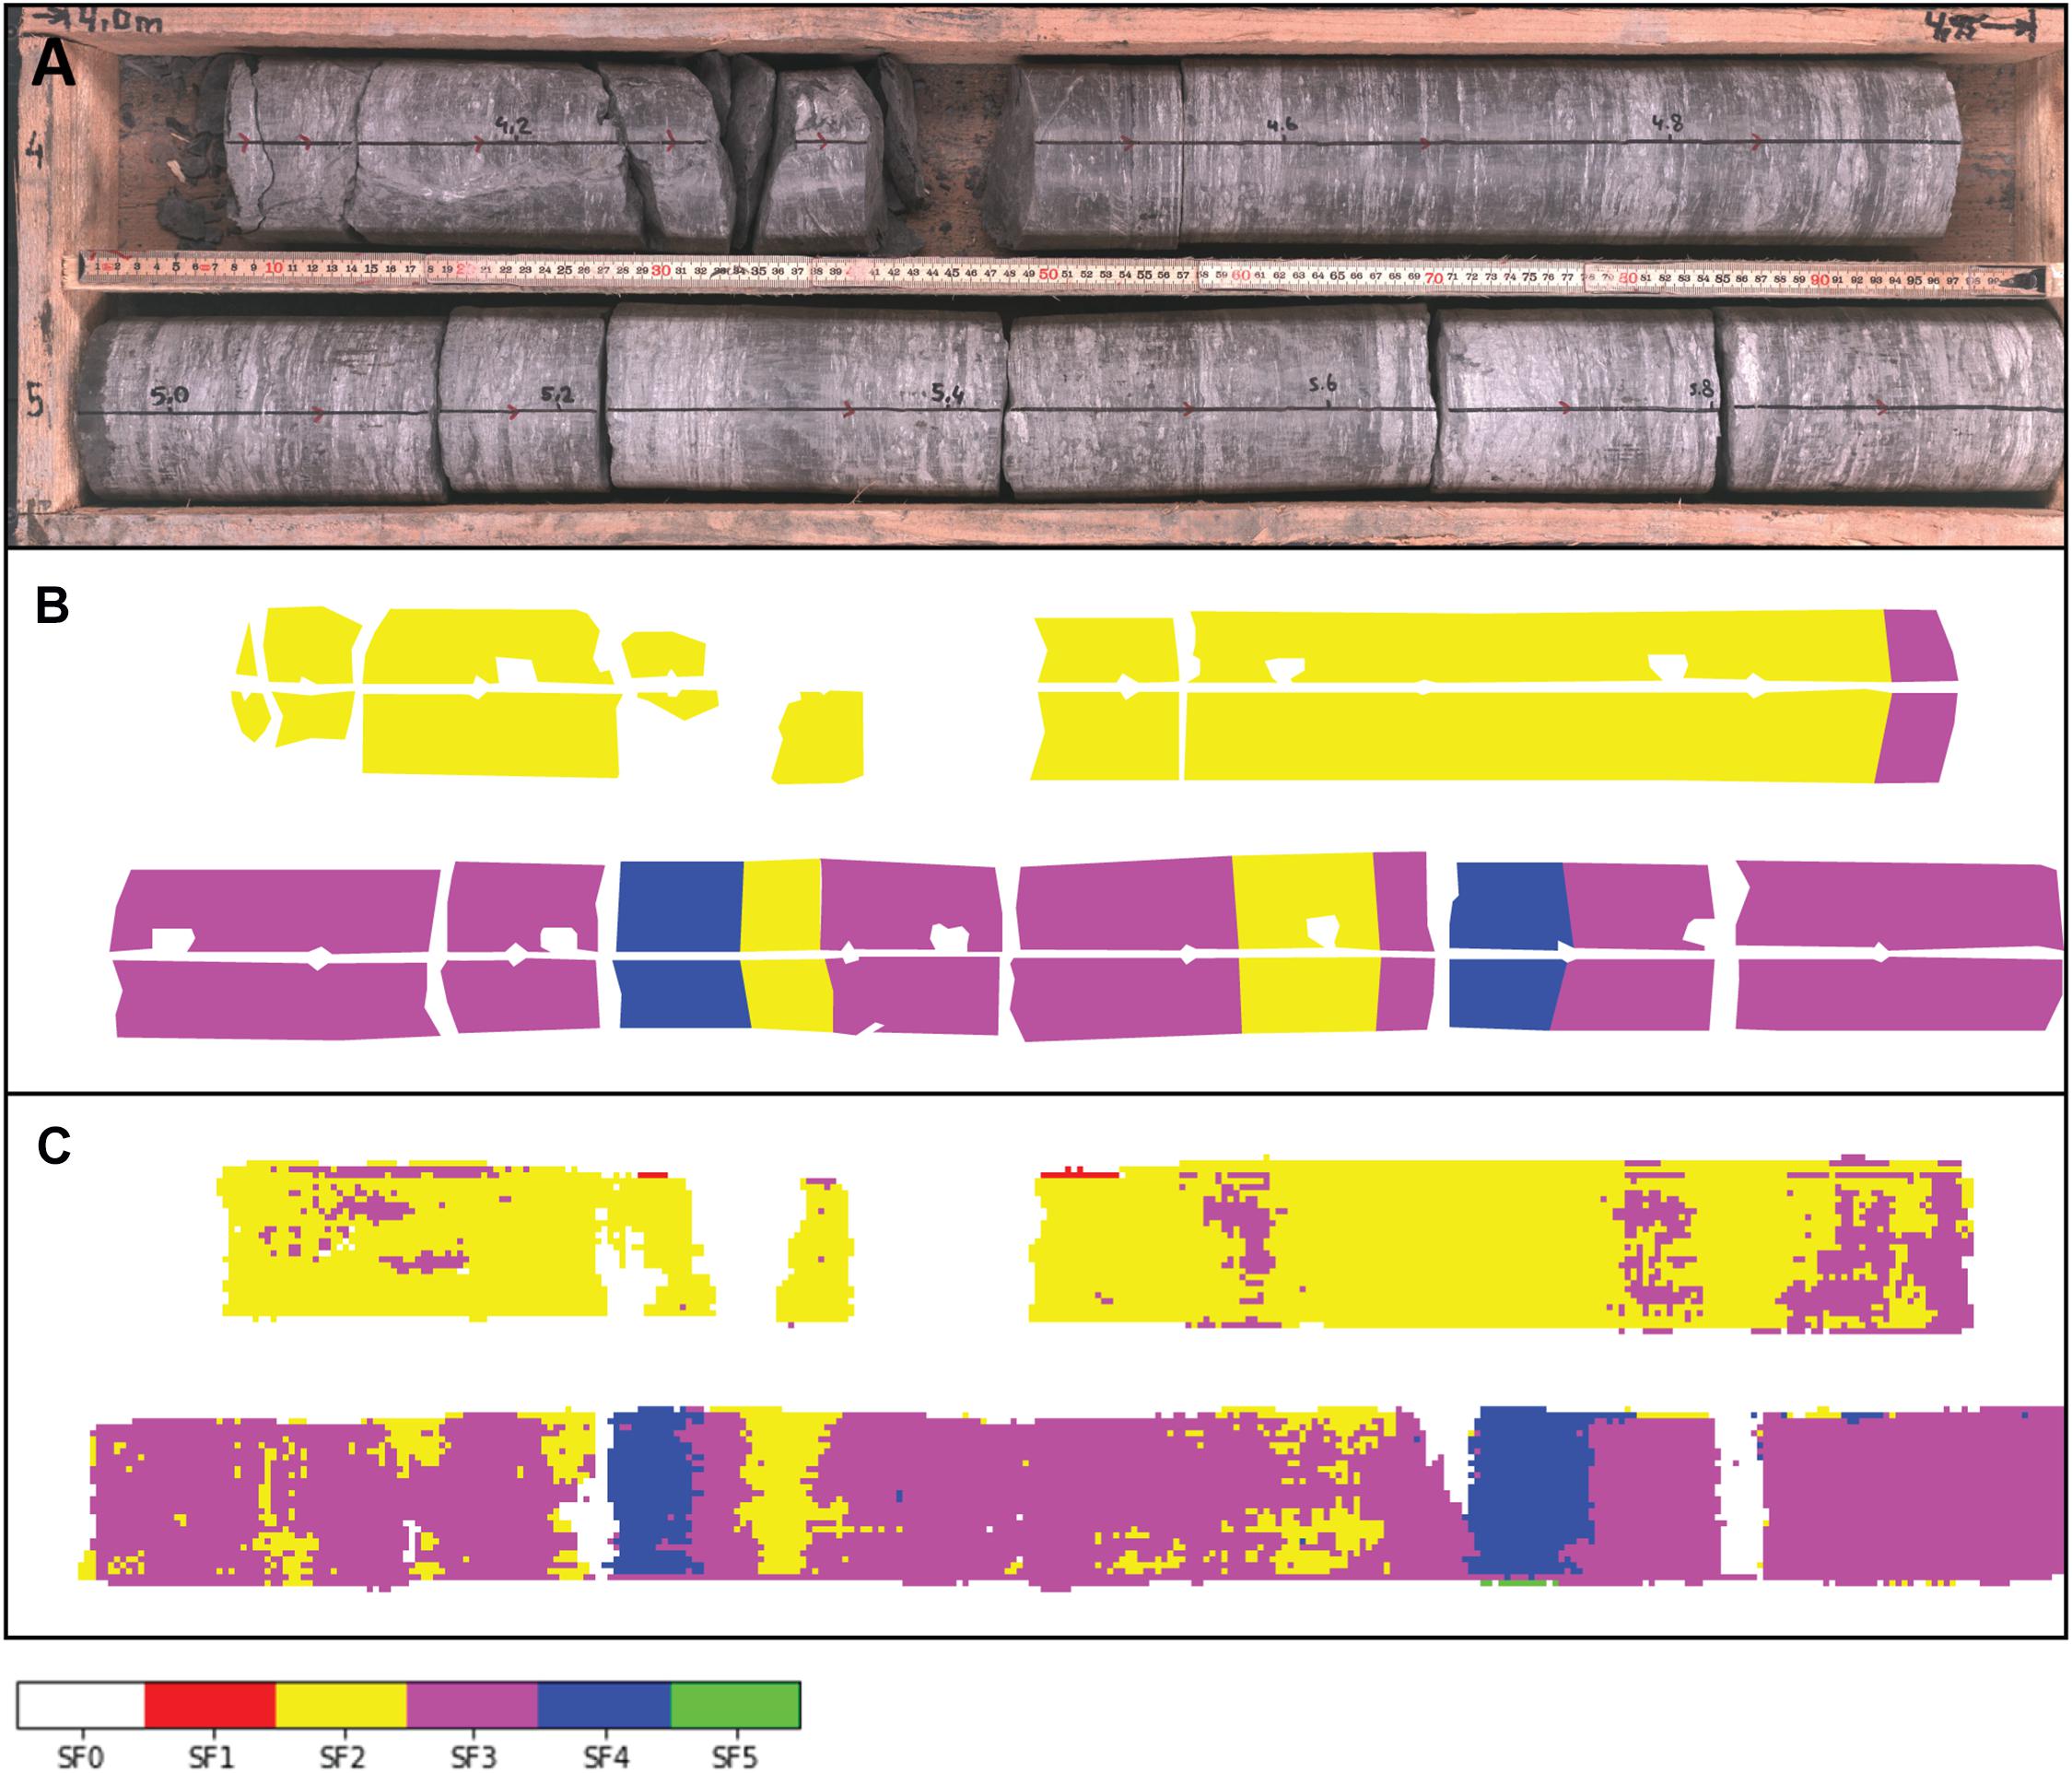
Figure 3. Example of a 2 m drill core interval from BAD-2 (depth meter 4.00 to 6.00), and test of the predictive mode of the trained DCNN (ResNet-50). (A) Original input image. (B) Same image with manual assignment of subfacies types (ground truth). (C) Automated prediction of the trained DCNN (1728 sub-images; see Rempfer et al., in review). Color labels display the distinct subfacies classes. SF0 represent parts of the original image that are not identified as a subfacies type (e.g., depth labeling, broken core sections and wooden storage box).
Within the present study, the ability of the trained DCNN to classify sub-images derived from the training material was tested (i.e., testing phase of the software development; Rempfer et al., in review). Images of equal size to the original drill core images (input files; Figure 3A) were reconstructed from the classified sub-images in order to compare the predicted (provided by the DCNN; Figure 3C) and true classes (such as assigned manually; Figure 3B).
In a next step, the predictive mode of the trained DCNN to identify subfacies types based on drill core images that were not used during the training phase was evaluated (n = 7; five images from Mont Terri and two from Riniken). The resulting images were compared with independent and manually assigned subfacies types (see Supplementary Figures 2–4). Generally, the use of the DCNN allows the cross-checking of the visual/petrographic subfacies identification in a more objective, computed and reproducible way, and hence can help to defining the subfacies classification scheme.
Subfacies Classification Scheme
The qualitative and quantitative datasets were compared, evaluated and integrated to elaborate the most optimal subfacies classification scheme taking into account the RES and REV, the ease of use, as well as previous studies (Müller and Jaeggi, 2012; Lauper et al., 2018; Kneuker et al., 2020). Each subfacies type was described and named according to its texture and mineralogical composition following the nomenclature scheme proposed by Lazar et al. (2015). Fine, medium and coarse mudstones refer to rocks composed of < 25% sand, and sandy mudstones refer to rocks comprising between 25 and 50% sand; sand ranges from 62.5 to 2000 μm (Lazar et al., 2015). Fine, medium and coarse mudstones are distinguished by their coarse silt content, respectively < 33.3%, between 33.3 and 66.6%, and > 66.6%; coarse silt ranges from 32 to 62.5 μm (Lazar et al., 2015). Argillaceous mudstones refer to fine-grained rocks composed of > 50% clay minerals, siliceous refers to > 50% quartz, calcareous refers to > 50% carbonate, and if no mineralogical component is higher than 50%, the two dominant ones are used in decreasing order to name the rock (Lazar et al., 2015). Mineralogical compositions are presented in a ternary diagram following Füchtbauer (1988), rather than Lazar et al. (2015), in order to be consistent with previous studies (e.g., Waber and Rufer, 2017; Naef et al., 2019; Mazurek and Aschwanden, 2020). The classification of Reineck and Wunderlich (1968) is used to describe bedding structures (lenticular, wavy and flaser bedding; used herein as non-genetic descriptive terms). Further characteristics, such as color, level of bioturbation, “lenses” and “matrix” contents, and occurrence of additional (biogenic, diagenetic or structural) features were also considered for subfacies definition (see Table 1).
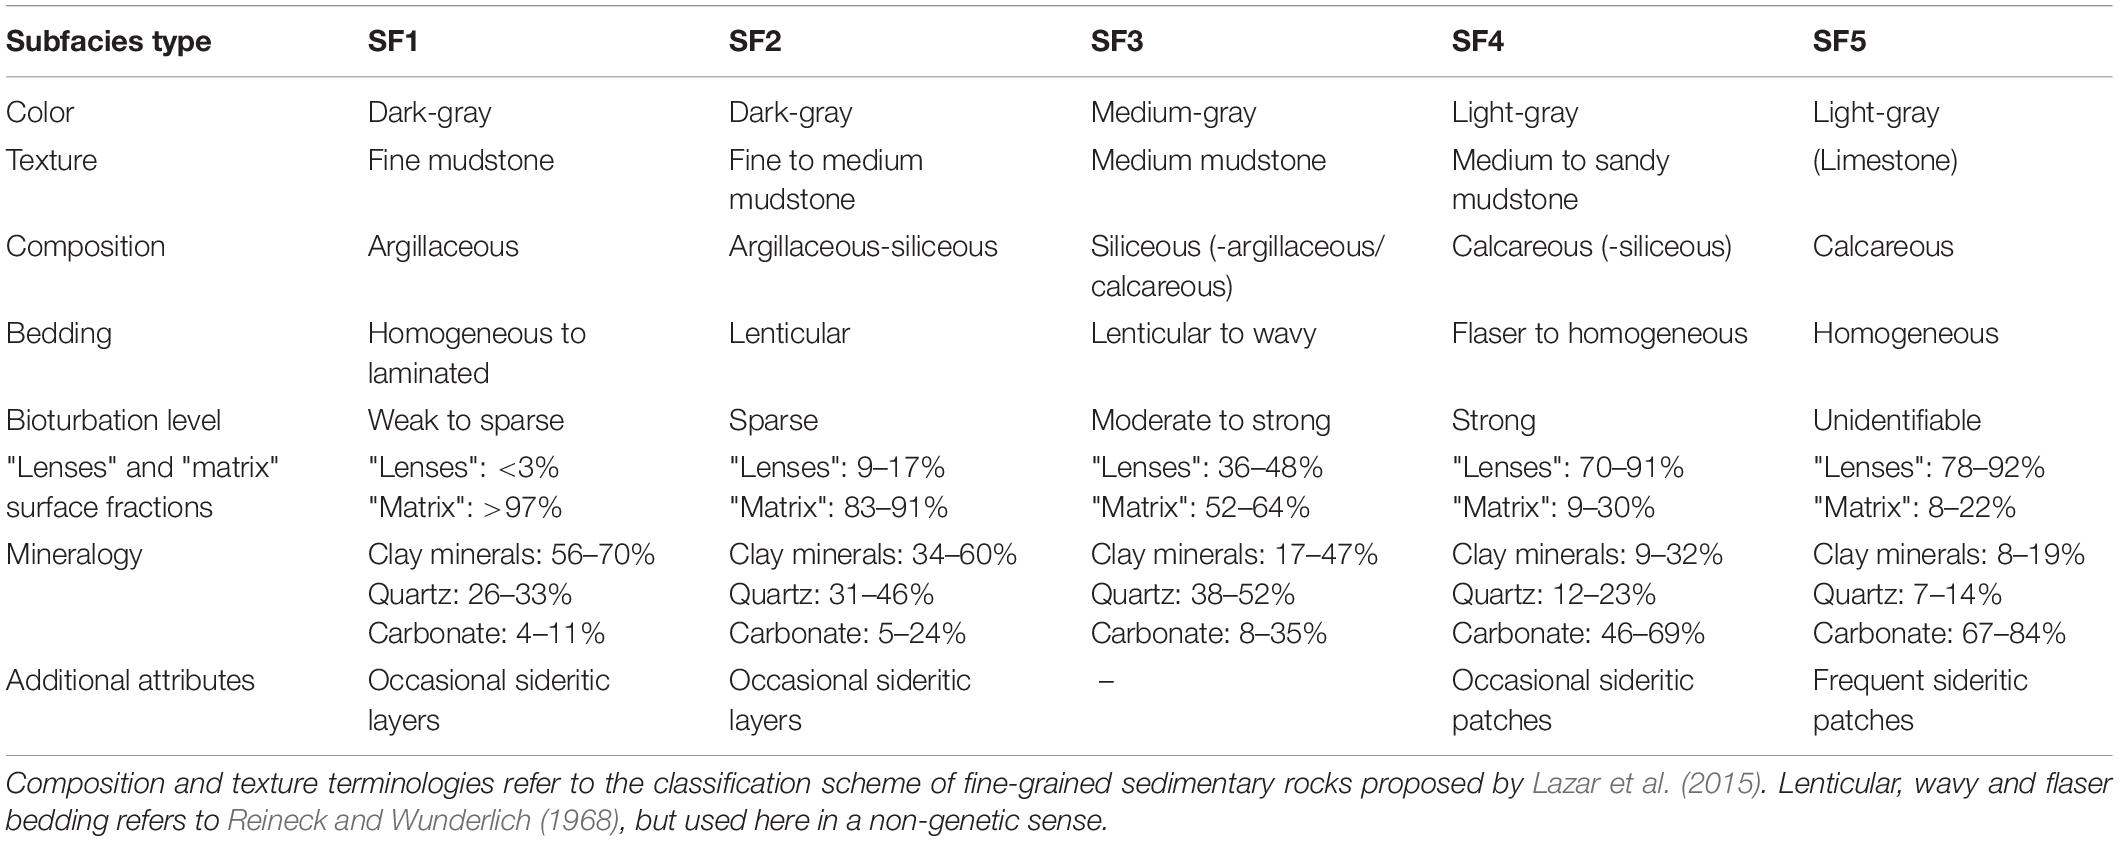
Table 1. Overview of key characteristics of the five OPA subfacies types.
Results
Lithology and Subfacies Type Classification
The OPA lithology is characterized by a continuous range of subtle and more abrupt variations in texture (color, grain size, bedding, fabric, and level of bioturbation) and composition (nature and mineralogy of components). This heterogeneity can be constrained into several end-members (= subfacies types). For consistency, the minimum representative thickness of subfacies types (direction perpendicular to bedding) is defined as 5 cm, although it might be smaller, depending on selected parameters (see results of RES and REV). The five OPA subfacies (SF1 to SF5) described along the Mont Terri drill core BDM-B2 by Lauper et al. (2018), resulted as being the most common lithological end-members observed within the overall studied material. However, within the scope of this study, the BDM-B2 subfacies are refined according to new observations (Figure 2 and Table 1).
Generally, the five subfacies types display, from SF1 toward SF5, an increase in lightness (from dark- to light-gray), a coarsening of the overall grain size (increasing content of coarse silt- to sand-sized grains with respect to finer material), an increase in carbonate and quartz content (including cements) with respect to clay minerals, and an increasing level of bioturbation (from individually identifiable burrow features toward homogenized textures).
Subfacies type 1 (SF1) consists of an argillaceous, fine mudstone (Figure 2). It is constituted of a homogeneous to thinly laminated, dark-gray “matrix,” with none to rare brighter “lenses.” The “matrix” primarily comprises fine-grained clay minerals. Dispersed, or vaguely grouped, silt- to sand-sized grains (mainly quartz, few feldspar, and micas) and/or bioclasts (mainly small mollusk shells) may occur throughout the “matrix,” resulting in a lighter gray shade. Minor micrite may also occur within some intervals. The rare brighter “lenses” are thin and flat (few-mm-thick), and mostly discontinuous at the drill-core-scale (≤ 6 cm). They are primarily composed of silt- to sand-sized quartz grains (including minor feldspar) and bioclasts (mainly echinoderm and mollusk shell fragments). They can be poorly- or well-cemented by sparitic Fe-calcite. Minor pyrite occurs throughout both “lenses” and “matrix,” mostly as disseminated framboids. Pyritized burrow trails occasionally occur. Occasional macrofossils and diagenetic concretions/layers occur. In particular, frequent, cm-thick, sideritic layers are present in some SF1 intervals in northern Switzerland (Riniken, Weiach and Benken).
Subfacies type 2 (SF2) consists of an argillaceous-siliceous, fine to medium mudstone characterized by lenticular bedding (Figure 2). It is composed of a dark-gray “matrix,” with common to abundant, brighter “lenses.” The “matrix” primarily comprises fine-grained clay minerals with dispersed silt- to sand-sized siliciclastic grains and few bioclastic fragments. The brighter “lenses” are mainly composed of silt- to sand-sized quartz grains (and minor feldspar), bioclasts (mainly echinoderm and mollusk shell fragments) and carbonate cements (mainly sparitic Fe-calcite, occasionally dolomite/ankerite and siderite). Some “lenses” may however be poorly cemented. Minor pyrite occurs throughout both, “lenses” and “matrix,” mostly as disseminated framboids. The “lenses” are discontinuous to continuous, mostly thin and flat, to less frequently thick and wavy. Their thickness ranges from few millimeters (thin laminae) to few centimeters. Within certain intervals, the “lenses” display sedimentary structures, such as starved ripples and graded rythmites (similar structures as in Reineck and Singh, 1972). Rounded bioturbational “lenses” occur and form the main lenticular features within certain intervals. Most “lenses” are sharply delineated from the “matrix,” although some intervals may display less contrasted features (higher content of dispersed, coarser grains or micrite within the “matrix”).
Subfacies type 3 (SF3) consists of a siliceous-argillaceous to siliceous-calcareous, medium mudstone characterized by lenticular to wavy bedding (Figure 2). It is composed of a dark- to medium-gray “matrix” with abundant brighter “lenses.” The “matrix” comprises fine-grained clay minerals with comparatively high content of dispersed silt- to sand-sized siliciclastic and bioclastic grains. The brighter “lenses” are mainly composed of silt- to sand-sized quartz grains (and minor feldspar) and bioclasts (mainly echinoderm and mollusk shell fragments). Most “lenses” are well cemented by sparitic Fe-calcite, and occasionally by dolomite/ankerite and siderite. Minor pyrite occurs throughout both “lenses” and “matrix,” mostly as disseminated framboids. The “lenses” are discontinuous to continuous, thin to thick, often wavy (lenticular to wavy bedding), and frequently disturbed by bioturbational features. Their thickness ranges from a few mm to a few cm. Within certain intervals, starved ripples can be distinguished, and some “lenses” display internal cross-bedding. Many “lenses” are not sharply delineated, due to a relatively high level of sediment mixing and/or poor sediment sorting (higher content of dispersed, coarser grains or micrite within the “matrix”).
Subfacies type 4 (SF4) consists of a calcareous-siliceous, medium to sandy mudstone (Figure 2). It is composed of a dominant, light-gray fraction, which primarily comprises silt- to sand-sized, siliciclastic quartz grains (and minor feldspar) and bioclastic fragments (mainly echinoderm and mollusk shell fragments). The proportion of bioclasts versus siliciclastic grains varies significantly from one interval to the other. Rare lenticular features are distinguishable at the drill-core-scale. The darker, fine-grained, argillaceous fraction is mixed to the overall sediments (poor sediment sorting), or occasionally forms discontinuous, flaser-like structures. Minor pyrite occurs throughout both fractions, mainly as disseminated framboids. Brownish, cm-sized, siderite-cemented patches are frequent. Further carbonate, sparitic, and to a lesser degree micritic cements are common.
Subfacies type 5 (SF5) consists of a silty to sandy, argillaceous, and bioclastic limestone (packstone sensu Dunham, 1962; Figure 2). It is composed of a dominant, light-gray fraction, which comprises abundant, up to > 2-mm-thick, bioclastic fragments (mainly echinoderm and mollusk shell fragments) and silt- to sand-sized siliciclastic grains (mostly quartz). Due to the monocrystalline nature of the abundant echinoderm fragments, SF5 has the brightest aspect of all subfacies types. The remaining fine-grained fraction (rich in clay minerals and micrite) is mixed into the overall sediments (poor sediment sorting), or absent and substituted by Fe-calcite cement (occasionally dolomite/ankerite and siderite). Brownish, cm-sized, and siderite-cemented patches are frequent.
In addition to the main lithological characteristics defining the above-presented subfacies types, further notable features, such as early or late diagenetic concretions and veins, may locally modify the textural aspect of the rock. The most common features include cm-sized pyritic concretions, sideritic patches, layers and concretions, calcite veins (occasionally mixed with Ba-Sr-sulfates), layers with cone-in-cone structures, and larger carbonate concretions and nodules (Figure 4; see further examples in e.g., Lerouge et al., 2014; Lauper et al., 2018, 2021). These features occur punctually or repeatedly, typically enriched within certain intervals. Larger fossils, such as belemnites, ammonites or other organisms, are occasionally observed (see examples in Etter, 1990, 2004; Reisdorf et al., 2014, 2016; Hostettler et al., 2020). Structural features, such as fault planes and shear zones, as well as induced excavation damaged zones and artificial discontinuities can occur, but are not further discussed within the scope of this study (see e.g., Kneuker et al., 2017). Furthermore, mineral alteration at the surface of long-exposed drill core sections or outcrops may typically modify the appearance of the rock. Such features include mainly whitish gypsum encrustation and red-rust-colored, oxidized Fe-minerals (Mäder and Mazurek, 1998).
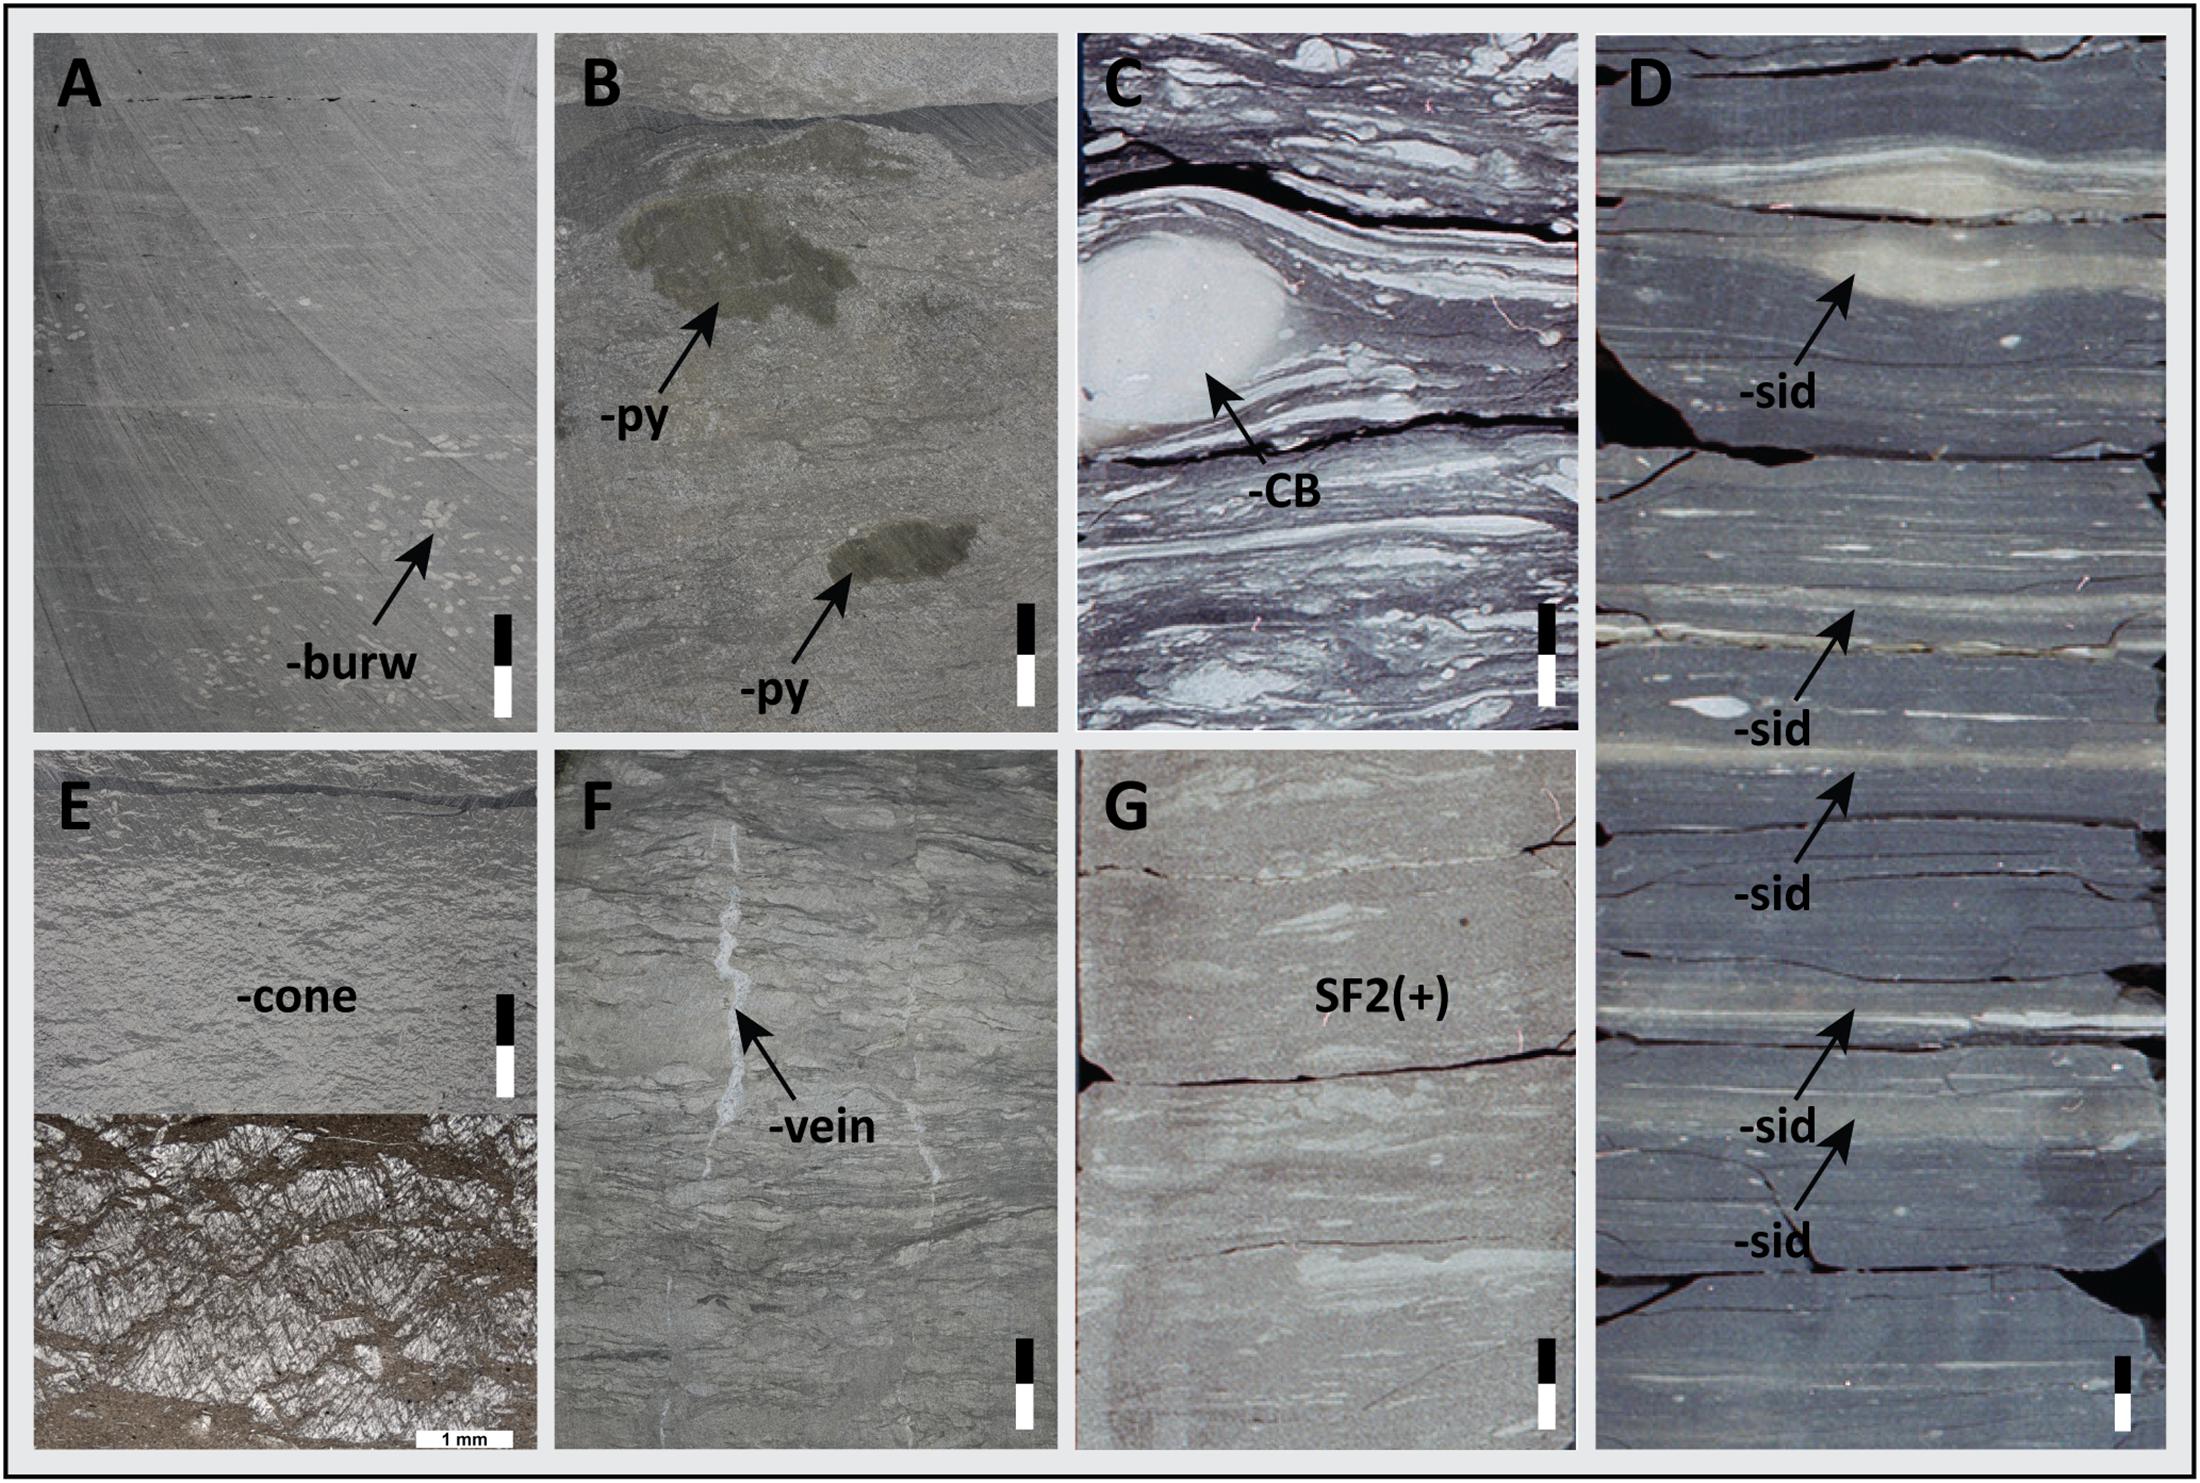
Figure 4. Examples of additional attributes subfacies characteristics (and corresponding abbreviations for the extension of the classification scheme). (A) Accumulation of mm-sized bioturbational features (arrow) within SF1 (Mont Terri). Highlighted by the abbreviation “-burw.” (B) Presence of cm-thick pyritic concretions (arrows) within SF4 (Mont Terri). Highlighted by the abbreviation “-py.” (C) Arrow points to a cm-thick carbonate nodule (Riniken). Highlighted by the abbreviation “-CB.” CB refers to concretionary bodies and includes indifferently concretions and nodules (sensu Sellés-Martínez, 1996). (D) Diagenetic sideritic layers (arrows) within the lower OPA (borehole Riniken; SF1). Highlighted by the abbreviation “-sid.” (E) Eight-cm-thick, calcitic layers with cone-in-cone structures (Mont Terri). Highlighted by the abbreviation “-cone.” The lower part shows the cone-in-cones microfacies (plane-polarized light, × 25 magnification). (F) Thin calcitic vein (arrow) within SF3 (Mont Terri). Highlighted by the abbreviation “-vein.” (G) Atypical SF2 (Weiach): poorer distinction between “lenses” and “matrix” than classical SF2 (coarser/lighter “matrix,” more silt content). The suffix (+) can be used to highlight the atypical aspect and above-average quartz/carbonate content (mainly within the “matrix”) with respect to the selected subfacies type. Scale bar = 2 cm.
In order to increase accuracy of subfacies descriptions, and to overcome classification challenges related to the continuous nature of OPA lithological variations (see Supplementary Figure 5), the identification of the five subfacies types is complemented by a list of short abbreviations and symbols representing the most common texture-modifiers and additional or atypical attributes (Table 2). This list aims at providing a standardized toolset to highlight, during drill core, and outcrop mapping, the occurrence of the main biogenic, diagenetic, sedimentological, and structural characteristics that present a variation of the typical texture of the identified subfacies type. Hence, atypical OPA intervals, or lithologies residing at the interface between two subfacies types, can be described by adding consistent terminology. For instance, the presence of a remarkable pyrite concretion within SF1 can be recorded as SF1-py, while a poorly contrasted SF2 interval (transitional) can be referred to as SF2(+), emphasizing its somewhat coarser “matrix” (Figure 4). An integrated conceptual classification workflow for the identification of OPA subfacies types is presented in the Supplementary Figure 6.
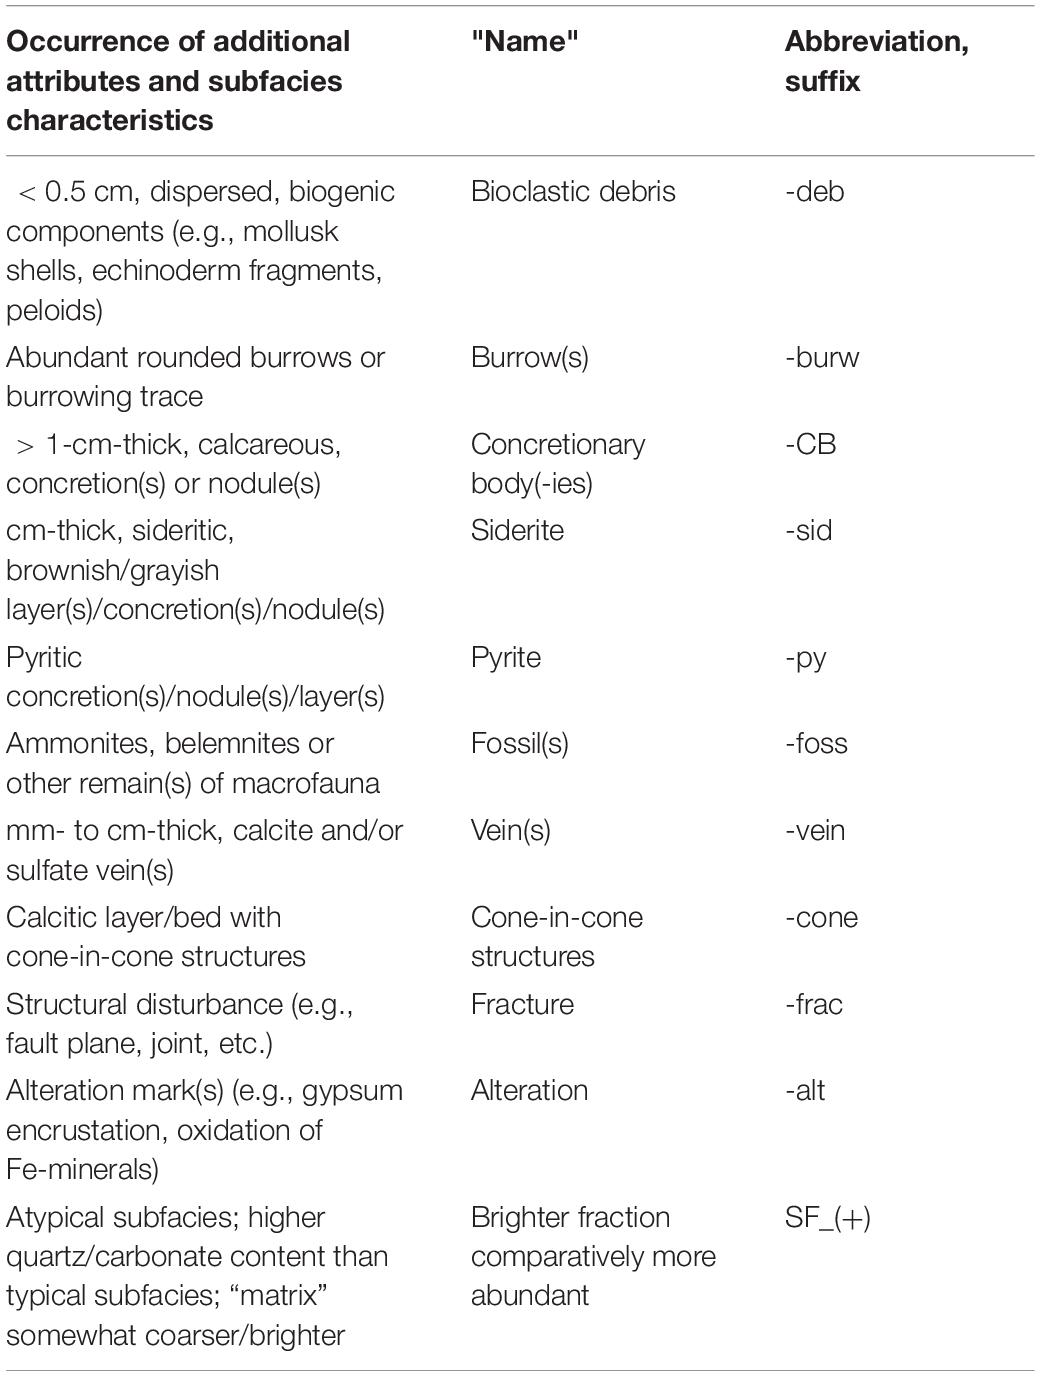
Table 2. Extension of the subfacies classification scheme: abbreviations and suffixes highlighting the main additional features and lithological characteristics for refined subfacies descriptions.
Furthermore, throughout the overall OPA lithostratigraphic interval, several, dm-thick, light-gray to red-colored, carbonate-rich beds are considered as major lithological heterogeneities (Mazurek and Aschwanden, 2020). Considering their scarcity and high textural and genetic heterogeneity, these units are not classified as distinct OPA subfacies types. For the sake of this study, these carbonate-rich units are assigned to either (i) silty, limestone beds, or (ii) concretionary/intraclastic calcareous horizons. Detailed analysis, classification and interpretation of some of these units can be found in Wetzel and Allia (2000); Lauper et al. (2021) and Lauper (in press).
Vertical and Lateral Subfacies Heterogeneity
Figures 5, 6 show the subfacies distribution along several key drill cores from Mont Terri and northern Switzerland (Riniken, Weiach, and Benken). The overall subfacies heterogeneity is described within each of the larger-scale, OPA sub-unit (from stratigraphic base to top), following the classical facies subdivision in use within the Mont Terri community (Bossart and Thury, 2008; Hostettler et al., 2017), and the informal sub-unit delineation proposed by Mazurek and Aschwanden (2020) for northern Switzerland, respectively.
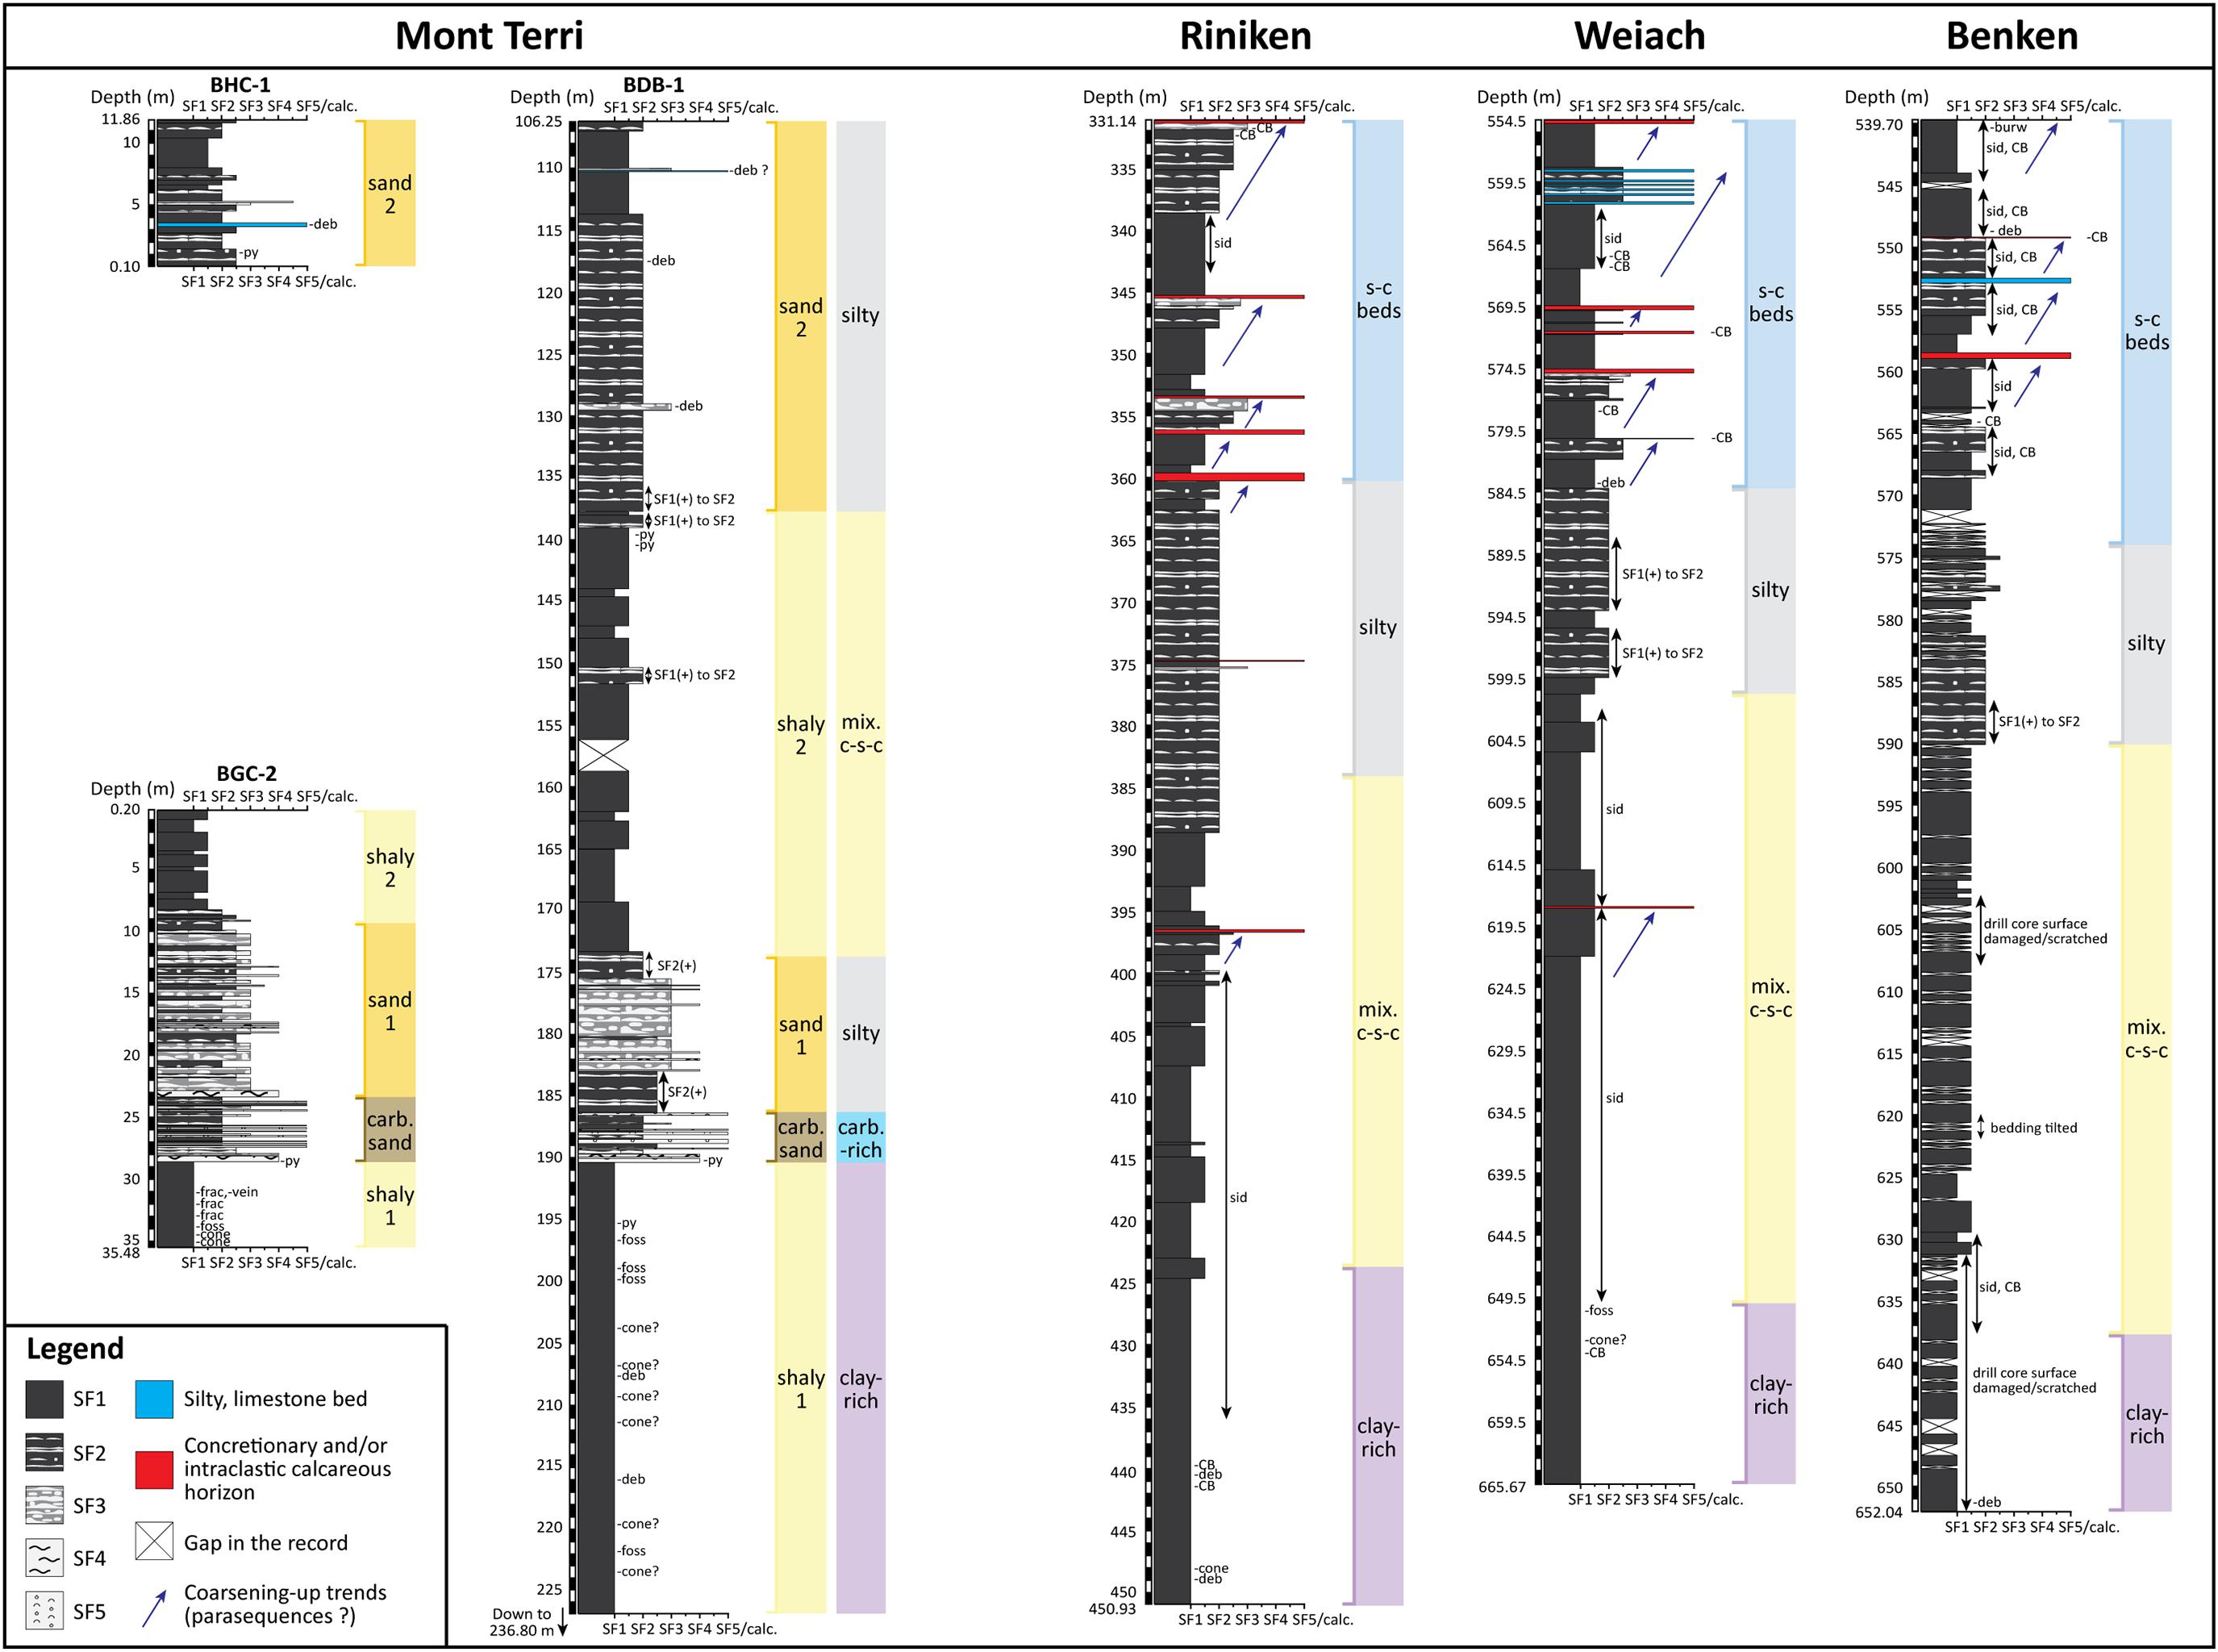
Figure 5. Overview of the Opalinus Clay succession in different locations (Mont Terri, Riniken, Weiach and Benken). Drillings crossed bedding planes at an angle of about 90°. The lithologs follow the subfacies classification scheme presented herein. Sub-units at Mont Terri refer to the facies classification as used within the Mont Terri Project (Bossart and Thury, 2008; Hostettler et al., 2017). shaly 1, lower shaly facies; carb. sand, carbonate-rich sandy facies; sand 1, lower sandy facies; shaly 2, upper shaly facies; sand 2, upper sandy facies. Sub-units in northern Switzerland refer to the refined sub-units proposed by Mazurek and Aschwanden (2020). clay-rich, «clay-rich sub-unit»; carb.-rich, «carbonate-rich silty sub-unit»; mix. c-s-c, «mixed clay-silt-carbonate sub-unit»; silty, «upper silty sub-unit»; s-c beds, «sub-unit with silty calcareous beds»; calc. (label), calcareous lithology (limestone). Possible parasequences (“Dachbank” cycles; Wetzel and Allia, 2003) are outlined by blue arrows.
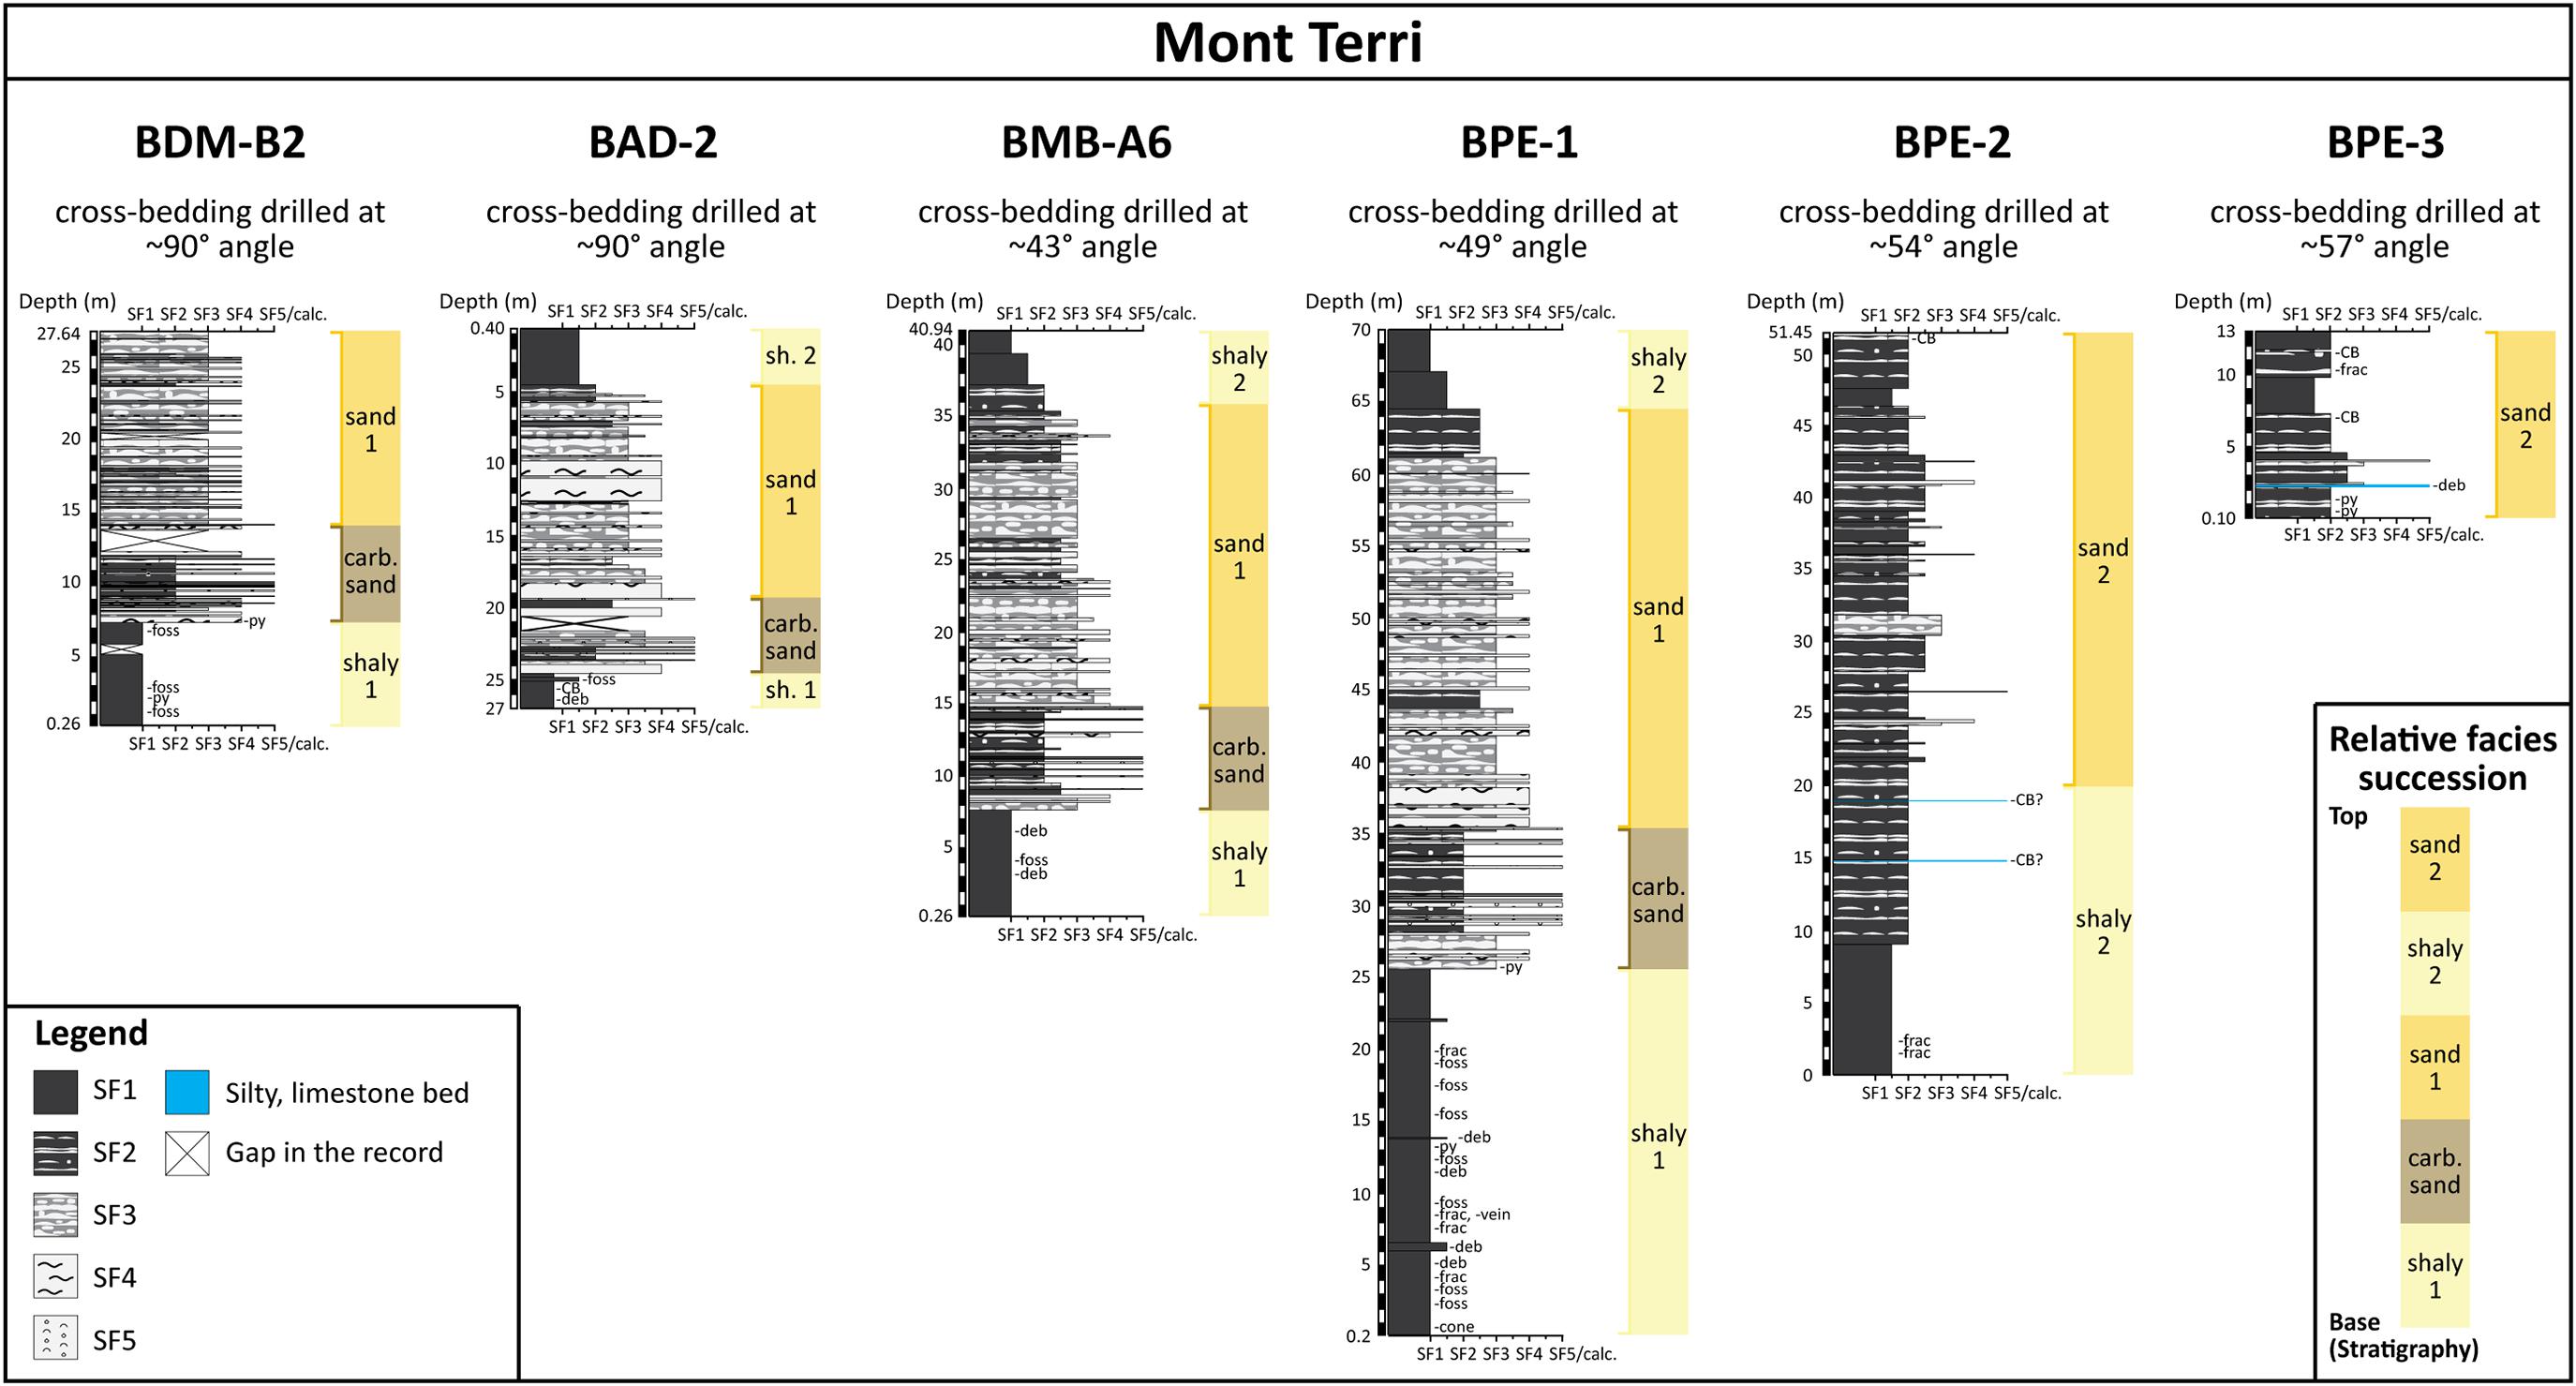
Figure 6. Overview of the Opalinus Clay succession in different drill cores from the Mont Terri rock laboratory. Drilling crossed bedding planes at different angles, resulting in varying subfacies/facies apparent thicknesses. The sketches follow the subfacies classification scheme presented herein. Sub-units at Mont Terri refer to the facies classification as used within the Mont Terri Project (Bossart and Thury, 2008; Hostettler et al., 2017). sh. 1, shaly 1, lower shaly facies; carb. sand, carbonate-rich sandy facies; sand 1, lower sandy facies; sh. 2, shaly 2, upper shaly facies; sand 2, upper sandy facies. calc. (label), calcareous lithology (limestone).
At Mont Terri, the lower shaly facies («clay-rich sub-unit» according to Mazurek and Aschwanden, 2020; Figure 5) is essentially composed of SF1. Additional features such as pyrite/carbonate concretions, macrofossils, horizons with high bioclastic fragments, sideritic layers, and layers with cone-in-cones structures are present (see also Bläsi et al., 1991, 1996; Hostettler et al., 2017). In this study, not many observations were made within the lower shaly facies, which is nonetheless compensated by existing reports. Within the framework of a biostratigraphic study, Reisdorf et al. (2014) differentiated the lower shaly facies into essentially three “(bio-)subfacies”: (i) “a shell coquina facies”; (ii) “an argillaceous facies with low share of biodetritus”; and (iii) “a cephalopod facies with shell coquina and burrows,” which may be translated with the herein-proposed subfacies type classification as: (i) SF1-deb; (ii) SF1; and (iii) SF1-foss-deb-burw. Jaeggi and Bossart (2014) suggested that the upper part of the lower shaly facies (Aalenian age) is rich in ammonites (SF1-foss), whereas the lower part (Toarcian age) is rich in bioclastic debris (SF1-deb).
The carbonate-rich sandy facies («carbonate-rich silty sub-unit» according to Mazurek and Aschwanden, 2020) shows high subfacies variability. It starts with a several-dm-thick, SF4 interval (SF4-py at its base), followed by dm-scale alternations between mainly SF2 and SF5. SF3 and SF4 occur occasionally, while SF1 is rare or absent. Along certain sections, SF2 and SF5 constitute dm-thick, coarsening-upward successions, separated by sharp but mostly undulated (or non-planar) subfacies boundaries. SF5 intervals are mostly < 10-cm-thick, and rarely thicker than 20 cm, whereas SF2 intervals can be thicker. SF5 occasionally forms in-filling sedimentary features, such as small-scale pot and gutter casts (Lauper et al., 2018).
The lower sandy facies («lower silty sub-unit» according to Mazurek and Aschwanden, 2020) begins after the last SF5 occurrence. It is largely composed of successions of SF3 and SF4, with rare SF2. Generally, individual subfacies types extend vertically over several decimeters, and even up to several meters. Comparisons between drill cores suggest that the proportions of SF3 and SF4 vary laterally (Figure 5).
The transition from the lower sandy facies toward the upper shaly facies («mixed clay-silt-carbonate sub-unit» according to Mazurek and Aschwanden, 2020) is gradational, characterized by a decrease in SF3 and SF4, and a congruent increase in first SF2, and then SF1. The upper shaly facies is somewhat coarser and more clay minerals-poor than the lower shaly facies, resulting in a slightly lighter gray shade. It is characterized by successions of SF1 and a subfacies that lies at the interface between SF1 and SF2, which displays thin, silty laminae within a fine-grained, argillaceous “matrix” [i.e., SF1(+); see also “SF2a” in Kneuker et al., 2020].
The upper sandy facies («upper silty sub-unit» according to Mazurek and Aschwanden, 2020) is predominantly composed of SF2 and some SF3. Few, up to 25-cm-thick, SF4 beds occur, while SF1 and SF5 are rare to absent. The upper sandy facies is generally finer than the lower sandy facies. At the top of the sub-unit, individual calcareous concretions are common (SF2-CB; see also Hostettler et al., 2020).
In northern Switzerland, the «clay-rich sub-unit» consists largely of SF1. Additional features such as pyrite/carbonate concretions and nodules, macrofossils, horizons with high bioclastic fragments and layers with cone-in-cone structures occur. Few, cm-thick, sideritic layers (SF1-sid) are visible within the upper part of the Riniken «clay-rich sub-unit», forming the transition toward the overlying, «mixed clay-silt-carbonate sub-unit».
The transition from the «clay-rich sub-unit» toward the «mixed clay-silt-carbonate sub-unit» is characterized by the onset of frequent, cm-thick, sideritic layers (SF1-sid). The «mixed clay-silt-carbonate sub-unit» is dominated by SF1 and subfacies that lie at the interface between SF1 and SF2 [i.e., SF1(+), SF1-deb]. At Riniken and Weiach, a dm-thick, concretionary carbonate horizon occurs, and is preceded by a coarsening-upward sequence (from SF1 to SF2 at Riniken; less obvious at Weiach). The upper part of the sub-unit shows an increase in silty laminae and lenses, from SF1(+) toward SF2, marking the transition toward the overlying sub-unit.
The «upper silty sub-unit» is characterized by SF2. From base to top, an overall coarsening-upward trend is suggested by the succession from SF1(+) toward SF2 with an increasing “lenses” content, especially at Weiach, and at Benken to some extent.
The «sub-unit with silty calcareous beds» is mostly composed of typical and atypical SF1 and SF2 [including cumulative additional features; e.g., SF1-sid-deb, SF1(+), etc]. This sub-unit is characterized by the presence of dm-thick, carbonate-rich units (including single carbonate concretions and concretionary/intraclastic horizons in all three drill cores, as well as successive, silty limestone beds at Weiach), often preceded by coarsening-upward trends ranging from SF1 toward mainly SF2, and occasionally SF3.
The recognition of subfacies variability patterns within the different OPA successions suggests a generally coarser lithology at Mont Terri. It is evidenced by the common presence of SF3, SF4 and SF5, especially within the middle part of the succession (carbonate-rich sandy and lower sandy facies), whereas their presence within the Riniken, Weiach and Benken drill cores is limited. On the other hand, the drillings from northern Switzerland displayed several, dm-thick, carbonate horizons within the uppermost sub-unit, and in particular concretionary/intraclastic calcareous beds, which are at Mont Terri limited to the uppermost transitional horizon toward the overlying Passwang Formation (Lauper et al., 2021).
This study evidences that subfacies type heterogeneity is higher at Mont Terri than in northern Switzerland. While a part of the higher heterogeneity is supported by mineralogical analyses (see next section), the different investigation methods (i.e., physical versus imaged drill core descriptions) may have partially resulted in a higher description accuracy (finer resolution) for the physical core sections from Mont Terri (direct calibration with physical samples and quantitative data). Nevertheless, facies analysis shows that the overall subfacies variability pattern remains smaller in northern Switzerland.
Mineralogical Characterization of Subfacies Types
The Mont Terri samples allowed constraining the typical mineralogical composition of each subfacies type (Figure 7 and Supplementary Tables 1, 2). The results show, from SF1 toward SF5, a general decrease in clay minerals content and an increase in carbonate. Quartz content increases from SF1 toward SF3, and diminishes toward SF4 and SF5. The results are coherent with thin section analyses and confirm that the mineralogical composition is tightly associated to the OPA texture. The finer subfacies show higher content of clay minerals, while the coarser subfacies show higher content of quartz and carbonate. This is due to the preferential distribution of the main mineralogical phases into specific grain sizes; clay minerals occur into the clay- to fine silt-sized fraction (within the “matrix”), while quartz and carbonate occur dominantly into the silt- to sand-sized fraction (within “lenses”; not taking into account diagenetic minerals). The mineralogical composition is hence an appropriate analytical proxy for subfacies identification.
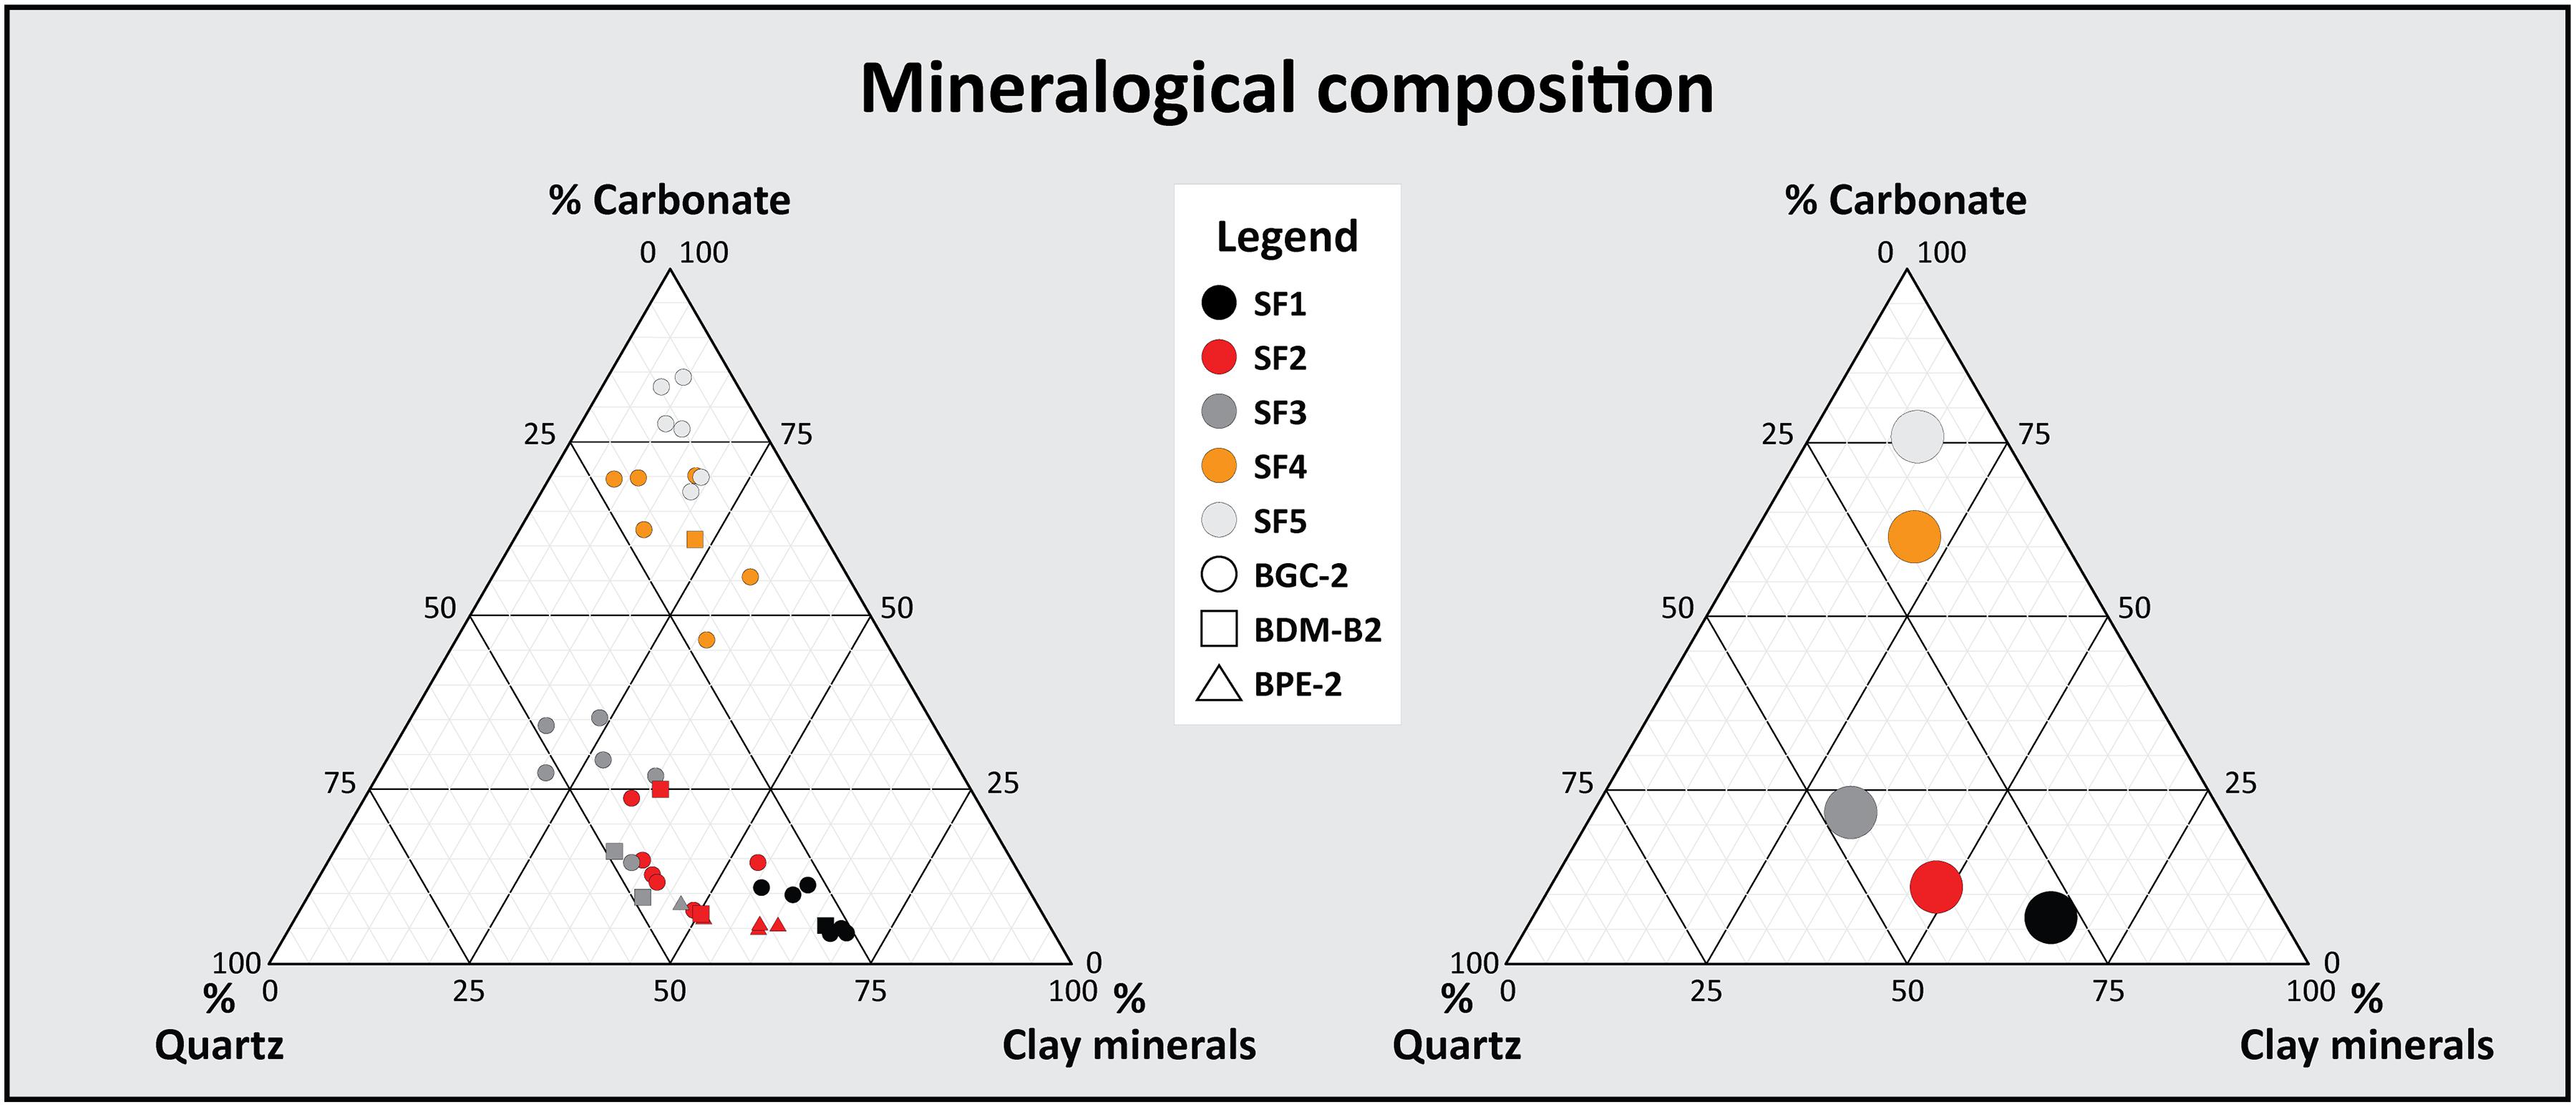
Figure 7. Typical mineralogical composition of the five subfacies types. The left graph displays the mineralogical composition (wt%) of 41 samples from Mont Terri (BGC-2, BDM-B2, and BPE-2 drill cores), and the right graph shows the average composition for each subfacies type. Carbonates include calcite, dolomite, ankerite, and siderite; clay minerals are not distinguished. They include kaolinite, illite, illite-smectite mixed layers, chlorite, as well as muscovite. Sum contents of the three mineral groups (carbonates, quartz, and clay minerals) are normalized to 100%; further minor components are not considered.
Based on the acquired XRD data, the typical mineralogical range for each subfacies type is given in Table 1. Carbonates, quartz and clay minerals data are normalized to 100% (other components are not considered). The true values are thus slightly lower by 1 to 3% than the data presented in Table 1 and Figure 7.
Figure 8 displays the mineralogical composition of different OPA samples retrieved from the literature (see figure caption for references). As the exact location of the measured samples could not be systematically identified based on the provided information, the subfacies types were not determined. Rather, the samples were classified in terms of major sub-unit, according to the common classifications at Mont Terri (Bossart and Thury, 2008) and in northern Switzerland (Mazurek and Aschwanden, 2020).
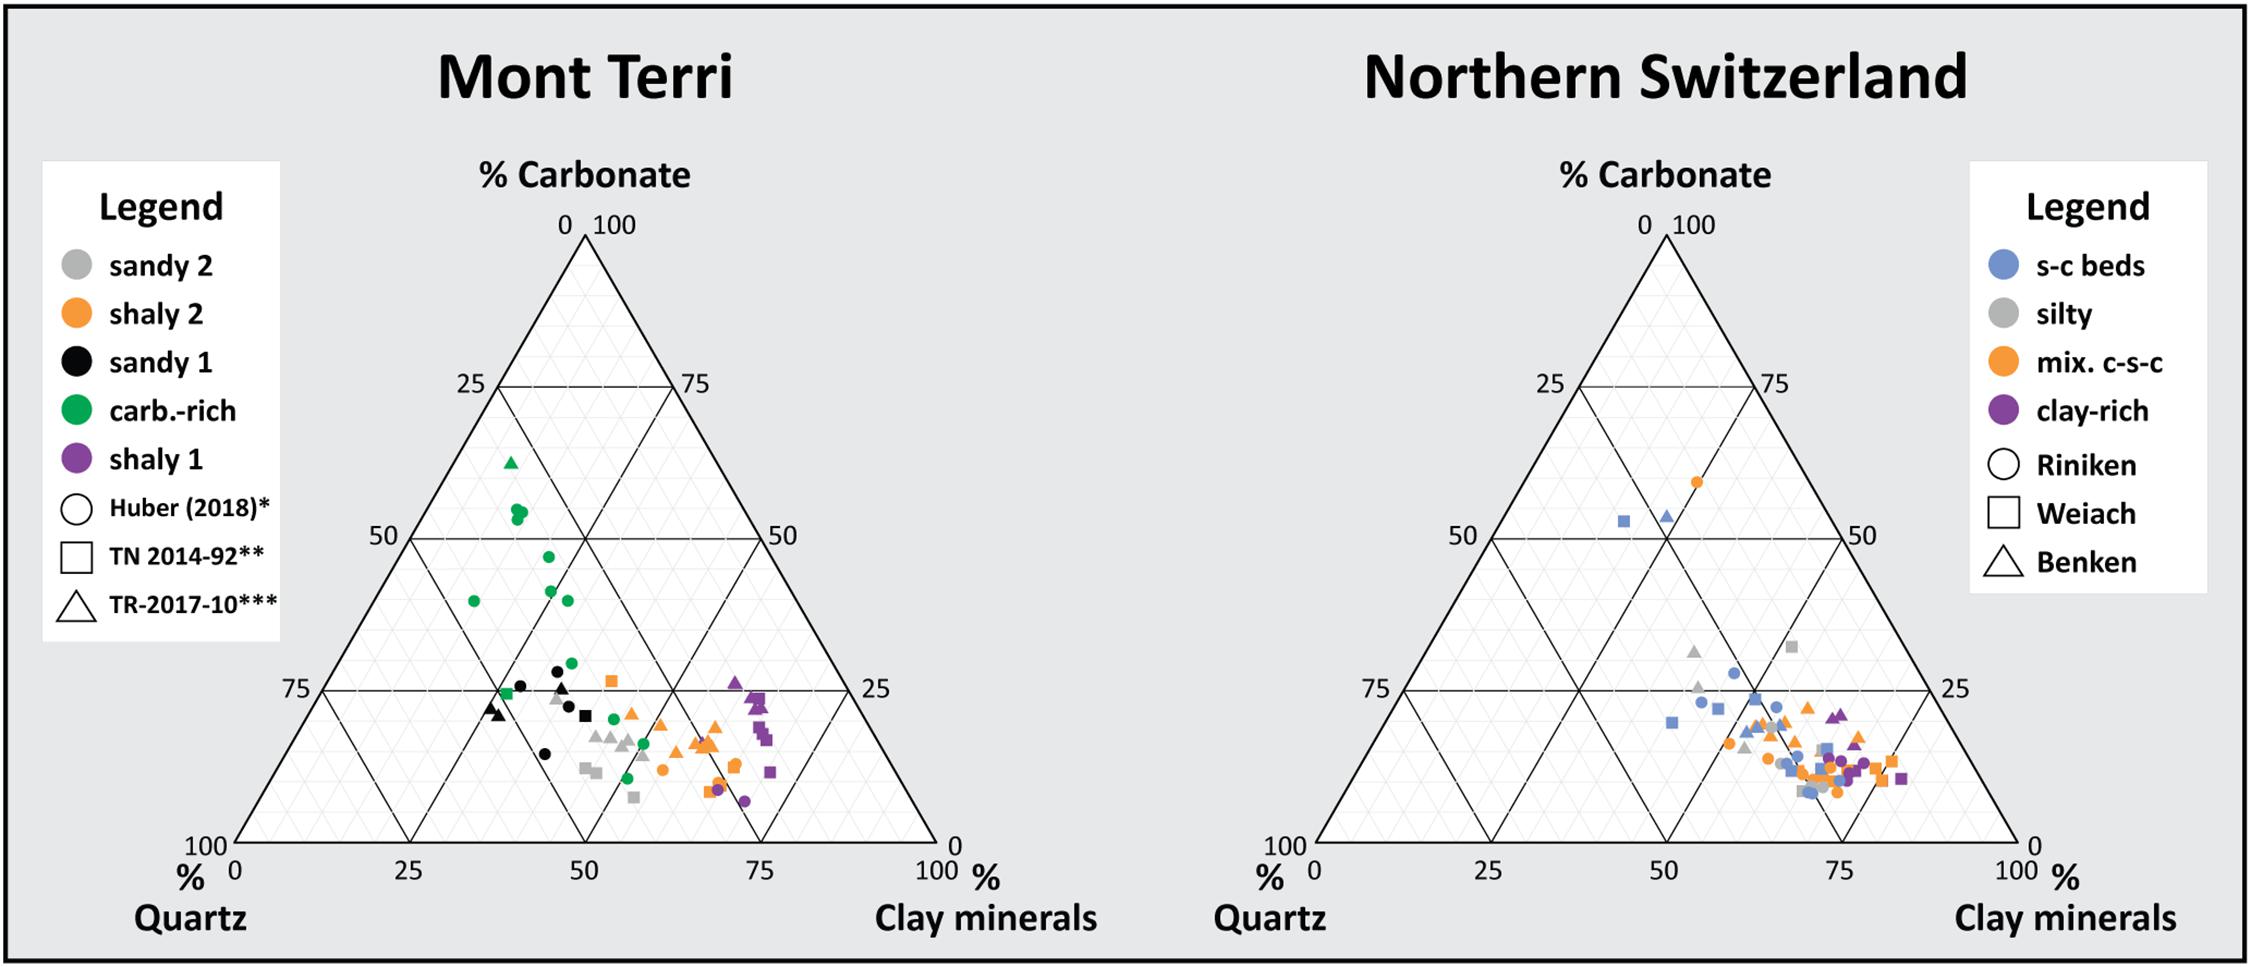
Figure 8. Mineralogical composition at Mont Terri and northern Switzerland by major sub-unit. Mont Terri: shaly 1, lower shaly facies; carb.-rich, carbonate rich sandy facies; sandy 1, lower sandy facies; shaly 2, upper shaly facies; sandy 2, upper sandy facies. ∗, data from Huber (2018), in wt%. ∗∗, data from Lerouge et al. (2015), in wt%. ∗∗∗, data from Waber and Rufer (2017), in wt%. Northern Switzerland: clay-rich, «clay-rich sub-unit»; carb.-rich, «carbonate-rich silty sub-unit»; mix. c-s-c, «mixed clay-silt-carbonate sub-unit»; silty, «upper silty sub-unit»; s-c beds, «sub-unit with silty calcareous beds» (sub-unit classification according to Mazurek and Aschwanden, 2020). Data for northern Switzerland are compiled and referenced in Mazurek (2017). Carbonates include calcite, dolomite, ankerite and siderite; quartz includes minor feldspars; clay minerals are not distinguished. They include kaolinite, illite, illite-smectite mixed layers, chlorite, as well as muscovite. Sum contents of the three mineral groups (carbonates, quartz, and clay minerals) are normalized to 100%; further minor components are not considered.
Generally, samples from northern Switzerland show less variability (n = 62; tighter cluster) than samples from Mont Terri (n = 58). The former also show slightly higher clay minerals content (up to 78%). Samples from the upper OPA of northern Switzerland («sub-unit with silty calcareous beds» and «upper silty sub-unit») have slightly higher carbonate content; the three higher values (outliers) correspond to carbonate-rich, discrete heterogeneities (sensu Mazurek and Aschwanden, 2020). The overall Mont Terri samples show a comparatively more dispersed pattern, covering hence a broader range of different compositions. In particular, a higher quartz (+ minor feldspar) content is noticed within the lower and upper sandy facies. Samples from the carbonate-rich sandy facies show the highest variability and the highest carbonate content.
By comparison with the herein-acquired samples (Figure 7), it can be noticed from Figure 8 that, at Mont Terri, the lower shaly facies is dominated by values situated mainly within the range of SF1, whereas the upper shaly facies shows values situated in-between SF1 and SF2. The lower sandy facies shows values situated in-between SF2 and SF3, while the upper sandy facies reflects typical SF2 and fewer SF3 samples. The carbonate-rich sandy facies shows values reflecting SF3 and SF4. The available datasets from northern Switzerland suggest that the «clay-rich sub-unit» and the «mixed clay-silt-carbonate sub-unit» are dominated by SF1, while most samples from the «sub-unit with silty calcareous beds» and the «upper silty sub-unit» are situated within the range of SF1 and SF2. The samples show slightly higher clay minerals values (about 10 to 20%) with respect to the SF1 and SF2 samples measured from the Mont Terri drill cores (BGC-2, BDM-B2 and BPE-2).
Textural Characterization of Subfacies Types
Bimodal Quantification of “Lenses” and “Matrix” Fractions – 2D
Figure 9 displays the typical “lenses” and “matrix” estimates based on representative subfacies type images from Mont Terri (see also Supplementary Table 3). SF1 is largely dominated by “matrix” (> 97%), while “lenses” constitute < 3% of the overall texture. SF2 displays a typical “lenses” content that varies between 9% and 17%. SF3 is characterized by comparatively higher “lenses” content, typically 36–48%. SF4 is predominantly formed of “lenses,” which constitute 70–91% of the overall composition. SF5 shows 78–92% “lenses.” Segmentation by manual single thresholding is however sensitive to human perception. Based on the present data, it is estimated that a 5–10% error could typically occur.
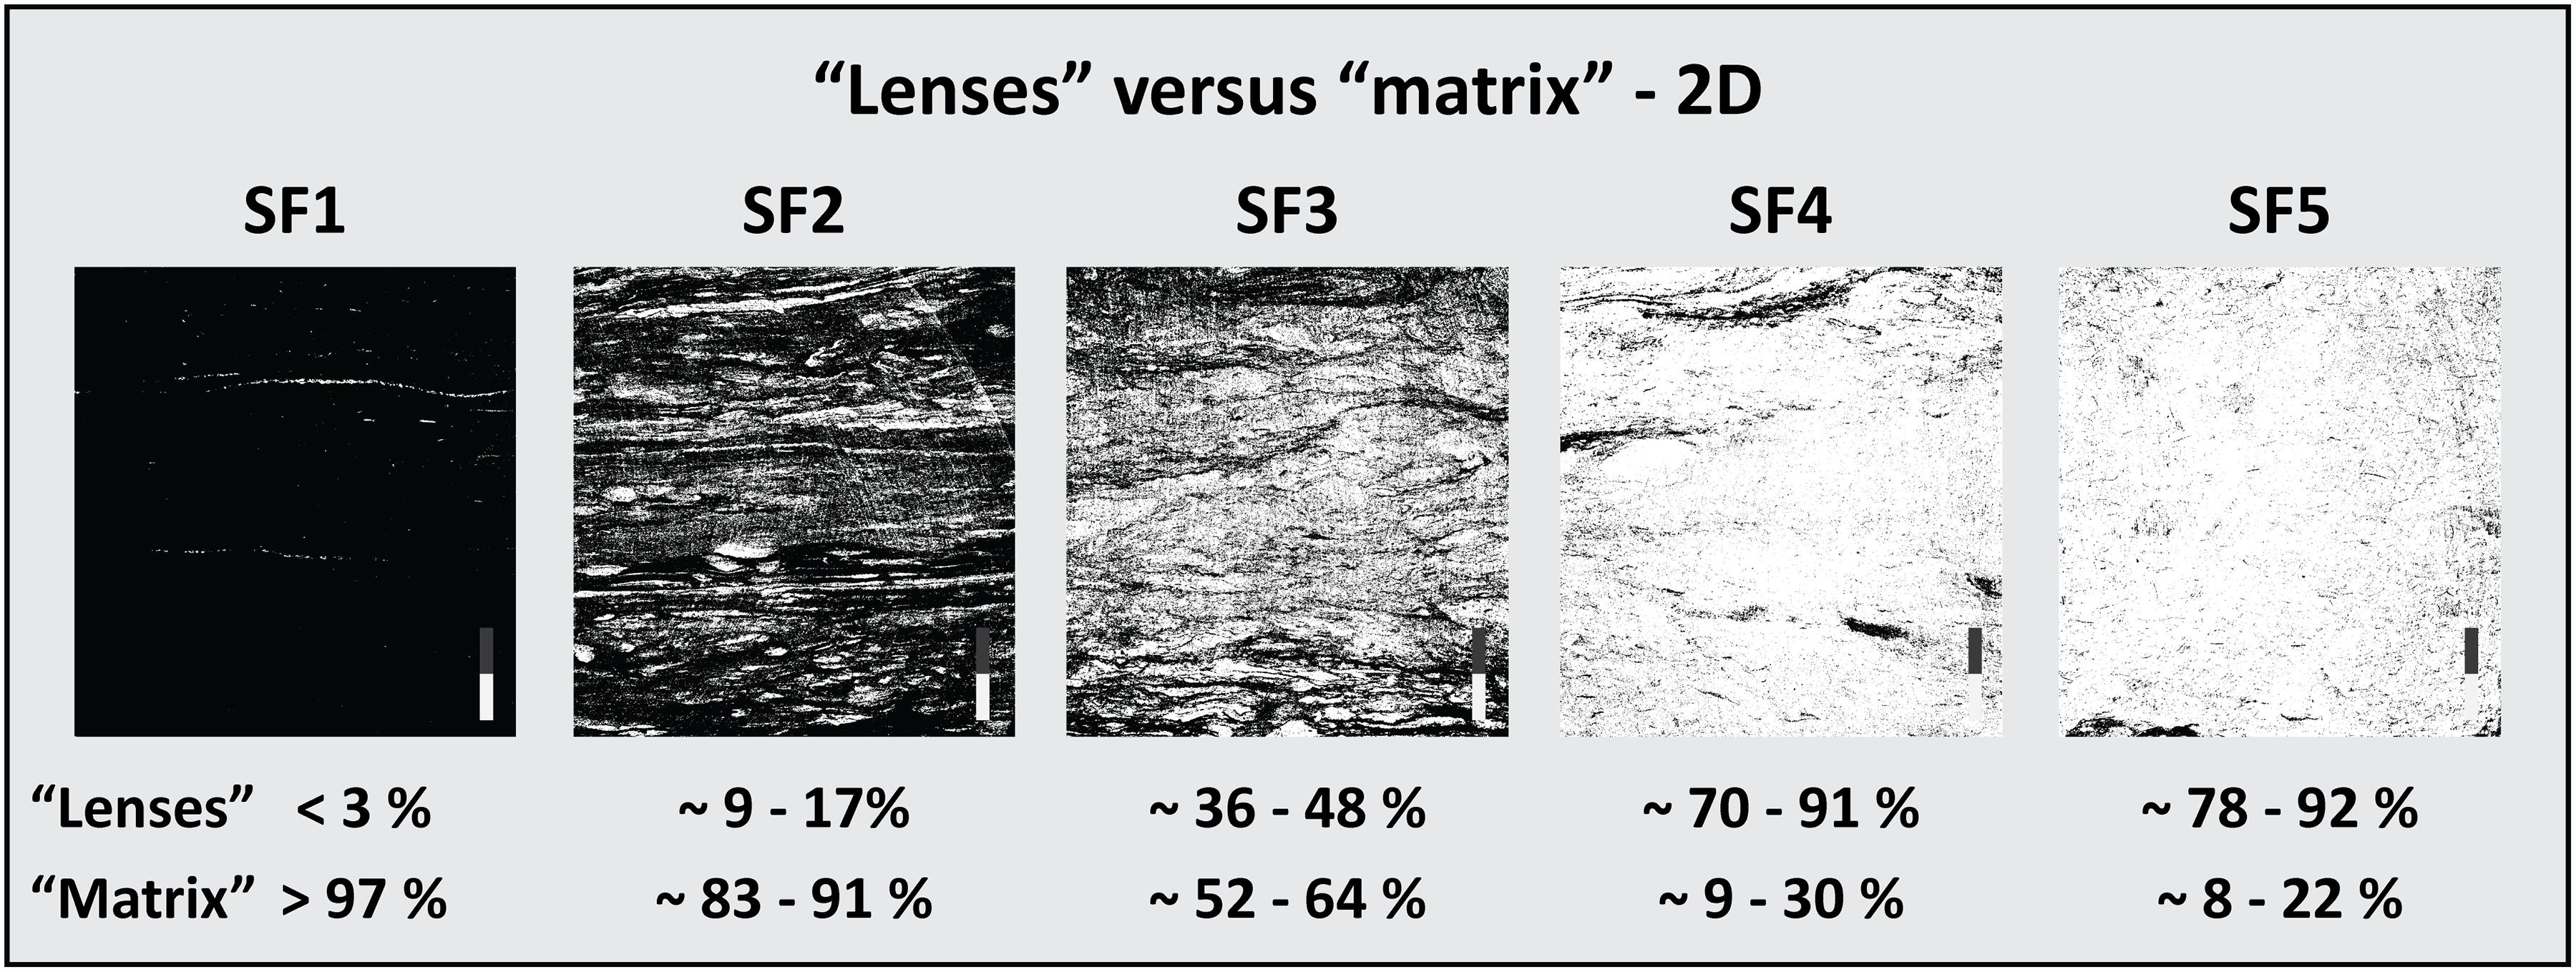
Figure 9. Typical “lenses” versus “matrix” content for each subfacies type. Ranges are indicative and result from representative subfacies type images from Mont Terri drill cores (BGC-2 and BDM-B2). On the binary images: black, “matrix” (clay minerals + minor quartz silt); white, “lenses” (carbonate + quartz content). Binary threshold was set manually with ImageJ. Scale bar = 2 cm.
Bimodal Quantification of “Lenses” and “Matrix” Fractions – 3D
Reconstructed μ-CT data were used to evaluate the volume fraction of “lenses” and “matrix” along core intervals (BMB-A6) displaying single subfacies types. The results show “lenses” and “matrix” percentages that fall into the same range as evaluated from binary images (Figure 10 and Supplementary Table 4). In average, SF1 shows 5% “lenses.” SF2 shows 11% “lenses.” SF3 shows 54% “lenses.” SF4 shows 82% “lenses,” and SF5 shows 87% “lenses.” It must be noted that the calculations were performed on core sections with tilted bedding planes.
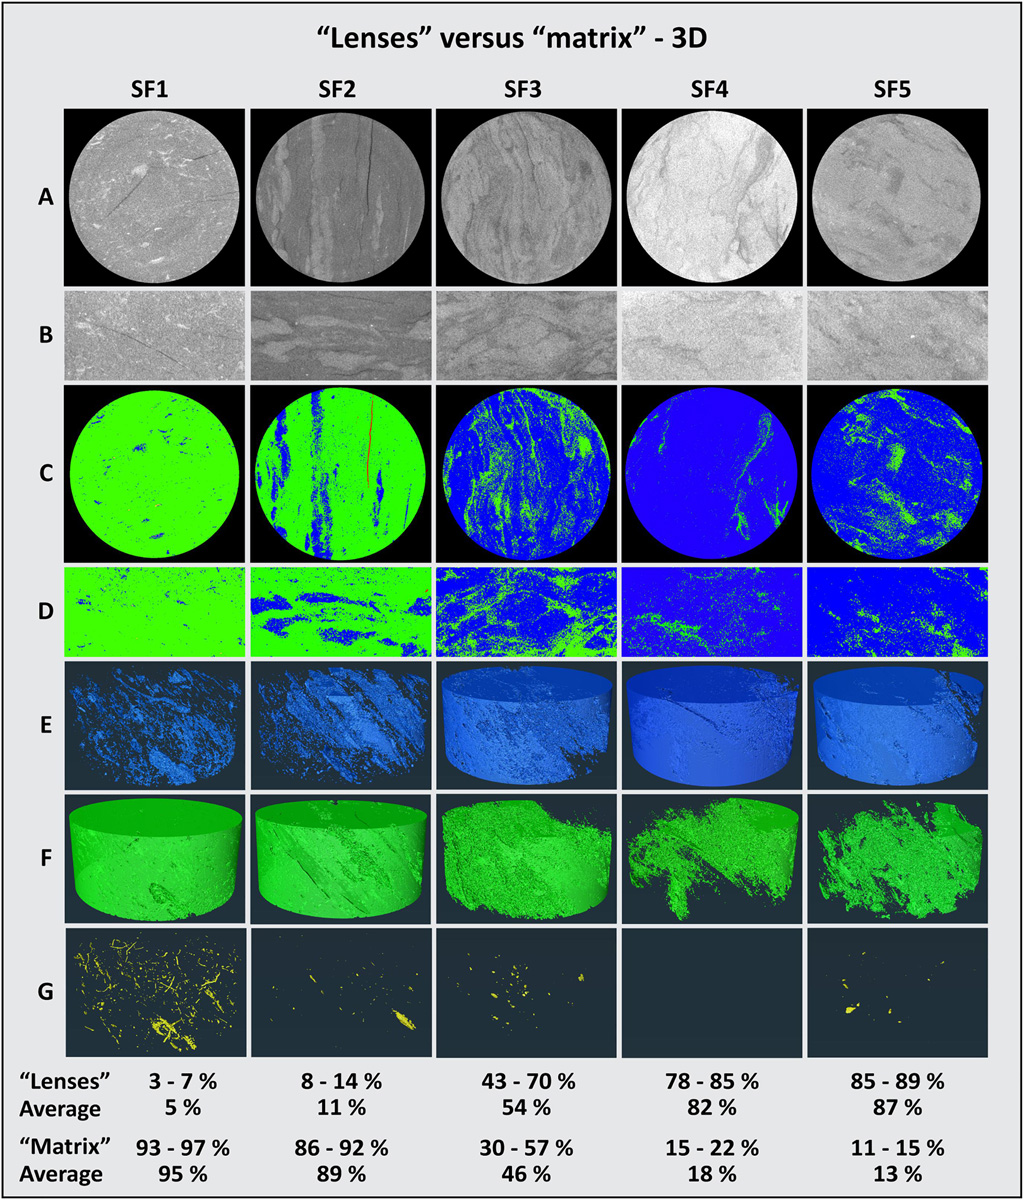
Figure 10. Selected results of μ-CT scans of core intervals (BMB-A6) displaying individual subfacies types. (A) Representative 2D xy slices (raw data) of the analyzed core intervals (selected core diameter = 5.50 cm). (B) Representative 2D yz plane slices (raw data) of selected core intervals (y = 5.50 cm; z = 2.35 cm). (C) Segmented data of the same 2D xy slices as in panel. (D) Segmented data of the same 2D yz slices as in panel. (E) Representative 3D volumes of “lenses” (mainly carbonate + quartz) for each subfacies type. (F) Representative 3D volumes of “matrix” (mainly clay minerals) for each subfacies type (same areas as 2D images, except for SF3). (G) Representative 3D volumes of pyrite content (high density contrasts) for each subfacies type. Green, “matrix”; blue, “lenses”; yellow, pyrite. For ease of convenience during the segmentation process, 2 to 3 distinct sub-sections from each selected core interval were individually segmented. The individual sub-sections were subdivided into 55-μm-thick slices (varying between 426 and 511 slices, depending on sub-section), which were segmented into three materials (“matrix,” “lenses,” and pyrite) and porosity. “Lenses” and pyrite were summed up together within the final “lenses” content for percentage calculations. Indicated “lenses” and “matrix” range and average values reflect the variation between the individual sub-sections in each subfacies type core interval. Bedding plane in the BMB-A6 core shows an angle of about 43° with respect to drilling direction.
The distinct “lenses” and “matrix” surfaces (2D) and volumes (3D), such as identified by image segmentation, are illustrated on Figure 10. The 3D textures, including the distribution and continuity of “lenses,” are coherent with petrographic observations and support the dual nature of “lenses,” i.e., depositional and bioturbational. Due to its high density, pyrite content has been segmented separately (Figure 10G) but was added to the “lenses” content for the “lenses” and “matrix” surface fractions quantification. It can be noted, especially within SF1, that an important part of pyrite occurs within burrowing traces. The dispersed pyrite content is difficult to assess based on 2D drill core images solely. The latter may explain the slightly higher “lenses” content within SF1 resulting from the 3D, μ-CT-based analysis compared to the 2D photograph-based analysis.
Representative Elementary Core Length
Figure 11 indicates the minimum representative thickness (z-axis) of individual subfacies types (in 2D and 3D) along an OPA drill core (diameter = 67 mm), based on variations of the 2D and 3D “lenses”/“matrix” ratio. Although “lenses” and “matrix” surface/volume fractions may change drastically from one subfacies type to the other (from < 5% internal variations in SF1 to > 20% in SF3), most curves show a flattening within the range of z = 2 to 3.5 cm (= representative elementary core length; RECL). Based on the analyzed drill core with a constant diameter, these values correspond to a surface of about 10 to 20 cm2, and a volume of about 60 to 90 cm3. On Figure 11, only SF4 shows a further increasing curve (i.e., “lenses”/“matrix” ratio decrease) with an increasing core length, which is nonetheless low, < 5% of the overall “lenses” content. Overall, the results show that the use of the “lenses”/“matrix” ratio legitimates the definition of a minimum representative thickness at 5 cm, such as defined petrographically.
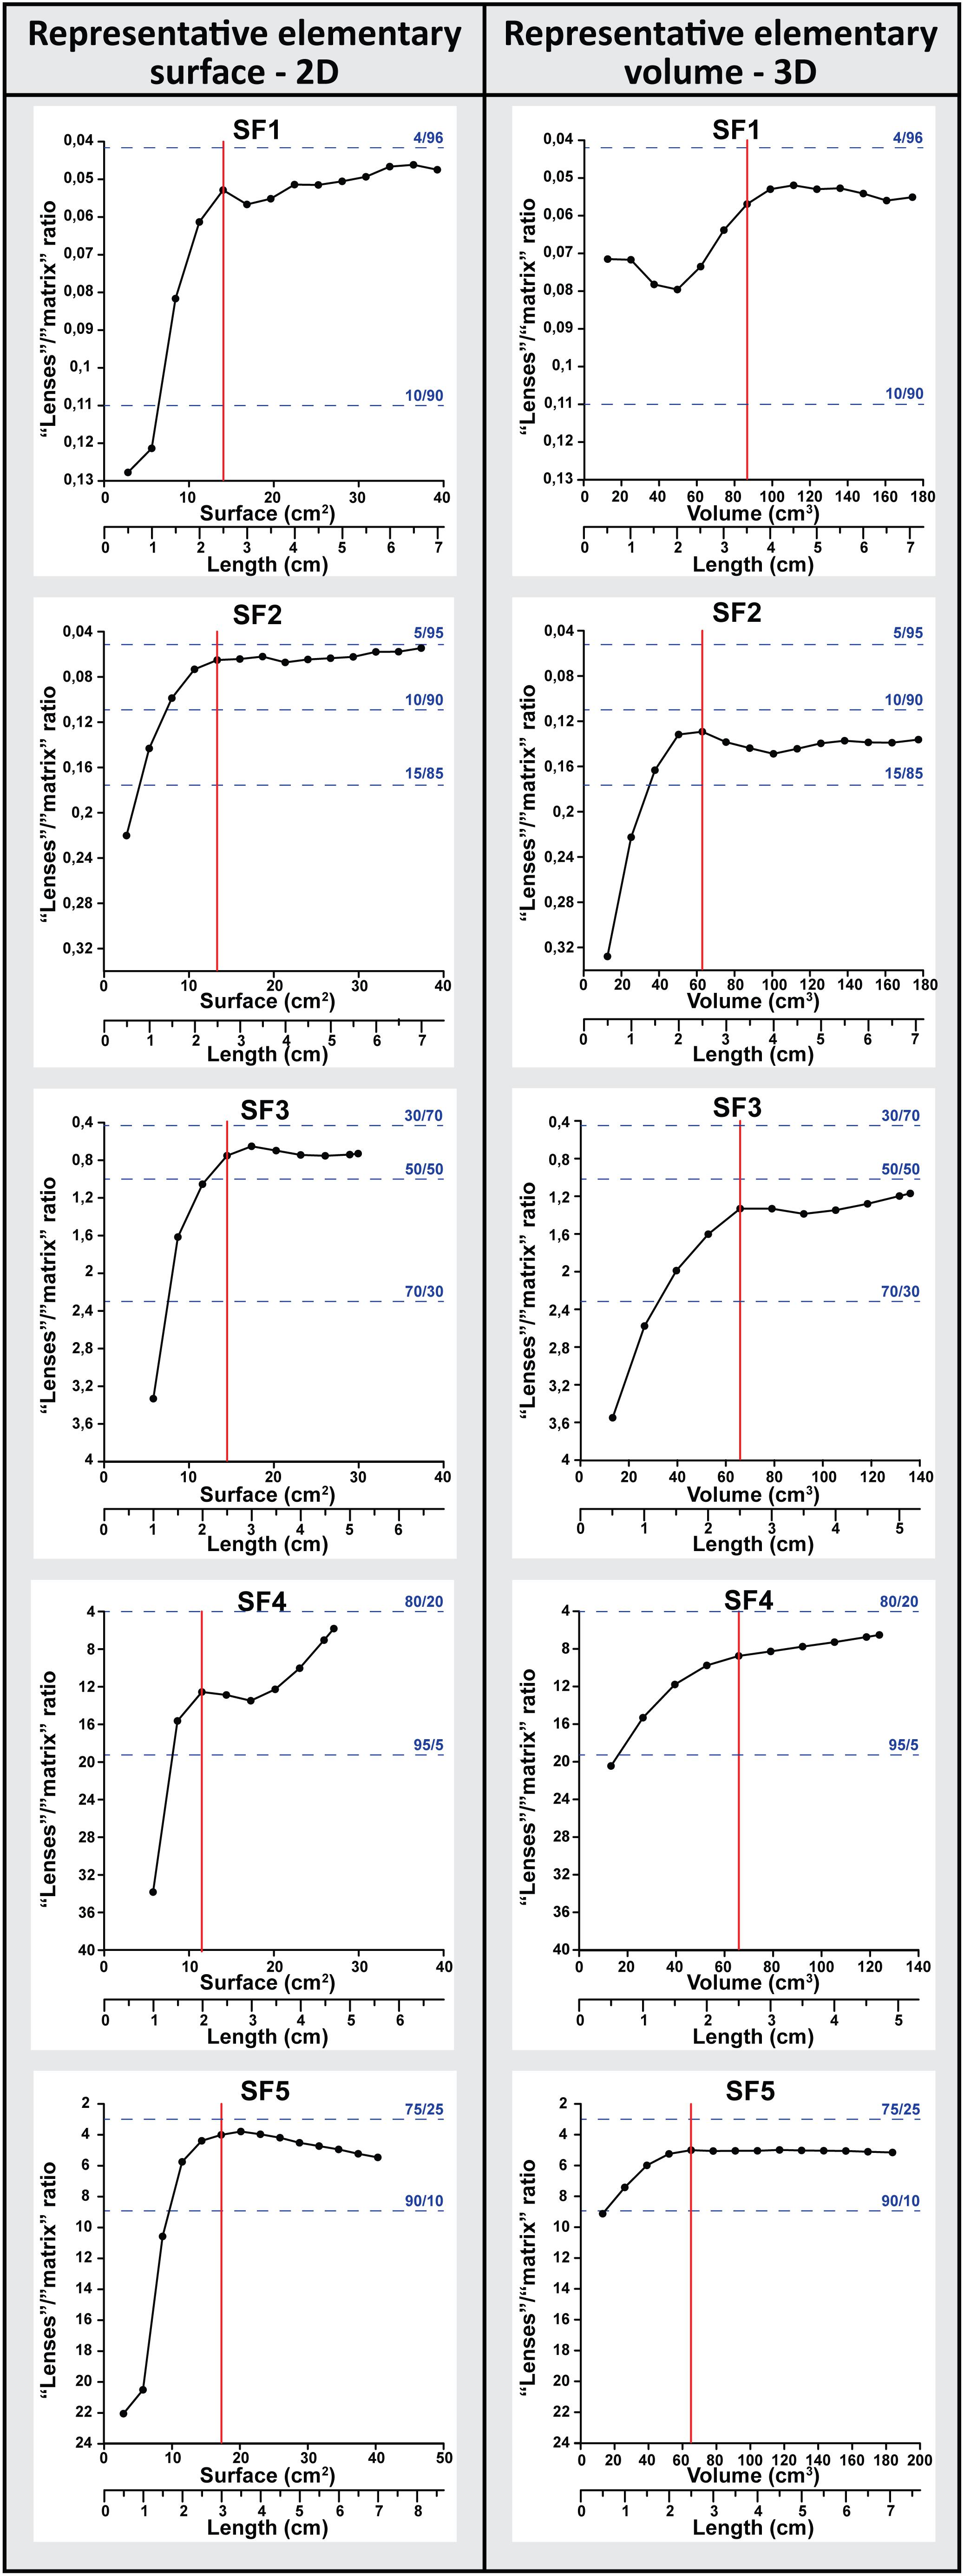
Figure 11. Representative elementary surfaces (left column) and volumes (right column) per subfacies type, with respect to “lenses”/“matrix” fraction ratios, and based on a single drill core with fixed diameter (67 mm). The slightly different “lenses”/“matrix” ratios between the 2D RES and 3D REV (up to about 10% in SF3) might partly be explained by the tilting of the bedding plane within the analyzed drill core (BMB-A6; ∼43°cross-bedding angle). Length = drill core section length; incremental steps = 0.5 cm; other dimensions = fixed constants (5.5 cm). Red lines indicate the interpreted limit of spatial representativeness. Dashed blue lines indicate “lenses”/“matrix” contents (in %).
The RECL of SF1 is reached at about 5–6% “lenses” content, which might be overestimated due to the integration by CT-scanning of the pyrite content; pyritized burrows are more common as visually evaluated, which hence increase the overall “lenses” content. The RECL of SF2 is reached at about 7–13% “lenses” content; SF3 at 44–60%; SF4 at 85–93%; and SF5 at 82–86% (value ranges converted from the “lenses”/“matrix” ratios in Figure 11). Differences between the RES and REV results (up to 10% for SF3) may partly be explained by the tilting of the bedding plane in the analyzed core sections, and by the heterogeneity of the lenticular features at the cm-scale. It may also be noted that the RECL analysis of SF4 shows a slightly higher “lenses” content than SF5 (unlike the 2D and 3D quantifications), which is attributed to the selection of the analyzed SF4 interval and to the sensitivity of the thresholding and segmentation.
Automated Subfacies Type Recognition
The ability of the trained DCNN to classify sub-images derived from the training material shows recovery rates greater than 90%, suggesting that the DCNN efficiently assigns sub-images to corresponding subfacies type (testing phase of the software development; Rempfer et al., in review; see Supplementary Figure 7). Figure 3C illustrates the predictive mode of the trained DCNN, and the results can be compared to the manual assignment of subfacies types (Figure 3B) for one drill core image (BAD-2; depth meter 4.00 to 6.00). Overall, the recovery rate of the individual sub-images appears reasonable. Misclassification is observed in particular regarding SF2 (being misclassified as SF3). Nevertheless, a quantitative decision regarding subfacies classification along the drill core axis may be possible based on a majority vote of the individual sub-images (i.e., attribution of all sub-images to the most frequent subfacies type identified within a given interval; Rempfer et al., 2018), which may result in even higher recovery rates. This operation is however not included in the current release of the software (Rempfer et al., in review).
The prediction mode of the trained DCNN to identify subfacies types based on drill core images that were not used during the training phase shows results that are generally in agreement with independent manual subfacies identification (e.g., Supplementary Figures 2–4). It is beyond the scope of the present study to quantitatively assess the recovery rate of the DCNN to identify subfacies types based on independent drill core images. However, first results demonstrate the usefulness of an image-based tool to objectively and automatically identify subfacies types within the OPA, and reveal the high potential of the trained DCNN to recognize similar subfacies types in further drill cores and locations (e.g., at Riniken; Supplementary Figure 4). Generally, intervals with the lower recovery rates (compared to manual assignment) tend to reflect atypical/intermediary subfacies or subfacies that could be nuanced by texture-modifiers as described in Table 2. In contrast, the occurrence of further attributes, such as cm-thick carbonate nodules, does not prevent the appropriate classification of the respective intervals to the corresponding subfacies classes (Supplementary Figure 4).
Overall, the results support the elaboration of a classification scheme comprising five distinct subfacies types that are based essentially on texture, and which can be identified on drill core images by more objective, computed and reproducible means.
Discussion
Relevance of the Subfacies Classification Scheme
Applicability of Subfacies Types Within the OPA
Jaeggi and Bossart (2014) highlighted the difficulty to select representative samples from OPA sub-units (i.e., facies) that display high internal heterogeneity, such as the Mont Terri carbonate-rich sandy facies and the lower sandy facies. The subdivision of major sub-units into subfacies types is thus an appropriate solution to overcome this issue.
The description of dm- to cm-scale subfacies units within the OPA at Mont Terri was initiated by Jaeggi et al. (2011) (see also Müller and Jaeggi, 2012). They reported the presence of four recurrent lithological patterns, called “subtypes,” along a tunnel face displaying the transition from the carbonate-rich sandy facies toward the lower sandy facies (Niche TT; Figure 1C). Lauper et al. (2018) argued that these four subtypes were comparable to SF2, SF3, SF4, and SF5 described along the BDM-B2 core, which crosses the same facies transition as the Niche TT. The similarity between the two sites suggests that subfacies units are not only convenient for the characterization of the vertical, small-scale heterogeneity, but may also be useful for the assessment of the lateral variability at the rock-laboratory-scale.
Kneuker et al. (2020) performed the first independent study using a subfacies approach similar to Lauper et al. (2018). Along three drill cores crossing the five Mont Terri sub-units (BPE-1 to 3; Figure 1C), they identified the same subfacies as Lauper et al. (2018), providing a few minor modifications. In particular, they evidenced the presence of an intermediary subfacies within the upper shaly facies (at the interface between SF1 and SF2), and introduced “SF2a”. They nonetheless confirmed the applicability of using mainly five subfacies types to characterize the small-scale heterogeneity within the larger-scale sub-units.
The necessity to nuance certain subfacies types, however, is for example highlighted by the biostratigraphic work of Reisdorf et al. (2014). Based on paleontological content, four different, so-called “subfacies” were identified within the lower shaly facies at Mont Terri. While the “matrix” surrounding the paleontological features remains petrographically the same (all SF1), the authors used the different, fossil-based “subfacies” to constrain the position of the Toarcian/Aalenian boundary (revised later by Reisdorf et al., 2016). Based on such observations, the use of additional attributes to highlight differences that may be crucial for certain studies is appropriate.
The convenience of additional attributes is further illustrated by observations from the OPA in northern Switzerland (Figure 5), where the restricted use of five subfacies types to describe the overall OPA is challenging (Supplementary Figure 5). For example, the lithology may represent variable textures lying at the interface between SF1 and SF2; e.g., two distinct intervals may have similar grain size, but different sediment sorting, or distinctive shape, size, and frequency of the lenticular structures (Supplementary Figure 6). While one may use, or define, new intermediary subfacies types, additional attributes can be used to overcome this issue and emphasize the atypical characteristics of certain intermediary subfacies (Figure 4G and Supplementary Figure 5).
Those examples highlight the importance of integrating additional attributes (see Table 2), while maintaining the ease of a fivefold subfacies classification scheme providing description guidelines for practical use across the scientific disciplines. Moreover, a higher number than five subfacies types may be discouraging for potential users and may render description processes more fastidious, while not being necessarily relevant for geotechnical, geochemical or hydrogeological issues.
The introduction of a list with the most common, additional attributes (Table 2) may not only differentiate the Reisdorf et al. (2014) subfacies at the sub-unit-scale (by highlighting their different features; SF1-deb, SF1 and SF1-foss-deb-burw), but also emphasize their similarity at the overall OPA-formation-scale (by highlighting their similar SF1 texture). The same approach can be used for subfacies that reside at the interface between two subfacies types. By describing the “SF2a” of Kneuker et al. (2020) as SF1(+) (i.e., atypical subfacies with slightly coarser/lighter “matrix” or higher quartz/carbonate content; see Table 2), the main characteristics of this intermediary subfacies can be distinguished without the necessity to implement a new subfacies type. Eventually, the list of additional attributes supplements the fivefold subfacies classification scheme by providing a higher level of accuracy and the means to outline further characteristics that may be required for diverse applications.
Automated Subfacies Type Classification
While the technical development of the automated subfacies recognition software is not the primary focus of the present study (the training phase might be extended to OPA images from further drill cores/outcrops and other locations; Rempfer et al., in review), the promising recovery rates demonstrate the great potential of combining a uniform subfacies classification scheme with an image-based, deep learning approach. Not only does this approach legitimate the subdivision of the OPA lithology into a fivefold, primarily texture-based, subfacies classification scheme, but it also demonstrates its efficiency for the relatively fast and consistent identification of subfacies types based on easily-acquired, routine drill core images. The application allows the comparison and cross-checking of the manual subfacies assignment in an automated and systematic way. Moreover, it has the potential to enhance collaboration among different research groups by enabling precise lithological comparisons of the studied material. Such comparisons may have important implications for linking lithological variations with rock properties, and for the elaboration of small-scale (petrophysical, geomechanical, geochemical), predictive models within the OPA (see Perspective for Linking Subfacies Types With Rock Properties).
Nonetheless, the use of the subfacies recognition software also highlights the relative subjectivity of subfacies type assignment within intervals displaying atypical (transitional) lithologies, and remains relatively sensitive to the image quality and lighting conditions during image acquisition. It shows further limitations for subfacies displaying additional attributes, such as the presence of fossils, pyrite/carbonate nodules, etc., which were not present in images used during the training of the DCNN. Similarly, lower recovery rates are observed for drill core images that deviate from the standard image acquisition procedure at Mont Terri (i.e., use of a DMT core scanner), and for images displaying untrained elements (further SF0; e.g., drill core plastic liners, crushed rock material, etc.). However, the application could be improved by additional training with further OPA images from diverse locations and representing various acquisition settings.
Applicability of Subfacies Types Within Other Shale and Mudstone Successions
The relatively simple mineralogical setting of the OPA enables the convenient, bimodal distinction between light-gray, siliceous-calcareous “lenses” and a darker, argillaceous “matrix.” In turn, both the mineralogical composition and the texture can be used for the assessment of quantitative property analysis and for the definition and identification of subfacies types. The presence of brighter lenticular features within a comparatively darker “matrix” is however not restricted to the OPA of northern Switzerland. Similar textures have notably been reported from an OPA-time equivalent succession in Germany, the Opalinuston Formation (Franz and Nitsch, 2009; Dietze et al., 2021). The applicability of the subfacies classification scheme presented within this paper should therefore be tested for this succession. Given the (largely) texture-based character of such a subfacies classification scheme, and the flexibility provided by a list texture-modifiers and additional attributes, a similar approach may be considered for the characterization of other shale and mudstone successions displaying a similar, bimodal aspect. Laminated and lenticular bedding resulting in a mainly bimodal texture is common within fine-grained, sedimentary successions, and may form within diverse depositional environments and as the result of various mechanisms, e.g., as tidal-controlled deposits (Reineck and Wunderlich, 1968), storm-controlled deposits (Reineck and Singh, 1972), contourite drift deposits (Rebesco et al., 2014), among others. While the herein-presented subfacies classification scheme was optimized for the OPA, the applicability of similar subfacies types to other successions is high, providing some adjustments and adequate interpretations of the depositional implications.
The presence of a bimodal, laminated to lenticular bedding is however not a prerequisite for the elaboration of a subfacies classification scheme. Many mudstone and shale studies have highlighted the importance of determining subfacies types for interpreting depositional controls and predicting lithology at the basin-scale (e.g., Schieber, 1989; Macquaker and Gawthorpe, 1993; Macquaker et al., 2007; Bohacs et al., 2014; Könitzer et al., 2014; Wilson and Schieber, 2015; Knapp et al., 2017). Generally, subfacies (or lithofacies, depending on the authors) are identified by parameters such as grain size distribution, lamina and bed geometry, composition, body and trace fossils, bioturbation index and color. Many of these parameters are also texture-based and have the potential to be recognized in images, providing hence the means for an image-based, textural subfacies characterization, as presented within this study, and for an automated subfacies recognition by DCNN.
Subfacies Spatial Heterogeneity
Lateral and Interregional Variations
Jaeggi and Bossart (2014) noted the difficulty to correlate intra-facies (subfacies) boundaries over distances of 10 m. These observations resulted from the Mont Terri carbonate-rich sandy facies and lower sandy facies, where subfacies variations are the highest (see also Müller and Jaeggi, 2012). Considering the depositional nature of SF5, interpreted by Lauper et al. (2018) as storm-induced turbiditic deposits originating from nearby topographic highs (Subfacies Types and Depositional Setting; see also Wetzel and Meyer, 2006), such single bioclastic layers are expected to be of limited lateral continuity. Variations between SF3 and SF4 are mostly transitional, and strongly dependent on depositional factors such as bioturbation level (sediment mixing) and topographic variations of the seafloor, which in turn can influence sediment deposition dynamic and grain size distribution at the subfacies-scale. Therefore, single subfacies intervals, especially if identified at the 5 cm resolution, may be difficult to trace laterally over decameters, although Müller and Jaeggi (2012) mapped subfacies extending at least throughout the size of a tunnel face (Niche TT). However, subfacies successions with defined variation patterns and subfacies type assemblages can easily be traced over longer distances, such as revealed by the drill cores investigations from Mont Terri and northern Switzerland (Figures 5, 6). For instance, similar < 10-cm-thick alternations of SF2 and SF5 could be identified within the carbonate-rich sandy facies in several Mont Terri drill cores (Figure 6). The same assessments can be made for each sub-unit (facies) at Mont Terri, which all display specific subfacies type patterns that are correlatable across the rock laboratory. Similarly, specific subfacies type assemblages occur in the four sub-units and can be traced from Riniken to Benken (Figure 5).
It was already shown by other authors that major OPA sub-units could be traced and correlated laterally at the scale of the Mont Terri rock laboratory (Bläsi et al., 1996; Bossart and Thury, 2008; Hostettler et al., 2017), and even at the scale of the Swiss northern basin (Bläsi, 1987; Mazurek and Aschwanden, 2020). However, the use of subfacies types to describe OPA successions renders such correlations more efficient and accurate, and validates the interregional sub-unit correlations proposed by Mazurek and Aschwanden (2020). Hence, the correlations of: (i) the Mont Terri lower shaly facies with the «clay-rich sub-unit» of northern Switzerland; (ii) the Mont Terri upper shaly facies with the «mixed clay-silt-carbonate sub-unit» of northern Switzerland; and (iii) the Mont Terri upper sandy facies with the «upper silty sub-unit» of northern Switzerland, are supported by their similar subfacies type assemblages and variability patterns (Figure 5). The presence of comparatively coarser material within the middle part of the Mont Terri OPA succession (i.e., carbonate-rich sandy facies and lower sandy facies) is confirmed by the presence of coarser subfacies types (SF4 and SF5), which are missing in northern Switzerland. It must nonetheless be noted that the OPA is diachronous across northern Switzerland, and therefore, correlatable sub-units may reflect similar depositional settings, but not necessarily time-equivalent units.
Vertical Variations
The use of subfacies types help in disentangling vertical heterogeneity between Mont Terri sub-units that might be considered as generally similar, as suggested by shared facies names: e.g., lower sandy facies versus upper sandy facies. In fact, the two sandy facies can be clearly distinguished by their subfacies patterns: the lower one is dominated by SF3 and SF4, while the upper one shows mainly SF2 and SF3.
Subfacies types help further in the delineation of major sub-units, such as suggested by the use of SF5 to determine the boundary between the carbonate-rich sandy and lower sandy facies (Lauper et al., 2018), or SF2 to differentiate between the «mixed clay-silty-carbonate sub-unit» and the overlying «upper silty sub-unit». Based on the present data, however, the latter sub-unit boundary could be refined at Riniken and Weiach based on the occurrence of SF2, with respect to the delineation proposed by Mazurek and Aschwanden (2020) (see Figure 5). Furthermore, the presence of additional features such as certain pyritic layers or cone-in-cone structures (Bläsi et al., 1996; Jaeggi and Bossart, 2014; Lauper et al., 2018) that can be traced at the Mont-Terri-rock-laboratory-scale and may serve as correlative layers can easily be highlighted by the application of the subfacies classification scheme (e.g., SF1-py and SF1-cone, respectively).
Within the present study, subfacies variations were used qualitatively to assess vertical and lateral heterogeneity between and within the larger-scale OPA sub-units. Yet, the consistent identification of subfacies types has the potential to further increase the accuracy of such lithological correlations and comparisons. This could be achieved by calculating the occurrence frequency of each subfacies type as a ratio per sub-unit and/or study site (e.g., overall percentage of SF2 within each sub-unit/study site). This approach might be applied in future studies and may even be used to quantitatively refine the major OPA sub-units described by Mazurek and Aschwanden (2020).
Subfacies Types and Depositional Setting
Interregional Depositional Setting
The Aalenian time was a period of major tectonic, hydrodynamic and climatic perturbations across the epicontinental Central European Basin (Mid-Cimmerian events; e.g., Underhill and Partington, 1993; de Graciansky and Jacquin, 2003; Korte et al., 2015). Enhanced, differential subsidence during the Aalenian in northern Switzerland (Wetzel et al., 2003), and the resulting, morphologically differentiated and constantly evolving depositional area, contributed to a relatively complex sequence stratigraphic framework. In particular, several high-order (para)sequences overprinted the lower, second- and third-order signals (Bläsi, 1987; Burkhalter et al., 1997; Lauper et al., 2021). At Mont Terri, two successive coarsening-upward trends can be interpreted as two high-order, shallowing-upward sequences separated by a relative sea level rise (i.e., flooding surface at the top of the lower sandy facies), which reflects an enhanced accommodation space induced by tectonic reactivation of pre-existing structures (Wetzel et al., 2003; Lauper et al., 2018). Further to the east, however, there is no equivalent of the carbonate-rich and lower sandy facies (middle part of the OPA at Mont Terri). Hence, these successions are generally interpreted as one overall, low-order, shallowing-upward sequence, characterized by higher-order “Dachbank” cycles (Bläsi, 1987; Matter et al., 1987, 1988; Wetzel and Allia, 2003). According to Wetzel and Allia (2003), “Dachbank” cycles consist of successions of basal argillaceous mudstones, followed by mudstones with increasing content and size of silty “lenses” (including different types of sedimentary structures), and topped by thick, continuous, silty/sandy layers (with hummocky cross-stratification; HCS). Such cycles are either interpreted as trends from distal toward proximal tempestites, or as deposits provided by increasing storm intensities, and could be attributed to Milankovitch precession cycles (Wetzel and Allia, 2003). Within this work, “Dachbank” cycles, which would reflect successions of SF1 toward SF4, were not identified at Mont Terri. They could however be recognized within the «sub-unit with silty calcareous beds» at Riniken, Weiach and Benken, although the upper members of the typical succession (SF3 and SF4) are mostly missing and topped instead by a concretionary/intraclastic calcareous horizon (Figure 5). Such horizons reflect high reworking of the seafloor, which indicate that the original sediments could have been eroded (Wetzel and Allia, 2000; Lauper et al., 2021). Within the upper part of the Weiach drill core (from 559.39 to 559.54 m), HCS could be identified within a silty limestone bed (Lauper, in press). Nevertheless, the “Dachbank” cycles could not be identified throughout all sub-units, such as described by Allia (1996). The existence of such cycles and their interregional correlation could however be verified using continuous X-ray fluorescence core scanning, following the approach of Lauper et al. (2018, 2021).
Besides differential subsidence between the Mont Terri and northern Swiss sub-basins, the presence of coarser material within the lower (to middle) part of the OPA (carbonate-rich sandy facies and lower sandy facies) suggests further paleogeographic controls. Although the scarcity of boreholes between both areas of interest does not allow any solid interpretation, the presence of a «lower silty sub-unit» (equivalent of the Mont Terri lower sandy facies) above the «clay-rich sub-unit» in the Lausen drill core (Lausen is situated in-between Mont Terri and Riniken; Vogt et al., 2016), points to an increase in carbonate content and a coarsening trend toward Mont Terri (see also Mazurek and Aschwanden, 2020). This westward trend is further confirmed by the occurrence in neighboring Franche-Comté (France) of a few meters of sandy limestone (Calcaires sableux d’Areches) contemporaneous to the whole OPA succession (Contini, 1970). This trend may be explained by the paleogeographic proximity with the Burgundy carbonate platform (Burgundy High; Contini, 1970; Durlet and Thierry, 2000; de Graciansky and Jacquin, 2003) and the possibly emerged Vosges Massif (or further north, the Rhenish Massif), which may have served as source for siliciclastics delivery. In northern Switzerland, on the other hand, the generally finer subfacies successions may indicate a more distal depositional environment, although parts of the OPA sediments in northern Switzerland possibly originate from the Bohemian Massif to the east (Etter, 1990; Wetzel and Allia, 2003).
Subfacies Types for Inferring Regional Depositional Setting
The elaboration of predictive lithological models is crucial for the characterization of the geometry and heterogeneity of sedimentary formations within the subsurface. Such models depend strongly on the ability to interpret and extrapolate the basin depositional and post-depositional characteristics from known successions. The potential of standardized subfacies types to develop predictive models is thus substantial.
The link between subfacies types and depositional setting, and the interpretation of the Mont Terri OPA succession, are provided by Lauper et al. (2018). They suggest that SF1 was deposited in comparatively deeper and/or more distal depositional areas, below the storm-wave base, where quiet and dysaerobic bottom-water prevailed, and sediment accumulation rates were supposedly low. The common occurrence of starved ripples and graded rythmites within SF2 points to distal tempestite deposits, where the surrounding “matrix” represents the background sedimentation similar to SF1. SF3 suggests higher sediment delivery, increased bioturbational activity and supposedly aerobic bottom-water conditions (i.e., common bioturbation). SF4 points to a more proximal deposition and/or comparatively higher energy bottom-water conditions, typically reflecting the upper members of proximal tempestites (Wetzel and Allia, 2003). SF5 intervals are interpreted as storm-induced turbidites. Biogenic material was transported by erosive currents from temporary swells (situated above the storm-wave base), toward nearby, somewhat deeper depocentres (Wetzel and Meyer, 2006; Lauper et al., 2018).
By comparison and extrapolation, the depositional setting of each OPA sub-unit in northern Switzerland can be inferred from their subfacies type composition. The lower part of the succession («clay-rich sub-unit» and «mixed clay-silt-carbonate sub-unit») is considered as being deposited in rather quiet conditions, situated below the storm-wave base, and characterized by comparatively slow sedimentation rates (mainly SF1). The lack of time markers within the OPA makes it difficult, however, to interpret sedimentation rates. The presence of sideritic layers points to important diagenetic overprint within this interval. Siderite typically forms within a few centimeters of the subseafloor, under Fe-reducing and non-sulfidic conditions (Berner, 1981). Relatively low organic matter content and/or high Fe availability might explain the abundance of siderite concretions within certain intervals (SF1-sid; e.g., Taylor and Macquaker, 2011). Whether siderite diagenetically formed within the suboxic or methanogenesis zones (sensu Froelich et al., 1979) remains however subject to discussion (Lerouge et al., 2014; Lauper et al., 2021). The presence of a hiatus bed (concretionary calcareous horizon; see Wetzel and Allia, 2000) within the «mixed clay-silt-carbonate sub-unit» at Riniken and Weiach (regionally correlatable unit; Matter et al., 1987, 1988), reflects a period of sediment non-deposition, either by sediment omission or bypassing. Sediment bypassing suggests the influence of storm-induced, erosive currents on a topographic swell situated above the storm-wave base (Wetzel and Allia, 2000; Lauper et al., 2021). The «upper silty sub-unit» points to distal tempestite deposits (mainly SF2), suggesting a slight increase in storm intensity (and/or proximity by decreasing sea level) upward (especially at Weiach). The overlying «sub-unit with silty calcareous beds» is characterized by 3- to 10-m-thick successions of coarsening-upward sequences typically topped by calcareous horizons (mainly SF1 to SF2 or SF3; probable “Dachbank” cycles as reported by Bläsi, 1987; Wetzel and Allia, 2003). The subfacies type coarsening-upward sequences, when topped by a hiatus bed, may reflect topographic gradation toward areas influenced by storm-induced currents (i.e., sediment accumulation within deeper depocenters resulting in relative sea level falls at regional scale; Burkhalter et al., 1997; Lauper et al., 2021). Alternatively, increasing storm intensity may form a similar succession (Wetzel and Allia, 2003). The presence of some individual carbonate nodules within the finer subfacies (mainly SF1) points to longer residence time within stable geochemical conditions, which in turn may indicate comparatively low sedimentation rates during quiet time periods between two storm events (Wetzel and Allia, 2000), or a temporary change in bottom water oxygen conditions.
This study suggests that subfacies types tend to deliver the same information on depositional processes and environmental conditions throughout northern Switzerland. It must nonetheless be noted that different OPA sites may have experienced slightly different burial and tectonic histories (Mazurek et al., 2006; Elie and Mazurek, 2008), which in turn could influence differently the apparent lithology and the additional attributes (e.g., precipitation of late diagenetic minerals, differences in compaction and porosity). Although these features have few implications in terms of depositional processes, they may however modify the geochemical properties of the rock. It is therefore crucial to consider the overall petrographic characteristics (including additional features) before extrapolating formation processes and rock properties.
Perspectives for Linking Subfacies Types With Rock Properties
Subfacies Types and Rock Properties
Many studies at Mont Terri have emphasized the tight relations between various rock properties, lithology and texture. Typical examples include the small-scale heterogeneity of geomechanical properties (Klinkenberg et al., 2009; Kaufhold et al., 2013; Siegesmund et al., 2014), the distribution of micro-porosity (Houben et al., 2013, 2014; Keller et al., 2013; Philipp et al., 2017), sorption processes and radionuclides diffusive transport (Hennig et al., 2020; Hennig and Kühn, 2021), the responses of seismic P-wave velocity (Kneuker et al., 2017; Schuster et al., 2017; Lauper et al., 2018), and more generally, the overall (geochemical, petrophysical and hydro-mechanical) anisotropic behavior of the OPA (Van Loon et al., 2004; Wenk et al., 2008; Favero et al., 2018). Jaeggi and Bossart (2014) provide an overview of the main rock properties (petrophysical, hydrogeological, rock mechanical, thermic, geochemical/pore water composition, and gas entry pressure parameters) of the OPA at Mont Terri and their relationship with lithology. In particular, they outline the differences between the shaly and the sandy facies (see also Bossart and Thury, 2008; Bossart et al., 2017). The elaboration of a model integrating the variability of rock properties with respect to small-scale lithological variations is crucial for the evaluation of the performance and integrity of the OPA as a natural geological barrier for nuclear waste storage. A standardized and uniform subfacies classification scheme within the OPA hence constitute a further step toward the elaboration of such model.
Automated and Continuous Records of Lithological Heterogeneity
Data acquisition by downhole core and outcrop logging and/or imaging methods, such as downhole geophysical logging (Bläsi et al., 1996; Reisdorf et al., 2016), multi-sensor core logging (Lauper et al., 2018), X-ray fluorescence core scanning (Lauper et al., 2018, 2021), medical CT (Keller and Giger, 2019; Zimmerli, 2021), and hyperspectral imaging (Kurz and Buckley, 2012; Malinverni et al., 2014) have the means to provide continuous records of physical, textural, and chemical rock properties in a relatively rapid, cost-effective and efficient way. In turn, these datasets can be related to lithological and facies changes, and hence have the potential to accelerate mapping procedures of drill cores and outcrops, and predict expected lithological properties. On the other hand, petrographic descriptions have the means to infer a wide range of expected rock properties, given that their inter-relations are known. Eventually, the expected rock properties can be up-scaled and combined to regional or basinal, predictive lithological models, and petrophysical models can be developed. The relations between continuous log datasets, discrete rock properties and lithology has been quantitatively illustrated within other rock formations. For instance, Henares et al. (2019) provided a statistical framework for multivariate calibration and prediction of a wide range of properties by combining high-resolution X-ray fluorescence core scans with discrete petrophysical data and sedimentological (facies) descriptions within an Upper Carboniferous fluvial sandstone succession. The application of their standardized protocol resulted in a near 30-fold increase of the petrophysical database, allowing associations between elemental composition, grain size distribution, diagenetic constraints and petrophysical responses.
At Mont Terri, several studies based on log datasets investigated the internal heterogeneity and variability of the OPA. For example, Alcolea Rodríguez et al. (2018) applied a geostatistical methodology to disentangle lithological variability and cyclicity within the OPA based on natural and spectral gamma-ray logs. The used algorithm was able to identify with accuracy the interfaces between the major sub-units and detected additional interfaces, which referred to the smaller-scale, intra-facies heterogeneity. Lenz and Jaeggi (2016) developed a script-based application to convert well images (e.g., acoustic borehole imager and optical borehole imager) into ASCII-synthetic logs, from which, with the help of statistical means, they aimed at extracting lithological characteristics such as sub-units transitions and the detection of specific patterns, which in turn could help to correlate different boreholes; see some results in Rempfer et al. (2017). The latter examples outline the relationship between log datasets and major OPA lithological units. They also illustrate the importance of acquiring continuous datasets for the characterization of lithological heterogeneity and variability by statistical and quantitative means, as well as for correlation purposes.
At a smaller lithological scale, Lauper et al. (2018) demonstrated qualitatively that a tight correlation between OPA subfacies and log datasets (gamma density, P-wave velocity, and elemental and organic carbon content) also exists. Similarly, Kneuker et al. (2020) highlighted the relationship between OPA subfacies types and discrete geochemical and mineralogical data (including cation exchange capacity and total organic carbon content). Within the present study, the automated subfacies recognition tool (Rempfer et al., in review) is the first attempt to link standardized OPA subfacies types with determined analytical data (here, image properties). It is foreseen that in future studies, such continuous datasets could be used to recognize subfacies type variations, following for instance the approaches of Alcolea Rodríguez et al. (2018) or Lenz and Jaeggi (2016), and hence provide direct and quantitative information on the OPA small-scale lithological heterogeneity, with all the advantages of subfacies types for establishing correlations, understanding basin-scale sedimentary processes, determining further rock properties, and deciphering diagenetic constraints and depositional mechanisms and environments. Eventually, the elaboration of a database combining rock properties and subfacies types will provide the means to rapidly and efficiently up-scale and predict rock properties at the overall OPA-formation-scale, similarly to Henares et al. (2019).
Conclusion
(1.) This paper presents a fivefold subfacies classification scheme covering the main lithological diversity within the OPA, and a list of attributes representing the most common, additional (biogenic, diagenetic, structural) features and atypical characteristics.
(2.) The five subfacies types (SF1 to SF5) are qualitatively and quantitatively characterized by textural (grain size, bedding, fabric, and color) and compositional (nature and mineralogy of constituting elements) characteristics. They represent the smallest, lithologically coherent units, identifiable during visual drill core (or outcrop) mapping. An automated subfacies recognition software, based on deep learning, allows their systematic identification on the basis of core images and thus lends additional support to the classification scheme.
(3.) The elaboration of a subfacies classification scheme within the OPA provides objective parameters for characterizing the dm- to cm-scale lithological heterogeneity. It is complementary to and may serve as basis for the classical subdivision of the OPA into dam- to m-scale sub-units (or facies), notably by providing intra-facies variability patterns, and by enabling the finer distinction and the quantitative refinement of the major facies units.
(4.) Subfacies type units allow for the efficient, visual highlighting of the main lithological trends, such as the presence of coarsening and fining gradational successions, as well as outlining major similarities and differences between distinct study sites. In turn, they may provide valuable information for establishing the sequence stratigraphic framework of the studied successions.
(5.) The consistent and extensive use of standardized subfacies types within future OPA studies may further help in (i) harmonizing OPA descriptions within international and multidisciplinary projects, (ii) improving predictive and interpretative lithological models, and (iii) inferring and evaluating the expected rock properties and their spatial variations, which in turn may be crucial for the performance and integrity of the OPA as a natural geological barrier for nuclear waste storage.
Data Availability Statement
The raw data supporting the conclusions of this article will be made available by the authors, without undue reservation.
Author Contributions
BL wrote the manuscript and created the figures with the help of GZ. BL and GZ collected, analyzed, and interpreted the data as part of, respectively, his Ph.D. and her M.Sc. BL, DJ, GD, and AF contributed to the elaboration of the full project. JR wrote the script of the automated core image recognition tool and performed the computations. All authors were involved in the discussion of the results and provided critical feedback to the final manuscript.
Funding
This study is part of a Ph.D. project co-funded by the National Cooperative for the Disposal of Radioactive Waste (Nagra) and the Federal Office of Topography Swisstopo. Part of the funding is provided through the SO-B and SO-C experiments of the Mont Terri Project.
Conflict of Interest
The authors declare that the research was conducted in the absence of any commercial or financial relationships that could be construed as a potential conflict of interest.
Acknowledgments
The following people are warmly acknowledged for their precious time and contribution: Patrick Dietsche for thin section preparation; Christoph Neururer for his help with μ-CT scanning; Bernard Grobéty, Alexandre Salzmann, and Akram El Kateb for their help with XRD analysis; Andreas Fischer and Nicolas Lenz for their help with deep learning methods (SO-B Experiment); and the whole team from the Mont Terri rock laboratory and the Nagra drill core repository for their technical and logistical support. Jens Becker, AS, LK, and BM (handling editor) are thanked for their helpful comments on (an earlier version of) the manuscript. The partner institutions involved in the SO-C Experiment of the Mont Terri Project, namely the National Cooperative for the Disposal of Radioactive Waste (Nagra) and the Federal Office of Topography Swisstopo are acknowledged for their financial contribution.
Supplementary Material
The Supplementary Material for this article can be found online at: https://www.frontiersin.org/articles/10.3389/feart.2021.645596/full#supplementary-material
References
Alcolea Rodríguez, A., Marschall, P., Nussbaum, C., and Becker, J. K. (2018). Automatic interpretation of geophysical well logs. Geol. Soc. Lond. Spec. Publ. 482, 25–38. doi: 10.1144/SP482.9
Allia, V. (1996). Sedimentologie und Ablagerungsgeschichte des Opalinustons in der Nordschweiz. PhD thesis. Basel: University of Basel.
Berner, R. A. (1981). A new geochemical classification of sedimentary environments. J. Sediment. Petrol. 51, 359–365. doi: 10.1306/212F7C7F-2B24-11D7-8648000102C1865D
Bjerrum, C. J., Surlyk, F., Callomon, J. H., and Slingerland, R. L. (2001). Numerical paleoceanographic study of the Early Jurassic Transcontinental Laurasian Seaway. Paleoceanogr. Paleoclimatol. 16, 390–404. doi: 10.1029/2000PA000512
Bläsi, H.-R. (1987). Lithostratigraphie und Korrelation der Doggersedimente in den Bohrungen Weiach, Riniken und Schafisheim. Ecl. Geol. Helve. 80, 415–430. doi: 10.5169/seals-166004
Bläsi, H.-R. (2002). Opalinuston – Zementation und Gefüge. Nagra Interner Bericht, NIB 02-03. Wettingen: Nagra.
Bläsi, H.-R., Deplazes, G., Schellmann, M., and Traber, D. (2013). Sedimentologie und Stratigraphie des ‘Braunen Doggers’ und Seiner Westlichen Äquivalente. Nagra Arbeitsbericht, NAB 12-51. Wettingen: Nagra.
Bläsi, H.-R., Moeri, A., and Bossart, P. (1996). Results of the Phase 1 Drilling Campaign. Mont Terri Technical Report, TR 96-01. Wabern: Federal Office of Topography swisstopo.
Bläsi, H.-R., Peters, T., and Mazurek, M. (1991). Der Opalinus-Ton des Mt. Terri (Kanton Jura): Lithologie, Mineralogie und Physiko-Chemische Gesteinsparameter. Nagra Interner Bericht, NIB 90-60. Wettingen: Nagra.
Bohacs, K. M., Lazar, O. R., and Demko, T. M. (2014). Parasequence types in shelfal mudstone strata – Quantitative observations of lithofacies and stacking patterns, and conceptual link to modern depositional regimes. Geology 42, 131–134. doi: 10.1130/G35089.1
Bossart, P., Bernier, F., Birkholzer, J., Bruggeman, C., Connolly, P., Dewonck, S., et al. (2017). Mont Terri rock laboratory, 20 years of research: introduction, site characteristics and overview of experiments. Swiss J. Geosci. 110, 3–22. doi: 10.1007/s00015-016-0236-1
Bossart, P., and Thury, M. (2007). Research in the mont terri rock laboratory: quo vadis? Phys. Chem. Earth 32, 19–31. doi: 10.1016/j.pce.2006.04.031
Bossart, P., and Thury, M. (2008). Mont Terri Rock Laboratory. Project, Programme 1996 to 2007 and Results. Reports of the Swiss Geological Survey, No. 3. Wabern: Federal Office of Topography swisstopo.
Burkhalter, R. M. (1996). Die Passwang-Alloformation (unteres Aalénien bis unteres Bajocien) im zentralen und nördlichen Schweizer Jura. Ecl. Geol. Helv. 89, 875–934. doi: 10.5169/seals-167927
Burkhalter, R. M., Bläsi, H.-R., and Feist-Burkhardt, S. (1997). Der «Dogger» (oberes Aalénien) in den Bohrungen Herdern-1, Berlingen-1 und Kreuzlingen-1 (Nordostschweiz) und seine Beziehung zu den gleichaltrigen Schichten im Nordjura. Ecl. Geol. Helv. 90, 269–291. doi: 10.5169/seals-168159
Contini, D. (1970). L’Aalénien et le Bajocien du Jura Franc-Comtois. PhD thesis. Besançon: University of Besançon.
de Graciansky, P.-C., and Jacquin, T. (2003). Evolution des structures et de la paléogéographie au passage Lias-Dogger dans le bassin de Paris d’après les données de la subsurface. Bull. Soc. Géol. France 174, 3–17.
Dietze, V., Gräbenstein, S., Franz, M., Schweigert, G., and Wetzel, A. (2021). The middle jurassic opalinuston formation (Aalenian, Opalinum Zone) at its type locality near Bad Boll and adjacent outcrops (Swabian Alb, SW Germany). Palaeodiversity 14, 15–113. doi: 10.18476/pale.v14.a3
Dunham, R. J. (1962). “Classification of carbonate rocks according to depositional texture,” in Classification of Carbonate Rocks, Vol. 1, ed. W. E. Ham (Tulsa: Memoir of the American Association of Petroleum Geologists), 108–121.
Durlet, C., and Thierry, J. (2000). Modalités séquentielles de la transgression aaleno-bajocienne sur le sud-est du Bassin parisien. Bull. Soc. Géol. France 171, 327–339. doi: 10.2113/171.3.327
Elie, M., and Mazurek, M. (2008). Biomarker transformations as constraints for the depositional environment and for maximum temperatures during burial of Opalinus Clay and Posidonia Shale in northern Switzerland. Appl. Geochem. 23, 3337–3354. doi: 10.1016/j.apgeochem.2008.05.022
Etter, W. (1990). Paläontologische Untersuchungen im Unteren Opalinuston der Nordschweiz. PhD thesis. Zürich: University of Zurich.
Etter, W. (2004). Decapod crustaceans from the Middle Jurassic Opalinus Clay of northern Switzerland, with comments on crustacean taphonomy. Ecl. Geol. Helv. 97, 381–392. doi: 10.1007/s00015-004-1137-2
Favero, V., Ferrari, A., and Laloui, L. (2018). Anisotropic behaviour of Opalinus Clay through consolidated and drained triaxial testing in saturated conditions. Rock Mech. Rock Eng. 51, 1305–1319. doi: 10.1007/s00603-017-1398-5
Franz, M., and Nitsch, E. (2009). Zur lithostratigraphischen Gliederung des Aalenium in Baden-Württemberg. LGRB Inf. 22, 123–146.
Froelich, P. N., Klinkhammer, G. P., Bender, M. L., Luedtke, N. A., Heath, G. R., Cullen, D., et al. (1979). Early oxidation of organic matter in pelagic sediments of the eastern equatorial Atlantic: suboxic diagenesis. Geochim.Cosmochim. Acta 43, 1075–1090. doi: 10.1016/0016-7037(79)90095-4
Füchtbauer, H. (1988). Sedimente und Sedimentgesteine. Stuttgart: Schweizerbart’sche Verlagsbuchandlung.
Goodfellow, I., Bengio, Y., Courville, A., and Bengio, Y. (2016). Deep Learning, Vol. 1. Cambridge: MIT press.
He, K., Zhang, X., Ren, S., and Sun, J. (2016). “Deep residual learning for image recognition,” in Proceedings of the IEEE Conference on Computer Vision and Pattern Recognition, Las Vegas, NV, 770–778. doi: 10.1109/CVPR.2016.90
Henares, S., Donselaar, M. E., Bloemsma, M. R., Tjallingii, R., De Wijn, B., and Weltje, G. J. (2019). Quantitative integration of sedimentological core descriptions and petrophysical data using high-resolution XRF core scans. Mar. Pet. Geol. 110, 450–462. doi: 10.1016/j.marpetgeo.2019.07.034
Hennig, T., and Kühn, M. (2021). Surrogate model for multi-component diffusion of uranium through Opalinus Clay on the host rock scale. Appl. Sci. 11:786. doi: 10.3390/app11020786
Hennig, T., Stockmann, M., and Kühn, M. (2020). Simulation of diffusive uranium transport and sorption processes in the Opalinus Clay. Appl. Geochem. 123:104777. doi: 10.1016/j.apgeochem.2020.104777
Hostettler, B., Dietze, V., Jaeggi, D., and Menkveld-Gfeller, U. (2020). SO-C Experiment: Ammonite Stratigraphy and Fossils of the Passwang Formation (Middle Jurassic) and the Opalinus Clay (Lower to Middle Jurassic) excavated in Ga 18 and the Niches P3, Passwang and CO2 in the Mont Terri Rock Laboratory. Mont Terri Technical Report, TR 2018-01. Wabern: Federal Office of Topography swisstopo.
Hostettler, B., Reisdorf, A. G., Jaeggi, D., Deplazes, G., Bläsi, H.-R., Morard, A., et al. (2017). Litho- and biostratigraphy of the Opalinus Clay and bounding formations in the Mont Terri rock laboratory (Switzerland). Swiss J. Geosci. 110, 22–37. doi: 10.1007/s00015-016-0250-3
Houben, M. E., Desbois, G., and Urai, J. L. (2013). Pore morphology and distribution in the Shaly facies of Opalinus Clay (Mont Terri, Switzerland): insights from representative 2D BIB-SEM investigations on mm to nm scale. App. Clay Sci. 71, 82–97. doi: 10.1016/j.clay.2012.11.006
Houben, M. E., Desbois, G., and Urai, J. L. (2014). A comparative study of representative 2D microstructures in Shaly and Sandy facies of Opalinus Clay (Mont Terri, Switzerland) inferred from BIB-SEM and MIP methods. Mar. Pet. Geol. 49, 143–161. doi: 10.1016/j.marpetgeo.2013.10.009
Huber, F. (2018). Vergleich Verschiedener Methoden zur Quantitativen Mineralbestimmung in Sedimentgesteinen. BSc thesis. Bern: University of Bern.
Irving, E. (1977). Drift of the major continental blocks since the Devonian. Nature 270, 304–309. doi: 10.1038/270304a0
Jaeggi, D., and Bossart, P. (2014). Kompilation der Lithologischen Variabilität und Eigenschaften des Opalinus-Ton im Felslabor Mont Terri. Expert Report for ENSI, 09-08. Wabern: Federal Office of Topography swisstopo.
Jaeggi, D., and Bossart, P. (2016). Borehole BDS-5 near Derrière-Monterri, Courgenay, Switzerland. Reports of the Swiss Geological Survey, No. 6. Wabern: Federal Office of Topography swisstopo.
Jaeggi, D., Müller, P., and Müller, H. (2011). WS-H Experiment: Heterogeneity of the Sandy Facies: Small Scale Mapping of the TT-Niche Face. Mont Terri Technical Note, TN 2010-72. Wabern: Federal Office of Topography swisstopo.
Kaufhold, A., Gräsle, W., Plischke, I., Dohrmann, R., and Siegesmund, S. (2013). Influence of carbonate content and micro fabrics on the failure strength of the sandy facies of the Opalinus Clay from Mont Terri (Underground Rock Laboratory). Eng. Geol. 156, 111–118. doi: 10.1016/j.enggeo.2013.01.014
Keller, L. M., and Giger, S. B. (2019). Petrophysical properties of Opalinus Clay drill cores determined from med-XCT images. Geotech. Geol. Eng. 37, 3507–3522. doi: 10.1007/s10706-019-00815-2
Keller, L. M., Schuetz, P., Erni, R., Rossell, M. D., Lucas, F., Gasser, P., et al. (2013). Characterization of multi-scale microstructural features in Opalinus Clay. Microporous Mesoporous Mater. 170, 83–94. doi: 10.1016/j.micromeso.2012.11.029
Klinkenberg, M., Kaufhold, S., Dohrmann, R., and Siegesmund, S. (2009). Influence of carbonate microfabrics on the failure strength of claystones. Eng. Geol. 107, 42–54. doi: 10.1016/j.enggeo.2009.04.001
Knapp, L. J., McMillan, J. M., and Harris, N. B. (2017). A depositional model for organic-rich Duvernay Formation mudstones. Sediment. Geol. 347, 160–182. doi: 10.1016/j.sedgeo.2016.11.012
Kneuker, T., Hammer, J., and Dohrmann, R. (2020). PE Experiment: Microstructural and Mineralogical-Geochemical Investigations on Selected Core Samples From Prospection Boreholes BPE-1, BPE-2 and BPE-3. Mont Terri Technical Note, TN 2018-12. Wabern: Federal Office of Topography swisstopo.
Kneuker, T., Hammer, J., Shao, H., Schuster, K., Furche, M., and Zulauf, G. (2017). Microstructure and composition of brittle faults in claystones of the Mont Terri rock laboratory (Switzerland): new data from petrographic studies, geophysical borehole logging and permeability tests. Eng. Geol. 321, 139–156. doi: 10.1016/j.enggeo.2017.10.016
Könitzer, S. F., Davies, S. J., Stephenson, M. H., and Leng, M. J. (2014). Depositional controls on mudstone lithofacies in a basinal setting: implications for the delivery of sedimentary organic matter. J. Sediment. Res. 84, 198–214. doi: 10.2110/jsr.2014.18
Korte, C., Hesselbo, S. P., Ullmann, C. V., Dietl, G., Ruhl, M., Schweigert, G., et al. (2015). Jurassic climate mode governed by ocean gateway. Nat. Commun. 6:10015. doi: 10.1038/ncomms10015
Kurz, T. H., and Buckley, S. J. (2012). VA Experiment: Combined Lidar Scanning and Hyperspectral Imaging of the Opalinus Clay in the Mont Terri Underground Rock Laboratory. Mont Terri Technical Note, TN 2012-37. Wabern: Federal Office of Topography swisstopo.
Lauper, B. (in press). Characterisation of Lithological Heterogeneity Within the Opalinus Clay and at its Upper Lithostratigraphic Boundary (N Switzerland). PhD thesis. Fribourg: University of Fribourg.
Lauper, B., Deplazes, G., Vogel, H., Jaeggi, D., Wohlwend, S., Ariztegui, D., et al. (2021). Geochemical fingerprinting of key lithologies and depositional processes across the upper boundary of the Opalinus Clay (Aalenian, Middle Jurassic, northern Switzerland). Depositional Record 7, 25–51. doi: 10.1002/dep2.126
Lauper, B., Jaeggi, D., Deplazes, G., and Foubert, A. (2018). Multi-proxy facies analysis of the Opalinus Clay and depositional implications (Mont Terri rock laboratory. Switzerland). Swiss J. Geosci. 111, 383–398. doi: 10.1007/s00015-018-0303-x
Lazar, O. R., Bohacs, K. M., Macquaker, J. H. S., Schieber, J., and Demko, T. M. (2015). Capturing key attributes of fine-grained sedimentary rocks in outcrops, cores, and thin sections: nomenclature and description guidelines. J. Sediment. Res. 85, 230–246. doi: 10.2110/jsr.2015.11
LeCun, Y., Bengio, Y., and Hinton, G. (2015). Deep learning. Nature 521, 436–444. doi: 10.1038/nature14539
Lenz, N., and Jaeggi, D. (2016). SO-B Experiment: Statistical Analysis and Detection of Periodic Patterns in Lithofacies of the Opalinus Clay by Using Acoustic Travel Time Scan (ATS). Mont Terri Technical Note, TN 2016-08. Wabern: Federal Office of Topography swisstopo.
Lerouge, C., Grangeon, S., Claret, F., Gaucher, E., Blanc, P., Guerrot, C., et al. (2014). Mineralogical and isotopic record of diagenesis from the Opalinus Clay formation at Benken, Switzerland: implications for the modeling of pore-water chemistry in a clay formation. Clays Clay Minerals 62, 286–312. doi: 10.1346/CCMN.2014.0620404
Lerouge, C., Maubec, N., Wille, G., and Flehoc, C. (2015). GD Experiment: Analysis of Carbonate Fraction in Opalinus Clay. Mont Terri Technical Note, TN 2014-92. Wabern: Federal Office of Topography swisstopo.
Lundegard, P. D., and Samuels, N. D. (1980). Field classification of fine-grained sedimentary rocks. J. Sediment. Petrol. 50, 781–786. doi: 10.1306/212F7AE5-2B24-11D7-8648000102C1865D
Macquaker, J. H. S., and Adams, A. E. (2003). Maximizing information from fine-grained sedimentary rocks: an inclusive nomenclature for mudstones. J. Sediment. Res. 73, 735–744. doi: 10.1306/012203730735
Macquaker, J. H. S., and Gawthorpe, R. L. (1993). Mudstone lithofacies in the Kimmeridge Clay Formation, Wessex Basin, southern England: implications for the origin and controls of the distribution of mudstones. J. Sediment. Res. 63, 1129–1143. doi: 10.1306/D4267CC1-2B26-11D7-8648000102C1865D
Macquaker, J. H. S., Taylor, K. G., and Gawthorpe, R. L. (2007). High-resolution facies analyses of mudstones: implications for paleoenvironmental and sequence stratigraphic interpretations of offshore ancient mud-dominated successions. J. Sediment. Res. 77, 324–339. doi: 10.2110/jsr.2007.029
Mäder, U. K., and Mazurek, M. (1998). Oxidation phenomena and processes in Opalinus Clay: evidence from the excavation-disturbed zones in Hauenstein and Mt. Terri Tunnels and Siblingen open clay pit. Mater. Res. Soc. Symposia Proc. 506, 731–739. doi: 10.1557/PROC-506-731
Malinverni, D., Brunner, P., Renard, P., Marguet, L., and Becker, J. (2014). HA Experiment: Hyperspectral Imaging of the Opalinus Clay at the Mont Terri Rock Laboratory: Data Acquisition and Geological Classification. Mont Terri Technical Note, TN 2013-19. Wabern: Federal Office of Topography swisstopo.
Matter, A., Peters, T., Bläsi, H.-R., Meyer, J., Ischi, H., and Meyer, C. (1988). Sondierbohrung Weiach – Geologie. Nagra Technischer Bericht, NTB 86-01. Wettingen: Nagra.
Matter, A., Peters, T., Isenschmid, C., Bläsi, H.-R., and Ziegler, H.-J. (1987). Sondierbohrung Riniken – Geologie. Nagra Technischer Bericht, NTB 86-02. Wettingen: Nagra.
Mazurek, M. (2017). Gesteinsparameter – Datenbank Nordschweiz – Version 2. Nagra Arbeitsbericht, NAB 17-56. Wettingen: Nagra.
Mazurek, M., and Aschwanden, L. (2020). Multi-Scale Petrographic and Structural Characterisation of the Opalinus Clay. Nagra Arbeitsbericht, NAB 19-44. Wettingen: Nagra.
Mazurek, M., Hurford, A. J., and Leu, W. (2006). Unravelling the multi-stage burial history of the Swiss Molasse Basin: integration of apatite fission track, vitrinite reflectance and biomarker isomerisation analysis. Basin Res. 18, 27–50. doi: 10.1111/j.1365-2117.2006.00286.x
Müller, P., and Jaeggi, D. (2012). SO Experiment: Sedimentary Structure in the Sandy Facies of the Opalinus Clay at Mont Terri Rock Laboratory. Mont Terri Technical Note, TN 2012-45. Wabern: Federal Office of Topography swisstopo.
Naef, H., Büchi, M., Bläsi, H. R., Deplazes, G., and Gysi, M. (2019). Lithology Manual. Lithological Description of Drill Cores and Cuttings in Northern Switzerland. Nagra Arbeitsbericht, NAB 19-11. Wettingen: Nagra.
Nagra (2001). Sondierbohrung Benken – Untersuchungsbericht. Nagra Technischer Bericht, NTB 00-01. Wettingen: Nagra.
Nagra (2002). Projekt Opalinuston: Synthese der Geowissenschaftlichen Untersuchungsergebnisse. Entsorgungsnachweis für Abgebrannte Brennelemente, Verglaste Hochaktive sowie Langlebige Mittelaktive Abfälle. Nagra Technischer Bericht, NTB 02-03. Wettingen: Nagra.
Nagra (2014). SGT Etappe 2: Vorschlag Weiter zu Untersuchender Geologischer Standortgebiete mit Zugehörigen Standortarealen für die Oberflächenanlage: Geologische Grundlagen, Dossier I Einleitung und Zusammenfassung. Nagra Technischer Bericht, NTB 14-02. Wettingen: Nagra.
Pearson, F. J., Arcos, D., Bath, A., Boisson, J.-Y., Fernández, A. M., Gäbler, H.-E., et al. (2003). Mont Terri Project – Geochemistry of Water in the Opalinus Clay Formation at the Mont Terri Rock Laboratory. Reports of the FOWG, Geology Series, No. 5. Bern: Federal Office of Water and Geology.
Peters, M., Mazurek, M., Jaeggi, D., and Müller, H. (2011). WS-H Experiment: Heterogeneities in the Sandy Facies of Opalinus Clay on a Scale of Millimeters to Centimeters. Mont Terri Technical Note, TN 2010-76. Wabern: Federal Office of Topography swisstopo.
Peters, T. (1962). Tonmineralogische Untersuchungen an Opalinustonen und einem Oxfordienprofil im Schweizer Jura. Schweiz. Mineral. Petrogr. Mitt. 42, 359–380. doi: 10.5169/seals-32682
Philipp, T., Amann-Hildenbrand, A., Laurich, B., Desbois, G., Littke, R., and Urai, J. L. (2017). The effect of microstructural heterogeneity on pore size distribution and permeability in Opalinus Clay (Mont Terri, Switzerland): insights from an integrated study of laboratory fluid flow and pore morphology from BIB-SEM images. Geol. Soc. Lond. Spec. Publ. 454, 85–106. doi: 10.1144/SP454.3
Picard, M. D. (1971). Classification of fine-grained sedimentary rocks. J. Sediment. Petrol. 41, 179–195. doi: 10.1306/74D7221B-2B21-11D7-8648000102C1865D
Potter, P. E., Maynard, J. B., and Pryor, W. A. (1980). Sedimentology of Shale. New York, NY: Springer-Verlag.
Quenstedt, F. A. (1843). Das Flözgebirge Würtembergs mit Besonderer Rücksicht auf den Jura. Tübingen: Laupp & Siebeck.
Rebesco, M., Hernández-Molina, F. J., Van Rooij, D., and Wåhlin, A. (2014). Contourites and associated sediments controlled by deep-water circulation processes: state-of-the-art and future considerations. Mar. Geol. 352, 111–154. doi: 10.1016/j.margeo.2014.03.011
Reineck, H. E., and Singh, I. B. (1972). Genesis of laminated sands and graded rythmites in storm-sand layers of shelf mud. Sedimentology 18, 123–128. doi: 10.1111/j.1365-3091.1972.tb00007.x
Reineck, H.-E., and Wunderlich, F. (1968). Classification and origin of flaser and lenticular bedding. Sedimentology 11, 99–104. doi: 10.1111/j.1365-3091.1968.tb00843.x
Reisdorf, A. G., Hostettler, B., Jaeggi, D., Deplazes, G., Bläsi, H.-R., Morard, A., et al. (2016). Litho- and Biostratigraphy of the 250 m-Deep Mont Terri BDB-1 Borehole Through the Opalinus Clay and Bounding Formations, St-Ursanne, Switzerland. Mont Terri Technical Report, TR 2016-02. Wabern: Federal Office of Topography swisstopo, doi: 10.13140/rg.2.2.15045.04322
Reisdorf, A. G., Hostettler, B., Waltschew, A., Jaeggi, D., and Menkveld-Gfeller, U. (2014). SO Experiment: Biostratigraphy of the Basal Part of the Opalinus-Ton at the Mont Terri Rock Laboratory, Switzerland. Mont Terri Technical Report, TR 2014-07. Wabern: Federal Office of Topography swisstopo.
Reisdorf, A. G., and Wetzel, A. (2018). Evidence for synsedimentary differential tectonic movements in a low-subsidence setting: early Jurassic in northwestern Switzerland. Swiss J. Geosci. 111, 417–444. doi: 10.1007/s00015-018-0318-3
Reisdorf, A. G., Wetzel, A., Schlatter, R., and Jordan, P. (2011). The Staffelegg Formation: a new stratigraphic scheme for the Early Jurassic of northern Switzerland. Swiss J. Geosci. 104, 97–146. doi: 10.1007/s00015-011-0057-1
Rempfer, J., Lenz, N., Fischer, A., and Jaeggi, D. (2017). SO-B Experiment: Automatic Pattern Recognition, Mont Terri. Mont Terri Technical Note, TN 2017-51. Wabern: Federal Office of Topography swisstopo.
Rempfer, J., Lenz, N., Fischer, A., Lauper, B., and Jaeggi, D. (2018). SO-B Experiment: Automatic pattern detection, Mont Terri. Mont Terri Technical Note, TN 2018-63. Wabern: Federal Office of Topography swisstopo.
Russakovsky, O., Deng, J., Su, H., Krause, J., Satheesh, S., Ma, S., et al. (2015). ImageNet large scale visual recognition challenge. Int. J. Comput. Vis. 115, 211–252. doi: 10.1007/s11263-015-0816-y
Schieber, J. (1989). Facies and origin of shales from the mid-Proterozoic Newland Formation, Belt Basin, Montana, USA. Sedimentology 36, 203–219. doi: 10.1111/j.1365-3091.1989.tb00603.x
Schmidt, C., Braun, L., Paltzer, G., Mühlberg, M., Christ, P., and Jakob, F. (1924). “Die Bohrungen von Buix bei Pruntrut und Allschwil bei Basel,” in Beiträge zur Geologie der Schweiz, Geotechnische Serie, 10, (Zurich: Aschmann & Scheller), 74.
Schneider, C. A., Rasband, W. S., and Eliceiri, K. W. (2012). NIH Image to ImageJ: 25 years of image analysis. Nat. Methods 9, 671–675. doi: 10.1038/nmeth.2089
Schuster, K., Amann, F., Young, S., Bossart, P., and Connolly, P. (2017). High-resolution mini-seismic methods applied in the Mont Terri rock laboratory (Switzerland). Swiss J. Geosci. 110, 213–231. doi: 10.1007/s00015-016-0241-4
Sellés-Martínez, J. (1996). Concretion morphology, classification and genesis. EarthSci. Rev. 41, 177–210. doi: 10.1016/S0012-8252(96)00022-0
Siegesmund, S., Popp, T., Kaufhold, A., Dohrmann, R., Gräsle, W., Hinkes, R., et al. (2014). Seismic and mechanical properties of Opalinus Clay: comparison between sandy and shaly facies from Mont Terri (Switzerland). Environ. Earth Sci. 137, 125–129. doi: 10.1007/s12665-013-2768-2
Spears, D. A. (1980). Towards a classification of shales. J. Geol. Soc. 71, 3737–3749. doi: 10.1144/gsjgs.137.2.0125
Taylor, K. G., and Macquaker, J. H. S. (2011). Iron minerals in marine sediments record chemical environments. Elements 7, 113–118. doi: 10.2113/gselements.7.2.113
Thury, M., and Bossart, P. (1999). The Mont Terri rock laboratory, a new international research project in a Mesozoic shale formation, in Switzerland. Eng. Geol. 52, 347–359. doi: 10.1016/S0013-7952(99)00015-0
Underhill, J. R., and Partington, M. A. (1993). Jurassic thermal doming and deflation in the North Sea: implications of the sequence stratigraphic evidence. Geol. Soc. Lond. Pet. Geol. Conf. Ser. 4, 337–345. doi: 10.1144/0040337
Van Loon, L. R., Soler, J. M., Müller, W., and Bradbury, M. H. (2004). Anisotropic diffusion in layered argillaceous rocks: a case study with Opalinus Clay. Environ. Sci. Technol. 38, 5721–5728. doi: 10.1021/es049937g
Vogt, T., Ebert, A., Häring, C., Becker, J. K., Traber, D., Deplazes, G., et al. (2016). Kernbohrung Lausen: Geologische, Hydrogeologische und Bohrlochgeophysikalische Untersuchungen (Rohdatenbericht). Nagra Arbeitsbericht, NAB 15-10. Wettingen: Nagra.
Waber, H. N., and Rufer, D. (2017). Porewater Geochemistry, Method Comparison and Opalinus Clay – Passwang Formation Interface Study at the Mont Terri URL. NWMO Technical Reports, TR-2017-10. Toronto: Nuclear waste management organization.
Wenk, H.-R., Voltolini, M., Mazurek, M., Van Loon, L. R., and Vinsot, A. (2008). Preferred orientation and anisotropy in shales: callovo-Oxfordian shale (France) and Opalinus Clay (Switzerland). Clays Clay Minerals 56, 285–306. doi: 10.1346/CCMN.2008.0560301
Wetzel, A., Allenbach, R., and Allia, V. (2003). Reactivated basement structures affecting the sedimentary facies in a tectonically “quiescent” epicontinental basin: an example from NW Switzerland. Sediment. Geol. 157, 153–172. doi: 10.1016/S0037-0738(02)00230-0
Wetzel, A., and Allia, V. (2000). The significance of hiatus beds in shallow-water mudstones: an example from the Middle Jurassic of Switzerland. J. Sediment. Res. 70, 170–180. doi: 10.1306/2DC40908-0E47-11D7-8643000102C1865D
Wetzel, A., and Allia, V. (2003). Der Opalinuston in der Nordschweiz: lithologie und Ablagerungsgeschichte. Ecl. Geol. Helv. 96, 451–469. doi: 10.5169/seals-169032
Wetzel, A., and Meyer, C. A. (2006). The dangers of high-rise living on a muddy seafloor: an example of crinoids from shallow-water mudstones (Aalenian, northern Switzerland). Palaios 21, 155–167. doi: 10.2110/palo.2005.p05-132
Wildi, W., Funk, H., Loup, B., Amato, E., and Huggenberger, P. (1989). Mesozoic subsidence history of the European marginal shelves of the alpine Tethys (Helvetic realm, Swiss Plateau and Jura). Ecl. Geol. Helv. 82, 817–840. doi: 10.5169/seals-166404
Wilson, R. D., and Schieber, J. (2015). Sedimentary facies and depositional environment of the Middle Devonian Geneseo Formation of New York, USA. J. Sediment. Res. 85, 1393–1415. doi: 10.2110/jsr.2015.88
Wohlwend, S., Bernasconi, S. M., Deplazes, G., and Jaeggi, D. (2019a). SO Experiment: Chemostratigraphic Study of Late Aalenian to Early Bajocian. Mont Terri Technical Report, TR 2019-05. Wabern: Federal Office of Topography swisstopo.
Wohlwend, S., Bläsi, H.-R., Feist-Burkhardt, S., Hostettler, B., Menkveld-Gfeller, U., Dietze, V., et al. (2019b). Die Passwang-Formation im östlichen Falten- und Tafeljura: Fasiswald (SO) – Unt. Hauenstein (SO) – Wasserflue (AG) – Thalheim (AG) – Frickberg (AG) – Cheisacher (AG) – Böttstein (AG) – Tegerfelden (AG) – Achberg (AG). Nagra Arbeitsbericht, NAB 18-11. Wettingen: Nagra.
Yu, C. (2017). Comparative Study of Convective and Diffusive Transport Phenomena Within the Opalinus Clay of Mont Terri. PhD thesis. Aix-en-Provence: Aix-Marseille University.
Ziegler, P. A. (1990). Geological Atlas of Western and Central Europe, 2nd Edn. London: Shell Internationale Petroleum Mij. B.V. and Geological Society.
Keywords: Aalenian, Toarcian, claystone and shale, mudstone, rock classification, nuclear waste storage, Mont Terri rock laboratory
Citation: Lauper B, Zimmerli GN, Jaeggi D, Deplazes G, Wohlwend S, Rempfer J and Foubert A (2021) Quantification of Lithological Heterogeneity Within Opalinus Clay: Toward a Uniform Subfacies Classification Scheme Using a Novel Automated Core Image Recognition Tool. Front. Earth Sci. 9:645596. doi: 10.3389/feart.2021.645596
Received: 23 December 2020; Accepted: 12 April 2021;
Published: 12 May 2021.
Edited by:
Barbara Mauz, University of Salzburg, AustriaReviewed by:
Anja Sundal, University of Oslo, NorwayLevi Knapp, Japan Oil, Gas and Metals National Corporation (JOGMEC), Japan
Copyright © 2021 Lauper, Zimmerli, Jaeggi, Deplazes, Wohlwend, Rempfer and Foubert. This is an open-access article distributed under the terms of the Creative Commons Attribution License (CC BY). The use, distribution or reproduction in other forums is permitted, provided the original author(s) and the copyright owner(s) are credited and that the original publication in this journal is cited, in accordance with accepted academic practice. No use, distribution or reproduction is permitted which does not comply with these terms.
*Correspondence: Bruno Lauper, YnJ1bm8ubGF1cGVyQHVuaWZyLmNo