 Wei Cheng1
 Jing Ba
 José M. Carcione
- 1School of Earth Sciences and Engineering, Hohai University, Nanjing, China
- 2National Institute of Oceanography and Applied Geophysics–OGS, Trieste, Italy
Tight-sandstone reservoirs have a complex pore structure with microcracks and intergranular pores, which have a significant impact on the seismic properties. We have performed ultrasonic measurements at different confining pressures for 15 tight-gas sandstone samples of the Xujiahe formation in Western Sichuan Basin, and have available well-log and seismic data of this area. The aim of this work is to estimate the porosity and crack properties for variable pressure conditions. The EIAS (equivalent inclusion-average stress) model is adopted to compute the high- and low-frequency bulk and shear moduli as a function of crack aspect ratio and (soft) and (stiff) porosities. Then, we use the EIAS-Zener anelastic model to obtain the wave properties as a function of frequency, and compare results with those of the constant Q (Kjartansson) one for verification of the robustness of the approach. The corresponding P-wave impedance, density and phase velocity ratio (VP/VS) are computed in order to built 3D rock‐physics templates (RPTs) at the ultrasonic, well-log and seismic frequency bands. The methodology is applied to a survey line crossing two wells, which together with the laboratory experiments, provide calibration suitable data. The estimated stiff porosity and crack porosity and density are consistent with the available data and actual production records, indicating that 3D RPTs provide a useful interpretation tool in seismic exploration and prospect evaluation.
Introduction
Unconventional gas resources offer significant gas production growth potential. Tight-gas sandstones represent an important part of the unconventional production and abundant reserves are yet to be developed (Khlaifat et al., 2011). There are tight-gas sandstone reservoirs almost in all oil and gas bearing areas with significant gas reserves (Zhu et al., 2008). These reservoirs have sandstones with low porosity, permeability and gas saturation and abundant microcracks (Guan and Niu, 1995, Anjos et al., 2003; Cheng et al., 2019; Guo et al., 2018). An effective reservoir characterization is the key to their successful exploration (Storker et al., 2013; Liu et al., 2019). The reservoir contains a large number of natural fractures, which provide main seepage channels and effective storage space, and favor single-well productivity (Harmelen and Weijermars, 2018; Xiao et al., 2019). Therefore, an accurate identification of the pore properties is essential.
In this case, rock physics is required to relate the wave properties to the composition and microstructure of these rocks, which have been affected by complex diagenetic and sedimentary processes during their formation (Vernik and Kachanov, 2010; Zhang et al., 2019; Dvorkin et al., 2020). Walsh (1965) developed some of the first techniques to study the effects of cracks and confining pressure on the dry-rock moduli. Thomsen (1995) considered aligned circular cracks and analyzed the effects of the associated anisotropy on the elastic properties, and Smith et al. (2009) quantified how microcracks affect the wave velocities in tight-gas sandstone reservoirs. Tang (2011) proposed an elastic-wave model to describe the effects of pores and cracks by extending the Biot and BISQ theories. Double-porosity models that consider two phases with different compressibilities are relatively new and useful approaches to model wave propagation in heterogeneous media (Pride et al., 2004; Ba et al., 2016; Ba et al., 2017; Fu et al., 2018).
To model the relation between pore geometry and elasticity attributes, we used the EIAS (equivalent inclusion-average stress) model (Endres and Knight, 1997), which is consistent with Gassmann equation at low frequencies and with the Hashin-Shtrikman bounds when applied to two-phase systems. Moreover, we used the EIAS-Zener model that generalizes the EIAS model to the full frequency range, by incorporating the Zener (standard linear solid) model (Cheng et al., 2020). The crack porosity, average crack aspect ratio and quality factors and phase velocities were obtained as a function of frequency by fitting experimental data at the unrelaxed and relaxed states.
RPTs establish a link between the reservoir properties (e.g., porosity, fluid saturation, clay content, etc) and the elastic properties, such as velocity, density, impedance, and wet-rock stiffness moduli (Carcione and Avseth, 2015; Hao et al., 2016; Li et al., 2019; Tan et al., 2020). Pang et al. (2019) used the P-wave quality factor and impedance to build RPTs, and shown that the estimated porosity and saturation are consistent with actual gas production results and well-log data. Gegenhuber and Pupos (2015) used RPTs based on VP/VS and acoustic impedance applied to carbonate samples.
We used VP/VS, impedance and density to build 3D RPTs, based on the EIAS model and the Zener frequency kernels, to characterize the relation between elastic properties and reservoir attributes, i.e., equant porosity and crack porosity and aspect ratio (Carcione, 2014). The templates were calibrated with ultrasonic, log and seismic data. Thereafter, a quantitative interpretation of those attributes can be performed by superposing the seismic-inversion data on the templates.
Laboratory Experiments
The Study Area
The reservoir in the Xujiahe formation of the western Sichuan Basin (China) belongs to the braided river delta sedimentary system. The main mineral components are quartz, feldspar, rock debris, mica, and heavy minerals. The size of the mineral particles is mainly medium to fine, most sandstones are sorted well, and the crushed particles are medium to poorly rounded. These sandstone reservoirs, of low porosity and permeability, have a high crack density and a heterogeneous distribution of pore fluids, due to long-term diagenesis.
Rock Specimens and Data
Fifteen samples were collected at approximately 2 km depth. They have low porosity and permeability, and are mainly composed of quartz, feldspar and rare clay. Moreover, there are calcite and quartz cementation in intergranular pores, and cracks. The ultrasonic experiments measurements (samples TSA1-TSA15) follow the experimental set-up of Guo et al. (2009), which is composed of a high pressure vessel and several units to control the temperature and the confining and pore pressures, and perform acoustic wave testing. The acquisition rate for ultrasonic waveforms (1 MHz) is 50 M/s and the time resolution is 0.02 μs.
The tests were performed at zero pore pressure and 22°C, whereas the confining pressure increases from 1 to 35 MPa (1, 5, 10, 15, 20, 25, 30 and 35 MPa). The differential pressure (Pd) is defined here as the difference between the confining and pore pressures. Ultrasonic compressional and shear-wave velocities (VP and VS) at full-gas (nitrogen) were obtained by picking the first arrivals of waveforms with 1 MHz dominant frequency. These samples have low porosity and permeability, with a maximum of 13.91% and 1.37 mD, respectively. The properties are given in Table 1. Figure 1 shows a crossplot of VP and VS for varying differential pressure. As can be seen, the velocities increase with pressure, as expected. The correlation of a linear fitting between VP and VS is excellent, the R-square is 0.956, and the slope of VP vs. VS is 1.6.
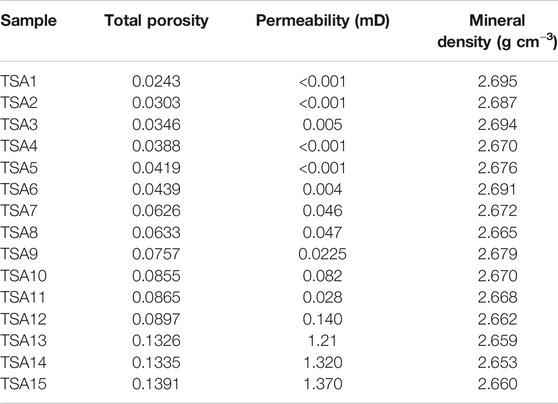
TABLE 1. Tight-gas sandstones properties.
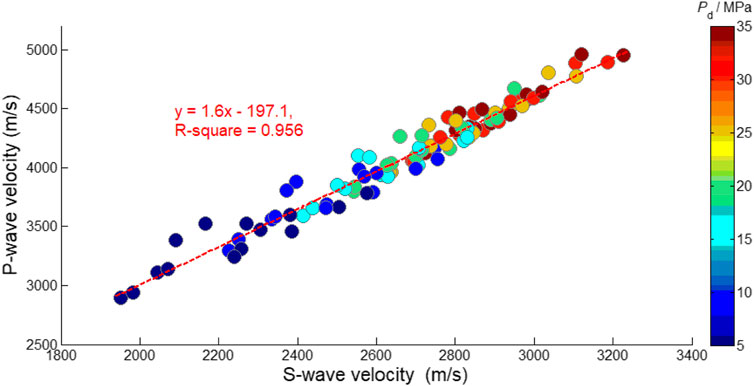
FIGURE 1. Crossplot of VP and VS for varying differential pressures for 15 tight-gas sandstone samples at full gas saturation. The color bar indicates differential pressure.
Figure 2 shows ultrasonic velocities as a function of differential pressure at full gas saturation. Velocities are non-linear at low differential pressure, becoming almost linear above 25 MPa, because cracks with lower aspect ratio close first and when the differential pressure exceeds approximately 25 MPa, the stiffer pores are also affected. The velocities increase faster for samples TSA4, TSA5 and TSA8, that can be due to a higher crack density, resulting in a higher sensitivity to pressure. Similar results have been observed previously by Yin et al. (2017), David et al. (2013), Pervukhina et al., 2010, Deng et al. (2015), Sun and Goldberg (1997) with different types of sandstones.
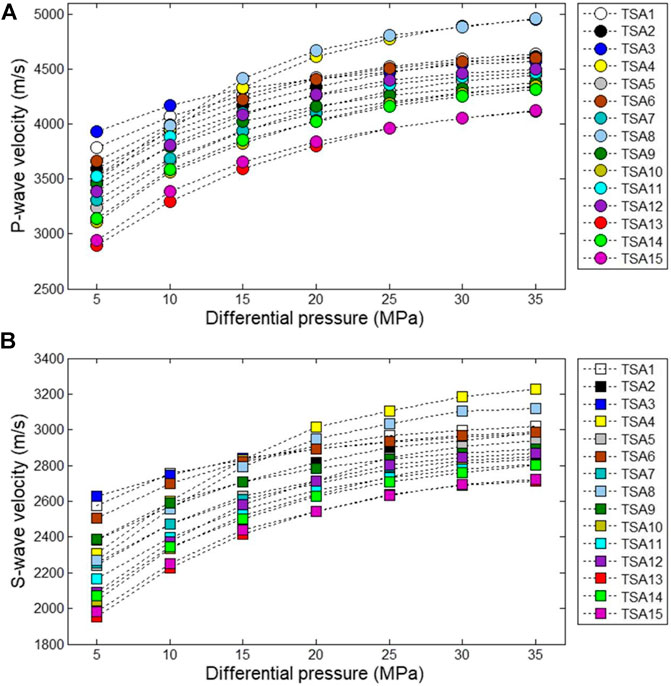
FIGURE 2. Ultrasonic velocities as a function of differential pressure at full-gas saturation, (A) P wave; (B) S wave.
Determination of the Experimental Crack Porosity
Cracks with lower aspect ratio close first when the differential pressure increases, leading to higher velocities and decreasing crack density. We use sample TSA13 as an example to estimate crack porosity and the pressure dependency of the total, stiff (equant) and crack porosity (Figure 3) (The former is the sum of the last two porosities). The total porosity as a function of pressure is obtained by measurement, whereas the stiff porosity by a linear extrapolation of the high-pressure trend determined between 30 and 35 MPa. The similar method was used by Yin et al. (2017) and Pervukhina et al., 2010. The crack porosity is estimated by subtracting the stiff one from the total porosity. Figure 4 shows the crack porosity as a function of the differential pressure. When the differential pressure is less than 25 MPa, the crack porosity decreases rapidly and non-linearly. As the pressure increases, the crack porosity exhibits linear characteristics until it approaches zero at high differential pressures.
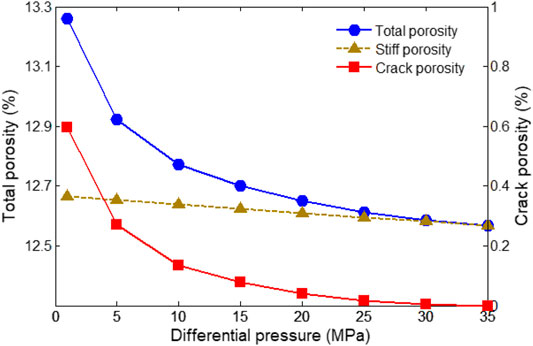
FIGURE 3. Pressure dependency of the total, stiff and crack porosity of sample TSA13.
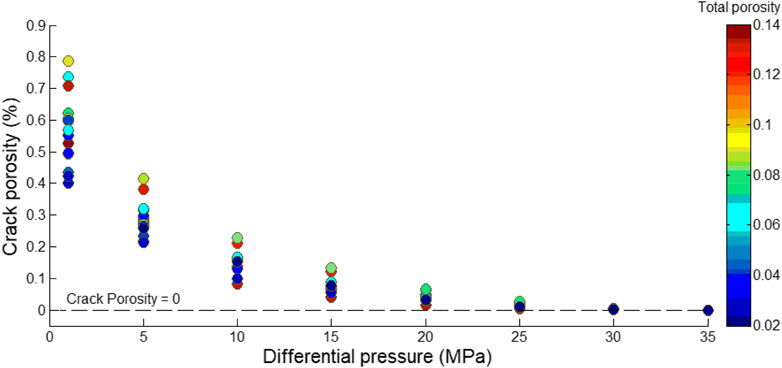
FIGURE 4. Crossplot of crack porosity and differential pressure at full gas saturation. The color bar indicates total porosity.
Rock-Physics Model
The EIAS Model
The microscopic pore structure is important because it affects the rock skeleton properties and the fluid distribution. The EIAS model can effectively address the relation between pore geometry and the elastic attributes, and it is consistent with the Hashin-Shtrikman bounds for two-phase systems (Endres and Knight 1997; Cheng et al., 2020). Assuming a background medium containing spherical pores and cracks, the resulting expressions for the effective high-frequency elastic moduli of the saturated rock are
where ϕ denotes the rock total porosity, K0 and G0 are the bulk and shear moduli of the mineral mixture, respectively, Kf is the fluid bulk modulus and
(Berryman 1995; Mavko et al., 2009; Carcione et al., 2020; Sun et al., 2020), where a is the crack aspect ratio, c is the soft-pore (crack) fraction and 1 - c is the stiff-pore fraction; the crack density is
The effective low-frequency moduli (when complete fluid-pressure communication occurs) are
where
and
The detailed derivation of these equations can be found in Endres and Knight (1997). The model considers the interactions between cracks and has no restrictions on the crack density. In order to generalize the model to all frequencies, we combine the EIAS model with the Zener (standard linear solid) and Kjartansson kernels, to describe the physics with two very dissimilar approaches and check the robustness of the methodology.
EIAS-Zener Model
The Zener mechanical model can be used to described the frequency dependence of dispersion and attenuation (e.g., Carcione et al., 2012; Carcione 2014). This model satisfies the Kramers-Kronig relations (Carcione et al., 2018). The minimum quality factors of the bulk and shear relaxation peaks are given by
respectively, whereas the bulk and shear complex moduli are
where
The phase velocity and quality factor of the body waves are
and
respectively, where
(Carcione, 2014), respectively, where ρ is the mass density.
EIAS-Kjartansson Model
Kjartansson (1979) presented a constant-Q model specified by the phase velocity at a reference frequency f1 and the value of Q. To combine this model with the EIAS model, we consider f1 = 50 Hz, which is the average frequency of the event corresponding to the target layer, i.e.,
For f2 = 1 MHz (the ultrasonic experimental frequency),
The phase velocity as a function of frequency is (Carcione, 2014, Eq. 2.214),
as an approximation for Q>>1. We obtain after some calculations,
Defining,
the complex modulus is (Carcione, 2014, Eq. 2.212)
Therefore, the complex velocity and quality factor are
respectively.
Example
The previous models are used to relate the crack properties (aspect ratio and porosity) and the frequency-dependent elastic moduli, phase velocities and quality factors. The purpose of using two dissimilar models is to verify the robustness of the approach, i.e., if the two models give similar results, we can rely on the methodology. Let us consider sample TSA13 (porosity is 13.26%). We assume that the mineral bulk and shear modulus are 39 and 36 GPa, respectively (Mavko et al., 2009), the fluid properties are obtained from Batzle and Wang (1992). We consider a Zener kernel with f0 = 10 KHz and the parameters of the constant-Q kernel assumed in the previous section. Figure 5 shows the phase velocities and dissipation factors as a function of frequency, where it is clear both kernels honor the velocity dispersion between the seismic and laboratory frequency bands. Therefore, they can be used to build multi-scale 3D RPTs in the ultrasonic, logging and seismic frequency bands.
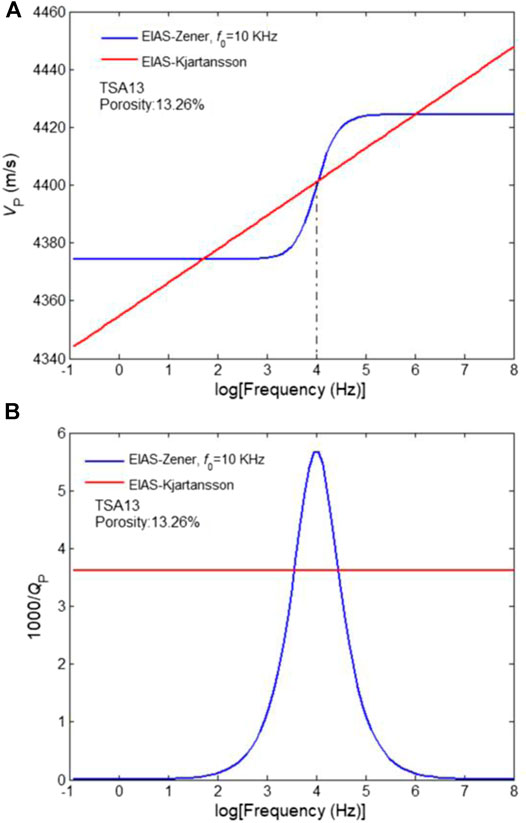
FIGURE 5. Phase velocity (A) and dissipation factor (B) as a function of frequency (sample TSA13).
Thereafter, we assume a crack porosity of 0.2% and crack aspect ratios of 0.001, 0.0014, 0.0018, 0.0022, 0.0026. Velocities and dissipation factors as a function of frequency are shown in Figures 6A,B. When the crack porosity is a constant and the crack aspect ratio increases, the rock becomes stiffer and the P-wave velocity increases, but attenuation decreases. If we take a crack aspect ratio of 0.002 and crack porosities of 0.2, 0.3, 0.4, 0.5, 0.6%, the results are shown in Figures 6C,D, where the trend opposite to the previous one.
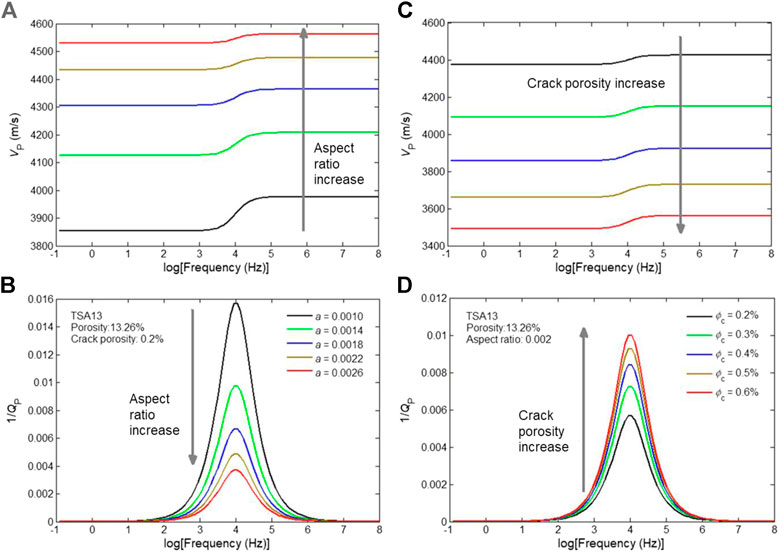
FIGURE 6. Effects of crack aspect ratio and crack porosity on P-wave dispersion and attenuation at seismic frequencies.
Multi-Scale 3D RPTs
Building the RPTs
By setting the crack aspect ratio, crack porosity and total porosity as variables, the corresponding P-wave impedance, density and VP/VS value are calculated by using the EIAS-Zener model. Then, we build the 3D RPTs at ultrasonic (1 MHz) well-log (10 kHz) and seismic (50 Hz) frequencies, and the seismic template is used to estimate the microstructure of the sandstone reservoirs. Similar templates have been used by Pang et al. (2020a) to estimate the microfracture porosity of deep carbonate reservoirs. Figures 7A,B show the 3D RPTs at ultrasonic and seismic frequencies, respectively (the well-log template is similar to the seismic one).
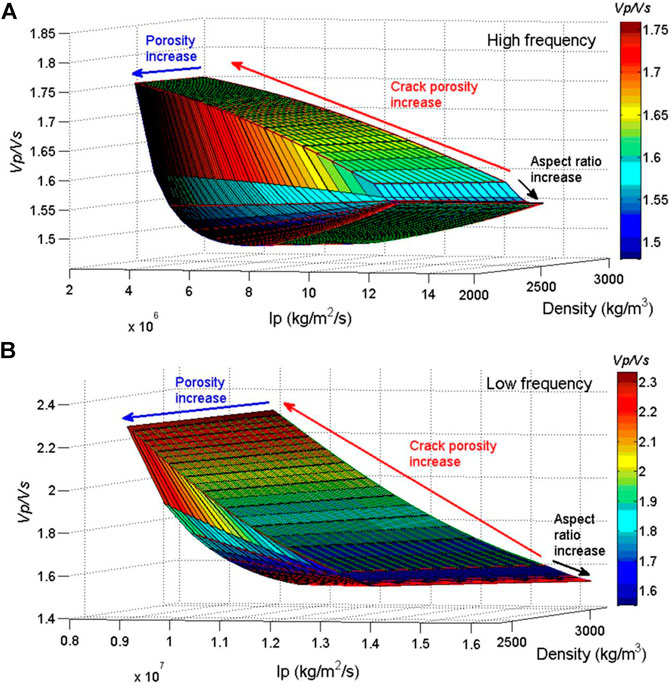
FIGURE 7. 3D RPTs at ultrasonic (A) and seismic (B) frequencies.
As the stiff porosity increases, the P-wave impedance and mass density decrease, but the variation in VP/VS is small. With the increase of crack porosity, the P-wave impedance decreases and VP/VS increases, but the density hardly changes. As the crack aspect ratio increases, the P-wave impedance increases, VP/VS decreases. This behavior is similar at all frequencies.
Calibration at Ultrasonic Frequencies
The templates are calibrated with the crack porosity obtained in Section Determination of the Experimental Crack Porosity. Figure 8 superposes the data to the template. The porosity (2.43–13.91%) of samples is basically consistent with the corresponding values in the templates, and the agreement is also good for the crack porosity. What’s more, the average error between the predicted porosities (based on ultrasonic wave attributes) and the measured one is 0.00455. In addition, as this increases, the P-wave impedance decreases.
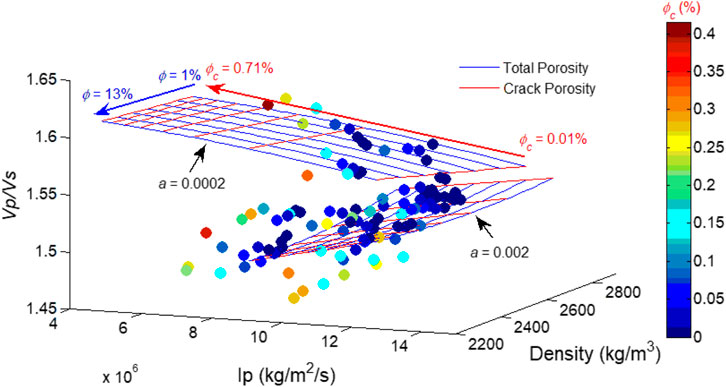
FIGURE 8. 3D RPT at ultrasonic frequencies with the superposed experimental data (symbols). The color bar is crack porosity.
Calibration at Well-Log and Seismic Frequencies
Figure 9 shows the calibration of the 3D RPTs at log and seismic frequencies, where the data is extracted from well B. The template at seismic frequencies is calibrated with inversion results (P-wave impedance, density and VP/VS) of pre-stack seismic data that has been verified, whole the porosity is taken from the logs. Similar methods have been used by Pang et al. (2020b). The velocities and density at seismic frequency band are extracted from the seismic traces around the borehole by using a three-term inversion method (Aki and Richards, 1980). We use the partial-stack method to obtain the seismic data based on pre-stack angle gathers, which improves the signal-noize ratio and suppresses random noises. In addition, the velocities and porosity at sonic-log frequency band are extracted from the well-log data by using the velocity-time semblance method, which avoids picking arrival times and can accurately determine the phase velocities for different modes (Wang et al., 2020), and the density is obtained from density logging. Figure 9 shows that the porosity is basically consistent with the corresponding values in the templates. Figure 10 shows a crossplot of VP and VS of well B, where the velocities increase with decreasing porosity, as expected. The correlation of a linear fitting between VP and VS is excellent, and the slope of VP vs. VS is 1.12.
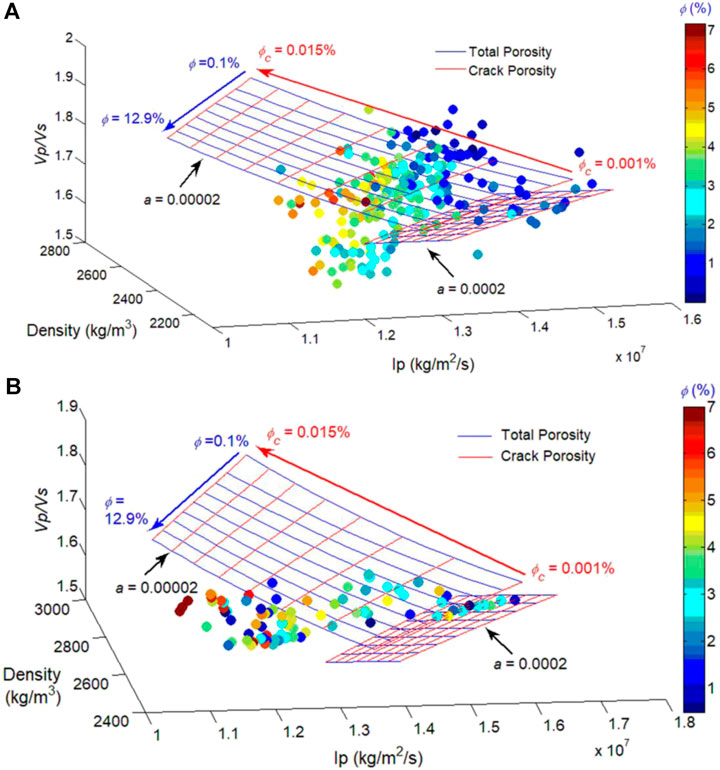
FIGURE 9. 3D RPTs at the well-log (A) and seismic (B) frequency bands, with the superposed experimental data (symbols). The color bar is porosity.
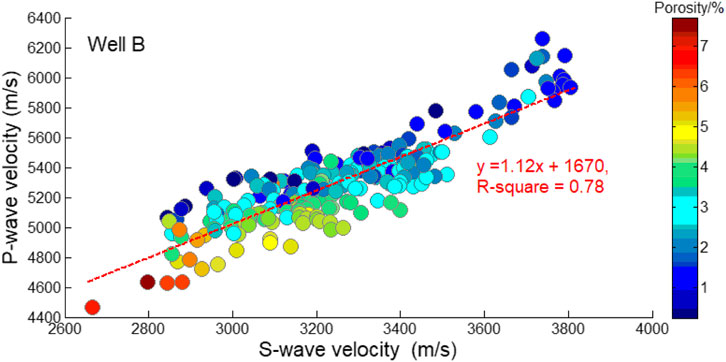
FIGURE 10. Crossplot of VP and VS of well B. The color bar indicates porosity.
The P-wave impedance, density and VP/VS decreases with increasing porosity, and the latter decreases with increasing crack aspect ratio. The porosity is low (less than 7%), which is consistent with the geological characteristics of the reservoirs.
Estimation of the Microstructure from Seismic Data
The predictions of reservoir stiff porosity and crack porosity and density are performed on a 2D seismic line crossing wells A and B. P-wave impedance, density and VP/VS are overlapped onto the 3D RPTs, and the microstructural properties are estimated.
Figure 11A shows the porosity from well log A and B are superposed, showing a good agreement. By taking well B as an example, the average error between the predicted porosities (based on seismic wave attributes) and the measured porosities is 0.00923, which is higher than the one at ultrasonic frequency, because the resolution of the seismic data is low. Figures 11B,C show the crack porosity and density, respectively. It shows that well B has a higher crack porosity and density. The horizontal sections are created from target layer (depth 4,787 m) of the study area in the Xujiahe formation of the western Sichuan Basin (China). Figures 12, 13 show horizontal section of those attributes, which are simulated by using EIAS-Zener and EIAS-Kjartansson models, respectively. The results show that the two models give similar results, thus indicating that the methodology is working. The total porosity and crack porosity and density effectively serve to identify high-quality reservoirs. Well B is located in an area with high porosity and crack content, where the target layer has a good pore connectivity, storage capability, and natural gas accumulation conditions. The gas production report of well B indicates 5148929 m3 per day, while well A yields 57559 m3 per day. The results agree with the actual production of the two wells. Therefore, the methodology is reliable, and is expected to provide an important basis for further rock-physics studies and field applications of seismic exploration.
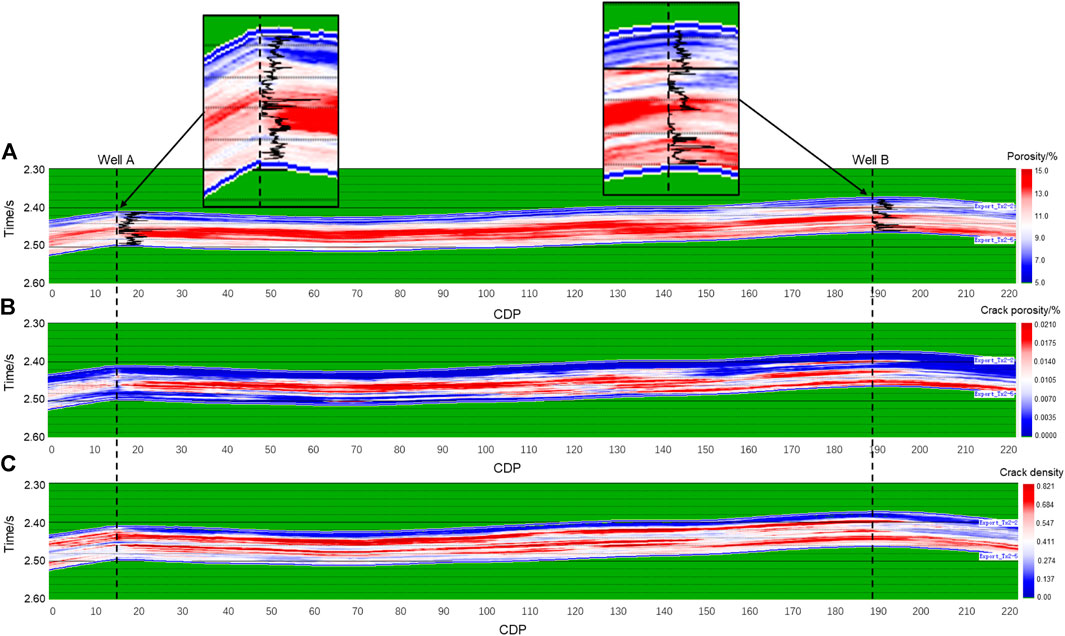
FIGURE 11. Vertical sections of the estimated porosity (A), crack porosity (B) and crack density (C).
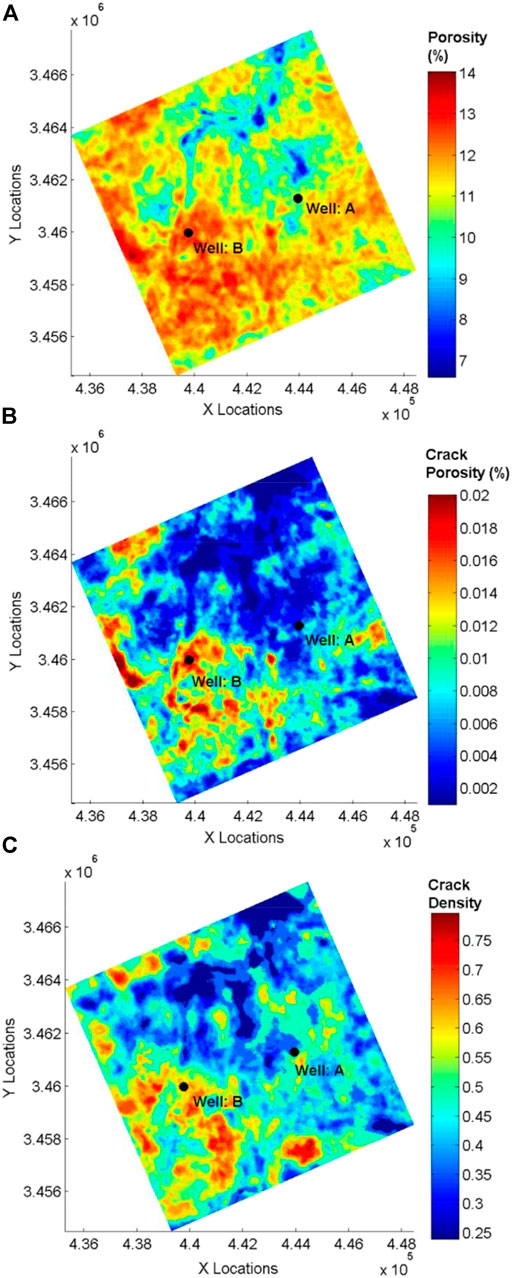
FIGURE 12. Horizontal sections of the estimated porosity (A), crack porosity (B) and crack density (C) by using the EIAS-Zener model.
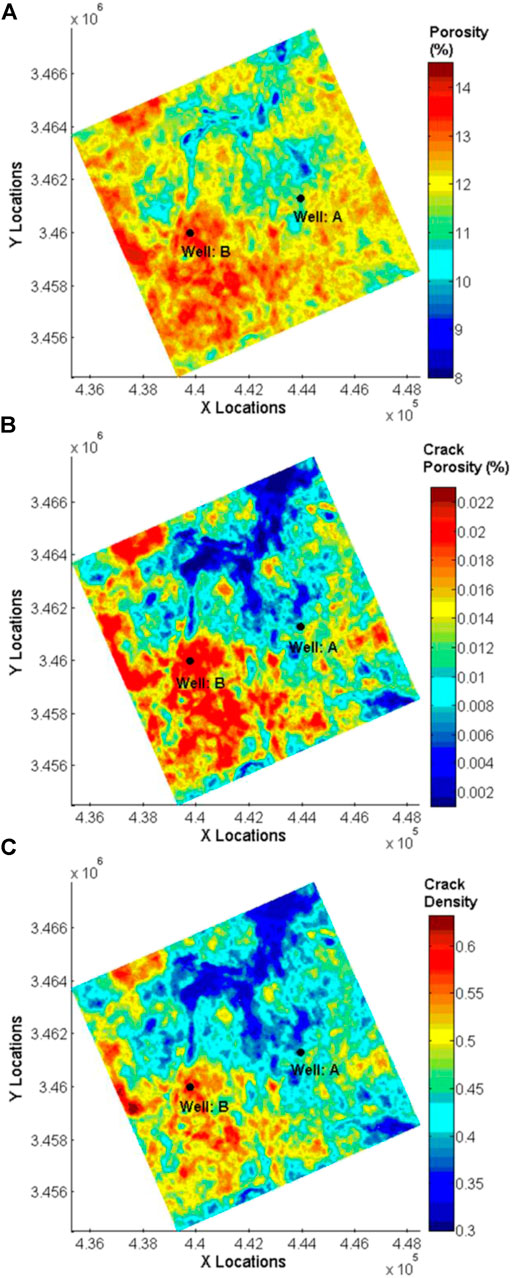
FIGURE 13. Horizontal sections of the estimated porosity (A), crack porosity (B) and crack density (C) by using the EIAS-Kjartansson model.
Conclusion
Rock-physics templates constitute an easy-to-use “tool-box” for pore microstructure properties interpretation from seismic data. We have implemented the EIAS-Zener model to describe the crack properties and elastic moduli of tight-gas sandstone reservoirs as a function of frequency from the seismic to the ultrasonic bands. Since P-wave impedance, mass density and VP/VS are sensitive to the pore and crack properties, we built the templates to estimate these attributes from seismic data. First, we calibrate the templates with ultrasonic, well-log and seismic data. Then, we estimate the total porosity and crack porosity and density from inversion of seismic data. The results indicate that these estimated attributes are consistent with the actual gas production reports. Thus, these templates can effectively be used to estimate the microstructure characteristics of tight-gas sandstone reservoirs based on seismic data.
Data Availability Statement
The raw data supporting the conclusions of this article will be made available by the authors, without undue reservation.
Author Contributions
WC: Methodology, writing original manuscript JB: Funding support, data and discussion, writing original manuscript, supervision JC: Model building, revising manuscript MP: Seismic data analysis CW: Ultrasonic experimental data analysis.
Funding
The authors are grateful to the support of the Jiangsu Innovation and Entrepreneurship Plan, Jiangsu Province Science Fund for Distinguished Young Scholars (BK20200021), National Natural Science Foundation of China (41974123), China Postdoctoral Science Foundation (2021M690863), Fundamental Research Funds for the Central Universities (B210202112) and the research funds from SINOPEC Key Laboratory of Geophysics.
Conflict of Interest
The authors declare that the research was conducted in the absence of any commercial or financial relationships that could be construed as a potential conflict of interest.
References
Aki, K., and Richards, P. G. (1980). Quantitative Seismology, Theory and Methods. San Francisco: W.H. Freeman and Company.
Anjos, S. M. C., De Ros, L. F., and Silva, C. M. A. (2003). Chlorite Authigenesis and Porosity Preservation in the Upper Cretaceous marine Sandstones of the Santos Basin, Offshore Eastern Brazil. Int. Assoc. Sedimentologists 34, 289–316. doi:10.1002/9781444304336.ch13
Ba, J., Xu, W., Fu, L.-Y., Carcione, J. M., and Zhang, L. (2017). Rock Anelasticity Due to Patchy Saturation and Fabric Heterogeneity: A Double Double-Porosity Model of Wave Propagation. J. Geophys. Res. Solid Earth 122 (3), 1949–1976. doi:10.1002/2016JB013882
Ba, J., Zhao, J., Carcione, J. M., and Huang, X. (2016). Compressional Wave Dispersion Due to Rock Matrix Stiffening by clay Squirt Flow. Geophys. Res. Lett. 43, 6186–6195. doi:10.1002/2016GL069312
Batzle, M., and Wang, Z. (1992). Seismic Properties of Pore Fluids. Geophysics 57 (11), 1396–1408. doi:10.1190/1.1443207
Berryman, J. G. (1995). Mixture Theories for Rock Propertie. A Handbook of Physical Constants. Washington, D C: American Geophysical Union, 205–228. doi:10.1029/RF003p0205
Carcione, J. M., and Avseth, P. (2015). Rock-physics Templates for clay-rich Source Rocks. Geophysics 80 (5), D481–D500. doi:10.1190/geo2014-0510.1
Carcione, J. M., Cavallini, F., Ba, J., Cheng, W., and Qadrouh, A. (2018). On the Kramers-Kronig Relations. Rheologica Acta 58 (1-2), 21–28. Available at: https://link.springer.com/article/10.1007%2Fs00397–018-1119–3. doi:10.1007/s00397-018-1119-3
Carcione, J. M., Farina, B., Poletto, F., Qadrouh, A. N., and Cheng, W. (2020). Seismic Attenuation in Partially Molten Rocks. Phys. Earth Planet. Interiors 309, 106568. doi:10.1016/j.pepi.2020.106568
Carcione, J. M., Gei, D., Picotti, S., and Michelini, A. (2012). Cross-hole Electromagnetic and Seismic Modeling for CO2 Detection and Monitoring in a saline Aquifer. J. Pet. Sci. Eng. 100, 162–172. doi:10.1016/j.petrol.2012.03.018
Carcione, J. M. (2014). Wave Fields in Real Media. Theory and Numerical Simulation of Wave Propagation in Anisotropic, Anelastic, Porous and Electromagnetic media. Third edition. Elsevier extended and revised.
Cheng, W., Ba, J., Fu, L.-Y., and Lebedev, M. (2019). Wave-velocity Dispersion and Rock Microstructure. J. Pet. Sci. Eng. 183, 106466. doi:10.1016/j.petrol.2019.106466
Cheng, W., Carcione, J. M., Qadrouh, A. N., Alajmi, M., and Ba, J. (2020). Rock Anelasticity, Pore Geometry and the Biot-Gardner Effect. Rock Mech. Rock Eng. 53, 3969–3981. doi:10.1007/s00603-020-02155-7
David, E. C., Fortin, J., Schubnel, A., Guéguen, Y., and Zimmerman, R. W. (2013). Laboratory Measurements of Low- and High-Frequency Elastic Moduli in Fontainebleau sandstone. Geophysics 78 (5), D369–D379. doi:10.1190/geo2013-0070.1
Deng, J., Zhou, H., Wang, H., Zhao, J., and Wang, S. (2015). The Influence of Pore Structure in Reservoir sandstone on Dispersion Properties of Elastic Waves. Chin. J. Geophysics-Chinese 58 (9), 3389–3400. doi:10.6038/cjg20150931
Dvorkin, J., Walls, J., and Davalos, G. (2020). Velocity-Porosity-Mineralogy Model for Unconventional Shale and its Applications to Digital Rock Physics. Front. Earth Sci. 8. doi:10.3389/feart.2020.613716
Endres, A. L., and Knight, R. J. (1997). Incorporating Pore Geometry and Fluid Pressure Communication into Modeling the Elastic Behavior of Porous Rocks. Geophysics 62 (1), 106–117. doi:10.1190/1.1444110
Fu, B.-Y., Guo, J., Fu, L.-Y., Glubokovskikh, S., Galvin, R. J., and Gurevich, B. (2018). Seismic Dispersion and Attenuation in Saturated Porous Rock with Aligned Slit Cracks. J. Geophys. Res. Solid Earth 123, 6890–6910. doi:10.1029/2018JB015918
Gegenhuber, N., and Pupos, J. (2015). Rock Physics Template from Laboratory Data for Carbonates. J. Appl. Geophys. 114, 12–18. doi:10.1016/j.jappgeo.2015.01.005
Guan, D. S., and Niu, J. Y. (1995). Unconventional Oil and Gas Geology in China. Beijing: Petroleum Industry Press, 60–85.
Guo, M.-Q., Fu, L.-Y., and Ba, J. (2009). Comparison of Stress-Associated Coda Attenuation and Intrinsic Attenuation from Ultrasonic Measurements. Geophys. J. Int. 178, 447–456. doi:10.1111/j.1365-246X.2009.04159.x
Guo, M. Q., Ba, J., Ma, R. P., Chen, T. S., Zhang, L., Pang, M. Q., et al. (2018). P-wave Velocity Dispersion and Attenuation in Fluid-Saturated Tight Sandstones: Characteristics Analysis Based on a Double Double-Porosity Structure Model Description. Chin. J. Geophys. 61 (3), 1053–1068. doi:10.6038/cji2018L0678
Hao, Z., Ba, J., Zhang, L., Zeng, Q., JiangLiu, R. J., Qian, W., et al. (2016). Rock Physics Inversion Workflow on Reservoir Parameters: A Case Study of Seismic Hydrocarbon Detection in Large-Area Tight Dolomite Reservoirs. J. Seismic Exploration 25, 561–588.
Harmelen, A. V., and Weijermars, R. (2018). Complex Analytical Solutions for Flow in Hydraulically Fractured Hydrocarbon Reservoirs with and without Natural Fractures. Appl. Math. Model. 56, 137–157. doi:10.1016/j.apm.2017.11.027
Khlaifat, A., Qutob, H., and Barakat, N. (2011). Tight Gas Sands Development Is Critical to Future World Energy Resources. Society of Petroleum Engineers, 1–12. doi:10.2118/142049-MS
Kjartansson, E. (1979). ConstantQ-wave Propagation and Attenuation. J. Geophys. Res. 84, 4737–4748. doi:10.1029/jb084ib09p04737
Li, H. B., Zhang, J. J., Cai, S. J., and Pan, H. J. (2019). 3D Rock Physics Template for Reservoir with Complex Pore Structure. Chin. J. Geophys. (in Chinese) 62, 2711–2723. doi:10.6038/cjg2019K0672
Liu, L., Tang, D., Wo, Y., Liu, L., and Sun, W. (2019). Favorable Area Prediction of Tight sandstone: A Case Study of the He8 Formation in the Kangning Area, Eastern Ordos Basin, China. J. Pet. Sci. Eng. 175, 430–443. doi:10.1016/j.petrol.2018.12.069
Mavko, G., Mukerji, T., and Dvorkin, J. (2009). The Rock Physics Handbook. Cambridge Univ. Press. doi:10.1017/cbo9780511626753
Pang, M., Ba, J., Carcione, J. M., Picotti, S., Zhou, J., and Jiang, R. (2019). Estimation of Porosity and Fluid Saturation in Carbonates from Rock-Physics Templates Based on Seismic Q. Geophysics 84 (6), M25–M36. doi:10.1190/geo2019-0031.1
Pang, M., Ba, J., Carcione, J., Vesnaver, A., Ma, R., and Chen, T. (2020b). Analysis of Attenuation Rock-Physics Template of Tight Sandstones: Reservoir Microcrack Prediction. Chin. J. Geophys. 63, 4205–4219.
Pang, M., Ba, J., Fu, L. Y., Carcione, J. M., Markus, U., and Zhang, L. (2020a). Estimation of Microfracture Porosity in Deep Carbonate Reservoirs Based on 3d Rock-Physics Templates. Interpretation 8 (4), 1–41. doi:10.1190/int-2019-0258.1
Pervukhina, M., Gurevich, B., Dewhurst, D. N., and Siggins, A. F. (2010). Applicability of Velocity-Stress Relationships Based on the Dual Porosity Concept to Isotropic Porous Rocks. Geophys. J. Int. 181, 1473–1479. doi:10.1111/j.1365-246X.2010.04535.x
Pride, S. R., Berryman, J. G., and Harris, J. M. (2004). Seismic Attenuation Due to Wave-Induced Flow. J. Geophys. Res. 109 (B1). doi:10.1029/2003jb002639
Smith, T. M., Sayers, C. M., and Sondergeld, C. H. (2009). Rock Properties in Low-Porosity/low-Permeability Sandstones. The Leading Edge 28 (1), 48–59. doi:10.1190/1.3064146
Stroker, T. M., Harris, N. B., Crawford Elliott, W., and Marion Wampler, J. (2013). Diagenesis of a Tight Gas Sand Reservoir: Upper Cretaceous Mesaverde Group, Piceance Basin, Colorado. Mar. Pet. Geology. 40, 48–68. doi:10.1016/j.marpetgeo.2012.08.003
Sun, Y., Carcione, J. M., and Gurevich, B. (2020). Squirt-flow Seismic Dispersion Models: A Comparison. Geophys. J. Internat. 222, 2068–2082. doi:10.1093/gji/ggaa274
Sun, Y. F., and Goldberg, D. (1997). Estimation of Aspect-Ratio Changes with Pressure from Seismic Velocities. Geol. Soc. Lond. Spec. Publications 122, 131–139. doi:10.1144/GSL.SP.1997.122.01.10
Tan, W., Ba, J., Müller, T., Fang, G., and Zhao, H. (2020). Rock Physics Model of Tight Oil Siltstone for Seismic Prediction of Brittleness. Geophys. Prospecting 68 (5), 1554–1574. doi:10.1111/1365-2478.12938
Tang, X. M. (2011). A Unified Theory for Elastic Wave Propagation through Porous media Containing Cracks—An Extension of Biot’s Poroelastic Wave Theory. Sci. China Earth Sci. (In Chinese) 41 (6), 784–795.
Thomsen, L. (1995). Elastic Anisotropy Due to Aligned Cracks in Porous Rock1. Geophys. Prospect 43, 805–829. doi:10.1111/j.1365-2478.1995.tb00282.x
Vernik, L., and Kachanov, M. (2010). Modeling Elastic Properties of Siliciclastic Rocks. Geophysics 75 (6), E171–E182. doi:10.1190/1.3494031
Walsh, J. B. (1965). The Effect of Cracks on the Compressibility of Rock. J. Geophys. Res. 70, 381–389. doi:10.1029/JZ070i002p00381
Wang, H., Toksöz, M. N., and Fehler, M. C. (2020). Borehole Acoustic Logging – Theory and Methods. Petroleum Engineering. doi:10.1007/978-3-030-51423-5
Xiao, Z., Ding, W., Liu, J., Tian, M., Yin, S., Zhou, X., et al. (2019). A Fracture Identification Method for Low-Permeability sandstone Based on R/S Analysis and the Finite Difference Method: A Case Study from the Chang 6 Reservoir in Huaqing Oilfield, Ordos Basin. J. Pet. Sci. Eng. 174, 1169–1178. doi:10.1016/j.petrol.2018.12.017
Yin, H., Zhao, J., Tang, G., Zhao, L., Ma, X., and Wang, S. (2017). Pressure and Fluid Effect on Frequency-dependent Elastic Moduli in Fully Saturated Tight sandstone. J. Geophys. Res. Solid Earth 122, 8925–8942. doi:10.1002/2017JB014244
Zhang, L., Ba, J., Fu, L., Carcione, J. M., and Cao, C. (2019). Estimation of Pore Microstructure by Using the Static and Dynamic Moduli. Int. J. Rock Mech. Mining Sci. 113, 24–30. doi:10.1016/j.ijrmms.2018.11.005
Keywords: tight-gas sandstone, rock-physics templates, porosity, crack porosity, EIAS-Zener model, attenuation
Citation: Cheng W, Ba J, Carcione JM, Pang M and Wu C (2021) Estimation of the Pore Microstructure of Tight-Gas Sandstone Reservoirs with Seismic Data. Front. Earth Sci. 9:646372. doi: 10.3389/feart.2021.646372
Received: 26 December 2020; Accepted: 07 June 2021;
Published: 29 June 2021.
Edited by:
Xin Li, China National Offshore Oil Corporation, ChinaReviewed by:
Luca De Siena, Johannes Gutenberg University Mainz, GermanyDavid Iacopini, University of Naples Federico II, Italy
Tingting Gu, Purdue University, United States
Copyright © 2021 Cheng, Ba, Carcione, Pang and Wu. This is an open-access article distributed under the terms of the Creative Commons Attribution License (CC BY). The use, distribution or reproduction in other forums is permitted, provided the original author(s) and the copyright owner(s) are credited and that the original publication in this journal is cited, in accordance with accepted academic practice. No use, distribution or reproduction is permitted which does not comply with these terms.
*Correspondence: Jing Ba, amluZ2JhQDE4OC5jb20=