 Xinyang Zhou1
 Jing Ba
 José M. Carcione
 Li-Yun Fu
- 1School of Earth Sciences and Engineering, Hohai University, Nanjing, China
- 2Laboratorio de Geofísica Numérica, Instituto del Gas y del Petróleo, Facultad de Ingeniería, Universidad de Buenos Aires, Buenos Aires, Argentina
- 3Department of Mathematics, Purdue University, West Lafayette, IN, United States
- 4National Institute of Oceanography and Applied Geophysics, Trieste, Italy
- 5Key Laboratory of Deep Oil and Gas, China University of Petroleum, Qingdao, China
We develop a methodology, based on rock-physics templates, to effectively identify reservoir fluids in ultra-deep reservoirs, where the poroelasticity model is based on the double double-porosity theory. P-wave attenuation, the ratio of the first Lamé constant to mass density (λ/ρ) and Poisson ratio are used to build the templates at the ultrasonic and seismic frequency bands to quantitatively predict the total and crack (soft) porosities and oil saturation. Attenuation on these frequency bands is estimated with the spectral-ratio and frequency-shift methods. We apply the methodology to fault-controlled karst reservoirs in the Tarim Basin (China), which contain ultra-deep hydrocarbon resources with a diverse pore-crack system, low porosity/permeability and complex oil-water spatial distributions. The results are consistent with well-log data and actual oil recovery. Crack porosity can be used as an indicator to find regions with high oil saturation, since high values implies a good pore connectivity.
Introduction
With the depletion of relatively shallow conventional reservoirs, ultra-deep resources will become an important target for oil and gas exploration. Carbonate reservoirs are typical examples (e.g., Zou et al., 2014), which, due to their burial depth and high degree of diagenesis, their pay zone is located in areas with secondary pores or cracks (or rift caves and karst caves) (Pang, 2010). The tectonic action, abnormal high pressure, the presence of fractures and thermal fluid activity favor the development of this secondary pore space. Fracture-cavern carbonate reservoirs are among the most important types (Tian et al., 2017; Li et al., 2019). A “fault-controlled karst reservoir” is a large-scale fracture-cavern carbonate reservoir formed by a series of geological processes including the dissolution of atmospheric fresh water or hydrothermal fluid that flows along faults and associated complex fracture system under unexposed conditions (Lan et al., 2015).
The fabric of carbonate rocks has at least two dissimilar porosities, leading to a heterogeneous distribution of immiscible fluids or patchy saturation (Ba et al., 2017). Early models consider a single porosity, such as that of White (1975), who assumed patchy saturation with spherical gas inclusions, and a generalization to non-spherical patches by Johnson (2001). Then, Pride et al. (2004) studied attenuation caused by patchy saturation based on a double-porosity theory, while Dvorkin and Nur (1993) combined the Biot and squirt flow mechanisms into a set of poroelasticity equations, explicitly considering attenuation due to global flow at cracks or grain contacts. The model has been applied to predict wave velocity and attenuation (Dvorkin et al., 1994, 1995). Deng et al. (2015) extended the squirt-flow model and Tang (2011) analyzed the effect of fractures on the elastic waves. Ba et al. (2011) introduced the Biot-Rayleigh theory to model wave propagation in double-porosity media with a single saturating fluid, and Ba et al. (2017) extended this model to the case of two fluids, i.e., a double double-porosity medium model (DDP).
Rock-physics templates (RPT) relate the reservoir and seismic properties (Odegaard and Avseth, 2004; Carcione and Avseth, 2015). For instance, Chi and Han (2009) interpreted the lithology and obtained fluid content by using RPTs and logging data, and RPTs were used to compute reservoir porosity and oil/gas saturation by Michel (2010). Picotti et al. (2018) analyzed the effects of different fluid saturations, porosities, and permeabilities on seismic waves, and introduced an attenuation RPT for sandstone reservoirs. Pang et al. (2020) estimated the microfracture porosity in carbonate reservoirs by using these attenuation templates. Tran et al. (2020) predicted organic matter content of source rocks using RPTs.
Building a RPT implies to choose the proper properties sensitive to lithology or fluid type and saturation (Batzle et al., 2001; Dillon et al., 2003; Qiao and An, 2007). Goodway et al. (1997) proposed to identify and detect reservoir fluids by using the Lamé constants. Hedlin (2000) proposed the pore modulus as a fluid recognition factor through experiments to distinguish shale, calcite, gas sand, oil sand, and wet sand. The Gassmann fluid term and its product with mass density were used as a fluid discriminator by Russell et al. (2003, 2006), and Quakenbush et al. (2006) used Poisson’s ratio for the same purpose. Quintal (2012) suggested that frequency-dependent attenuation due to wave-induced fluid flow is a potential index of saturation, and Xue et al. (2017) used a combination of the normal crack compliance of the saturated and dry rocks as a fluid factor.
We choose P-wave attenuation, Poisson’s ratio and the ratio of the first Lamé constant to mass density (λ/ρ) to build the templates at ultrasonic and seismic frequencies, based on the DDP theory, and associate the total and crack porosities and oil saturation to the seismic properties. The theory considers the effects of fabric heterogeneity and heterogeneous distribution of immiscible fluids. Ultrasonic, well-log and seismic data are used to calibrate the templates. Then, these are applied to quantitatively predict the rock properties and oil saturation.
Rock-Physics Model
Overview of the Work Area
The area is located at the Tarim Basin, China, and the reservoir section is constituted by the upper members of the Yijianfang to Yingshan formation (Ordovician), formed during the Caledonian-Hercynian period. It is a marine fault-controlled karst reservoir (Li et al., 2019). The multi-stage fault activity has a controlling effect on the accumulation and distribution of oil and gas in the reservoir. Fractures and fluid transformation have formed a diverse reservoir system including dissolved pores, inter-crystalline pores and cracks, which make the structure quite complex (Lan et al., 2015). The reservoir along the fault zone is oil-bearing and unevenly enriched. It is characterized by an ultra-deep burial (>7 km), high temperature (>150°C) and high pressure (>160 MPa). Figure 1A shows a diagram of the reservoir, where the orange color represents caverns and vugs, and the black lines represent cracks.
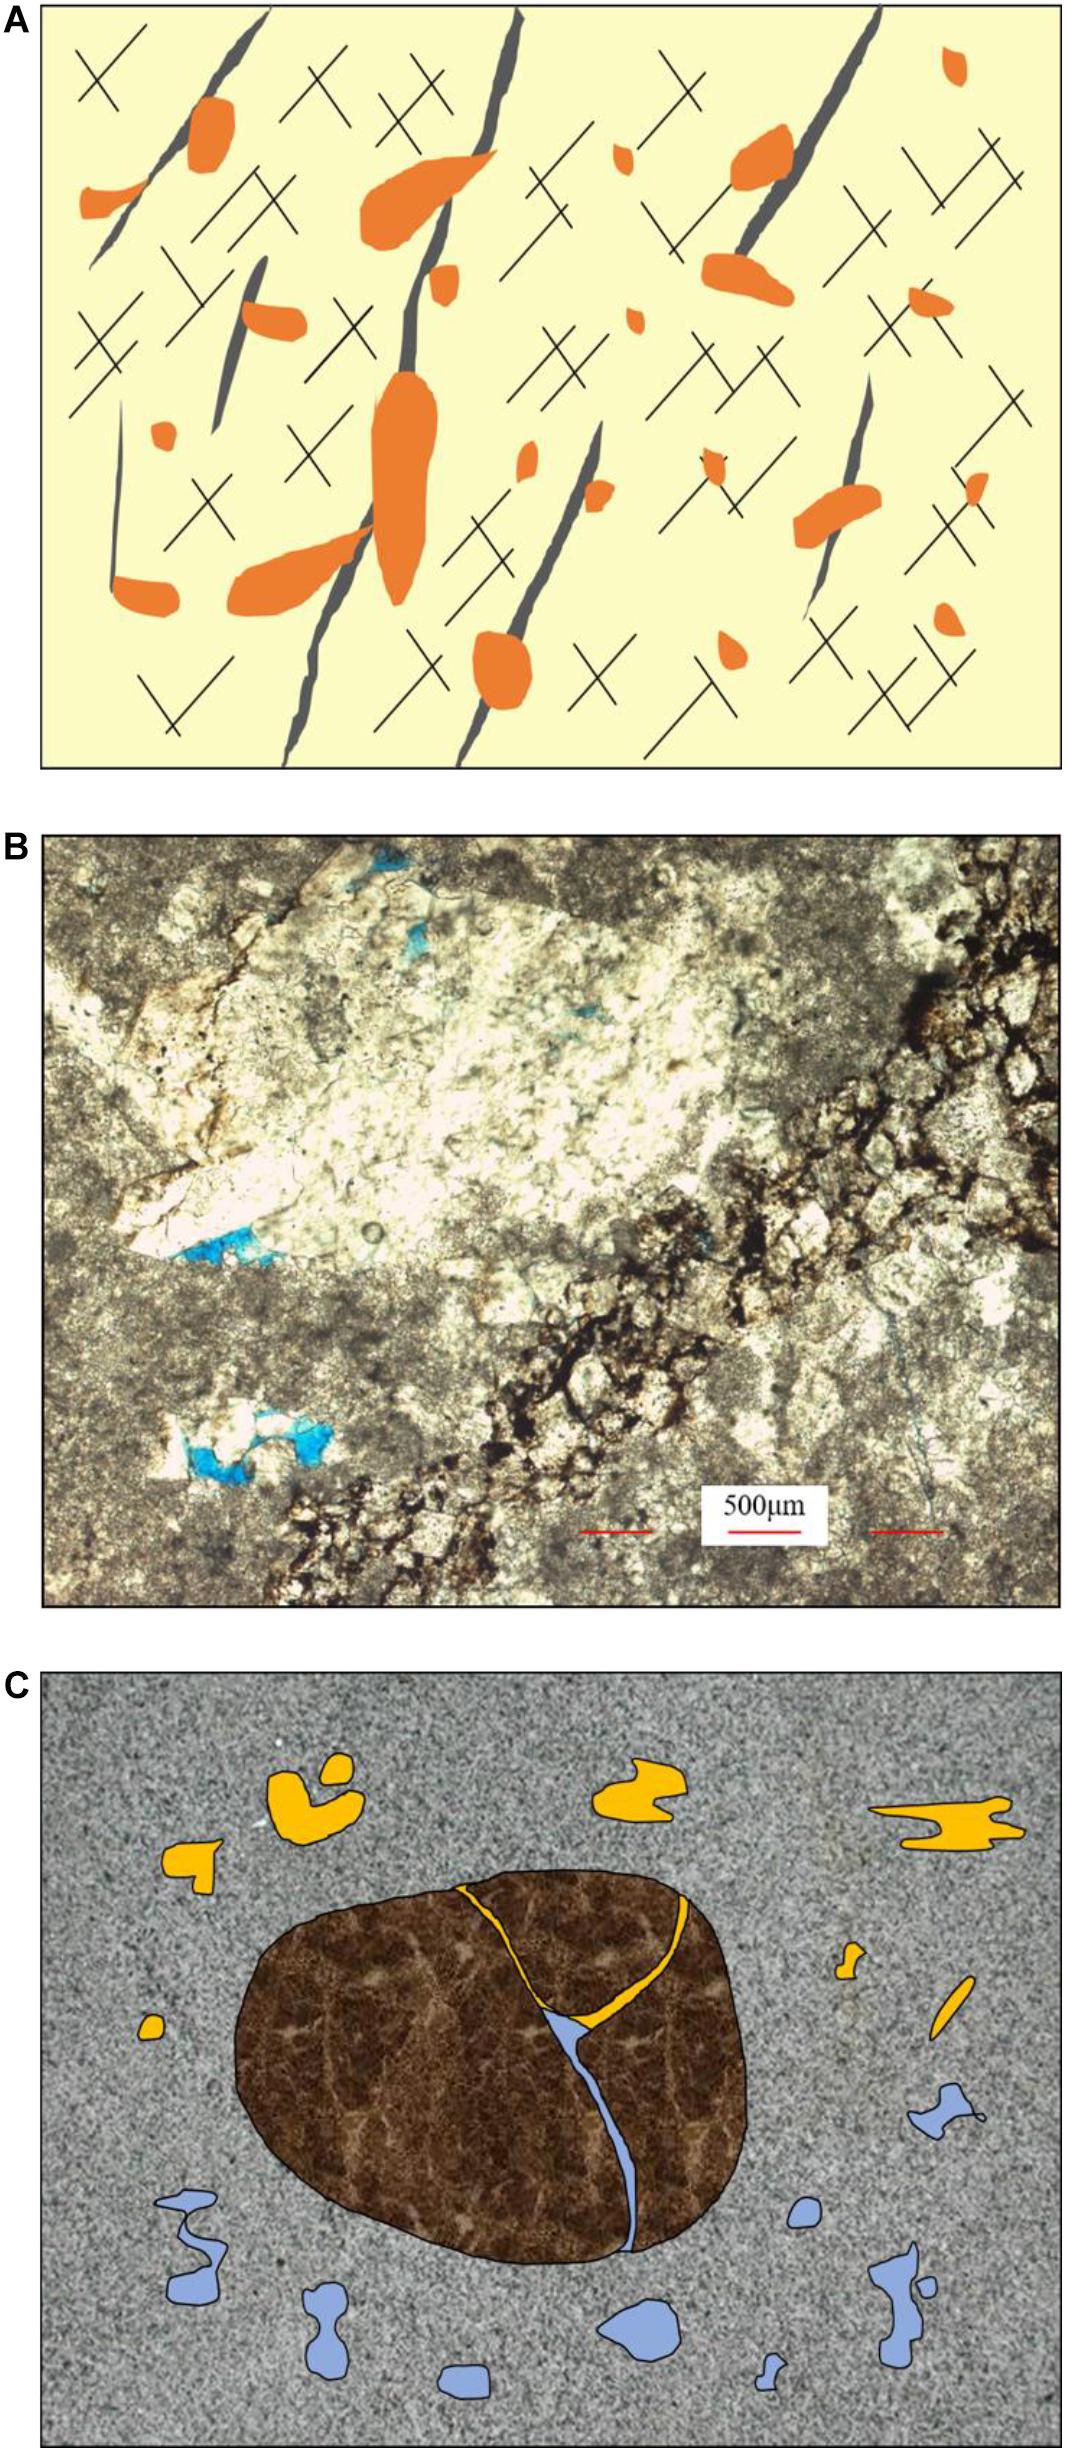
Figure 1. (A) Schematic of a fault-controlled karst reservoir (orange represents caverns and vugs, while black refers to cracks); (B) thin section of a carbonate sample; (C) schematic of a double-porosity structure with patchy saturation of fluids (two skeletons and two fluids; orange represents oil and blue is water).
Figure 1B shows a thin section of a rock sample collected at a depth of 7443 m. The lithology is limestone, with a dolomite content of 6% and a calcite content of 94%. Dissolution of pores and multiple cracks of various diameters are observed and the surface porosity is extremely low (less than 1%).
Rock-Physics Modeling Flowchart
The reservoir characteristics are simplified with a double-porosity structure with cracks and pores and saturation with two immiscible fluides, oil and water (Figure 1C). Figure 2 shows the flowchart of the modeling methodology, which can be summarized as follows.
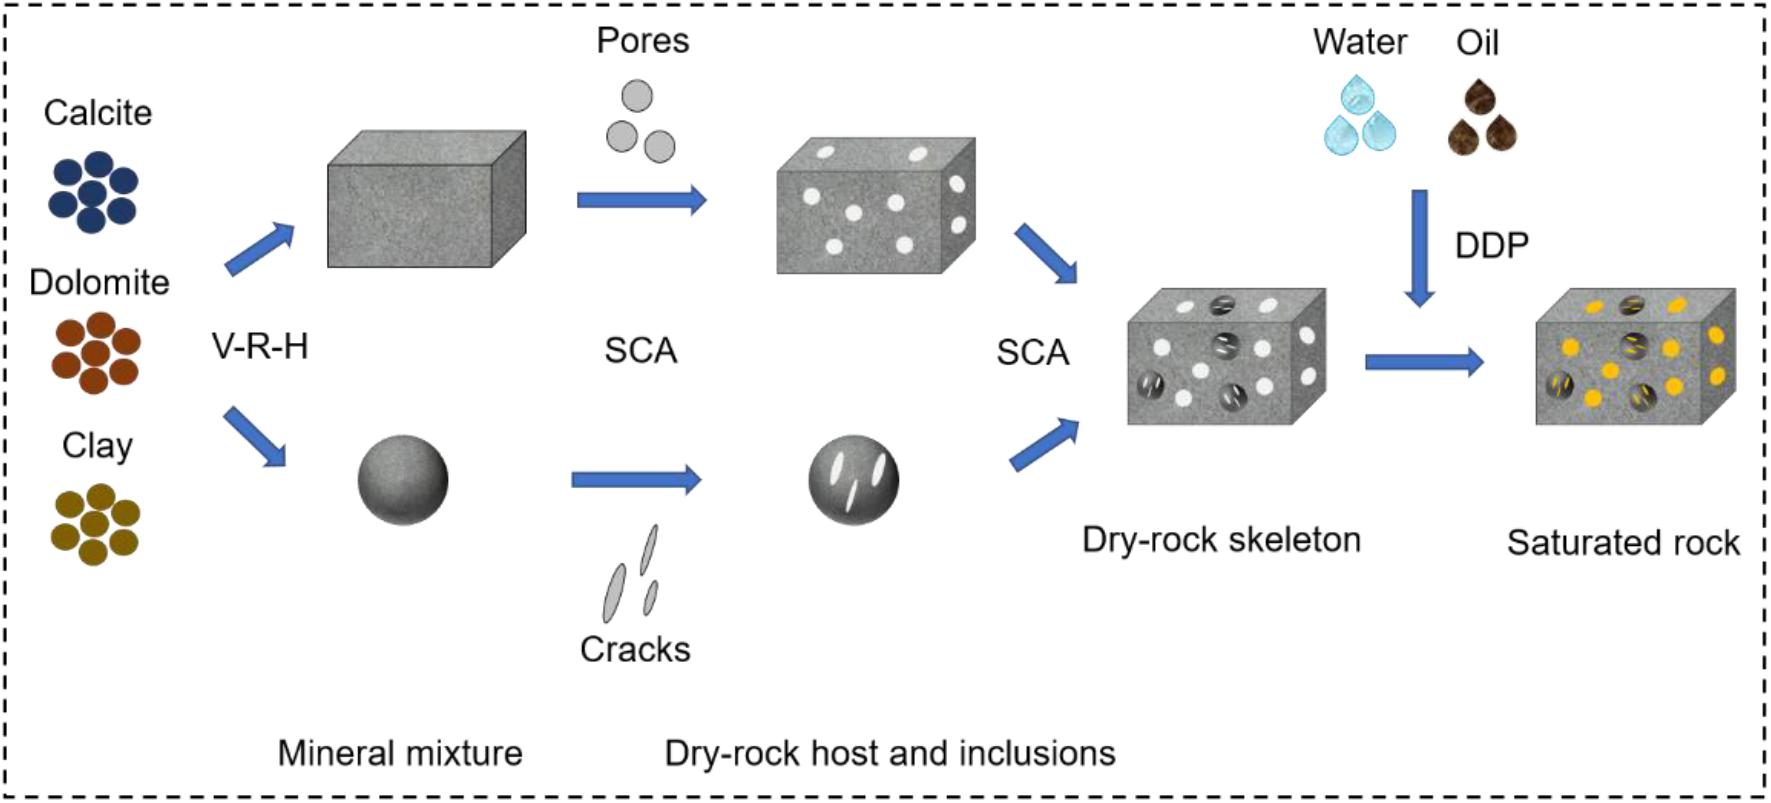
Figure 2. Flowchart of the rock-physics modeling.
(1) The minerals are mainly calcite and a small amount of dolomite and clay. The Voigt-Reuss-Hill (VRH) equation (see Supplementary Appendix Eq. A1) is used to calculate the elastic moduli of the mineral mixture (Voigt, 1910; Reuss, 1929; Hill, 1952). The bulk and shear moduli of calcite, dolomite, and clay are 63.7 and 31.7, 76.4 and 49.7, and 21 and 7 GPa, respectively (Mavko et al., 2009).
(2) The pores and cracks are assumed spherical and oblate in shape (Shapiro, 2003), with aspect ratios of 1 and 0.00035 (generally in range of 10–5∼10–4, according to Tan et al., 2020 and Pimienta et al., 2015), respectively. The connectivity of these two kinds of pores affects P-wave attenuation and dispersion, as well as the elastic parameters (Agersborg et al., 2008). In this model, the two pore systems are connected and the composite medium is isotropic. Based on the self-consistent approximation (SCA) (Berryman, 1980, 1992, 1998), the pores and cracks are treated as inclusions and mixed with the minerals to obtain two partial dry-rock elastic moduli and then mixed again with the SCA model to obtain the dry-rock elastic moduli. At this point, the frame (or skeleton) is a double-porosity structure. The relevant equations are given in Supplementary Appendix Eq. A2.
(3) The volume content of the host medium v1 and the volume content of inclusion v2 satisfy v1 + v2 = 1. The total porosity ϕ = ϕ10⋅v1 + ϕ20⋅v2, where ϕ10 is the porosity of the host medium and ϕ20 is the porosity of the inclusions, and the crack porosity is ϕc = ϕ20⋅v2. ϕ20 is 0.006 (in range of 0.005∼0.1, by considering that a larger cracked grain is modeled as a cylinder of axial length around 100 μm, containing a transverse crack with an average effective aperture of several microns, according to Pride et al., 2004; Pang et al., 2020, and Ba et al., 2017). The stiff porosity is ϕs = ϕ−ϕc.
The equations proposed by Batzle and Wang (1992) are used to estimate the bulk moduli, densities, and viscosity of the fluids at 180°C and 80 MPa. The bulk modulus, density, and viscosity of oil and water in the oil-water mixture are 0.79 and 2.2 GPa, 0.70 and 0.93 g/cm3, and 0.002289 and 0.000647 Pa s, respectively. Then, fluid substitution is performed by using the DDP theory to obtain the acoustic properties. The main skeleton is composed of two components, namely, a host one with dissolved pores and an inclusion one with cracks, and each of them is patchy saturated. Each component can be considered as a secondary double-porosity structure, i.e., two pore phases saturated with different fluids (there are four types of pores globally). By performing a plane-wave analysis (see Supplementary Appendix Eq. A5), we obtain the P-wave velocity and attenuation.
3D RPTs
P-Wave Phase Velocity and Attenuation
The stiff porosity, crack porosity, and oil saturation are basic factors related to oil production in reservoirs. First, we study the effects of these properties on P-wave velocity and attenuation in the frequency range of 101∼108Hz. Attenuation is represented by the dissipation factor, defined as 1000/Q, where Q is the quality factor. Oil saturation is 100%, stiff porosity is 6%, crack porosity is 0.06%. In the analysis, we vary one property and set the others constant. The fluid patch radius of the host medium is 50 μm, the inclusion radius is 50 μm (at pore/grain scale), and the fluid patch radius in the inclusion is 5 μm.
Figures 3A,B show the effect of the stiff porosity on the P-wave phase velocity and dissipation factor, respectively, where it can be seen that velocity dispersion and attenuation increase with increasing porosity and the relaxation peaks move slightly to the low frequencies. Figure 4 shows that increasing crack porosity, the velocity dispersion becomes stronger, attenuation increases and the peaks move to the high frequencies, while Figure 5 indicates that dispersion and attenuation increase with increasing oil saturation, and the peaks move to the low frequencies.
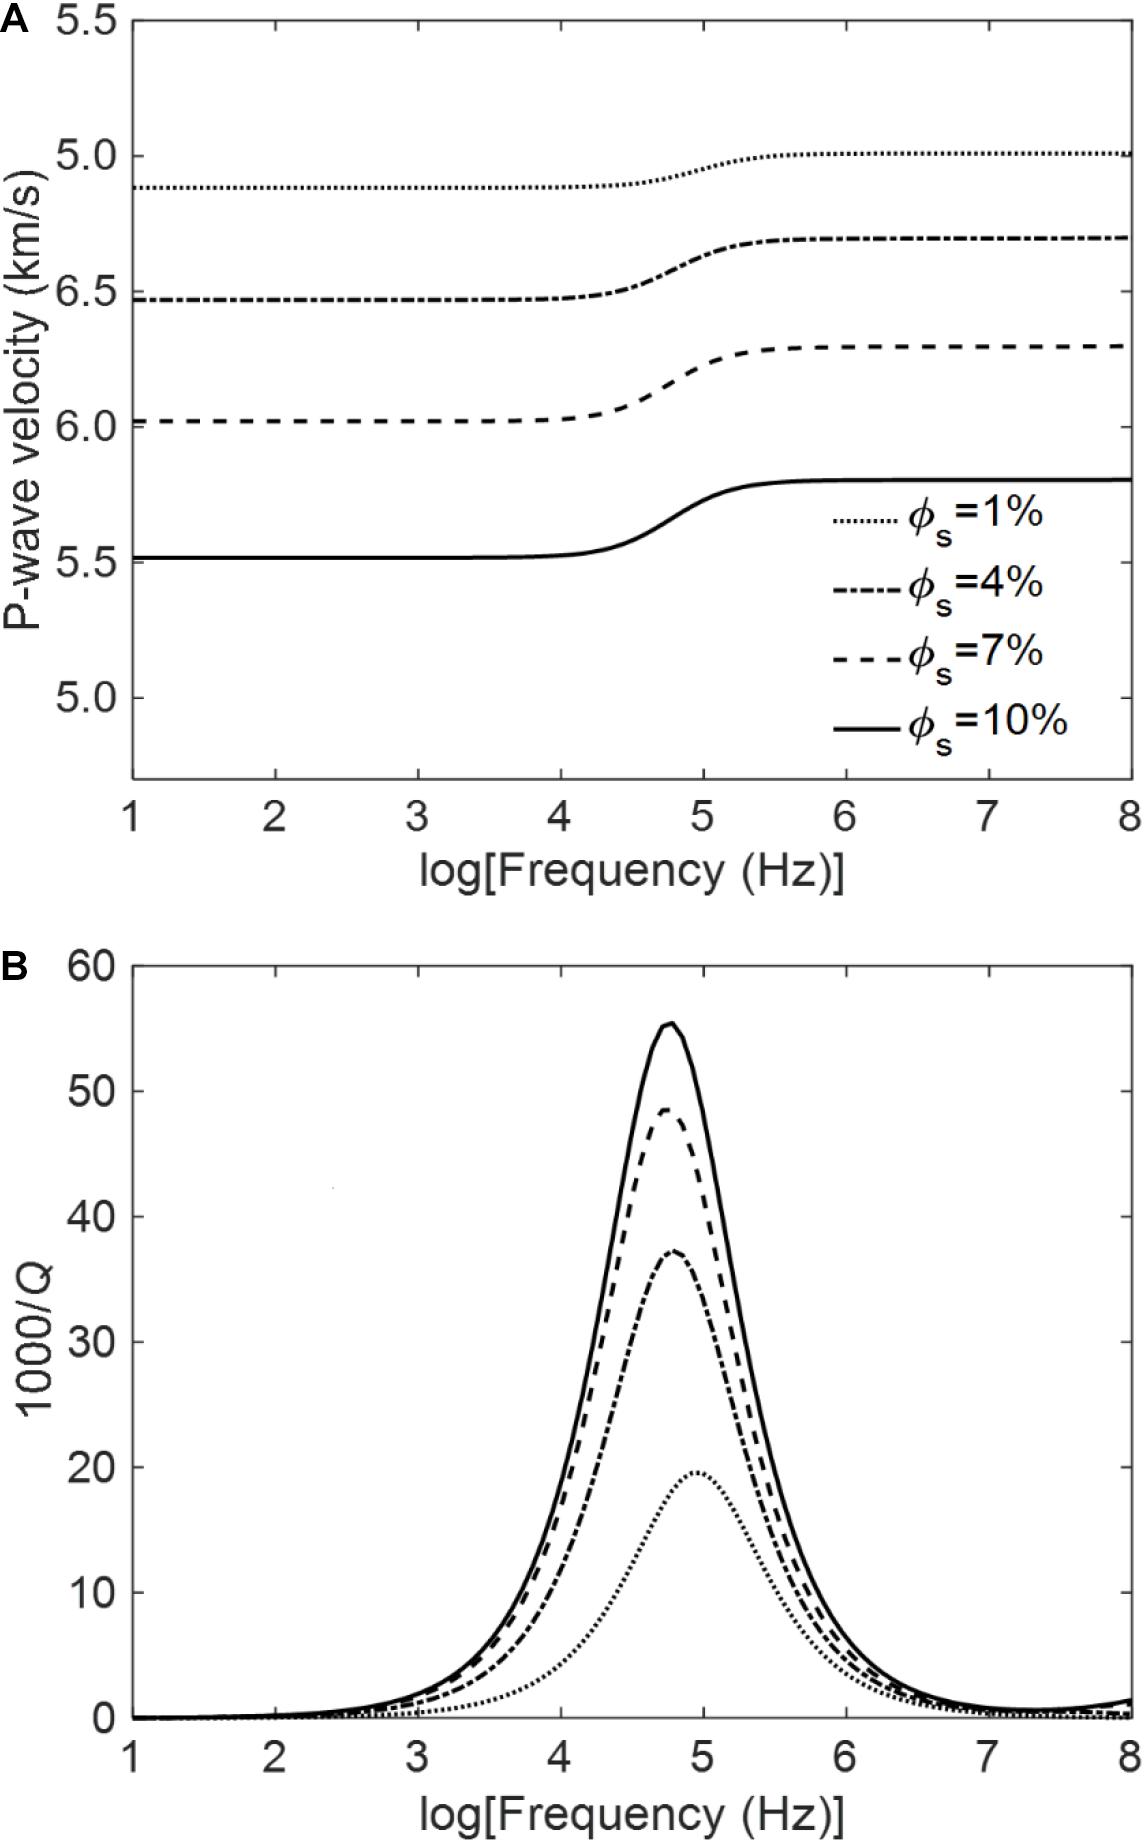
Figure 3. P-wave velocity (A) and attenuation (B) as a function of frequency for varying stiff porosity.
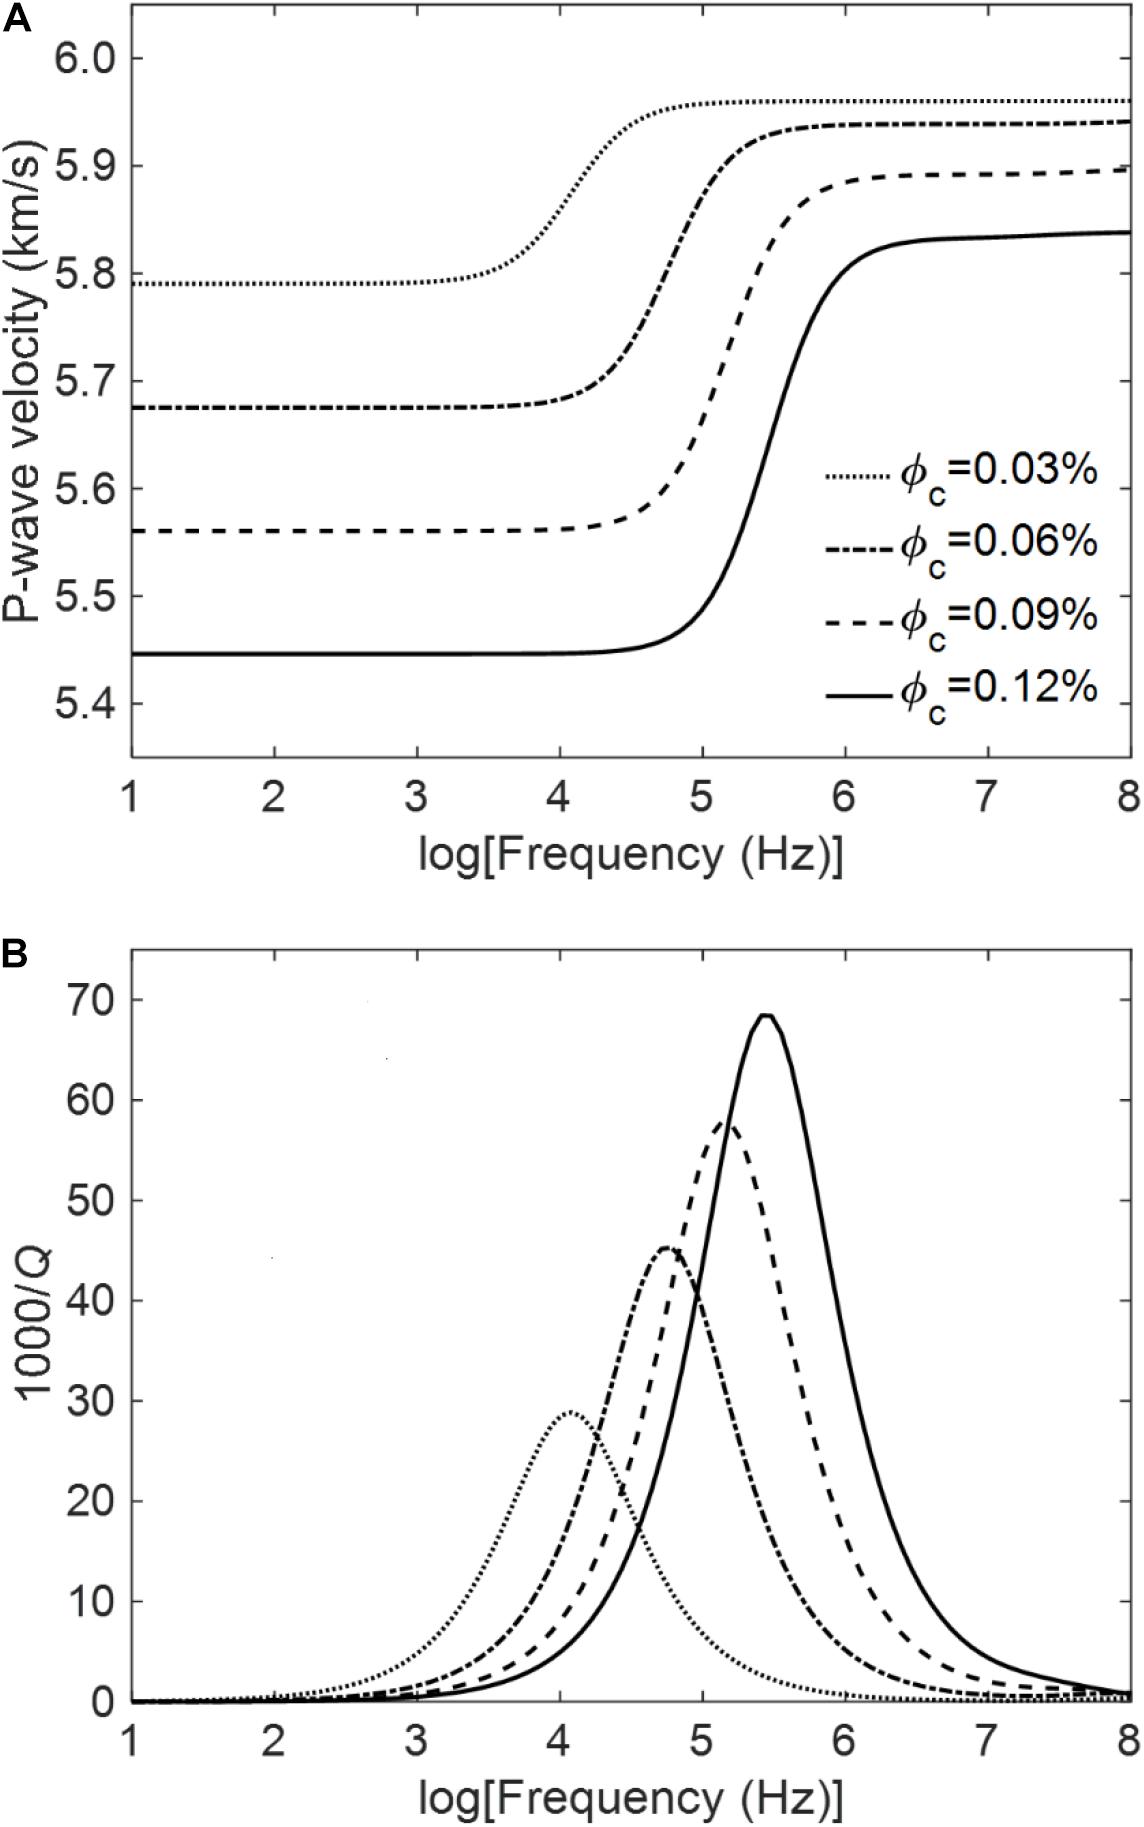
Figure 4. P-wave velocity (A) and attenuation (B) as a function of frequency for varying crack (soft) porosity.
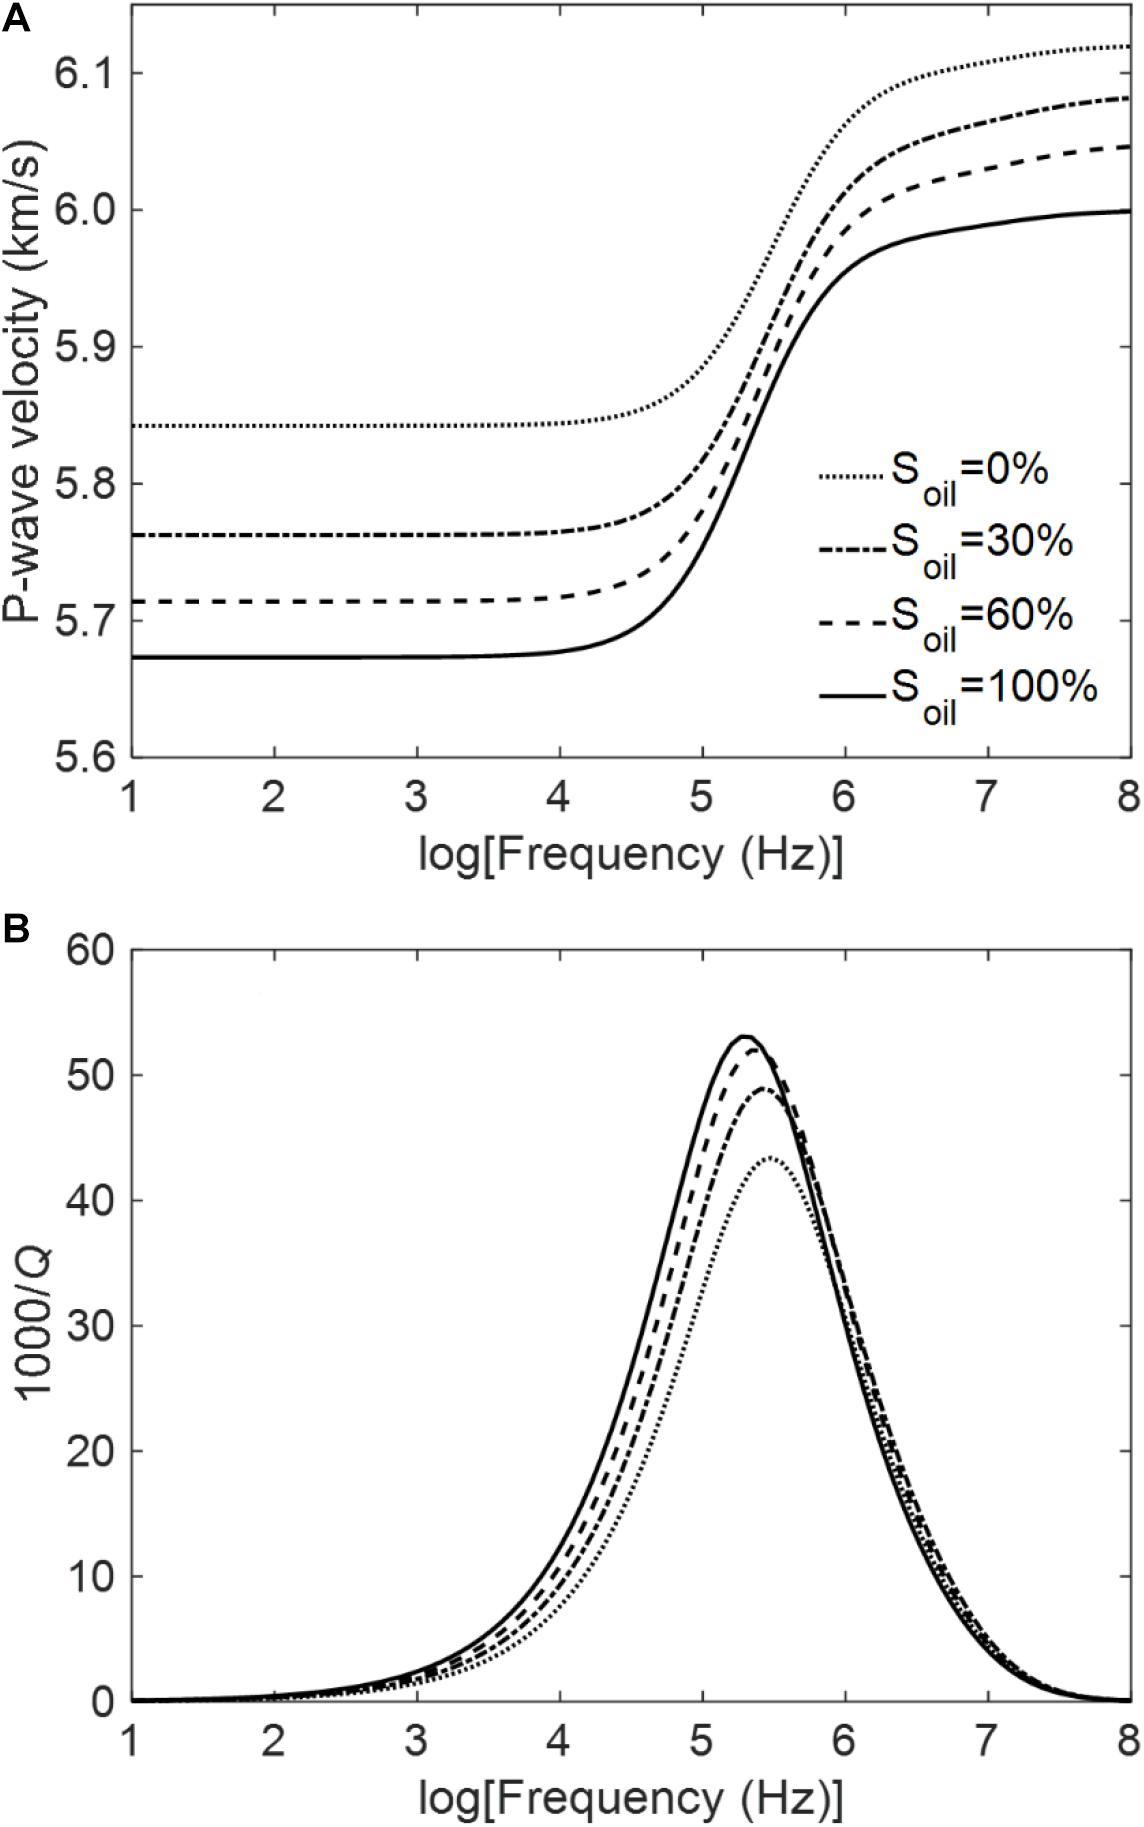
Figure 5. P-wave velocity (A) and attenuation (B) as a function of frequency for varying oil saturation.
Fluid Identification Factors
Poisson’s ratio and λ/ρ are used to identify the fluids (Goodway et al., 1997; Quakenbush et al., 2006). Figures 6, 7 show the effects of stiff porosity, crack porosity, and oil saturation at 1 MHz, respectively. As can be seen, increasing stiff porosity and oil saturation, λ/ρ gradually decreases, while increasing crack porosity has the opposite effect. On the other hand (Figure 7), Poisson’s ratio increases with increasing stiff and crack porosities and decreases with increasing saturation.
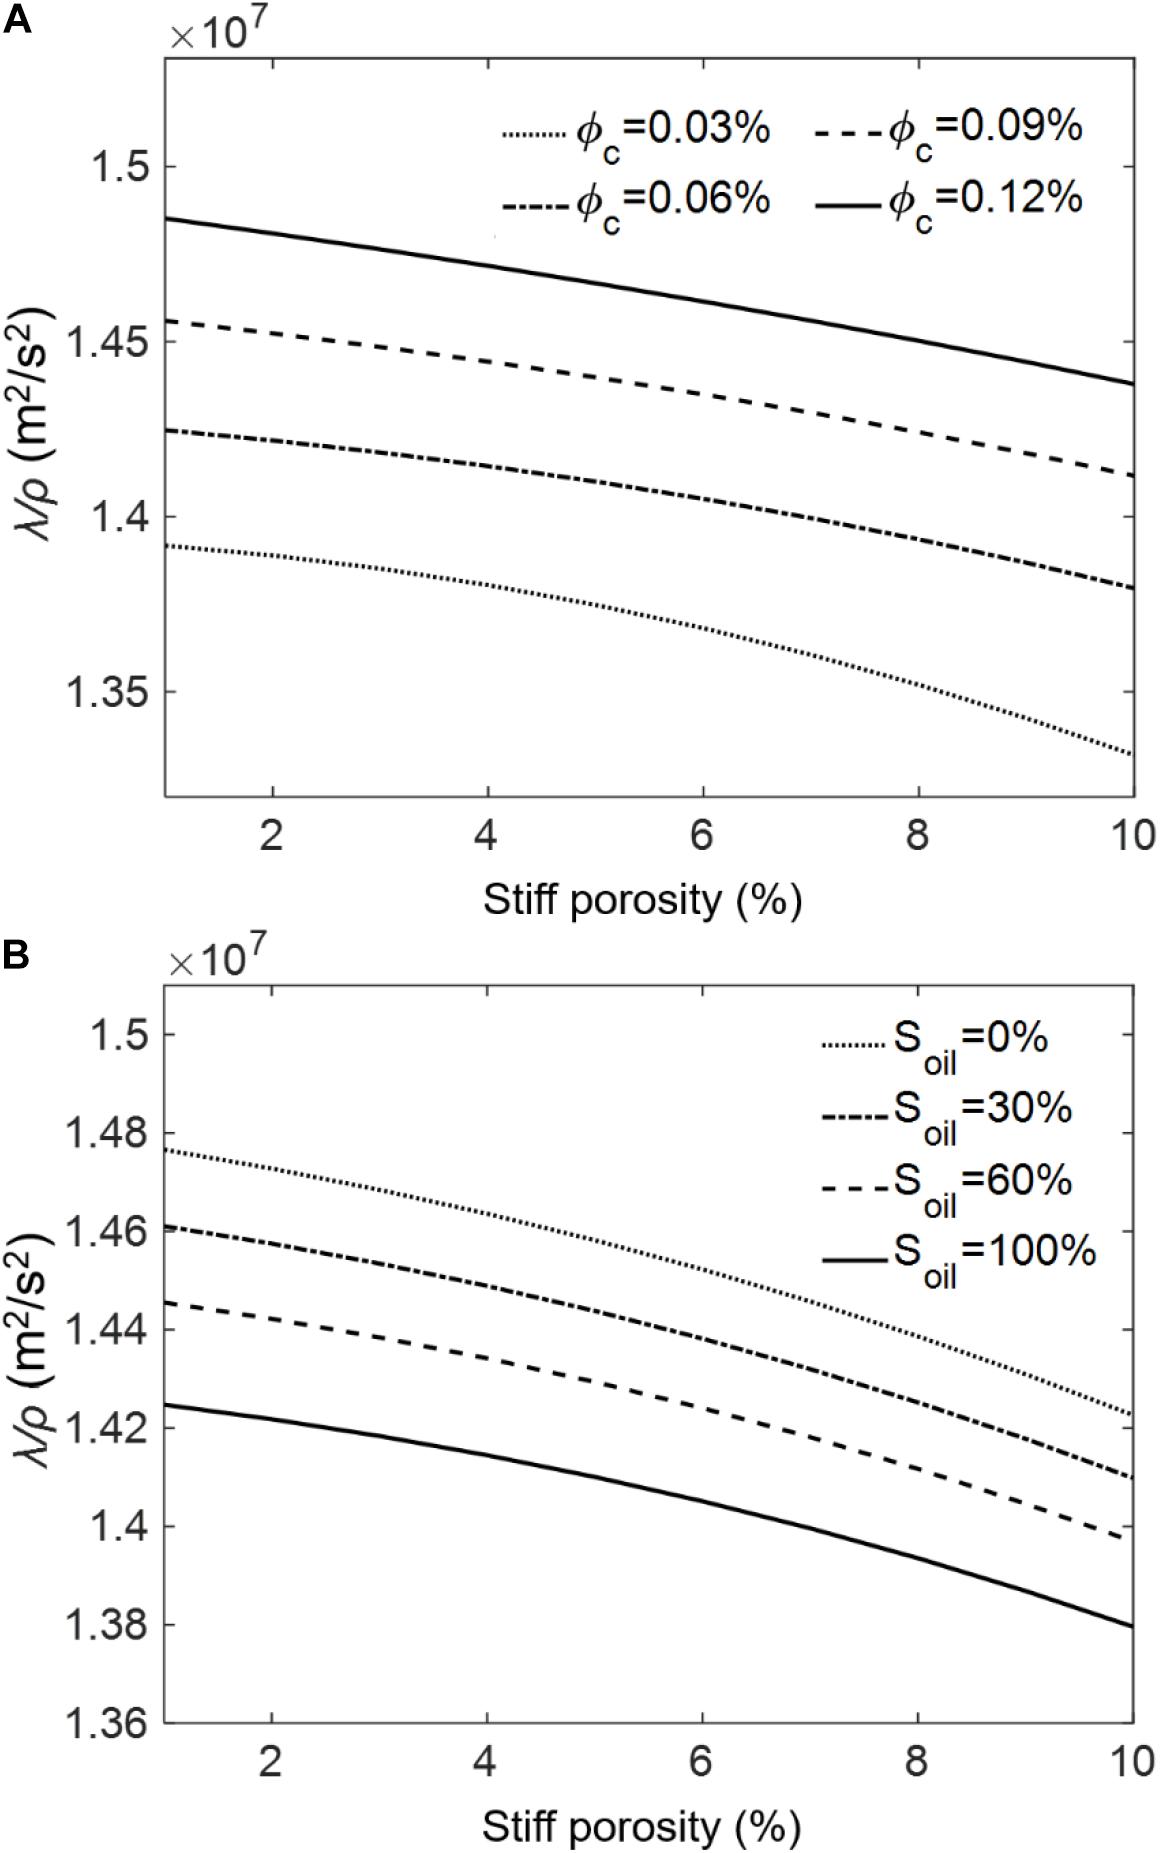
Figure 6. λ/ρ at 1 MHz as a function of stiff porosity for different crack (soft) porosities (A) and oil saturations (B).
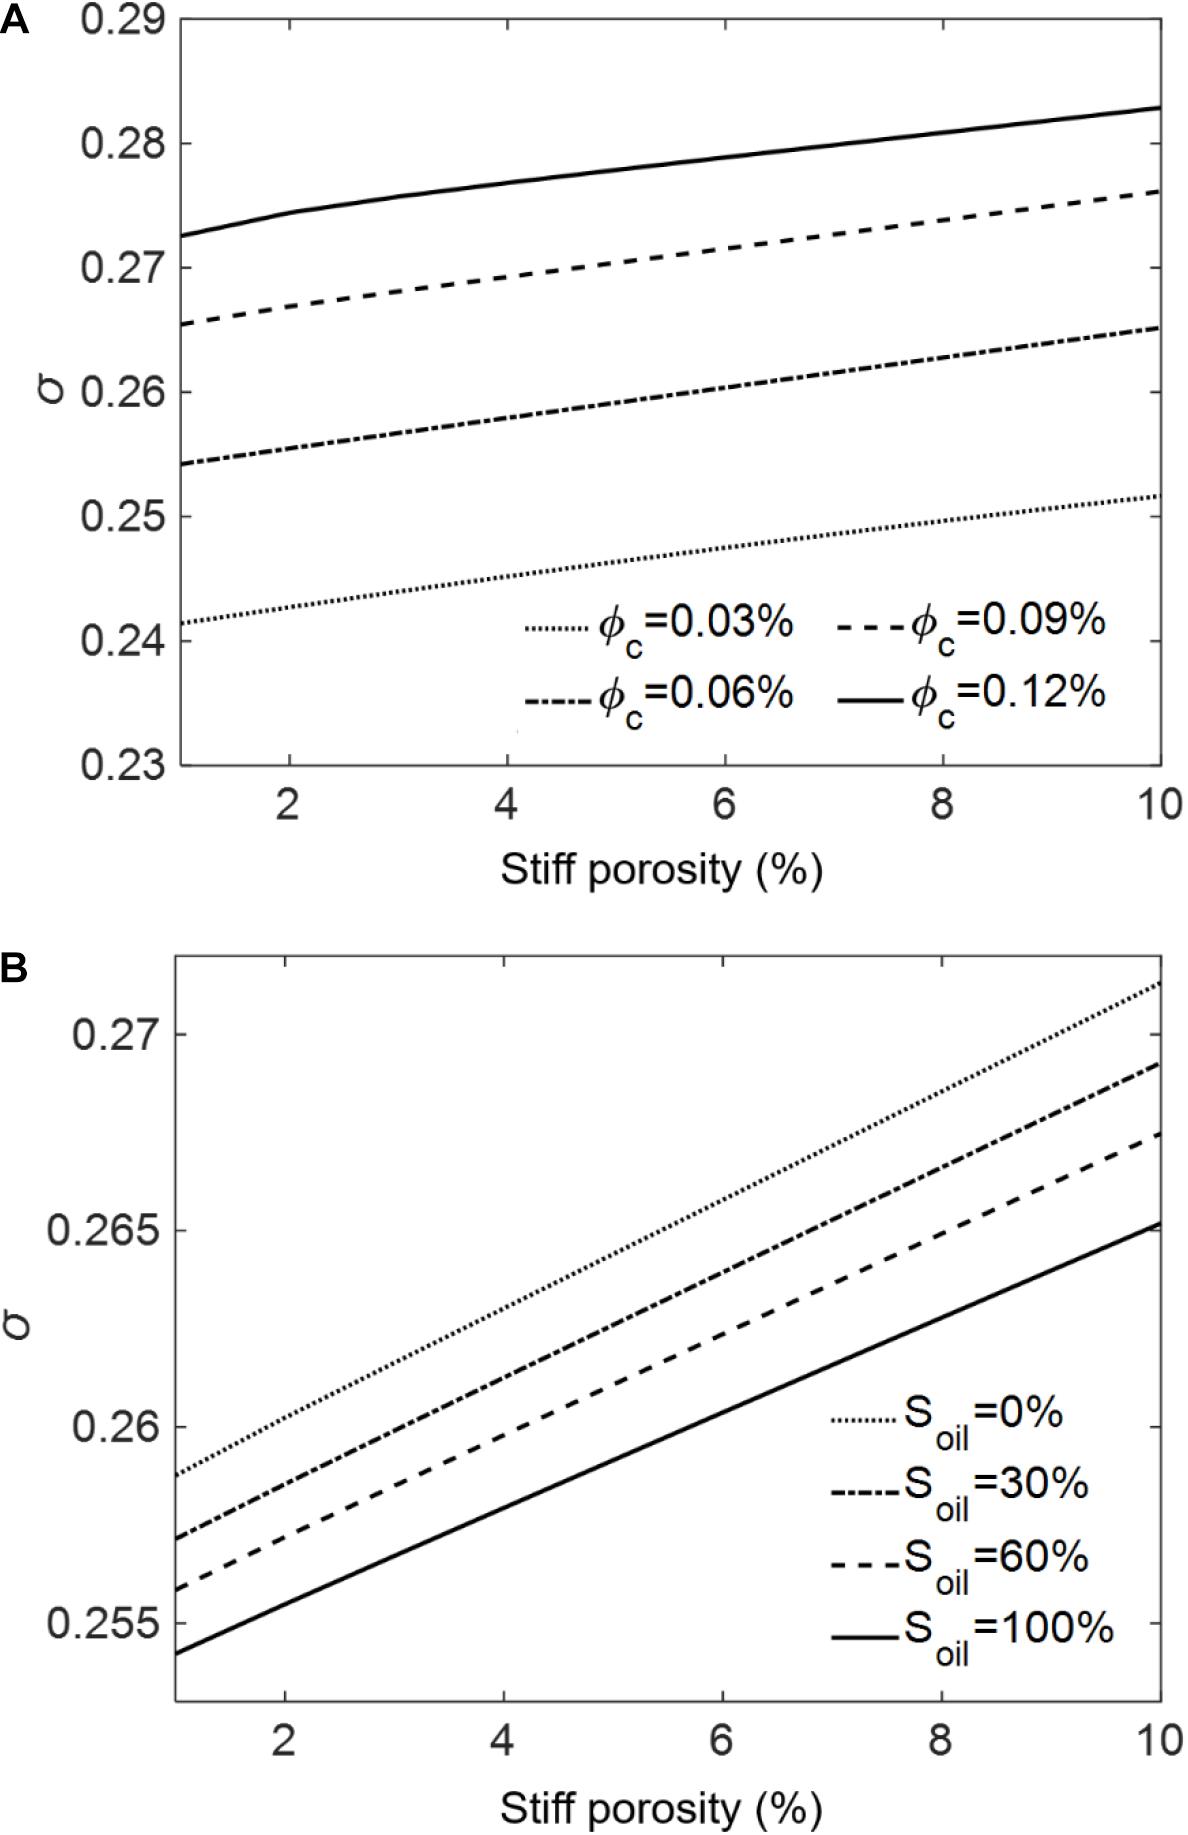
Figure 7. Poisson’s ratio at 1 MHz as a function of stiff porosity for different crack (soft) porosities (A) and oil saturations (B).
Rock-Physics Templates
Total and crack porosities and oil saturation are set as variables to build a 3D RPT at 1 MHz, which is displayed in Figure 8A, where the parameters are the same as in section “P-Wave Phase Velocity and Attenuation.” The blue and red line refers to water and oil saturations, respectively, and the behavior of the template agrees with the previous results. On the other hand, Figure 8B shows the 3D RPT at 35 Hz, where the radii of the inclusion, fluid patch in the host medium and fluid patch in the inclusion are 50, 50, and 5 mm, respectively. The characteristics of the seismic template are identical to those of the ultrasonic template.
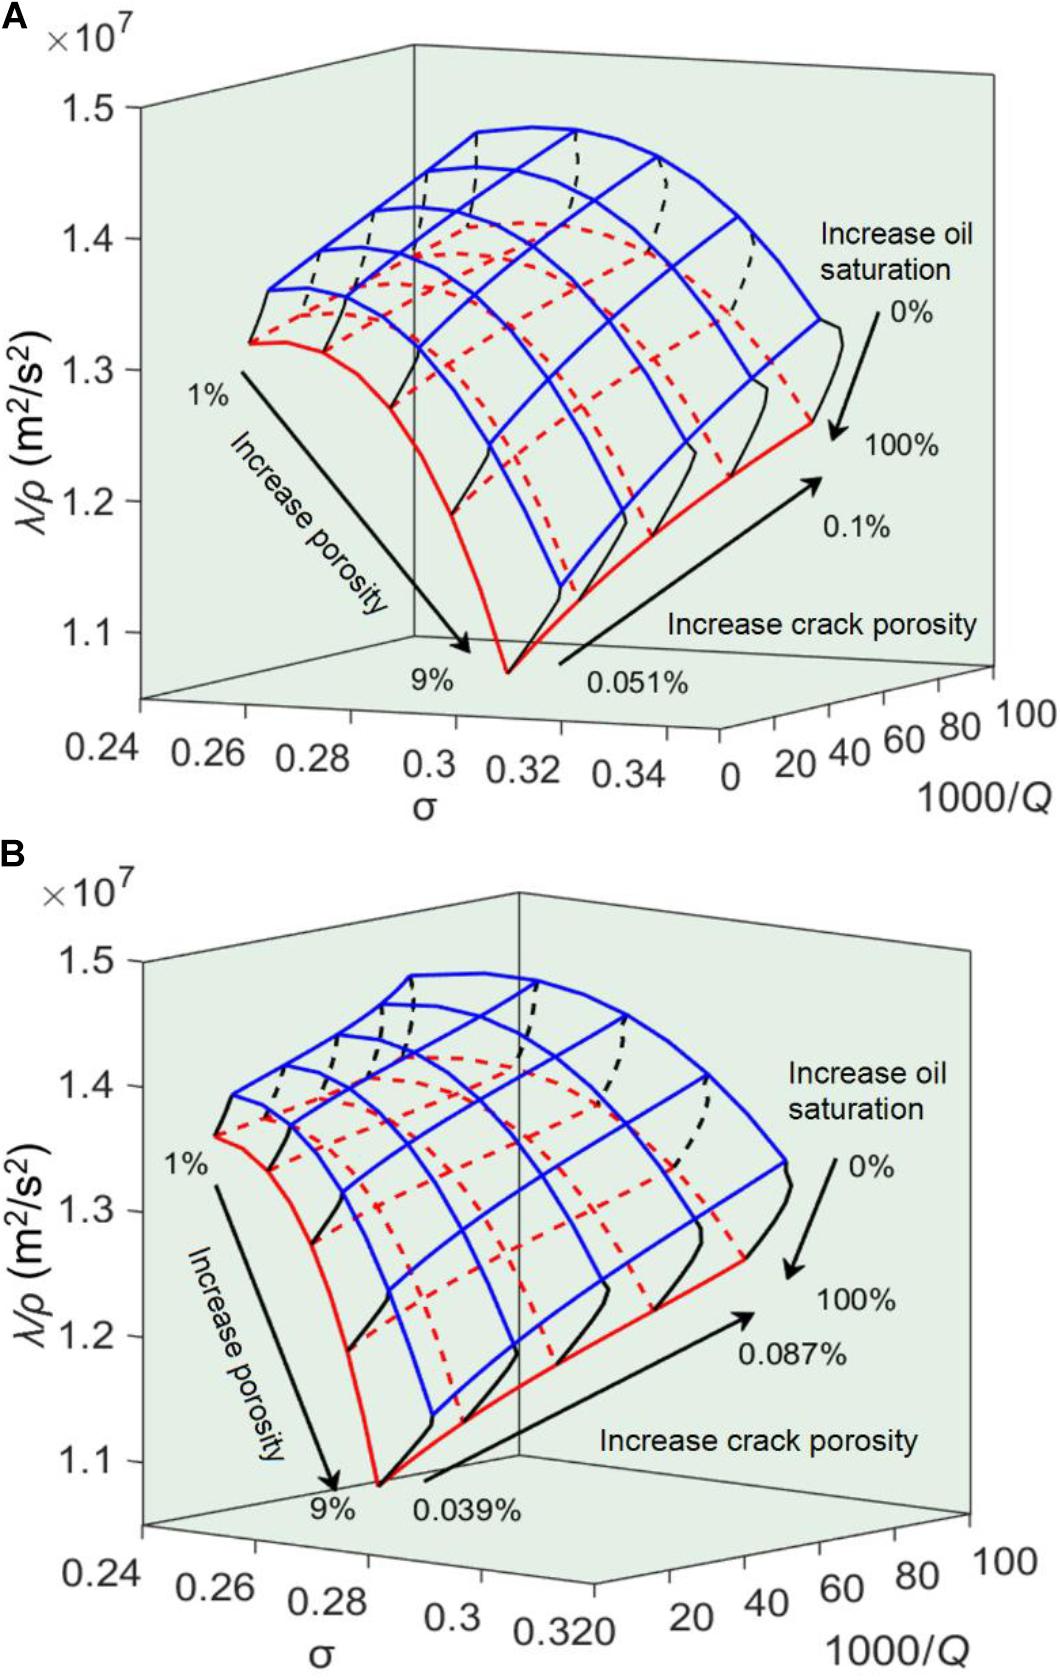
Figure 8. Rock-physics template at 1 MHz (A) and rock-physics template at 35 Hz (B).
Calibration of the RPTs
Ultrasonic Band
Ultrasonic experiments were performed on five water- and oil-saturated samples at 1 MHz, a pore pressure of 70 MPa and 140°C, whose properties are given in Table 1. The carbonate samples used in the ultrasonic measurements are mainly made of limestone, and parts of cracks are filled with asphalt, calcite, and pyrite. Moreover, there are micro-cracks and a relative amount of dissolved pore cavities. In the experiments, the sample is fully saturated, jacketed, and put into a container according to the experimental setup of Guo et al. (2018a). The first arrivals are picked to obtain the wave velocities. Figure 9A,B show the velocities and the attenuation factor estimated with the spectral-ratio method (Toksöz et al., 1979; Guo and Fu, 2006; see Supplementary Appendix Eq. A3).
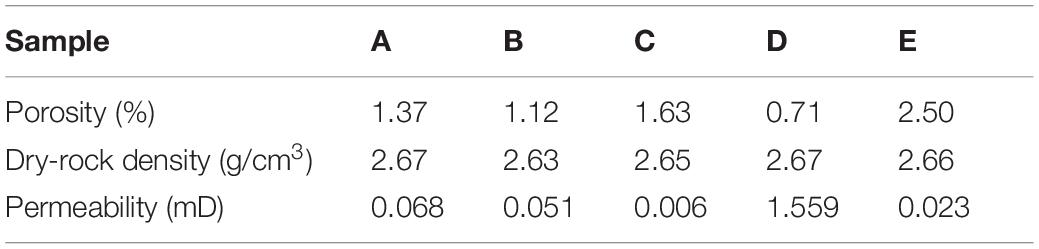
Table 1. Properties of the limestone samples.
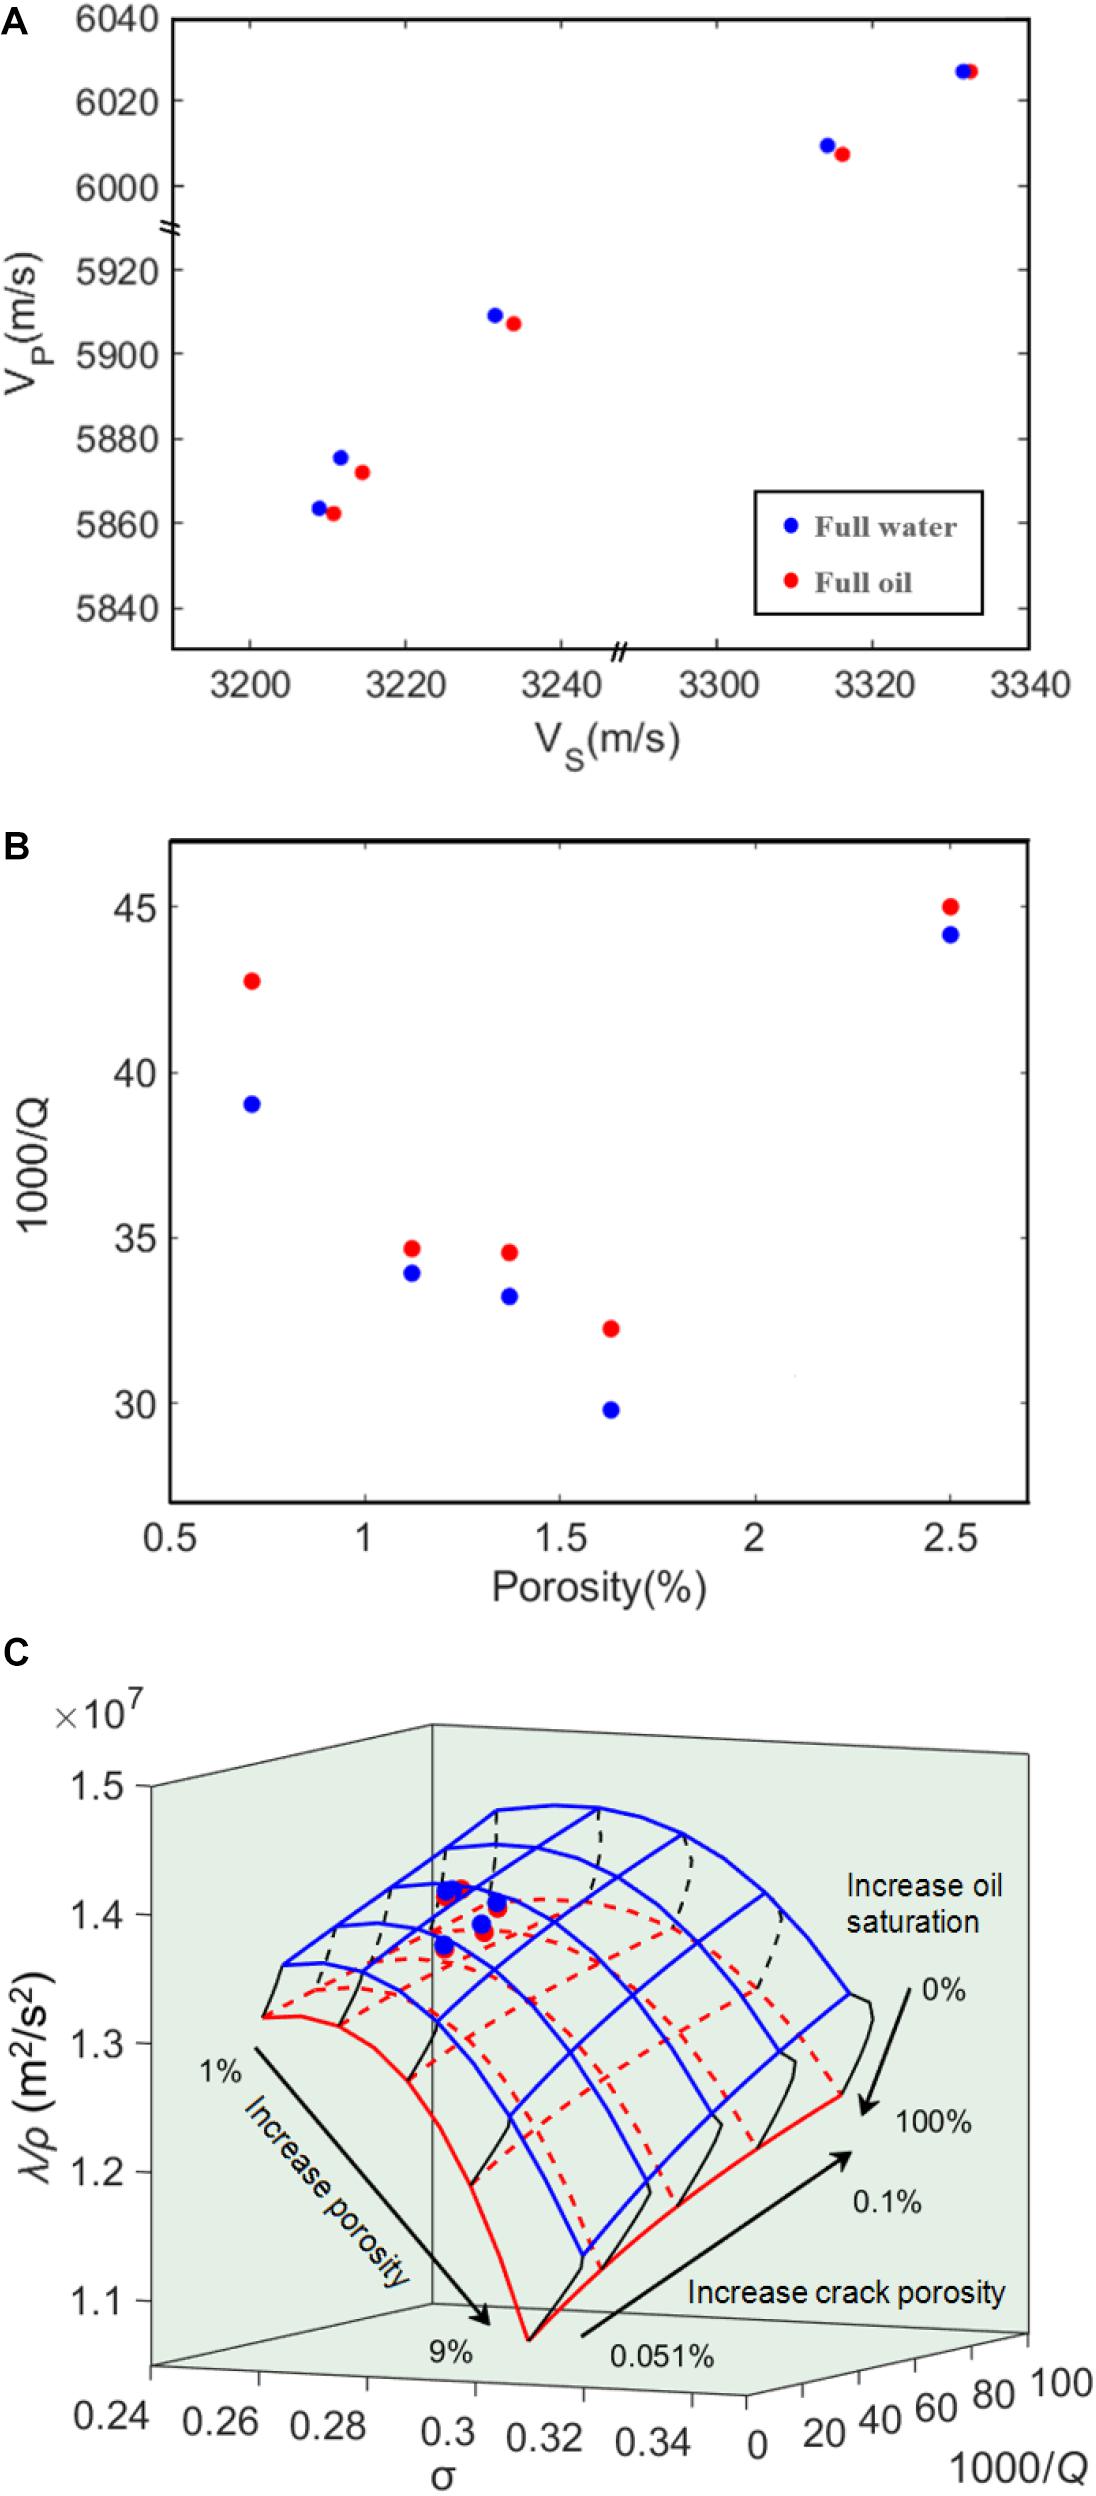
Figure 9. (A) Experimental P-S wave velocity crossplot; (B) P-wave dissipation factor as a function of the total porosity; (C) 3D RPT at 1 MHz compared to the experimental data. The blue and red dots refer to the samples saturated with water and oil, respectively.
Figure 9A shows that P-wave velocity at full water saturation is higher than that at full oil saturation, while the S-wave velocity exhibits the opposite behavior. Figure 9B indicates that the oil-saturated samples have a stronger P-wave attenuation. As shown in the template of Figure 9C, the experimental data of these five samples are used for the calibration at ultrasonic frequencies, where the blue and red circles refer to the water- and oil-saturated samples, respectively. The average error between the predicted total porosities (based on ultrasonic wave attributes) and the measured porosities under oil saturation is 0.00344. The template shows good agreement with the experimental measurements.
Seismic Band
Based on well-log and seismic data, the RPT is calibrated at 35 Hz. The seismic quality factor is estimated with the improved frequency-shift method (Pang et al., 2019, 2020), as shown in Supplementary Appendix Eq. A4. Figures 10A,B show the post-stack seismic data and attenuation (the dissipation factor 1000/Q) profiles of the target layer, respectively, where the red and blue colors indicate high and low attenuation (Figure 10B). The results show that the rocks at the two wells exhibit significant attenuation. On the other hand, Poisson’s ratio and λ/ρ are obtained from AVO inversion (Guo et al., 2018b; Luo et al.,2020a,b). The pre-stack angle gather data contains useful information about the amplitude change with angle. The three-parameter inversion method of pre-stack seismic data, based on the AVO theory, can directly estimate P-wave impedance, S-wave impedance and density, and from these the Poisson’s ratio and λ/ρ are obtained. Figures 10C,D show 2D profiles of λ/ρ and Poisson’s ratio obtained with pre-stack seismic inversion. We can see that Poisson’s ratio is low in regions with a high λ/ρ.
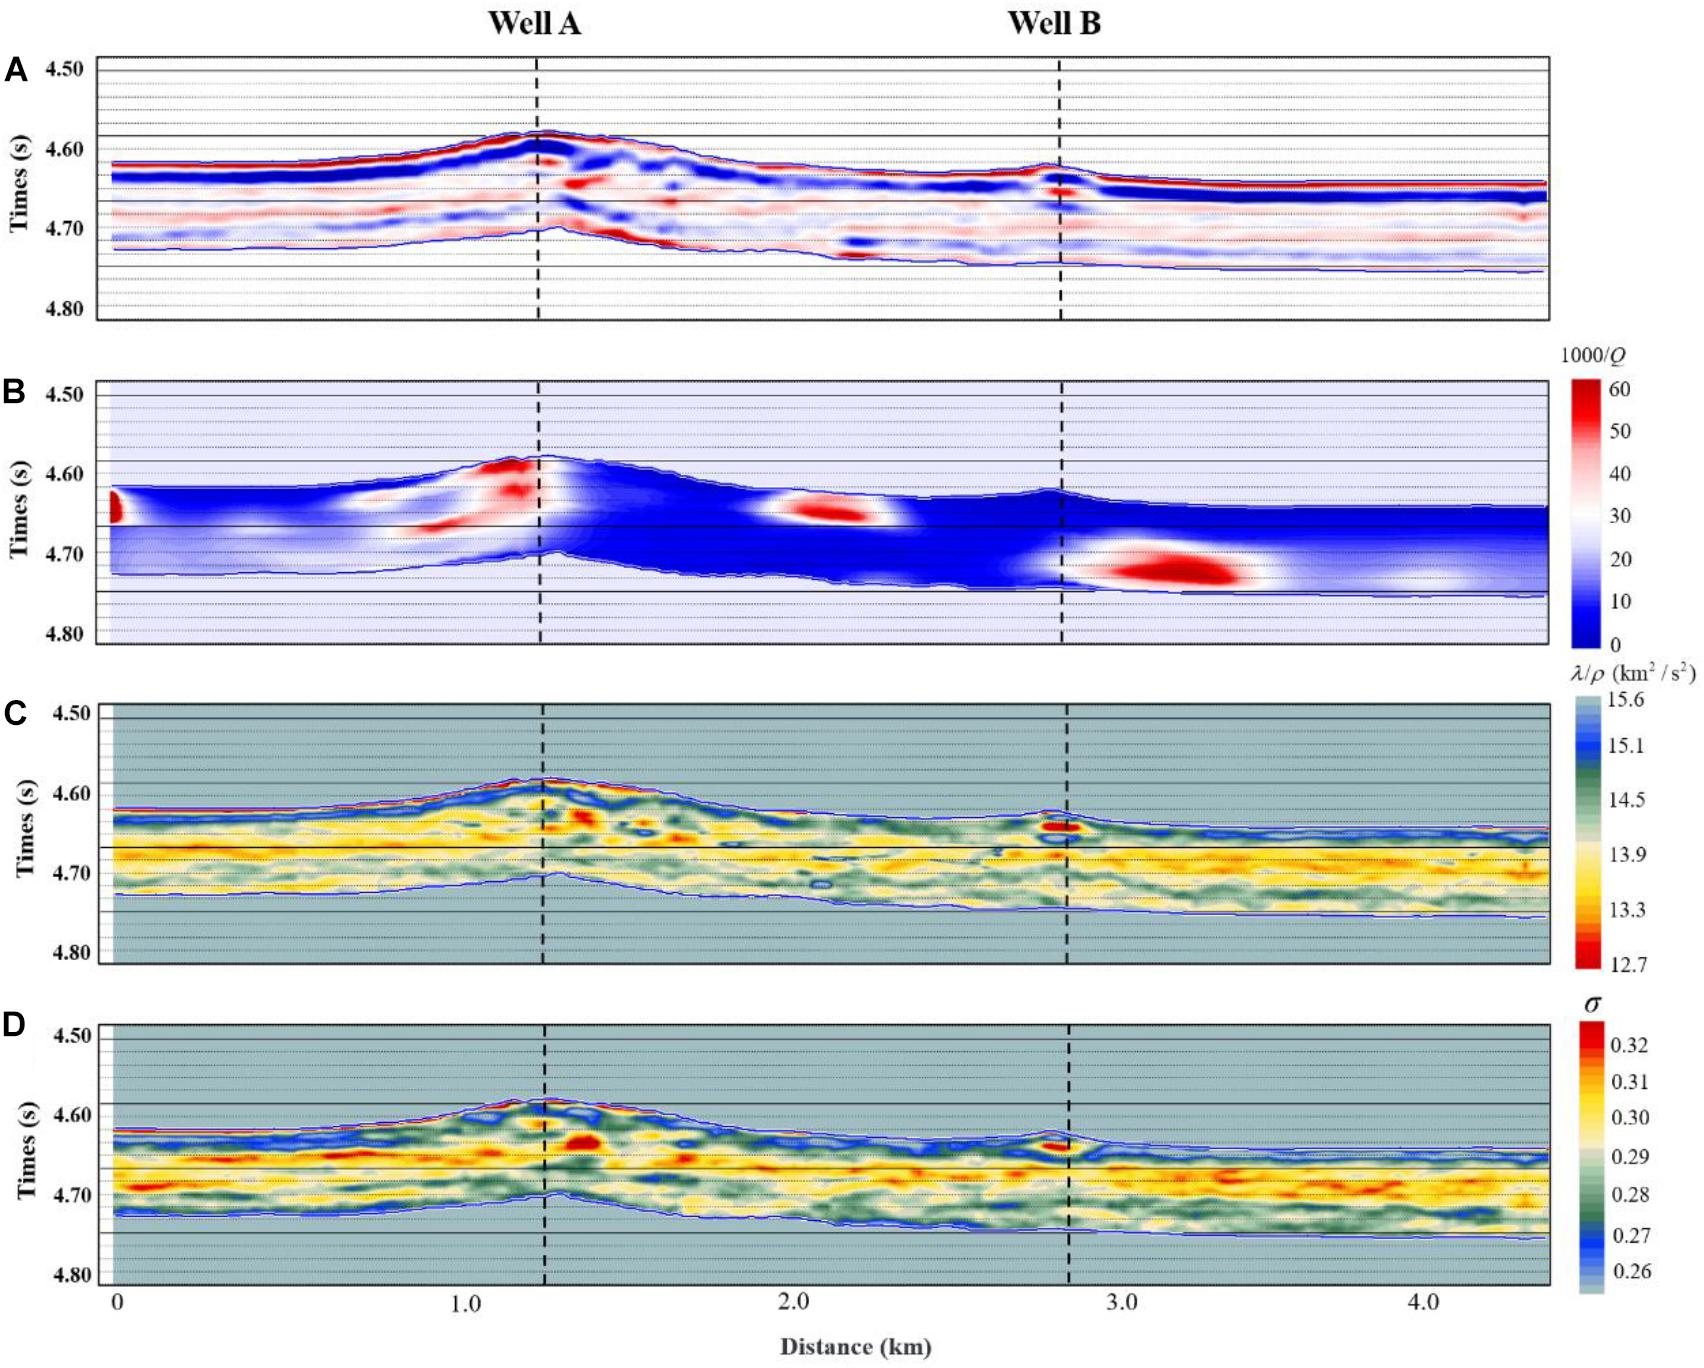
Figure 10. 2D profiles of the post-stack seismic data (A), dissipation factor (1000/Q) (B), λ/ρ (C), and Poisson’s ratio (D) of the target layer.
Attenuation, Poisson’s ratio and λ/ρ at well A were used to calibrate the RPT at seismic frequencies (see Figure 11) and the log porosity of well A is assumed. Comparing the seismic inversion data with the RPT, we can observe that the seismic data with porosity is consistent with the template. According to the color bar of Figure 11, the porosity of the seismic data is low (less than 7%), which agrees with the characteristics of the ultra-deep reservoirs. Attenuation, Poisson’s ratio, and λ/ρ can be obtained from seismic data, and a quantitative prediction of total porosity, crack porosity, and oil saturation can be achieved by overlapping the data on the template.
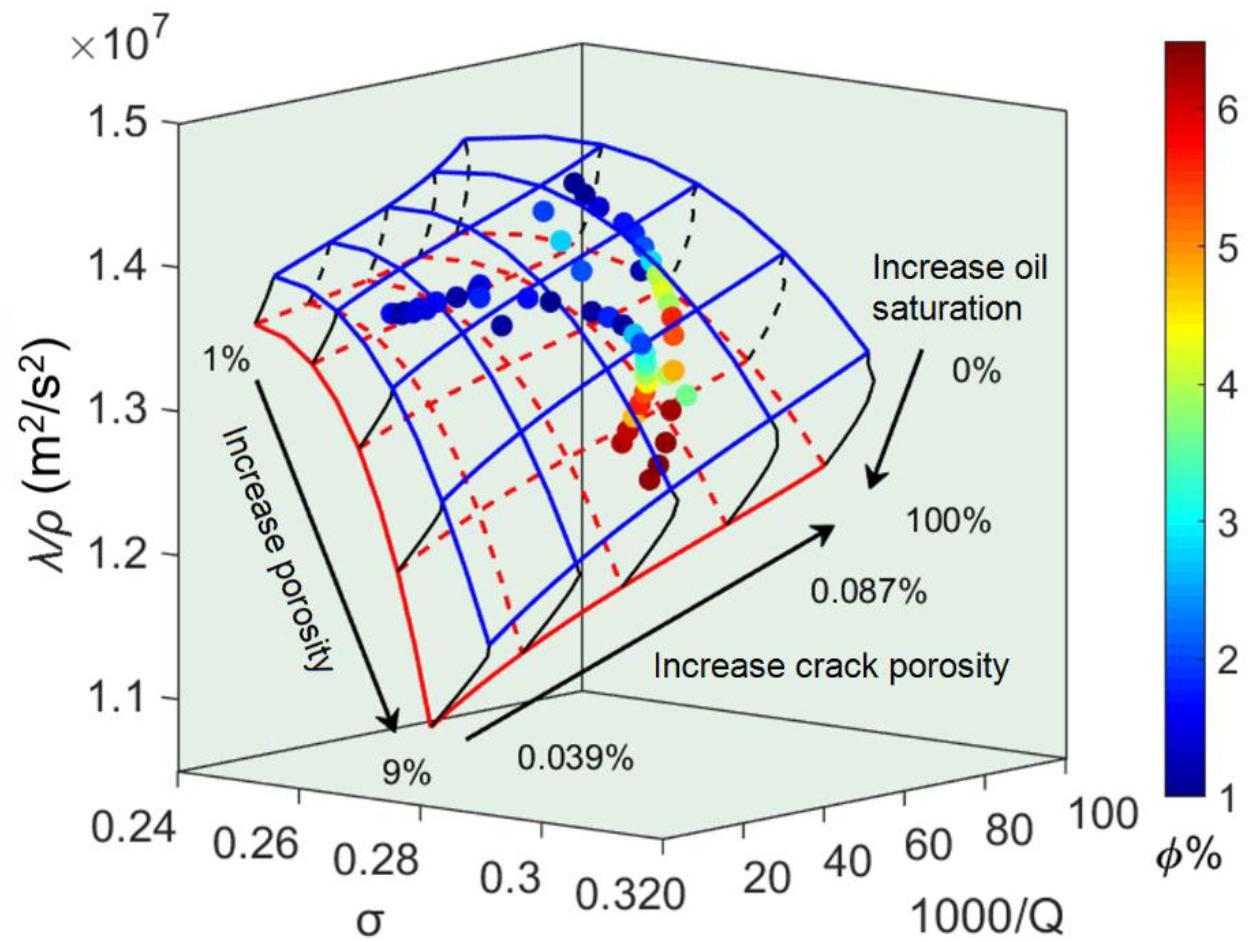
Figure 11. 3D RPT at 35 Hz and seismic data (dots). The color bar indicates total porosity.
Prediction of the Reservoir Properties
The calibrated RPTs are applied to estimate the reservoir properties. Figure 12 shows the reservoir total and crack porosities, and oil saturation on a 2D survey line crossing wells A and B. In Figure 12A, total porosity is generally less than 10% and areas around the wells exhibit higher porosity. As shown in Figure 13, the predicted results of well A are consistent with the porosity log profile. The average error between the predicted porosities (based on seismic wave attributes) and the measured porosities of well A is 0.0125. By combining Figures 12B,C, high crack porosity enables good connectivity and better oil storage capacity. In Figure 12, we also can see that the upper part of well B has a pore-crack system with low oil saturation, while the lower part has high oil saturation, indicating that the reservoir is not homogeneous. Comparative analysis shows that the predicted results are consistent with the reported oil production of well A (90.26 tons/day) and well B (50.31 tons/day). The prediction results of well A are used to analyze the correlation between crack porosity and oil saturation. The correlation coefficient is 0.6296 between fracture porosity and oil saturation.
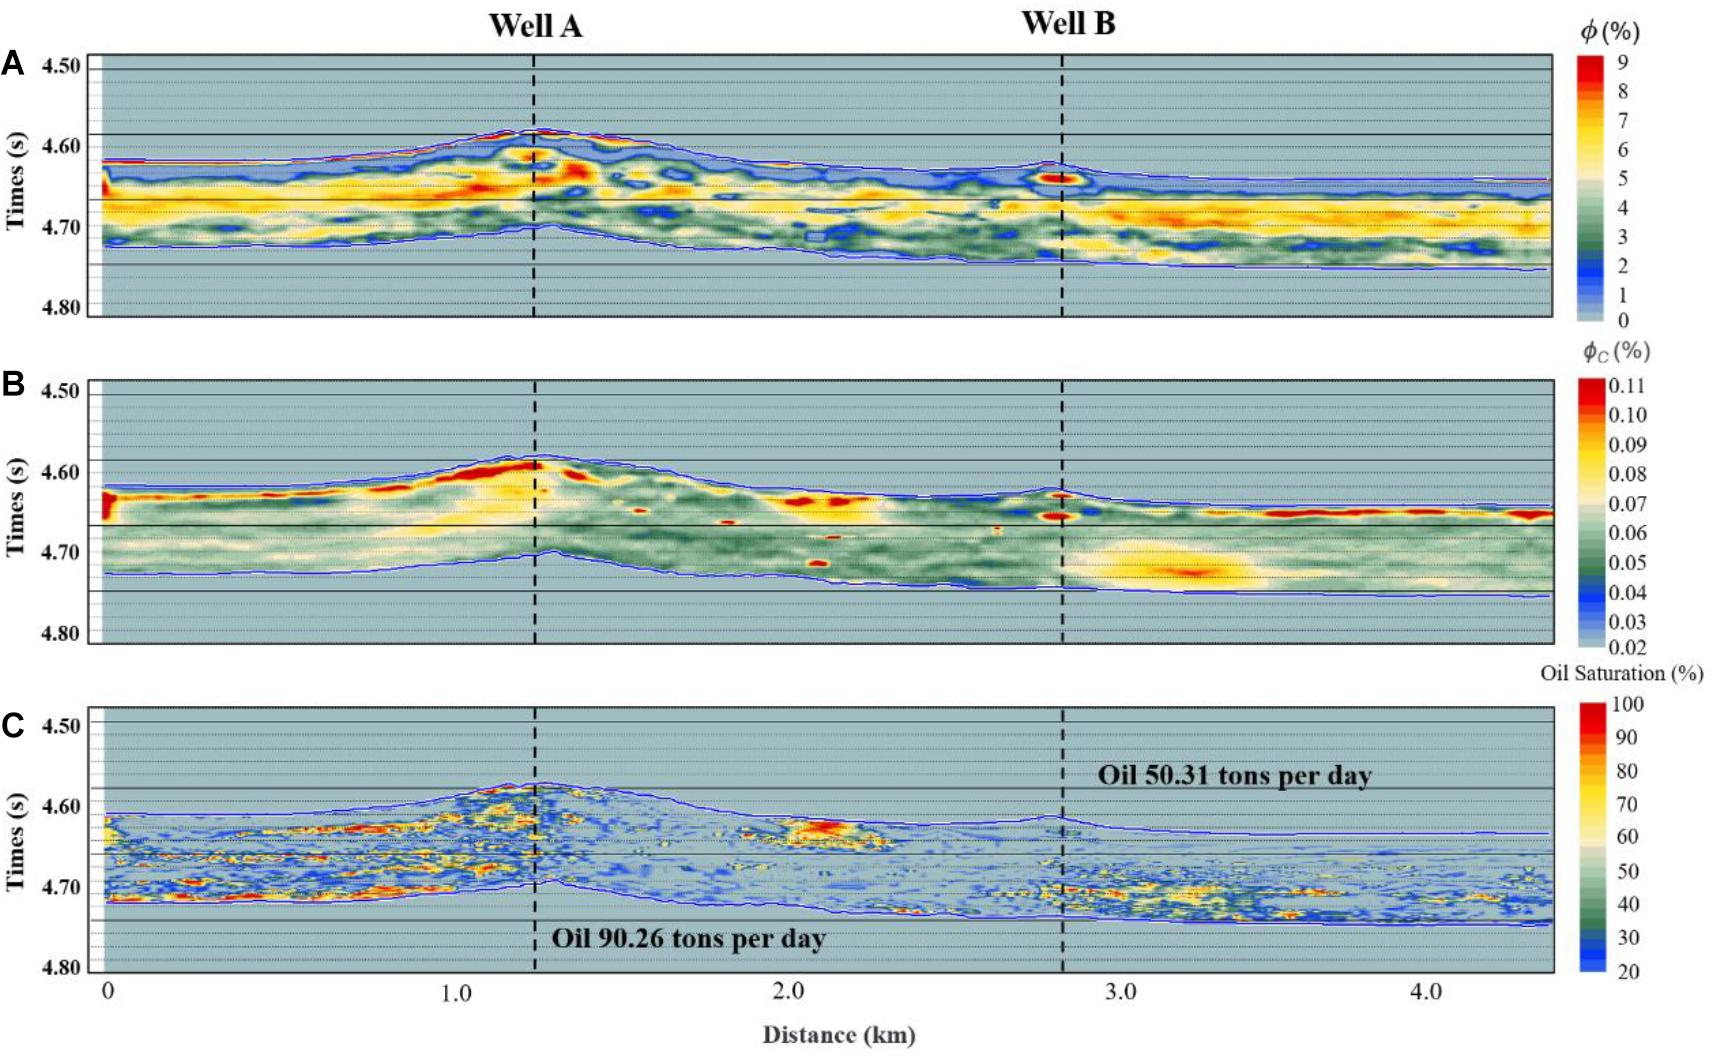
Figure 12. Vertical section of total porosity (A), crack porosity (B), and oil saturation (C) of the target layer. The oil production of both wells are shown.
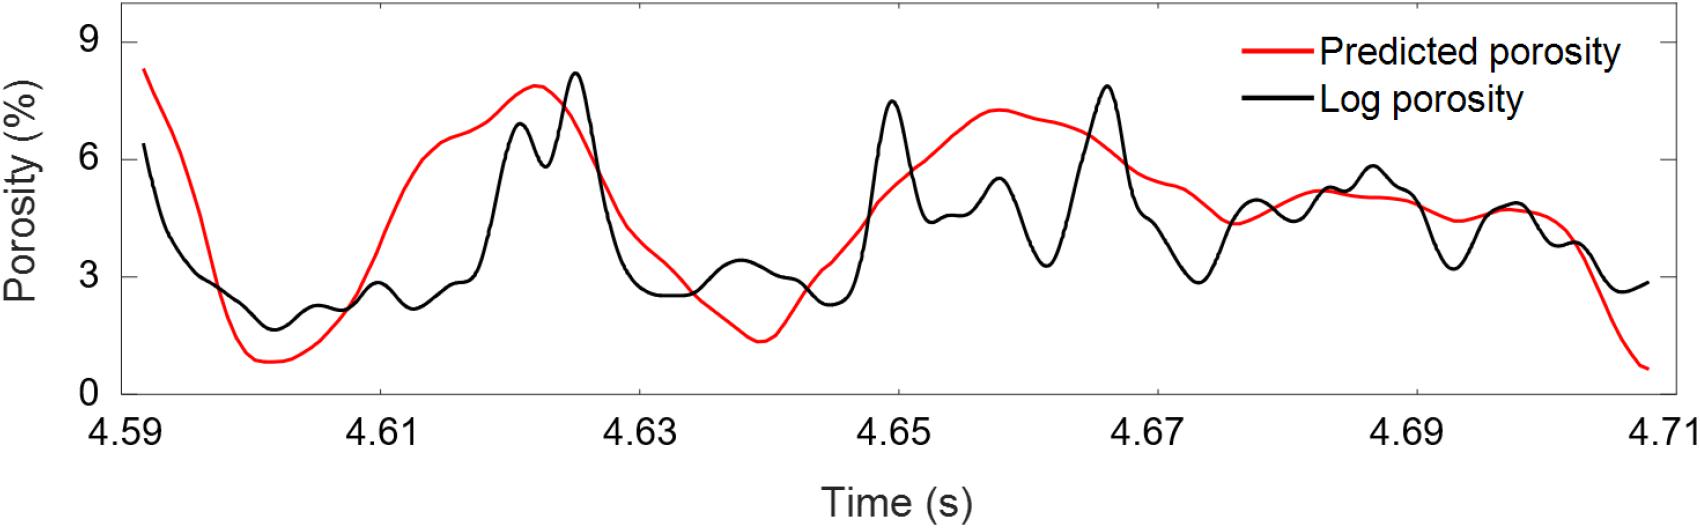
Figure 13. Comparison between the predicted total porosity and log porosity of well A.
Figure 14 gives horizontal sections of total and crack porosities and oil saturation, showing that well A exhibits higher porosity and oil saturation than well B, while the difference in crack porosity is small. The storage space of fault-controlled karst reservoirs is formed by the dissolution of water or hydrothermal fluid along the fault and the distribution of the fluid is extremely uneven. Combining Figures 14A,B, the distributions of total and crack porosities are complementary and the oil saturation distribution in Figure 14C is irregular. These are typical characteristics of fault-controlled karst reservoirs.
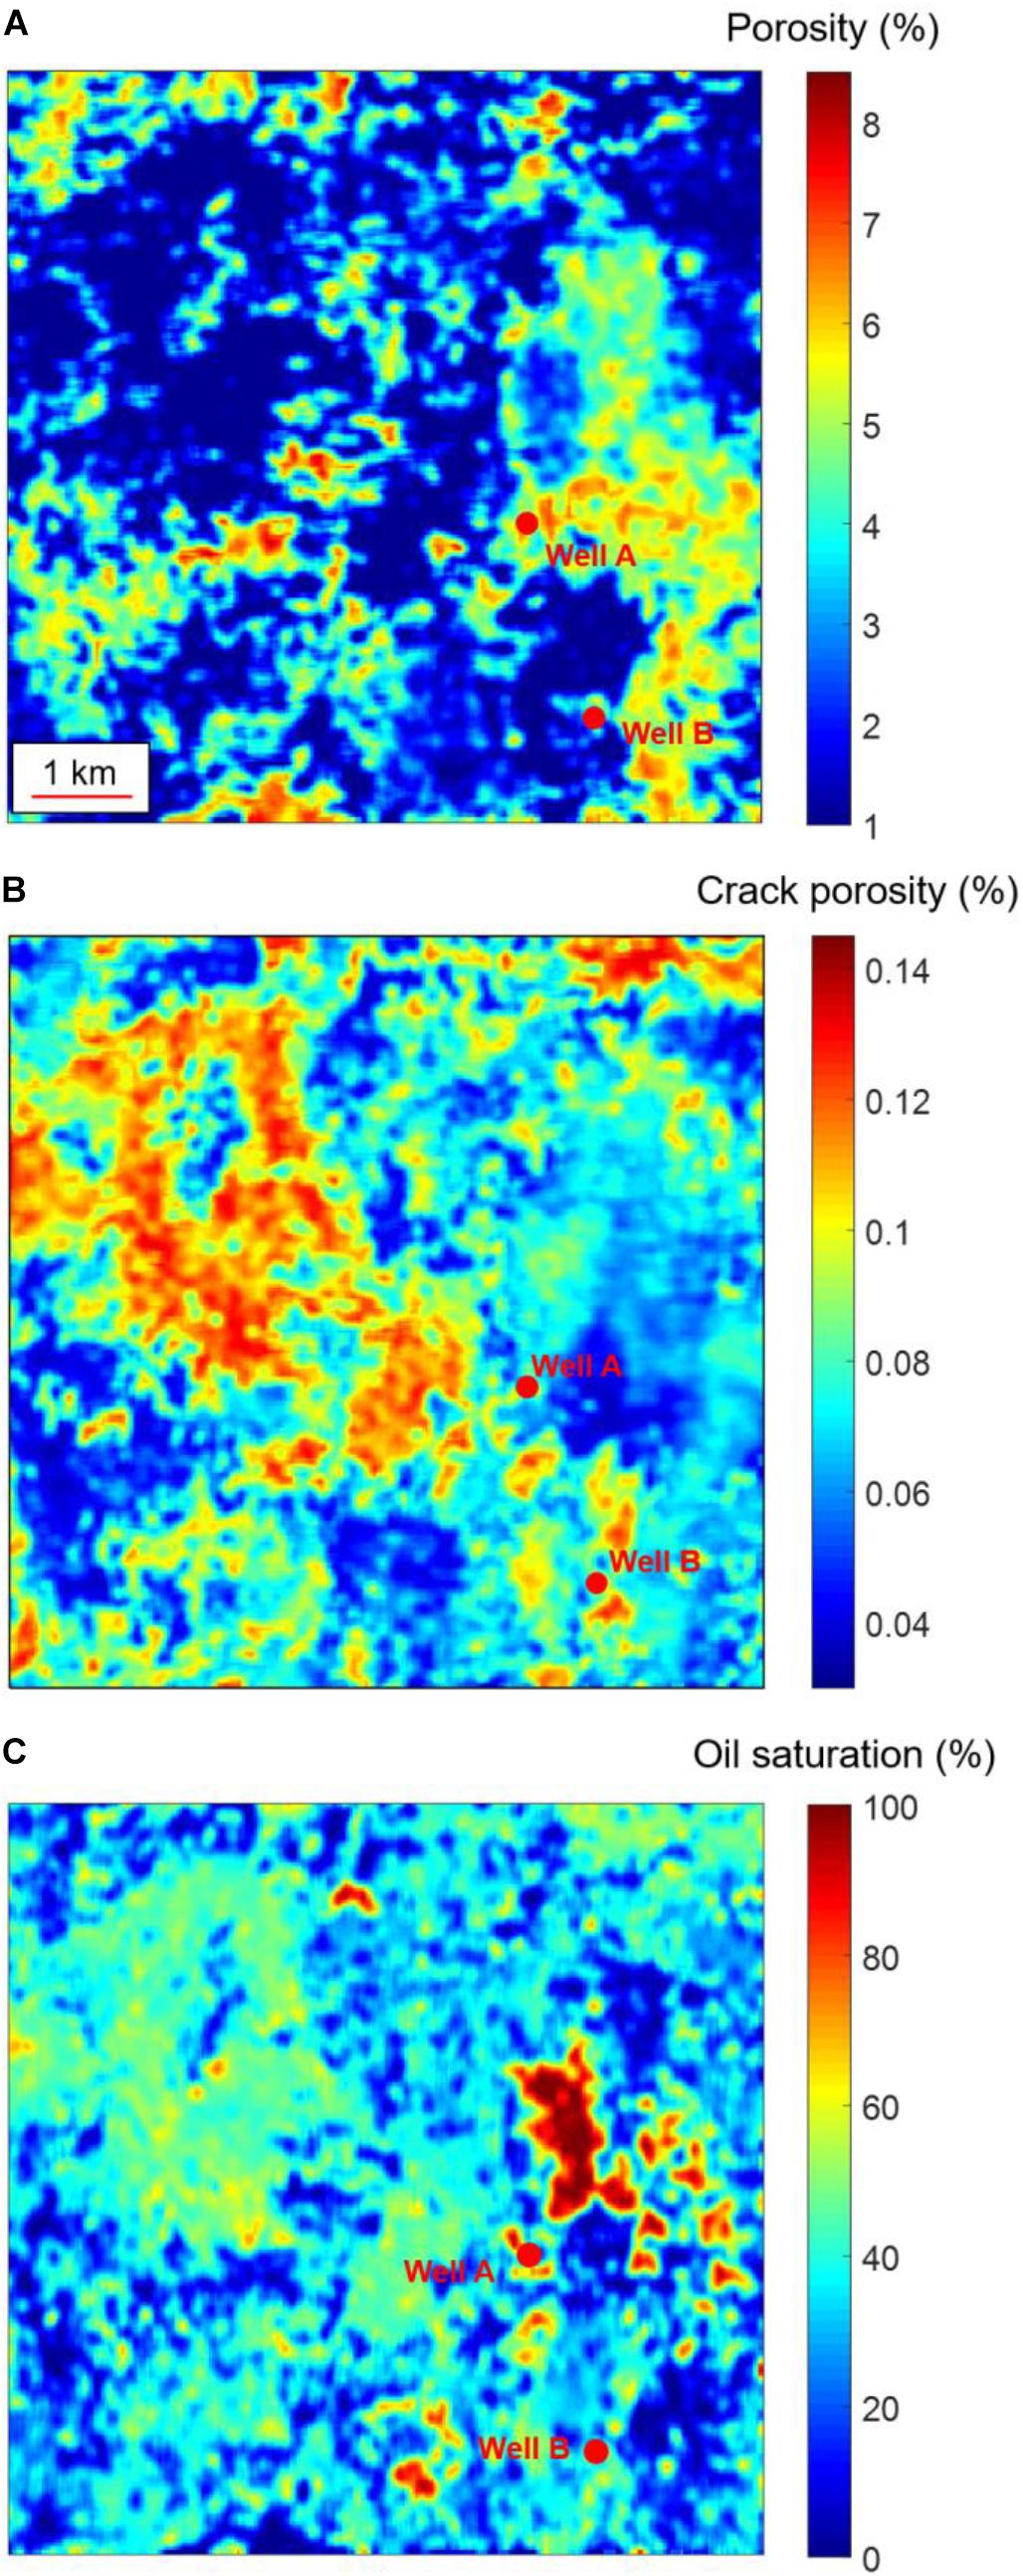
Figure 14. Horizontal section of total porosity (A), crack porosity(B), and oil saturation (C) of the target layer.
It can be seen in Figures 12, 14 that fault-controlled karst reservoirs do not have a defined oil-water interface, but a patchy fluid saturation due to dissimilar crack-pore characteristics. Crack porosity can be used as an indicator to find regions with high oil saturation. Stiff pores mainly store oil and soft pores act as flow channels and also play an important storage role. These findings are consistent with the actual characteristics of the reservoirs, indicating that the proposed method can be successfully applied.
Conclusion
We have implemented a double double-porosity theory to build RPT in order to estimate the properties of deep carbonate reservoirs. The dry-rock moduli were obtained with a combination of the VRH equation and the self-consistent model. The templates axes involve attenuation, Poisson’s ratio and the ratio Lamé constant to density. Ultrasonic experiments were performed on rock samples of the study area and used to calibrate the templates, as well as information from well logs. Then, we have predicted total porosity, crack porosity and oil saturation of the carbonate reservoirs. According to the results, the reservoir has low porosity with developed cracks, which is consistent with the local geological features. Moreover, the results are basically consistent with the actual oil production in the area.
Data Availability Statement
The original contributions presented in the study are included in the article/Supplementary Material, and further inquiries can be directed to the corresponding author/s.
Author Contributions
XZ: ideas and writing. JB: theories and applications. JS and JC: revising. L-YF: suggestions and revising. MP: modeling. All authors contributed to the article and approved the submitted version.
Funding
The authors were grateful to the support of National Natural Science Foundation of China (Grant No. 41821002), the Jiangsu Innovation and Entrepreneurship Plan, Jiangsu Province Science Fund for Distinguished Young Scholars (BK20200021), National Natural Science Foundation of China (41974123), the National Science and Technology Major Project of China (2017ZX05069-002), and the research funds from SINOPEC Key Laboratory of Geophysics.
Conflict of Interest
The authors declare that the research was conducted in the absence of any commercial or financial relationships that could be construed as a potential conflict of interest.
Supplementary Material
The Supplementary Material for this article can be found online at: https://www.frontiersin.org/articles/10.3389/feart.2021.649984/full#supplementary-material
References
Agersborg, R., Johansen, T. A., Jakobsen, M., Sothcott, J., and Best, A. I. (2008). Effects of fluids and dual-pore systems on pressure-dependent velocities and attenuations in carbonates. Geophysics 73, N35–N47.
Ba, J., Carcione, J. M., and Nie, J. X. (2011). Biot-Rayleigh theory of wave propagation in double-porosity media. J. Geophys. Res. Solid Earth 116: B06202.
Ba, J., Xu, W. H., Fu, L. Y., Carcione, J. M., and Zhang, L. (2017). Rock anelasticity due to patchy-saturation and fabric heterogeneity: a double-double porosity model of wave propagation. J. Geophys. Res. Solid Earth 122, 1949–1976.
Batzle, M., and Wang, Z. J. (1992). Seismic properties of pore fluids. Geophysics 57, 1396–1408. doi: 10.1190/1.1443207
Batzle, M., Han, D., and Hofmann, R. (2001). Optimal hydrocarbon indicators. Paper Presented at the 71st Ann. Internat. Mtg., Soc. Explor, Geophys, Tulsa, OK. 1697–1700.
Berryman, J. G. (1980). Long wavelength propagation in composite elastic media II. ellipsoidal inclusions. Acoustical Soc. Am. J. 68, 1820–1831. doi: 10.1121/1.385172
Berryman, J. G. (1992). Single-scattering approximations for coefficients in Biot’s equations of poroelasticity. Acoustical Soc. Am. J. 91, 551–571. doi: 10.1121/1.402518
Berryman, J. G. (1998). Long-wavelength propagation in composite elastic media I. spherical inclusions. J. Acoustical Soc. Am. 68, 1809–1819. doi: 10.1121/1.385171
Carcione, J. M. (2014). Wave Fields in Real Media, Theory and Numerical Simulation of Wave Propagation in anisotropic, Anelastic, Porous and Electromagnetic Media, 3rd Edn. Amsterdam: Elsevier.
Carcione, J. M., and Avseth, P. (2015). Rock-physics templates for clay-rich source rocks. Geophysics 80, D481–D500.
Chi, X. G., and Han, D. H. (2009). Lithology and fluid differentiation using a rock physics template. Lead. Edge 28, 60–65. doi: 10.1190/1.3064147
Deng, J. X., Zhou, H., Wang, H., Zhou, G., and Wang, S. X. (2015). The influence of pore structure in reservoir sandstone on dispersion properties of elastic waves. Chinese J. Geophys. (in Chinese) 58, 3389–3400.
Dillon, L., Schwedersky, G., Guilherme, V., Velloso, R., and Numes, C. (2003). A multiscale DHI elastic attributes evaluation. Leading Edge 22, 1024–1029. doi: 10.1190/1.1623644
Dvorkin, J., Mavko, G., and Nur, A. (1995). Squirt flow in fully saturated rocks. Geophysics 60, 97–107. doi: 10.1190/1.1443767
Dvorkin, J., Nolen-Hoeksema, R., and Nur, A. (1994). The Squirt-flow t mechanism: macroscopic description. Geophysics 59, 428–438. doi: 10.1190/1.1443605
Dvorkin, J., and Nur, A. (1993). Dynamic poroelasticity: a unified model with the squirt and the biot mechanisms. Geophysics 58, 524–533. doi: 10.1190/1.1443435
Goodway, W., Chen, T., and Downton, J. (1997). Improved AVO fluid detection and lithology discrimination using Lame petrophysical parameters from P and S inversion. Paper Presented at 67th Annual International Mtg Social. Explor. Geophysics, Dallas: 183–186.
Guo, J. X., Shuai, D., Wei, J. X., Ding, P. B., and Gurevich, B. (2018a). P-wave dispersion and attenuation due to scattering by aligned fluid saturated fractures with finite thickness: theory and experiment. Geophys. J. Int. 215, 2114–2133. doi: 10.1093/gji/ggy406
Guo, Q., Zhang, H. B., Han, F. L., and Shang, Z. P. (2018b). Prestack seismic inversion based on anisotropic Markov random field. IEEE Trans. Geosci. Remote Sens. 56, 1069–1079. doi: 10.1109/tgrs.2017.2758800
Guo, M. Q., and Fu, L. Y. (2006). Stress associated coda attenuation from ultrasonic waveform measurements. Geophys. Res. Lett. 34:L09307.
Hedlin, K. (2000). Pore space modulus and extraction using AVO. Paper presented at 70th Ann. Internat. Mtg., Soc. Explor. Geophys, Calgary: 170–173.
Hill, R. (1952). The elastic behaviour of a crystalline aggregate. Proc. Phys. Soc. 65, 349–354. doi: 10.1088/0370-1298/65/5/307
Johnson, D. L. (2001). Theory of frequency dependent acoustics in patchy-saturated porous media. J. Acoustical Soc. Am. 110, 682–694. doi: 10.1121/1.1381021
Lan, X. D., Lü, X. X., Zhu, Y. M., and Yu, H. F. (2015). The geometry and origin of strike-slip faults cutting the Tazhong low rise megaanticline (central uplift, Tarim Basin, China) and their control on hydrocarbon distribution in carbonate reservoirs. J. Nat. Gas Sci. Eng. 22, 633–645. doi: 10.1016/j.jngse.2014.12.030
Li, Y. Q., Sun, J. F., Wei, H. H., and Song, S. H. (2019). Architectural features of fault-controlled karst reservoirs in the Tahe oilfield. J. Petroleum Sci. Eng. 181:106208. doi: 10.1016/j.petrol.2019.106208
Luo, C., Ba, J., Carcione, J. M., Huang, G. T., and Guo, Q. (2020a). Joint PP and PS pre-stack AVA inversion for VTI medium based on the exact Graebner equation. J. Petroleum Sci. Eng. 194:107416. doi: 10.1016/j.petrol.2020.107416
Luo, C., Ba, J., Carcione, J. M., Huang, G. T., and Guo, Q. (2020b). Joint PP and PS pre-stack seismic inversion for stratified models based on the propagator matrix forward engine. Surveys Geophys. 41, 987–1028. doi: 10.1007/s10712-020-09605-5
Mavko, G., Mukerji, T., and Dvorkin, J. (2009). The Rock Physics Handbook: Tools for Seismic Analysis of Porous Media. Cambridge: Cambridge University Press.
Michel, K. (2010). Rock physics driven inversion: the importance of workflow. First Break 28, 68–81.
Odegaard, E., and Avseth, P. A. (2004). Well log and seismic data analysis using rock physics templates. First Break 22, 37–43.
Pang, M. Q., Ba, J., Carcione, J. M., Picotti, S., Zhou, J., and Jiang, R. (2019). Estimation of porosity and fluid saturation in carbonates from rock-physics templates based on seismic Q. Geophysics 84, M25–M36.
Pang, M. Q., Ba, J., Fu, L. Y., Carcione, J. M., Markus, U. I., and Zhang, L. (2020). Estimation of microfracture porosity in deep carbonate reservoirs based on 3D rock-physics templates. Interpretation 8, 1–10. doi: 10.1190/geo2020-0550.1
Pang, X. Q. (2010). Key challenges and research methods of petroleum exploration in the deep of superimposed basins in western China. Oil Gas Geol. 31, 517–534.
Picotti, S., Carcione, J. M., and Ba, J. (2018). Rock-physics templates for seismic Q. Geophysics 84, MR13–MR23.
Pimienta, L., Fortin, J., and Guéguen, Y. (2015). Bulk modulus dispersion and attenuation in sandstones. Geophysics 80, D111–D127.
Pride, S. R., Berryman, J. G., and Harris, J. M. (2004). Seismic attenuation due to wave induced flow. J. Geophys. Res. 109:B01201.
Qiao, Y. D., and An, H. W. (2007). Study of petrophysical parameter sensitivity from well log data. Appl. Geophys. 4, 28–287.
Quakenbush, M., Shang, B., and Tuttle, C. (2006). Poisson impedance. Leading Edge 25, 128–138. doi: 10.1190/1.2172301
Quintal, B. (2012). Frequency-dependent attenuation as a potential indicator of oil saturation. J. Appl. Geophys. 82, 119–128. doi: 10.1016/j.jappgeo.2012.03.001
Reuss, A. (1929). Calculation of the flow limits of mixed crystals on the basis of the plasticity of monocrystals. Zeitschrift fur Angewandte Mathenatik 9, 49–58.
Russell, B. H., Gray, D., Hampson, D. P., and Lines, L. (2006). Linearized AVO and poroelasticity. CREWES Res. Report 18, 1–25.
Russell, B. H., Hedlin, K., Hilterman, F. J., and Lines, L. R. (2003). Fluid-property discrimination with AVO: a Biot-Gassmann perspective. Geophysics 68, 29–39. doi: 10.1190/1.1543192
Shapiro, S. A. (2003). Elastic piezosensitivity of porous and fractured rocks. Geophysics 68, 482–486. doi: 10.1190/1.1567215
Tan, W. H., Ba, J., Müller, T., Fang, G., and Zhao, H. B. (2020). Rock physics model of tight oil siltstone for seismic prediction of brittleness. Geophys. Prospect. 68, 1554–1574. doi: 10.1111/1365-2478.12938
Tang, X. M. (2011). A unified theory for elastic wave propagation through porous media containing cracks-An extension of Biot’s poroelastic wave theory. Sci. China Earth Sci. 54, 1441–1452. doi: 10.1007/s11430-011-4245-7
Tian, F., Lu, X. B., Zheng, S. Q., Zhang, H. F., Rong, Y. S., Yang, D. B., et al. (2017). Structure and Filling Characters of Paleokarst Reservoirs in Northern Tarim Basin, Revealed by Outcrop, Core and Borehole Images. Open Geosci. 9, 266–280.
Toksöz, M. N., Johnston, D. H., and Timur, A. (1979). Attenuation of seismic waves in dry and saturated rocks: I, Laboratory measurements. Geophysics 44, 681–690. doi: 10.1190/1.1440969
Tran, M., Mukerji, T., and Hosford Scheirer, A. (2020). Lithofacies-dependent rock physics templates of an unconventional shale reservoir on the North Slope, Alaska. Interpretation 8, 1–49. doi: 10.1190/int-2019-0156.1
White, J. E. (1975). Computed seismic speeds and attenuation in rocks with partial gas saturation. Geophysics 40, 224–232. doi: 10.1190/1.1440520
Xue, J., Gu, H., and Cai, C. (2017). Model-based amplitude versus offset and azimuth inversion for estimating fracture parameters and fluid content. Geophysics 82, M1–M17.
Keywords: double double-porosity theory, fault-controlled karst reservoirs, fluid detection, ultra-deep reservoirs, 3D rock-physics template
Citation: Zhou X, Ba J, Santos JE, Carcione JM, Fu L-Y and Pang M (2021) Fluid Discrimination in Ultra-Deep Reservoirs Based on a Double Double-Porosity Theory. Front. Earth Sci. 9:649984. doi: 10.3389/feart.2021.649984
Received: 06 January 2021; Accepted: 06 April 2021;
Published: 04 May 2021.
Edited by:
Pier Paolo Bruno, University of Naples Federico II, ItalyReviewed by:
Per Avseth, Norwegian University of Science and Technology, NorwayKen Ikeda, The University of Texas at Austin, United States
Copyright © 2021 Zhou, Ba, Santos, Carcione, Fu and Pang. This is an open-access article distributed under the terms of the Creative Commons Attribution License (CC BY). The use, distribution or reproduction in other forums is permitted, provided the original author(s) and the copyright owner(s) are credited and that the original publication in this journal is cited, in accordance with accepted academic practice. No use, distribution or reproduction is permitted which does not comply with these terms.
*Correspondence: Jing Ba, amluZ2JhQDE4OC5jb20=