 Lei Sun*
 Paul Mann
- Department of Earth and Atmospheric Sciences, University of Houston, Houston, TX, United States
The area of southeastern Papua New Guinea includes three active microplates – the Trobriand, Woodlark, and Solomon Sea plates – that are being deformed by regional convergence between the much larger Pacific and Australian Plates. The landward extent of the plate boundary between the Trobriand and Australian Plates corresponds to the Owen-Stanley Fault Zone (OSFZ), an onland and continuous 510 km-long left-lateral strike-slip fault that forms a linear, intermontane valley within the elongate Owen-Stanley Range (OSR) and continues as a 250 km-long low-angle normal fault along the margins of Goodenough and Woodlark basins. GPS geodesy reveals that the Trobriand microplate has undergone rapid counter-clockwise rotation since the Late Miocene (8.4 Ma) and that this rotation about a nearby pole of rotation predicts transpressional deformation along the 250 km-long northwestern segment of the OSFZ, strike-slip motion along a 100 km-long central segment, and transtension along the 270 km-long ESE-trending southeastern segment of OSFZ. In order to illustrate the along-strike variations in neotectonic uplift resulting from the changing structure of the OSFZ, we delineated 3903 river segments in the northeastern side of the OSR drainage divide and derived river longitudinal profiles along each river segment. Normalized steepness indices (ksn) and knickpoint clusters are the highest and most concentrated, respectively, for the northwestern transpressional segment of the OSR, moderately high and concentrated along the southeastern segment of the OSR, and the lowest and least concentrated along the central strike-slip segment. These geomorphological indices indicate that most of the plate boundary uplift occurs along the transpressional and transtensional segments that are connected by the central strike-slip zone. Within this overall pattern of structural variation, abrupt changes in the azimuth of the OSFZ create more localized anomalies in the geomorphological indices.
Introduction
The eastern margin of the Papuan Peninsula and the Solomon Sea has been identified using GPS-based geodesy as the landward extent of the 135,000 km2 Trobriand microplate – one of the three microplates in the Woodlark region between the much larger Pacific and Australian Plates (Baldwin et al., 2012; Ott and Mann, 2015). The Woodlark region is formed by orthogonal oceanic spreading at rates of 19–35 mm/yr at the Woodlark Rift in the south and subduction beneath the Bismarck Plates at rates of 67–157 mm/yr at the New Britain and San Cristobal trenches in the north and east (Wallace et al., 2014). To the west, the plate boundary follows the Owen-Stanley Fault Zone (OSFZ) that is dominated by left-lateral oblique convergence, strike-slip, and extension between the Woodlark region and the Australian Plate (Wallace et al., 2004; Daczko et al., 2011; Baldwin et al., 2012; Wallace et al., 2014; Figure 1). With the recognition that slow subduction occurs along the 600 km-long Trobriand Trench and that right-lateral strike-slip motion occurs along the Nubara Transform (Lock et al., 1987; Wallace et al., 2014; Benyshek and Taylor, 2021), the Woodlark region is now perceived as three discrete and active fault-bounded microplates that include the Trobriand Plate in the west, the Solomon Sea Plate in the northeast, and the Woodlark Plate in the southeast (Kington and Goodliffe, 2008; Benyshek and Taylor, 2021).
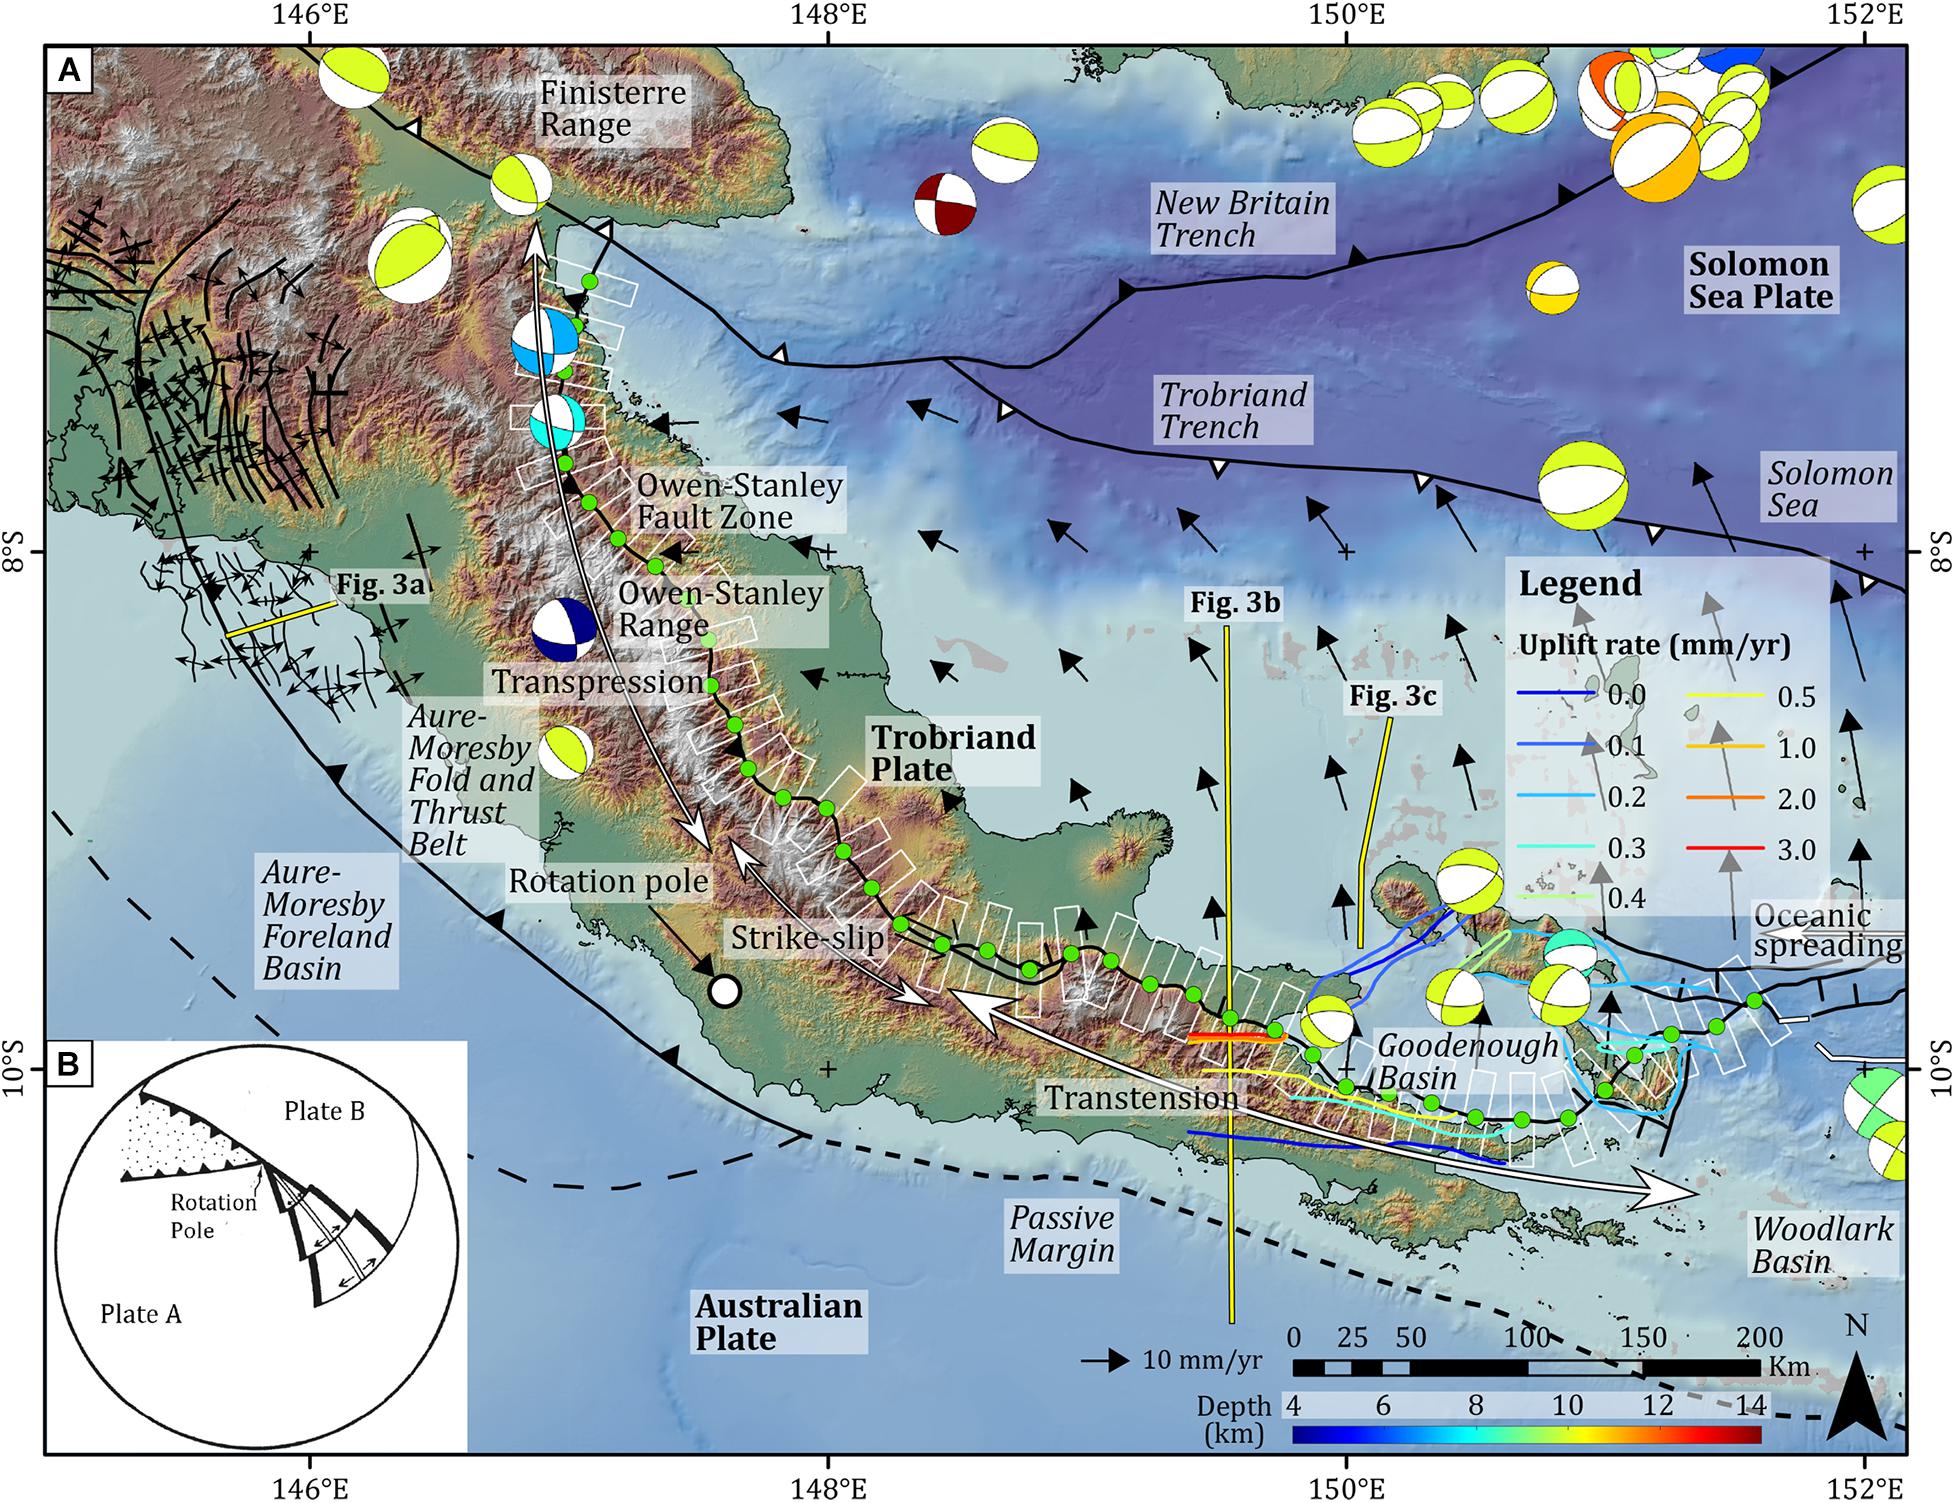
Figure 1. (A) Tectonic setting of the Papuan-Woodlark region with the black arrows showing the active counter-clockwise rotation of Trobriand Plate relative to the much larger Australian Plate about the GPS-constrained pole of rotation on the map from Benyshek and Taylor (2021). The onland Owen-Stanley Fault Zone (OSFZ) extends 510 km along the length of the Papuan Peninsula and marks the boundary between the Australian and Trobriand Plates. The structural and geomorphic character of the OSFZ transitions from transtensional in the southeast where the fault is largely submarine in a coastal setting to strike-slip and transpressional where the fault forms a prominent and linear valley within the more elevated areas of the central and northwestern Owen-Stanley Range (OSR). The green dots are sampled at 20-km intervals along the fault, and the white boxes show the outlines of the swath topography profiles shown in Figures 11, 13. The yellow lines show the locations of the cross sections shown in Figure 3. Colored lines show contours of uplift rates derived from emerged, Holocene coral reefs (Mann et al., 2004). (B) Schematic illustration of the rapid along-strike structural transition from compression to extension about a nearby pole of rotation is modified from De Paor et al. (1989).
Current plate models based mostly on GPS data indicate that the Trobriand Plate is undergoing counter-clockwise rotation relative to the Australian Plate (Wallace et al., 2004, 2014; Koulali et al., 2015; Benyshek and Taylor, 2021; Figure 1). It has been proposed that this rapid microplate rotation about a nearby pole of rotation is driven by a downward pull from the 600 km-long Solomon Sea slab that is subducted at the New Britain Trench that is terminated at its western end by the Finisterre collisional zone (Weissel et al., 1982; Wallace et al., 2014). This slab-driven plate rotation leads to the westward propagation and transition of the Woodlark oceanic spreading center into a more diffuse zone of continental rifting along the southeastern segment of the OSFZ (Abers, 2001; Abers et al., 2016). This large-scale rotation of the Solomon Sea and Trobriand plates also explains the distinctive V-shape of the Woodlark oceanic crust – a hallmark of rotationally-controlled plate boundaries (Figure 1).
The 600 km-long and 60–150 km-wide Papuan Peninsula forms the southeastern part of the island of New Guinea (Figures 1, 2). The mountain range that forms the central spine of the peninsula is called the Owen-Stanley Range (OSR) as it was first described by the English ship captain Owen Stanley as he carried out a naval survey of the region in 1849. The OSR is defined on its northwestern end by Mount Chapman (3,376 m) at its juncture with the even higher New Guinea Highlands (3–4.7 km). From Mount Chapman, the crest of the range increases in elevation to Mount Victoria (4,038 m) in the center of the range and then decreases in a southeastward direction with three peaks in the elevation range of 2.8–3.7 km (Figure 2). The range has few natural passes so most travelers use small boats or ships to circumnavigate the peninsula to access the higher interior areas from the nearest coastal areas. The best-known passes across the range include the Kokoda Trail and the Kapa Kapa Trail that occupy the same 50 km-wide saddle south of Mount Victoria; these two passes connect Port Moresby on the southwestern coast with Buna on the northeastern coast. Both tracks were expanded and used extensively by Japanese, US, and Australian troops during World War II – but proved to be too steep to accommodate vehicles or heavy equipment. The OSR disappears into Goodenough Basin at the southeastern tip of the peninsula.
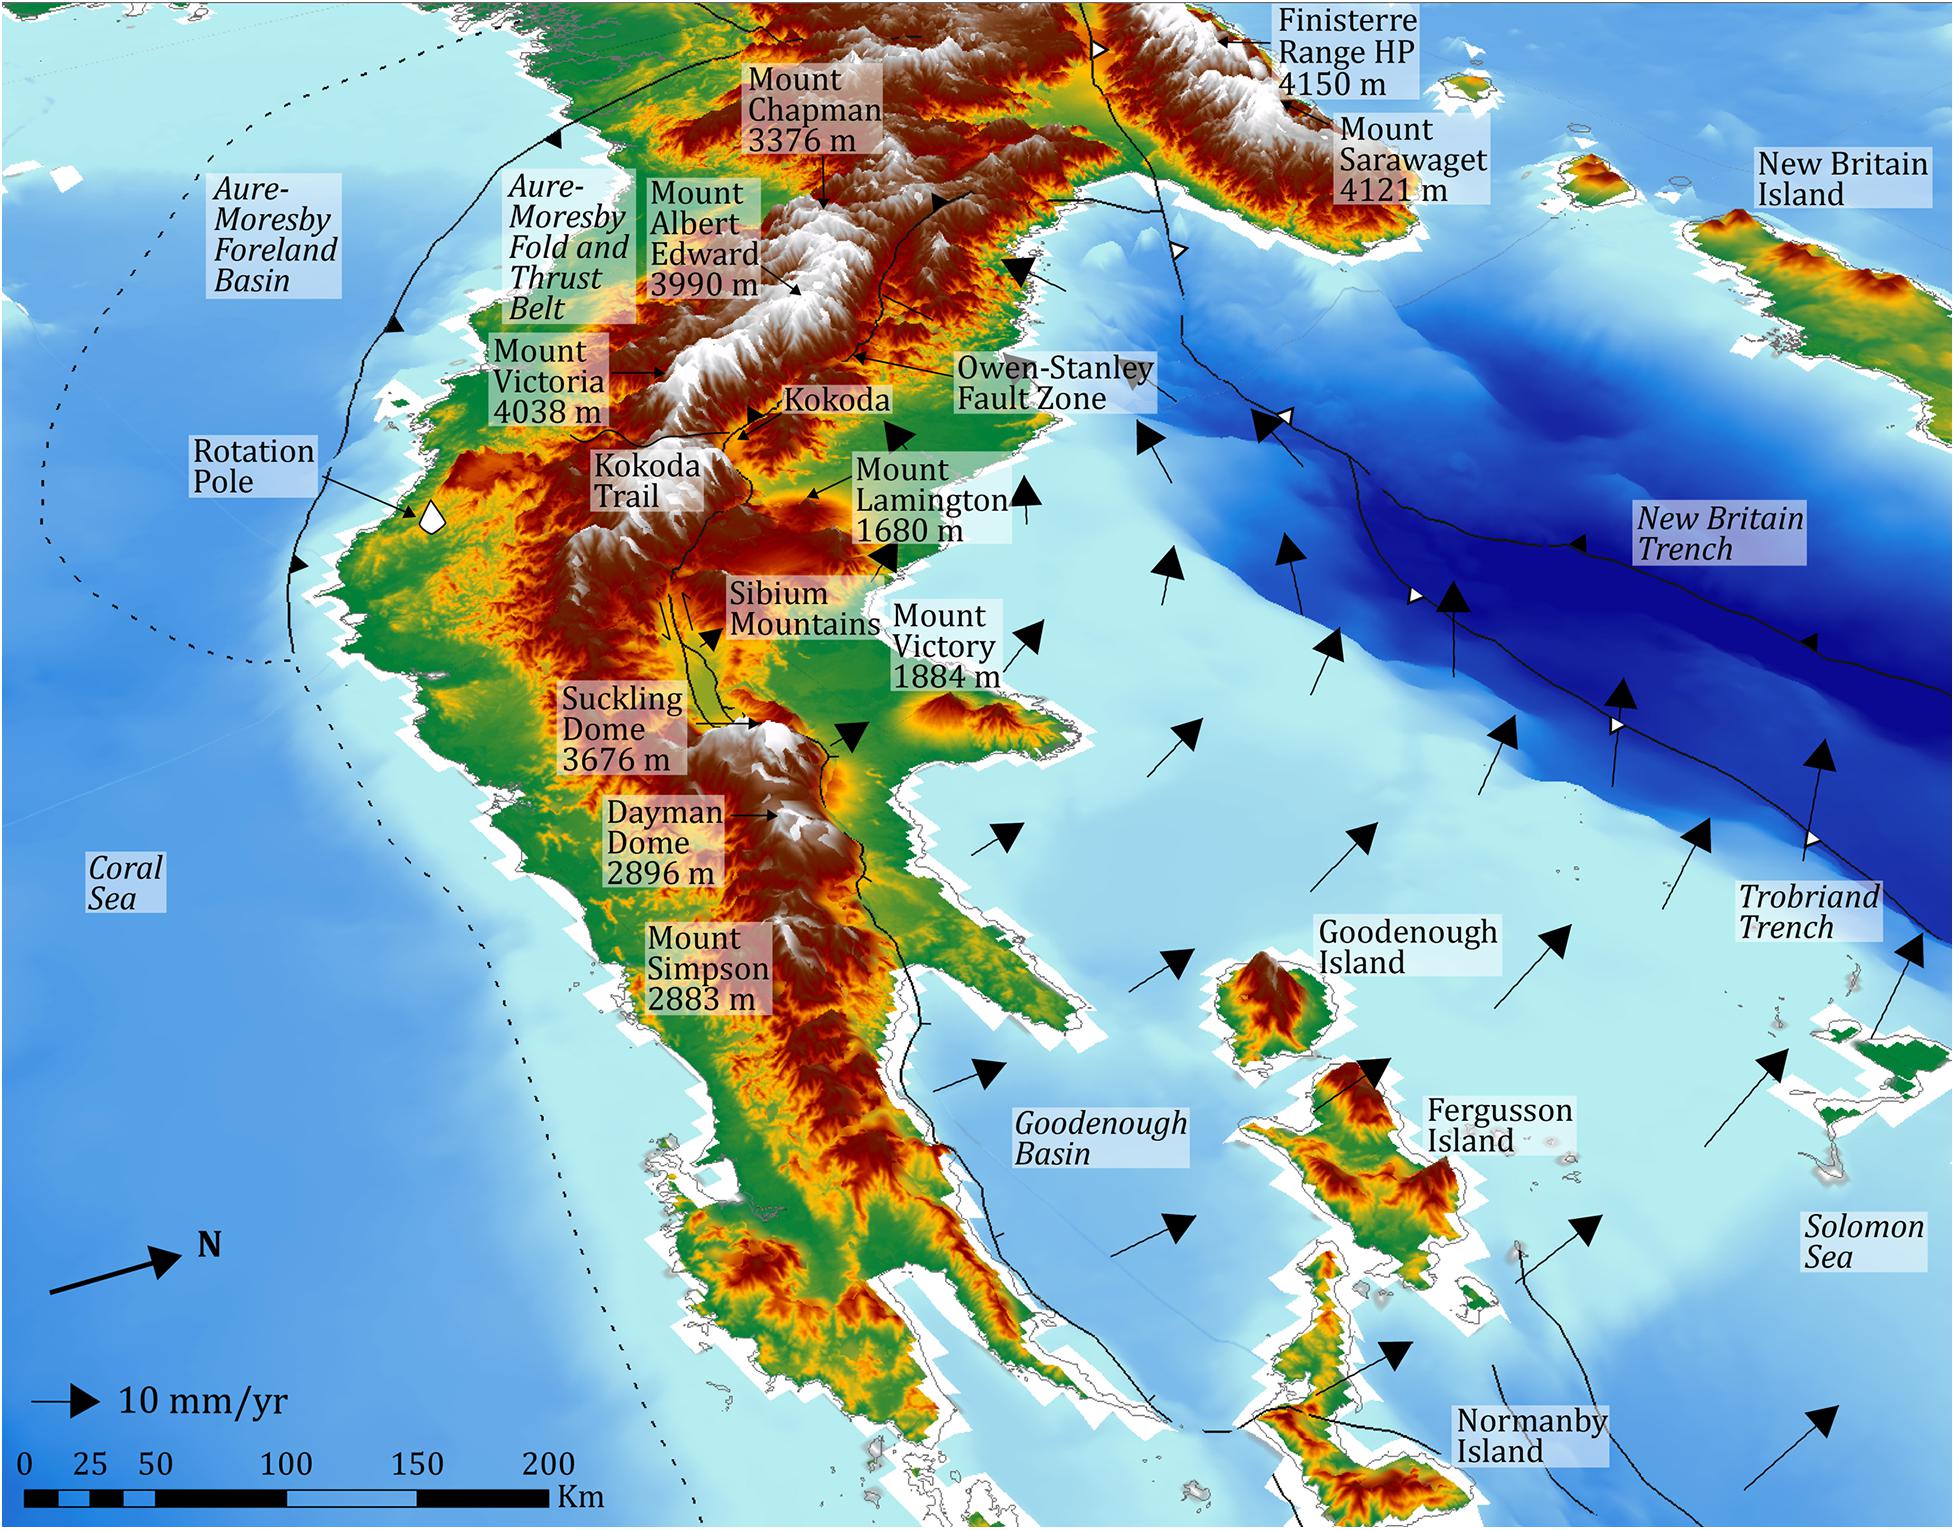
Figure 2. Oblique view of the topography and bathymetry of the OSR of the Papuan Peninsula and the adjacent Goodenough Basin, the Solomon Sea, and the New Britain Trench. The counter-clockwise rotation of the Trobriand Plate is inferred to result from the rapid subduction (67–157 mm/yr) of the Solomon Sea Plate along the New Britain Trench and its transition to the west with the collisional zone of the Finisterre arc with the Australian margin (Wallace et al., 2014). The areas northwest of Mount Lamington are subject to transpression whereas the areas to the southeast of the pole of rotation and the Sibium Mountains are subject to transtension as shown schematically in Figure 1B. South of Goodenough Island and Ferguson Island, continental rifting becomes more pronounced and produced the rifting that formed Goodenough Basin. Mount Lamington and Mount Victory are active, andesitic stratovolcanoes produced by slow subduction of the Solomon Sea plate at the Trobriand trench. This volcanic line is colinear with the domal core complexes of Goodenough and Fergusson Islands.
Because of the proximity of its pole of rotation, the OSFZ changes very rapidly along its strike from its 250 km-long northwestern transpressional segment between Mount Chapman and the Sibium Mountains to its 100 km-long central strike-slip segment area adjacent to the Sibium Mountains and extending to its 270 km-long southeastern segment from Suckling Dome (3,676 m) to the southeastern tip of the Papuan Peninsula at sea level (Figures 1–3). This structural change from transpression to strike-slip and to transtension occurs over a very short distance of about 200 km. The northwestern transpression is also expressed by a broad zone of Miocene and younger anticlines in the Aure-Moresby fold and thrust belt (Figure 1A). Earthquake focal mechanisms from the USGS Comprehensive Earthquake Catalog (U.S. Geological Survey, 2020) show oblique extension along the transtensional southeastern fault segment (Figure 1A). Several 9-km long NNE-SSW corrugations on Dayman Dome show the normal slip along the southeastern transtensional segment of OSFZ (Figure 3; Daczko et al., 2011).
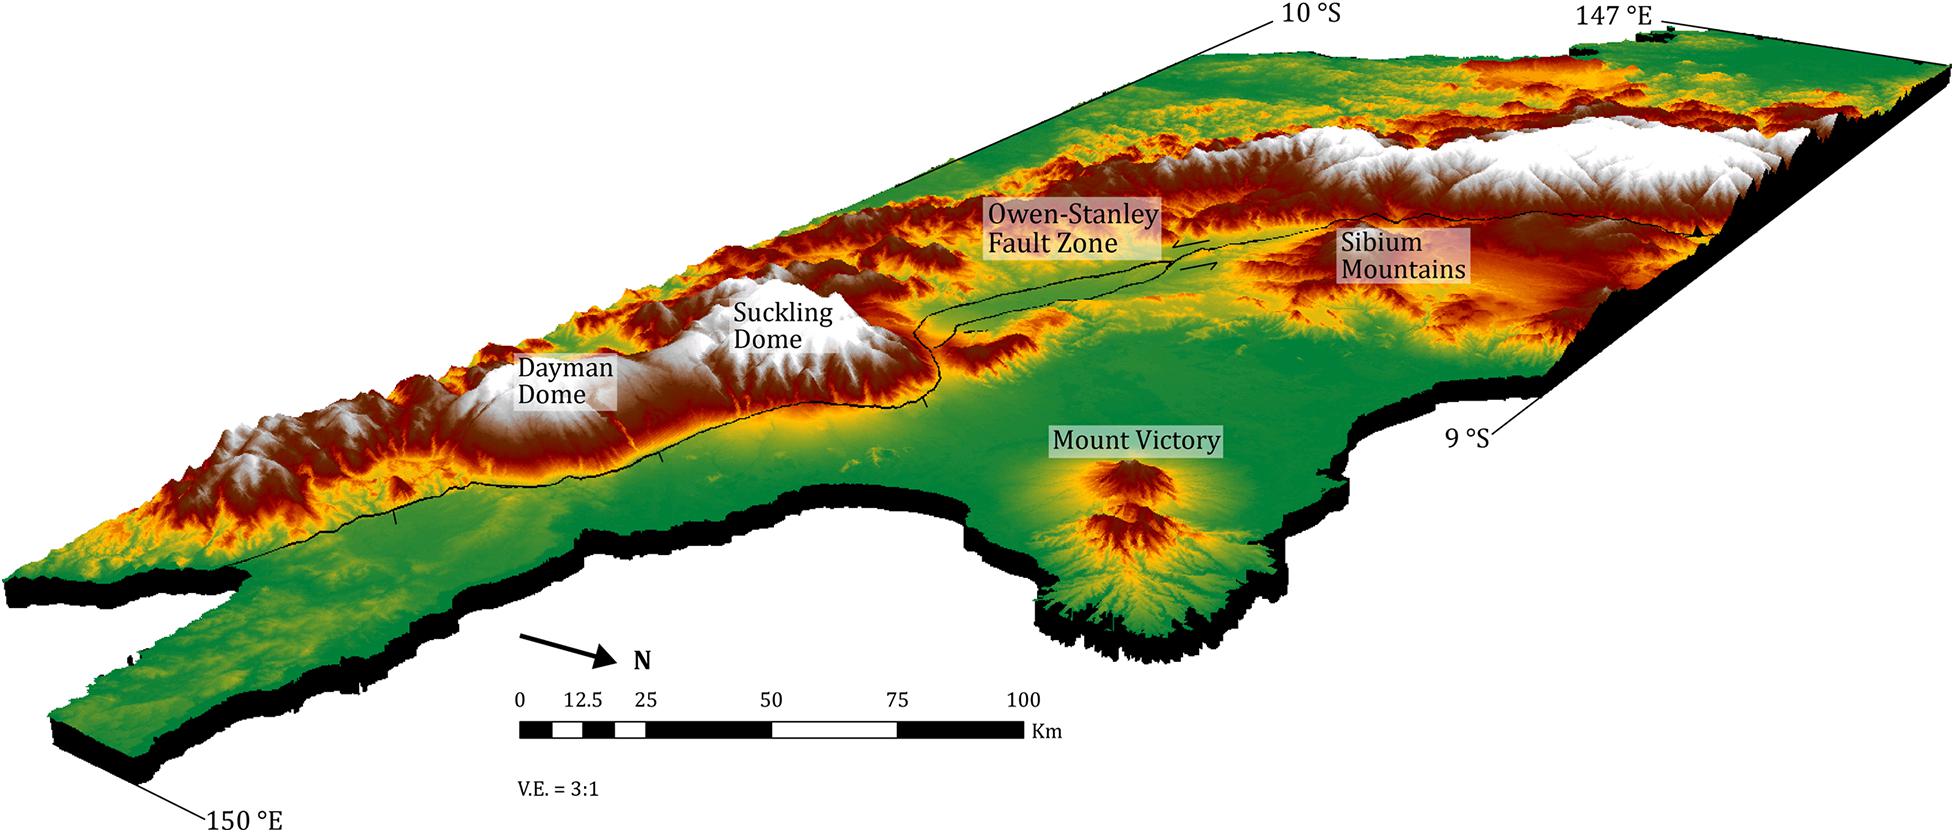
Figure 3. Oblique view of the topographic transition along the southern OSFZ of the Papuan Peninsula based on the SRTM DEM (Farr et al., 2007). The corrugations on the northern flank of the Dayman Dome show normal slip along the southeastern transtensional segment of OSFZ. Vertical exaggeration is 3:1.
An ancient analog for “near-pole orogeny” – characterized by compression on one side of a pole of rotation and extension on the opposite side of the pole – has been proposed as a tectonic mechanism for Eocene compression during the Eurekan orogeny that deformed the present-day area of Ellesmere Island. This compression accompanied the Eocene oceanic spreading of the V-shaped Labrador Sea as conceptually shown in Figure 1B (De Paor et al., 1989). In this case, previous workers have shown that the age of shortening on Ellesmere Island is the same as the age of oceanic spreading in the adjacent Labrador Sea. Similarly on the Papuan Peninsula, previous studies (Fitz and Mann, 2013a,b; Ott and Mann, 2015) have shown that compression and extension along the 510 km-long OSFZ that has been active simultaneously since Late Miocene (8.4 Ma) (Figure 4).
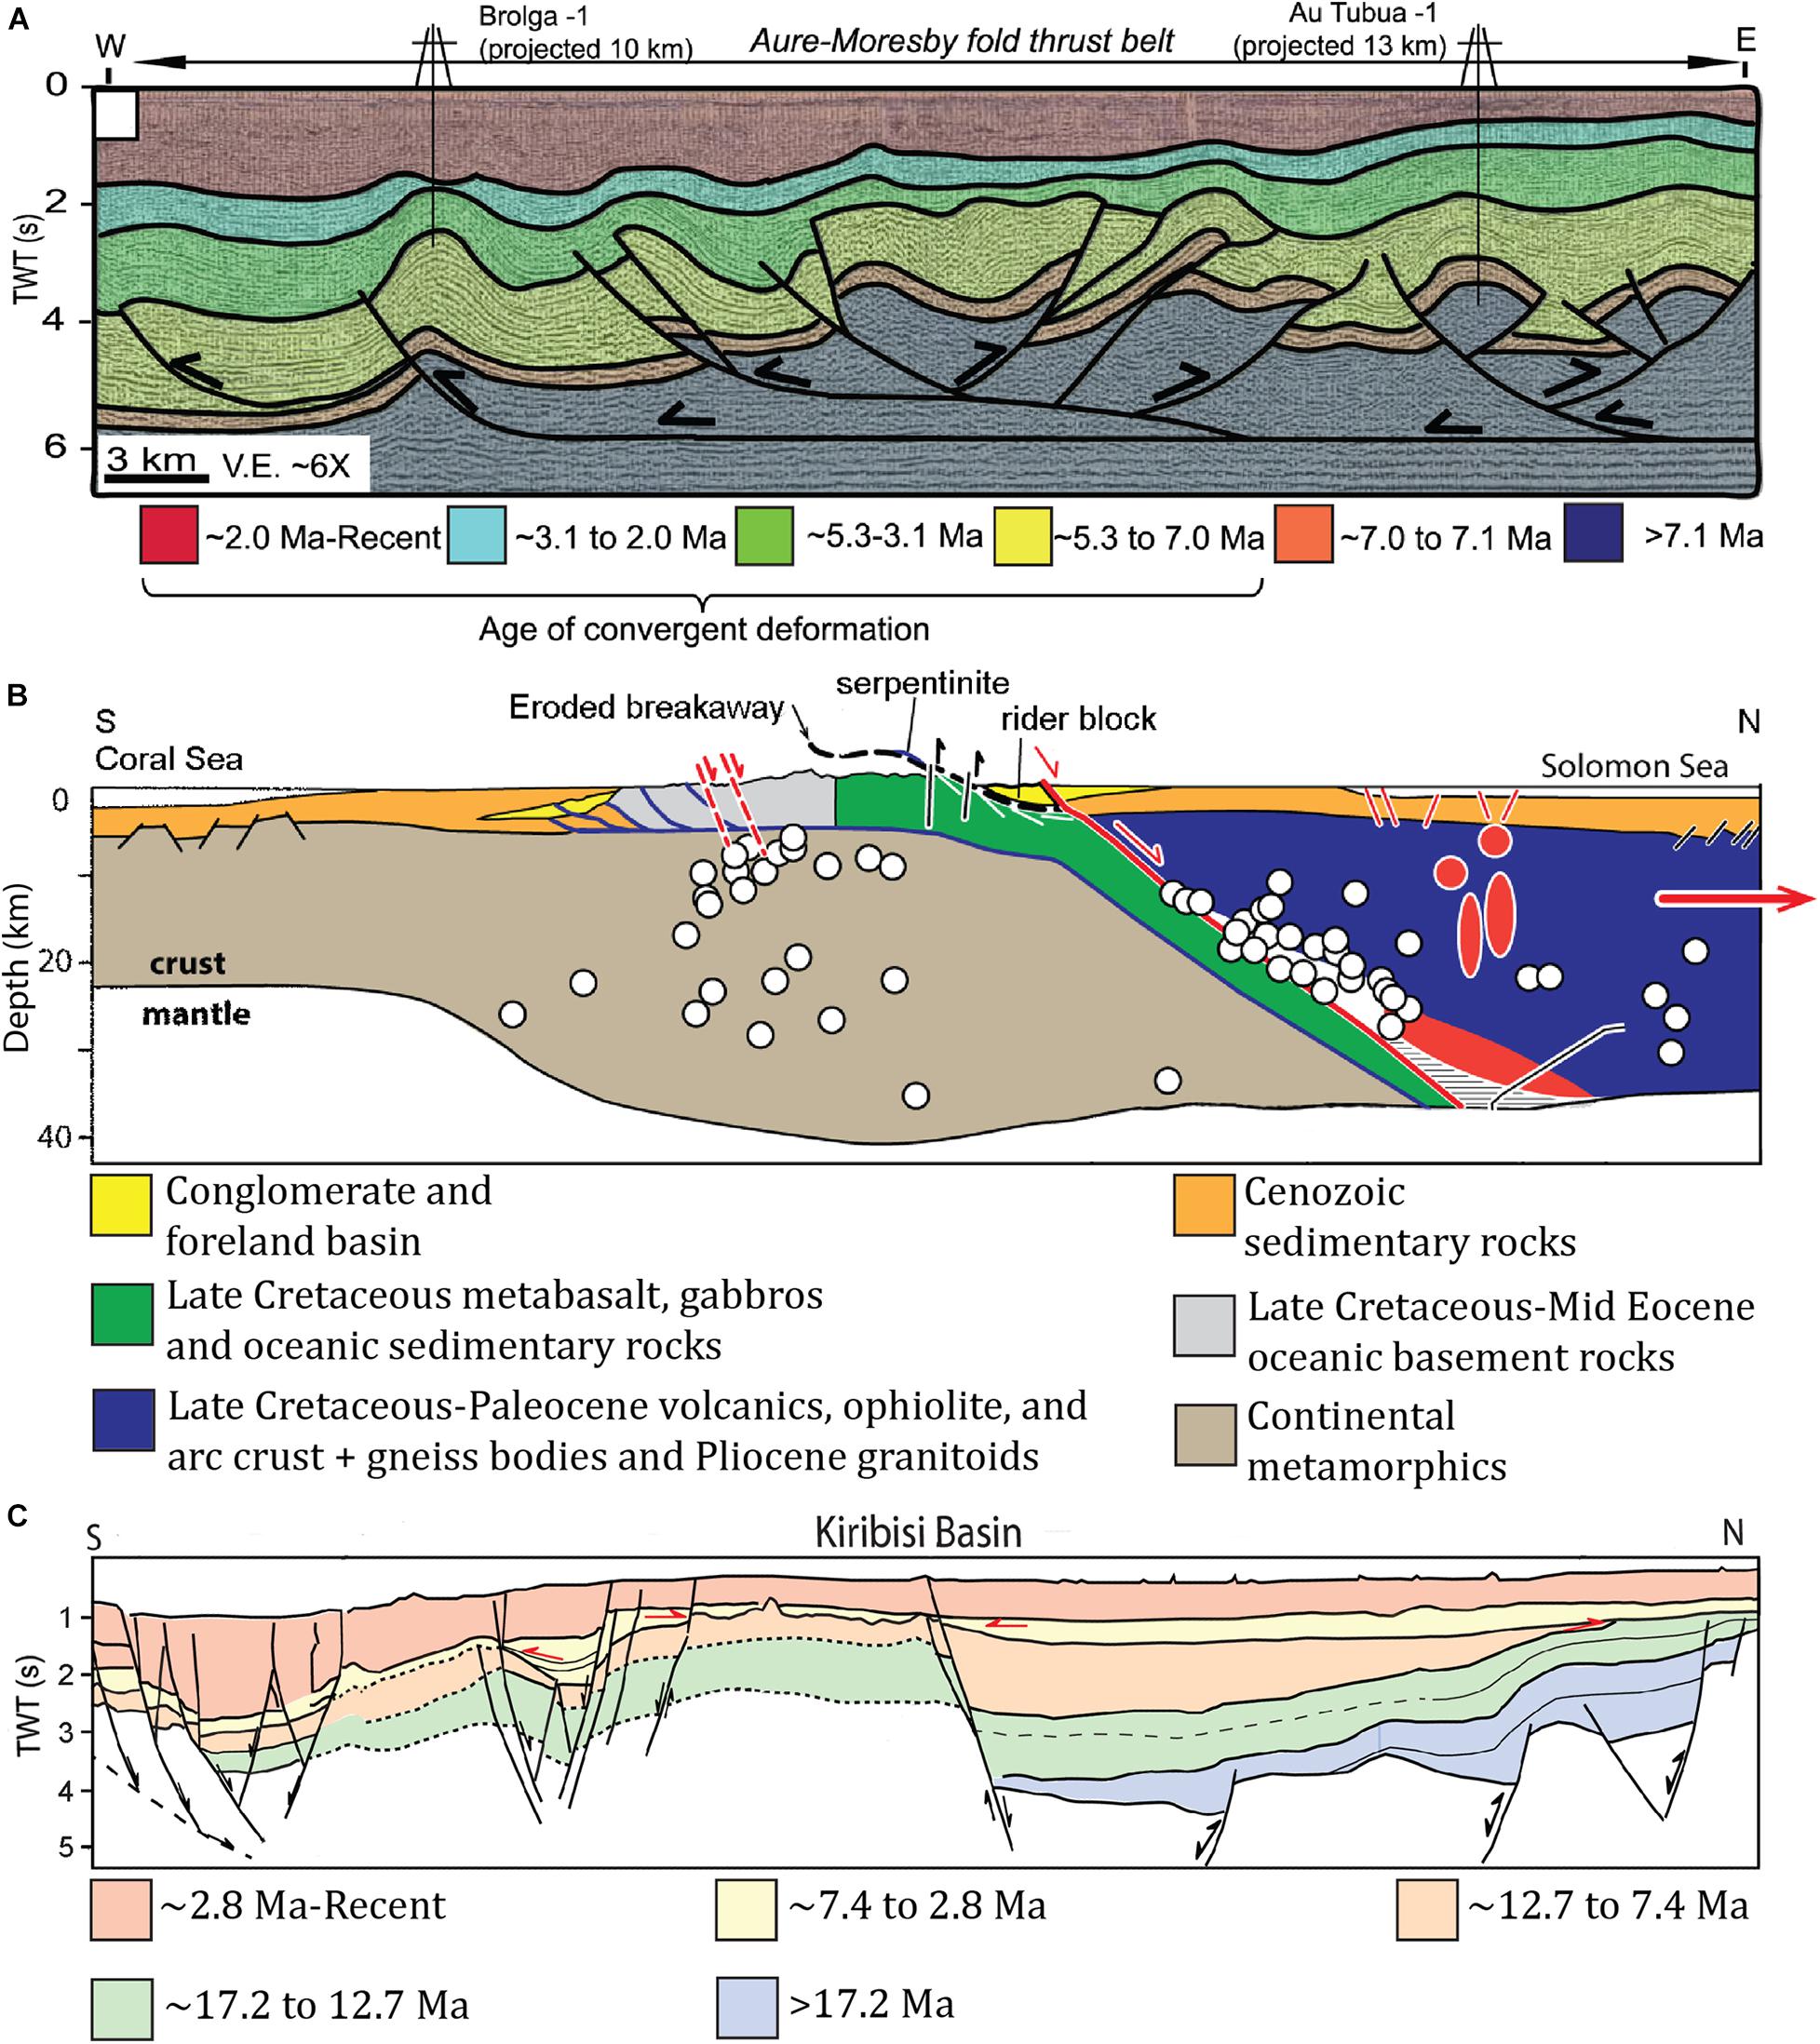
Figure 4. Three regional cross sections located on the map in Figure 1 that illustrate the changing structural style along the OSFZ. (A) Transpressional, northwestern region of the Aure-Moresby fold-thrust belt exhibits elevated areas with peaks reaching as high as 4,038 m; plate motion is highly transpressional and partitioned into left-lateral shear along the OSFZ and across a 160 km-wide zone of thrusting that formed the Aure-Moresby foreland basin along the western side of the OSR; the age of thrusting based on syn-deformational deposits is late Miocene to Recent (Ott and Mann, 2015); the pole of rotation separates the Miocene to Recent, transpressional Aure-Moresby foreland basin to the north from an older Paleogene rifted-passive margin of the Coral Sea to the south (Ott and Mann, 2015; Bulois et al., 2018). (B) In the transtensional, southeastern region, the Suckling Dome (3,676 m) and Dayman Dome (2,896 m) are footwall blocks elevated along low-angle (16–21°) normal faults of Late Miocene to Recent age (Little et al., 2019; Biemiller et al., 2020a,b); cross section is modified from Little et al. (2019). (C) The hanging wall block of the low-angle normal fault segment of the OSFZ forms Goodenough Basin (water depth over 1,300 m) (Fitz and Mann, 2013b). Age of rifting from syn-rift wedging in the Goodenough Basin region is Late Miocene to Recent (Fitz and Mann, 2013b) and is coeval with transpression along the northern OSFZ as schematically shown in Figure 1B.
The rugged and sparsely populated northwestern transpressional area of the OSFZ remains poorly studied compared with the more accessible and populated central strike-slip and southeastern transtensional fault segments near Suckling and Dayman Domes (Daczko et al., 2011; Little et al., 2019; Biemiller et al., 2020a,b) and the coastal areas adjacent to Goodenough Basin, a large submarine half-graben that has been mapped by marine geophysical studies (Little et al., 2011; Fitz and Mann, 2013a,b). In this study, we use satellite-based remote sensing data to better understand the remote, northwestern segments of OSFZ and to illustrate the remarkably rapid geomorphic transitions of all three segments of the OSFZ.
Materials and Methods
Tectonic geomorphology quantitatively evaluates the competing processes of neotectonic uplift and river incision. If the tectonic uplift rate does not surpass the fluvial incision rate, the river incises into bedrock and an equilibrium state between uplift and incision is quickly achieved (Begin et al., 1981; Snow and Slingerland, 1987; Hume and Herdendorf, 1988; Roering et al., 2001). If the tectonic rate surpasses the fluvial incision rate, the riverbed is steadily being elevated and river slopes become progressively steeper (Hovius, 2000). For each river, a longitudinal profile can be constructed by plotting riverbed elevations against distances to the river mouth. Rivers in equilibrium form longitudinal profiles that are concave upward; rivers that are not in equilibrium are characterized by a riverbed segment that is uplifted, over-steepened, incised, and contains a knickpoint in the upstream direction (Kirby and Whipple, 2001). Knickpoints mark the sudden changes from gentler to steeper slopes and appear convex upward on river longitudinal profiles.
In this study, we first extract detailed maps of the river network from the NASA Shuttle Radar Topography Mission (SRTM) global digital elevation model (DEM) version 3.0 (Farr et al., 2007). In order to down-sample the topography into a coarser resolution and to limit the computation expense, the 1 arc-second data (about 30 m) over the Papuan Peninsula are mosaicked together and resampled to 3 arc-second (about 90 m). The mosaic is projected into UTM Zone 55S so that the grid cells have the same geodetic sizes. The river network is then delineated using the hydrology toolbox in ArcGIS 10.7 (ESRI, Redlands, CA, United States). We used a 5 km2 cutoff for catchment areas to study only the fluvial rivers (Willgoose et al., 1991). Applying the same procedure to a smaller test subset of a higher resolution (1 arc-second) resulted in the same river network pattern with the pattern from the lower resolution (3 arc-second) subset data; this test enhanced the credibility of our river-delineating methodology. For bathymetric data, we used the GEBCO 2020 digital grid which has a 15 arc-second spatial resolution (about 470 m) (GEBCO Bathymetric Compilation Group, 2020).
To compare river steepness for different areas, we calculate the normalized steepness index (ksn) for each river data point by:
where Slope represents the elevation gradient along the river, A represents the catchment area of that river point, and θref is the reference concavity index and typically 0.45 is used (Wobus et al., 2006). Elevation values are smoothed using a moving average filter (Durbin, 1959) of about 1 km-wide moving window through the river profiles. Higher ksn values indicate that the river is relatively steeper as commonly observed in tectonically active areas. These ksn values are then averaged within each river segment and interpolated into a ksn surface which highlights the areas of most active tectonic uplift with the highest ksn values. We also extracted knickpoints from the river longitudinal profiles that mark slope increases greater than 3° in order to highlight areas of active uplift.
Results
Constraints on Active Left-Lateral Strike-Slip Along the OSFZ
Using satellite photography and digital topography, we identified three areas of left-lateral strike-slip in the remote forest-covered areas of northwestern OSFZ and the floodplain area of the central OSFZ (Figure 5). In the northernmost area, a river junction is displaced northward by the OSFZ for a distance of 2.25 km in a left-lateral sense (Figure 5B). This left-lateral displacement of the OSFZ is consistent with both GPS results and earthquake focal mechanisms from this area (Figure 1A). The two northeast-flowing river segments are separated by shutter ridges within the main trace of the OSFZ. The map in Figure 5C illustrates a possible left-stepping pull-apart basin that formed the isolated Lake Trist that overlies the trace of the OSFZ. Figure 5D shows a larger left-stepping pull-apart basin along central OSFZ. The outlet of this basin in the center of Figure 5D is a water gap that the Musa River has eroded through the elevated ridge northeast of the basin.
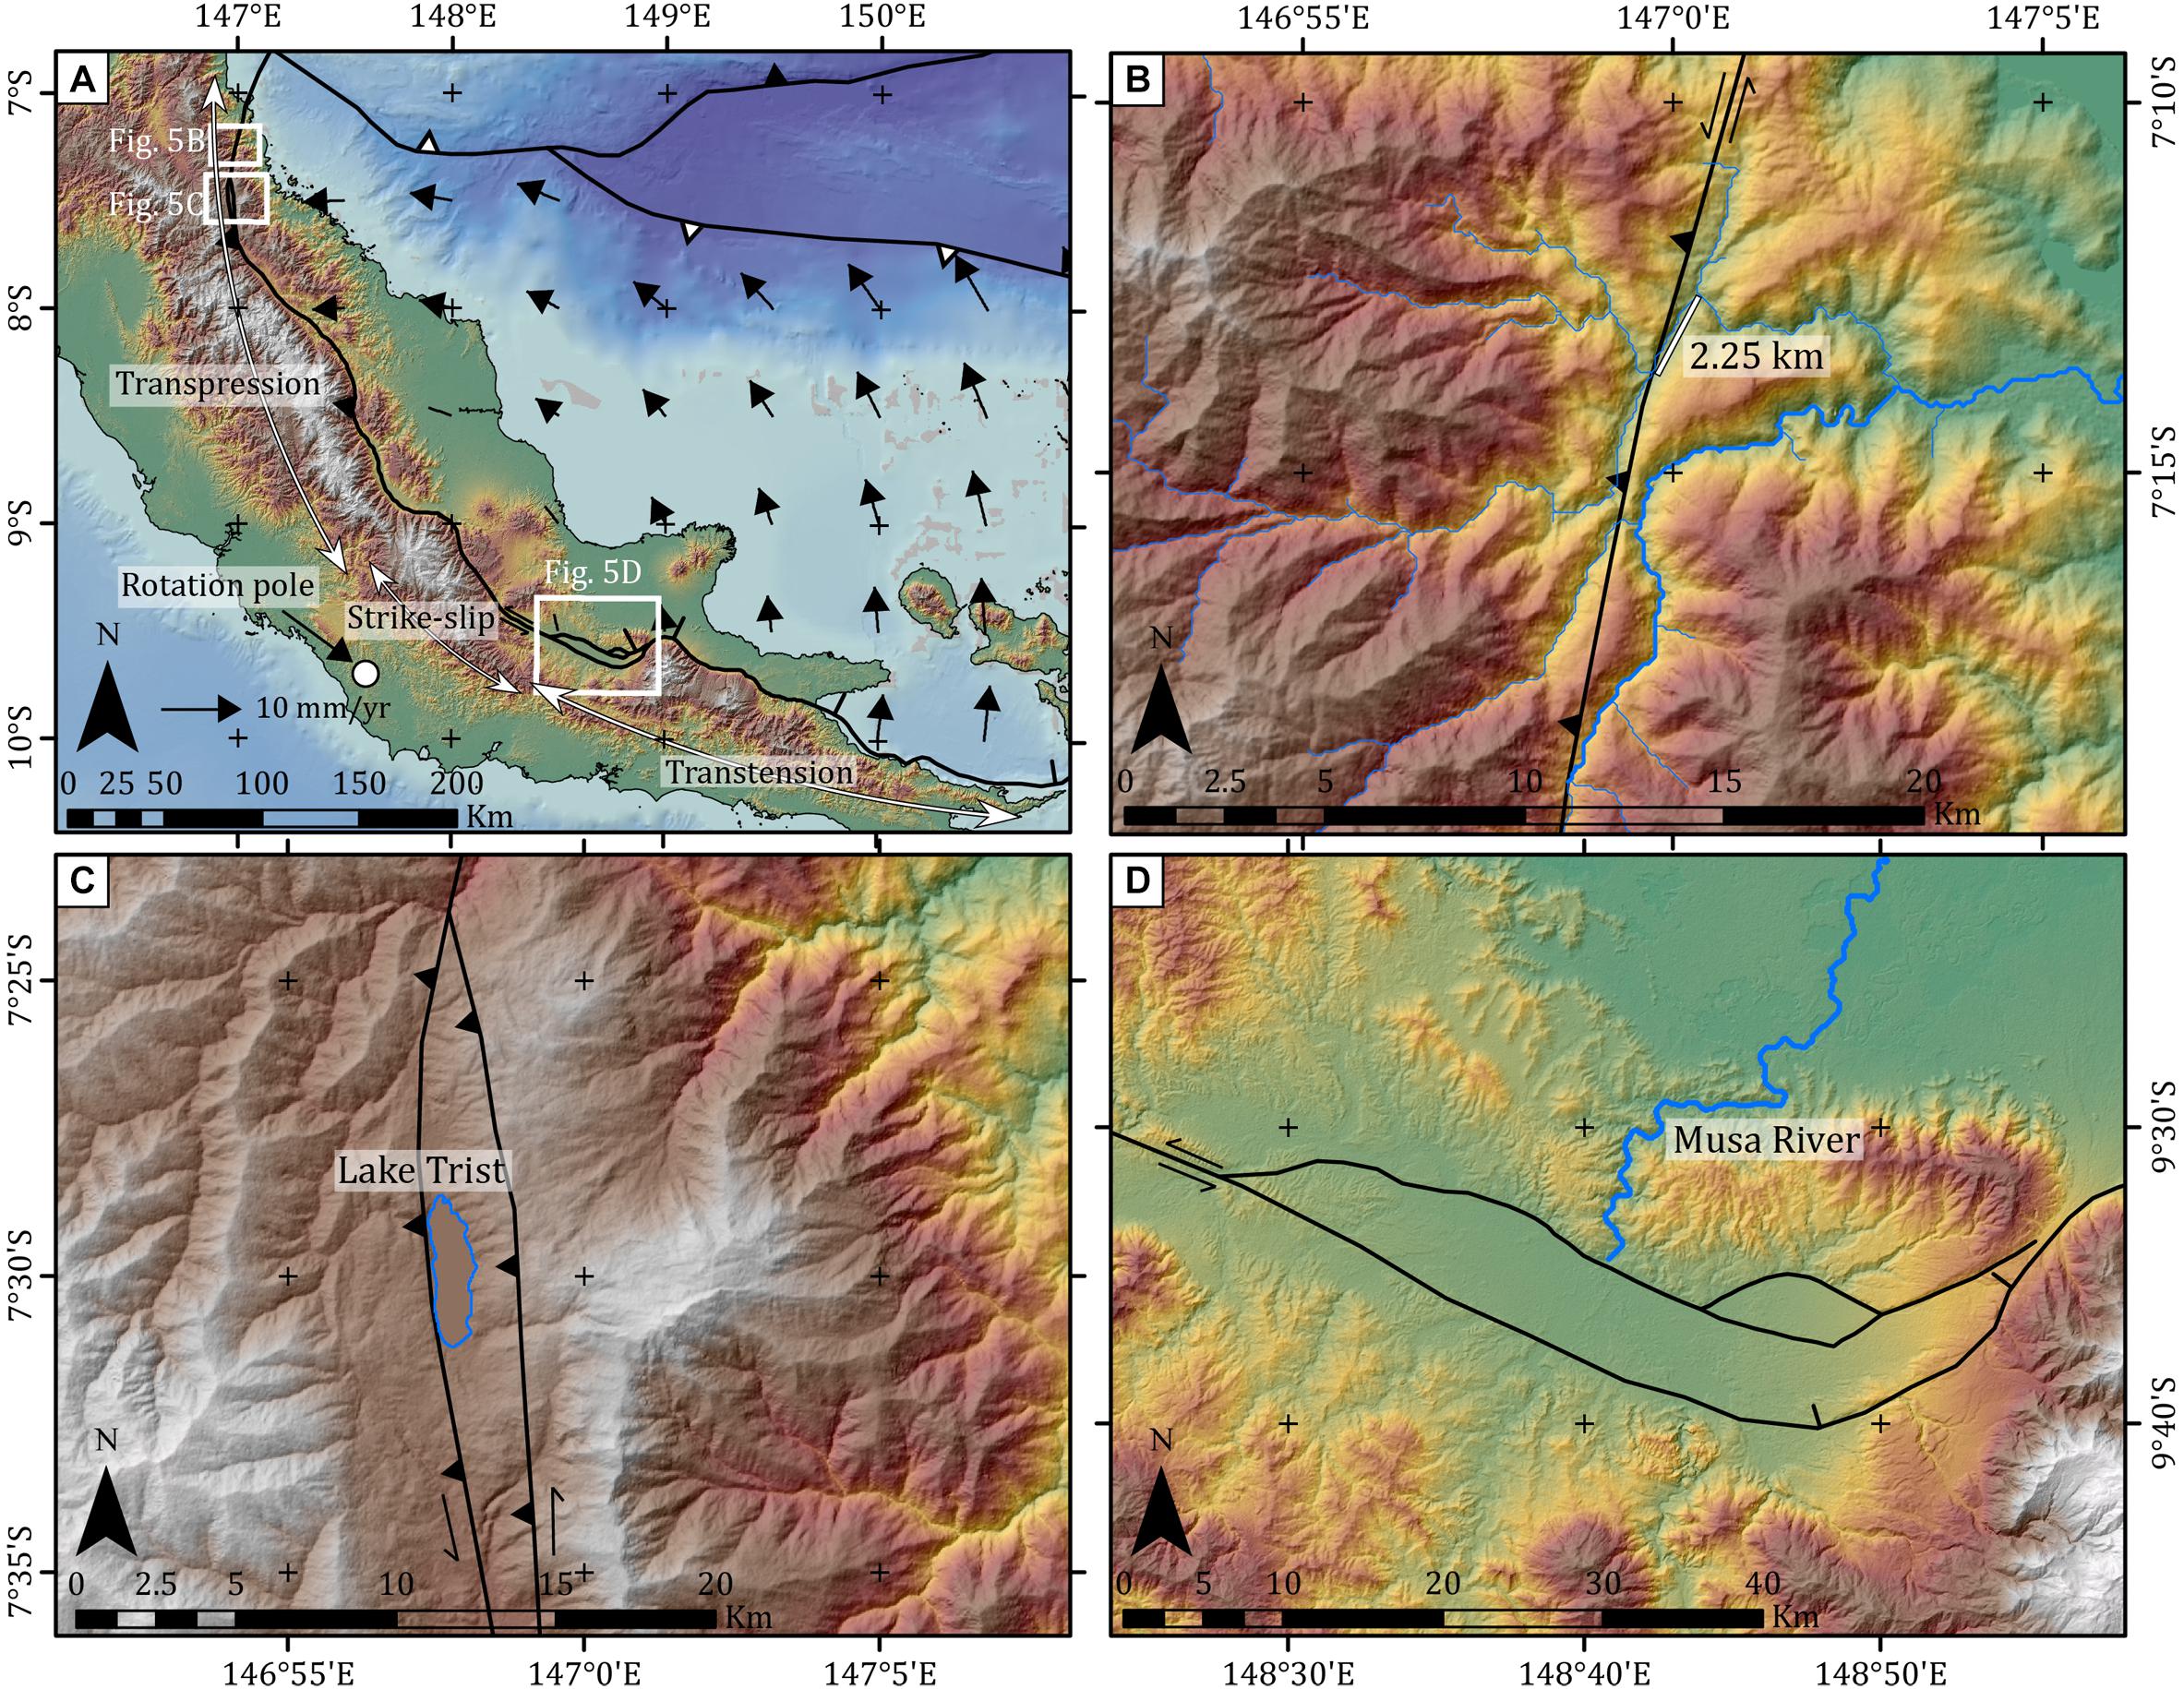
Figure 5. (A) Geomorphic indicators of active left-lateral strike-slip displacement along the OSFZ; map locations of zoomed areas (B–D) are shown; (B) Apparent left-lateral disruption of the drainage pattern with a maximum offset of 2.25 km of left-lateral displacement; (C) Lake Trist is an isolated, 4.32 km2 lake that either formed as a pull-apart basin at a left-step in the fault trace or formed along the downthrown side of the large west-dipping thrust; (D) a larger 250 km2 pull-apart basin in the central OSFZ that exhibits a water gap outlet for the Musa River. The surrounding area of this basin to the northeast and southwest forms one of the lower passes that traverses the OSR between Suckling Dome and the Sibium Mountains.
The left-lateral strike-slip character of the northwestern and central OSFZ is consistent with the counter-clockwise rotation of the Trobriand Plate around a rotation pole at 147.6°E, 9.7°S at 2.560°/Myr relative to a fixed Australian Plate (Benyshek and Taylor, 2021; Figures 1, 2, 5). Along the strike of OSFZ, the counter-clockwise plate rotation translates the Trobriand Plate toward north-northwest to produce transpressional deformation along the northwestern segment, strike-slip deformation along the central segment, and transtensional deformation along the southeastern segment. These transitions occur over distances as short as 200 km and produce significant geomorphological variability. On the Australian Plate, both the transpressional and transtensional areas produce much higher and more rugged topographic relief while the intervening strike-slip area exhibits a much lower topographic relief (Figures 2, 3, 5). We use the tectonic geomorphology of river systems to quantitatively illustrate these rapid along-strike variations.
River Network and Geomorphologic Indices Along OSFZ
The river network in the northeastern side of the OSR drainage divide is disrupted by the OSFZ as shown in Figure 6. Eighteen basins that cross the OSFZ are delineated and labeled from northwest to southeast (Figure 6). Some basins like c, f, and h are much wider in the upstream than in their downstream areas (i.e., these basins cross the OSFZ over larger distances). The mean ksn values of river segments are higher along the OSR that occupy the Australian Plate as compared to the areas of gentler slope northeastern of the OSFZ that occupy the Trobriand Plate (Figure 7).
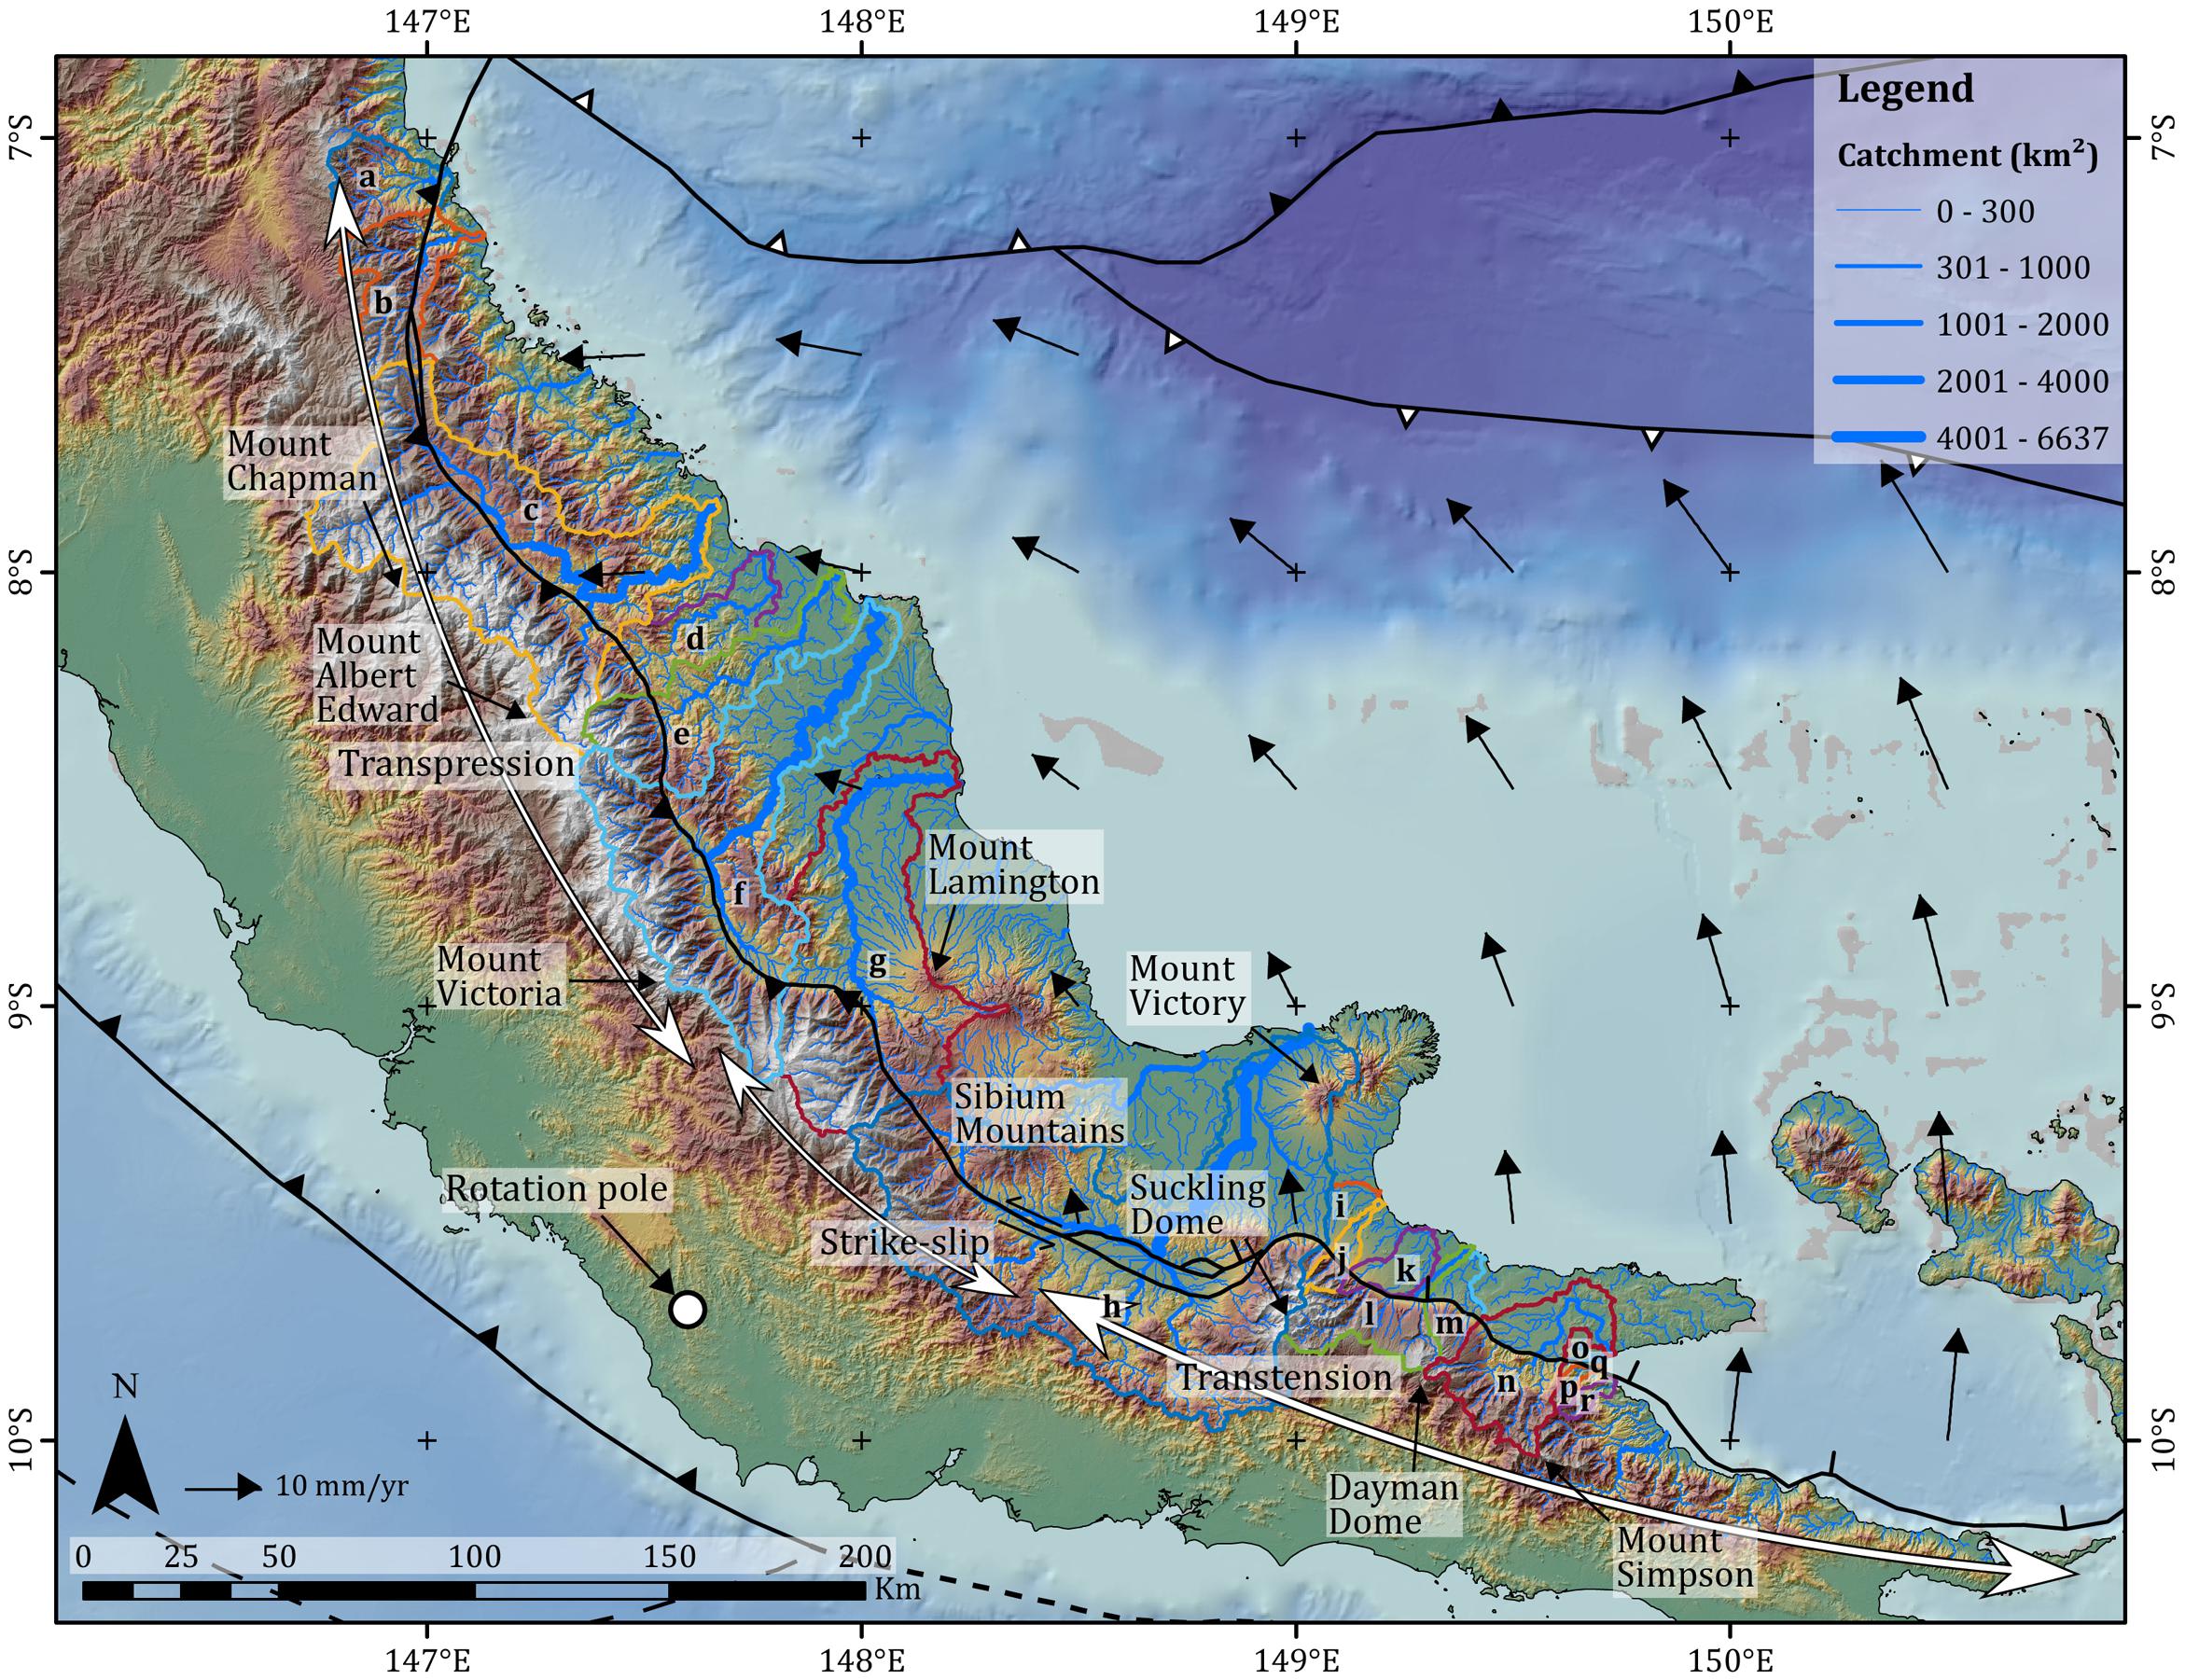
Figure 6. Map of the river network derived from the SRTM DEM that crosses the OSFZ along the northeastern side of the Papuan Peninsula. Line widths in blue represent the catchment areas and are scaled by their relative line thicknesses to show the relative flow rates of the rivers. Boundaries of 18 basins are outlined in color and are keyed by letters which are also used to name rivers and basins in Figures 12 and 14. The black arrows show the counter-clockwise rotation of the Trobriand Plate relative to the Australian Plate (Benyshek and Taylor, 2021). The white dot indicates the rotation pole of the Trobriand Plate.
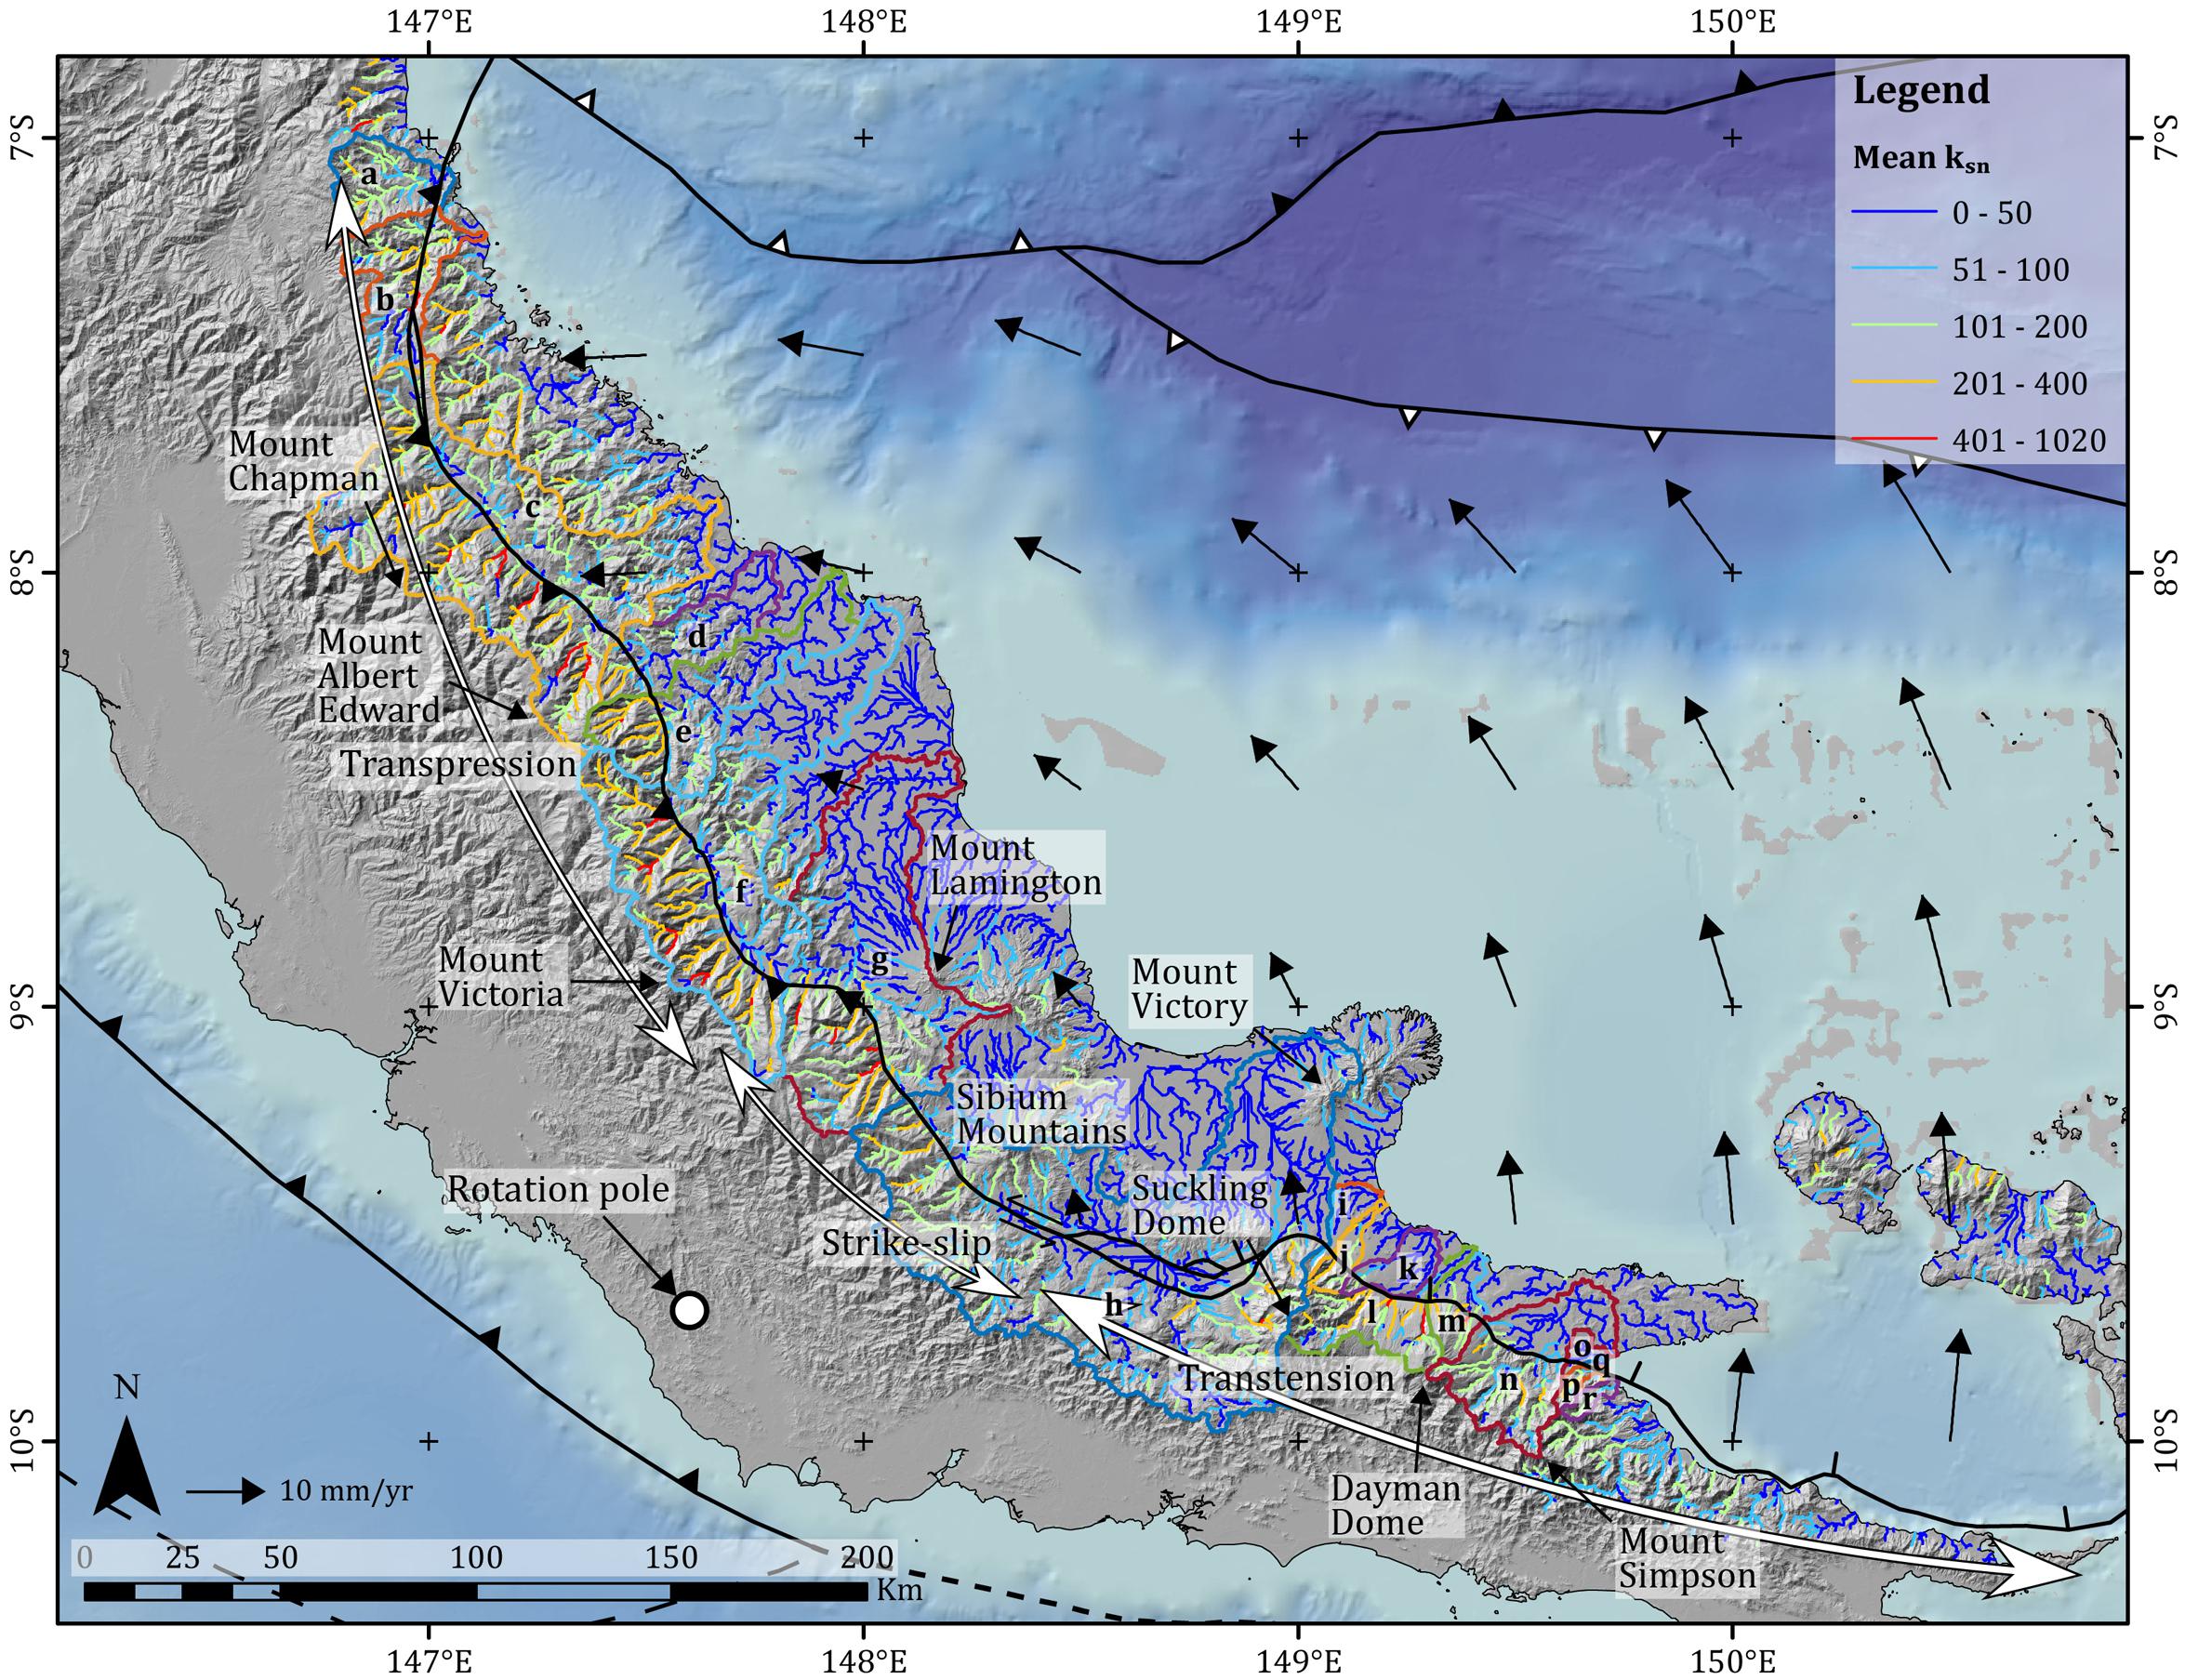
Figure 7. Mean normalized steepness index (ksn) values of river segments crossing the OSFZ along the northeastern side of the Papuan Peninsula. Lower ksn values are shown with blue and cyan colors and higher ksn values are shown with red and yellow colors. Boundaries of 18 basins are outlined in color and are keyed by letters which are also used to name rivers and basins in Figures 12 and 14. The black arrows show the counter-clockwise rotation of the Trobriand Plate relative to the Australian Plate (Benyshek and Taylor, 2021). The white dot indicates the rotation pole of the Trobriand Plate. The highest ksn values are clustered near Mount Albert Edward and Mount Victoria in the transpressional area and in basin g in the strike-slip area. The second highest ksn values are clustered along both the transpressional and transtensional segments of the OSFZ that occupy the Australian Plate. These high ksn values indicate areas of active neotectonic uplift.
The highest ksn values are clustered along the northwestern transpressional segment of the OSFZ near Mount Albert Edward and Mount Victoria and in basin g in the central strike-slip area (Figure 7). The second highest ksn values are clustered along both the transpressional and transtensional segments of the OSFZ that occupy the Australian Plate. The central and southeastern, strike-slip to transtension transition areas on the Australian Plate, and adjacent areas on the Trobriand Plate all show low ksn values.
These ksn distribution trends are better illustrated from a Kriging interpolation surface based on the river ksn values (Figure 8). It should be noted that the areas of the highest elevations along the drainage divide of OSR (i.e., Mount Albert Edward and Mount Victoria) do not show high ksn values. This observation does not mean that these areas are not being actively uplifted as shown by the relatively lower ksn values. This index only applies to rivers (defined by a catchment area of at least 5 km2 in this study) and would not apply to smaller, alluvial streams. The areas of the highest elevations and small catchment do not have ksn values, and the apparent lower ksn values are interpolations in areas of data not applicable.
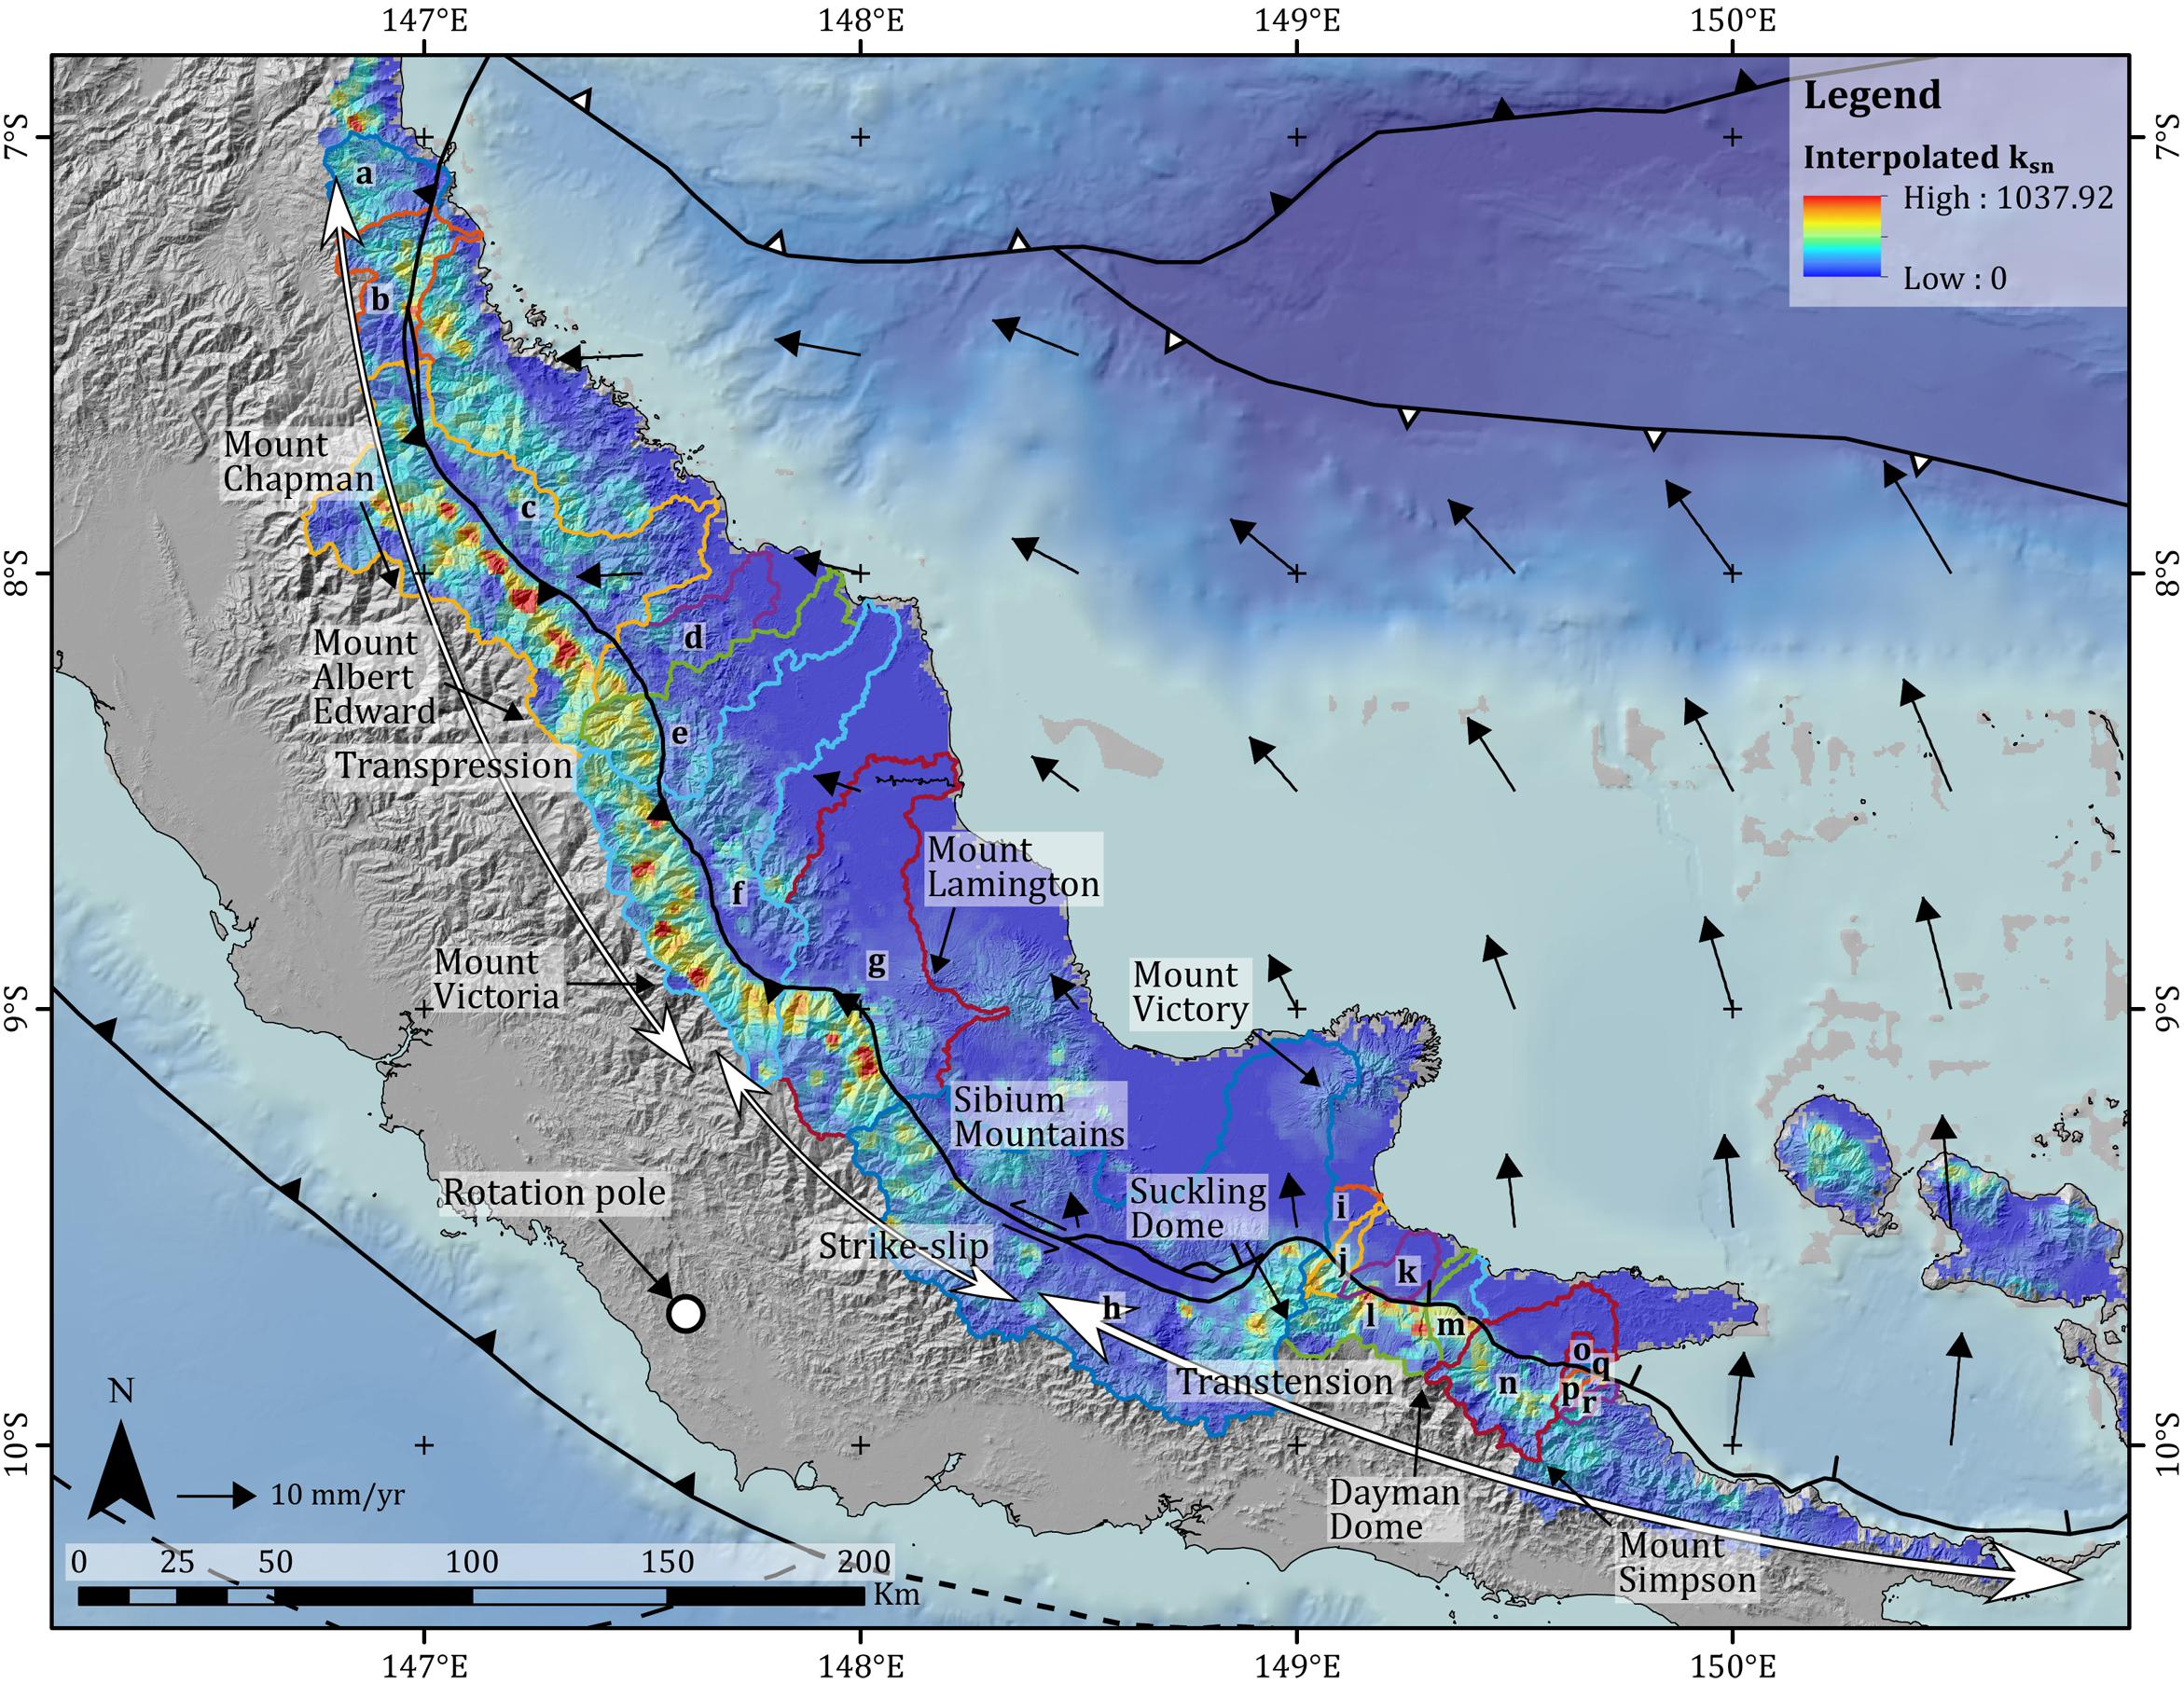
Figure 8. Interpolation surface of the normalized steepness index (ksn) values along river segments crossing the OSFZ along the northeastern side of the Papuan Peninsula. Lower ksn values are shown with blue and cyan colors and higher ksn values are shown with red and yellow colors. Boundaries of 18 basins are outlined in color and are keyed by letters which are also used to name rivers and basins in Figures 12 and 14. The black arrows show the counter-clockwise rotation of the Trobriand Plate with reference to the Australian Plate (Benyshek and Taylor, 2021). The white dot indicates the rotation pole of the Trobriand Plate. The highest ksn values are clustered near Mount Albert Edward and Mount Victoria in the transpressional areas and in basin g in the strike-slip area. The second highest ksn values are clustered along both the transpressional and transtensional segments of the OSFZ that occupy the Australian Plate. These high ksn values indicate areas of active neotectonic uplift.
Knickpoints
In the eighteen watershed basins along the northeastern side of the Papuan Peninsula, prominent knickpoints were mapped within a 50 km-wide swath along the OSFZ and across large variations in topographic elevation (200–3167 m) (Figure 9). These observations indicate that neotectonic uplift is mainly confined to the area of the OSFZ rather than being more widely distributed across the width of the elevated areas of the OSR. Knickpoints are more clustered on the Australian Plate than on the Trobriand Plate (Figure 9). The highest kernel densities – kernel density indicates how well features are clustered – of knickpoints occupy the northwestern transpressional area, with the second highest kernel densities occupying the southeastern transtensional area. These knickpoints signify that the most active uplift is closely aligned with the OSFZ within both the transpressional and transtensional areas because: (1) the knickpoints mark a gentler slope in the upstream direction and a steeper slope in the downstream direction; and (2) the highest kernel densities occur within a 50 km-wide swath along the OSFZ.
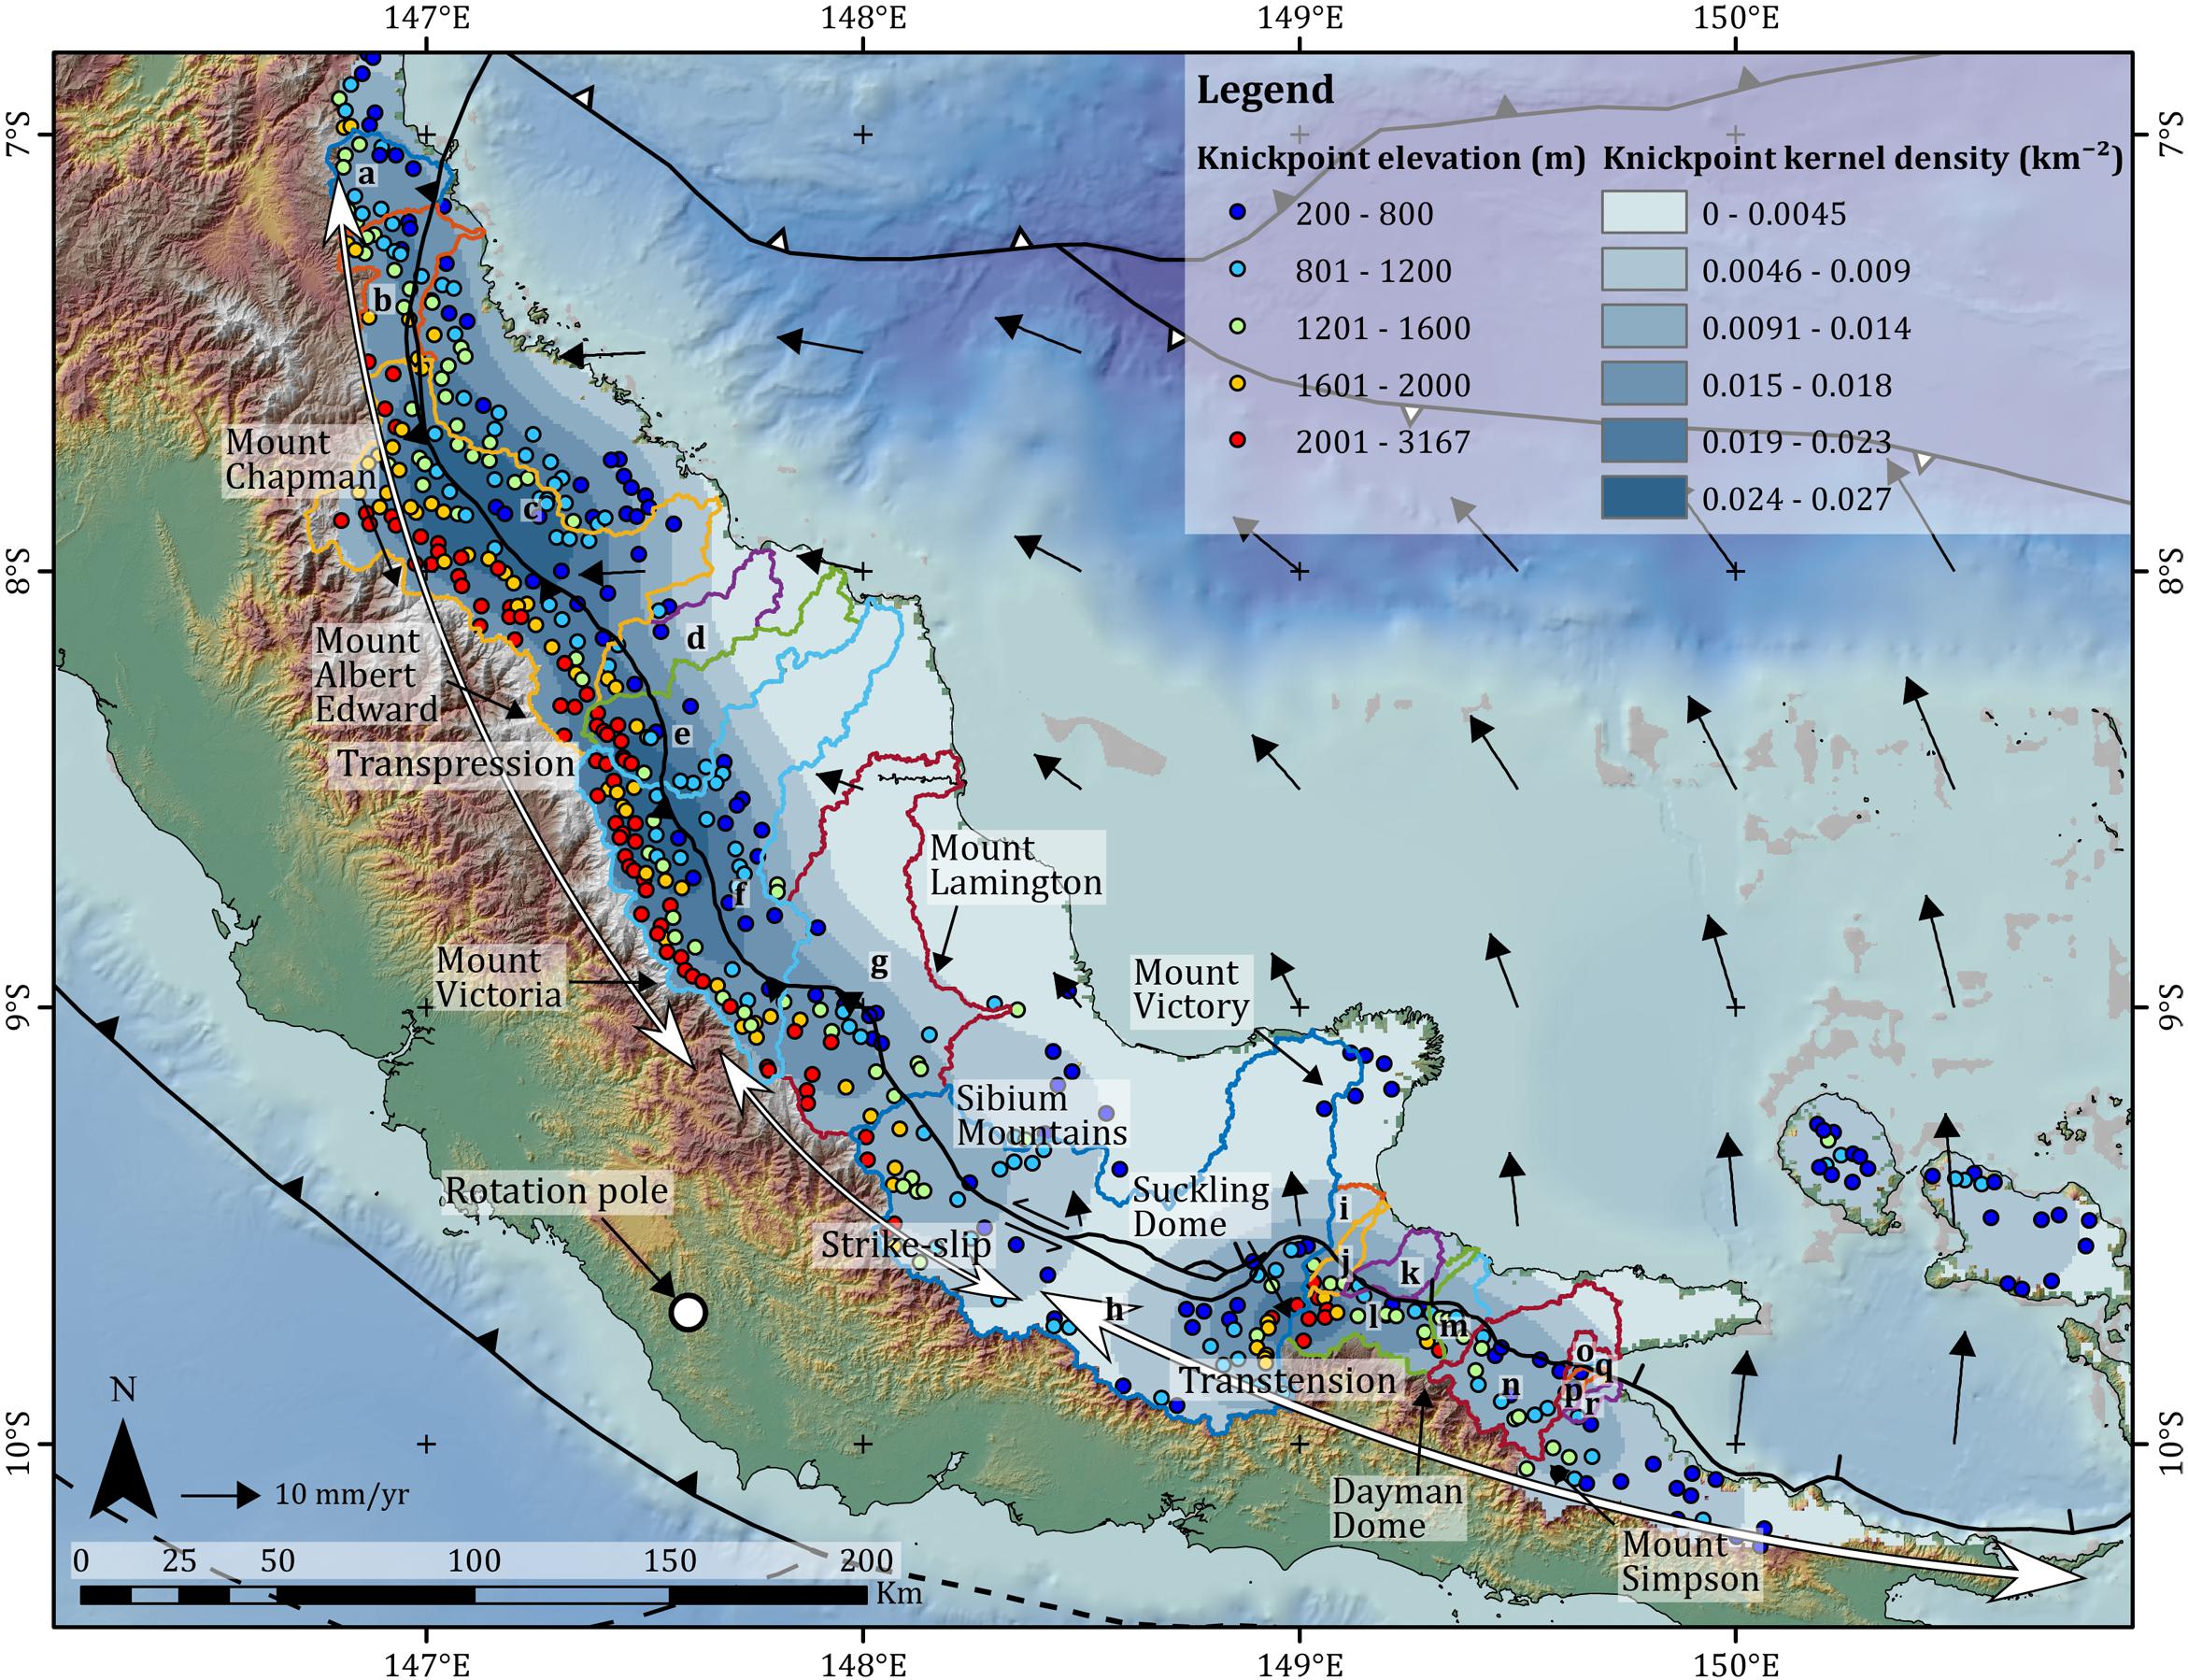
Figure 9. Knickpoints and their kernel densities across the OSFZ along the northeastern side of the Papuan Peninsula. Knickpoints at lower elevations are shown with blue and cyan colors and those at higher elevations are shown with red and yellow colors. Deeper blue colors show higher kernel densities of knickpoints. Boundaries of 18 basins are outlined in color and are keyed by letters which are also used to name rivers and basins in Figures 12 and 14. The black arrows show the counter-clockwise rotation of the Trobriand Plate with reference to the Australian Plate (Benyshek and Taylor, 2021). The white dot indicates the rotation pole of the Trobriand Plate. Knickpoints are more clustered within the northwestern transpressional area and within the southeastern transtensional area and indicate the areas of most active uplift.
Discussion
Controls of Lithology and Climate on Geomorphology
In addition to tectonic controls on bedrock uplift, lithologic and climatic variations can also have a strong impact on the incisions of rivers into bedrock and therefore are important controls on the fluvial geomorphology (DiBiase and Whipple, 2011; Whittaker, 2012; Cyr et al., 2014; Kober et al., 2015). High resistivity to weathering may limit erosion rates and river incisions. For this reason, more resistant rocks tend to have higher ksn values than less resistant rocks (Tucker, 2004).
Most of the catchment areas along the central OSR are covered with Mesozoic to Tertiary metamorphic (greenschists and blueschists) or igneous (ultramafic and mafic) rocks (Bain, 1973; Bureau of Mineral Resources of Australia, 1972; Baldwin et al., 2012). These metamorphic and igneous areas are more resistant to erosion; only the topographically lower pull-apart basin is covered by more erodible sedimentary rocks (Figure 10). Within the similar metamorphic and igneous lithologies, ksn values are much lower in the strike-slip to transtensional areas between the Sibium Mountains and Suckling Dome than the transpressional areas to the northwest and transtensional areas to the southeast (Figure 10). In summary, lithological variations along OSFZ are not major controls on the along-strike variations in ksn values.
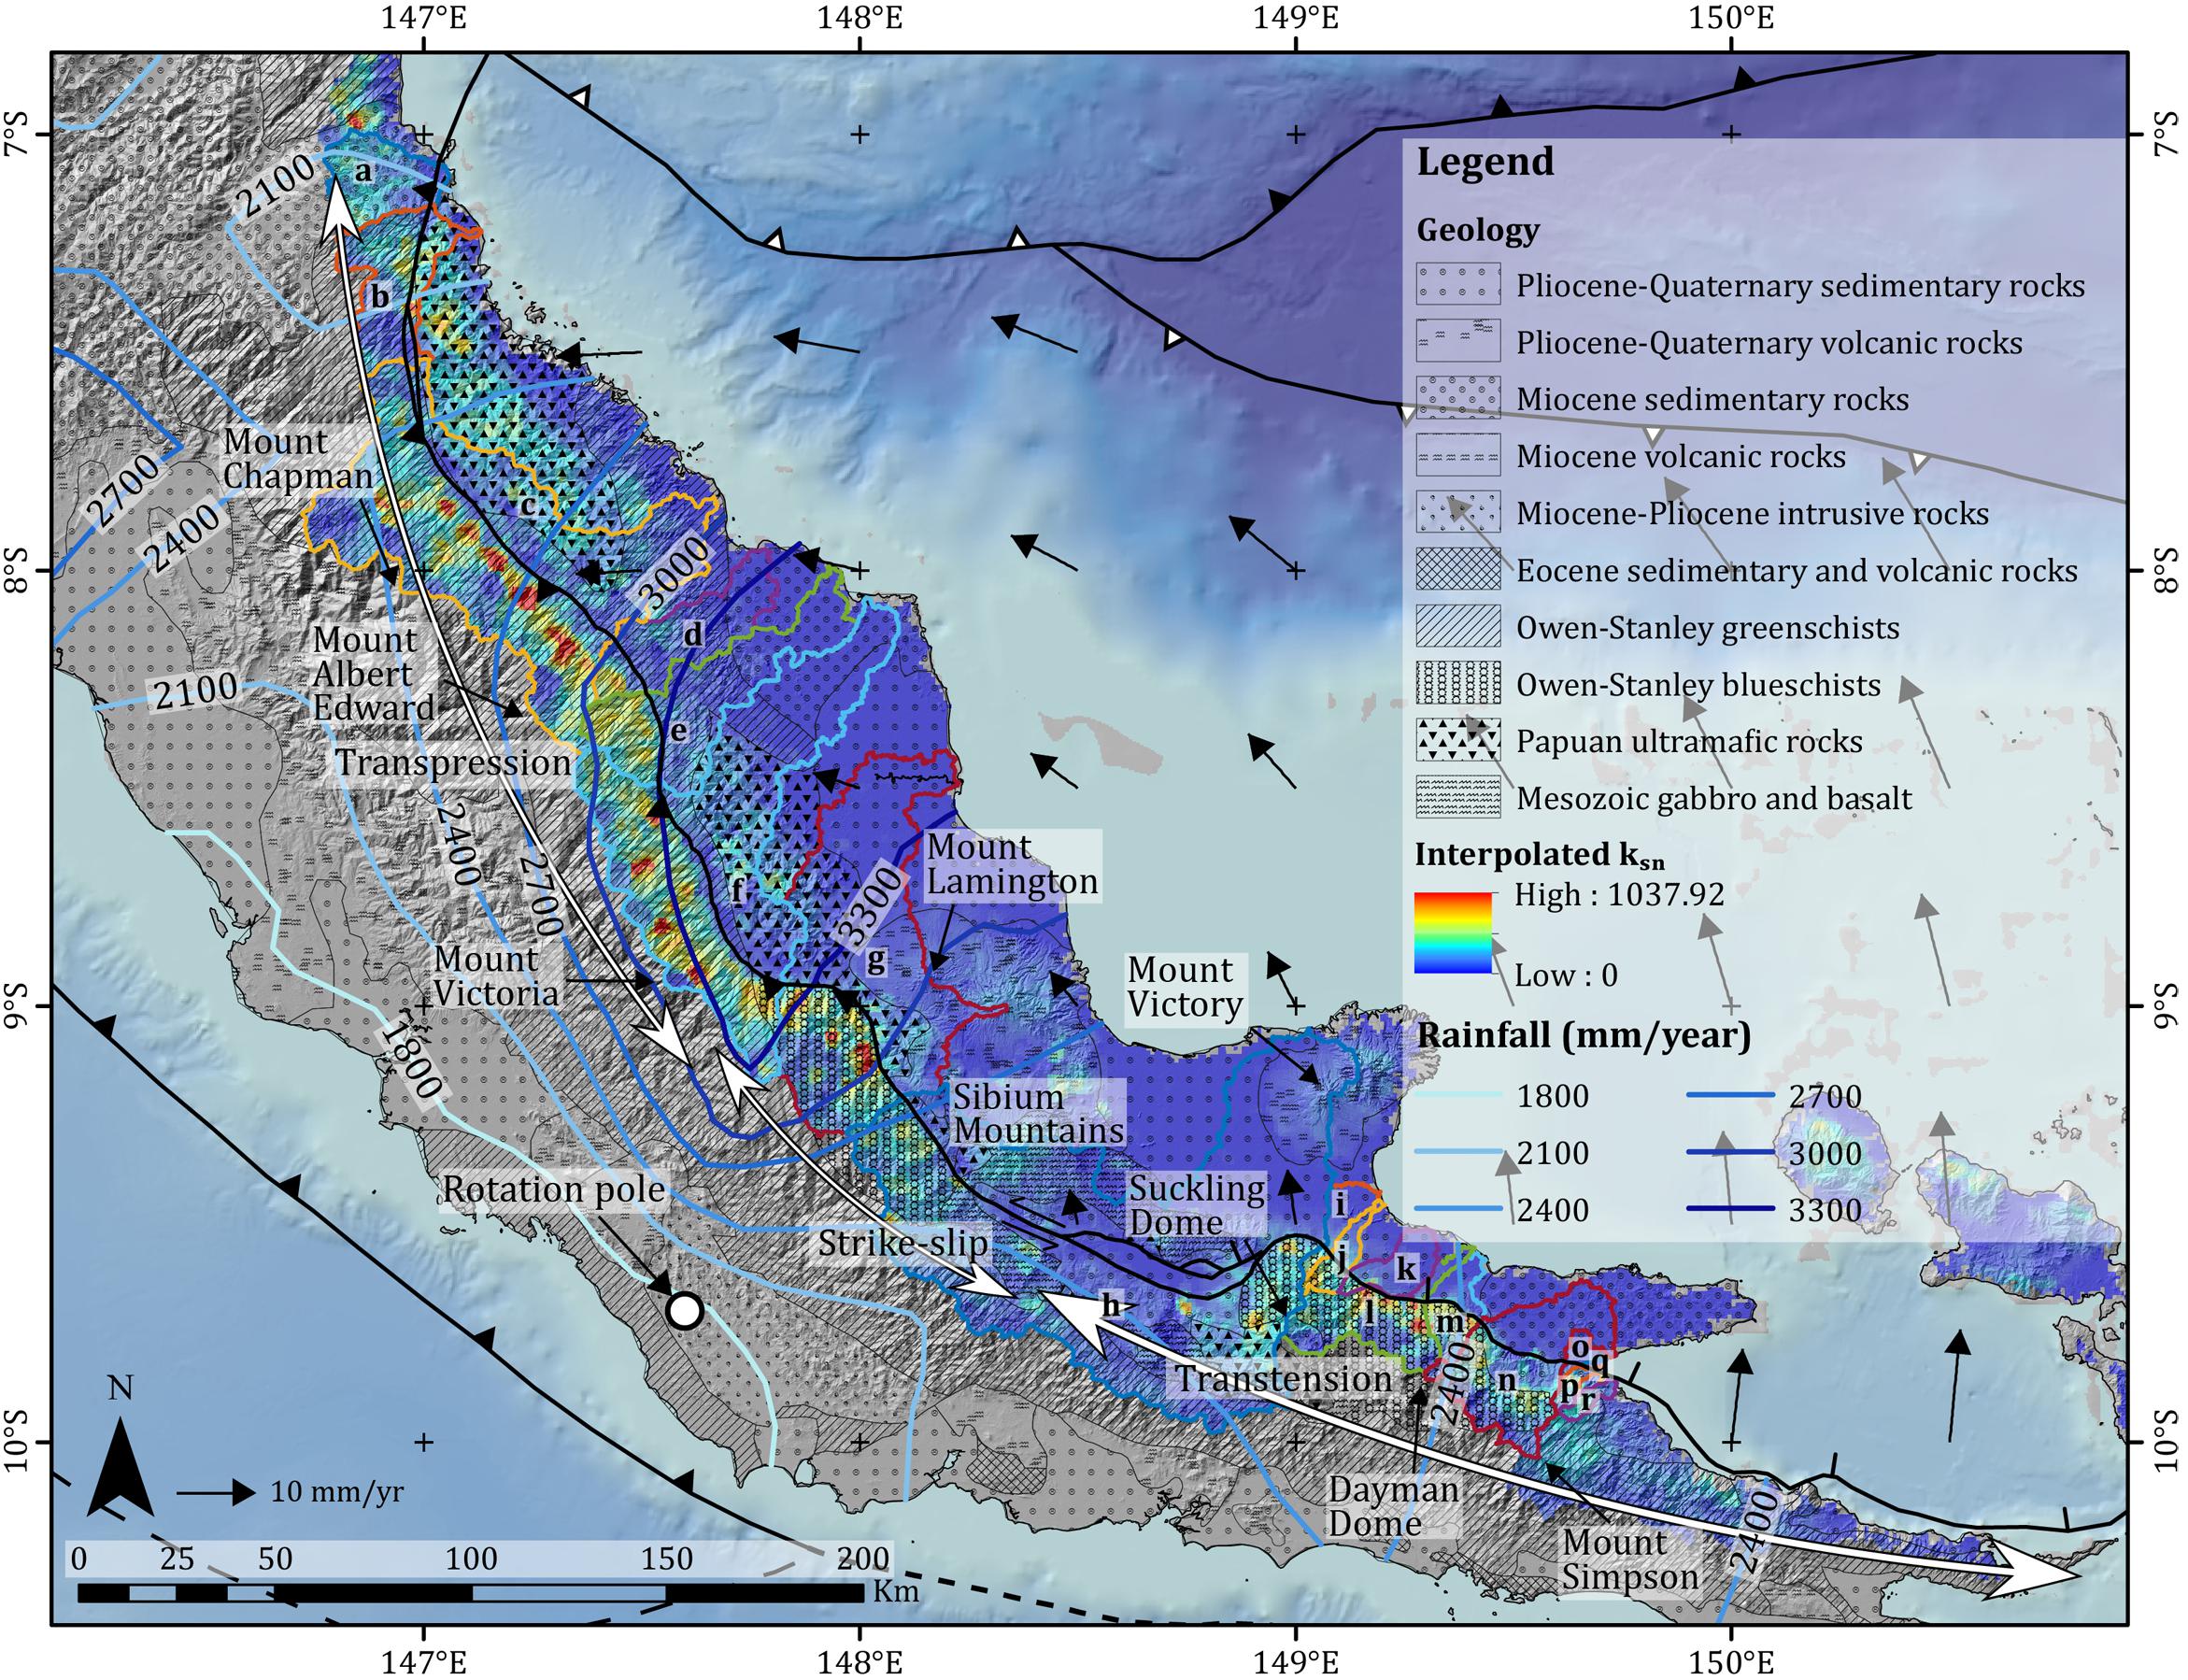
Figure 10. Interpolation surface of the normalized steepness index (ksn) along river segments crossing the OSFZ along the northeastern side of the Papuan Peninsula compared with the surface geology (Bain, 1973; Bureau of Mineral Resources of Australia, 1972; Baldwin et al., 2012) and mean annual rainfall (Robbins, 2016) of the Papuan Peninsula. Most of the catchment areas along the OSFZ are underlain by metamorphic or igneous rocks that are more resistant to erosion, therefore lithology cannot explain the variations in ksn values. The relatively higher mean annual rainfall in the central OSFZ would not significantly lower the ksn values or explain the variations in ksn values.
The tropical climate on the Papuan Peninsula results in heavy rainfall (mostly > 2100 mm/yr), with the heaviest rainfall (>3,000 mm/yr) areas in the central OSR between Mount Victoria and the Sibium Mountains (Figure 10). The high tropical temperature, high rainfall amounts, and resulting high erosion rates do not produce appreciable lower ksn values for the areas of highest topography of the central OSR as compared with areas of the OSR to the northwest and southeast. We conclude that climate variations along OSFZ are not significant controls on ksn values, and that geomorphic variations along the OSFZ are mainly controlled by tectonics.
Tectonic Controls on the Along-Strike Transition From Transpression to Transtension
The geomorphological indices vary rapidly along the OSFZ because of the rapid along-strike transition from transpression in the northwestern segment, to strike-slip in the central segment, and to transtension in the southeastern segment (Figures 7–9). We relate these along-strike structural variations to the proximity of the pole of rotation to the plate boundary fault (Figure 1).
In order to visualize this rapid transition in geomorphology, we created thirty-nine swath topographic profiles at a spacing of 20 km across the OSFZ and used these swaths to extract and compare geomorphological indices (Figure 1). The swath areas are 40 km long and 10 km wide, and the mean elevations across the strikes of each swath are plotted along the swath strikes (Figure 1). To extend the swaths into marine areas to the northeast of the Papuan Peninsula we used the GEBCO 2020 topography and bathymetry data at a coarser resolution instead of the SRTM DEM that only covers the land area. As a result of the decrease in pixels across strike, these swath profiles have lower resolution (Figure 11).
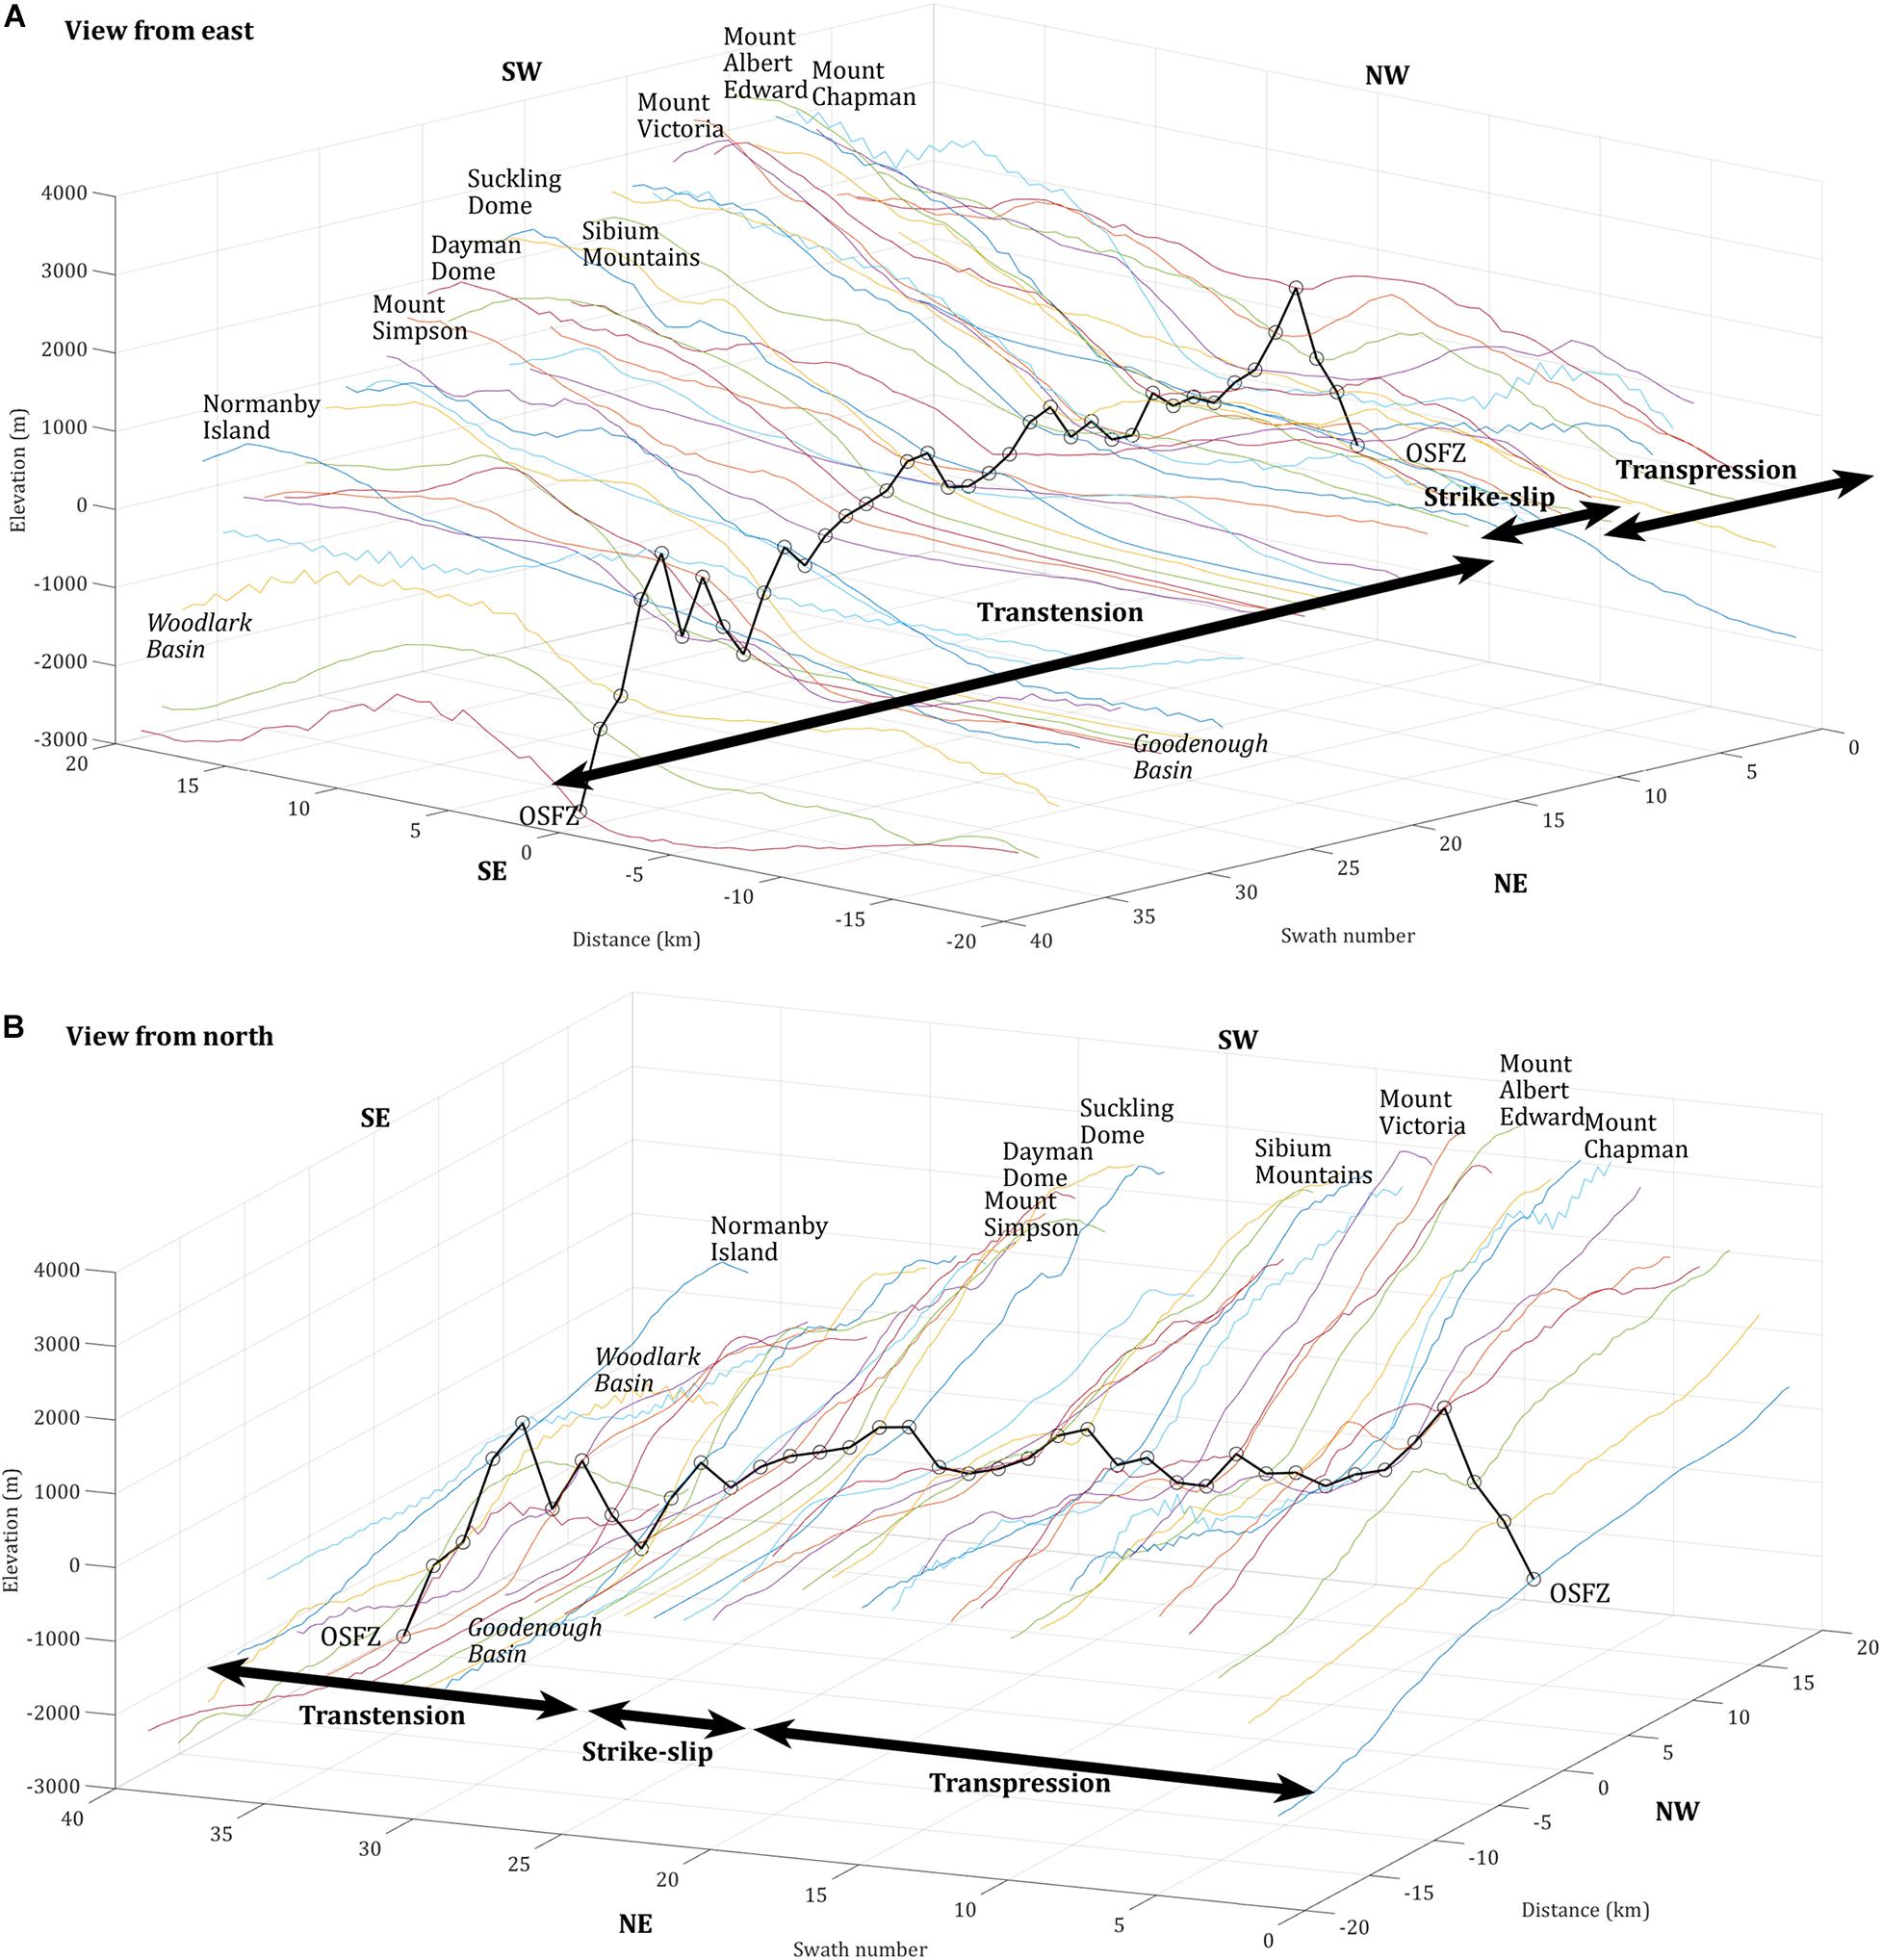
Figure 11. Thirty-nine swath topography profiles crossing the OSFZ. Panel (A) shows the profiles viewed from east, and panel (B) shows the profiles viewed from north. The OSFZ is shown by the generalized straight black line in the NW-SE direction that connects the points where profiles cross the trace of the OSFZ (shown by black circles). The lateral comparisons between swath profiles highlight the rapid along-strike transition of fault displacement from transpression in the northwestern segment, to strike-slip in the central segment, and to transtension in the southeastern segment.
Comparisons of the swath profiles in three dimensions (3D) show that the profiles are much steeper on the Australian Plate southwest of OSFZ than on the Trobriand Plate northeast of OSFZ (Figure 11). In general, the swath profiles from the transpressional area are steeper than the profiles in the transtensional areas, and most profiles of the strike-slip area are gentler in slope than those profiles crossing either the transpressional or transtensional areas. The bathymetric profiles are generally gentler in slope than the topographic profiles.
The topographic profiles are generally steeper on the Australian Plate within 5–10 km of the OSFZ and the bathymetric profiles are steeper on the Trobriand Plate within a distance of 5 km of OSFZ. Bathymetric profiles crossing the Solomon Sea appear shallower at greater distances from the OSFZ and likely reflect the expression of the older Paleogene rifted margin (Bulois et al., 2018; Ott and Mann, 2015).
Similar to the swath profiling, we selected forty representative rivers that flow across OSFZ within the eighteen basins shown in Figures 6–10 and plotted their longitudinal profiles along OSFZ (Figure 12). It should be noted that rivers meander in the basins, so the distances to OSFZ in these longitudinal profiles are not always “perpendicular distances” to OSFZ but are rather along-stream distances. For this same reason, individual rivers may cross the OSFZ multiple times and the upstream direction may not necessarily correspond to the Australian Plate and the downstream direction may not correspond to the Trobriand Plate.
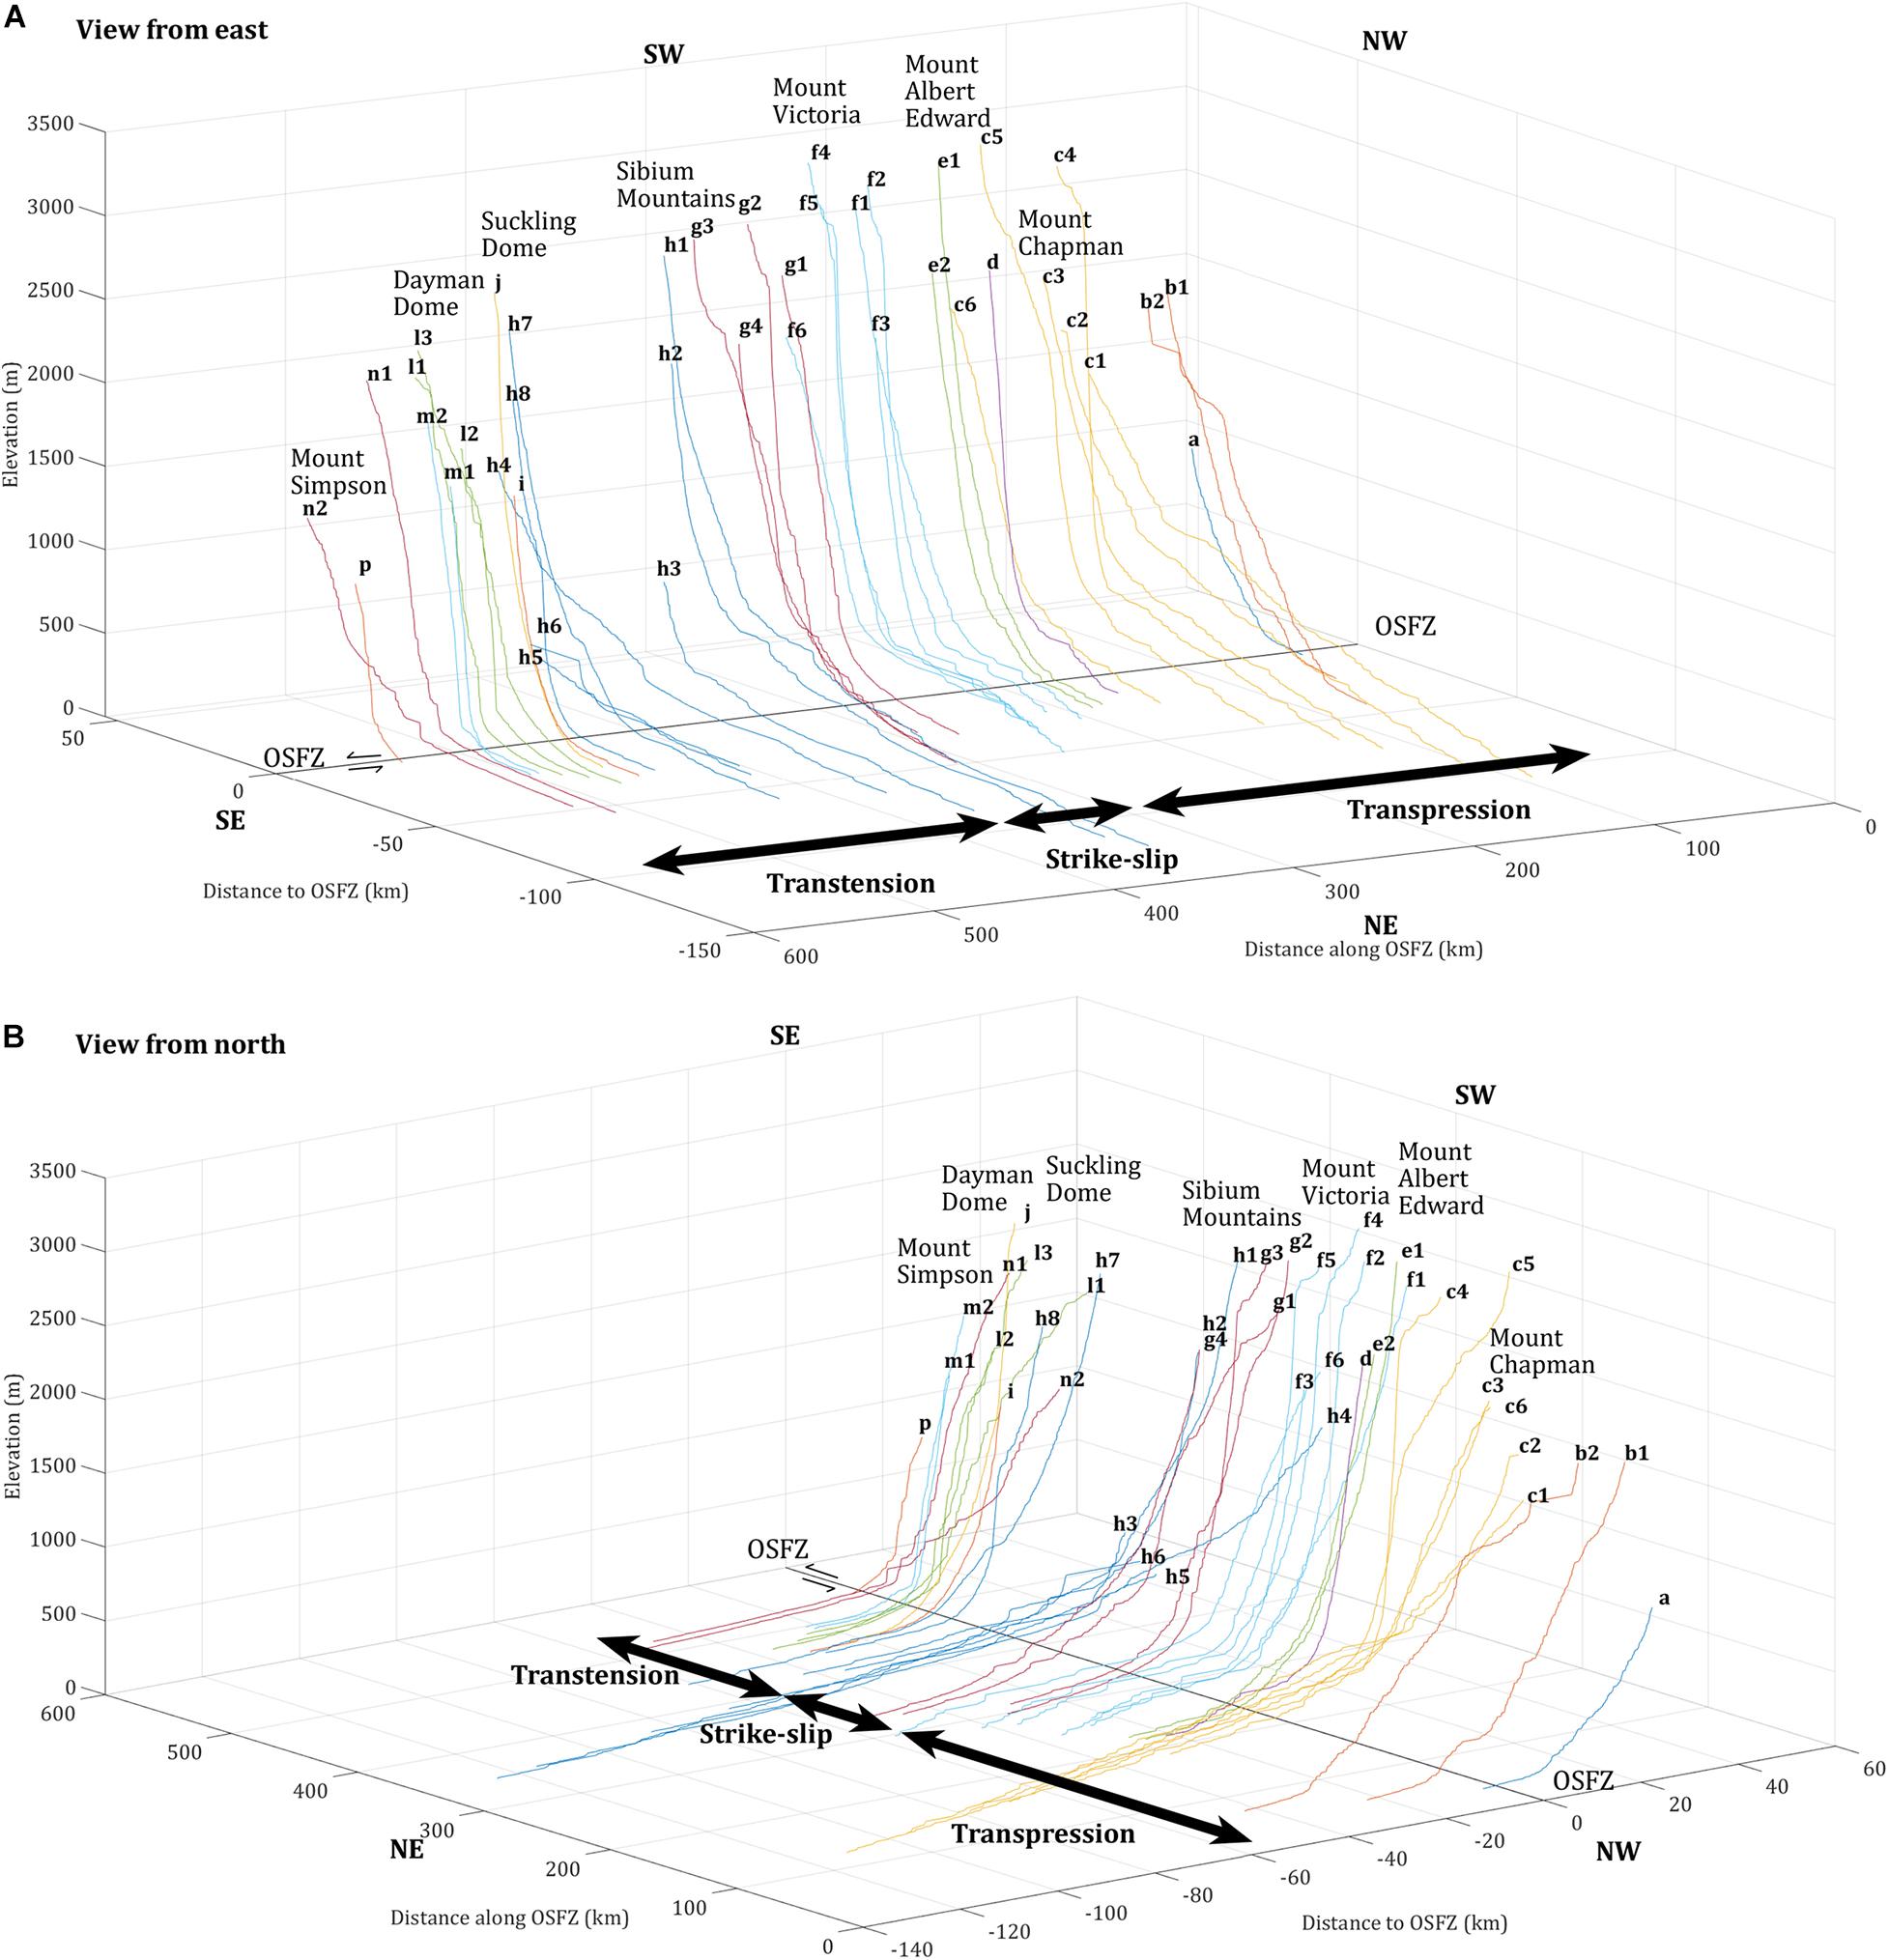
Figure 12. Forty longitudinal profiles of selected rivers crossing the OSFZ. Panel (A) shows the profiles viewed from east, and panel (B) shows the profiles viewed from north. The rivers are labelled and colored according to the labeled basins shown in Figures 6–9. The OSFZ is shown by a straight black line trending in the NW-SE direction. The lateral comparisons between longitudinal profiles highlight the rapid along-strike transition of fault displacement from transpression in the northwestern segment, to strike-slip in the central segment, and to transtension in the southeastern segment.
In general, the longitudinal profiles are convex upward with the upstream segments steeper and downstream segments gentler (Figure 12). Some profiles like b2, c4, c5, f4, f5, g1, g2, g3, h2, h6, and n2 show knickpoints with some upstream segments that are more gentle in slope than the downstream segments (Figure 12). It is not readily apparent whether the longitudinal profiles along the northwestern transpressional segment of the OSFZ are steeper than those along the southeastern transtensional segment – but the profiles in the transpressional segment reach higher elevations and exhibit higher topographic relief. Most longitudinal profiles in the strike-slip area are much gentler than nearby profiles in the transpressional and transtensional areas.
Transpressional and Transtensional Uplift Along the OSFZ
Boxplots show the 75% and 25% percentiles, the maximum, and the minimum of a series of features that graphically shows the general statistical distribution and variation and indicates the degree of dispersion and skewness in the data. By combining the boxplots into a single plot showing the pixel elevations for swaths on the Australian and Trobriand Plates (Figure 13), we can see that the overall elevations are higher on the Australian Plate with larger variations reflecting higher roughness compared to elevations from the Trobriand Plate. Bathymetry from the Goodenough Basin and the Solomon Sea reveals this same trend. Along the OSFZ, both the Australian and Trobriand Plates have similar trends with the highest topographic elevations and elevation variations within the transpressional areas, second highest elevations within the transtensional areas, and lowest elevations within the strike-slip areas (Figure 13).
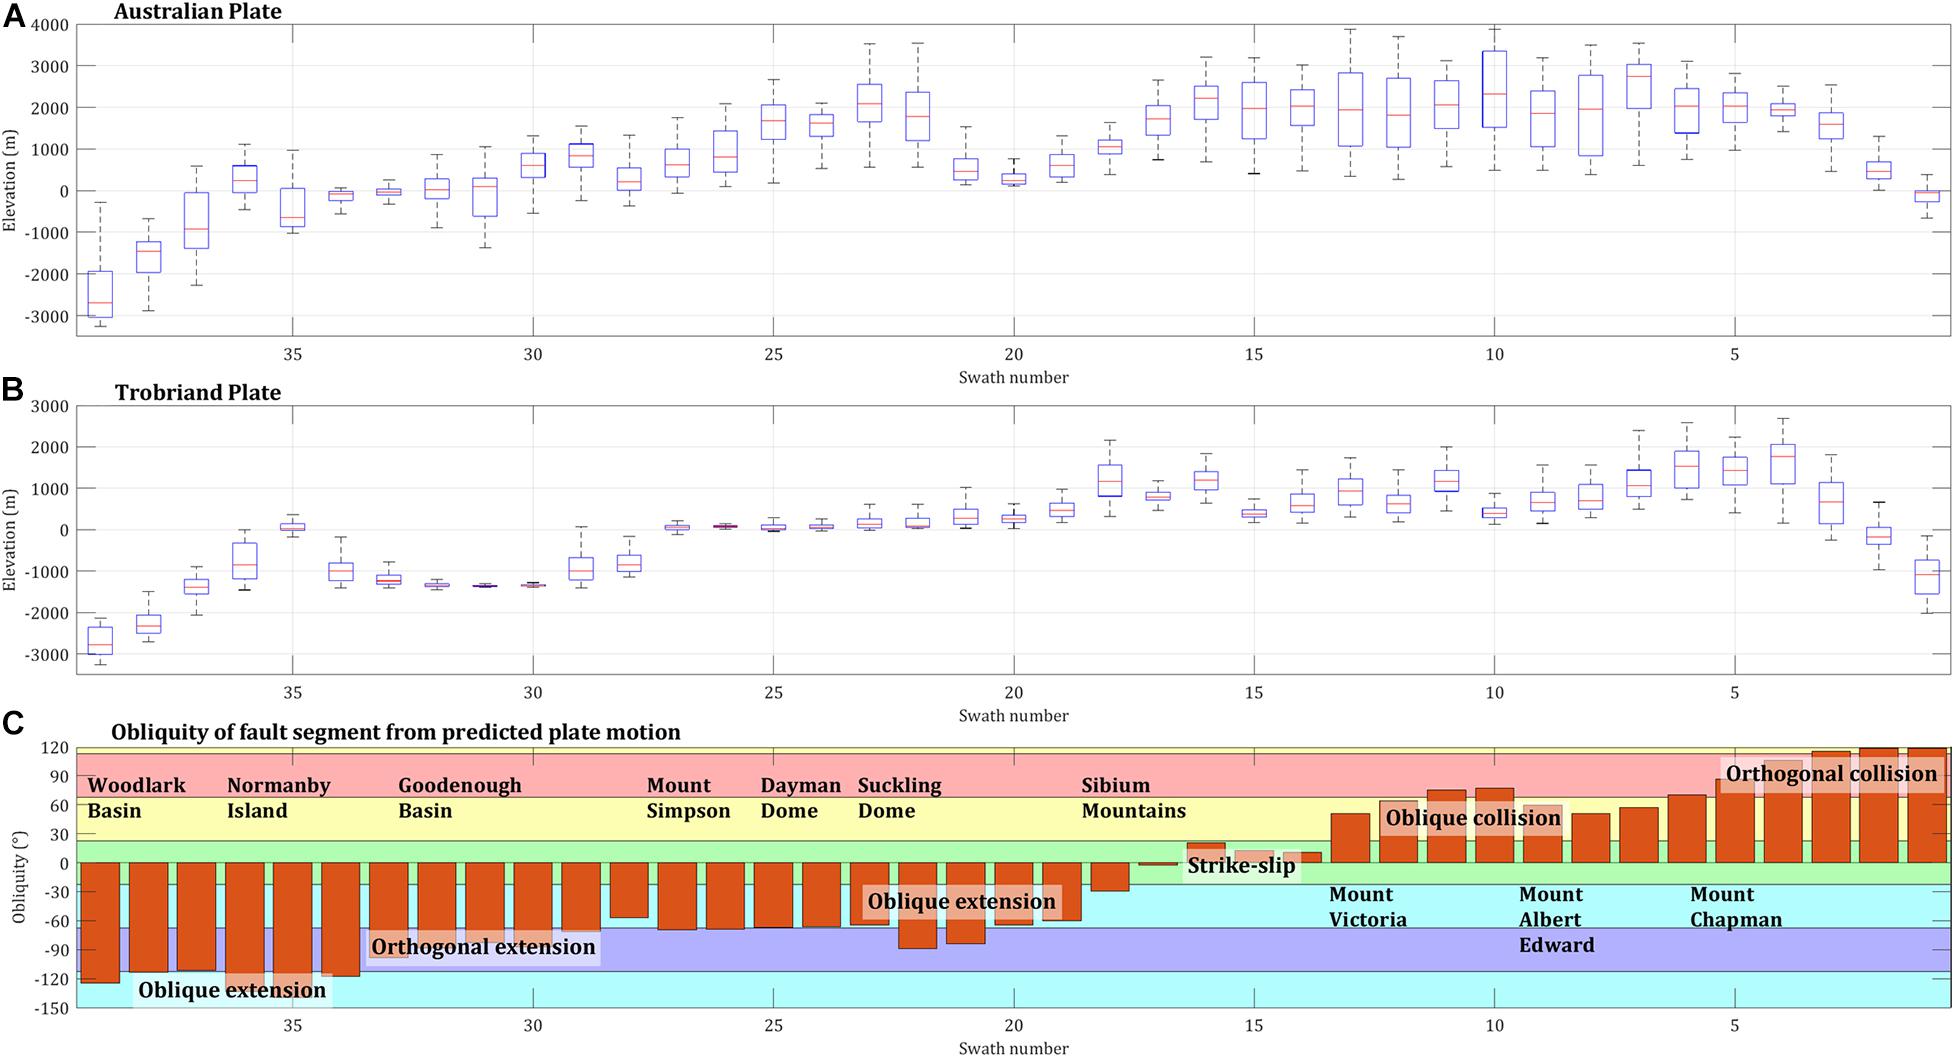
Figure 13. Boxplots of elevations within the thirty-nine swath topographic profiles that were created across the OSFZ. Panel (A) shows the elevations on the Australian Plate, panel (B) shows the elevations on the Trobriand Plate, and panel (C) shows the obliquity of fault segments calculated from the angle between fault strike and the predicted plate motion azimuth. Fault slip senses are classified based on the obliquity angles. Comparisons between the Australian and Trobriand Plates show compressional uplift in the transpressional areas and footwall uplift in the transtensional areas. The lateral comparisons between swath profiles highlight the rapid transition of fault displacement from transpressional to transtensional and the related variations in neotectonic uplift.
Using the most recent and best constrained pole of rotation for the Trobriand Plate at 147.6°E, 9.7°S with an angular speed of 2.560°/Myr relative to a fixed Australian Plate (Benyshek and Taylor, 2021), we calculate the obliquity of fault segments from the angle between the fault strike and azimuth of the predicted plate motion – assuming that the Trobriand Plate is undergoing a homogenous rigid plate rotation (Figure 13C). If the obliquity angle is near 0° the deformation is predicted as strike-slip; if the angle is near 90° with the plate motion directed toward the Australian Plate (90° in Figure 13C) the deformation is predicted as an orthogonal collision; if the angle is near 90° with the plate motion toward the Trobriand Plate (−90° in Figure 13C) the deformation is predicted as an orthogonal extension; and if the angle is intermediate between these angles deformation is predicted as obliquely collisiional or obliquely extensional.
In general, the swath elevations are higher in the transpressional and transtensional areas (Figure 13). There is a minor inconsistency between the swath elevations and the fault obliquities as some fault segments appear as strike-slip in central OSFZ – but the nearby topography (swaths 14-16, in basin g) appears transpressional with the higher elevations and rougher topography on the Australian Plate. This inconsistency can be explained by local variations in the nearby OSFZ fault azimuths whose fault strike changes from west-east in the northwest of the segment to northwest-southeast in the southeast of the segment; this local change in OSFZ strike creates a local transpressional area with a ∼50° angle between these segments that is convex toward the northeast (Figures 7–9). Between this area and Mount Victoria, the fault trace bends from northwest-southeast to west-east, forms a concave map pattern towards the northeast, and creates a localized area of transtension with relatively lower ksn values compared with the adjacent areas (Figures 7–9).
The OSFZ bends from north/northeast-south/southwest to northwest-southeast near Lake Trist (Figure 5C) and forms a concave pattern toward east where the fault appears to create a localized transtensional or pull-apart depression within the overall northwestern transpressional fault segment.
Using the same method as the swath elevations (Figure 13), we plotted the boxplots of ksn values (Figure 14) along the forty selected rivers shown in Figure 12. Almost all ksn values in the upstream direction are much higher with larger variations than those in the downstream direction. The upstream segments in transpressional areas have the highest ksn values, compared to the transtensional areas that have the second highest ksn values, and those in strike-slip areas that have the lowest ksn values. The downstream segment statistics in basins c, f, and h appear very homogeneous between rivers (c1-c6, f2-f4, and h1-h4, Figure 14) because these basins are much wider in their upstream areas. There is a minor inconsistency between the higher ksn values and the apparent strike-slip sense of the fault segments (Figure 14) that can be explained by the local transpression along the trace of the OSFZ.
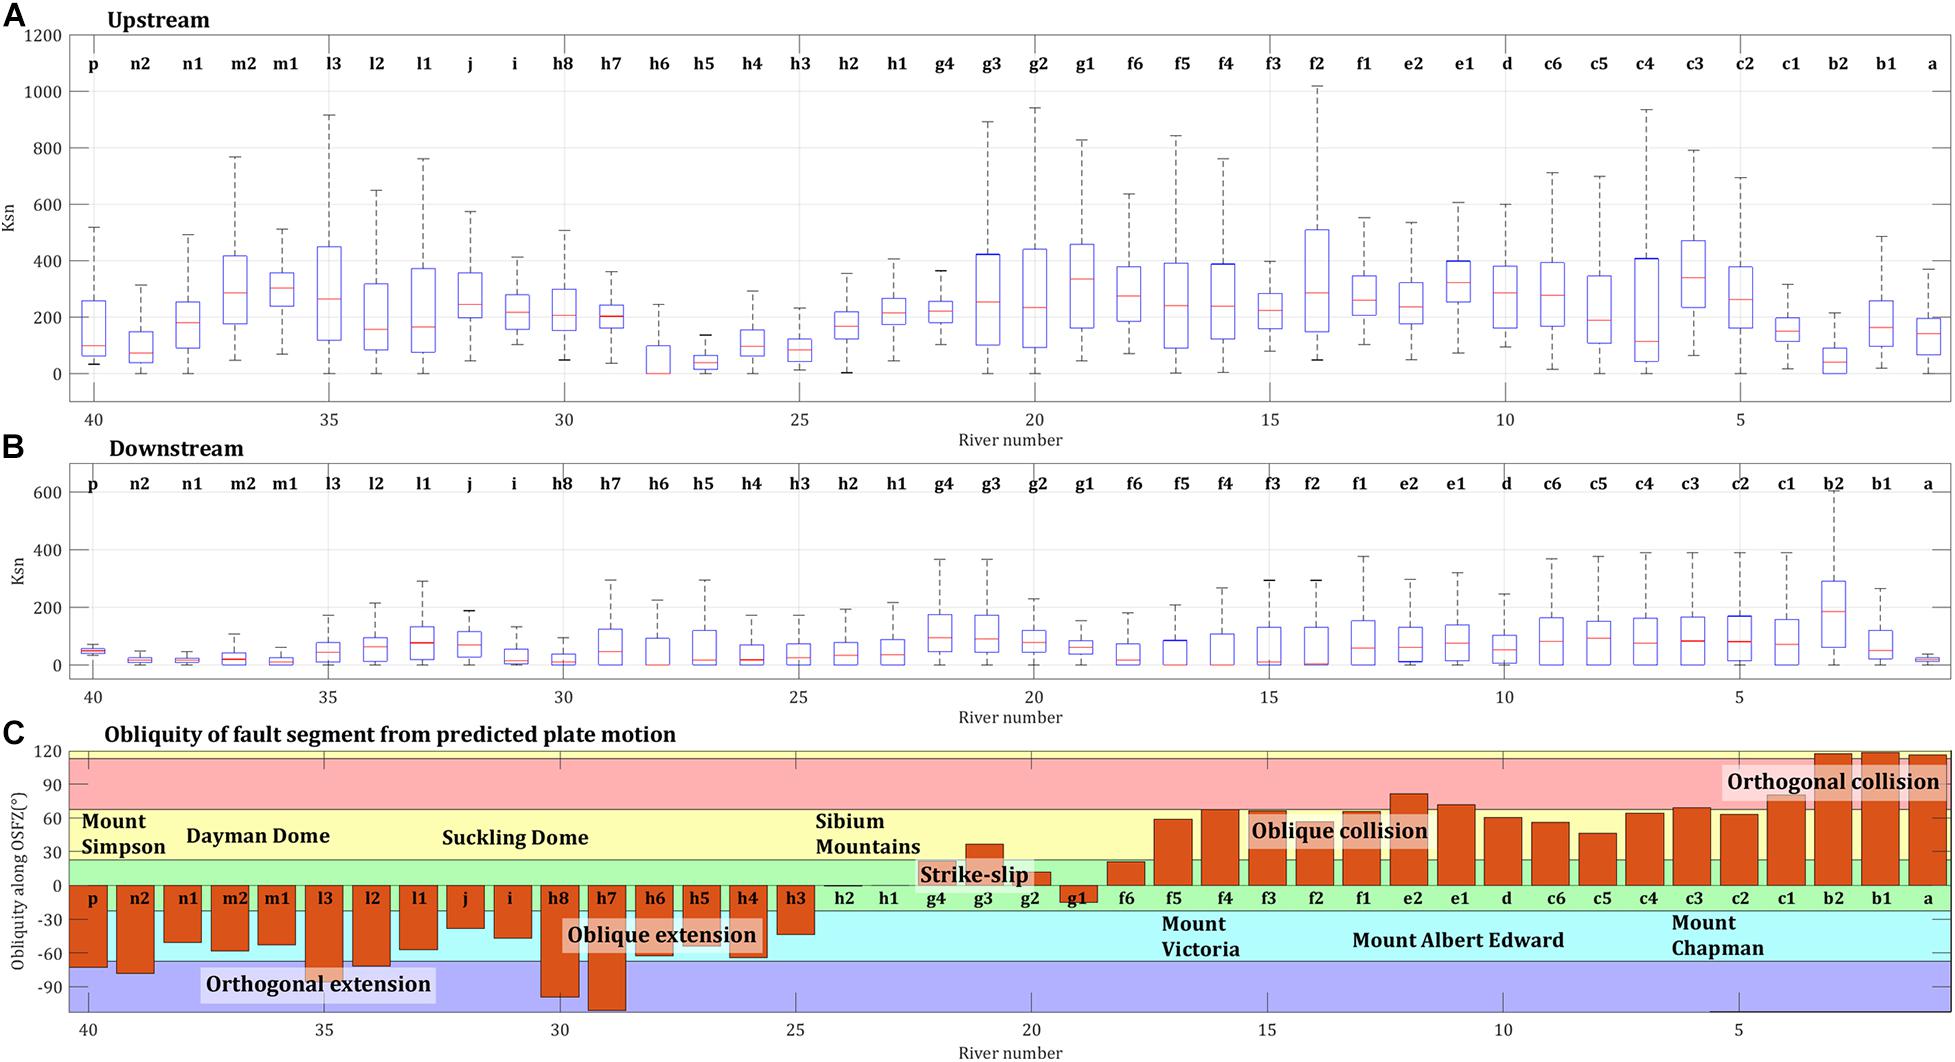
Figure 14. Boxplots of normalized steepness indices (ksn) along forty selected rivers across the OSFZ. The rivers are labeled according to the basins shown in Figures 6–10. Panel (A) shows the ksn values from the upstream side of the fault zone, panel (B) shows the ksn values from the downstream side of the fault zone, and panel (C) shows the obliquity of fault segments calculated from the angle between fault strike and the predicted plate motion azimuth. Fault slip senses are classified based on the obliquity angles. Comparisons between the upstream and downstream segments show compressional uplift in the transpressional areas and footwall uplift in the transtensional areas. The lateral comparisons between swath profiles highlight the rapid transition of fault displacement from transpressional to transtensional and the related variations in neotectonic uplift.
Unlike the D’Entrecateaux Islands (Goodenough and Fergusson Islands) where knickpoint elevations cluster around three elevation bands (Miller et al., 2012), the knickpoint elevations across OSFZ are more scattered with a general trend that decreases in the southwest-northeast direction (Figure 15A). This trend is explained by the much larger deformed area of the OSFZ (18,000 km2) in comparison to the smaller deformed areas of D’Entrecateaux Islands (1200 km2) and the variable styles of neotectonic uplift along the OSFZ.
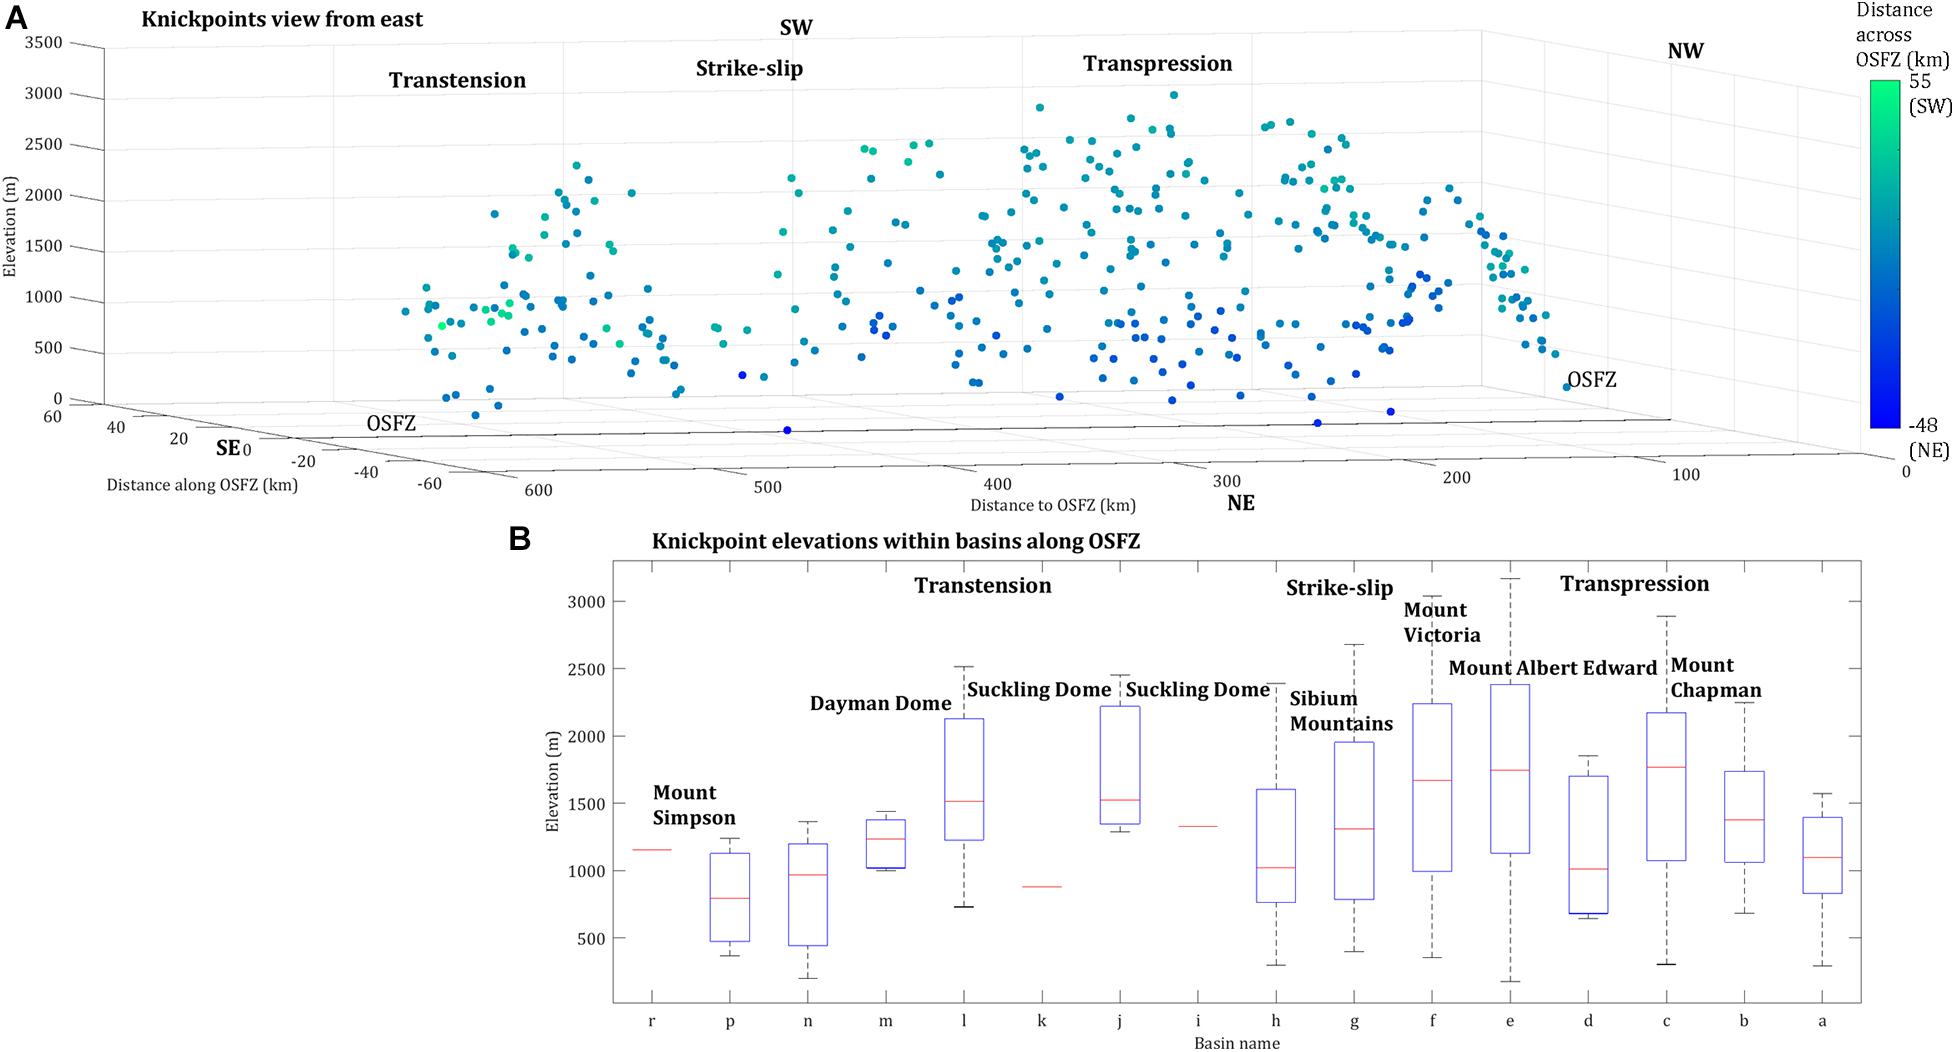
Figure 15. Knickpoint elevations (A) and their boxplots (B) extracted within basins along the OSFZ. The green to blue colors show distances across OSFZ from southwest to northeast. The OSFZ is shown by a straight black line in the NW-SE direction. The denser clusters of knickpoints indicate the most active areas of neotectonic uplift in transpressional and transtensional areas. The lateral comparisons between knickpoints highlight the rapid transition of fault displacement from transpressional to transtensional and the related variations in neotectonic uplift.
There are more knickpoints in the transpressional areas than the transtensional areas, and the strike-slip areas have the least of all three of the structural provinces (Figures 9, 15A). Integrating the knickpoints within basins as boxplots (Figure 15B), elevations are more scattered and reach higher elevations in the transpressional areas. Smaller basins i, k, and r have only one knickpoint and do not show population variations.
The transpressional area on the Australian Plate is being overthrust to the northeast above the Trobriand Plate at the northwestern segment of OSFZ, and this thrusting can explain the high topography in this region of the northwestern OSR (Ott and Mann, 2015). The transtensional area is also being actively uplifted as a footwall block on a northeast-dipping low-angle normal fault system (Fitz and Mann, 2013b; Little et al., 2019; Biemiller et al., 2020a,b) as supported by high uplift rates derived from Holocene coral reefs (Mann et al., 2004; Figure 1). This continental rifting with footwall uplift at the southeastern segment of OSFZ is linked to the Woodlark Rift along faults that pass through Normanby Island (Fitz and Mann, 2013b).
Concluding Remarks
The nearby pole of rotation of the Trobriand Plate relative to a stable Australian Plate causes a remarkably rapid transition of structural styles along the OSFZ from transpression to strike-slip and to transtension over a distance of 200 km. This along-strike transition is reflected in geomorphologic variability with the higher and steeper areas in the transpressional area in the northwest between Mount Chapman and the Sibium Mountains, with the lower and gentler sloped areas in the strike-slip areas in the central region adjacent to the Sibium Mountains and Suckling Dome, and with a higher and steeper transtensional area in the southeast between the Suckling Dome and Mount Simpson (Figures 7–9). These variations cannot be explained by variations in the underlying metamorphic or igneous lithologies nor in variations in tropical climates along the peninsula.
Both the steeper profiles and higher elevations/ksn values support our interpretation that the transpressional and transtensional areas undergo neotectonic uplift in comparison to the more stable, central strike-slip area (Figures 11–14). The larger knickpoint elevation variations and higher elevations in the transpressional and transtensional areas (Figure 15) also undergo neotectonic uplift with the constant creation of new knickpoints in this actively evolving area. These provinces of neotectonic uplift result from the transition from transpressional shortening to transtensional footwall uplift along the OSFZ that are related to the regional microplate rotation.
Data Availability Statement
Publicly available datasets were analyzed in this study. This data can be found here: https://www2.jpl.nasa.gov/srtm/ and https://www.gebco.net/data_and_products/gridded_bathymetry_ data/.
Author Contributions
LS designed the study and wrote the first draft of the manuscript. LS and PM both contributed to the conception of the study and manuscript revision, and both approved the submitted version. Both authors contributed to the article and approved the submitted version.
Funding
This work was funded by the NSF Continental Dynamics Program (EAR-0708105) and the sponsors of the CBTH project at the University of Houston.
Conflict of Interest
The authors declare that the research was conducted in the absence of any commercial or financial relationships that could be construed as a potential conflict of interest.
Acknowledgments
We thank Bryan Ott and Fred Taylor for their encouragement and assistance. We also thank HZ and XW for their constructive reviews and to GR for his editorial oversight reviews.
References
Abers, G. A. (2001). Evidence for seismogenic normal faults at shallow dips in continental rifts. Geol. Soc. Spec. Publ. 187, 305–318. doi: 10.1144/gsl.sp.2001.187.01.15
Abers, G. A., Eilon, E., Gaherty, J. B., Jin, G., Kim, Y., Obrebski, M., et al. (2016). Southeast Papuan crustal tectonics: imaging extension and buoyancy of an active rift. J. Geophys. Res. Solid Earth 121, 951–971. doi: 10.1002/2015jb012621
Bain, J. H. (1973). “A summary of the main structural elements of Papua new Guinea,” in The Western Pacific: Island Arc, Marginal Seas, Geochemistry, ed. P. J. Coleman Perth (Nedlands: University of Western Australia Press), 147–161.
Baldwin, S. L., Fitzgerald, P. G., and Webb, L. E. (2012). Tectonics of the New Guinea region. Annu. Rev. Earth Planet Sci. 40, 495–520. doi: 10.1146/annurev-earth-040809-152540
Begin, Z. B., Meyer, D. F., and Schumm, S. A. (1981). Development of longitudinal profiles of alluvial channels in response to base-level lowering. Earth Surf. Process. Landf. 6, 49–68. doi: 10.1002/esp.3290060106
Benyshek, E. K., and Taylor, B. (2021). Tectonics of the Papua – Woodlark region. Geochem. Geophys. Geosyst. 22:e2020GC009209.
Biemiller, J., Boulton, C., Wallace, L., Ellis, S., Little, T., Mizera, M., et al. (2020a). Mechanical implications of creep and partial coupling on the world’s fastest slipping low-angle normal fault in southeastern Papua New Guinea. J. Geophys. Res. Solid Earth 125, 1–24.
Biemiller, J., Taylor, F., Lavier, L., Yu, T. L., Wallace, L., and Shen, C. C. (2020b). Emerged coral reefs record Holocene low-angle normal fault earthquakes. Geophys. Res. Lett. 47, 1–12.
Bulois, C., Pubellier, M., Chamot-Rooke, N., and Delescluse, M. (2018). Successive rifting events in marginal basins: the example of the Coral Sea region (Papua New Guinea). Tectonics 37, 3–29. doi: 10.1002/2017tc004783
Bureau of Mineral Resources of Australia (1972). Geology of Papua New Guinea 1:1000000. Canberra, ACT: Bureau of Mineral Resources of Australia.
Cyr, A. J., Granger, D. E., Olivetti, V., and Molin, P. (2014). Distinguishing between tectonic and lithologic controls on bedrock channel longitudinal profiles using cosmogenic 10Be erosion rates and channel steepness index. Geomorphology 209, 27–38. doi: 10.1016/j.geomorph.2013.12.010
Daczko, N. R., Caffi, P., and Mann, P. (2011). Structural evolution of the Dayman Dome metamorphic core complex, eastern Papua new Guinea. Bull. Geol. Soc. Am. 123, 2335–2351. doi: 10.1130/b30326.1
De Paor, D., Bradley, D., Eisenstadt, G., and Phillips, S. (1989). The Arctic Eurekan orogen: a most unusual fold-and-thrust belt. Geol. Soc. Am. Bull. 101, 952–967. doi: 10.1130/0016-7606(1989)101<0952:taeoam>2.3.co;2
DiBiase, R. A., and Whipple, K. X. (2011). The influence of erosion thresholds and runoff variability on the relationships among topography, climate, and erosion rate. J. Geophys. Res. Earth Surf. 116, 1–17.
Durbin, J. (1959). Efficient estimation of parameters in moving-average models. Biometrika 46, 306–316. doi: 10.2307/2333528
Farr, T. G., Rosen, P. A., Caro, E., Crippen, R., Duren, R., Hensley, S., et al. (2007). The Shuttle Radar Topography Mission. Rev. Geophys. 45:2005RG000183.
Fitz, G., and Mann, P. (2013a). Evaluating upper versus lower crustal extension through structural reconstructions and subsidence analysis of basins adjacent to the D’Entrecasteaux Islands, eastern Papua New Guinea. Geochem. Geophys. Geosyst. 14, 1800–1818. doi: 10.1002/ggge.20123
Fitz, G., and Mann, P. (2013b). Tectonic uplift mechanism of the Goodenough and Fergusson island gneiss domes, eastern Papua new Guinea: constraints from seismic reflection and well data. Geochem. Geophys. Geosyst. 14, 3969–3995. doi: 10.1002/ggge.20208
GEBCO Bathymetric Compilation Group (2020). The GEBCO 2020 Grid − a Continuous Terrain Model of the Global Oceans and Land. NERC: British Oceanographic Data Centre, National Oceanography Centre.
Hovius, N. (2000). “Macroscale process systems of mountain belt erosion,” in Geomorphology and Global Tectonics, ed. M. A. Summerfield (Chichester: John Wiley and Sons), 77–105.
Hume, T. M., and Herdendorf, C. E. (1988). A geomorphic classification of estuaries and its application to coastal resource management-A New Zealand example. Ocean Shorel. Manag. 11, 249–274. doi: 10.1016/0951-8312(88)90022-7
Kington, J. D., and Goodliffe, A. M. (2008). Plate motions and continental extension at the rifting to spreading transition in Woodlark Basin, Papua New Guinea: can oceanic plate kinematics be extended into continental rifts? Tectonophysics 458, 82–95. doi: 10.1016/j.tecto.2007.11.027
Kirby, E., and Whipple, K. (2001). Quantifying differential rock-uplift rates via stream profile analysis. Geology 29, 415–418. doi: 10.1130/0091-7613(2001)029<0415:qdrurv>2.0.co;2
Kober, F., Zeilinger, G., Hippe, K., Marc, O., Lendzioch, T., Grischott, R., et al. (2015). Tectonic and lithological controls on denudation rates in the central Bolivian Andes. Tectonophysics 657, 230–244. doi: 10.1016/j.tecto.2015.06.037
Koulali, A., Tregoning, P., McClusky, S., Stanaway, R., Wallace, L., and Lister, G. (2015). New insights into the present-day kinematics of the central and western Papua New Guinea from GPS. Geophys. J. Int. 202, 993–1004. doi: 10.1093/gji/ggv200
Little, T. A., Hacker, B. R., Gordon, S. M., Baldwin, S. L., Fitzgerald, P. G., Ellis, S., et al. (2011). Diapiric exhumation of Earth’s youngest (UHP) eclogites in the gneiss domes of the D’Entrecasteaux Islands, Papua New Guinea. Tectonophysics 510, 39–68. doi: 10.1016/j.tecto.2011.06.006
Little, T. A., Webber, S. M., Mizera, M., Boulton, C., Oesterle, J., Ellis, S., et al. (2019). Evolution of a rapidly slipping, active low-angle normal fault, Suckling-Dayman metamorphic core complex, SE Papua New Guinea. Bull. Geol. Soc. Am. 131, 1333–1363. doi: 10.1130/b35051.1
Lock, J., Davies, H. L., Tiffin, D. L., Murakami, F., and Kisimoto, K. (1987). The Trobriand subduction system in the western Solomon Sea. Geo Marine Lett. 7, 129–134. doi: 10.1007/bf02238042
Mann, P., Taylor, F. W., Gahagan, L., and Watson, L. (2004). “Rapid kinematic and tectonic variations along the 1400-km-long Australia-Woodlark Plate Boundary Zone, Papua New Guinea and Woodlark Basin,” in Proceedings of the AGU Fall Meeting 2004 Abstracts [Internet]. Abstract id T41C-1209, San Francisco, CA: AGU, 13–17.
Miller, S. R., Baldwin, S. L., and Fitzgerald, P. G. (2012). Transient fluvial incision and active surface uplift in the Woodlark rift of eastern Papua New Guinea. Lithosphere 4, 131–149. doi: 10.1130/l135.1
Ott, B., and Mann, P. (2015). Late Miocene to Recent formation of the Aure-Moresby fold- thrust belt and foreland basin as a consequence of Woodlark microplate rotation, Papua New Guinea. Geochem. Geophys. Geosystems. 16, 1988–2004. doi: 10.1002/2014gc005668
Robbins, J. C. (2016). A probabilistic approach for assessing landslide-triggering event rainfall in Papua New Guinea, using TRMM satellite precipitation estimates. J. Hydrol. 541, 296–309. doi: 10.1016/j.jhydrol.2016.06.052
Roering, J. J., Kirchner, J. W., and Dietrich, W. E. (2001). Hillslope evolution by nonlinear, slope-dependent transport: steady state morphology and equilibrium adjustment timescales. J. Geophys. Res. Solid Earth 106, 16499–16513. doi: 10.1029/2001jb000323
Snow, R. S., and Slingerland, R. L. (1987). Mathematical modeling of graded river profiles. J. Geol. 95, 15–33. doi: 10.1086/629104
Tucker, G. E. (2004). Drainage basin sensitivity to tectonic and climatic forcing: Implications of a stochastic model for the role of entrainment and erosion thresholds. Earth Surf. Process. Landf. 29, 185–205. doi: 10.1002/esp.1020
U.S. Geological Survey (2020). ANSS Comprehensive Earthquake Catalog (ComCat) Documentation [Internet]. Available online at: https://earthquake.usgs.gov/data/comcat (accessed November 1, 2020).
Wallace, L. M., Ellis, S., Little, T., Tregoning, P., Palmer, N., Rosa, R., et al. (2014). Continental breakup and UHP rock exhumation in action: GPS results from the Woodlark Rift, Papua New Guinea. Geochem. Geophys. Geosyst. 15, 4267–4290. doi: 10.1002/2014gc005458
Wallace, L. M., Stevens, C., Silver, E., McCaffrey, R., Loratung, W., Hasiata, S., et al. (2004). GPS and seismological constraints on active tectonics and arc-continent collision in Papua New Guinea: implications for mechanics of microplate rotations in a plate boundary zone. J. Geophys. Res. Solid Earth 109:B05404.
Weissel, J. K., Taylor, B., and Karner, G. D. (1982). The opening of the Woodlark Basin, subduction of the Woodlark spreading system, and the evolution of Northern Melanesia since Mid-Pliocene time. Tectonophysics 87, 253–277. doi: 10.1016/0040-1951(82)90229-3
Whittaker, A. C. (2012). How do landscapes record tectonics and climate? Lithosphere 4, 160–164. doi: 10.1130/rf.l003.1
Willgoose, G., Bras, R. L., and Rodriguez−Iturbe, I. (1991). A physical explanation of an observed link area−slope relationship. Water Resour. Res. 27, 1697–1702. doi: 10.1029/91wr00937
Wobus, C., Whipple, K. X., Kirby, E., Snyder, N., Johnson, J., Spyropolou, K., et al. (2006). “Tectonics from topography: procedures, promise, and pitfalls,” in Tectonics, Climate, and Landscape Evolution: Geological Society of America Special Paper 398, Penrose Conference Series, eds S. D. Willett, N. Hovius, M. T. Brandon, and D. M. Fisher (Boulder, CO: Geological Scoiety of America), 55–74.
Keywords: Owen-Stanley Fault Zone, tectonic geomorphology, transpression and transtension, normalized steepness index, microplate rotation
Citation: Sun L and Mann P (2021) Along-Strike Rapid Structural and Geomorphic Transition From Transpression to Strike-Slip to Transtension Related to Active Microplate Rotation, Papua New Guinea. Front. Earth Sci. 9:652352. doi: 10.3389/feart.2021.652352
Received: 12 January 2021; Accepted: 07 April 2021;
Published: 13 May 2021.
Edited by:
Gang Rao, Zhejiang University, ChinaReviewed by:
Huiping Zhang, Institute of Geology, China Earthquake Administration, ChinaXianyan Wang, Nanjing University, China
Copyright © 2021 Sun and Mann. This is an open-access article distributed under the terms of the Creative Commons Attribution License (CC BY). The use, distribution or reproduction in other forums is permitted, provided the original author(s) and the copyright owner(s) are credited and that the original publication in this journal is cited, in accordance with accepted academic practice. No use, distribution or reproduction is permitted which does not comply with these terms.
*Correspondence: Lei Sun, bHN1bjEwQHVoLmVkdQ==