 Ling Zeng
 Quanming Liu2*
 Linhai Jing
 Jun Feng
- 1Geomathematics Key Laboratory of Sichuan Province, Chengdu Technological University, Chengdu, China
- 2College of Water Conservancy and Civil Engineering, Inner Mongolia Agricultural University, Huhhot, China
- 3Aerospace Information Research Institute, Chinese Academy of Sciences, Beijing, China
The combined influence of surface soil moisture and roughness on radar backscatters has been limiting SAR’s application in soil moisture retrieval. In the past research, multi-temporal analysis and artificial neural network (ANN) inversion of physically based forward models were regarded as promising methods to decouple that combined influence. However, the former does not consider soil roughness change over a relatively longer period and the latter makes it hard to thoroughly eliminate the effect of soil roughness. This study proposes to use generalized regression neural network (GRNN) to derive bare surface soil moisture (BSSM) from radar backscatter observations regardless of the effect of soil roughness (GRNN inversion of backscatter observations). This method not only can derive BSSM from radar backscatters, provided soil roughness is unknown in any long period, but also can train models based on small-size sample data so as to reduce the manual error of training data created by simulation of physically based models. The comparison of validations between BSSM-backscatter models and BSSM-roughness-backscatter models both analyzed by GRNN shows that the incorporation of soil roughness cannot raise the prediction accuracy of models and, instead, even reduce it, indicating that the combined influence is thoroughly decoupled when being analyzed by GRNN. Moreover, BSSM-backscatter models by GRNN are recommended due to their good prediction, even compared to those related models in past publications.
Introduction
The verified combination of influence of bare surface soil moisture (BSSM) and roughness on backscattering coefficients of synthetic aperture radar (SAR) especially at the C-band, under given radar parameters and homogeneous soil textures, has been limiting its application as an operational source of soil moisture in hydrology, though it is regarded as the most suitable for monitoring surface soil moisture (SSM), due to its high sensitivity to water contents, its high spatial resolution in the order of tens of meters for the distributed soil moisture, and its ability to neglect the influence of the atmosphere (Ulaby et al., 1982; Fung and Chen, 1994; Nancy and James, 2003; Wagner et al., 2007; Kornelsen and Coulibaly, 2013; Peng et al., 2017; Zeng et al., 2020). How to minimize the auxiliary parameters so as to ably construct a direct relationship between backscattering coefficients and SSM is the key to break that limitation of application.
In past researches, multi-temporal analysis is regarded as the promising one to decouple SSM effect on radar backscatter from the effects of other surface soil parameters (e.g., soil roughness) (Balenzano et al., 2011; Zhu et al., 2019). That methodology is under the assumption that soil roughness is constant within a sufficiently short time interval or soil roughness changes over a longer time scale compared to BSSM change, and thus SAR backscatter change is just related to BSSM change during this period, under the given radar configurations and homogeneous soil textures. However, this method ignores cultivation practices during this period that may produce soil roughness change (Wagner et al., 1999; Zhu et al., 2019), and yet have to choose the SAR sensors with a short repeat cycle so as to guarantee constant roughness within this period.
Artificial neural network (ANN) inversion of physically based forward electromagnetic models has also been realized ably to retrieve BSSM, provided that surface roughness is an unknown parameter in the training (e.g., Weimann, 1998; Baghdadi et al., 2002; Paloscia et al., 2008, 2013; Santi et al., 2016). These physically based models account for the interactions between the microwave radiation and soil [e.g., the integral equation model (IEM) by Fung et al. (1992) and the advanced integral equation model (AIEM) by Wu et al. (2001)] and thus ably simulate backscattering coefficients in terms of soil attributes (e.g., the dielectric constant and the surface roughness). However, those researches utilized the feedforward ANNs, which require a huge amount of datasets in the training to guarantee the precision and robustness of models, and thus had to create the simulated data by a physically based model to train ANNs, because the small size of sample data hardly satisfied that requirement of training. The proven obvious discrepancy between simulated and measured backscatters (Zeng et al., 2020) is brought into the course of training in which ANN leads to some uncertainty of the retrieval model. For example, Paloscia et al. (2008) showed the resultant standard error of estimation (SEE) of 2.75% and the determination coefficient (R2) of 0.85 using ANN inversion of IEMs, compared to a SEE of 2.16% and an R2 of 0.91 by incorporating roughness to ANN inversion of IEMs. This contrast indicates that in spite of the good prediction accuracy for SSM retrieval by ANN inversion of physical-based forward models, this method does not thoroughly decouple the effect of BSSM on backscatter from that of soil roughness but just reduces the effect of soil roughness on BSSM retrieval from backscatter.
Furthermore, if BSSM sample data and their corresponding SAR’s backscatter data are used in ANNs’ training so as not to produce the manual error from simulated BSSM data by physically based models, it will probably explain how ANN techniques work on separating the combined effect of BSSM and soil roughness on backscatter. GRNN, involving a single-pass learning and without backpropagation so as to reduce times of iterations, has a high-accuracy estimation due to its Gaussian kernel and can handle noises in the inputs. More important is that GRNN can train data in a multidimensional measurement space even with sparse datasets (Cui et al., 2020). Recently, GRNN is increasingly exploited in the field of estimating soil moisture, due to its proven outperformance over backpropagation neural network (BPNN). For example, Yuan et al. (2020) trained GRNN on sparse ground-based measurements by passive microwave, and Cui et al. (2020) trained GRNN using 84 ground-station measurements and their corresponding multi-source remote sensing data (optical and microwave).
The study uses a local case in China to construct backscatter-BSSM and backscatter-roughness-BSSM relationships by GRNN based on 147 datasets of samples. The 10-fold cross-validations of backscatter-BSSM and backscatter-roughness-BSSM models by GRNN are compared to show the null or even negative effect of soil roughness on BSSM retrieval from backscatters here. Moreover, as a contrast, this study uses parametric regression method to analyze backscatter-BSSM and backscatter-roughness-BSSM relationships, whose 10-fold cross-validations are also compared to confirm the combined effect of BSSM and soil roughness on backscatter. The contrast shows that soil roughness works totally differently when using nonparametric analysis of GRNN and parametric analysis of traditional regression.
Materials and Methods
The study area is located in Hetao Irrigation Plain, Inner Mongolia, China (Figure 1), covering a region of 457.7 km2, with a dry and cold climate and an annual average temperature of 6.3–7.7°C. The average annual precipitation and evaporation are approximately 139.4 and 2,070 mm, respectively.
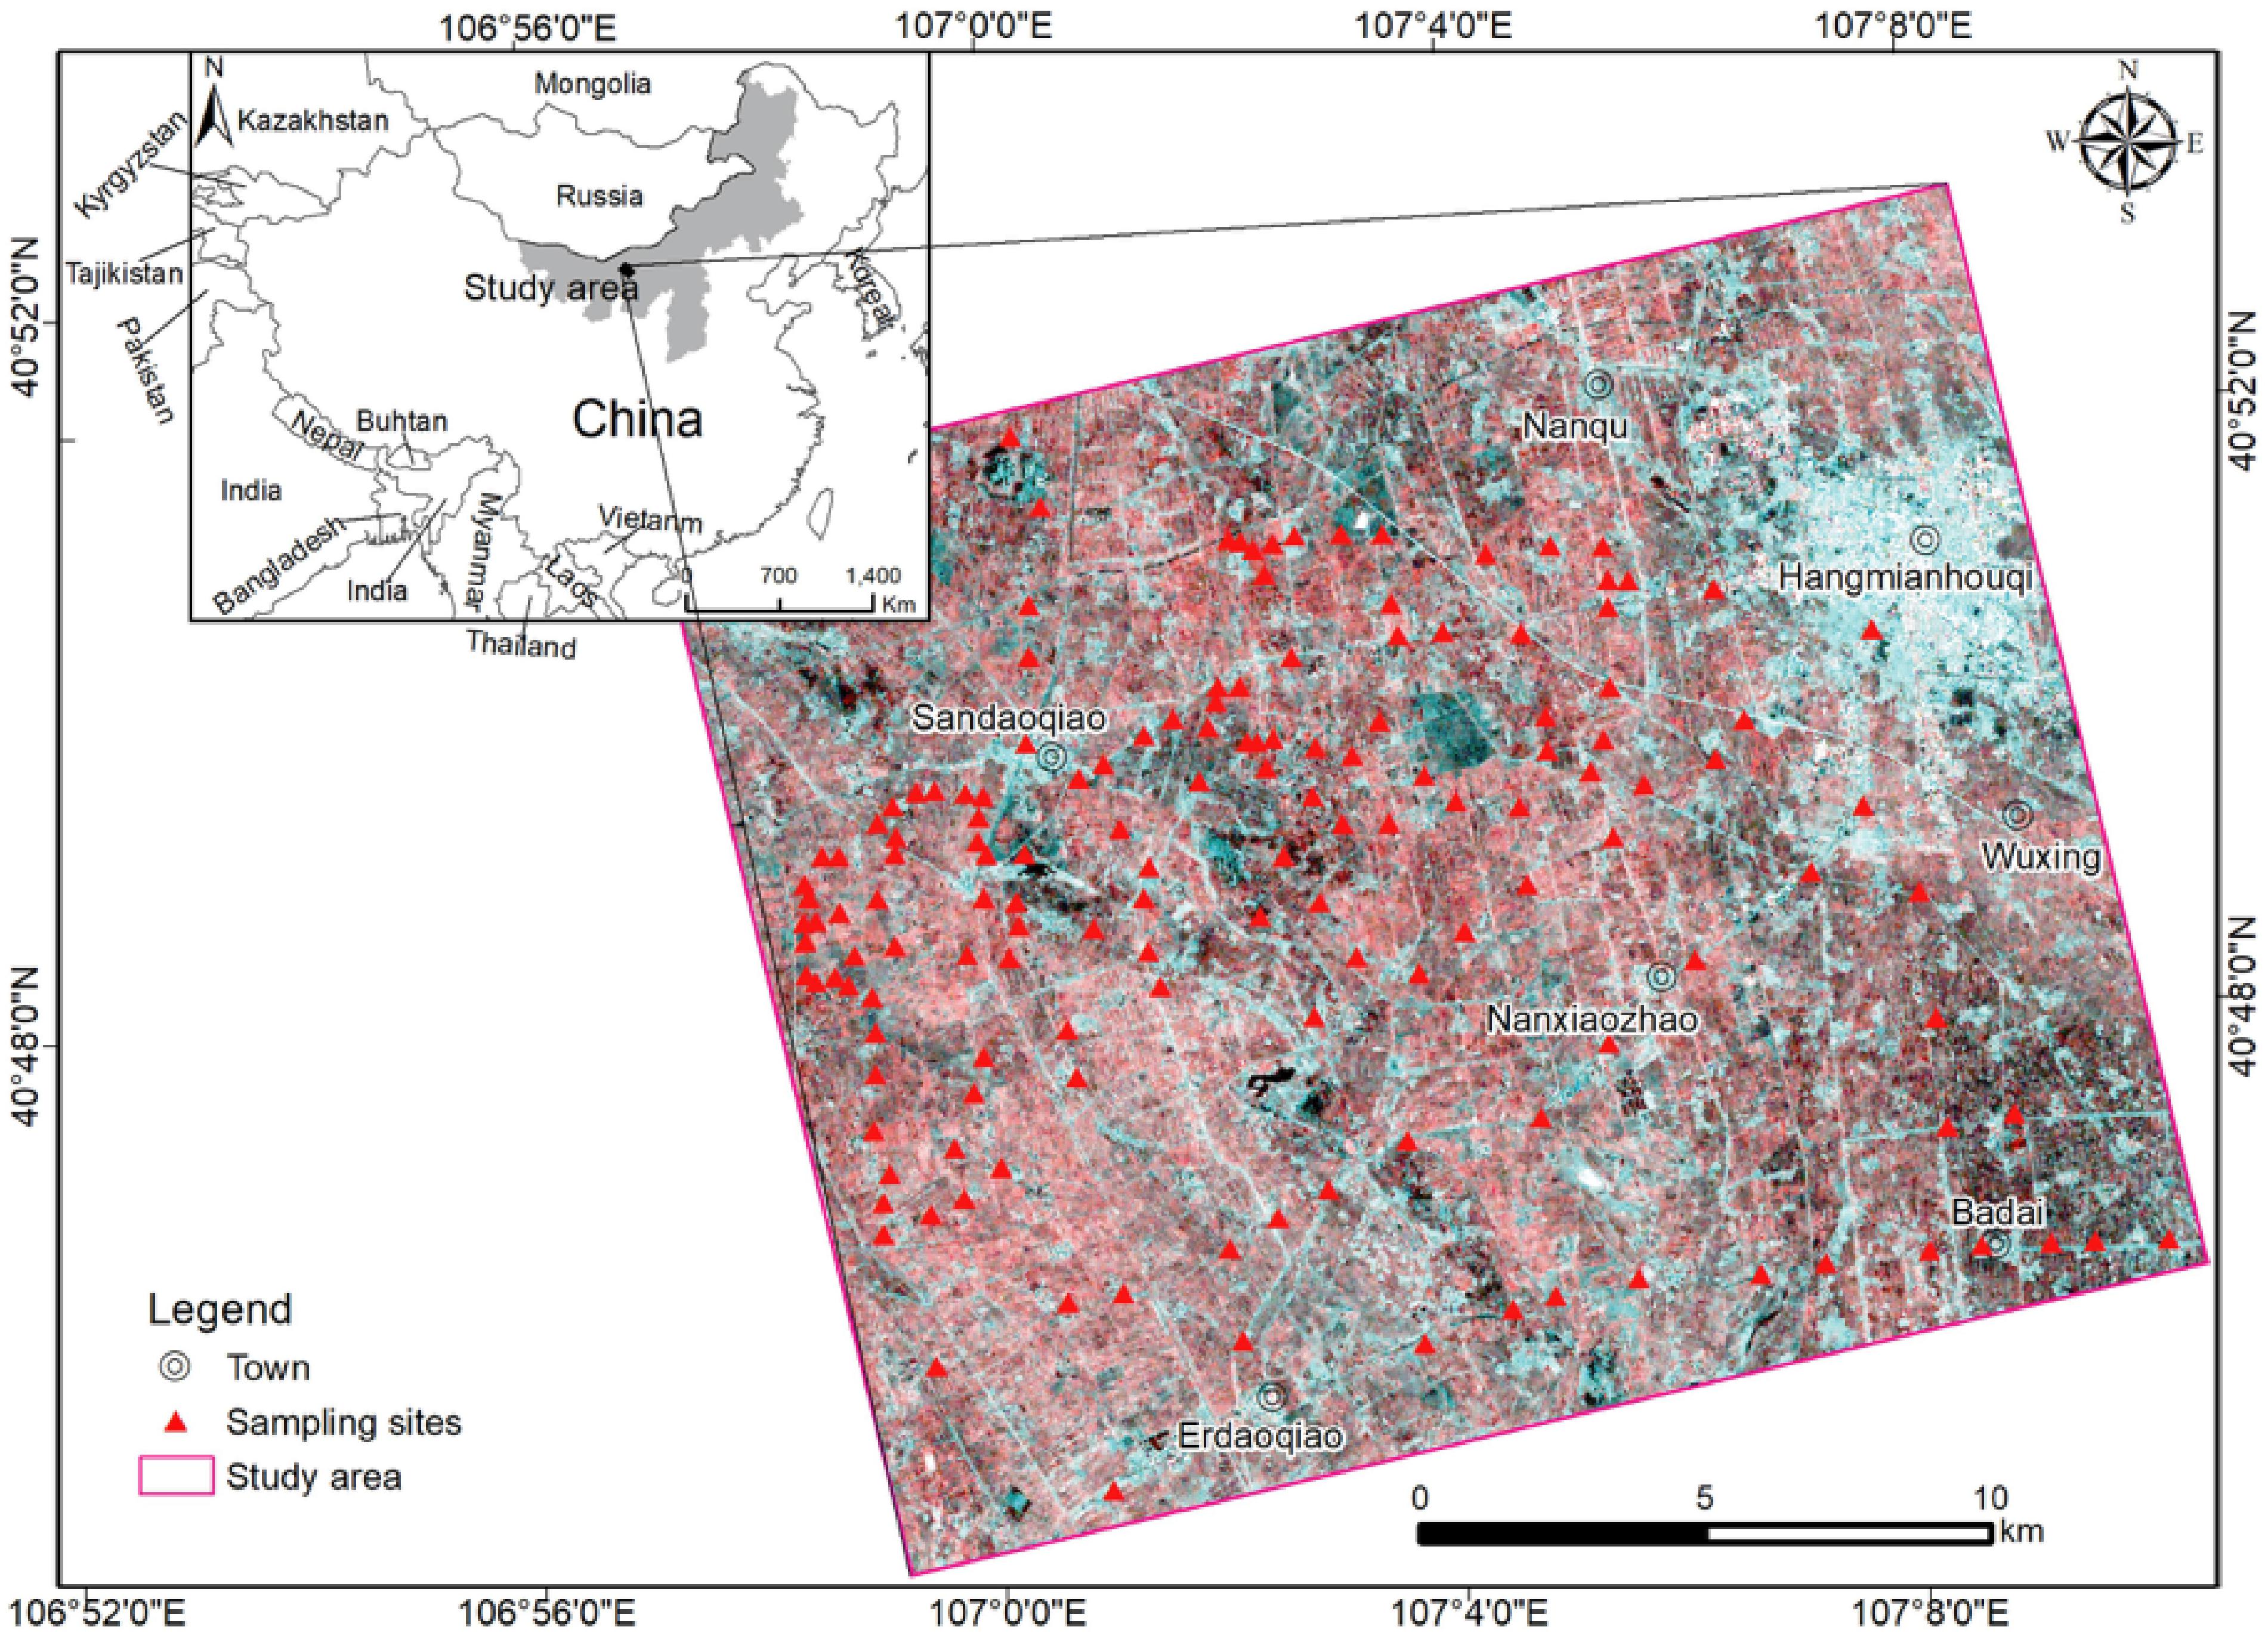
Figure 1. Location of study area and 147 sampling plots in Hetao Plain, Inner Mongolia from Radarsat-2 scene.
Radarsat-2 Observations
A Radarsat-2 scene was acquired using fine quad-polarization mode and a mean incidence angle of 31.32°, with SAR sensor of C-band (∼5.33 GHz), multiple imaging modes, and different polarization channels. The acquisition date of this scene is on April 11, 2016, when the surface of the study region was bare, immediately prior to spring irrigation. The spatial resolution of the image was 8 m, and the coverage was 25 km × 25 km. Standard processing to extract full-polarization backscatter coefficients was applied to the Radarsat-2 image with ENVI 5.3.1 software, including multilook, single image filtering, geocoding, and radiometric calibration. Terrain correction was not included in pre-processing due to the flat terrain in the study area, and the resultant principal parameters of backscattering coefficients were georeferenced using multiple ground control points. Resultantly, two co-polarization backscatters (transmitting and receiving directions are the same, e.g., hh or vv) and two cross-polarization backscatters (transmitting and receiving directions are not the same, e.g., hv or vh) are described in Table 1 and Supplementary Table 1.
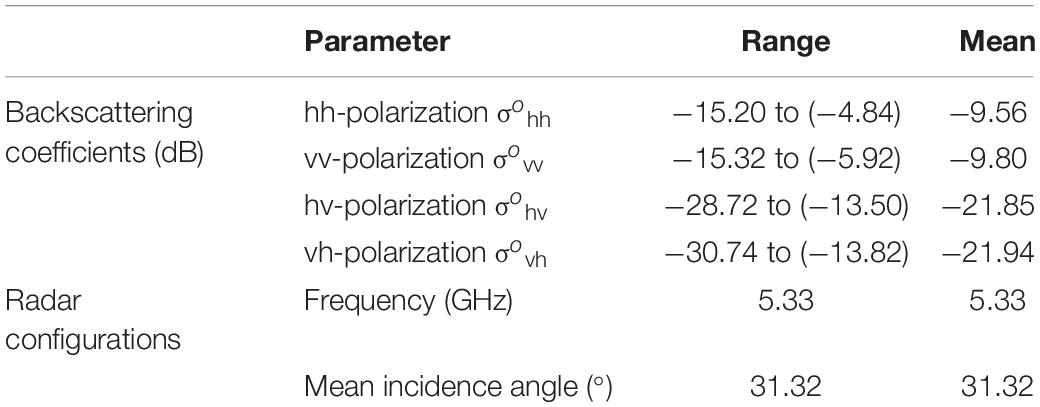
Table 1. Radarsat-2 data description.
Ground Measurements
Ground measurements of BSSM in the study area were conducted simultaneously to Radarsat-2 imagery acquisition, approximately on April 11–14, 2016. A total of 147 sampling plots were collected (Figure 1) on the bare tillable surface. There was neither precipitation nor agricultural practices during the whole campaign. A portable global positioning system device was used to record sampling locations.
Soil samples were collected at three evenly distributed points at a depth of 0–10 cm in each plot under the temperature of 10.4°C and later analyzed for gravimetric moisture content and bulk density measurements using the oven drying method. Surface roughness parameters [root-mean-square (RMS) height and correlation length] were measured on location in each sampling plot using the meshboard method and were alternatively taken in south–north and east–west directions. The meshboard used is 1 m long, and the sampling interval is 1 cm. As a result, the measured volumetric soil moisture contents and roughness parameters are described in Table 2 and Supplementary Table 1.
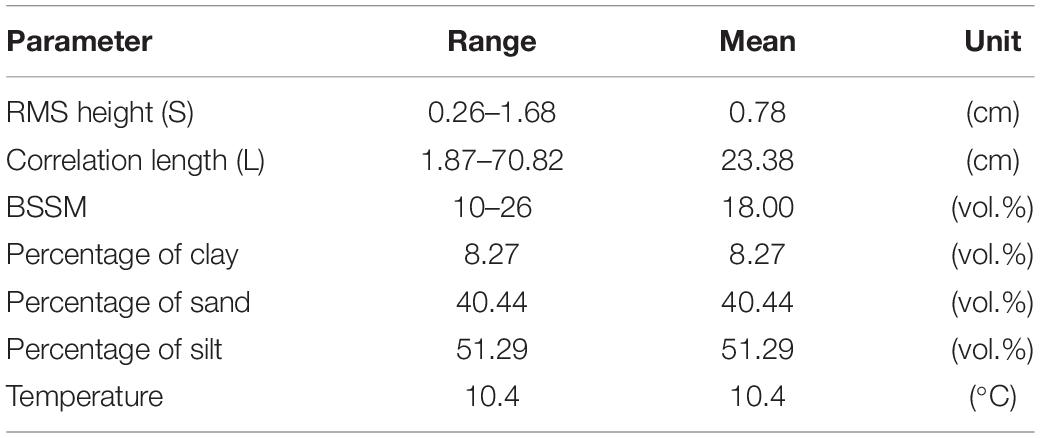
Table 2. Description of the collected of soil parameters from 147 sampling plots.
Methodology
GRNN Algorithm
Compared to standard feedforward neural network (e.g., Duda et al., 2001; Dou et al., 2015, 2020; Chang et al., 2019; Merghadi et al., 2020), the structure of GRNN is relatively simple and static with four layers: input, pattern, summation, and output layers (Djarfour et al., 2014). Once the input goes through each unit in the pattern layer, the relationship between the input and the response would be stored in the unit. Therefore, the regression performed by GRNN is actually to output the most probable scalar , given specified input vector X:
where D_i is the distance between the input vector X and the training sample input vector Xi stored in the pattern unit (or cluster centre), and σ, called “spread” or “smoothing parameter,” is the only unknown parameter in the network and affects the fitness in GRNN architecture that needs optimization (Yuan et al., 2020). The spread represents the standard deviation of the input vector X from the training sample input vector Xi in the Gaussian kernel of , and GRNN can produce the optimal results as long as the spread is no more than the standard deviation (Zhong et al., 2007). Therefore, the optimized σ is theoretically not unique, and it was often suggested to use the cross-validation to estimate the optimized spread (Specht, 1992; Specht and Romsdahl, 1994). In this study, the GRNN package integrated in the MATLAB software is used.
There are 15 GRNN architectures due to 15 different kinds of input, respectively, for BSSM-backscatter and BSSM-roughness-backscatter relationships (Figure 2).
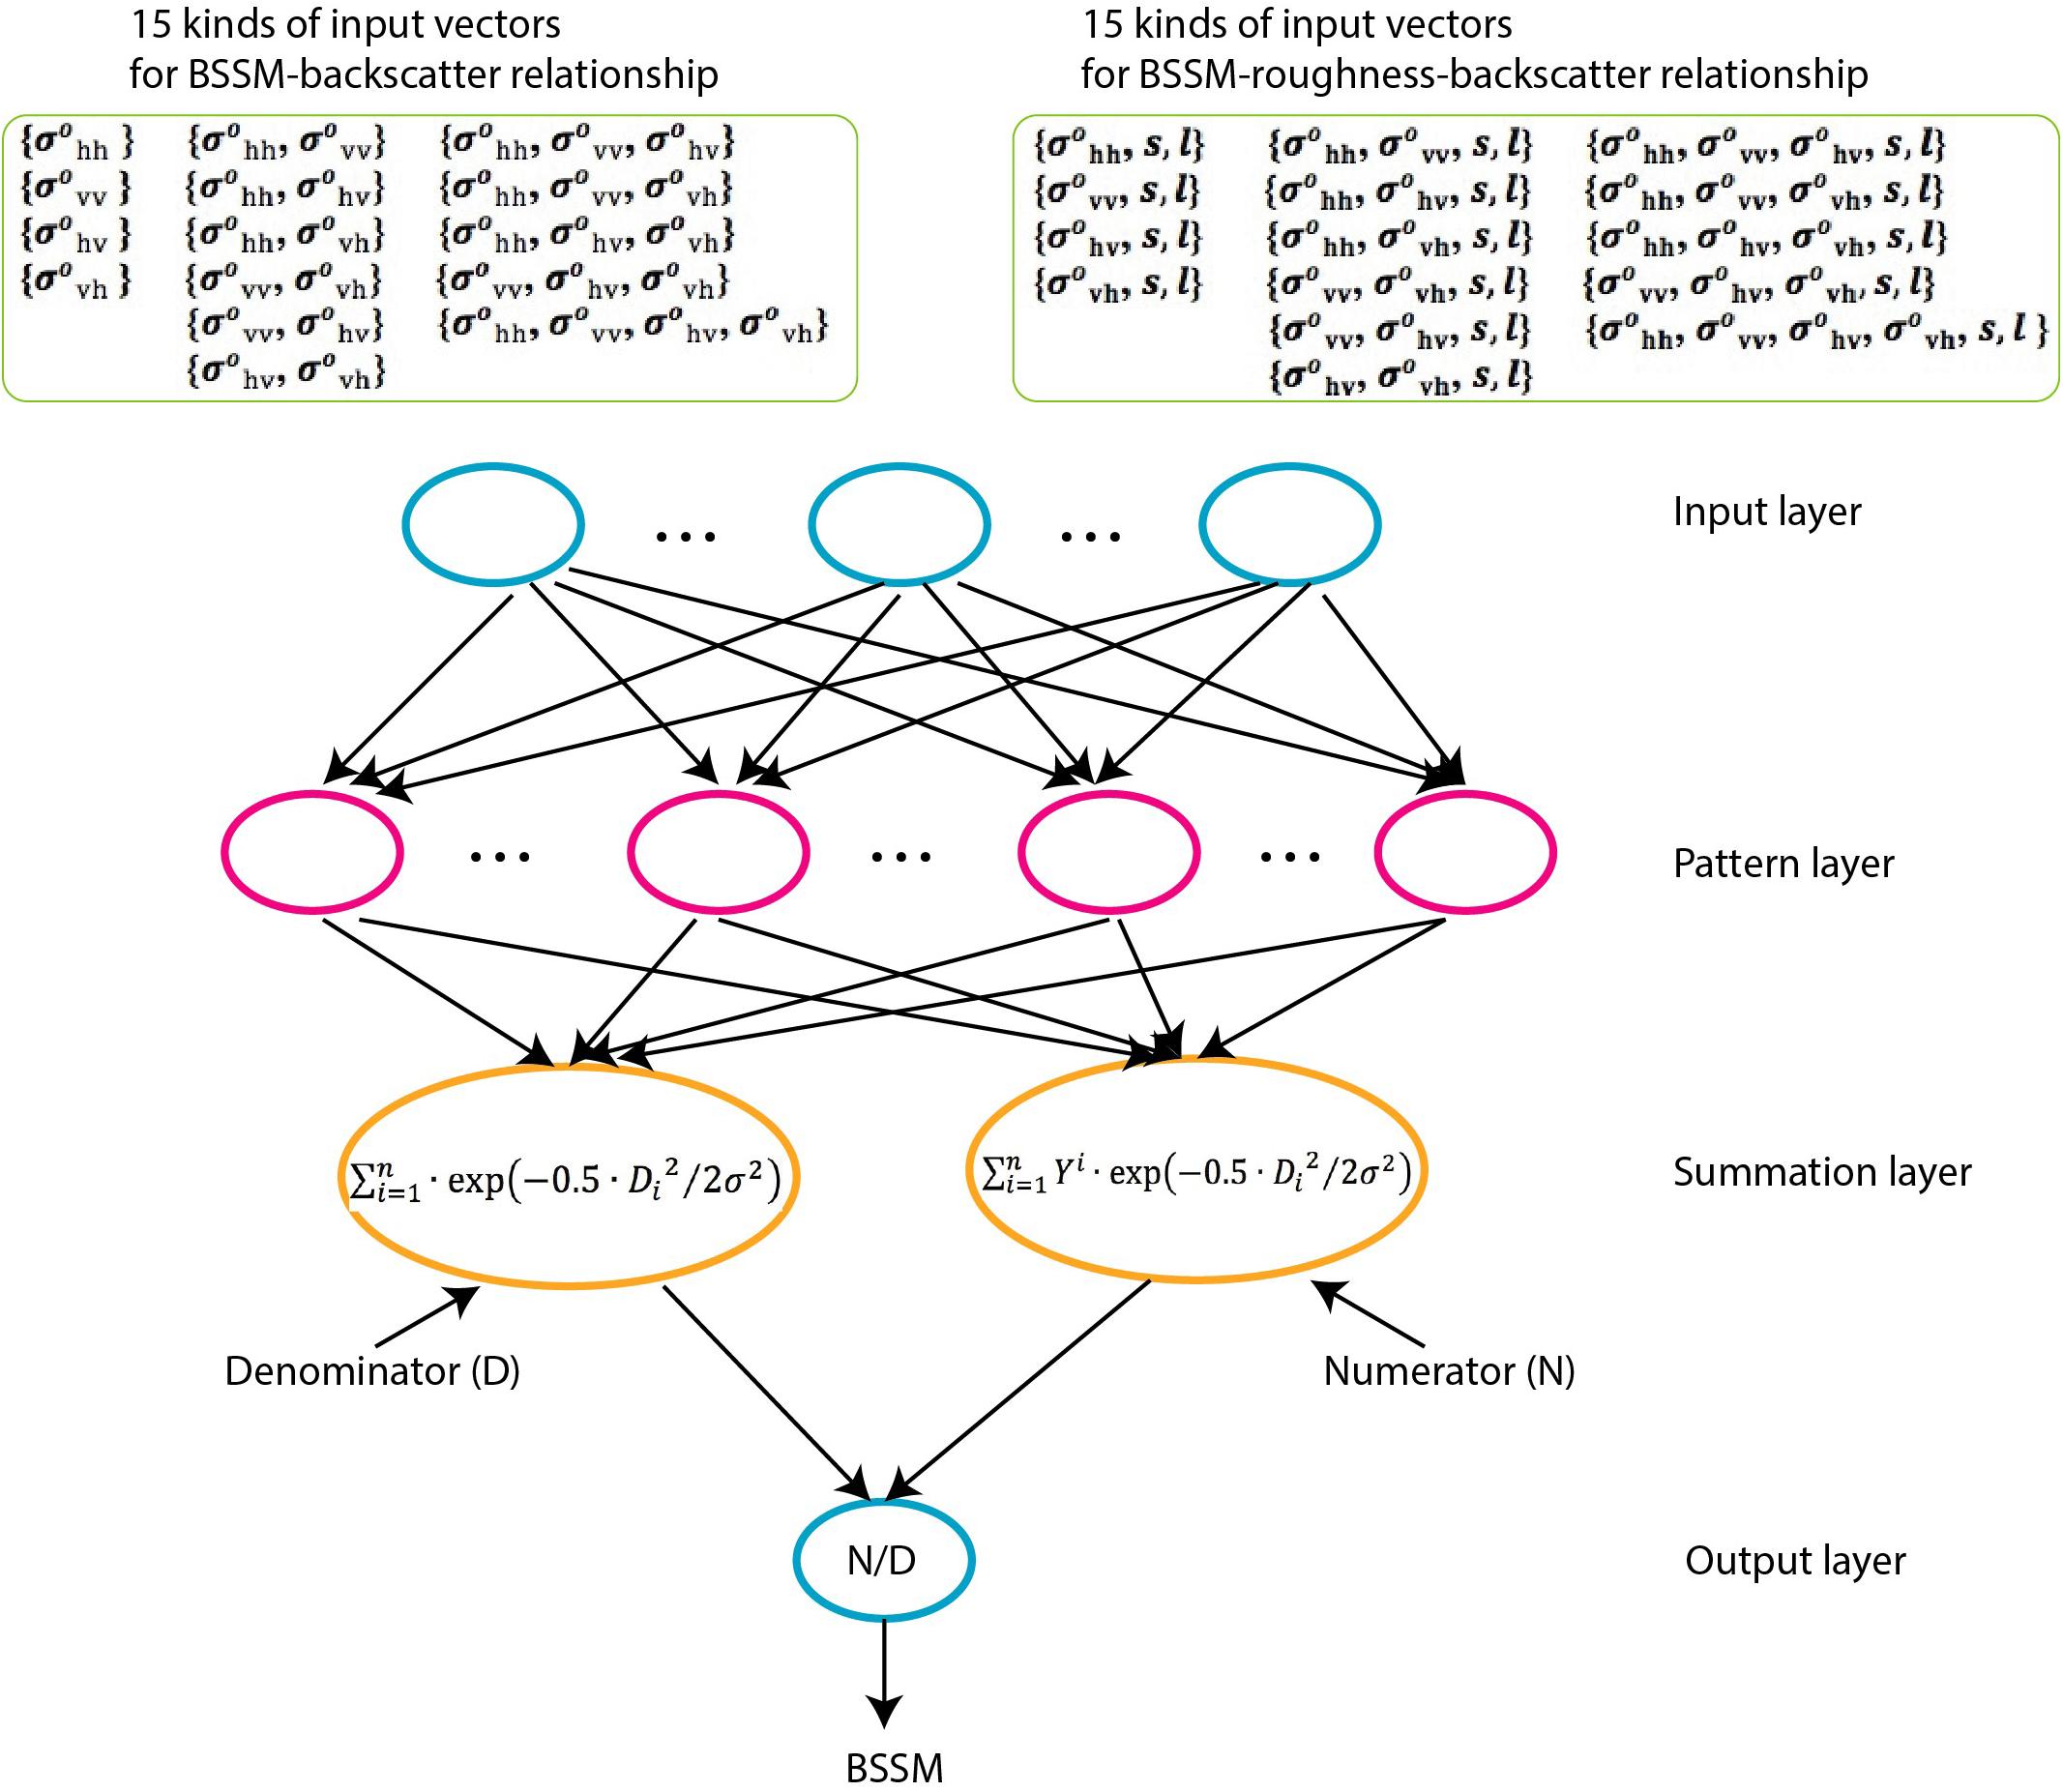
Figure 2. GRNN frameworks for bare surface soil moisture retrieval from backscattering coefficients without and with auxiliary surface roughness.
Model Evaluation
In this study, a 10-fold cross-validation technique is chosen to test the models’ predictive capabilities due to a limited number of soil samples (Entekhabi et al., 2010; Rodriguez and Perez, 2010; Berrar, 2018). The mean absolute error (MAE) and the root-mean-square-error (RMSE) (Hastie et al., 2008) are used as the metrics to assess the performances of GRNN algorithms for soil moisture retrieval in terms of prediction accuracy. These metrics mentioned above are defined as follows:
where is the predicted bare surface soil moisture content of sample i, BSSMi is the in situ measurement of sample i, is the mean value of soil moisture contents of all in situ measurements, and n is the number of all samples.
The coefficient of determination was often used in different versions of mathematical definition in past publications (Kvalseth, 1985), which makes it difficult to compare. Moreover, the value of R2 is also related to the number of observations: for example, R2 could be as high as 0.97 in fitting a linear relationship between an independent variable X and a normally distributed dependent variable Y based on three observations, even though X is unrelated to Y, but with 100 observations, the R2 of 0.07 is enough to establish statistical significance at the 1% level (Hahn, 1973). Therefore, the statistical significance that is reflected by the value of R2 in different models with different observations is also difficult to compare. Instead, the significance level of F test (Box, 1953) is used here as a complementary reference to the MAE and RMSE metrics, and the statistical significance package integrated in the MATLAB software is used.
Results
Fifteen BSSM-backscatter models are constructed by GRNN here, based on 15 combinations of full-polarized backscattering coefficients: { }, { }, {}, {}, {, }, {, }, {, }, {, }, {, }, {, }, {, , }, {, , }, {, , }, {, , }, and {, , , }. The 10-fold cross-validations are used to determine the appropriate spread parameters of these models. The empirical knowledge in the past publications indicates that the spread σ definitely was more than zero and it was probably to produce a good result by a value between 0.01 and 1 (Yuan et al., 2020), so here the range of the spread σ is explored from 0.01 to 1. This study utilizes MAE and RMSE to estimate the models, and utilize the significance level (P value) to confine the MAE and RMSE. The MAE and RMSE, which have P values of above 5%, will be eliminated, and thus those ranges not circled in a green dashed line in Figure 3 are eliminated first.
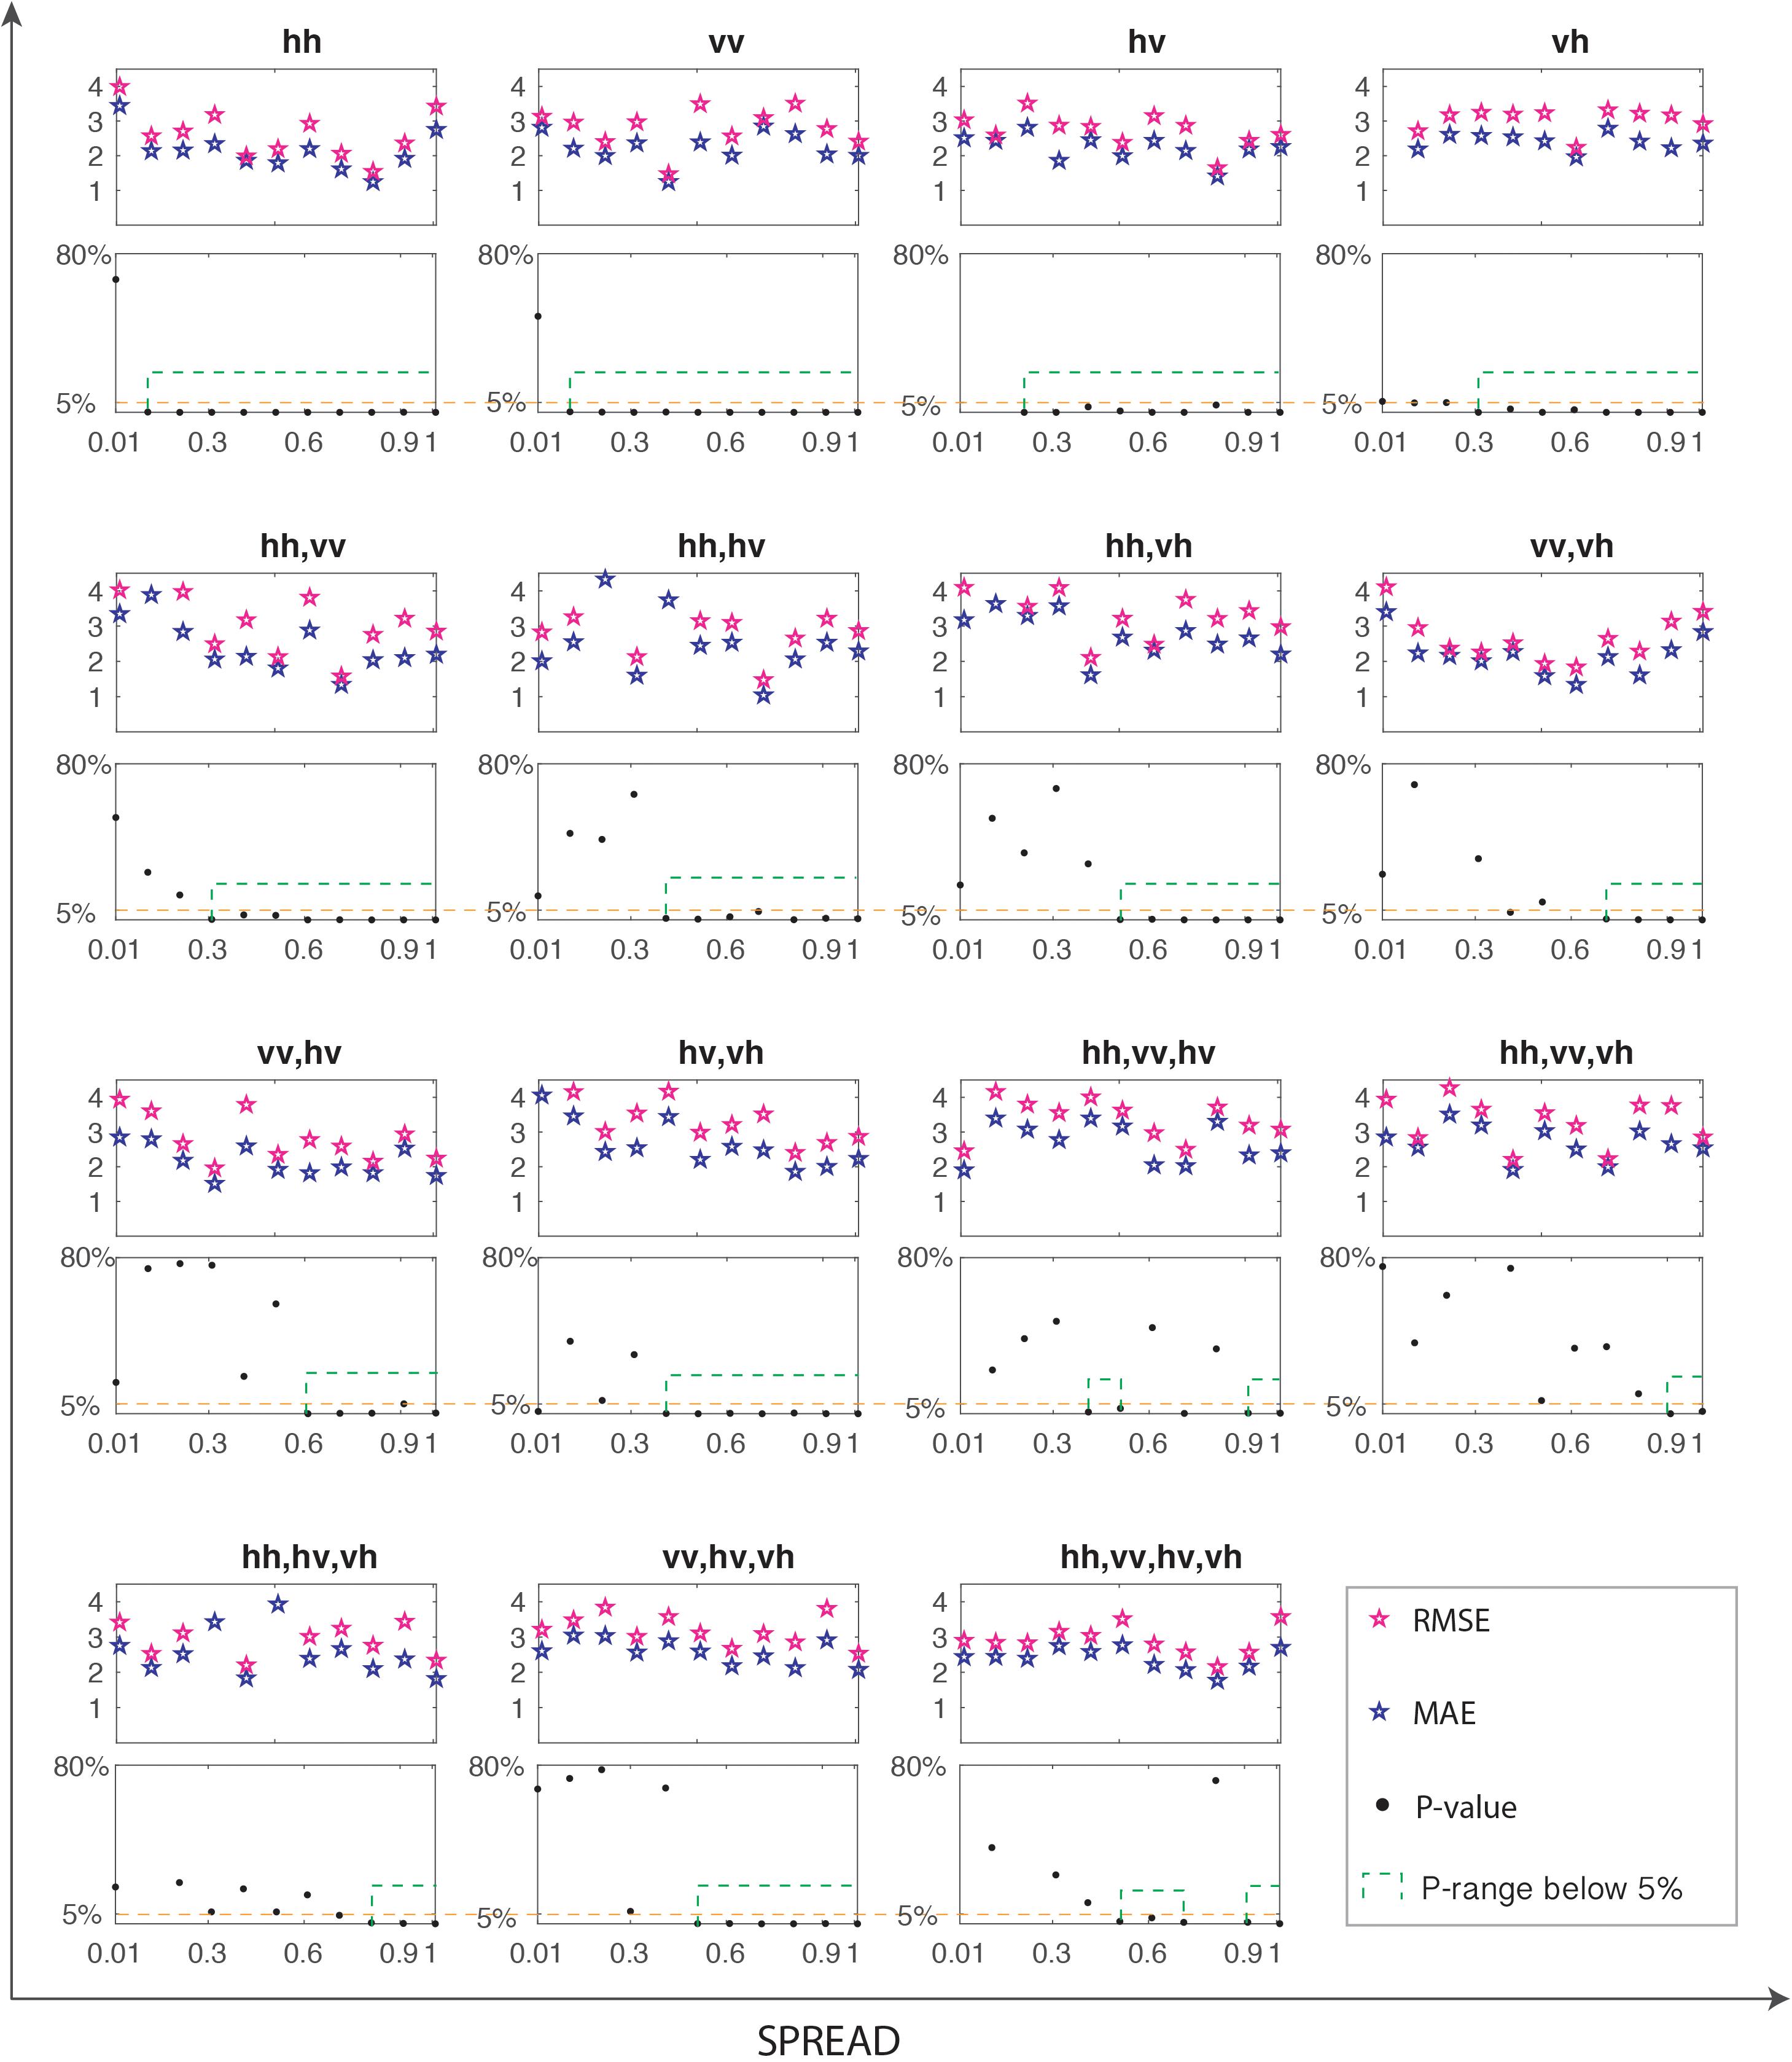
Figure 3. The cross-validation results of 15 backscatter-BSSM models under the spread range from 0.01 to 1.
Furthermore, the independent test dataset is used to assess the final models’ performance and the metrics are shown in Figure 4. Based on the results of both 10-fold cross-validations and independent-test metrics, those ranges of the spread parameters in translucent blue are recommended to use for GRNN models. Table 3 lists the recommended backscatter-BSSM models, their respective appropriate spread ranges, and their corresponding MAE and RMSE values. Generally, the nine recommended backscatter-BSSM models have excellent MAE and RMSE values ranging, respectively, from 1.43 to 1.84 and 1.83 to 2.4, which are even better than the related models in past publications.
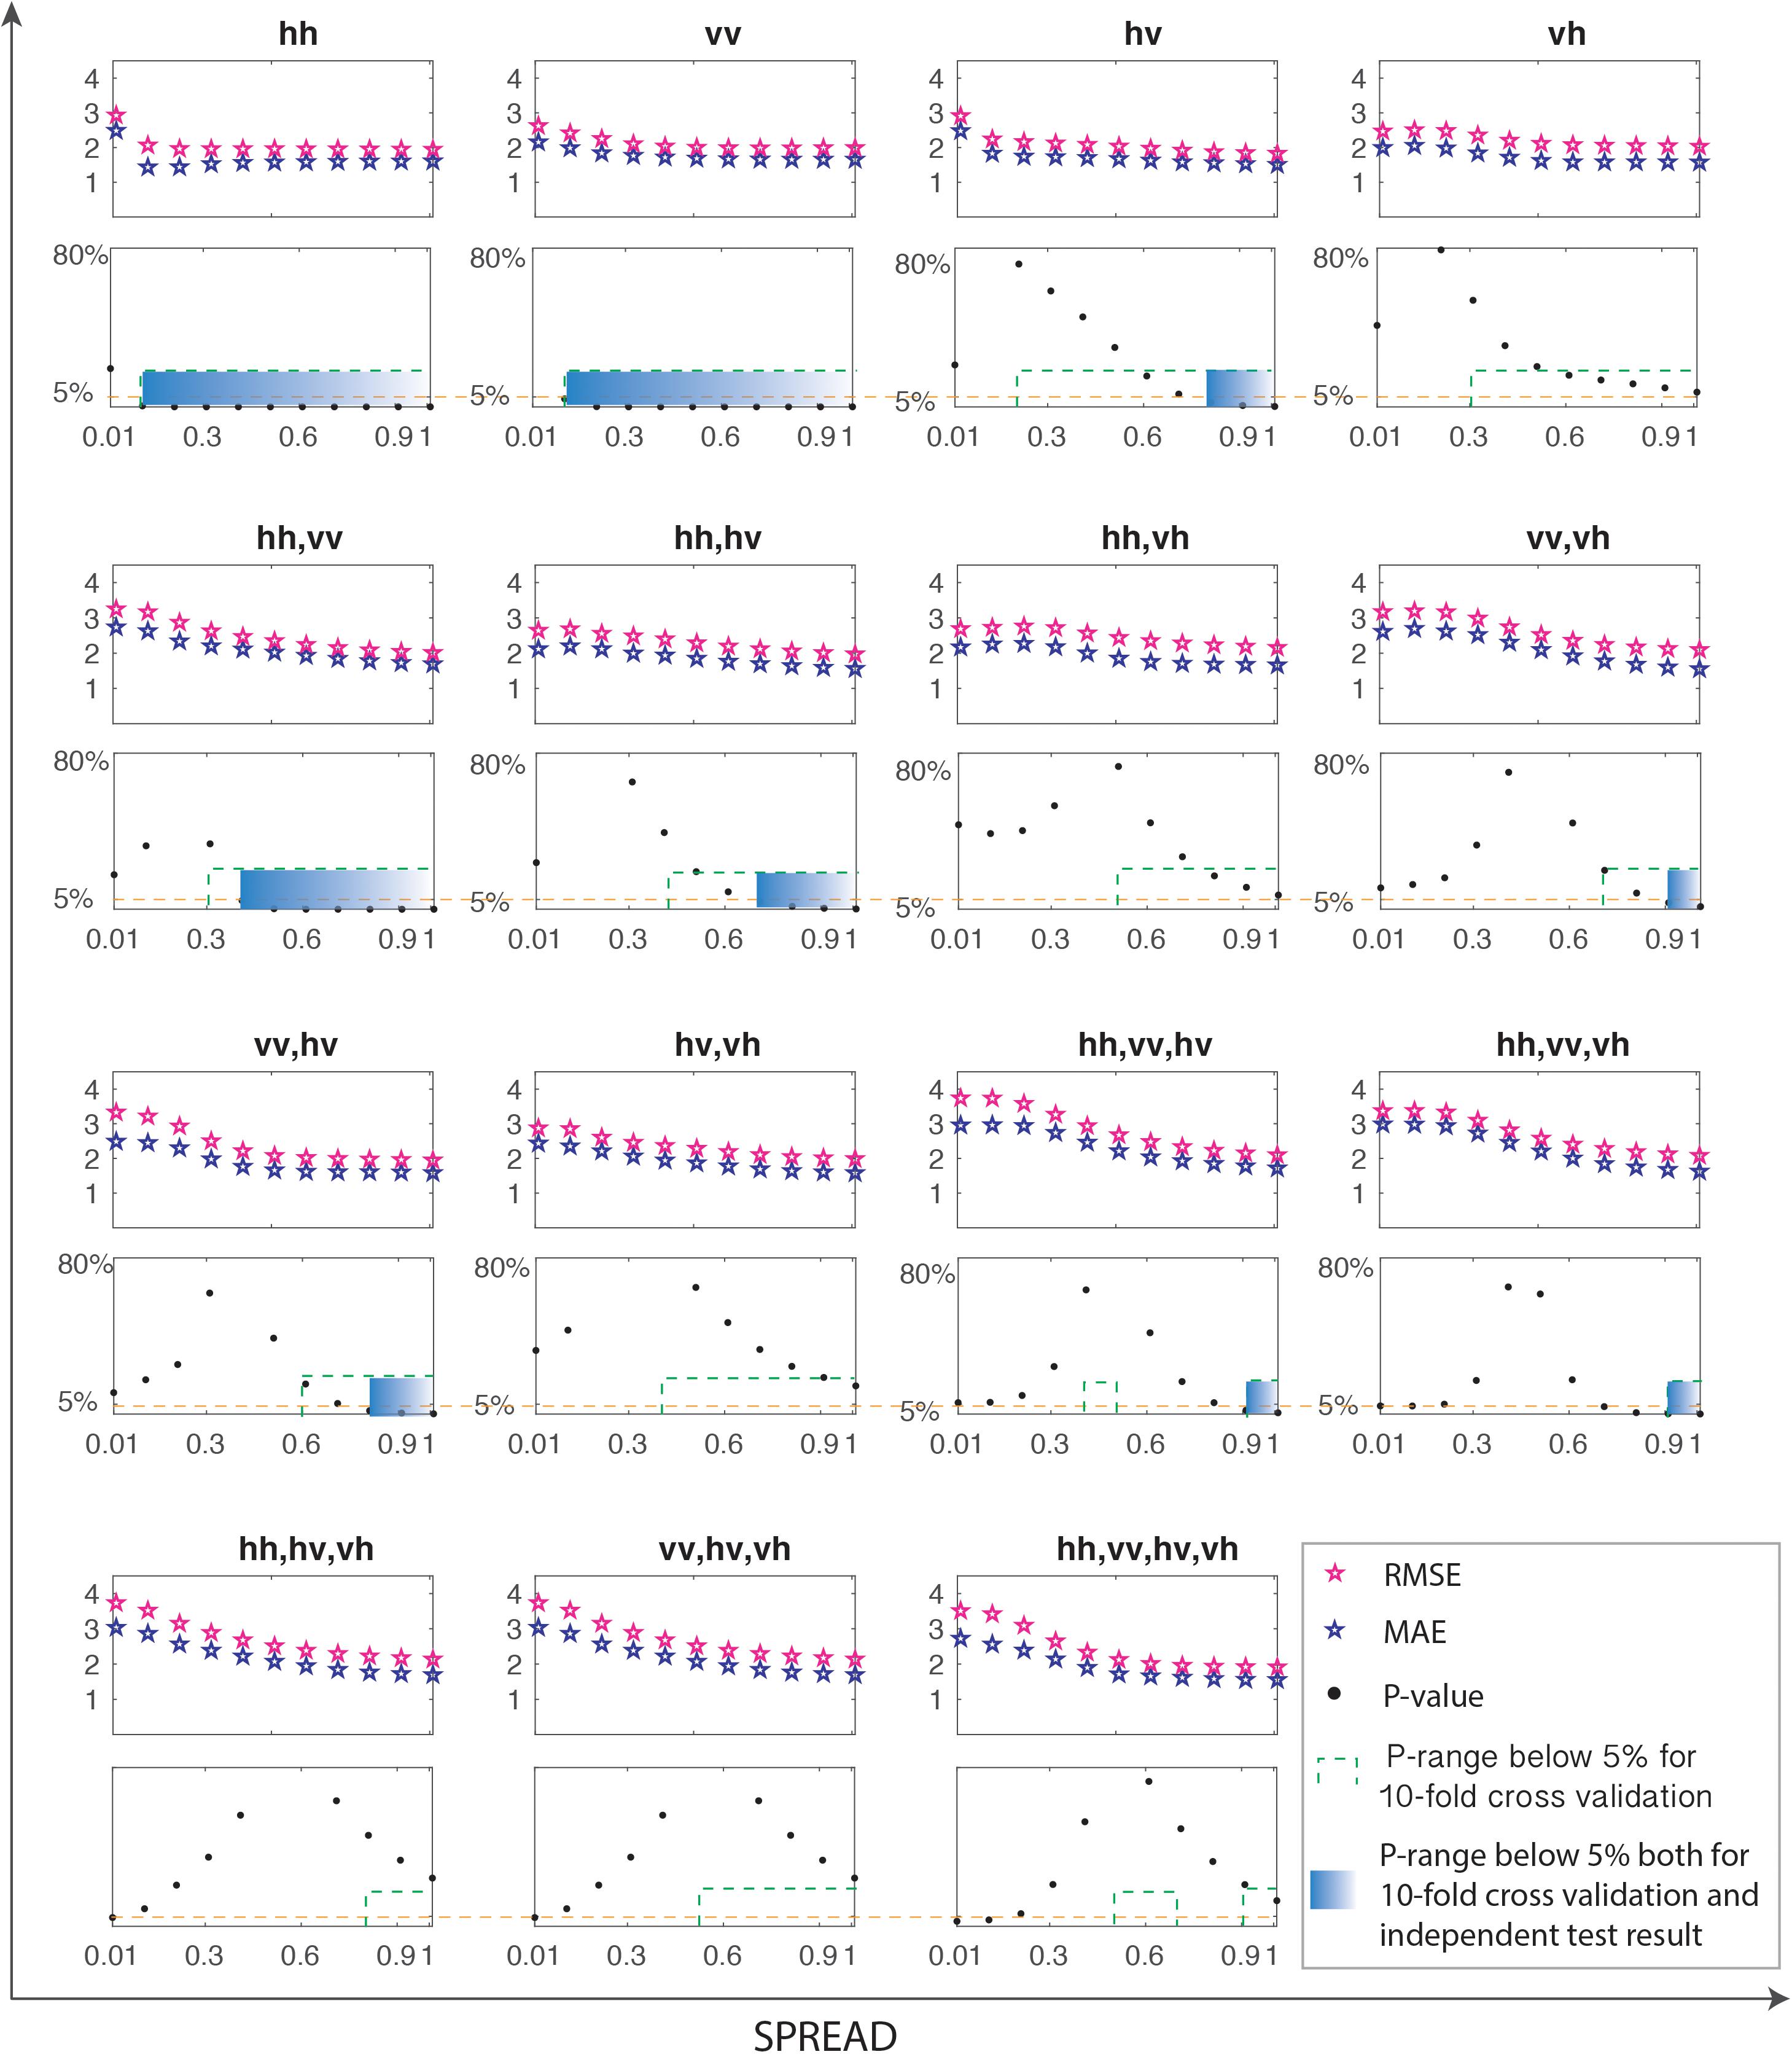
Figure 4. The performance metrics of 15 backscatter-BSSM models by independent test under the spread of 0.01 to 1.
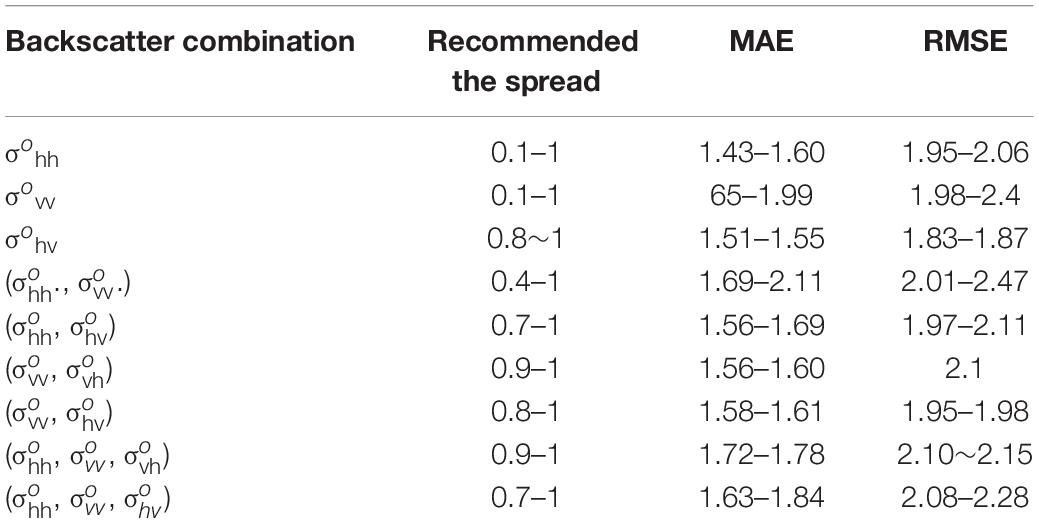
Table 3. The recommended backscatter models, spread parameters, and their performance metrics.
Comparisons and Discussion
Comparison Between Backscatter-BSSM and Backscatter-Roughness-BSSM Models by GRNN
Comparisons are made between backscatter-BSSM and backscatter-roughness-BSSM models constructed by GRNN in order to be clear whether soil roughness is thoroughly decoupled from the BSSM effect on SAR backscatters (Figure 5). Here, the MAE and RMSE are compared in terms of trend lines fitted by power function, where the solid lines denote trend lines of 15 backscatter-BSSM models and the dashed lines denote those in Figure 5, which are, respectively, in blue and magenta. The translucent ranges in Figure 5 are the recommended spread parameters. Generally, the solid lines are lower than their corresponding dashed lines for the 15 pairs of comparison, which implies an overall better prediction of 15 backscatter-BSSM models than 15 backscatter-roughness-BSSM models by GRNN. In the recommended ranges of spread parameters, backscatter-BSSM models have better prediction than backscatter-roughness-BSSM models.
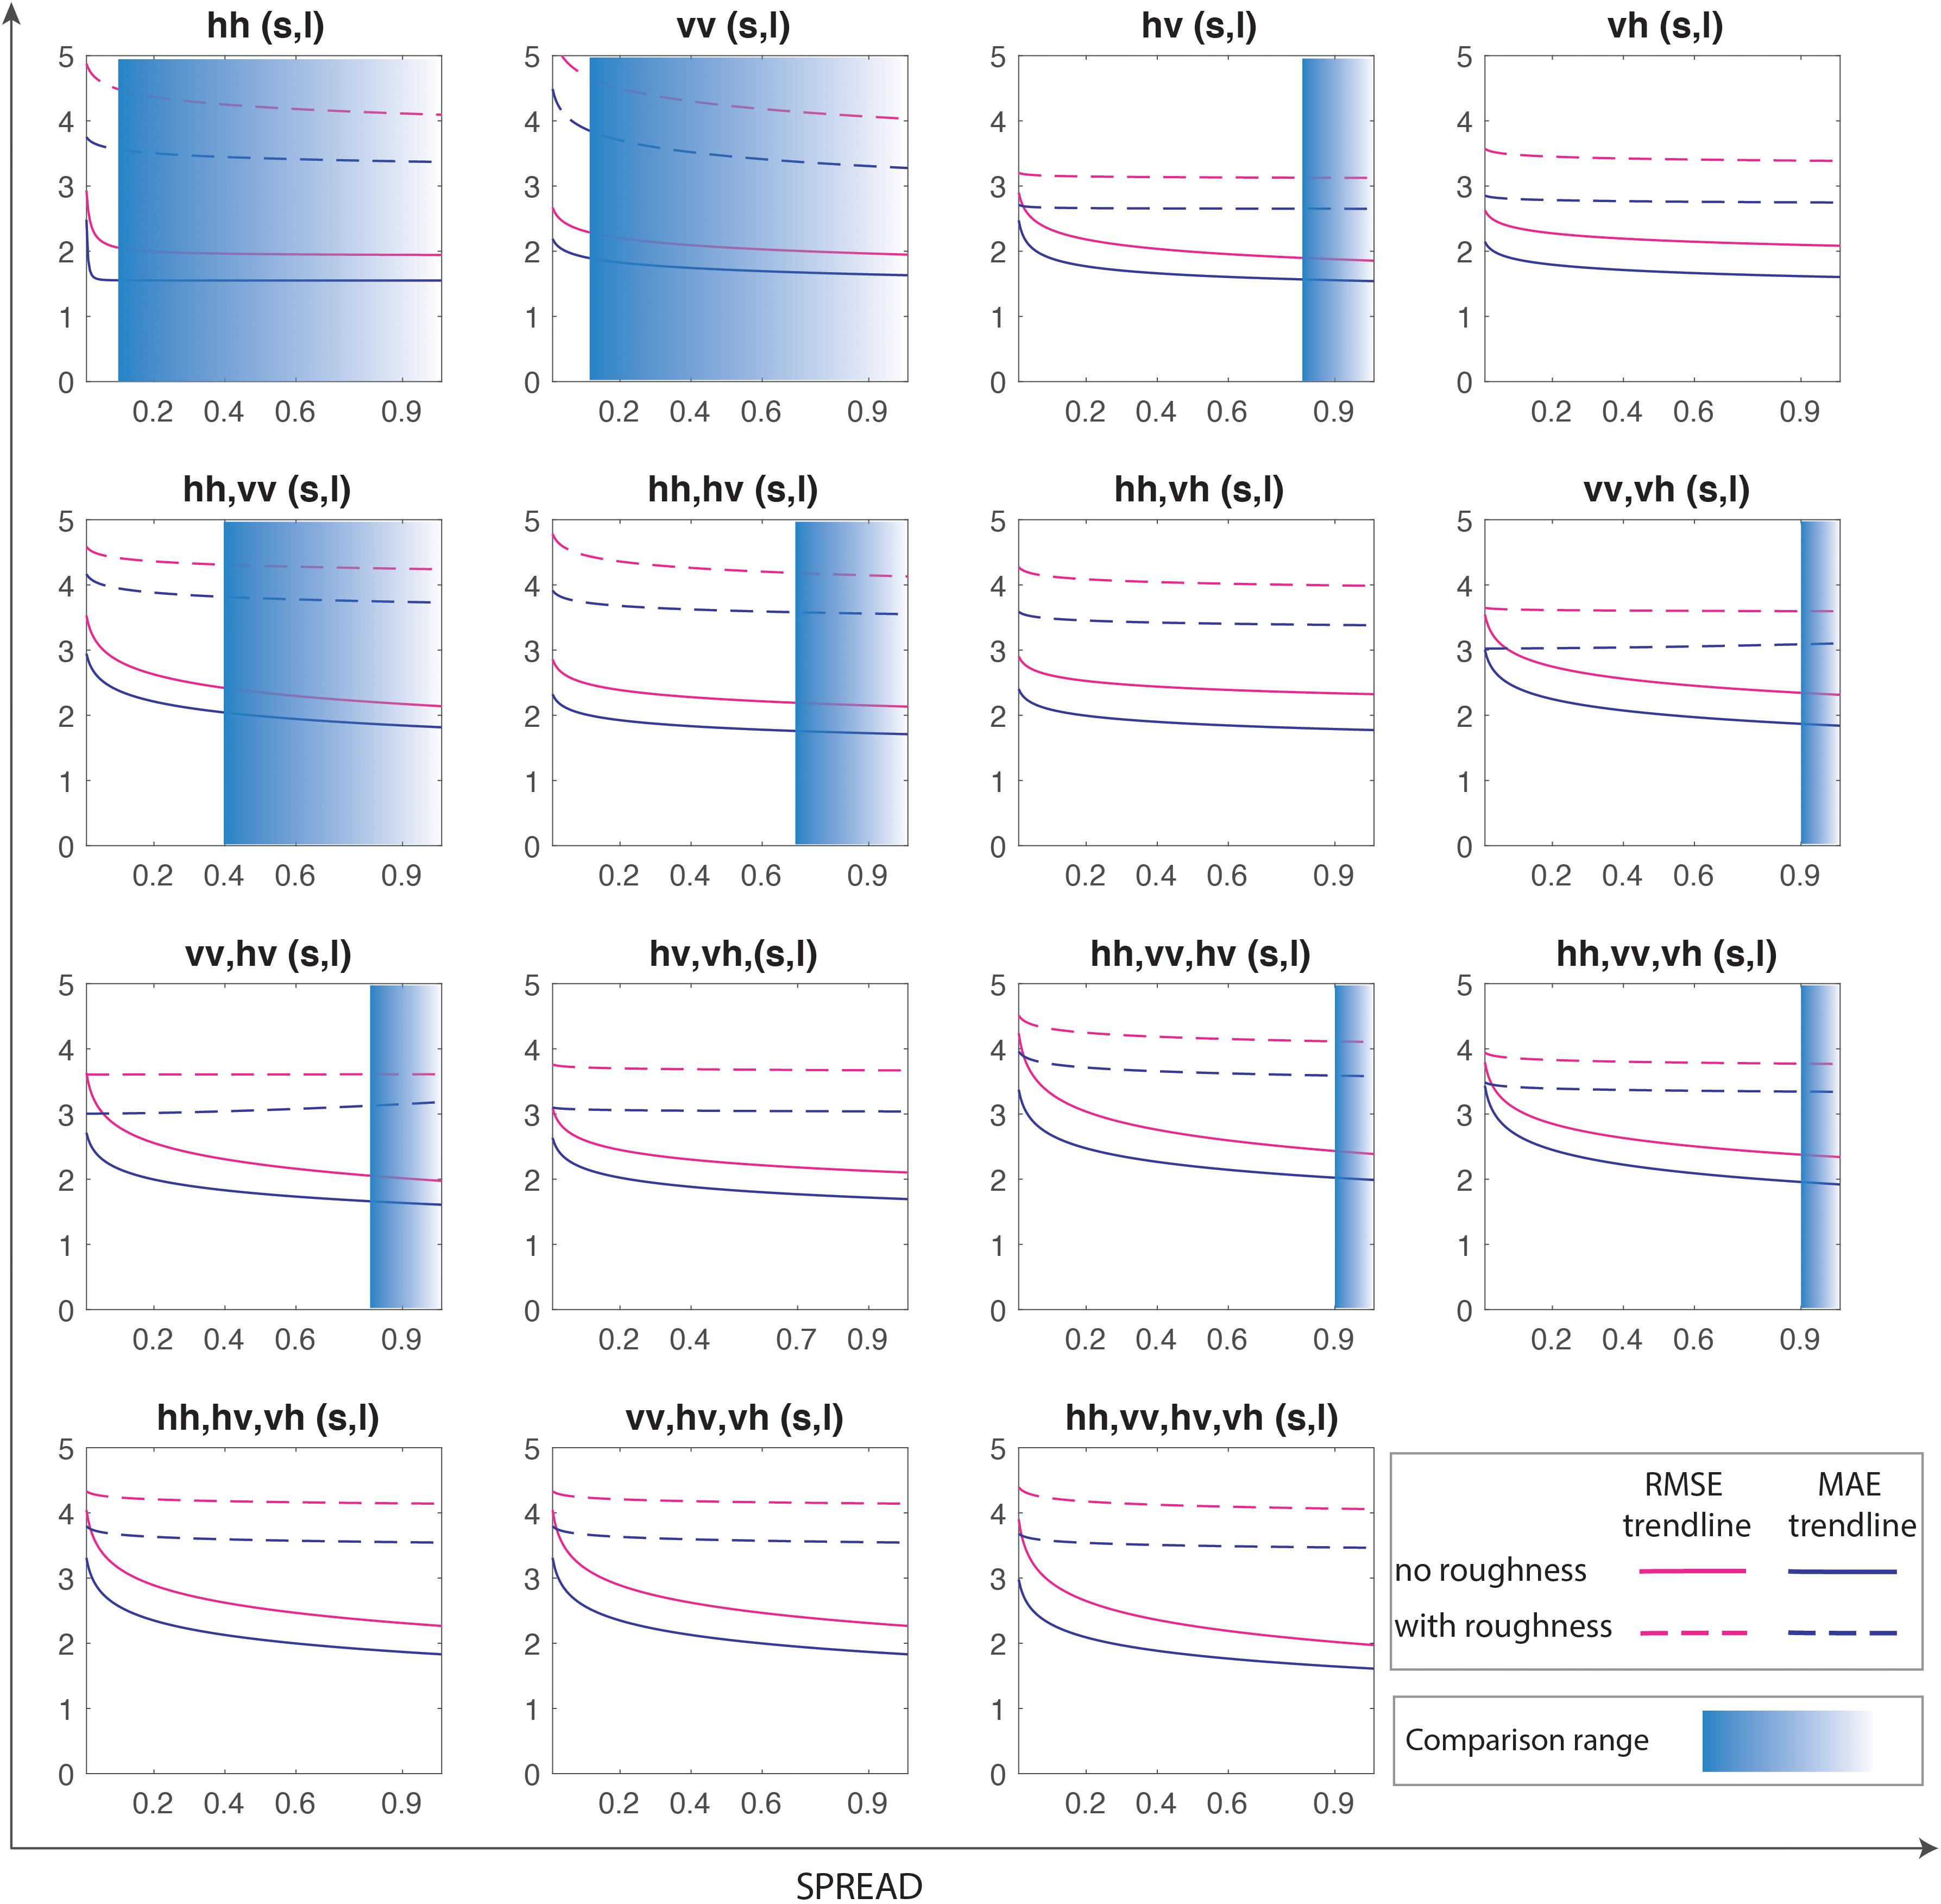
Figure 5. Comparison of trends of models’ final performance metrics by independent test between backscatter-BSSM and backscatter-roughness-BSSM models constructed by GRNN. The blue translucent ranges of the spread parameter are within those recommended ranges.
Comparison Between Backscatter-BSSM and Backscatter-Roughness-BSSM Models by Parametric Regression
The comparison here is in order to confirm the combined influence of BSSM and surface roughness on SAR backscatters by parametric regression in this study. The backscatter-BSSM and backscatter-roughness-BSSM models by parametrical regression are defined based on the research (Zribi and Dechambre, 2003), which are written as follows:
In Figure 6, the red lines and markers symbolize the MAE and RMSE metrics of the 15 BSSM-backscatter regression analyses, whereas the blue lines and markers symbolize the MAE and RMSE metrics of the 15 BSSM-roughness-backscatter regression analyses. In general, the MAE and RMSE of the regression analyses with roughness for the 15 combinations of backscatters are lower than the corresponding values of the regression analyses without roughness, which means better prediction by considering the soil roughness effect when using the parametric analysis methods.
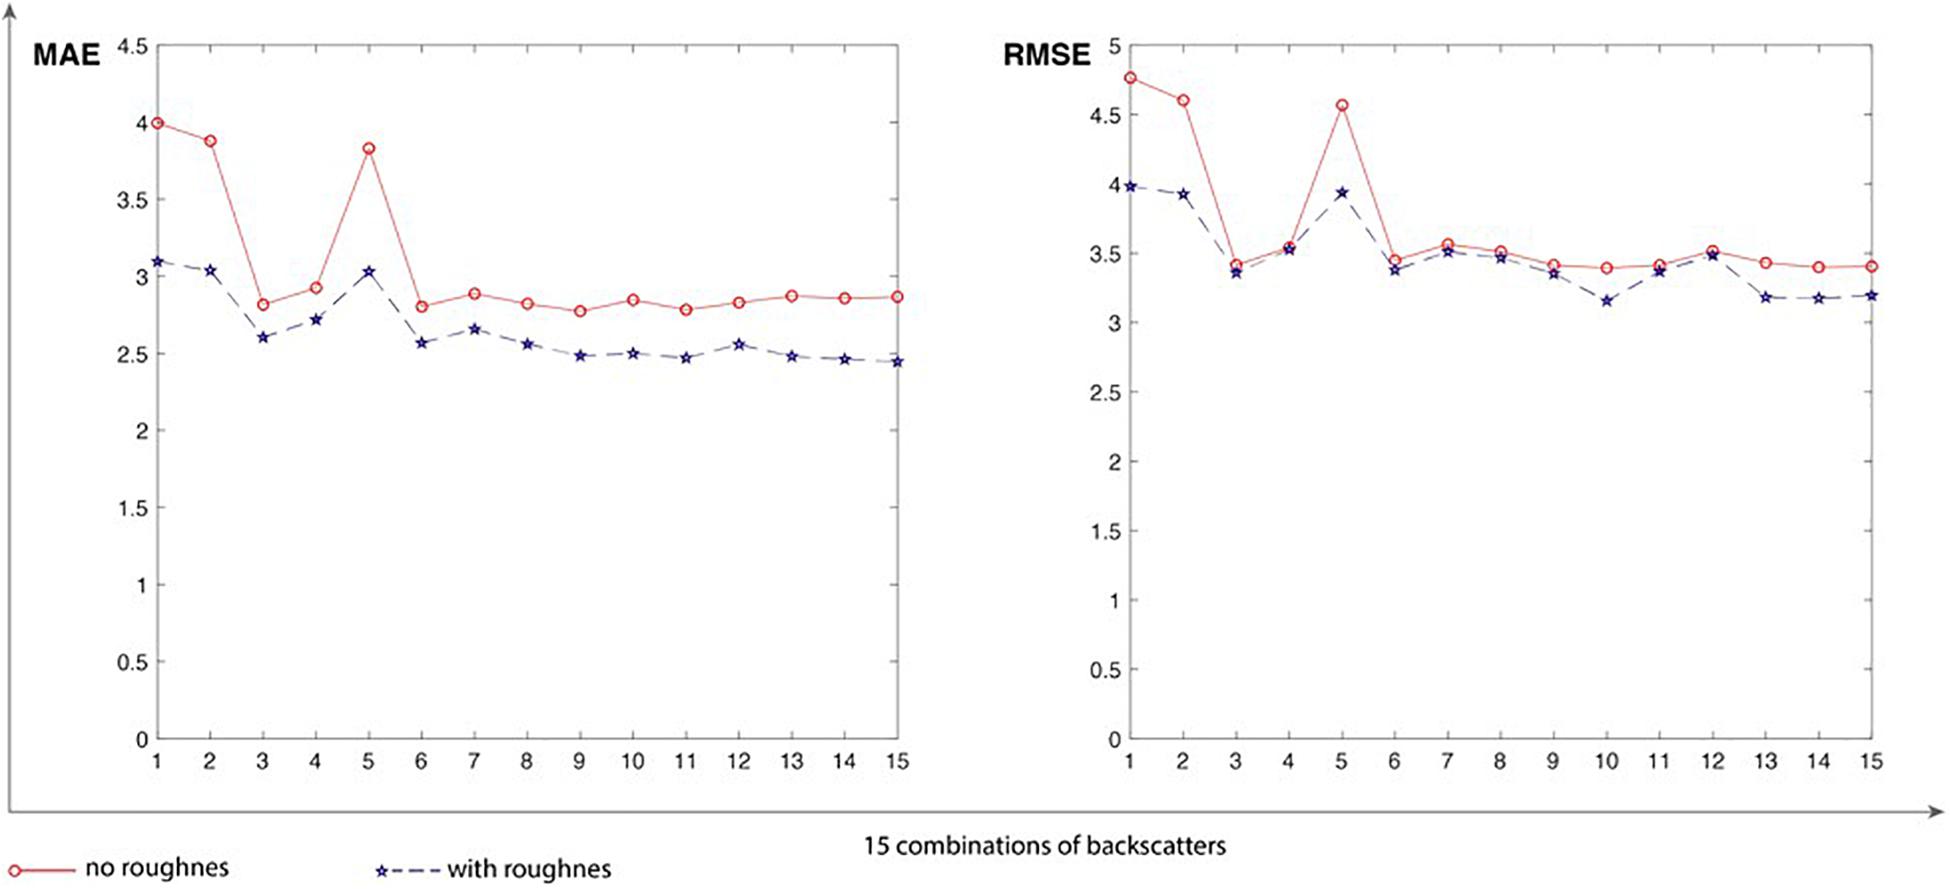
Figure 6. Comparison of cross-validation results of backscatter-BSSM and backscatter-roughness-BSSM models analyzed by parametric regression in low-dimensional space.
Discussion
The first comparison (Figure 5) shows that the incorporation of auxiliary roughness into BSSM retrieval from SAR backscatters by GRNN does not raise the prediction accuracy of models and even, most of the time, reduces the prediction accuracy, which indicates that the soil roughness is an invalid effect in BSSM retrieval from SAR backscatters by GRNN. The second comparison (Figure 6) shows that the incorporation of roughness into BSSM retrieval from SAR backscatters by parametric regression raises the prediction accuracy of models, which indicates the positive effect of soil roughness in BSSM retrieval from SAR backscatters by parametric regression. GRNN analysis signifies high-dimensional analysis, whereas parametric regression denotes low-dimensional analysis. The contrast between the two comparisons may be a hint that the relationships among BSSM, soil roughness, and backscattering coefficients are distinct in the analytic spaces with different dimensions.
Conclusion
This study derives BSSM directly from SAR backscatter observations using small-size sample data to train GRNN. This method is more promising to remove the effect of soil roughness on soil moisture retrieval from SAR backscatter than both multi-temporal analysis and feedforward ANN inversion of physically based forward models. Firstly, this method can avoid the inconvenience of temporal characteristics of roughness changes from multi-temporal analysis. Secondly, it minimizes the error of data to train ANNs using samples data, compared to feedforward ANN inversion that uses simulated data from physically based forward models. Furthermore, the models’ validations show that the incorporation of soil roughness into BSSM retrieval from backscatter by GRNN does not raise prediction accuracy and even reduces it (Figure 5), indicating thoroughly decoupling the effect of BSSM on backscatter from the effect of soil roughness. By contrast, as mentioned in Section 1, ANN inversion of IEMs (e.g., Paloscia et al., 2008) actually does not thoroughly decouple the combined effect of BSSM and soil roughness on SAR backscatter. However, the comparison of models’ validations between BSSM-backscatter and BSSM-roughness-backscatter models by parametric regression still shows the combined influence of soil roughness and BSSM on SAR backscatter. Conclusively, although ANNs are rather advantageous to recognize the superbly complex nonlinear relationships compared to traditional parametric analysis methods, the selection of ANNs is still crucial and it is better to choose the ANNs that can work well even with small-size data (e.g., GRNN).
In the 15 backscatter-BSSM models by GRNN, #x03C3;hh-BSSM, σvv-BSSM, σhv-BSSM, (, )-BSSM, (, )-BSSM, (, )-BSSM, (, )-BSSM, (, , )-BSSM, and (, , )-BSSM models are recommended (Figure 4 and Table 3), because they have small MAE (1.43 to 2.11 vol.%) and RMSE values (1.83 to 2.47 vol.%) under the spread range of statistical significance (5%). Especially recommended is the σhh-BSSM model whose MAE ranges from 1.43 to 1.60 vol.% and whose RMSE ranges from 1.95 to 2.06 vol.% over the 0.1–1 spread of statistical significance (5%).
Data Availability Statement
The original contributions presented in the study are included in the article/Supplementary Material, further inquiries can be directed to the corresponding author/s.
Author Contributions
LZ and QL: conceptualization. LZ: formal analysis and methodology, software, validation, and writing—original draft. QL, LJ, and JF: funding acquisition. QL: investigation, project administration, and resources. QL and LJ: supervision. JF: visualization. LZ and LJ: writing—review and editing. All authors contributed to the article and approved the submitted version.
Funding
This work was funded by the National Science Foundation of China (No. 52069020, No. 1212011085468, No. 42002294, and No. 41972308), the Research Initiation Fund for Teacher Development from Chengdu University of Technology (No. 10912-2019KYQD07430), the State Key Research Project in 13th Five-Year (No. 51569018), the Science and Technology Major Project of Xinjiang Uygur Autonomous Region, and the China Postdoctoral Science Foundation (No. 2017M623307XB).
Conflict of Interest
The authors declare that the research was conducted in the absence of any commercial or financial relationships that could be construed as a potential conflict of interest.
Supplementary Material
The Supplementary Material for this article can be found online at: https://www.frontiersin.org/articles/10.3389/feart.2021.657206/full#supplementary-material
References
Baghdadi, N., Gaultier, S., and King, C. (2002). Retrieving surface roughness and soil moisture from synthetic aperture radar (SAR) data using neural networks. Can. J. Remote Sens. 28, 701–711. doi: 10.5589/m02-066
Balenzano, A., Mattia, F., Satalino, G., and Davidson, M. W. (2011). Dense temporal series of C- and L-band SAR data for soil moisture retrieval over agricultural crops. IEEE J. Sel. Top. Appl. Earth Obs. Remote Sens. 4, 439–450. doi: 10.1109/jstars.2010.2052916
Box, G. E. P. (1953). Non-normality and tests on variances. Biometrika. 40, 318–335. doi: 10.2307/2333350
Chang, K. T., Merghadi, A., Yunus, A. P., Pham, B. T., and Dou, J. (2019). Evaluating scale effects of topographic variables in landslide susceptibility models using GIS-based machine learning techniques. Sci. Rep. 9, 1–21. doi: 10.1038/s41598-019-48773-2
Cui, Y. K., Chen, X., Xiong, W. T., He, L., Lv, F., Fan, W. J., et al. (2020). A soil moisture spatial and temporal resolution improving algorithm based on multi-source remote sensing data and GRNN model. Remote Sens. 12:455.
Djarfour, N., Ferahtia, J., Babaia, F., Baddari, K., Said, E., and Farfour, M. (2014). Seismic noise filtering based on generalised regression neural networks. Comput. Geosci. 69, 1–9. doi: 10.1016/j.cageo.2014.04.007
Dou, J., Yamagishi, H., Pourghasemi, H. R., Yunus, A. P., Song, X., Xu, Y., et al. (2015). An integrated artificial neural network model for the landslide susceptibility assessment of Osada Island, Japan. Nat. Hazards 78: 1749–1776. doi: 10.1007/s11069-015-1799-2
Dou, J., Yunus, A. P., Merghadi, A., Merghadi, A., Shirzadi, A., Nguyen, H., et al. (2020). Different sampling strategies for predicting landslide susceptibilities are deemed less consequential with deep learning. Sci. Total. Environ. 720:137320. doi: 10.1016/j.scitotenv.2020.137320
Entekhabi, D., Reichle, R. H., Koster, R. D., and Crow, W. T. (2010). Performance metrics for soil moisture retrievals and application requirements. J. Hydrometeorol. 11, 832–840. doi: 10.1175/2010jhm1223.1
Fung, A. K., and Chen, K. S. (1994). Microwave Scattering and Emission Models and Their Applications. Norwood, MA: Artech House.
Fung, A. K., Zongqian, L., and Chen, K. S. (1992). Backscattering from a randomly rough dielectric surface. IEEE Trans. Geosci. Remote Sens. 30, 356–369. doi: 10.1109/36.134085
Hastie, T., Tibshirani, R., and Friedman, J. (2008). The Elements of Statistical Learning, 2nd Edn. Berlin: Springer.
Kornelsen, K. C., and Coulibaly, P. (2013). Advances in soil moisture retrieval from synthetic aperture radar and hydrological applications. J. Hydrol. 476, 460–489. doi: 10.1016/j.jhydrol.2012.10.044
Merghadi, A., Yunus, A. P., Dou, J., Whiteley, J., Thaipham, B., Bui, T., et al. (2020). Machine learning methods for landslide susceptibility studies: a comparative overview of algorithm performance. Earth-Science Rev. 207:103225. doi: 10.1016/j.earscirev.2020.103225
Nancy, F. G., and James, R. C. (2003). The use of geostatistics in relating soil moisture to RADARSAT-1 SAR data obtained over the Great Basin. Nevada, USA. Comput. Geosci. 29, 577–586. doi: 10.1016/s0098-3004(03)00050-5
Paloscia, S., Pampaloni, P., Pettinato, S., and Santi, E. (2008). A comparison of algorithms for retrieving soil moisture from ENVISAT/ASAR images. IEEE Trans. Geosci. Remote Sens. 46, 3274–3284. doi: 10.1109/tgrs.2008.920370
Paloscia, S., Pettinato, E. S., Notarnicola, C., Pasolli, L., and Reppucci, A. (2013). Soil moisture mapping using sentinel-1 images: algorithm and preliminary validation. Remote Sens. Environ. 134, 234–248. doi: 10.1016/j.rse.2013.02.027
Peng, J., Loew, A., Merlin, O., and Verhoest, N. E. C. (2017). A review of spatial downscaling of satellite remotely sensed soil moisture. Rev. Geophys. 55, 341–366. doi: 10.1002/2016rg000543
Rodriguez, J. D., and Perez, A. (2010). Sensitivity analysis of k-fold cross validation in prediction error estimation. IEEE Trans. Pattern Anal. Mach. Intell. 32, 569–575. doi: 10.1109/tpami.2009.187
Santi, E., Paloscia, S., Pettinato, S., and Fontanelli, G. (2016). Application of artificial ne ural networks for the soil moisture retrieval from active and passive microwave spaceborne sensors. Int. J. Appl. Earth Obs. 48, 61–73. doi: 10.1016/j.jag.2015.08.002
Specht, D. F. (1992). “Enhancements to probabilistic neural networks,” in Proceedings of the IJCNN International Joint Conference on Neural Networks,Vol 1, Baltimore, MD, 568–576
Specht, D. F., and Romsdahl, H. (1994). Experience with adaptive probabilistic Neural Networks and adaptive general regression neural networks. Proc. IEEE World Congr. Comput. Intell. 2, 1203–1208.
Ulaby, F. T., Moore, R. K., and Fung, A. K. (1982). Microwave remote Sensing Active and Passive—Volume II: Radar Remote Sensing and Surface Scattering and Emission Theory. Norwood, MA: Artech House.
Wagner, W., Bloschl, G., Pampaloni, P., Calvet, J. C., Bizzarri, B., Wigneron, J. P., et al. (2007). Operational readiness of microwave remote sensing of soil moisture for dydrologic applications. Hydrol. Res. 38, 1–20. doi: 10.2166/nh.2007.029
Wagner, W., Noll, J., Borgeaud, M., and Rott, H. (1999). Monitoring soil moisture over the Canadian Prairies with the ERS scatterometer. IEEE Trans. Geosci. Remote Sens. 37, 206–216. doi: 10.1109/36.739155
Weimann, A. (1998). “Inverting a microwave backscattering model by the use of a neural network for the estimation of soil moisture,” in Proceedings of the Sensing and Managing the Environment. 1998 IEEE International Geoscience and Remote Sensing. IGARSS’98, Vol. 4, Seattle, WA,Google Scholar
Wu, T. D., Chen, K. S., Shi, J., and Fung, A. K. (2001). A transition model for the reflection coefficient in surface scattering. IEEE Trans. Geosci. Remote Sens. 39, 2040–2050. doi: 10.1109/36.951094
Yuan, Q. Q., Xu, H. Z., Li, T. W., Shen, H. F., and Zhang, L. P. (2020). Estimating surface soil moisture from satellite observations using a generalized regression neural network trained on sparse ground-based measurements in the continental U.S. J. Hydrol. 580:124351. doi: 10.1016/j.jhydrol.2019.124351
Zeng, L., Shi, Q. Y., Guo, K., Xie, S. Y., and Herrin, J. S. (2020). A three-variables cokriging method to estimate bare-surface soil moisture using multi-temporal, VV-polarization synthetic-aperture radar data. Hydrogeol. J. 28, 2129–2139. doi: 10.1007/s10040-020-02177-z
Zhong, M., Goggeshall, D., Ghaneie, E., Pope, T., Rivera, M., Georgiopoulos, M., et al. (2007). Gap-based estimation: choosing the smoothing parameters for probabilistic and general regression neural networks. Neural Comput. 19, 2840–2864. doi: 10.1162/neco.2007.19.10.2840
Zhu, L., Walker, J. P., Ye, N., and Rudiger, C. (2019). Roughness and vegetation change detection: A pre-processing for soil moisture retrieval from multi-temporal SAR imagery. Remote Sens. Environ. 225, 93–106. doi: 10.1016/j.rse.2019.02.027
Keywords: soil moisture, surface roughness, generalized regression neural network, SAR backscatter, high-dimensional analyses
Citation: Zeng L, Liu Q, Jing L, Lan L and Feng J (2021) Using Generalized Regression Neural Network to Retrieve Bare Surface Soil Moisture From Radarsat-2 Backscatter Observations, Regardless of Roughness Effect. Front. Earth Sci. 9:657206. doi: 10.3389/feart.2021.657206
Received: 22 January 2021; Accepted: 04 March 2021;
Published: 23 April 2021.
Edited by:
Jie Dou, Nagaoka University of Technology, JapanReviewed by:
Qiyu Chen, China University of Geosciences Wuhan, ChinaXiaoning Song, University of Chinese Academy of Sciences, China
Copyright © 2021 Zeng, Liu, Jing, Lan and Feng. This is an open-access article distributed under the terms of the Creative Commons Attribution License (CC BY). The use, distribution or reproduction in other forums is permitted, provided the original author(s) and the copyright owner(s) are credited and that the original publication in this journal is cited, in accordance with accepted academic practice. No use, distribution or reproduction is permitted which does not comply with these terms.
*Correspondence: Quanming Liu, bm5kbHFtQGltYXUuZWR1LmNu