 Xia Luo
 Zhongying Zhao*
- Research Institute of Petroleum Exploration and Development, PetroChina, Beijing, China
Deep insights into the movability of the retained shale oil are of great significance to shale oil. Rock and crude oil samples were collected from well J174 in the Jimsar Sag, Junggar Basin. Rock samples were subjected to different extraction followed by analysis of the component in the extracts, and measurement of porosity in conjunction with nuclear magnetic resonance and high-pressure mercury injection analysis. The results of these analyses were used to establish an experimental method for quantitative assessment of movable shale oil. The extract content of the component varied among different extraction and between mud shale and non-mud shale samples. The saturated hydrocarbon in the extracts of the mud shale was similar to those of the non-mud shale after extraction with CHCl3 alone or after sequential extraction with nC6 + CHCl3. The aromatic hydrocarbon in the extract were significantly lower for the mud shale than for the non-mud shale after extraction with nC6, but the opposite was observed after sequential extraction with nC6 + CHCl3. The contents of the non-hydrocarbon in the extract were significantly lower for the mud shale than for the non-mud shale after extraction with nC6, but the opposite was observed after extraction with CHCl3 or nC6 + CHCl3. The contents of the asphaltene in the extract were not significantly different for the mud shale and non-mud shale after extraction with nC6, but the contents were higher for the mud shale than for the non-mud shale after extraction with nC6 + CHCl3 or CHCl3. The viscosity of the crude oil was negatively correlated with the saturated hydrocarbon, was positively correlated with the aromatic hydrocarbon and non-hydrocarbon, and was not correlated with the asphaltene. For the mud shale and non-mud shale, their porosity after extraction with nC6 or CHCl3 was higher than their original porosity. Moreover, their porosity after extraction with CHCl3 was higher than after extraction with nC6. The movable oil was significantly correlated with the lithology, with sandstone allowing for a higher fluid movability than mud shale and dolomite allowing for a higher fluid movability than siliceous rocks.
Introduction
Shale oil has drawn a great deal of attention in terms of the global exploration and production of unconventional oil and gas (Goodarzi, 2020; Kim and Shin, 2020; Solarin, 2020; Kara and Isik, 2021). China’s terrestrial shale oil has a huge resource potential, and breakthroughs have been achieved in the Permian Lucaogou Formation in the Jimsar Sag, Junggar Basin, as well as in the Chang 7 Member in the Ordos Basin (Hou et al., 2020a,b, 2021; Hu et al., 2020; Ma et al., 2020; Zhao et al., 2020). However, the shale oil is only in its initial stage and is under geological conditions that are dramatically different from those of the marine shale oil in North America. Chinese shale oil is mainly distributed in Mesozoic-Cenozoic shale strata, where the lacustrine mud shale is characterized by a low thermal maturity, with Ro values primarily ranging from 0.5 to 1.2%. The high stratigraphic heterogeneity, high oil density, and low oil fluidity pose significant challenges in the exploration and production of such shale oil. Therefore, it is extremely important to obtain a comprehensive, in-depth understanding of the movability of the retained oil in shale (Liu et al., 2012; Tao et al., 2012; Li et al., 2015; Xie et al., 2015). In this study, core samples of different lithologies were collected from the different strata in well J174 in the Jimsar Sag, Junggar Basin, and then, the samples were subjected to different extraction treatments with n-hexane (nC6) and chloroform (CHCl3), followed by porosity measurements to explore how the extract composition of the component and the rock porosity vary with the extraction treatments and rock types. Moreover, the volume fraction of the movable oil in the different lithologies was addressed from different aspects via nuclear magnetic resonance (NMR) analysis and high-pressure mercury injection analysis of representative rock samples.
Samples and Methods
Rock and crude oil samples were collected from well J174 in the Jimsar Sag, Junggar Basin. The main crude oil production depths in well J174 are 3246–3285 m, at which the main lithology is characterized by the frequent interbedding of dolomitic siltstone with thin dolomitic shale. The rock samples were divided into mud shale samples and non-mud shale samples. The mud shale samples were mainly siliceous and dolomitic, while the non-mud shale samples were mainly muddy siltstone, dolomitic siltstone, and dolomite.
Rock cores were obtained through drilling, while the other samples were broken (120 mesh) for basic geological analysis (Appendix Table A1). The cores were separately subjected to single-solvent extraction with nC6, single-solvent extraction with CHCl3, and sequential extraction with nC6 + CHCl3. The porosity and permeability were measured by the helium method (Burnham, 2017; Gao and Li, 2018; Dong and Harris, 2020). The extraction steps were completed in the North China Oilfield Research Institute of the China National Petroleum Corporation (CNPC), while the rock porosity and permeability were determined in the Key Laboratory of Natural Gas Formation and Development of CNPC. The powdered samples were divided into two parts. (1) One part was extracted using only CHCl3, and the extract was subjected to component-group isolation and quantification. (2) The other part was extracted using nC6 and CHCl3 in sequence, followed by component-group isolation and quantification for each solvent extract. All of the extraction experiments were conducted at Yangtze University. Representative lithological samples were selected for thermal dissolution followed by NMR and high-pressure mercury injection analysis in the Key Laboratory of Natural Gas Formation and Development of CNPC.
Results and Discussion
Different Extraction Treatments
The powdered samples were either first extracted using nC6 and then CHCl3 or using only CHCl3. The contents of the saturated hydrocarbon, the aromatic hydrocarbon, the asphaltene, and the non-hydrocarbon in each extract were determined. The experimental results are presented in Appendix Table A2. The cores were extracted using only nC6 or only CHCl3, followed by porosity and permeability measurements. The experimental results are also presented in Appendix Table A2. Five samples (#3, #9, #15, #16, and #22) were selected for NMR analysis, of which four (#3, #9, #15, and #22) were also subjected to high-pressure mercury injection analysis. The experimental results are presented in Appendix Tables A3, A4, respectively.
Extract Contents of the Component After Extraction
Saturated Hydrocarbon
The extract contents (as a percentage of the total extracted components; the same hereafter) of the saturated hydrocarbon were similar for the mud shale samples and the non-mud shale samples after extraction with nC6. The extract contents of the saturated hydrocarbon from the samples of the oil-producing strata were similar to those of the crude oil samples (Figure 1). However, there was a significant difference in the extract contents of the saturated hydrocarbon for the two rock types after sequential extraction with nC6 and CHCl3. The mud shale samples had significantly smaller contents than the non-mud shale samples (Figure 1). For the oil-producing strata, the extract contents of the saturated hydrocarbon for the non-mud shale samples after sequential extraction with nC6 + CHCl3 were similar to those of the saturated hydrocarbon in crude oil samples, but the extract contents from the mud shale samples were significantly lower than those of the crude oil samples. The extract contents of the saturated hydrocarbon from the mud shale samples were lower than those from the non-mud shale samples after extraction with CHCl3, which is similar to the case of the sequential extraction with nC6 + CHCl3. In other words, the mud shale was similar to the non-mud shale in terms of the extract contents of the saturated hydrocarbon after single-solvent extraction with CHCl3 or after sequential extraction with nC6 + CHCl3. For the non-mud shale samples of the oil-producing strata, the extract contents of the saturated hydrocarbon were similar to those of the crude oil samples (Figure 1). However, the extract contents of the saturated hydrocarbon from the mud shale samples decreased in the order of single-solvent extraction with nC6, single-solvent extraction with CHCl3, and sequential extraction with nC6 and CHCl3. That is, the extract content gradually shifts toward the left along the abscissa in Figure 1 when samples from the same sampling depth were separately subjected to the above-mentioned extraction treatments. This indicates that the extract contents of the saturated hydrocarbon from the mud shale samples are greatly dependent on the polarity of the organic solvent, with a higher polarity leading to a weaker extraction and thus a lower extract content. However, this pattern was not obvious for the non-mud shale samples.
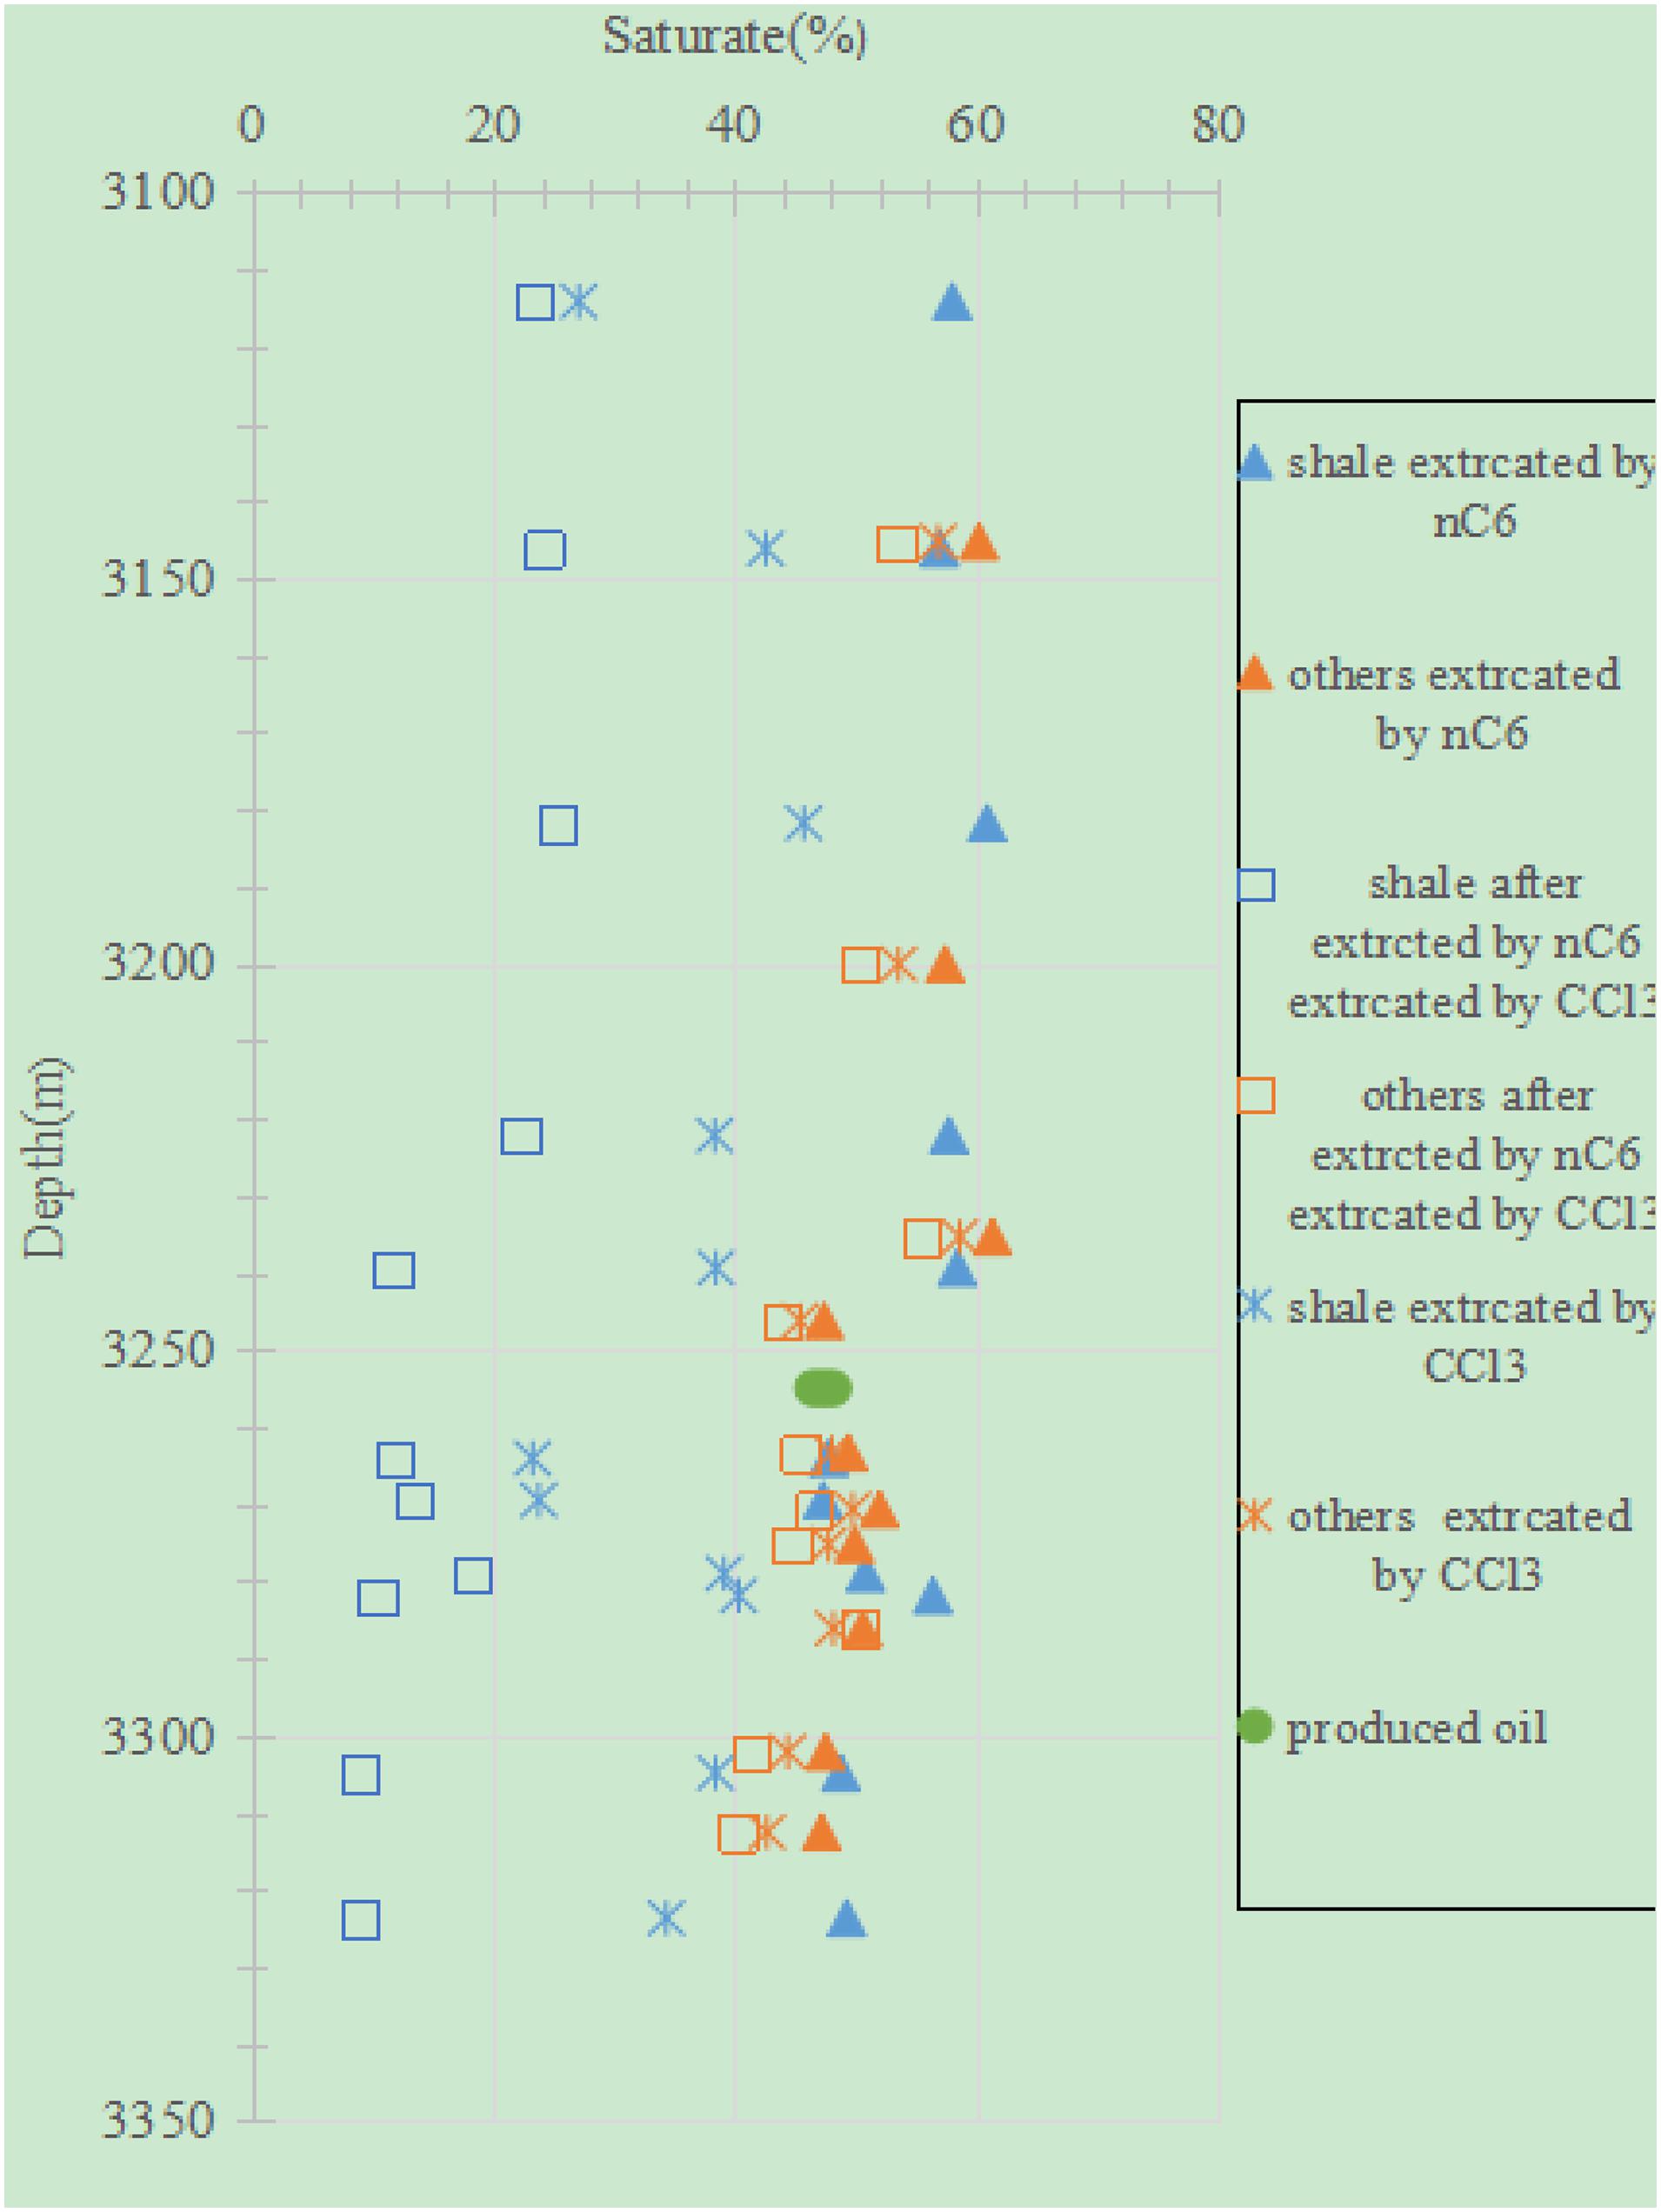
Figure 1. Depth profile of the extract contents of the saturated hydrocarbon from the mud shale versus the non-mud shale after the different extraction treatments.
Moreover, the higher the saturated hydrocarbon content, the lower the viscosity is (Figure 2), exhibiting an obvious negative correlation with a correlation coefficient R2 of 0.86. Studies have shown that for crude oil, the higher the content of the saturated hydrocarbon, the lower the viscosity, and the easier it is to extract it from underground reservoirs (Boak and Kleinberg, 2020; Zhang et al., 2021).
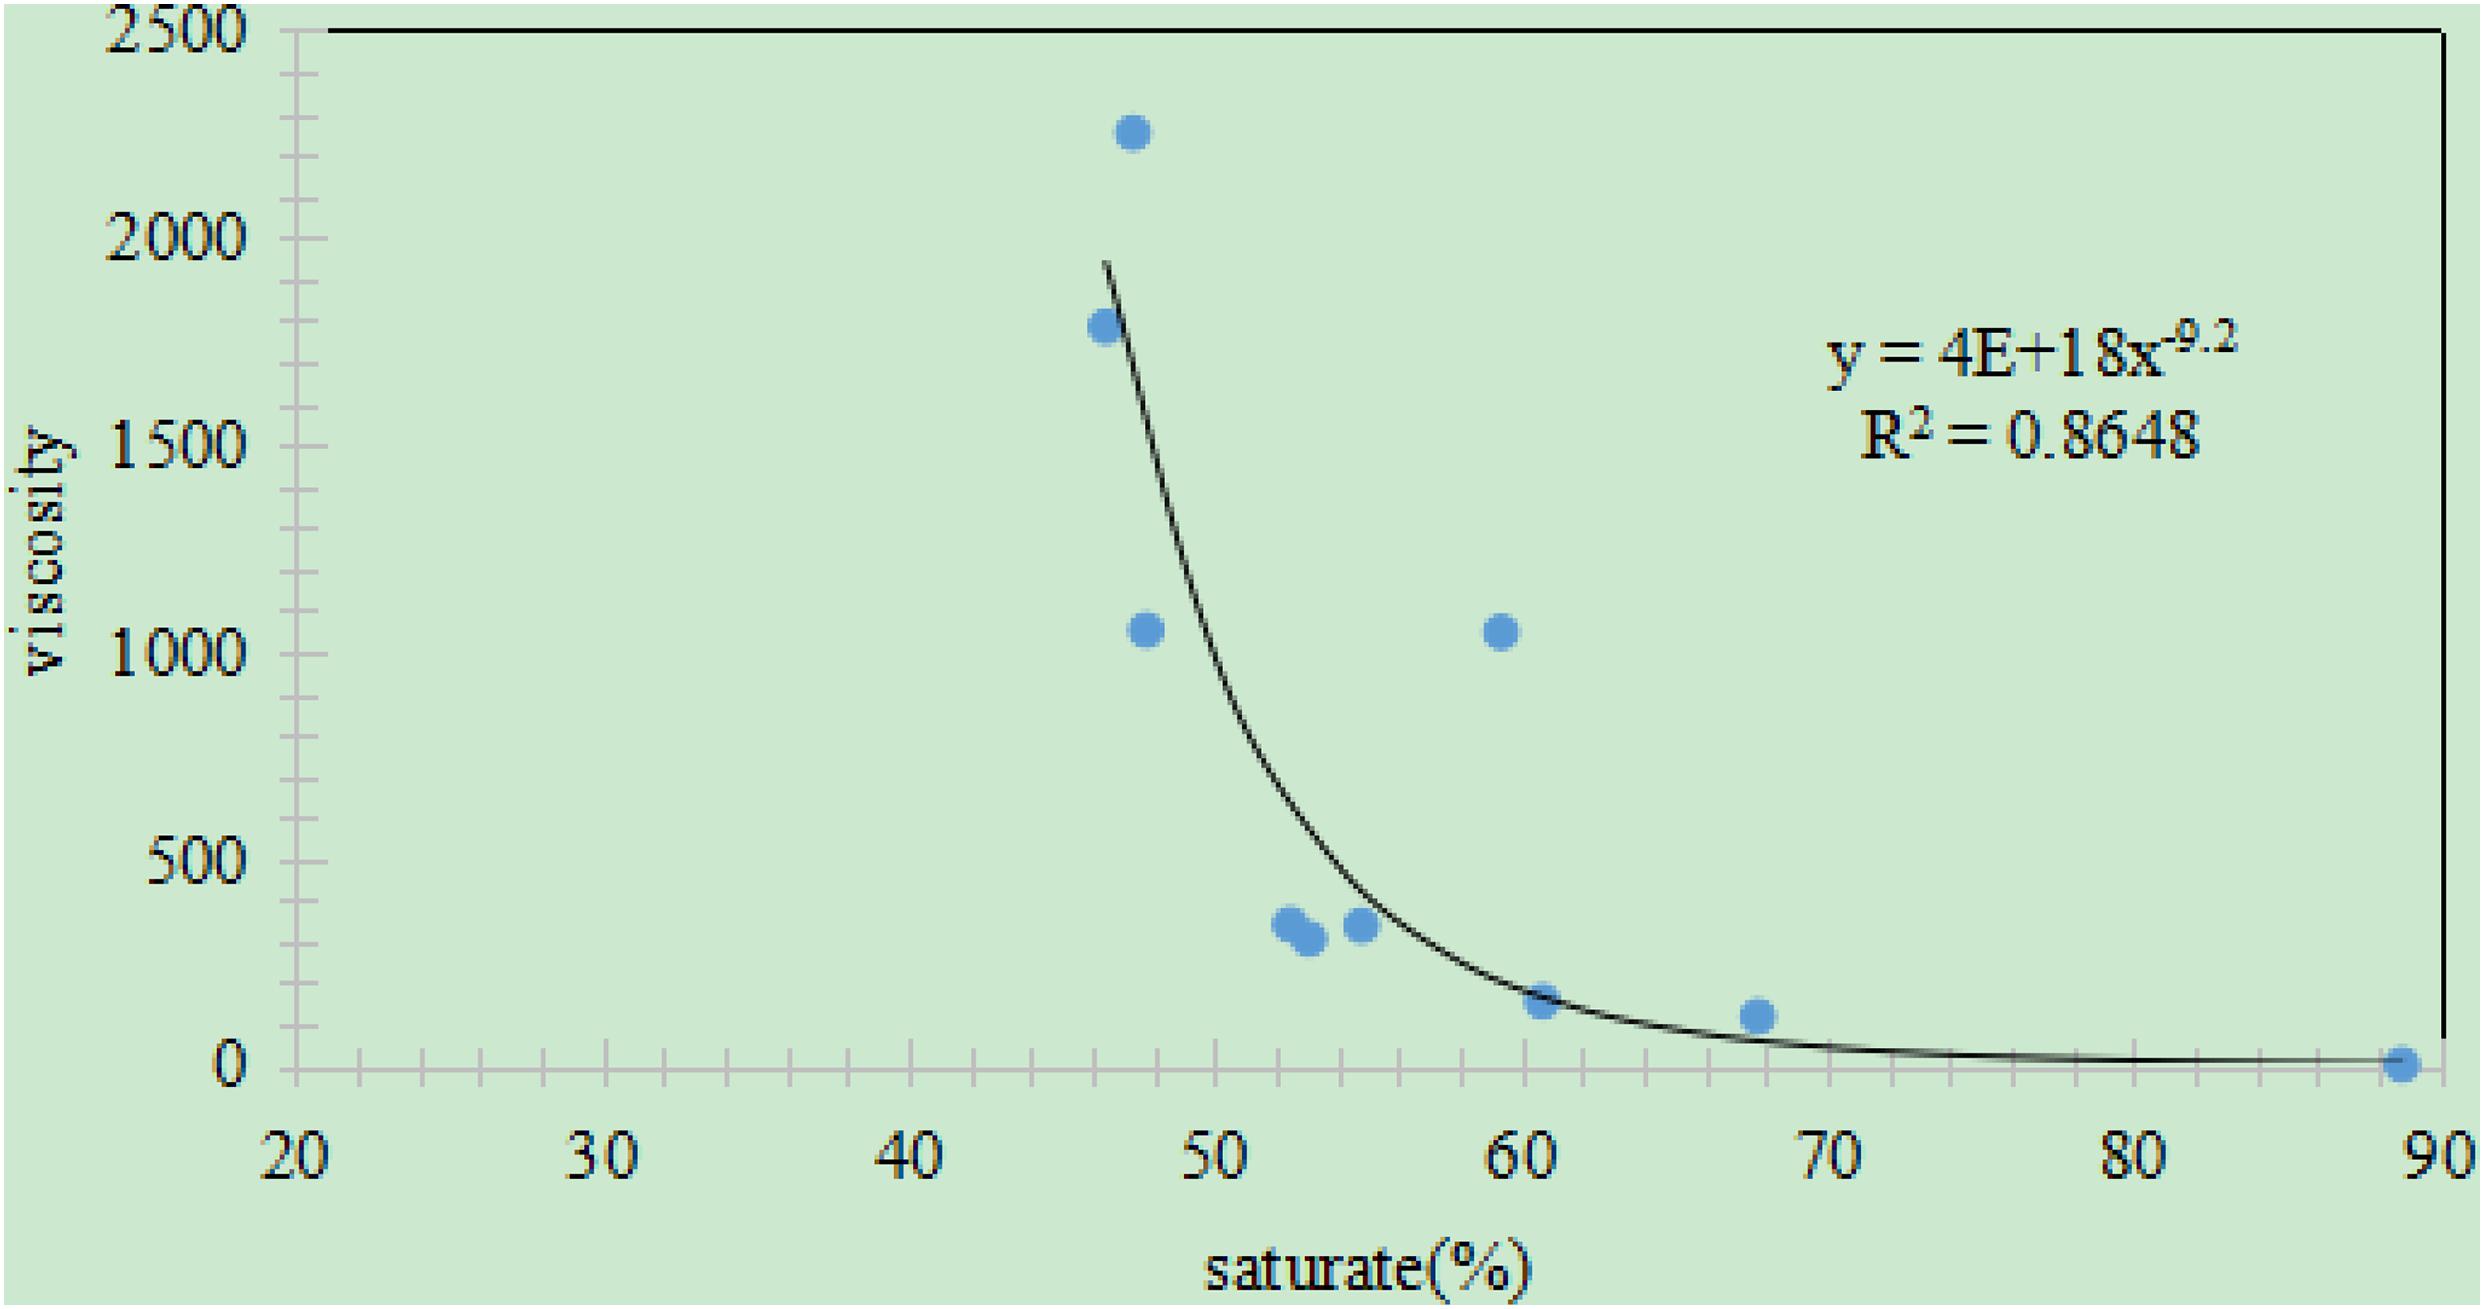
Figure 2. Relationship between the content of the saturated hydrocarbon and the viscosity (20°C) for the crude oil extracted from the Jimsar Sag.
Aromatic Hydrocarbon
The extract contents of the aromatic hydrocarbon from the mud shale samples after extraction with nC6 were significantly lower than those from the non-mud shale samples (Figure 3). Moreover, the extract contents from the non-mud shale samples of the oil-producing strata were similar to those of the crude oil samples, but the extract contents from the mud shale samples from the same strata were obviously higher. However, the opposite patterns were observed for the case of the sequential extraction with nC6 + CHCl3. (1) The extract contents of the aromatic hydrocarbon from the mud shale samples after sequential extraction with nC6 + CHCl3 were significantly higher than those of from the non-mud shale samples (Figure 3). (2) For the oil-producing strata, the extract contents from the non-mud shale samples were lower than those of the crude oil samples, but the extract contents from the mud shale samples were significantly higher. For extraction with CHCl3, the extract contents of the aromatic hydrocarbon from the mud shale samples versus the non-mud shale samples did not exhibit a clear trend, which is consistent with the results of other studies (Chishti and Williams, 1999; Jefimova et al., 2014; Fang et al., 2019).
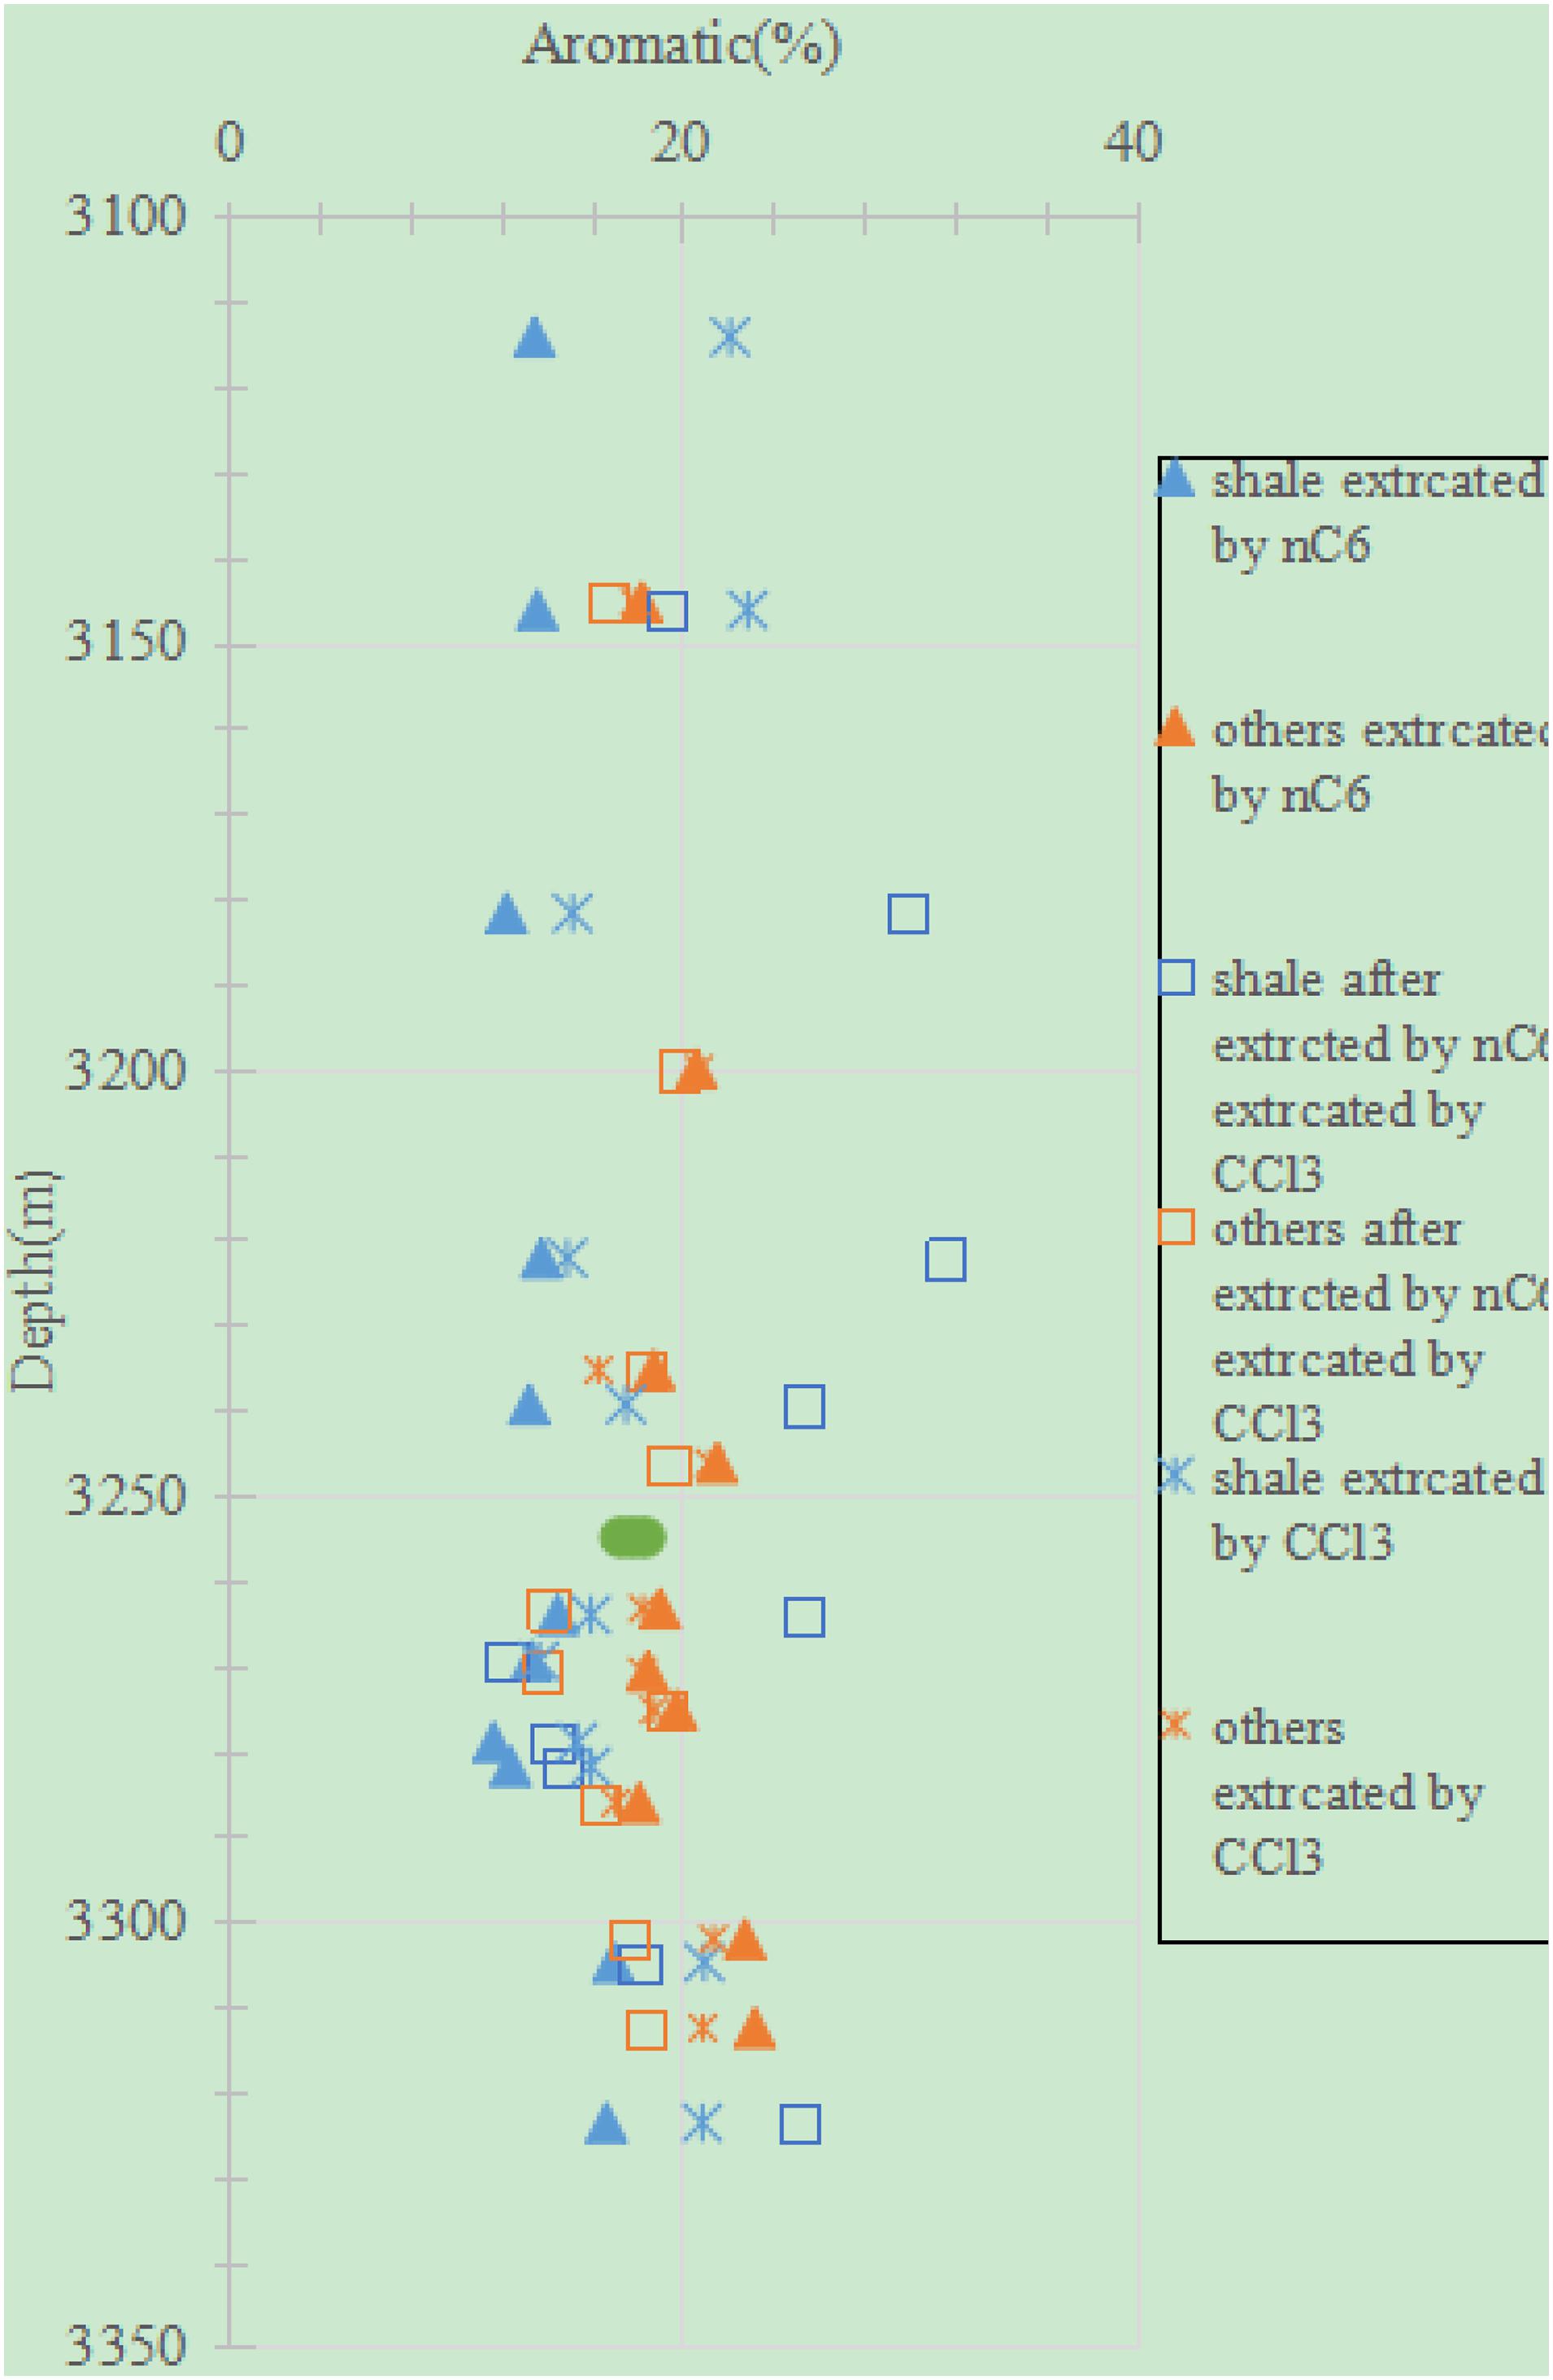
Figure 3. Depth profile of the extract contents of the aromatic hydrocarbon from the mud shale versus the non-mud shale after different extraction treatments.
For the mud shale, the extract contents of the aromatic hydrocarbon decreased in the order of nC6 + CHCl3, CHCl3, and nC6. This indicates that the aromatic hydrocarbon in the shale oil can be extracted by chloroform and n-hexane. For the non-mud shale, the extract contents obtained using the three extraction treatments did not vary significantly.
Moreover, the higher the aromatic content, the higher the viscosity of the crude oil, exhibiting an obvious positive correlation with an R2 of 0.71 (Figure 4). For the crude oil, the higher the content of the aromatic hydrocarbon, the heavier the oil (i.e., the higher the viscosity), and the harder it is to extract it from underground reservoirs (Chen et al., 2010; Yu et al., 2018; Aily et al., 2019).
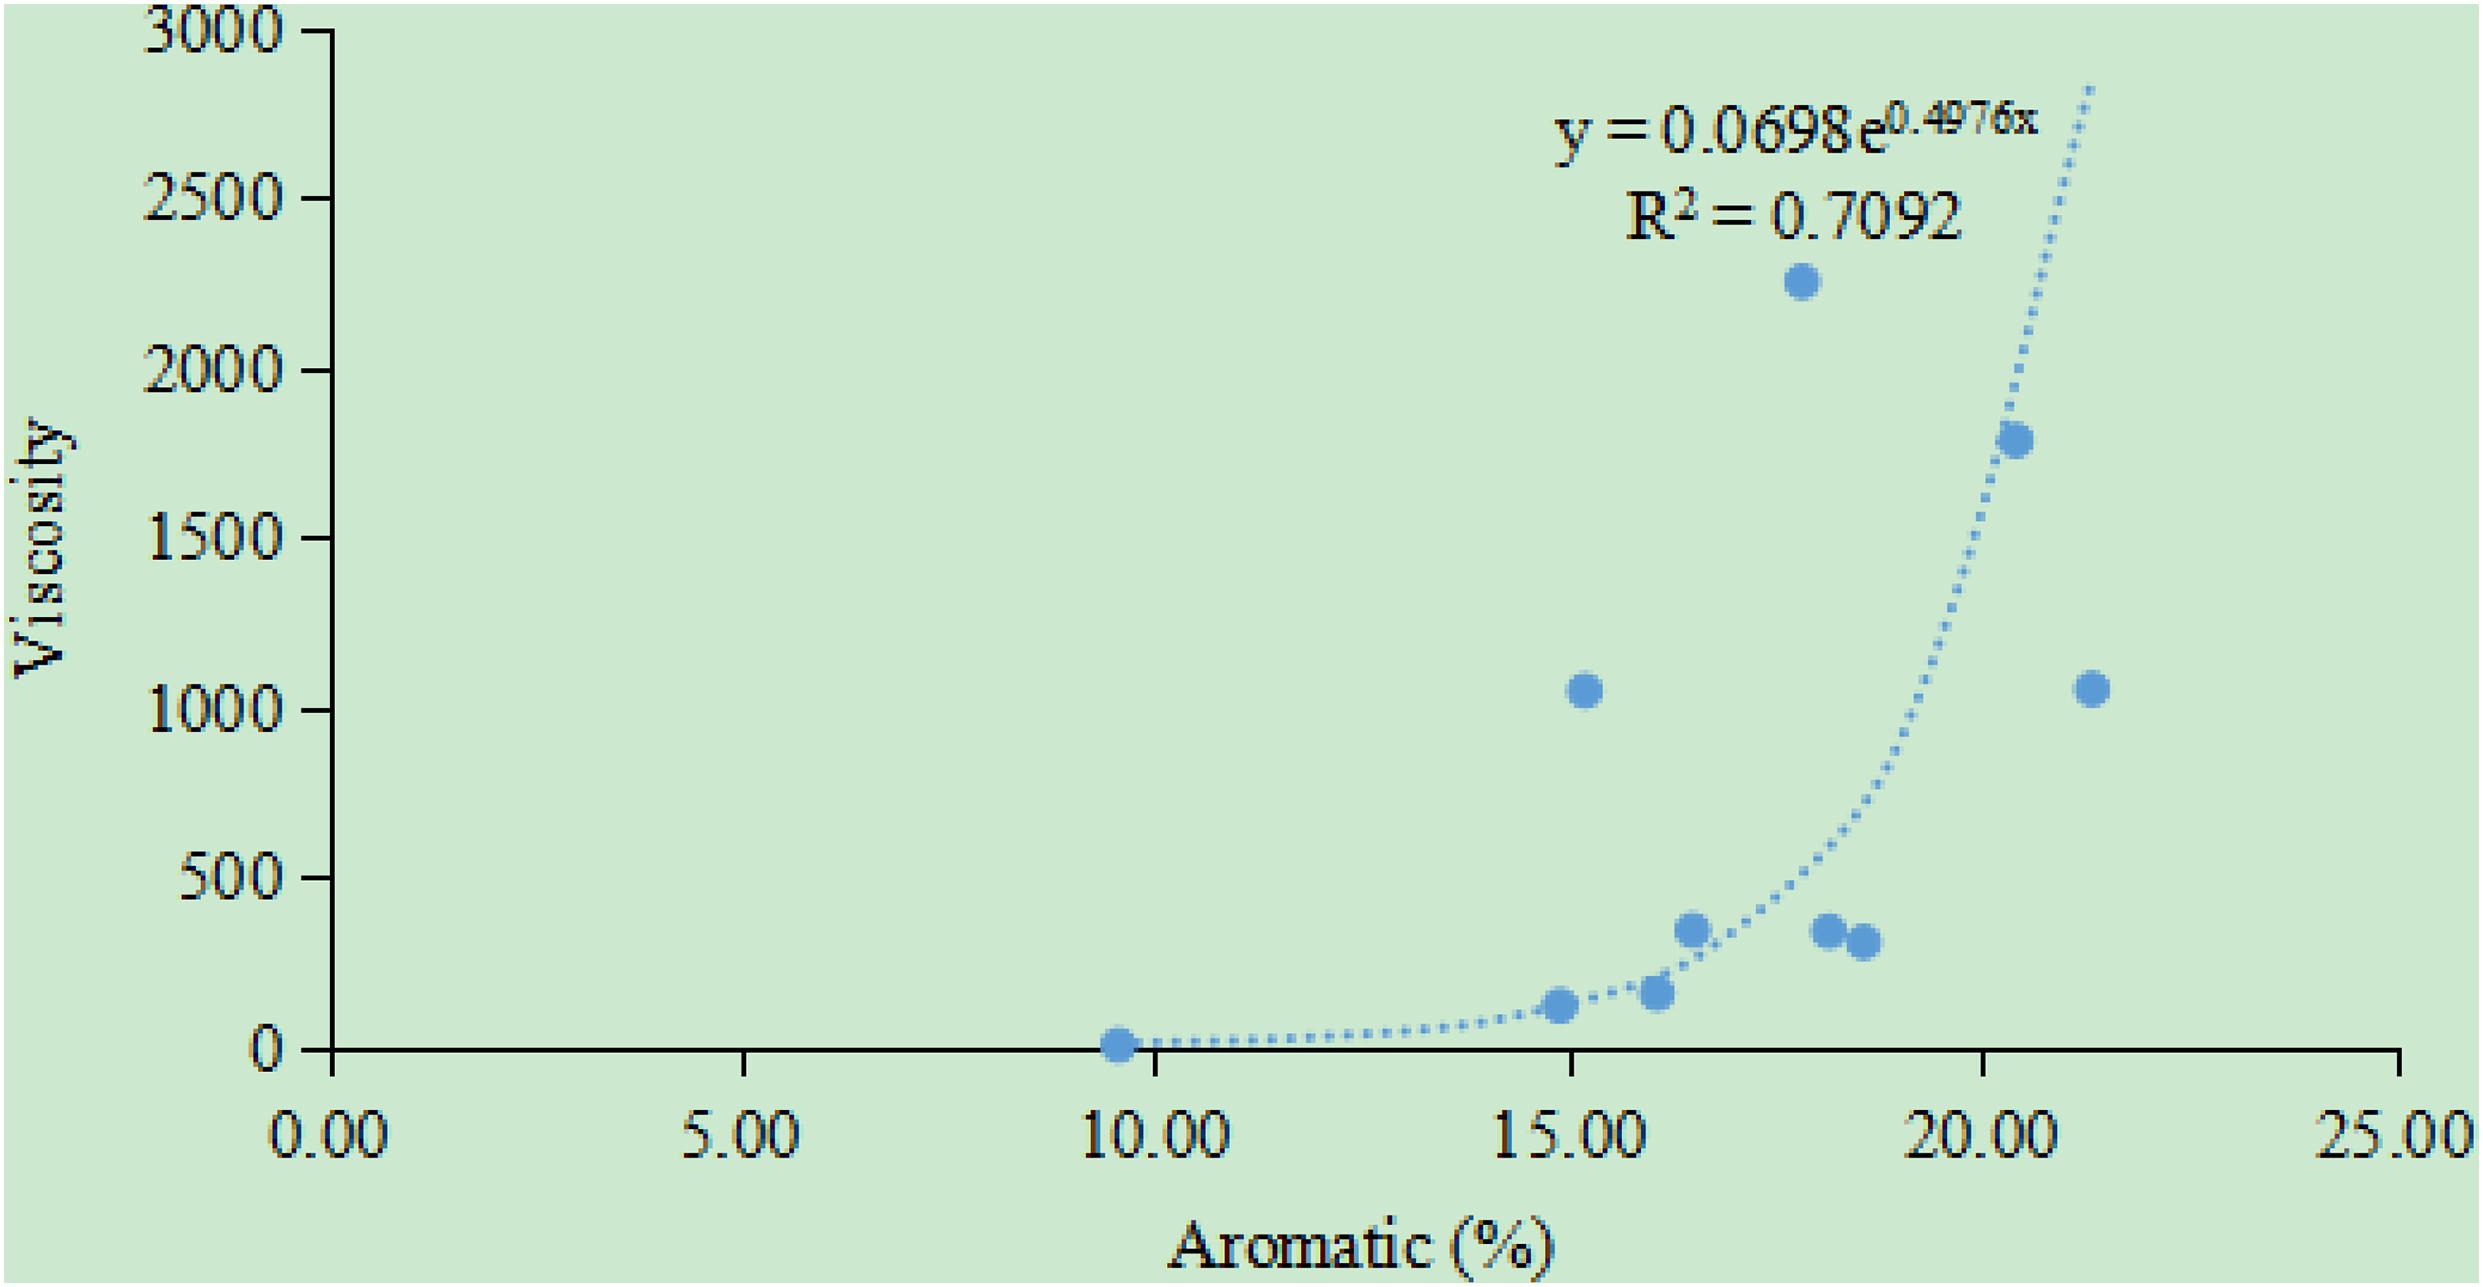
Figure 4. Relationship between the content of the aromatic hydrocarbon and the viscosity (20°C) for crude oil extracted from the Jimsar Sag (the crude oil data were provided by the Xinjiang Oilfield Company of CNPC).
Non-hydrocarbon
For the non-hydrocarbon, its extract contents after extraction with nC6 were significantly lower for the mud shale samples than for the non-mud shale samples (Figure 5). But the opposite was observed for the case of sequential extraction with nC6 + CHCl3. The extract contents of the non-hydrocarbon from the mud shale samples were higher than those from the non-mud shale samples. This pattern was also similarly observed for the case of extraction with CHCl3. As is shown above, the extract contents of the non-hydrocarbon after extraction with CHCl3 or nC6 + CHCl3 were higher for the mud shale samples than for the non-mud shale samples.
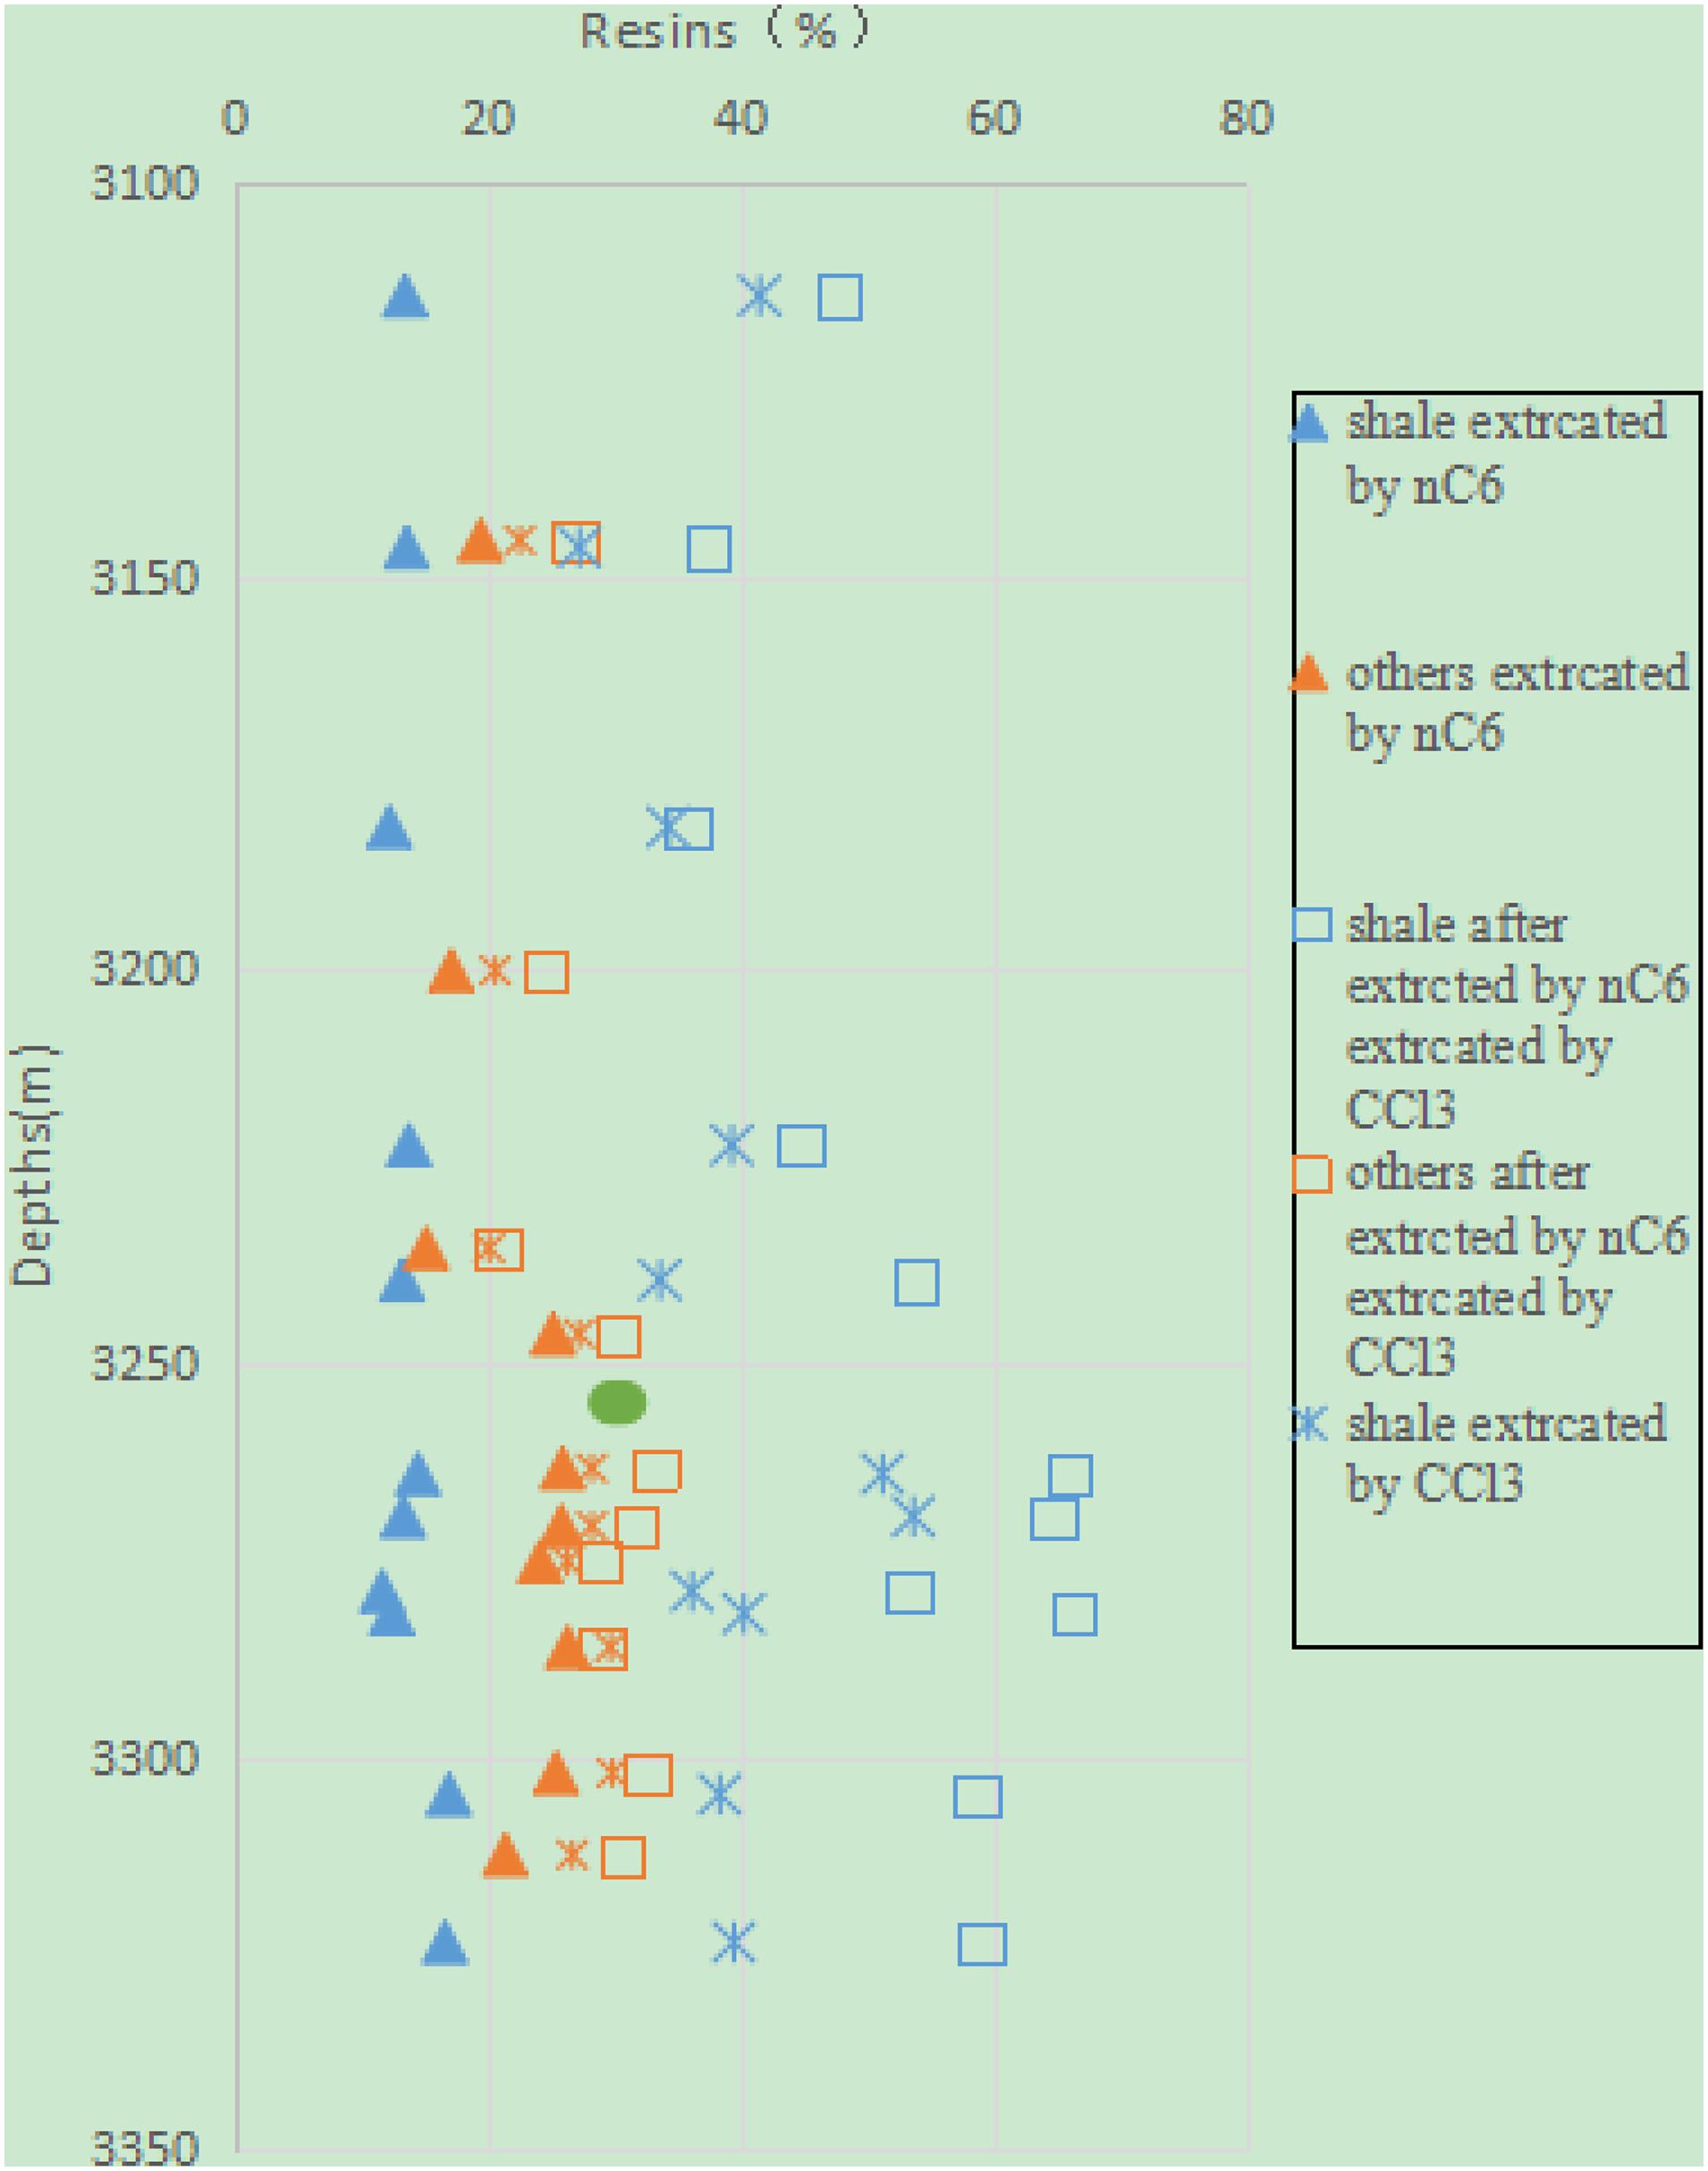
Figure 5. Depth profile of the extract contents of the non-hydrocarbon from the mud shale versus the non-mud shale after different extraction treatments.
For a given sample, the extract contents decreased in the order of nC6 + CHCl3, CHCl3, and nC6. This suggests that the more polar the solvent, the higher the content of the extracted non-hydrocarbon.
Moreover, the higher the non-hydrocarbon content, the higher the viscosity of the crude oil, exhibiting an obvious positive correlation with an R2 of 0.96 (Figure 6). This suggests that for crude oil, the higher the non-hydrocarbon content, the heavier the oil (i.e., the higher the viscosity), and the harder it is to extract in from underground reservoirs.
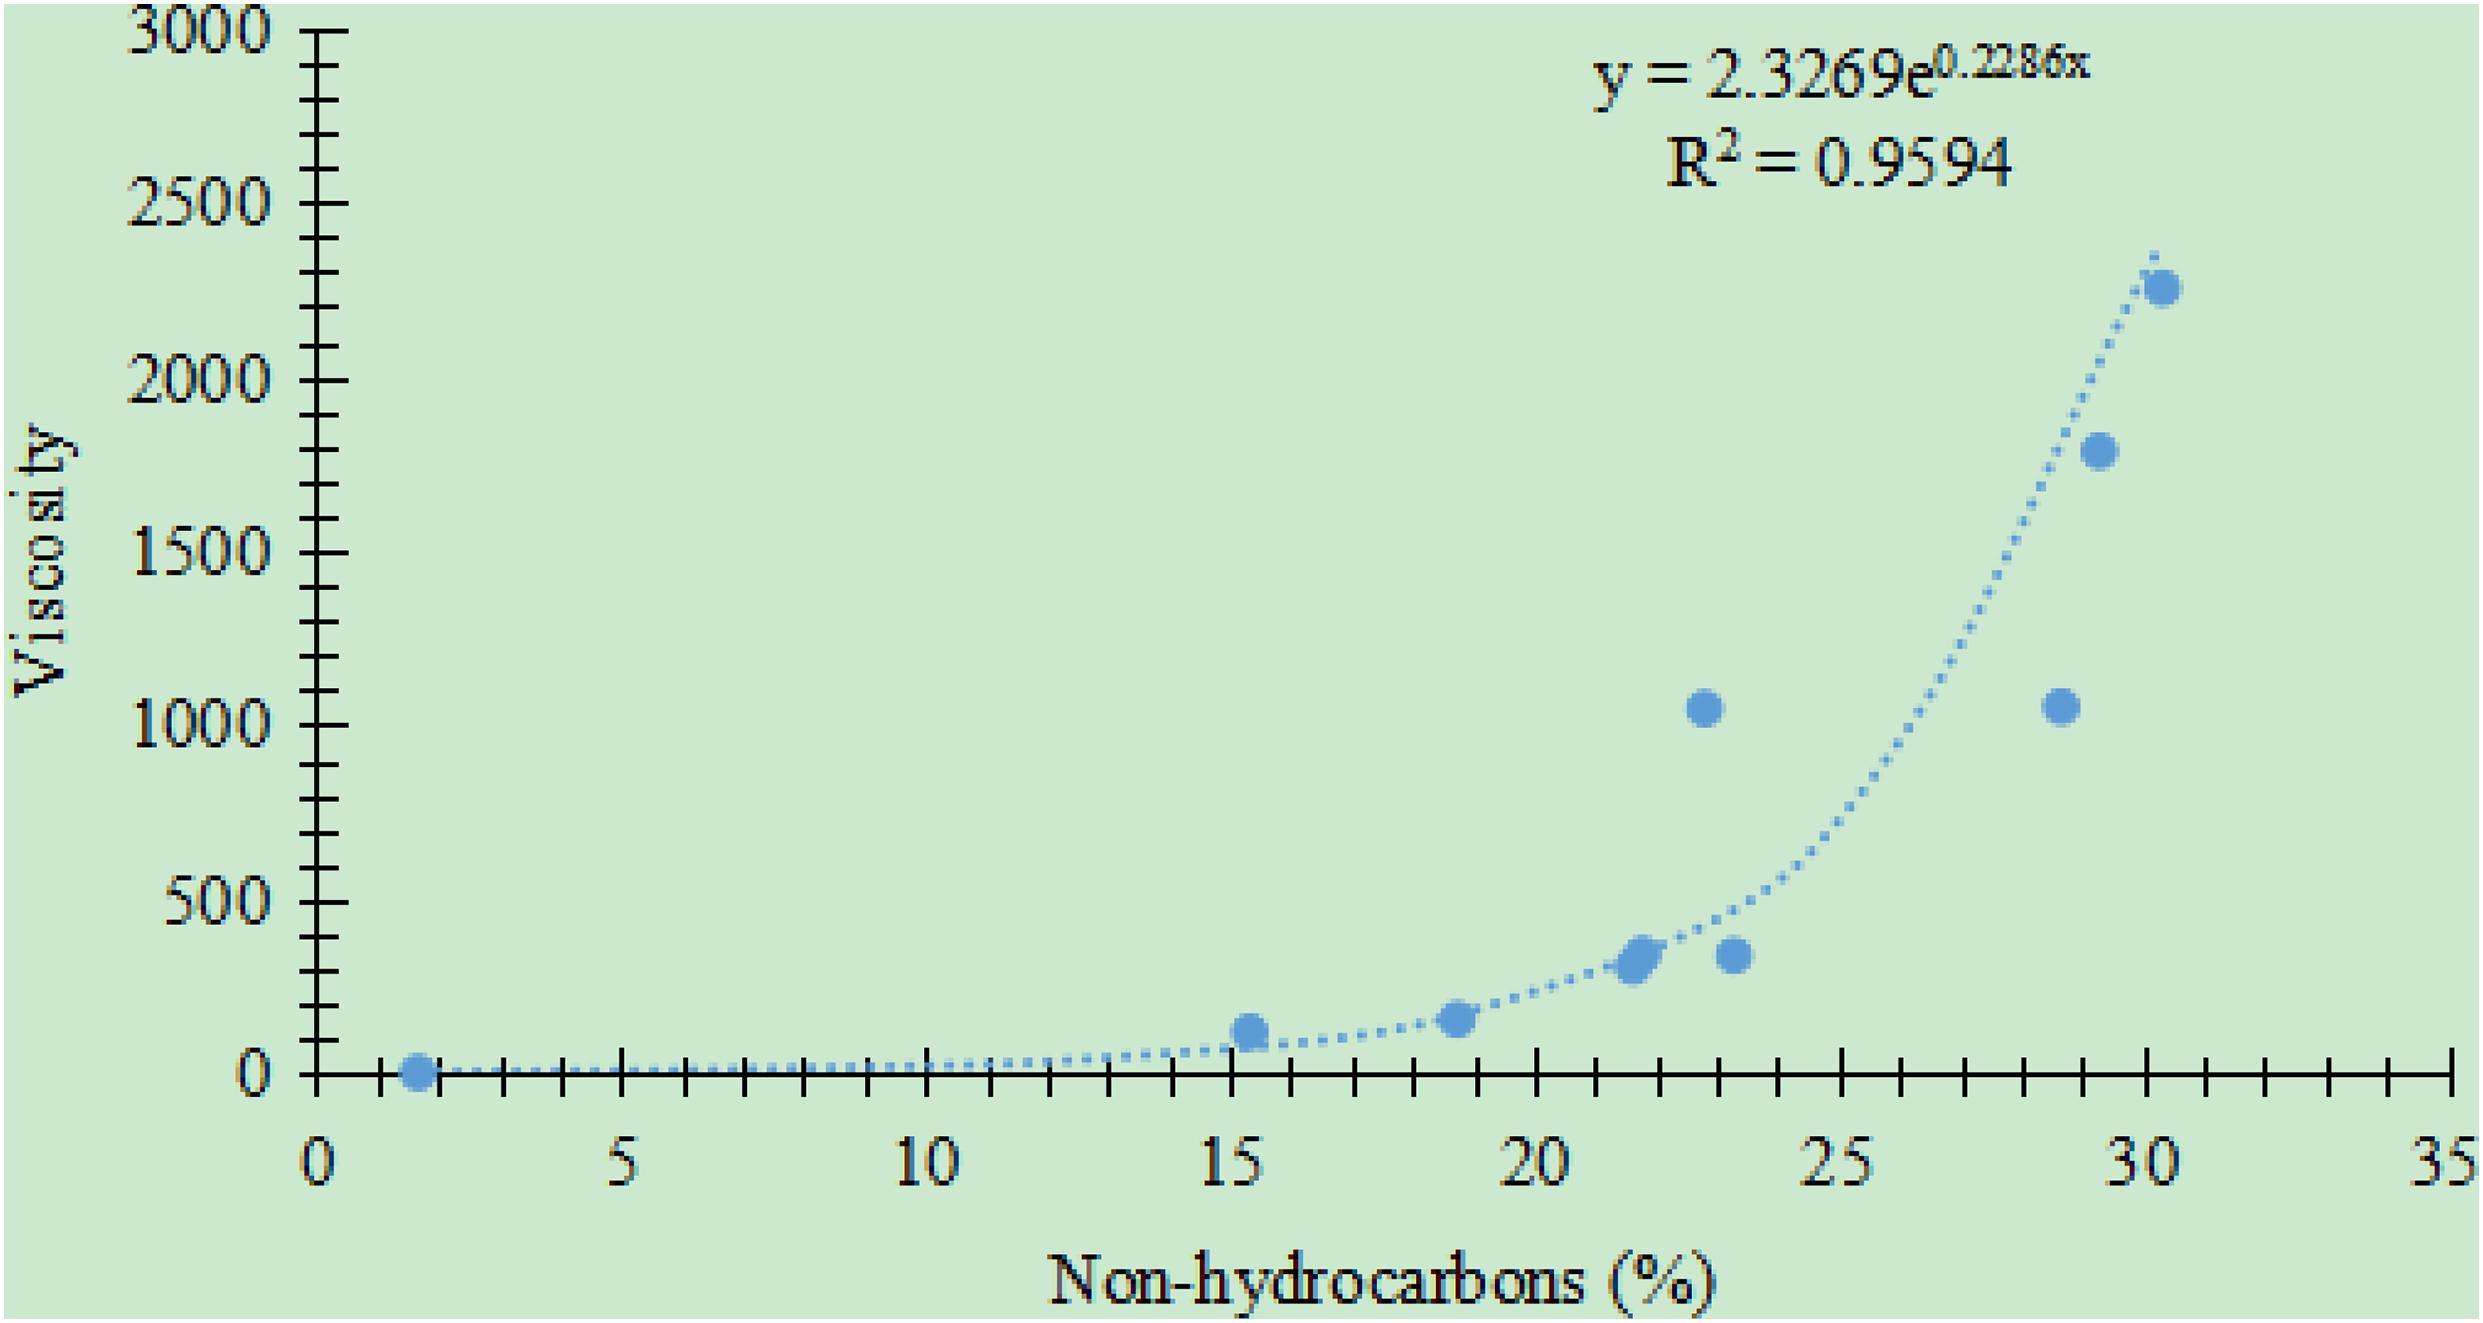
Figure 6. Relationship between the content of the non-hydrocarbon and the viscosity (20°C) for crude oil extracted from the Jimsar Sag (the crude oil data were provided by the Xinjiang Oilfield Company of CNPC).
Asphaltene
For extraction with nC6, the extract contents of the asphaltene from the mud shale samples versus the non-mud shale samples do not exhibit a clear trend. For extraction with nC6 + CHCl3, the extract contents were significantly higher for the mud shale samples than for the non-mud shale samples. For extraction with CHCl3, the extract contents were generally higher for the mud shale samples than for the non-mud shale samples (Figure 7).
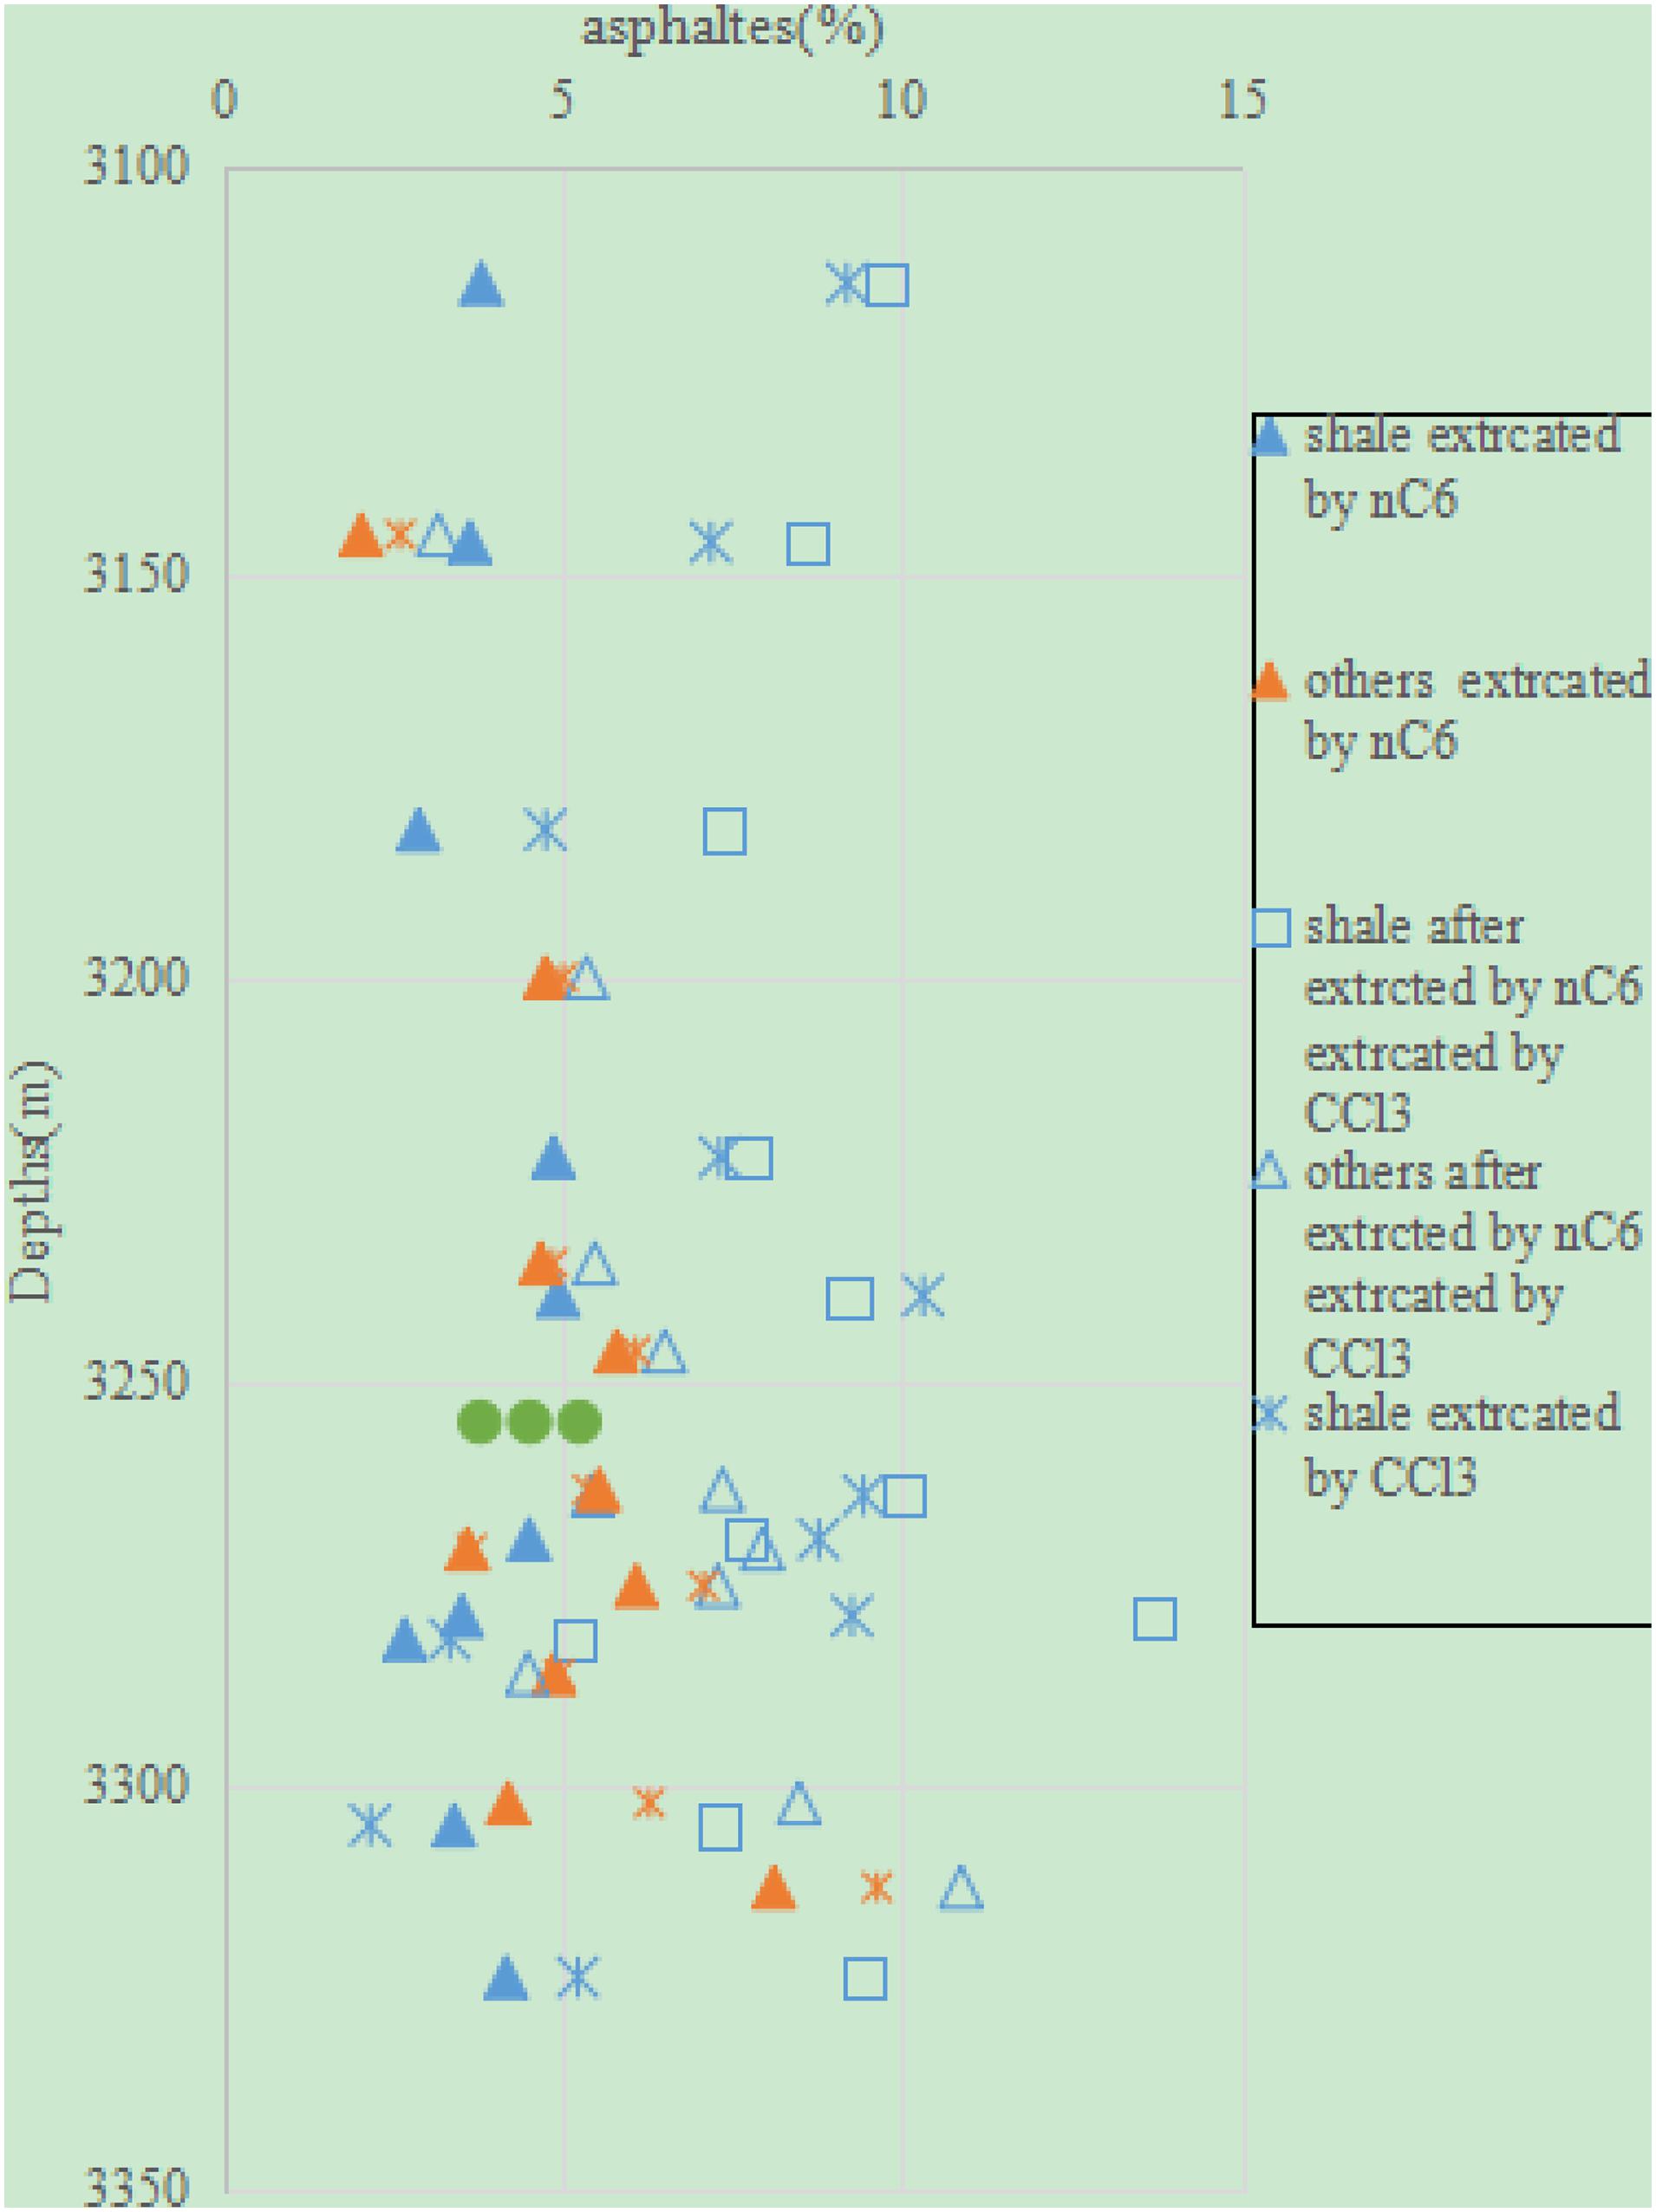
Figure 7. Depth profile of the extract contents of the asphaltene from the mud shale versus the non-mud shale samples after different extraction treatments.
For the mud shale samples, the extract contents of the asphaltene decreased in the order of nC6 + CHCl3, CHCl3, and nC6. This suggests that the higher the polarity of the organic solvent (nC6 + CHCl3), the higher the content of the extracted asphaltene. The lower the polarity of the organic solvent (nC6), the smaller the content of the extracted asphaltene is. This pattern was also observed for the non-mud shale samples.
Moreover, there was no obvious correlation between the viscosity of the crude oil and the content of the asphaltene (Figure 8). The content of the asphaltene did not affect the viscosity of the crude oil.
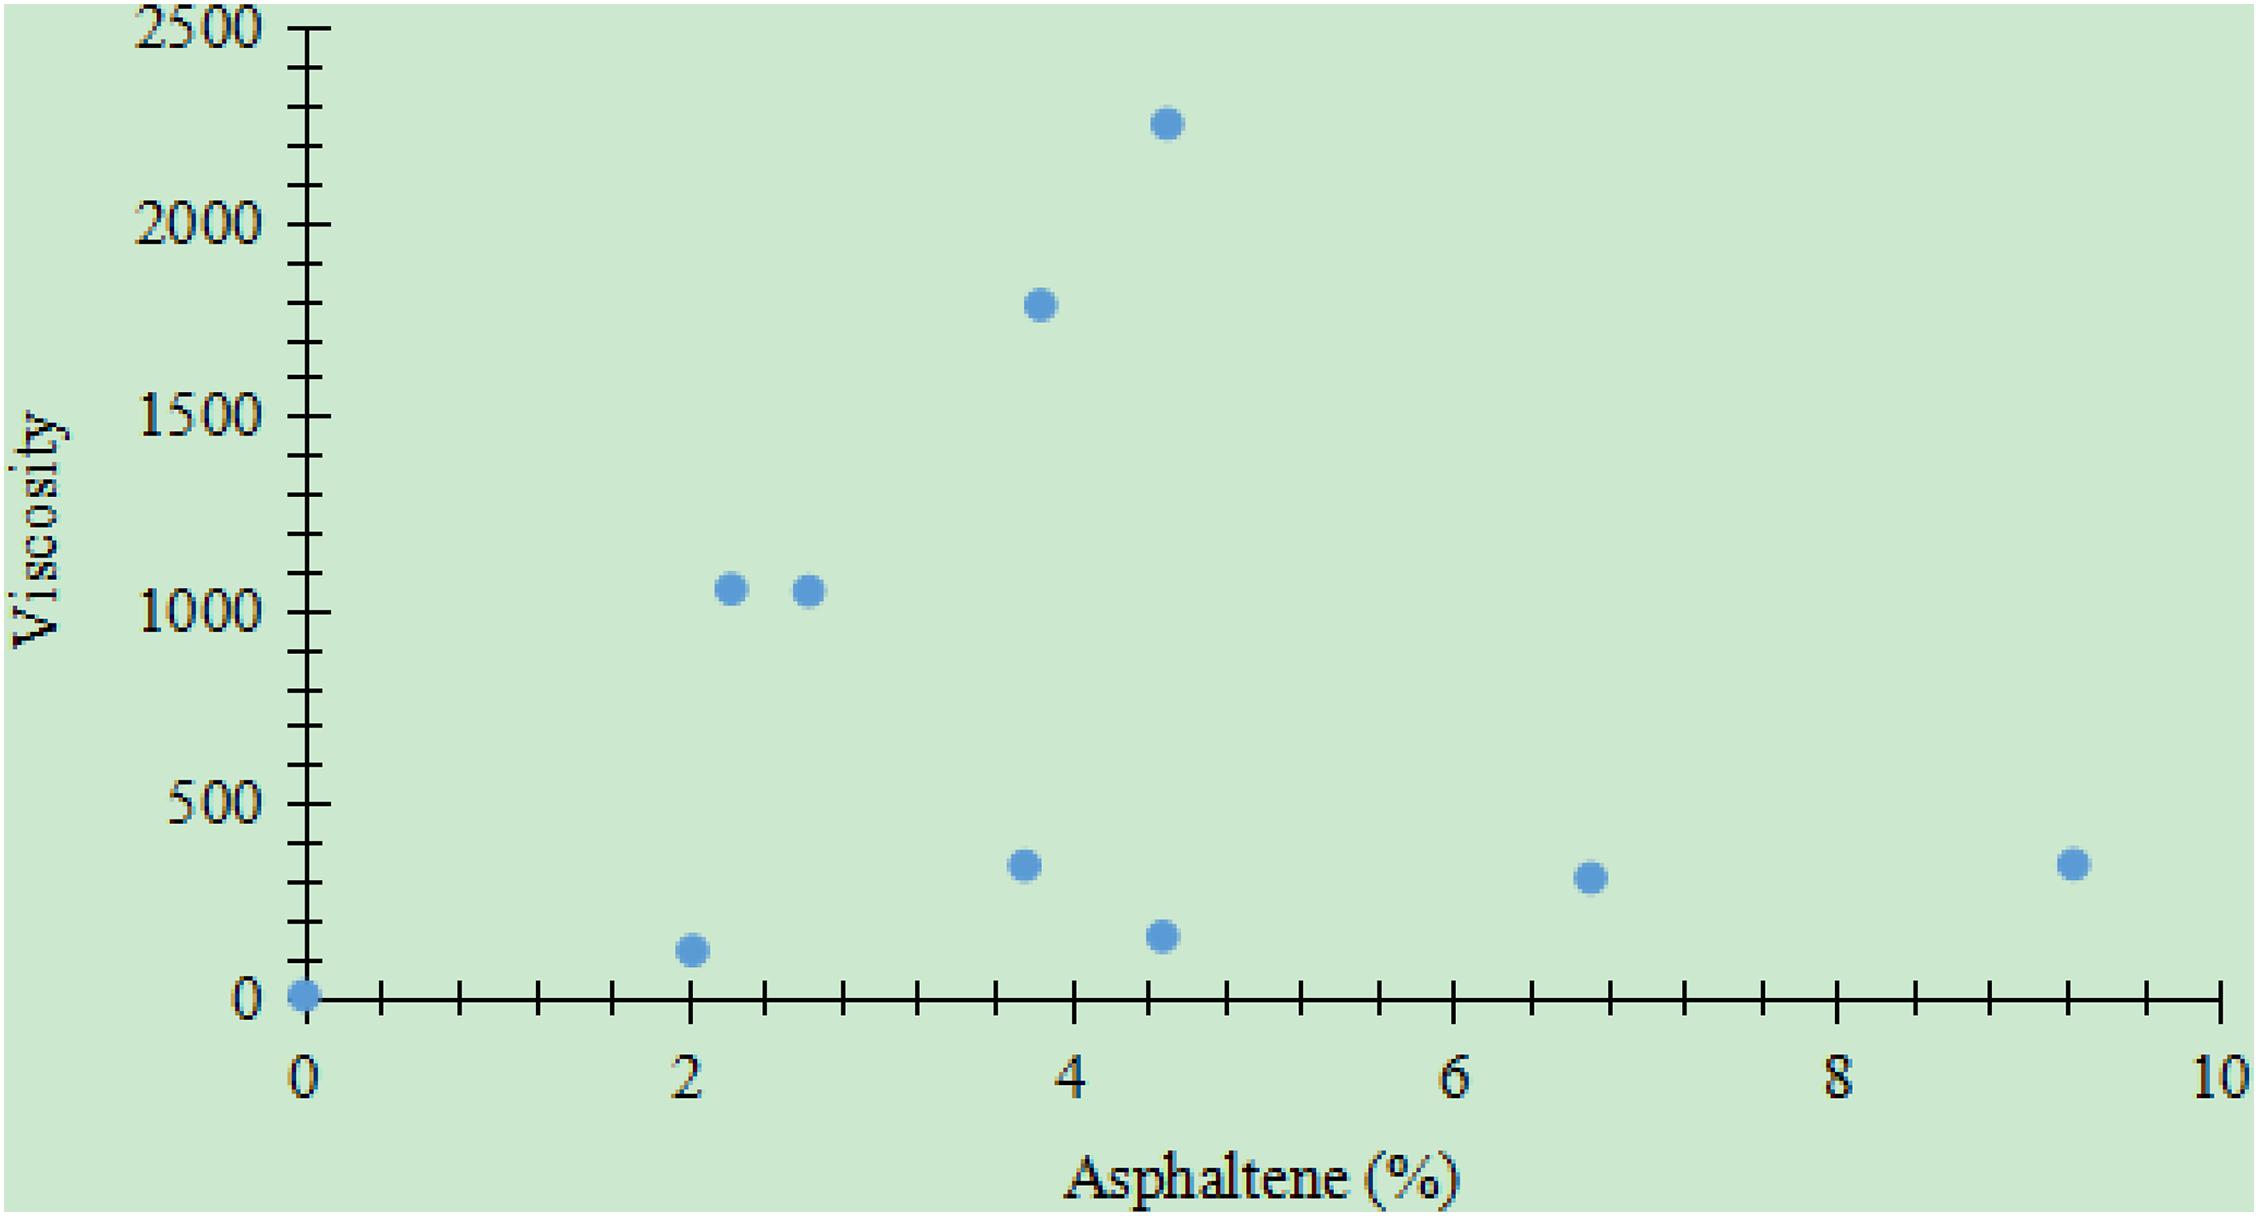
Figure 8. Relationship between the content of the asphaltene and the viscosity (20°C) for crude oil extracted from the Jimsar Sag (the crude oil data were provided by the Xinjiang Oilfield Company of CNPC).
Porosity After the Different Extraction Treatments
The original porosity of the non-mud shale samples were generally slightly higher than those of the mud shale samples. After single-solvent extraction with nC6 or CHCl3, the porosity of the non-mud shale was still higher than those of the mud shale (Figure 9). For the mud shale and non-mud shale samples, the porosity after extraction with nC6 or CHCl3 was higher than the original porosity. In particular, the porosity after extraction with CHCl3 were higher than those after extraction with nC6, and both values were higher than the original porosity. This shows that extraction with organic solvents increases the porosity of mud shale and non-mud shale. The higher the polarity, the larger the increase is. After sequential extraction with nC6 + CHCl3, the increase was more obvious for the non-mud shale samples than for the mud shale samples (Figure 10).
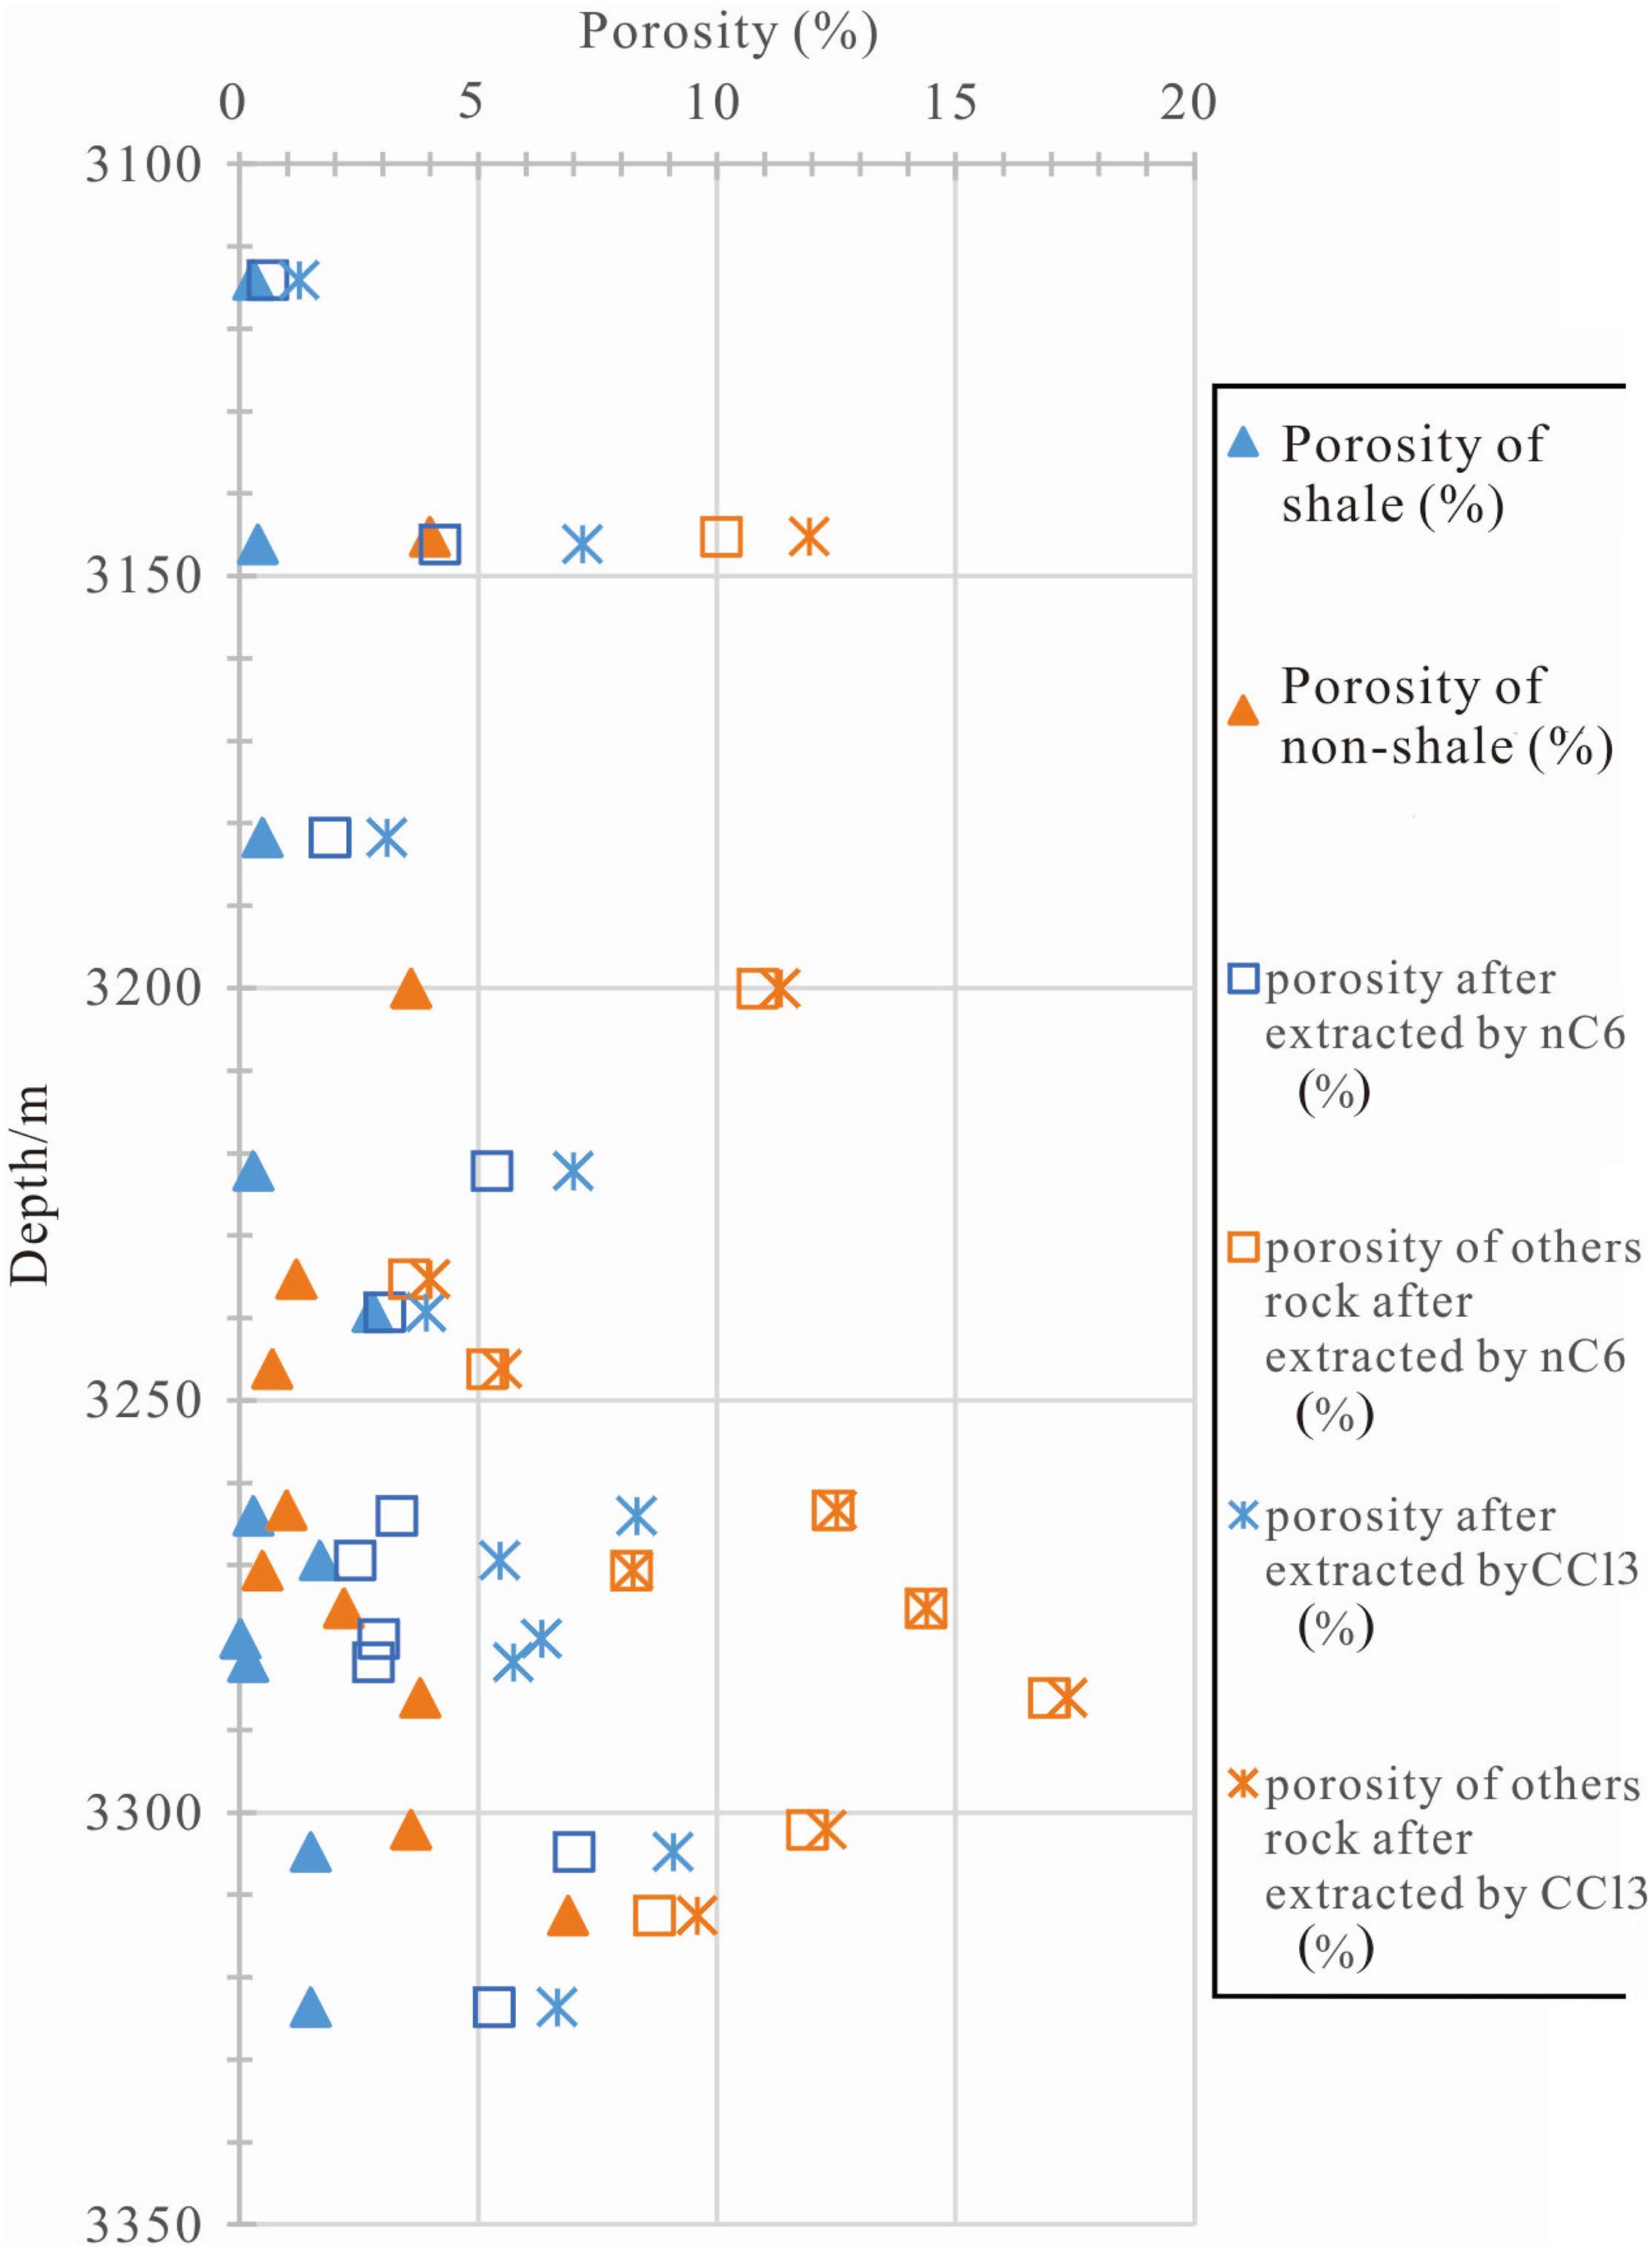
Figure 9. Porosity of the mud shale samples versus the non-mud shale after extraction with nC6 alone or with CHCl3 alone.
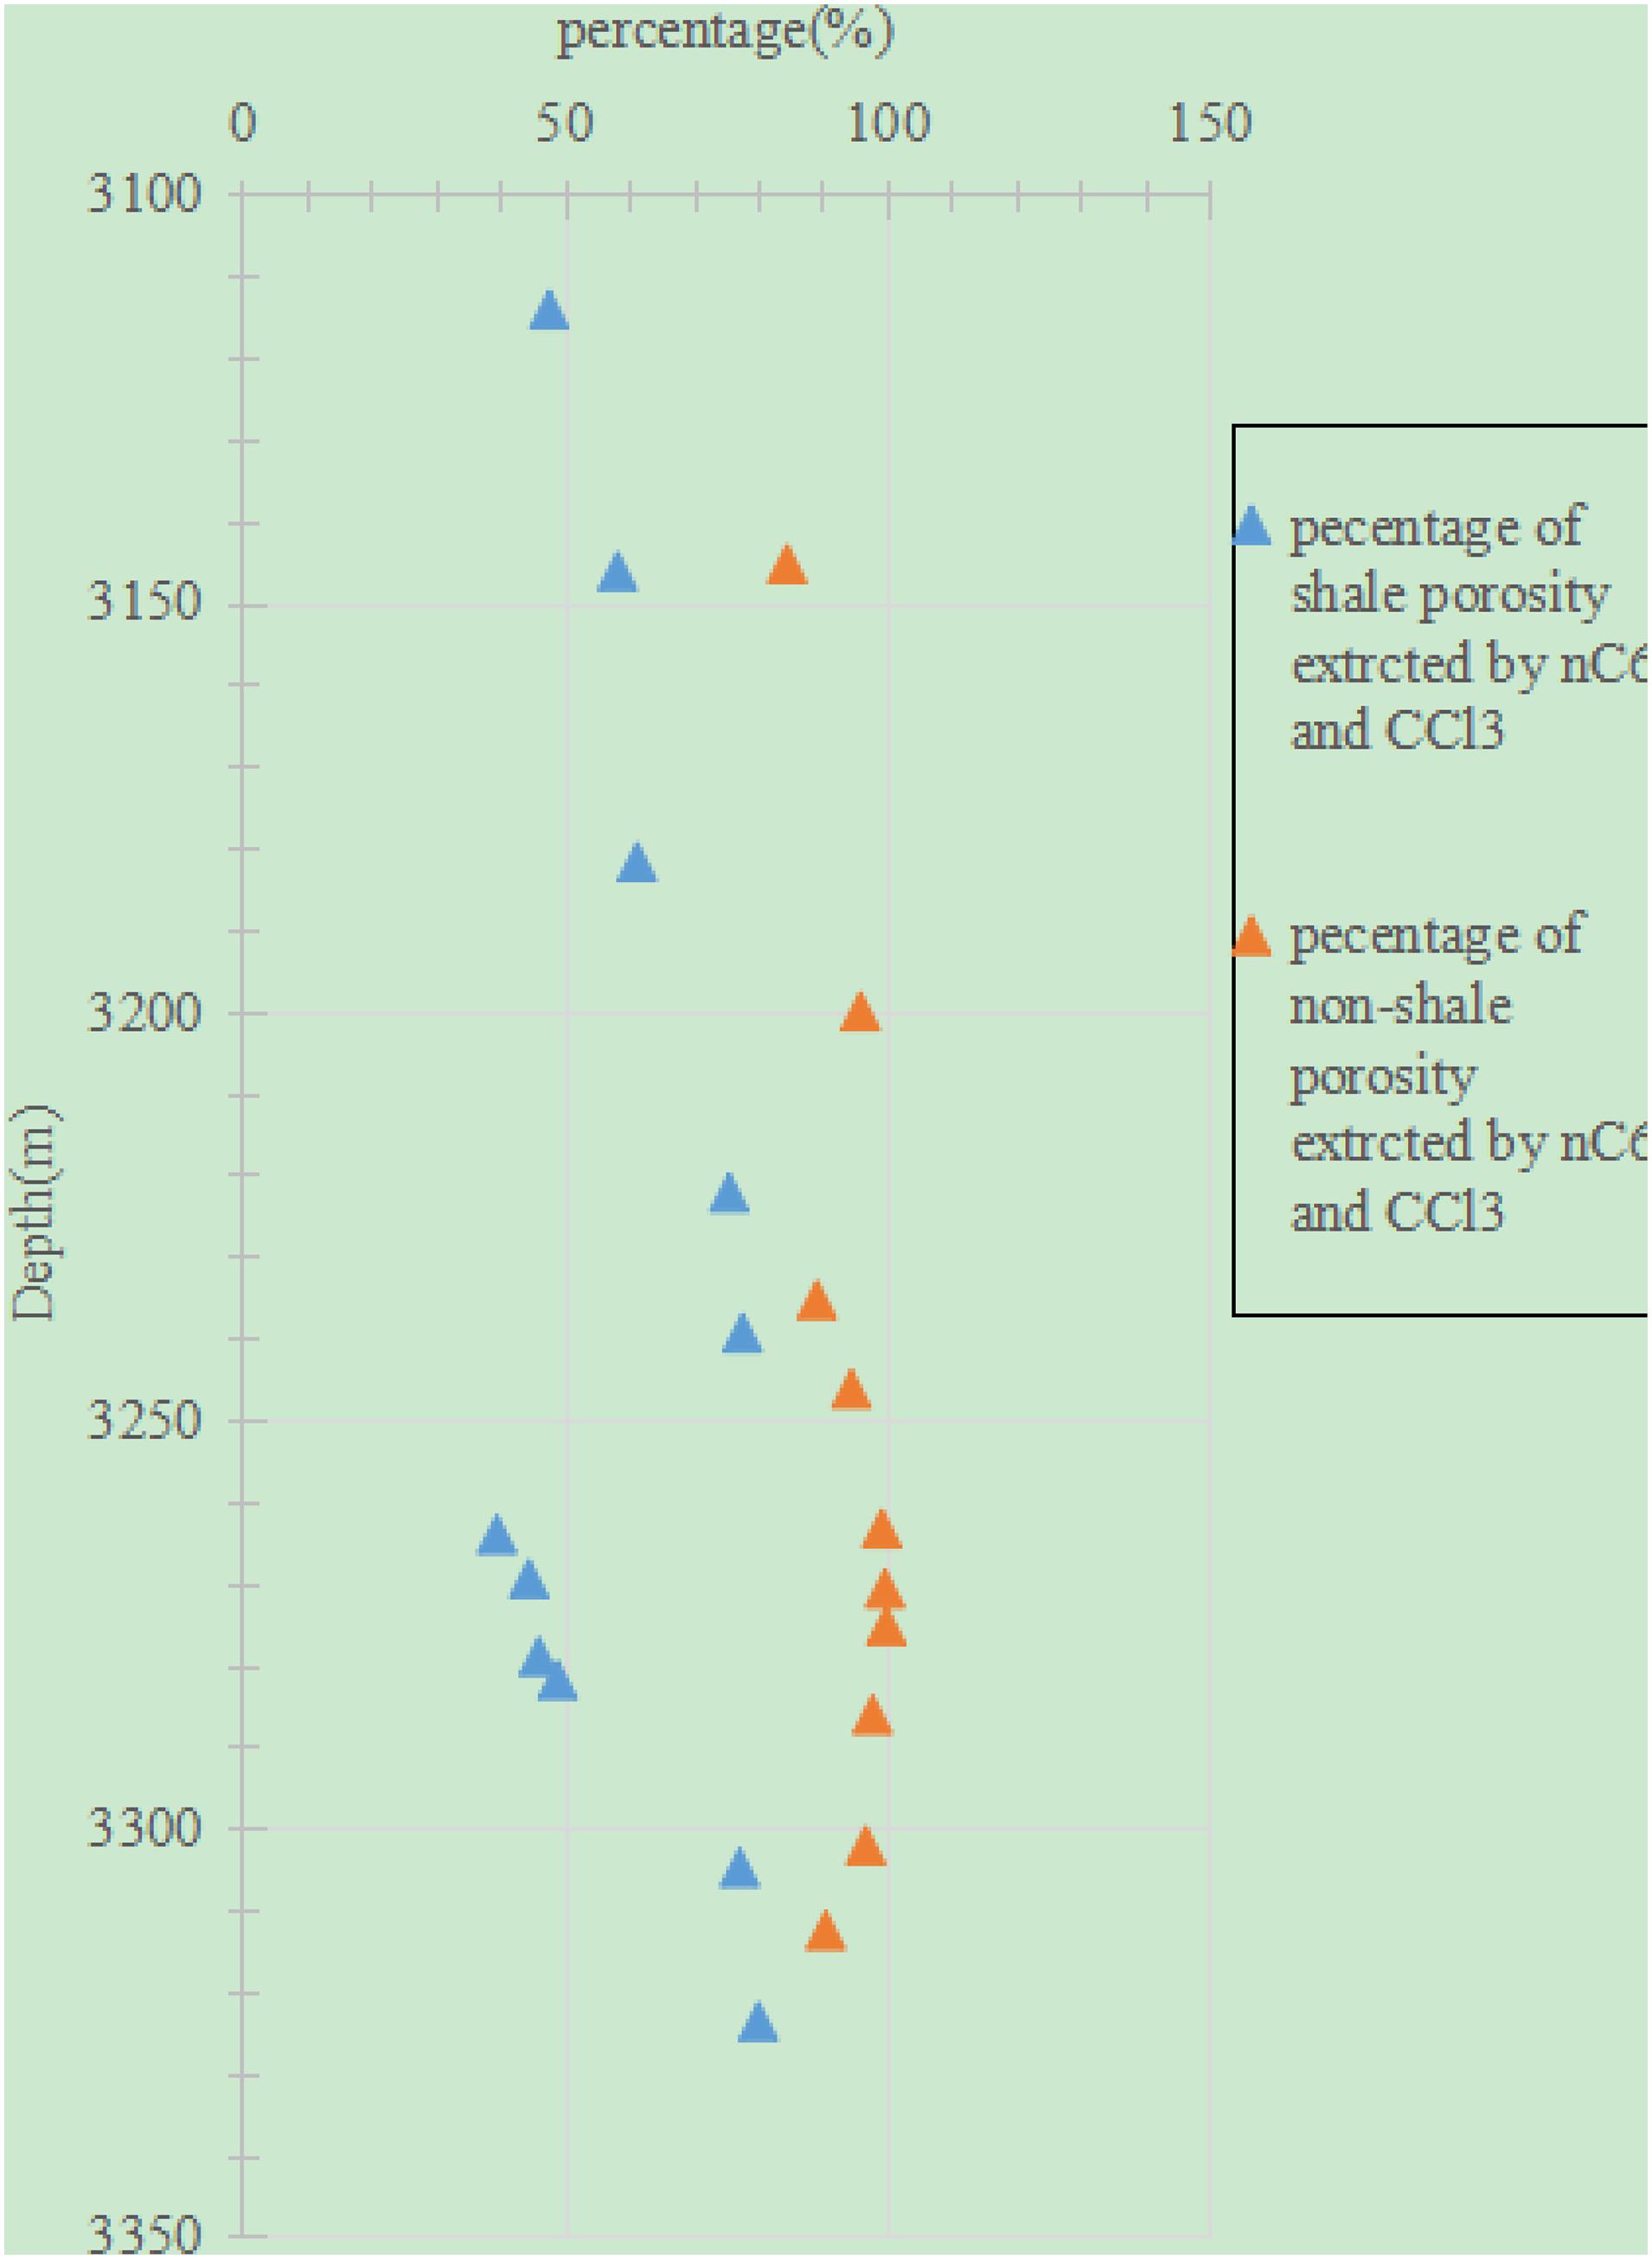
Figure 10. Porosity of the mud shale samples versus the non-mud shale after sequential extraction with nC6 + CHCl3.
Conclusion
In this study, an experimental method for quantitative assessment of movable shale oil was established. The results revealed that the extract contents of the four components vary among the different extraction treatments and different lithology. The mud shale and non-mud shale exhibited similar extract contents of the saturated hydrocarbon after single-solvent extraction with CHCl3 or sequential extraction with nC6 + CHCl3. For the aromatic hydrocarbon, the mud shale exhibited lower extract content than the non-mud shale after extraction with nC6, but they exhibited higher extract content after extraction with nC6 + CHCl3. However, for extraction with CHCl3, the extract contents of the aromatic hydrocarbon from the mud shale versus non-mud shale did not exhibit a clear trend. For the non-hydrocarbon, the mud shale exhibited lower extract content than the non-mud shale after single-solvent extraction with nC6, but they exhibited higher extract content after single-solvent extraction with CHCl3 or sequential extraction with nC6 + CHCl3. For the asphaltene, its content in the nC6 extract did not exhibit a clear trend between the mud shale and the non-mud shale. In contrast, its extract content was higher for the mud shale than for the non-mud shale after extraction with nC6 + CHCl3 or with CHCl3 alone. The viscosity of the crude oil exhibits a negative correlation with the saturated hydrocarbon, positive correlations with the aromatic hydrocarbon and the non-hydrocarbon, and no correlation with the asphaltene. The porosity after single-solvent extraction with nC6 or CHCl3 was higher than their original porosity. In particular, the porosity after extraction with CHCl3 was higher than that after extraction with nC6. There was correlation between the movable shale oil and lithology, with sandstone allowing for a higher fluid movability than mud shale and dolomite allowing for a higher fluid movability than siliceous rocks.
Data Availability Statement
The original contributions presented in the study are included in the article/supplementary material, further inquiries can be directed to the corresponding author/s.
Author Contributions
XL: conceptualization, methodology, investigation, and writing. ZZ: formal analysis, resources, data curation, and writing. LH: software, validation, project administration, and methodology. SL: software, project administration, and data validation. FS: data validation and analysis and software. LZ: data interpretation, draft, and approval. YZ: drawing of figures, data analysis, and references. All authors contributed to the article and approved the submitted version.
Funding
This study was funded by the PetroChina Co., Ltd. (Grant No. 2015D-4810-02; 2018ycq03). The funder was not involved in the study design, collection, analysis, interpretation of data, the writing of this article or the decision to submit it for publication.
Conflict of Interest
All authors are affiliated with the company PetroChina Co., Ltd.
Acknowledgments
We sincerely thank Garcia for his continuous care and help. We also thank Wilson for reviewing our article. We benefit from Allen for providing polishing and editing services to our manuscript.
References
Aily, M. E., Mansour, E. M., Desouky, S. M., and Helmi, M. E. (2019). Modeling viscosity of moderate and light dead oils in the presence of complex aromatic structure. J. Pet. Sci. Eng. 173, 426–433. doi: 10.1016/j.petrol.2018.10.024
Burnham, A. K. (2017). Porosity and permeability of Green River oil shale and their changes during retorting. Fuel 203, 208–213. doi: 10.1016/j.fuel.2017.04.119
Chen, Y. L., He, J., Wang, Y. P., and Li, P. (2010). GC-MS used in study on the mechanism of the viscosity reduction of heavy oil through aquathermolysis catalyzed by aromatic sulfonic H3PMo12O40. Energy 35, 3454–3460. doi: 10.1016/j.energy.2010.04.041
Chishti, H. M., and Williams, P. T. (1999). Aromatic and hetero-aromatic compositional changes during catalytic hydrotreatment of shale oil. Fuel 78, 1805–1815. doi: 10.1016/s0016-2361(99)00089-7
Dong, T., and Harris, N. B. (2020). The effect of thermal maturity on porosity development in the Upper devonian –lower Mississippian Woodford Shale, Permian Basin, US: insights into the role of silica nanospheres and microcrystalline quartz on porosity preservation. Intern. J. Coal Geol. 217:103346. doi: 10.1016/j.coal.2019.103346
Fang, R. H., Littke, R., Zieger, L., Baniaasad, A., Li, M. J., and Schwarzbauer, J. (2019). Changes of composition and content of Tricyclic Terpane, Hopane, Sterane, and aromatic biomarkers throughout the oil window: a detailed study on maturity parameters of Lower Toarcian Posidonia Shale of the Hils Syncline, NW Germany. Organ. Geochem. 138:103928. doi: 10.1016/j.orggeochem.2019.103928
Gao, J., and Li, Z. X. (2018). Water saturation-driven evolution of helium permeability in Carboniferous shale from Qaidam Basin, China: an experimental study. Mar. Petrol. Geol. 96, 371–390. doi: 10.1016/j.marpetgeo.2018.05.028
Goodarzi, F. (2020). Comparison of the geochemistry of lacustrine oil shales of Mississippian age from Nova Scotia and New Brunswick, Canada. Intern. J. Coal Geol. 220:103398. doi: 10.1016/j.coal.2020.103398
Hou, L. H., Luo, X., Han, W. X., Lin, S. H., Pang, Z. L., and Liu, J. Z. (2020a). Geochemical evaluation of the hydrocarbon potential of shale oil and its correlation with different minerals-a case study of the TYP shale in the Songliao Basin, China. Energy Fuels 34, 11998–12009. doi: 10.1021/acs.energyfuels.0c01285
Hou, L. H., Ma, W. J., Luo, X., and Liu, J. Z. (2020b). Characteristics and quantitative models for hydrocarbon generation-retention-production of shale under ICP conditions: example from the Chang 7 member in the Ordos Basin. Fuel 279:118497. doi: 10.1016/j.fuel.2020.118497
Hou, L. H., Ma, W. J., Luo, X., Liu, J. Z., Lin, S. H., and Zhao, Z. Y. (2021). Hydrocarbon generation-retention-expulsion mechanism and shale oil producibility of the Permian lucaogou shale in the Junggar Basin as simulated by semi-open pyrolysis experiments. Mar. Petrol. Geol. 125:104880. doi: 10.1016/j.marpetgeo.2020.104880
Hu, S. Y., Zhao, W. Z., Hou, L. H., Yang, Z., Zhu, R. K., Wu, S. T., et al. (2020). Development potential and technical strategy of continental shale oil in China. Pet. Explor. Dev. 47, 877–887. doi: 10.1016/s1876-3804(20)60103-3
Jefimova, J., Irha, N., Reinik, J., Kirso, U., and Steinnes, E. (2014). Leaching of polycyclic aromatic hydrocarbons from oil shale processing waste deposit: a long-term field study. Sci. Total Environ. 481, 605–610. doi: 10.1016/j.scitotenv.2014.02.105
Kara, B., and Isik, V. (2021). Reservoir characteristics and unconventional oil potential of Silurian aged Dadaş shale in southeast Turkey. J. Pet. Sci. Eng. 200:108365. doi: 10.1016/j.petrol.2021.108365
Kim, M., and Shin, H. (2020). Numerical simulation of undulating shale breaking with steam-assisted gravity drainage (UB-SAGD) for the oil sands reservoir with a shale barrier. J. Pet. Sci. Eng. 195:107604. doi: 10.1016/j.petrol.2020.107604
Li, W. H., Lu, S. F., Xue, H. T., Zhang, P. F., and Hu, Y. (2015). Oil content in argillaceous dolomite from the Jianghan Basin, China: application of new grading evaluation criteria to study shale oil potential. Fuel 143, 424–429. doi: 10.1016/j.fuel.2014.11.080
Liu, B., Lv, Y. F., Zhao, R., Tu, X. X., Guo, X. B., and Shen, Y. (2012). Formation overpressure and shale oil enrichment in the shale system of Lucaogou formation, Malang Sag, Santanghu Basin, NW China. Pet. Explor. Dev. 39, 744–750. doi: 10.1016/s1876-3804(12)60099-8
Ma, W. J., Hou, L. H., Luo, X., Tao, S. Z., Guan, P., Liu, J. Z., et al. (2020). Role of bitumen and NSOs during the decomposition process of a lacustrine Type-II kerogen in semi-open pyrolysis system. Fuel 259:116211. doi: 10.1016/j.fuel.2019.116211
Solarin, S. A. (2020). The effects of shale oil production, capital and labour on economic growth in the United States: a maximum likelihood analysis of the resource curse hypothesis. Resour. Policy 68:101799. doi: 10.1016/j.resourpol.2020.101799
Tao, S., Wang, Y. B., Tang, D. Z., Wu, D. M., Xu, H., and He, W. (2012). Organic petrology of Fukang Permian Lucaogou formation oil Shales at the northern foot of Bogda Mountain, Junggar Basin, China. Intern. J. Coal Geol. 99, 27–34. doi: 10.1016/j.coal.2012.05.001
Xie, X. M., Borjigin, T., Zhang, Q. Z., Zhang, Z. R., Qin, J. Z., Bian, L. Z., et al. (2015). Intact microbial fossils in the Permian Lucaogou Formation oil shale, Junggar Basin, NW China. Intern. J. Coal Geol. 146, 166–178. doi: 10.1016/j.coal.2015.05.011
Yu, Z. S., Dai, M. Q., Huang, M. M., Fang, S. W., Xu, J. C., Lin, Y., et al. (2018). Catalytic characteristics of the fast pyrolysis of microalgae over oil shale: analytical Py-GC/MS study. Renew. Energy 125, 465–471. doi: 10.1016/j.renene.2018.02.136
Zhang, L. Y., Wu, K. L., Chen, Z. X., Li, J., Yu, X. R., Hui, G., et al. (2021). The increased viscosity effect for fracturing fluid imbibition in shale. Chem. Eng. Sci. 232:116352. doi: 10.1016/j.ces.2020.116352
Zhao, W. Z., Zhu, R. K., Hu, S. Y., Hou, L. H., and Wu, S. T. (2020). Accumulation contribution differences between lacustrine organic-rich shales and mudstones and their significance in shale oil evaluation. Pet. Explor. Dev. 47, 1160–1171. doi: 10.1016/s1876-3804(20)60126-x
Appendix
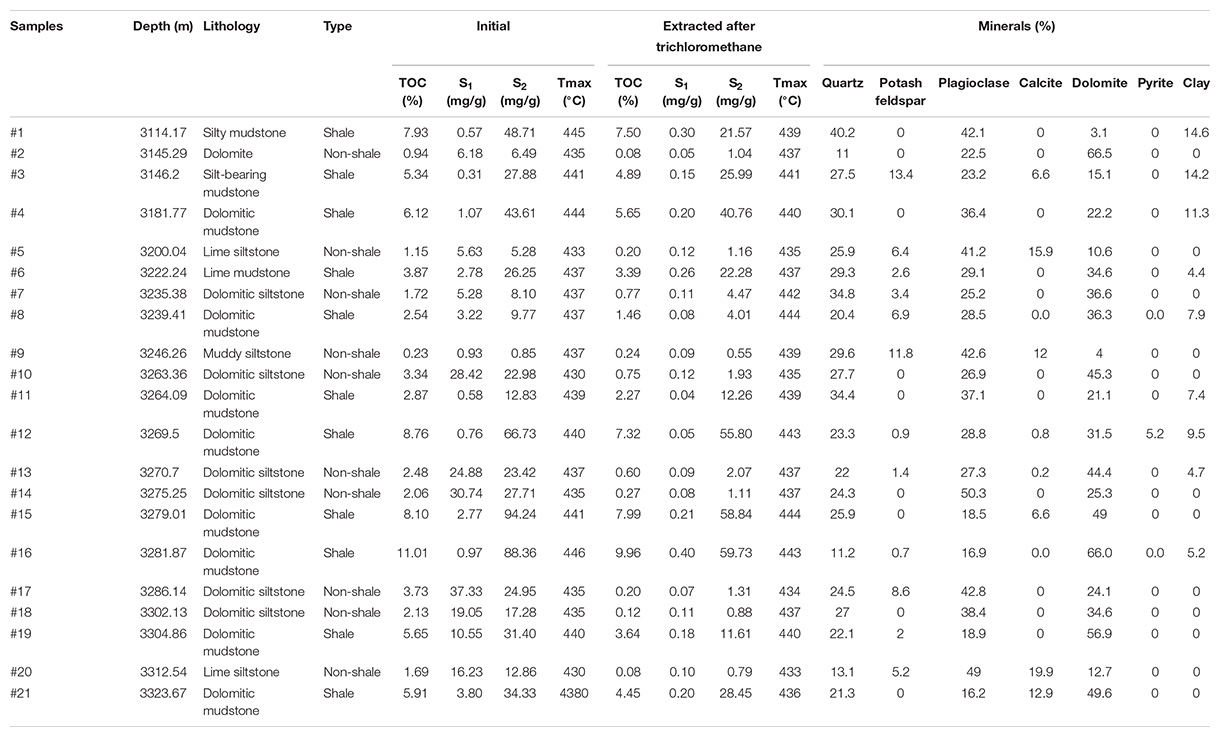
TABLE A1. Basic geochemical information for the samples.
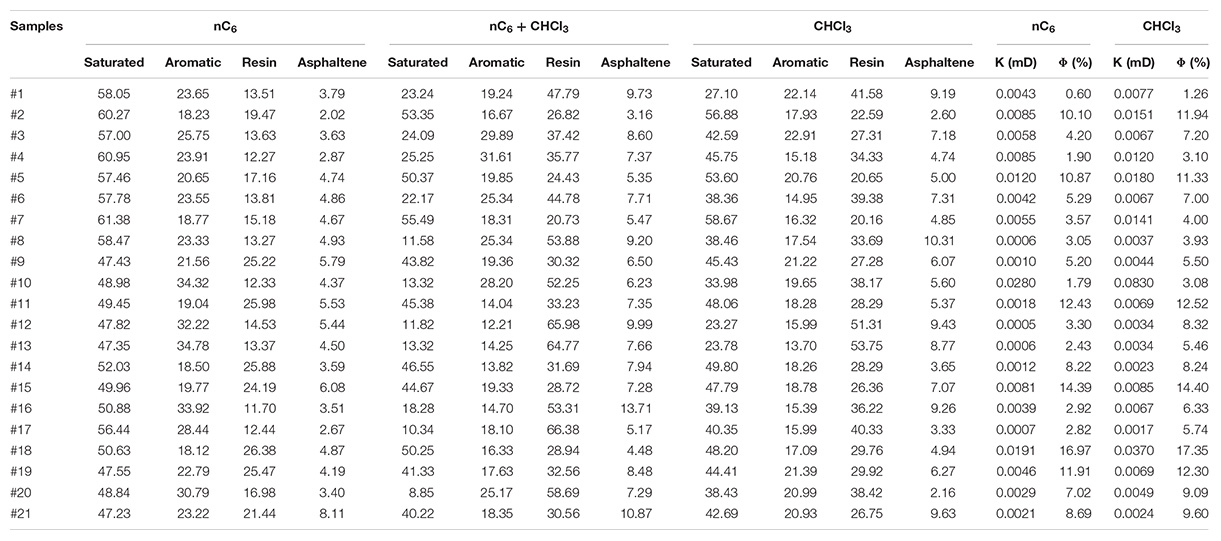
TABLE A2. Analysis results of the extracts after different extraction treatments.

TABLE A3. NMR analysis results.

TABLE A4. High-pressure mercury injection results.
Keywords: shale oil, volume fraction of movable oil, retained oil, sequential extraction, Jimsar Sag
Citation: Luo X, Zhao Z, Hou L, Lin S, Sun F, Zhang L and Zhang Y (2021) Experimental Methods for the Quantitative Assessment of the Volume Fraction of Movable Shale Oil: A Case Study in the Jimsar Sag, Junggar Basin, China. Front. Earth Sci. 9:663574. doi: 10.3389/feart.2021.663574
Received: 03 February 2021; Accepted: 12 March 2021;
Published: 06 April 2021.
Edited by:
Dongdong Wang, Shandong University of Science and Technology, ChinaReviewed by:
Weilong Peng, SINOPEC Petroleum Exploration and Production Research Institute, ChinaBinfeng Cao, Institute of Geology and Geophysics (CAS), China
Copyright © 2021 Luo, Zhao, Hou, Lin, Sun, Zhang and Zhang. This is an open-access article distributed under the terms of the Creative Commons Attribution License (CC BY). The use, distribution or reproduction in other forums is permitted, provided the original author(s) and the copyright owner(s) are credited and that the original publication in this journal is cited, in accordance with accepted academic practice. No use, distribution or reproduction is permitted which does not comply with these terms.
*Correspondence: Xia Luo, bHVveGlhNjlAcGV0cm9jaGluYS5jb20uY24=; Zhongying Zhao, emhhb3pob25neWluZ0BwZXRyb2NoaW5hLmNvbS5jbg==; Lianhua Hou, aG91bGhAcGV0cm9jaGluYS5jb20uY24=