 Delong Ma1,2*
 Jianying Yuan1,2
 Yanpeng Sun3Hongbin Wang1,2Dengfa He4Yanjun Wang1,2Shuxin Pan1Jian Cui5
- 1Research Institute of Petroleum Exploration and Development-Northwest, PetroChina, Lanzhou, China
- 2Key Laboratory of Reservoir Description, PetroChina, Lanzhou, China
- 3Department of Earth and Planetary Sciences, Harvard University, Cambridge, MA, United States
- 4School of Energy Resources, China University of Geosciences, Beijing, China
- 5Department of Earth Sciences and Engineering, Nanjing University, Nanjing, China
Because of the influence of the far field effect of the collision between Euro-Asian and India plates during the Late Cenozoic, the Tian Shan orogenic belt underwent intense reactivation, forming the Southern Junggar fold-and-thrust belt (SJ-FTB) to the north and the Kuqa fold-and-thrust belt to the south. Most previous research focuses on the deformation features and mechanisms during the Late Cenozoic. However, little research has been done on deformation features and mechanisms during the Late Jurassic. In this paper, we conducted geometric and kinematic analyses of seismic profiles and outcrop data to reveal the Late Jurassic deformation characteristics in SJ-FTB. Furthermore, we carried out sandbox modeling experiments to reproduce the regional structural evolution since the Early Jurassic. Angular unconformity between the Cretaceous and Jurassic is well preserved in the Qigu anticline belt. This unconformity also exists in the Huoerguosi–Manasi–Tugulu (HMT) anticline belt, which is the second fold belt of the SJ-FTB, indicating that the HMT anticline belt started to become active during the Late Jurassic. The Qigu anticline belt reactivated intensively during the Late Cenozoic, and the displacement was transferred to the HMT anticline belt along the Paleogene Anjihaihe Formation mudstone detachment. Therefore, the present-day SJ-FTB forms because of the two-stage compressional deformation from both the Late Jurassic and Late Cenozoic (ca. 24 Ma).
Introduction
The Southern Junggar fold-and-thrust belt (SJ-FTB) experienced strong deformation during the Late Cenozoic as a result of the far field effect of the collision between the Euro-Asian and India plates. Much research has been conducted in the SJ-FTB focusing on the study of the geometry, kinematics, and kinetics during the Late Cenozoic (e.g., Avouac et al., 1993; Deng et al., 1999; Wang et al., 2004; Wang et al., 2007; Daëron et al., 2007; Charreau et al., 2008; Lu et al., 2010; Li et al., 2011; Lu et al., 2018; Li et al., 2020). Studies of the clastic lithology (Hendrix et al., 1992; Fang et al., 2007; Li and Peng., 2013) and low-temperature thermal chronology (Guo et al., 2006) demonstrate that the Southern Junggar Basin margin experienced reginal uplift during the Late Jurassic, and the neighboring Tian Shan orogenic belt also uplifted at that time (Dumitru et al., 2001; Jolivet et al., 2010). However, very few researchers have analyzed the Mesozoic structural deformation recorded in the Southern Junggar Basin. Furthermore, there is a lack of study on the superposition of the Late Cenozoic deformation and the Late Jurassic uplift. By using field outcrops and subsurface seismic profiles, this paper analyzes the characteristics of the two-stage structural deformation. We also carried out sandbox modeling experiments to reveal the structural evolution history. Our study results could help to understand the deformation process in other fold-and-thrust belt regions, such as Alps thrust belts (Ziegler, 1987, 1989) while also providing a reference on how to define their deeper hydrocarbon prospects.
Geologic Setting
Regional Tectonic Evolution
The Tian Shan is an approximately 2500-km-long, east-west-trending mountain belt in northwest China (Figure 1). The belt originally formed in the Paleozoic as the result of multiple collisional events involving continental blocks and island arcs during the closure of the Paleo-Asian Ocean (e.g., Windley et al., 1990; Allen et al., 1993; Gao et al., 1998; Charvet et al., 2011; Xiao et al., 2013).
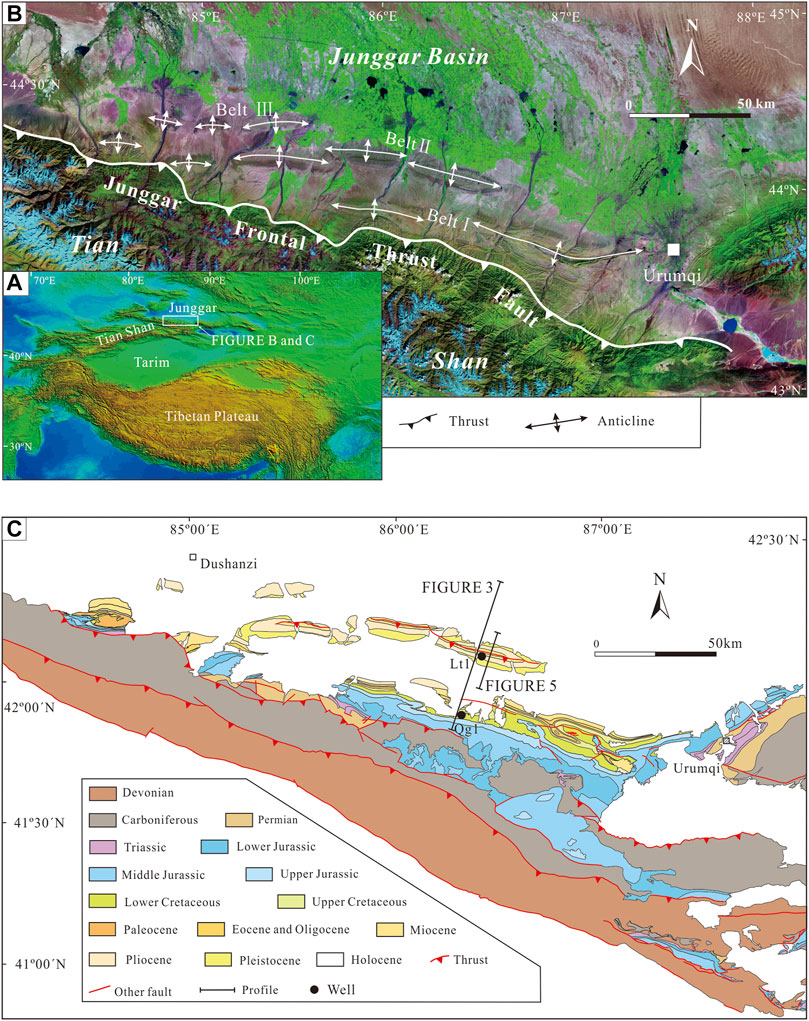
FIGURE 1. Satellite image and geologic map of the study area. (A): Digital elevation map of the Tibetan Plateau and surrounding area where the white box shows the location of the study area. (B): Enhanced thematic mapper image shows that the Tian Shan and Junggar Basin are separated by the Southern Junggar fold-and-thrust belt. (C): Geological map of the Southern Junggar fold-and-thrust belts (Bureau of Geological and Mineral Resources of the Xinjiang Uygur Autonomous Region, 1985).
Substantial work has been done on the sedimentology, structural history, and geodynamics of the Southern Junggar Basin, which flanks the Tian Shan to the north (e.g.,Tapponnier and Molnar, 1979; Nelson et al., 1987; Hendrix et al., 1992, 1994; Avouac et al., 1993; Burchfiel et al., 1999; Sun et al., 2004; Charreau et al., 2012). The present topography and structural style of the Southern Junggar Basin is a result of the late Cenozoic reactivation of the Paleozoic mountain range (Tapponnier and Molnar, 1979; Windley et al., 1990).
The study area experienced multiple extensional-compressional tectonic cycles before the Late Cenozoic (e.g., Hendrix et al., 1992; Allen et al., 1995; De Grave et al., 2007; Jolivet et al., 2010; Guan et al., 2016). However, the Mesozoic tectonic setting of the Southern Junggar Basin is still controversial. Some researchers think it is an extensional basin (Li and Chen, 1998; Liu et al., 2000; Guan et al., 2016), and some other researchers think it is a continental depression basin (Xu et al., 1997; Jolivet et al., 2010), and still others think it is a foreland basin associated with the collision of the Qiangtang terrane to the south (Hendrix et al., 1992; Zhang et al., 1999; Chen et al., 2002).
Sedimentary Sequence
The Southern Junggar Basin developed adjacent to the Tian Shan and hosts nearly continuous sediments from carboniferous to quaternary (Figure 2). The carboniferous volcanic rock serves as the basement of the basin. Permian mudstones are mainly distributed along the eastern part of the southern margins, and Permian tuff is more limited in the central part. Triassic rock is rare in the central part although it is widespread in the eastern part with the rocks, mainly clastics. Jurassic occurs in the whole basin, and it unconformably sits on top of the carboniferous in the central part. The Lower and Middle Jurassic are mainly mudstone with coal and siltstone, and the Upper Jurassic is sandstone. Cretaceous is mainly mudstone with interlayers of sandstone in some local part. The Lower Paleogene consists of interlayered mudstone and sandstone, and the Middle and Upper Paleogene is mainly thick-layered mudstone. Neogene is interlayered mudstone and sandstone. Quartey is composed of thick conglomerates.
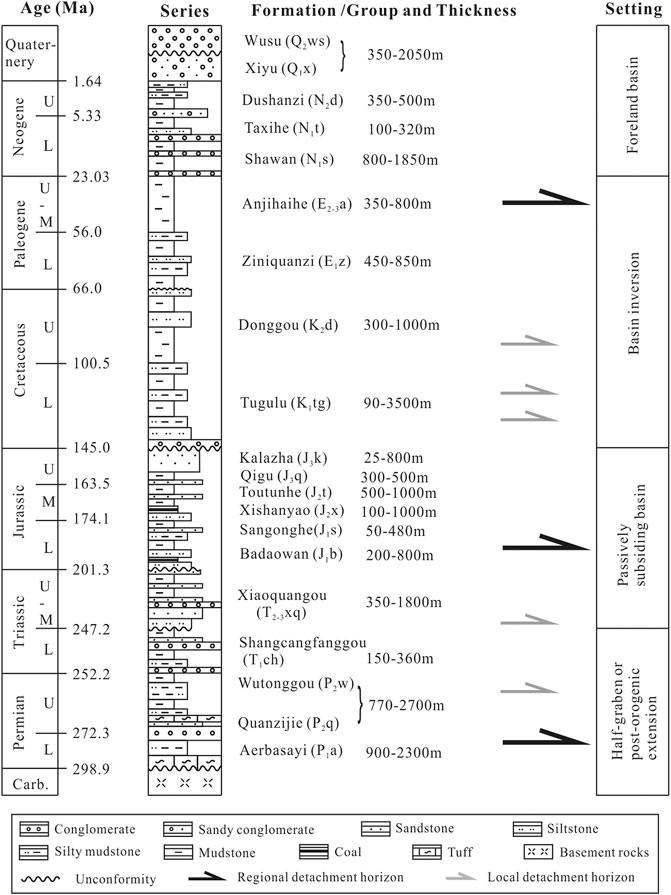
FIGURE 2. Stratigraphic column showing the main stratigraphic units in the study region (Bureau of Geological and Mineral Resources of the Xinjiang Uygur Autonomous Region, 1985), and the tectonic setting that the region experienced (Yang et al., 2013).
Structural and Geophysical Characteristics
Regional transient electromagnetic data (Figure 3A) shows that the carboniferous basement rocks have large resistivity of more than 2 Ω m, and the sediments above generally have resistivity lower than 1.8 Ω m. The transient electromagnetic profile shows that the carboniferous basement fluctuates a lot, and it is at least 8 km shallower in the Qigu fold belt region compared with the interior basin, which could be caused by a series of thrust faults. The Middle and Lower Jurassic has a resistivity of about 1.5–1.8 Ω m with local lows being 1.4 Ω m, exhibiting an oval shape, potentially indicating the depocenters controlled by blind normal faults. The Cretaceous shows a very low value of smaller than 1.3 Ω m in the HMT anticline belt and 1.6–1.7 Ω m in the Qigu anticline belt. Meanwhile, the resistivity of the Cenozoic sequence is higher in the hanging wall of the HMT thrust compared with the footwall region.
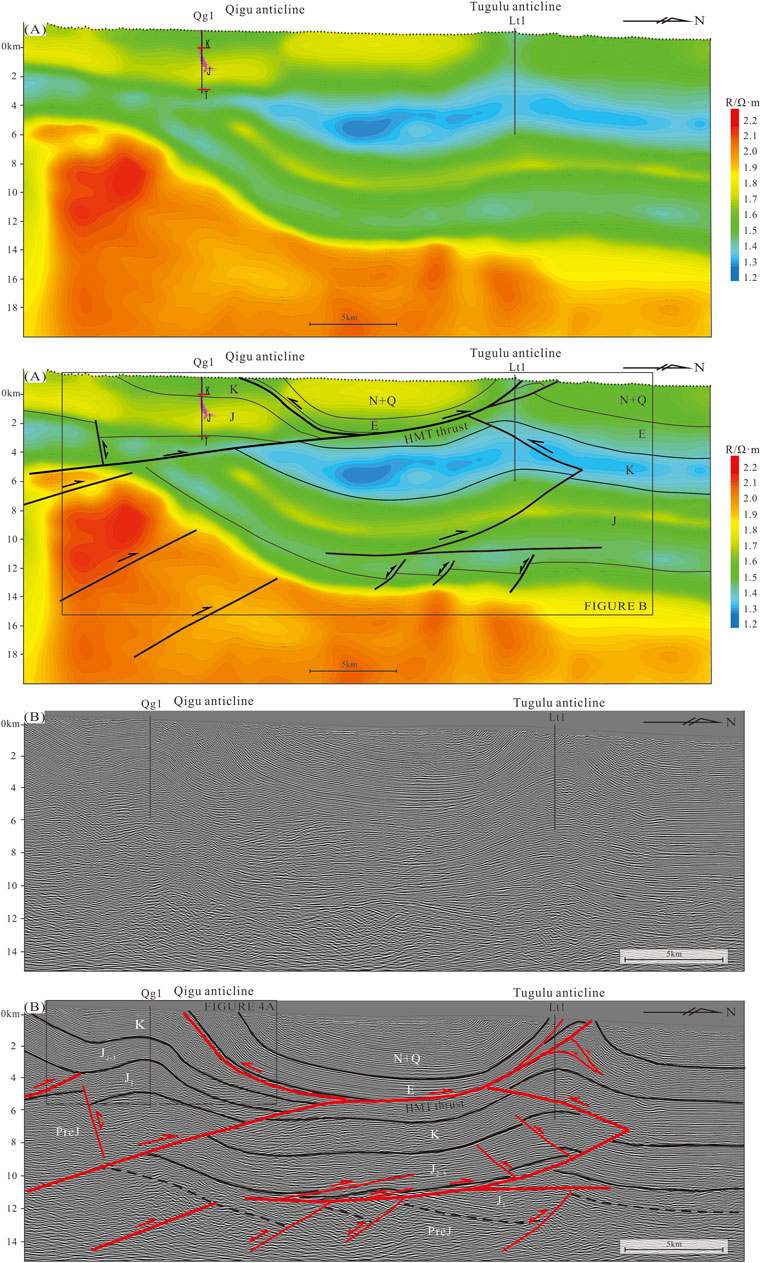
FIGURE 3. Sections cutting across the Qigu and Tugulu anticlines (for location see Figure 1C), showing the shallow folds and thrusts detached above the wedge-shaped Lower Jurassic strata. Note the wedge-shaped nature of the Lower Jurassic strata indicating the syn-kinematic deposition. (A): Regional transient electromagnetic section. (B): Seismic reflection section.
Recently acquired and processed reflection seismic data by PetroChina with a trace interval of 25 m greatly improves the imaging quality of the study area. Due to the complexities of the regional deformation, we were not able to build a 3-D velocity model for depth conversion. Nevertheless, well data suggests a uniform seismic velocity of 2.5 km/s serves as a good approximation for depth conversion.
Based on these depth-converted seismic data, we can identify south-dipping normal faults along the HMT anticline belt. These normal faults bound the Lower Jurassic wedge-shaped seismic reflectors, which we interpret as a sequence of half-graben fills with no or weak tectonic inversion. At the Tugulu anticline (Figure 3B), the half-graben fills have north dipping reflectors with less continuity, and the Middle-Upper Jurassic units dip to south (Figure 3B). The Lower Jurassic units appear to thin abruptly across the normal fault from the hanging wall to the footwall. The base of the Lower Jurassic units is located much deeper to the south of the HMT anticline belt than to the north. A Lower Jurassic wedge-shaped half-graben is also present in the core of the Qigu anticline belt. In the study area, two main detachments in the Lower Jurassic and Paleogene control the structural style. The Middle-Upper Jurassic and Cretaceous structural wedges are developed at depths of 4–8 km, and the HMT thrust exposed on the surface merges into the Paleogene detachment at a depth of about 4 km below sea level (Figure 3B).
Structural Deformation of the Qigu Anticline
We can observe the clear angular unconformity between the Cretaceous and Jurassic on the seismic profile across the Qigu anticline (Figure 4A) as well as in the filed outcrops (Figure 4B). On the seismic profiles, there exists the upper erosion cutoff at the top of the Late Jurassic (yellow arrows, Figure 4A) in the southern limb of the Qigu anticline, where the southern limb is shallower and thicker than the northern limb. The Cretaceous reflectors above the unconformity surface are continuous, in contrast with the discontinuous reflectors below. The dip of reflectors also changes across the unconformity, which itself has also been folded. Meanwhile, there is no obvious onlap feature within the Cretaceous above the unconformity.
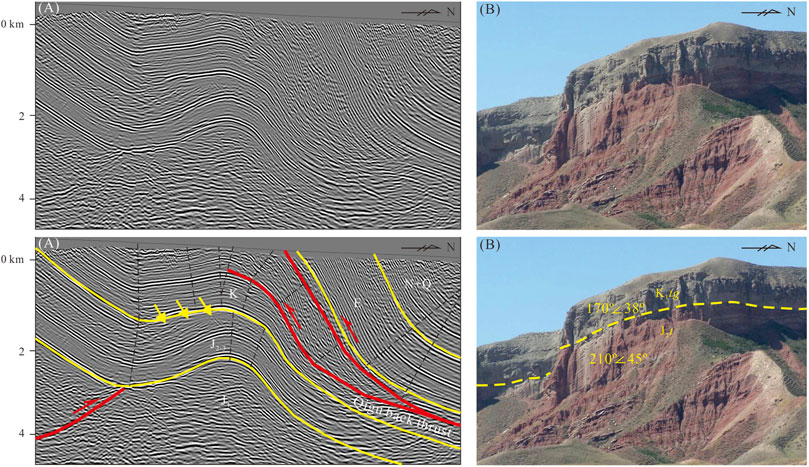
FIGURE 4. Seismic reflection (A) and outcrop (B) features of K/J unconformity in the Qigu anticline.
All of this evidence suggests that, after the formation of the unconformity at the end of the Jurassic, this region became stable in the Cretaceous. Because the hanging wall above the north dipping Qigu back thrust exhibits consistent deformation from deep to shallow events (Figure 4A), we believe that the Qigu anticline formed as a result of two stages of compressional deformation: Late Jurassic and Late Cenozoic.
Structural Deformation of the Tugulu Anticline
Three-dimensional seismic data acquired in the Tugulu anticline region (Figure 5) provide high-quality images, which we can use to characterize the deep structures in detail. A fault starting from the Lower Jurassic detachment layer breaks to the shallower part as a back-thrust in the Cretaceous, forming a wedge structure. Secondary faults exist within the wedge, further compartmentalizing the core of the anticline. Furthermore, there are also secondary branch faults related to the back-thrust, further complicating the deep structures. The back-thrust soles upward into the shallower detachment in the Anjihaihe formation (E2-3a). Similar to the Qigu anticline, we can also identify the unconformity feature in the core of the Tugulu anticline (yellow arrows, Figure 6), where the Cretaceous above the unconformity does not have onlap. This demonstrates that, after the regional uplift forming the unconformity, it changes into a stable depositional environment. As the unconformity surface has been further folded along with the shallower sediments, the wedge part has at least gone through two stages of folding deformation.
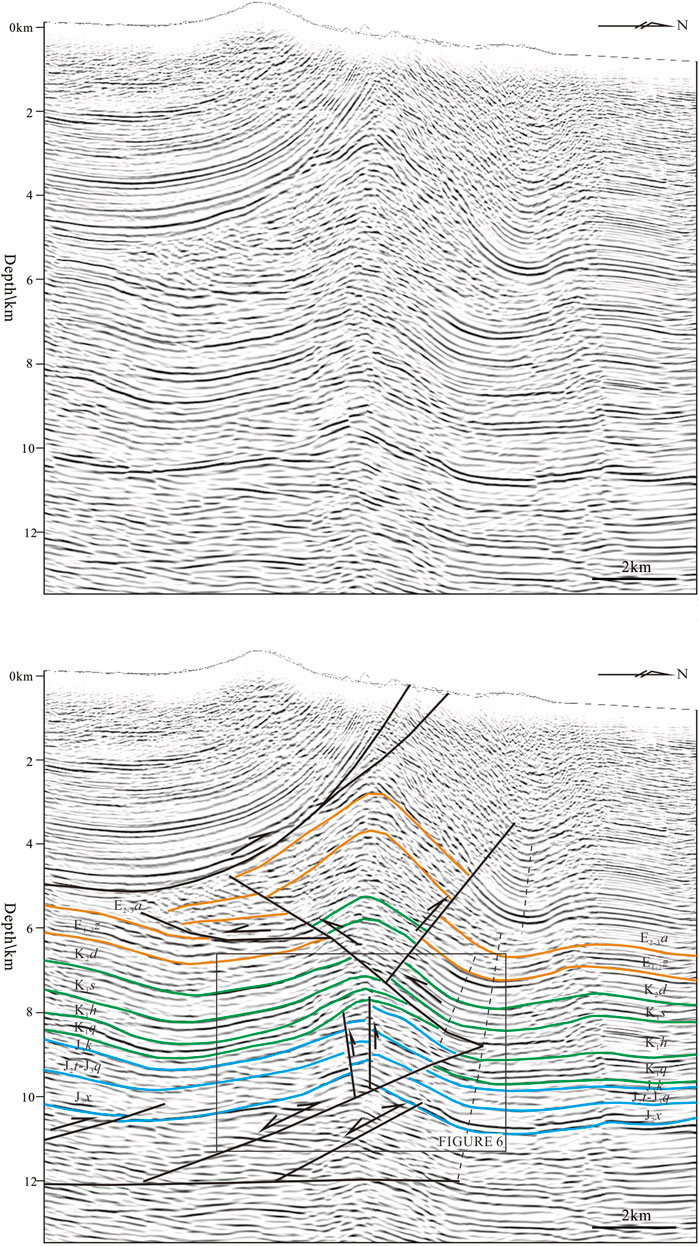
FIGURE 5. Structural interpretation of seismic reflection across the Tugulu anticline showing the structural wedge in depth (for location see Figure 1C).
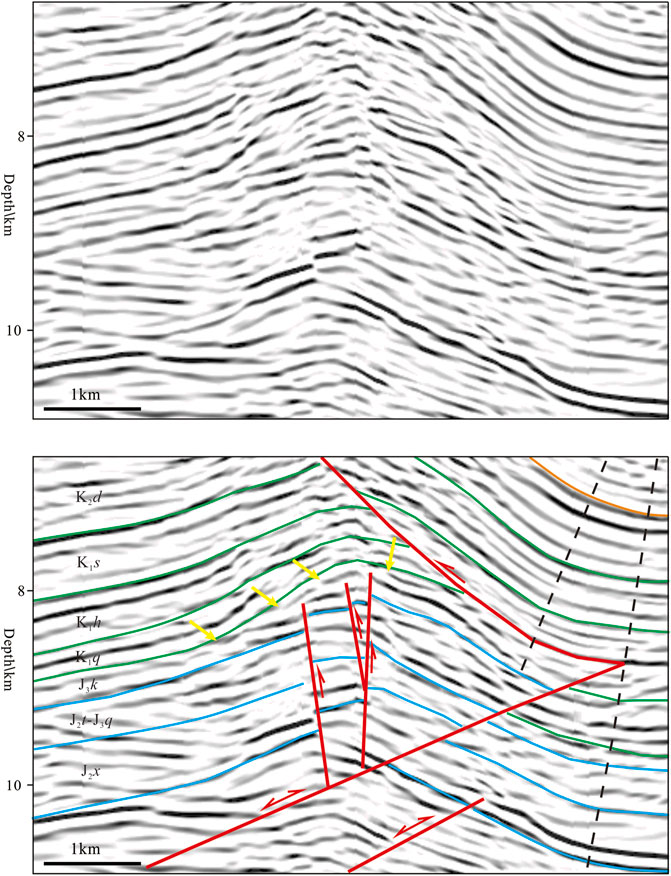
FIGURE 6. Close view of the structural wedge in the Tugulu anticline, which clearly shows unconformity between the Jurassic and Cretaceous.
Sandbox Modeling
Model Setup
Here, we conduct sandbox analogue experiments to test the influence of two stages of compressional deformation to compare model results with the working hypothesis derived from field and geophysical data in the SJ-FTB.
Modeling materials were well-sorted dry quartz and corundum sand with well-rounded grain size of 200–400 μm to simulate the brittle sedimentary rocks and viscous silicone putty to simulate detachments. To a first approximation, dry sand fails according to a linear Mohr envelope (Krantz, 1991). The mechanical properties were measured with a modified Hubbert-type shear apparatus (Koyi and Cotton, 2004; Koyi and Sans, 2006; Maillot and Koyi, 2006), which enables determination of the ratio of normal-to-shear stress at failure. The test results indicate that the quartz and corundum sand have a friction angle of ∼36° and 37°, respectively, close to the values of 40° determined experimentally for competent upper crustal rocks (Byerlee, 1978). The silicone putty (effective viscosity is 5 × 10⁴ Pas at room temperature and density is 987 kg/m3) has a Newtonian behavior at a low strain rate (10−5–10−3 s−1) (Koyi et al., 2008) and acts as a natural detachment similar to salt or shale.
Analogue experiments must be scaled to achieve geometric, kinematic, and dynamic similarities with the natural cases they aim to represent (Hubbert, 1937; Ramberg, 1981). The models described in this paper are scaled such that 1 cm in the model simulates approximately 2 km in nature (geometric scale factor λ = 5 × 10⁻⁶); the density ratio (ρ) between the granular materials and their prototype is ρ ≈ 0.5, and both the prototype and the model are subject to the same value of gravitational acceleration, imposing a scale factor g = 1. The stress scale factor σ is given by
Running the experiment twice to ensure reproducibility, we test the two stages of the shortening process and see how they affect the final structure (Figure 7). The models contain alternating layers of sieved quartz and corundum sand with densities of 1,297 kg/m3 and 1700 kg/m3, respectively, to obtain a clear CT image (Panien et al., 2005). In addition, 6 mm-thick rigid plastic sheets were placed at the bottom of the models (Figure 8) to represent the Pre-Jurassic basement footwall and hanging wall of the HMT anticline belt (Ma et al., 2018, 2019). A 6 mm-thick layer of silicone was placed on the bottom where there is no rigid plastic sheet, simulating the Lower Jurassic detachment. The boundary of the rigid plastic sheet simulated the normal fault-bounding graben (Ma et al., 2018, 2019). A 1.0 cm-thick layer of quartz and corundum were placed on the whole model. A constant deformation velocity of 1.0 cm/h was used to reach a shortening of 3 cm for the first stage. Then, the folds, both near the pushing wall and above the boundary of the rigid plastic sheet, were eroded. Another 0.5 cm-thick layer of quartz and corundum were placed on the whole model. A 0.3 cm-thick layer of silicone simulating the Paleogene detachment (E2-3a Formation) was placed in the model with 1.0 cm-thick layers of quartz and corundum above. During the second stage shortening, a constant deformation velocity of 2.0 cm/h was used, and quartz and corundum sand were sprinkled alternatively manually onto the models, 0.2 cm thick every half hour, to mimic syn-kinematic sedimentation or growth strata. The total thickness of the syn-kinematic sediments was 1.4 cm.
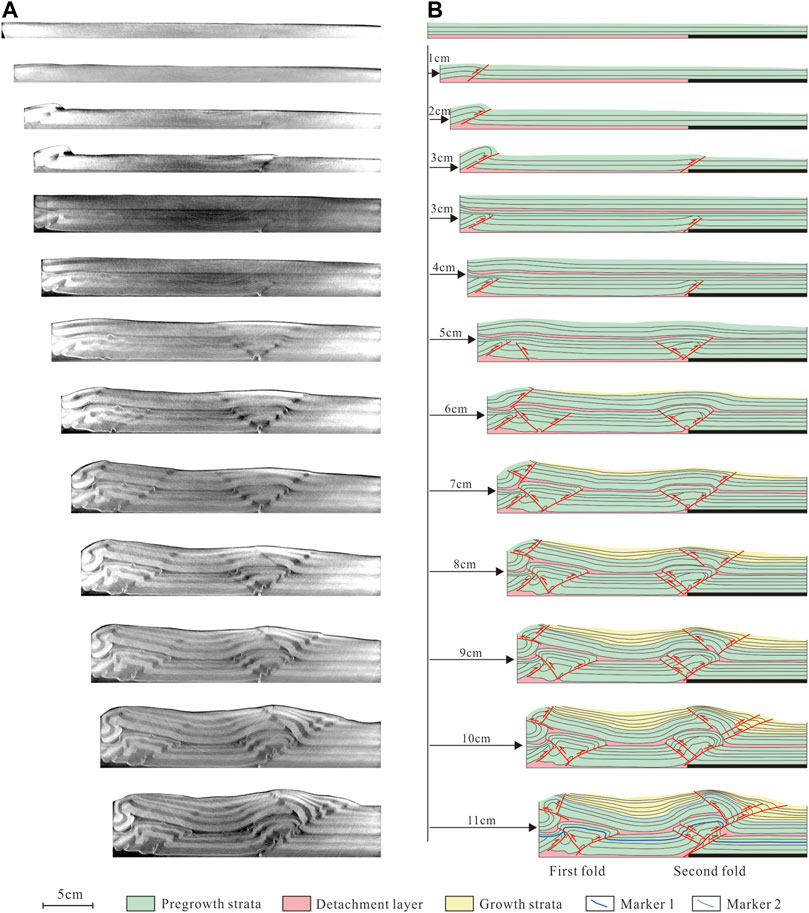
FIGURE 7. X-ray images of structural evolution in the model after every 1 cm shortening (A). Line drawings of the scanned images highlighting the main structural features (B).
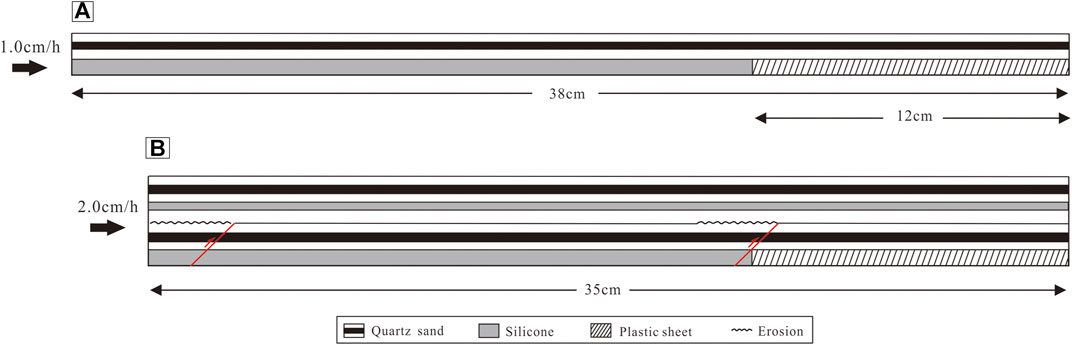
FIGURE 8. Diagram of the model setup with two stages of shortening. (A): In the first stage, the shortening amount was 3 cm at the rate of 1.0 cm/h. (B): In the second stage, folds generated in the first stage were eroded, and then sand and silicone were added before shortening at the rate of 2.0 cm/h.
Model Results
During our experiments, for every 1 cm of shortening, we run an industrial CT scan of the model perpendicular to the moving wall (Figure 7). For the first stage of shortening when the compressional rate is 1 cm/h by 1 cm of shortening, the first fold belt formed near the moving wall, which further increased its amplitude by 2 cm of shortening. At this stage, the second fold belt was not formed yet. By 3 cm of shortening, the first fold belt was still growing, and the second fold belt started to show near the stable wall. Afterward, we eroded the two fold belts before adding the shallower particles as detailed in the previous section.
For the second stage of shortening, the compressional rate is 2 cm/h. By 4 cm of shortening, the first fold belt started to react first, and the second fold belt did not reactivate until 5 cm of shortening. At this time, there formed nearly symmetrical fore-thrust and back-thrust in the second fold belt. Afterward, for every 1 cm of shortening, we added 0.2 cm of particles, simulating growth strata. By 6 cm of shortening, both the first and second folds were active, and the first fold belt gradually stopped growing by 7 cm of shortening. By 8 cm of shortening, back-thrust started to form in the folded sequences above the upper silicone putty layer, leading to the different structures above and below the detachment. Finally, by 11 cm of shortening, the folding above the upper silicone putty layer as well as the fore-thrust and back-thrust within the fold continued to be active.
By analyzing the timing of the major faults in our models as well as the uplift-shortening curve during these two stages of shortening experiment (Figure 9), we can identify the different structural zone deformation timing of the structures above and below the detachment layer. Based on the uplift-shortening curve (Figure 9) as well as the amplitude of uplift for marker layers, we believe that the first fold belt has an obvious increase in its uplift rate by 7 cm of shortening, and the second fold belt increases its uplift at this time.
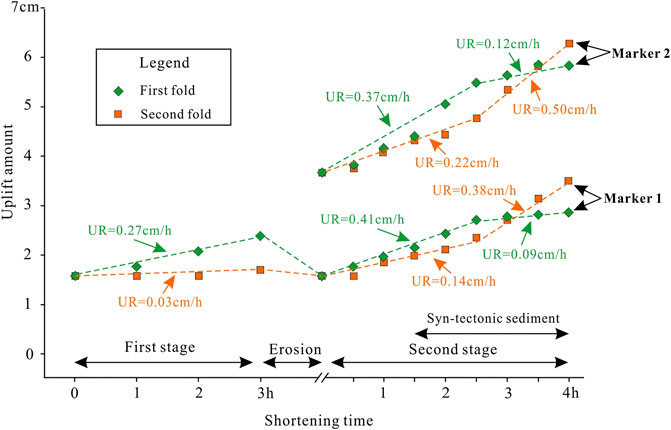
FIGURE 9. Uplift-shortening time curves during the two stages of the shortening experiment show the uplift rate (UR) of different folds and different layers (Markers one and two located below and above silicone, see Figure 8). As in the first stage, the uplift rate of the first fold is 0.27 cm/h. In the second stage, the first fold uplift rate is 4.1 cm/h at the first 2.5 h and falls to 0.09 cm/h.
Discussion
The local lows in terms of its resistivity in the Lower Jurassic within the Tugulu anticline as well as the seismic reflector characteristics represent the Early Jurassic extensional features (Figure 3). These extensional features in previous data (Li et al., 2011) were not as clear as recently collected and processed data. A thrust ramp in the deeper level was initiated at the edge of the fixed rigid plastic sheets, representing the half-graben boundary (Ma et al., 2019).
The Late Jurassic shortening could be caused by the formation of the Qiangtang block when smaller blocks collided (Hendrix et al., 1992; Zhang et al., 1999; Chen et al., 2002), or it could be caused by the Mesozoic sinistral rotation of the Junggar Basin (Yu et al., 2016). The extent of this Late Jurassic shortening in the Junggar basin still needs to be studied as we do not know if there is any further shortening toward the north outside the Tugulu anticline.
These sandbox modeling experiments helps us better understand the evolution history of the SJ-FTB since the Early Jurassic. Though we did not simulate formation of the half-grabens before the superimposed shortening, the boundary of the rigid plastic sheet can act as velocity discontinuity simulating the half-graben that generated in the Early Jurassic. Some limitations of our experiments include not considering the effect of pore fluid pressure and the absence of thermal gradients with depth. Pore fluid pressure, in particular, may exert an important control on brittle fault reactivation (Sibson, 1985; Etheridge, 1986).
Mode and intensity of inversion are related to a number of factors, including the strike and dip of the preexisting normal faults, angle of shortening relative to the trend of the preexisting faults, stratigraphic properties, spacing of the normal faults, time lapse since extension, and the amount of contraction relative to extension (Bonini et al., 2012). Thrust ramp localization over preexisting normal faults is formerly recognized in other inversion tectonics (Butler, 1989; Hayward and Graham, 1989; Tavarnelli, 1996; Pace and Calamita., 2014, 2015; Calamita et al., 2018; Shi et al., 2019). And model results in this study show that the Lower Jurassic extensional structures in the Junggar Basin act as nucleation for the thrusts formed during the Late Jurassic and Cenozoic compression.
During our experiment, the first 3 cm of shortening represents the Late Jurassic deformation of the Southern Junggar Basin. The deformed model then got eroded and covered by the shallower sediments, representing the formation of the unconformity surface between Jurassic and Cretaceous. The shortening phase of 3–11 cm corresponds to the Late Cenozoic deformation in our study area in which we also included the syn-depositional sediments in our sandbox experiment. Our final model result resembles what we observe from the seismic profile, validating our proposal of two stages of deformation in the region.
Based on the interpretations of the seismic profiles and field outcrops as well as our sandbox modeling result, we establish the structural evolution of the Southern Junggar Basin since the Early Jurassic (Figure 10). During the Early Jurassic, multiple extensional grabens existed in the region, leading to the wedge shape of the Lower Jurassic sediments. By the Late Jurassic, regional compression led to the uplift of the Qigu anticline belt, and those Lower Jurassic syn-tectonic sediments serve as a detachment layer, transferring the deformation into the interior of the basin. The HMT region, which has some weak zones due to the presence of the older normal fault, deformed into the HMT anticline belt. During the Cretaceous and Paleogene, this region was mostly stable and received sediments of similar thickness. By the Neogene, the Southern Junggar Basin reactivated, further uplifting the Qigu anticline belt, and displacement got transferred to the HMT anticline belt along the Lower Jurassic detachment, forming the wedge structures. The intense shortening during the Quaternary uplifted again the Qigu anticline, and extra displacement fed into the HMT anticline belt along the shallower Anjihaihe Formation (E2-3a) detachment, forming the shallower thrust faults, which superimposed over the initial HMT anticlines.
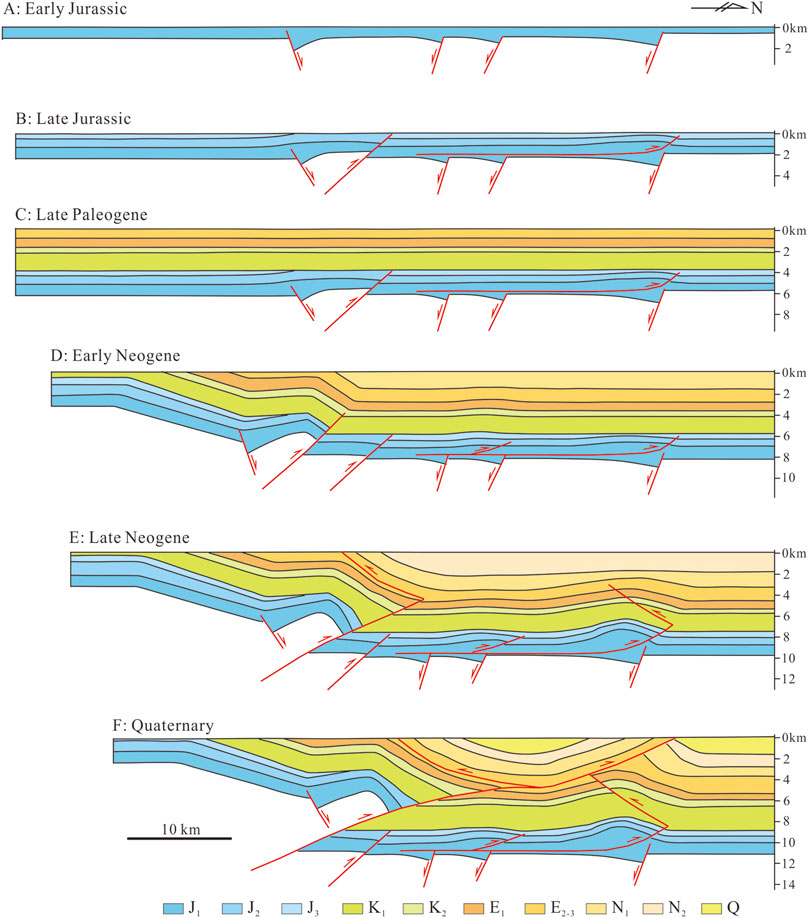
FIGURE 10. Structural evolution of the Southern Junggar fold-and-thrust belt. The first compressional stage occurred in the Late Jurassic (B), and the second compressional stage occurred in the Late Cenozoic (D–F).
Conclusion
We draw the following conclusions from our study:
1) We identified the deep buried extensional grabens in the Southern Junggar fold-and-thrust belt and the well-preserved angular unconformity between the Jurassic and Cretaceous in the Qigu and Tugulu anticlines.
2) Our sandbox modeling using two stages of shortening reveals a similar result to the current Southern Junggar Basin, which further demonstrates that the SJ-FTB formed as a result of the two stages of compressional deformation.
3) During the Late Jurassic, the Southern Junggar Basin margin started to experience compressional deformation, leading to the formation of the Qigu and Tugulu anticlines. During the Cenozoic, the SJ-FTB reactivated intensively, further uplifting the Qigu antinline and forming the deeper wedge structures as well as the shallower thrust in the Tugulu anticline.
Data Availability Statement
The original contributions presented in the study are included in the article/supplementary material, further inquiries can be directed to the corresponding author.
Author Contributions
DM: Conceptualization, Methodology, Sandbox modeling, Validation, Formal analysis, Investigation, Resources, Writing—original draft, Writing—review, and editing. JY: Resources, Writing—review, and editing, Supervision, Project administration, Funding acquisition. YS: original draft, Writing—review, and editing. HW: Resources, Writing—review, and editing, Supervision, Project administration, Funding acquisition. DH: Conceptualization, Methodology, Writing—review, and editing. YW: Conceptualization. SP: Resources, Writing—review, and editing, Supervision, Project administration, Funding acquisition. JC: Conceptualization, Methodology, Sandbox modeling, Writing—review, and editing.
Funding
This study has been supported by National Science and Technology Major Project (2016ZX05003).
Conflict of Interest
Authors DM, JY, HW, YW, and SP were employed by the company PetroChina.
The remaining authors declare that the research was conducted in the absence of any commercial or financial relationships that could be construed as a potential conflict of interest.
The reviewer KC declared a shared affiliation with one of the authors, DH, to the handling editor at time of review
Publisher’s Note
All claims expressed in this article are solely those of the authors and do not necessarily represent those of their affiliated organizations, or those of the publisher, the editors and the reviewers. Any product that may be evaluated in this article, or claim that may be made by its manufacturer, is not guaranteed or endorsed by the publisher.
Acknowledgments
Special thanks to Dong Jia and Xiaojun Wu for very helpful discussion of the early draft, and to Wenqiang Liu and Xiaogen Fan for their help during the experiments.
References
Allen, M. B., Windley, B. F., and Zhang, C. (1993). Palaeozoic Collisional Tectonics and Magmatism of the Chinese Tien Shan, central Asia. Tectonophysics 220, 89–115. doi:10.1016/0040-1951(93)90225-9
Allen, M. B., ªengör, A. M. C., and Natal’In, B. A. (1995). Junggar, Turfan and Alakol Basins as Late Permian to ?Early Triassic Extensional Structures in a Sinistral Shear Zone in the Altaid Orogenic Collage, Central Asia. J. Geol. Soc. 152, 327–338. doi:10.1144/gsjgs.152.2.0327
Avouac, J. P., Tapponnier, P., Bai, M., You, H., and Wang, G. (1993). Active Thrusting and Folding along the Northern Tien Shan and Late Cenozoic Rotation of the Tarim Relative to Dzungaria and Kazakhstan. J. Geophys. Res. 98, 6755–6804. doi:10.1029/92jb01963
Bonini, M., Sani, F., and Antonielli, B. (2012). Basin Inversion and Contractional Reactivation of Inherited normal Faults: A Review Based on Previous and New Experimental Models. Tectonophysics 522-523, 55–88. doi:10.1016/j.tecto.2011.11.014
Burchfiel, B. C., Brown, E. T., Qidong, D., Xianyue, F., Jun, L., Molnar, P., et al. (1999). Crustal Shortening on the Margins of the Tien Shan, Xinjiang, China. Int. Geology. Rev. 41, 665–700. doi:10.1080/00206819909465164
Bureau of Geological and Mineral Resources of the Xinjiang Uygur Autonomous Region (1985). Geological Map of the Xinjiang Uygur Autonomous Region. ChinaBeijing: China Geological Printing House.
Butler, R. W. H. (1989). The Influence of Pre-existing basin Structure on Thrust System Evolution in the Western Alps. Geol. Soc. Lond. Spec. Publications 44, 105–122. doi:10.1144/gsl.sp.1989.044.01.07
Byerlee, J. (1978). Friction of Rocks, Rock Friction and Earthquake Prediction. Springer, 615–626. doi:10.1007/978-3-0348-7182-2_4
Calamita, F., Di Domenica, A., and Pace, P. (2018). Macro- and Meso-Scale Structural Criteria for Identifying Pre-thrusting normal Faults within Foreland Fold-And-Thrust Belts: Insights from the Central-Northern Apennines (Italy). Terra Nova 30, 50–62. doi:10.1111/ter.12307
Charreau, J., Avouac, J.-P., Chen, Y., Dominguez, S., and Gilder, S. (2008). Miocene to Present Kinematics of Fault-bend Folding across the Huerguosi Anticline, Northern Tianshan (China), Derived from Structural, Seismic, and Magnetostratigraphic Data. Geol. 36, 871–874. doi:10.1130/g25073a.1
Charreau, J., Kent-Corson, M. L., Barrier, L., Augier, R., Ritts, B. D., Chen, Y., et al. (2012). A High-Resolution Stable Isotopic Record from the Junggar Basin (NW China): Implications for the Paleotopographic Evolution of the Tianshan Mountains. Earth Planet. Sci. Lett. 341-344, 158–169. doi:10.1016/j.epsl.2012.05.033
Charvet, J., Shu, L., Laurent-Charvet, S., Wang, B., Faure, M., Cluzel, D., et al. (2011). Palaeozoic Tectonic Evolution of the Tianshan belt, NW China. Sci. China Earth Sci. 54, 166–184. doi:10.1007/s11430-010-4138-1
Chen, X., Lu, H., Shu, L., Wang, H., and Zhang, G. (2002). Study on Tectonic Evolution of Junggar Basin. Geol. J. China Universities 8 (3), 257–266.
Daëron, M., Avouac, J.-P., and Charreau, J. (2007). Modeling the Shortening History of a Fault Tip Fold Using Structural and Geomorphic Records of Deformation. J. Geophys. Res. Solid Earth 112. doi:10.1029/2006jb004460
De Grave, J., Buslov, M. M., and Van Den Haute, P. (2007). Distant Effects of India-Eurasia Convergence and Mesozoic Intracontinental Deformation in Central Asia: Constraints from Apatite Fission-Track Thermochronology. J. Asian Earth Sci. 29, 188–204. doi:10.1016/j.jseaes.2006.03.001
Deng, Q., Feng, X., Zhang, P., Yang, X., Xu, X., Peng, S., et al. (1999). Reverse Fault and Fold Zone in the Urumqi Range-Front Depression of the Northern Tianshan and its Genetic Mechanism. Earth Sci. Front. 6, 191–201.
Dumitru, T. A., Zhou, D., Chang, E. Z., Graham, S. A., Hendrix, M. S., Sobel, E. R., et al. (2001). “Uplift, Exhumation, and Deformation in the Chinese Tian Shan,” in Paleozoic and Mesozoic Tectonic Evolution of Central and Eastern Asia: From Continental Assembly to Intracontinental Deformation. Editors M. S. Hendrix, and G. A. Davis (Boulder, Colorado: Geological Society of America Memoir), 194, 71–99. doi:10.1130/0-8137-1194-0.71
Etheridge, M. A. (1986). On the Reactivation of Extensional Fault Systems. Phil. Trans. R. Soc. Lond. A. 317, 179–194. doi:10.1098/rsta.1986.0031
Fang, S., Jia, C., Song, Y., Guo, Z., Yuan, S., and Wang, X. (2007). Meso-Cenozoic Tectonic Events and Structural Constraints in the Southern Junggar basin: Evidence from Detrital Compositions. Chin. J. Geology 42 (4), 753–765.
Gao, J., Li, M., Xiao, X., Tang, Y., and He, G. (1998). Paleozoic Tectonic Evolution of the Tianshan Orogen, Northwestern China. Tectonophysics 287, 213–231. doi:10.1016/s0040-1951(97)00211-4
Guan, S., Stockmeyer, J. M., Shaw, J. H., Plesch, A., and Zhang, J. (2016). Structural Inversion, Imbricate Wedging, and Out-Of-Sequence Thrusting in the Southern Junggar Fold-And-Thrust belt, Northern Tian Shan, China. Bulletin 100, 1443–1468. doi:10.1306/04041615023
Guo, Z., Zhang, Z., Wu, C., Fang, S., and Zhang, R. (2006). The Mesozoic and Cenozoic Exhumation History of Tianshan and Comparative Studies to the Junggar and Altai Mountains Acta Geologica Sinica 80 (1), 1–15.
Hayward, A. B., and Graham, R. H. (1989). Some Geometrical Characteristics of Inversion. Geol. Soc. Lond. Spec. Publications 44, 17–39. doi:10.1144/gsl.sp.1989.044.01.03
Hendrix, M. S., Dumitru, T. A., and Graham, S. A. (1994). Late Oligocene-Early Miocene Unroofing in the Chinese Tian Shan: An Early Effect of the India-Asia Collision. Geol. 22, 487–490. doi:10.1130/0091-7613(1994)022<0487:loemui>2.3.co;2
Hendrix, M. S., Graham, S. A., Carroll, A. R., Sobel, E. R., Mcknight, C. L., Schulein, B. J., et al. (1992). Sedimentary Record and Climatic Implications of Recurrent Deformation in the Tian Shan: Evidence from Mesozoic Strata of the north Tarim, South Junggar, and Turpan Basins, Northwest China. GSA Bull. 104, 53–79. doi:10.1130/0016-7606(1992)104<0053:sracio>2.3.co;2
Hubbert, M. K. (1937). Theory of Scale Models as Applied to the Study of Geologic Structures. Geol. Soc. America Bull. 48, 1459–1520. doi:10.1130/gsab-48-1459
Jolivet, M., Dominguez, S., Charreau, J., Chen, Y., Li, Y., and Wang, Q. (2010). Mesozoic and Cenozoic Tectonic History of the central Chinese Tian Shan: Reactivated Tectonic Structures and Active Deformation. Tectonics 29. doi:10.1029/2010tc002712
Koyi, H. A., and Sans, M. (2006). “Deformation Transfer in Viscous Detachments: Comparison of Sandbox Models to the South Pyrenean Triangle Zone,” in Analogue and Numerical Modelling of Crustal-Scale Processes. Editors S. J. H. Buiter, and G. Schreurs. (London: Geological Society, London, Special Publications). doi:10.1144/gsl.sp.2006.253.01.06
Koyi, H. A., and Cotton, J. (2004). Experimental Insights on the Geometry and Kinematics of Fold-And-Thrust Belts above Weak, Viscous Evaporitic Décollement; a Discussion. J. Struct. Geology 26, 2139–2141. doi:10.1016/j.jsg.2004.04.001
Koyi, H. A., Ghasemi, A., Hessami, K., and Dietl, C. (2008). The Mechanical Relationship between Strike-Slip Faults and Salt Diapirs in the Zagros Fold-Thrust belt. J. Geol. Soc. 165, 1031–1044. doi:10.1144/0016-76492007-142
Krantz, R. W. (1991). Measurements of Friction Coefficients and Cohesion for Faulting and Fault Reactivation in Laboratory Models Using Sand and Sand Mixtures. Tectonophysics 188, 203–207. doi:10.1016/0040-1951(91)90323-k
Li, C., Guo, Z., and Dupont-Nivet, G. (2011). Late Cenozoic Tectonic Deformation across the Northern Foreland of the Chinese Tian Shan. J. Asian Earth Sci. 42, 1066–1073. doi:10.1016/j.jseaes.2010.08.009
Li, Z., and Chen, G. (1998). Discussion on the Extensional Dynamic Setting in the South Border of Junngar basin, Xinjiang, China. Geol. J. China Universities 4 (1), 73–78. doi:10.1007/bf02891489
Li, Z., Chen, W., Jia, D., Sun, C., Zheng, W., Zhang, P., et al. (2020). The Effects of Fault Geometry and Kinematic Parameters on 3D Fold Morphology: Insights from 3D Geometric Models and Comparison with the Dushanzi Anticline, China. Tectonics 39, e2019TC005713. doi:10.1029/2019tc005713
Li, Z., and Peng, S. (2013). U-pb Geochronological Records and Provenance System Analysis of the Mesozoic-Cenozoic sandstone Detrital Zircons in the Northern and Southern Piedmonts of Tianshan,Northwest China: Responses to Intracontinental basin-range Evolution. Acta Petrologica Sinica 29 (3), 739–755.
Liu, H., Wang, Z., Xiong, B., Li, Y., Liu, L., and Zhang, J. (2000). Coupling Analysis of Mesozoic-Cenozoic Foreland basin and Mountain System in central and Western China. Earth Sci. Front. 7 (3), 55–72.
Lu, H., Burbank, D. W., Li, Y., and Liu, Y. (2010). Late Cenozoic Structural and Stratigraphic Evolution of the Northern Chinese Tian Shan Foreland. Basin Res. 22, 249–269. doi:10.1111/j.1365-2117.2009.00412.x
Lu, R., He, D., Xu, X., Wang, X., Tan, X., and Wu, X. (2018). Seismotectonics of the 2016 M 6.2 Hutubi Earthquake: Implications for the 1906 M 7.7 Manas Earthquake in the Northern Tian Shan Belt, China. Seismological Res. Lett. 89, 13–21. doi:10.1785/0220170123
Ma, D., Koyi, H. A., Yuan, J., He, D., Zhang, H., Wang, H., et al. (2019). The Role of Deep-Seated Half-Grabens in the Evolution of Huoerguosi-Manasi-Tugulu Fold-And-Thrust belt, Northern Tian Shan, China. J. Geodynamics 131, 101647. doi:10.1016/j.jog.2019.101647
Ma, D., Yuan, J., Zhang, H., He, D., Pan, J., Pan, S., et al. (2018). Deep Structure Analysis of Huoerguosi Anticline at the Southern Margin of Junggar Basin Based on High-Density Seismic Reflection and Sandbox Modeling. J. China Univ. Pet. 42 (6), 9–18.
Maillot, B., and Koyi, H. (2006). Thrust Dip and Thrust Refraction in Fault-bend Folds: Analogue Models and Theoretical Predictions. J. Struct. Geology 28, 36–49. doi:10.1016/j.jsg.2005.10.001
Nelson, M. R., Mccaffrey, R., and Molnar, P. (1987). Source Parameters for 11 Earthquakes in the Tien Shan, central Asia, Determined by P and SH Waveform Inversion. J. Geophys. Res. Solid Earth 92. doi:10.1029/jb092ib12p12629
Pace, P., and Calamita, F. (2015). Coalescence of Fault-bend and Fault-Propagation Folding in Curved Thrust Systems: an Insight from the Central Apennines, Italy. Terra Nova 27, 175–183. doi:10.1111/ter.12146
Pace, P., and Calamita, F. (2014). Push-up Inversion Structures V. Fault-bend Reactivation Anticlines along Oblique Thrust Ramps: Examples from the Apennines Fold-And-Thrust belt (Italy). J. Geol. Soc. 171, 227–238. doi:10.1144/jgs2013-053
Panien, M., Schreurs, G., and Pfiffner, A. (2005). Sandbox Experiments on basin Inversion: Testing the Influence of basin Orientation and basin Fill. J. Struct. Geology 27, 433–445. doi:10.1016/j.jsg.2004.11.001
Ramberg, H. (1981). Gravity, Deformation and the Earth's Crust in Theory, Experiments and Geological Application. London: Academic Press.
Shi, G., Shen, C., Zattin, M., Wang, H., Yang, C., and Liang, C. (2019). Late Cretaceous-Cenozoic Exhumation of the Helanshan Mt Range, Western Ordos Fold-Thrust belt, China: Insights from Structural and Apatite Fission Track Analyses. J. Asian Earth Sci. 176, 196–208. doi:10.1016/j.jseaes.2019.02.016
Sibson, R. H. (1985). A Note on Fault Reactivation. J. Struct. Geology 7, 751–754. doi:10.1016/0191-8141(85)90150-6
Sun, J., Zhu, R., and Bowler, J. (2004). Timing of the Tianshan Mountains Uplift Constrained by Magnetostratigraphic Analysis of Molasse Deposits. Earth Planet. Sci. Lett. 219, 239–253. doi:10.1016/s0012-821x(04)00008-1
Tapponnier, P., and Molnar, P. (1979). Active Faulting and Cenozoic Tectonics of the Tien Shan, Mongolia, and Baykal Regions. J. Geophys. Res. 84, 3425–3459. doi:10.1029/jb084ib07p03425
Tavarnelli, E. (1996). The Effects of Pre-existing normal Faults on Thrust Ramp Development: An Example from the Northern Apennines, Italy. Geol. Rundsch 85, 363–371. doi:10.1007/bf02422241
Wang, C., Yang, Z.-E., Luo, H., and Mooney, W. D. (2004). Crustal Structure of the Northern Margin of the Eastern Tien Shan, China, and its Tectonic Implications for the 1906 M?7.7 Manas Earthquake. Earth Planet. Sci. Lett. 223, 187–202. doi:10.1016/j.epsl.2004.04.015
Wang, X., Wang, X., and Ma, Y. (2007). Characteristics of Structure Transform Zones in the Fold-Thrust Belts on the Southern Margin of Junggar basin, Northwest China. Oil Gas Geology 28, 345–354.
Windley, B. F., Allen, M. B., Zhang, C., Zhao, Z.-Y., and Wang, G.-R. (1990). Paleozoic Accretion and Cenozoic Redeformation of the Chinese Tien Shan Range, central Asia. Geol. 18, 128–131. doi:10.1130/0091-7613(1990)018<0128:paacro>2.3.co;2
Xiao, W., Windley, B. F., Allen, M. B., and Han, C. (2013). Paleozoic Multiple Accretionary and Collisional Tectonics of the Chinese Tianshan Orogenic Collage. Gondwana Res. 23, 1316–1341. doi:10.1016/j.gr.2012.01.012
Xu, X., Liu, B., Xu, Q., Pan, G., Yan, Y., Wu, Y., et al. (1997). Analysis of Large-Scale Basins in West China and Their Geodynamic Characteristics. Beijing: Geological Publishing House, 16–37.
Yang, W., Jolivet, M., Dupont-Nivet, G., Guo, Z., Zhang, Z., and Wu, C. (2013). Source to Sink Relations between the Tian Shan and Junggar Basin (Northwest China) from Late Palaeozoic to Quaternary: Evidence from Detrital U-Pb Zircon Geochronology. Basin Res. 25, 219–240. doi:10.1111/j.1365-2117.2012.00558.x
Yu, Y., Wang, X., Rao, G., and Wang, R. (2016). Mesozoic Reactivated Transpressional Structures and Multi-Stage Tectonic Deformation along the Hong-Che Fault Zone in the Northwestern Junggar Basin, NW China. Tectonophysics 679, 156–168. doi:10.1016/j.tecto.2016.04.039
Zhang, G., Chen, X., Liu, L., Yu, L., and Wang, Z. (1999). The Architecture of Junggar Basin and the Distribution of Oil and Gas fields. Acta Petrolei Sinica 1, 1–10.
Ziegler, P. A. (1989). Geodynamic Model for Alpine Intra-plate Compressional Deformation in Western and Central Europe. Geol. Soc. Lond. Spec. Publications 44, 63–85. doi:10.1144/gsl.sp.1989.044.01.05
Keywords: Tian Shan, southern Junggar, fold-and-thrust belt, sandbox modeling, structural evolution
Citation: Ma D, Yuan J, Sun Y, Wang H, He D, Wang Y, Pan S and Cui J (2021) Late Jurassic Structural Deformation and Late Cenozoic Reactivation of the Southern Junggar Fold-And-Thrust Belt, NW China. Front. Earth Sci. 9:664092. doi: 10.3389/feart.2021.664092
Received: 04 February 2021; Accepted: 12 August 2021;
Published: 14 September 2021.
Edited by:
Bernard Delcaillau, Université de Caen Normandie, FranceReviewed by:
Paolo Pace, G d’Annunzio University of Chieti and Pescara, ItalyGuanzhong Shi, China University of Geosciences Wuhan, China
Keda Cai, China University of Geosciences, China
Copyright © 2021 Ma, Yuan, Sun, Wang, He, Wang, Pan and Cui. This is an open-access article distributed under the terms of the Creative Commons Attribution License (CC BY). The use, distribution or reproduction in other forums is permitted, provided the original author(s) and the copyright owner(s) are credited and that the original publication in this journal is cited, in accordance with accepted academic practice. No use, distribution or reproduction is permitted which does not comply with these terms.
*Correspondence: Delong Ma, emhlbm1hZGVsb25nQDEyNi5jb20=