 Thomas R. Baird1*
 Charles S. Bristow2
 Wanyin Luo3
 Erji Du3
 Robert G. Bryant4
 Thomas M. Mitchell1Pieter Vermeesch1
- 1Department of Earth Sciences, University College, London, United Kingdom
- 2Earth and Planetary Sciences, Birkbeck, University of London, London, United Kingdom
- 3Northwest Institute of Eco-Environment and Resources, Chinese Academy of Sciences, Lanzhou, China
- 4Department of Geography, University of Sheffield, Sheffield, United Kingdom
The Gonghe Basin on the Qinghai-Tibet Plateau has a cold, arid climate and has suffered severe land degradation. Climate change as well as anthropogenic activities including overgrazing have resulted in widespread blowout development and the formation of some of Earth’s largest blowouts. The blowouts are part of an aeolian dominated landscape that passes from deflation zone to grass covered plain, and then through blowouts of increasing size and complexity to transverse barchanoid dunes that are migrating into the valley of the Yellow River. A combination of structure-from-motion (SfM) optical drone mapping, ground-penetrating radar (GPR) and soil pits are used to investigate blowout scour hollows and depositional lobes. Comparisons of the volumes of sediment removed from the scour hollows with the volumes of sediment deposited within adjacent lobes varies between sites. The lobe volume is invariably less than the volume of the scour hollow. This can, in part, be attributed to aeolian reworking of the lobe, distributing sand further downwind and uplifting of dust. However, much of the difference in volumes between the scour and lobe can be attributed to the measurement technique, particularly where GPR was employed to calculate lobe volumes. The wavelength of the GPR limits its ability to resolve thin layers of sand resulting in an underestimate of the deposited sand at the margins of a lobe where the sand thickness is equal to, or less than, the wavelength of the GPR. For thin sand layers, beneath the resolution of the GPR, soil pits suggest a closer match between the volume of sand eroded from the scour and the volume of the lobe, albeit with large measurement uncertainty. We put forth two hypotheses to explain the spatio-temporal evolution of the blowout dune field. The downwind increase in blowout dune size could either reflect a downwind propagation of aeolian instability; or it could result from an upwind propagation of the instability, which started at the highest points in the landscape and has subsequently migrated in a northwesterly direction, towards lower elevations. Recent optically stimulated luminescence dating appear to support the latter hypothesis.
1 Introduction
Blowouts are aeolian features consisting of an erosional depression and an associated downwind depositional lobe or apron. They play a critical role in diagnosing landscape changes, acting as an initial source of sand in reactivating dune fields as well as supplying sediment to downwind features (Barchyn and Hugenholtz, 2013). Blowouts are found in coastal, semi-arid, sandy grassland, and desert landscapes (Hugenholtz and Wolfe, 2006; Hesp and Walker, 2012) and are found across the world, including Europe (van Boxel et al., 1997; Käyhkö, 2007; Gonzlez-Villanueva et al., 2013; Smyth et al., 2013; García-Romero et al., 2019), North America (Fox et al., 2012; Abhar et al., 2015; Garès and Pease, 2015), Africa (Lancaster, 1986), and Asia (Sun et al., 2016; Kang et al., 2017; Luo et al., 2019a). Blowout morphology varies, with scour hollows being classified as saucer, bowl, or trough-shaped and the eroded sediment deposited immediately downwind as either a large lobe or a thinly spread layer of sediment called an apron (Smyth et al., 2020).
Blowouts develop when a stabilised dune’s surface is disturbed, exposing the underlying sand to wind erosion. A positive feedback mechanism is then initiated with the reduction in surface roughness facilitating an increase in wind velocity, allowing for further aeolian deflation to occur (Hesp and Walker, 2012). Additional erosion and subsequent destabilisation of the surface, including any anchorage vegetation, then leads to further reductions in surface roughness, and an increasing rate of deflation. Over time, a small area of exposed sand may erode to form a large hollow, supplying sediment to the downwind environment (Luo et al., 2019a). Once initiated, the positive feedback mechanism is self-sustaining and can continue even if conditions are no longer conducive to blowout initialisation (Käyhkö, 2007). Subsequent morphologic development can be restricted by physical characteristics such as the size of the original stabilised dune, a layer of calcrete, or an armoured surface (Hesp, 2002). Seasonal changes, such as the height of the water table, surface moisture levels, or the magnitude and direction of prevailing winds, can also limit blowout development (Hugenholtz and Wolfe, 2006; Davidson-Arnott et al., 2008; Hesp and Walker, 2012). Blowout stabilization requires primary succession of pioneer flora to re-establish vegetation cover, mitigating blowout development by increasing surface roughness and decreasing bed shear stress (Schwarz et al., 2018).
The initial exposure of underlying sediment to wind erosion can occur through natural processes as well as anthropogenic activity. Natural factors which lead to blowout formation include coastal wave erosion, storm events, vegetation cover change, and increased wind speeds (Barchyn and Hugenholtz, 2013; Smyth et al., 2013; Hesp et al., 2016). Biotic factors associated with the grazing pressures from wild fauna, such as rabbits and bison, have also been found to influence blowout formation (van Boxel et al., 1997; Drees and Olff, 2001; Fox et al., 2012). Natural processes may occur seasonally, with reduced efficacy in months with more precipitation or a weaker wind regime (Gonzlez-Villanueva et al., 2013; Abhar et al., 2015). In addition, anthropogenic activities can cause blowout initiation through direct and indirect actions. Off-road vehicle disturbance, pathway trampling, and poor land-use practices can remove anchorage vegetation facilitating blowout genesis (Hesp et al., 2010; Acosta et al., 2013; Houser et al., 2013; Jewell et al., 2014). Pastoral farming poses a dual threat of increased grazing pressures as well as high-intensity trampling involved with moving livestock between paddocks (Blanco et al., 2008; van der Hagen et al., 2020). Indirectly, infrastructure projects and urbanisation may also divert wind patterns, changing the spatiality of sand transport mechanisms and influencing the formation of deflation landforms (García-Romero et al., 2019; Wernette et al., 2020). Abiotic and biotic factors rarely work independently (Corenblit et al., 2015). As such, blowout initiation may be exacerbated by a number of processes at any given study location.
Measuring up to 40 m deep and 1,000 m long (Luo et al., 2019a), the blowouts in Gonghe Basin, Qinghai-Tibet Plateau (QTP) distinguish themselves from previously studied, smaller features in other parts of the world (Hugenholtz and Wolfe, 2006). In comparison to their coastal counterparts, the mega-blowouts of the QTP defy conventional models of blowout development, exceeding a size in which coastal blowouts would tend towards stabilisation (Hugenholtz and Wolfe, 2009). Yet the scarcity of detailed morphological investigations into blowouts on the QTP means that much remains unknown about these mega features. Of particular interest is the difference in volume between the depositional lobes and erosional scour hollows. An inequality in their mass balance would quantify the amount of sediment lost to the surrounding area. This is either as a fine layer extending beyond the depositional lobe or as atmospherically entrained dust.
In this paper we present morphometrics and a mass balance for a range of blowouts on the QTP. An innovative methodology which combines ground-penetrating radar (GPR) surveys, Structure-from-Motion (SfM) modeling from optical drone footage, and geospatial analysis is used to determine a mass balance between the erosional hollow and depositional lobe of three blowouts. A further two compound mega-blowouts are also assessed. Such quantifications are vital to address both the lack of detailed morphometrics for the full range of blowout features and the lack of parametrization in sediment reactivation processes. This research focuses on the Gonghe Basin on the QTP, but the concepts and methodology can be applied elsewhere.
2 Study Site
The Gonghe Basin on the QTP in China is an important region for agriculture, pastoral farming, and power production. The semi-arid steppe is comprised of grassland, farmland, and semi-shifting dunes (Zhang et al., 2003; Yu and Jia, 2014). In recent years, the cold alpine desert region of the Gonghe Basin has experienced severe land degradation from anthropogenic activities and local climatic warming (Wang et al., 2017). Aeolian sand reactivation, predominantly from wind erosion, has substantially eroded cultivated farmlands (Dong et al., 1993; Zhang et al., 2003) and proceeds to threaten downwind infrastructure projects from the risk of sand encroachment. Of particular note, the Longyangxia Dam and Solar Power Park are located downwind from such eroded farmlands in Gonghe Basin. Attempts have been made to reduce soil degradation by enclosing grasslands with fencing; however, unprotected areas remain overgrazed and the basin continues to be cultivated (Zhang et al., 2003). The threat of further wind erosion is therefore still present. Despite this, the morphology, distributions, and impacts of wind erosion and blowout development in the Gonghe Basin remains a largely understudied phenomena (Luo et al., 2019a).
The mega-blowouts of the QTP are some of the largest on Earth (Luo et al., 2020) and are themselves part of a wider sand flow system from the Gonghe Basin to the Yellow River valley. The Gonghe Basin (Figure 1) covers an area of 13,800 km2 (Liu et al., 2013) and is a northeast to southwest aligned endorheic basin flanked by the Qinghai Nanshan mountains to the north and the Wahongshan Mountains to the south. There is a remarkable coincidence between the orientation of the valley, the mountains on either side, and the winds. Winds blowing along the axis of the basin have caused widespread erosion (Zhang et al., 2003; Luo et al., 2019a). Sand deflated from the valley has accumulated at the downwind end of the valley forming a gently inclined plain that rises around 450 m over 50 km, a gradient of about 1:100, before descending very steeply into the valley of the Yellow River that is around 620 m deep. Across much of the plain the sand-covered slope is vegetated and described as an “alpine meadow” (Yu et al., 2017). The topography includes northeast to southwest elongated ridges of sand that are possibly vegetated linear dunes.
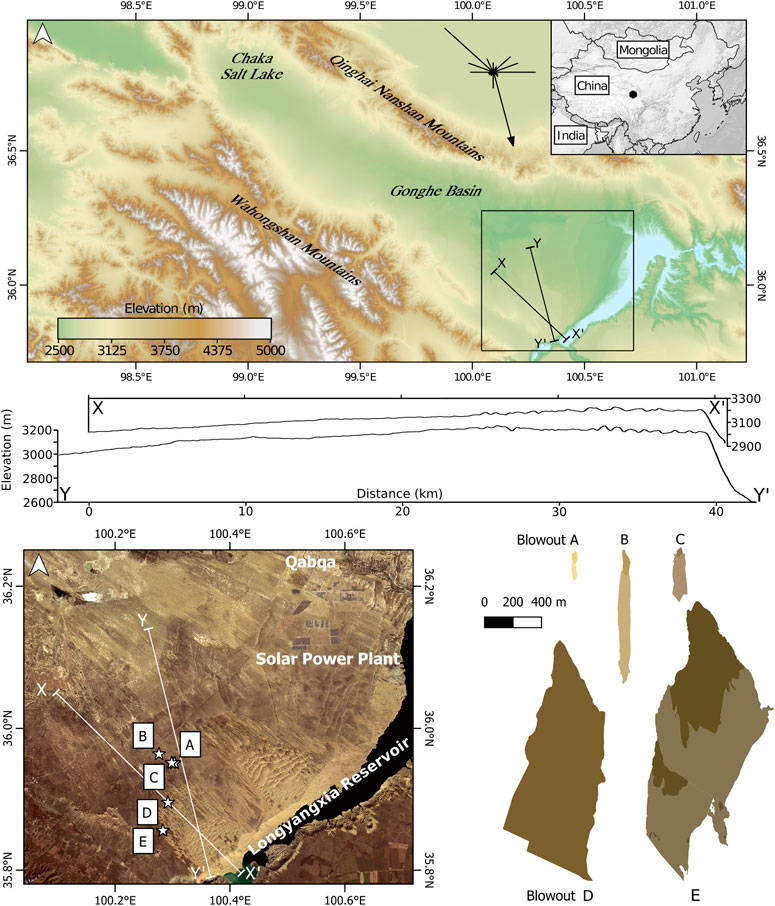
FIGURE 1. The geographic setting, location, and relative scale of the studied blowout features in Gonghe Basin, Qinghai-Tibet Plateau, China. The presence of upwind blowouts and downwind mobile sand dunes shows clear evidence of dune reactivation. Topographic profile X–X′ is parallel to the direction of net sand transport, which is perpendicular to the orientation of the transverse dune field at the highest point of the plateau. Topographic profile Y–Y′ is parallel to the average wind direction (wind rose from Zhang et al., 2003).
The Gonghe Basin experiences average annual temperatures of 2.4—4.1°C and an annual average precipitation of 314.3—414.8 mm (Liu et al., 2013). Approximately 80% of this rainfall occurs between June and September (Yu and Jia, 2014; Yu et al., 2017). Vegetation cover during this wet season increases to a maximum of 20% but remains below 5% during the rest of the year (Wang et al., 2018). The cold alpine desert region in the northeastern QTP is an unusual aeolian environment due to its low temperature and low air pressure (Lu et al., 2005). Sitting at 3750 m above sea level and at the intersection of the westerlies wind belt, Asian, and Indian monsoon, the fragile ecosystem is extremely sensitive to global climate change (Qiang et al., 2016; Luo et al., 2019b). Strong northerly and northwest winds of up to 40 ms−1 occur from February to May (Qiang et al., 2013) with average annual speeds ranging from 2.1–2.7 ms−1 (Yan and Shi, 2004; Yu and Jia, 2014).
The Longyangxia Power Park is located within the Basin and is comprised of a hydroelectric dam and a solar power farm. It was the largest photovoltaic power station in the world until 2017 (Gautam et al., 2017) and generates an average of 5.94 GW h hydroelectric power and 0.48 GW h photovoltaic power a year (An et al., 2015). Aeolian sediment transport in the basin poses three main threats to the Longyangxia Power Park, including the burial of solar panels, obscuration of solar panels by dust, and the in-filling of the Longyangxia Dam Reservoir.
Five blowouts were surveyed in the Gonghe Basin (Table 1), located approximately 50 km south-west of Qabqa, Gonghe County, Qinghai Province (Figure 1). Blowouts A, B, and C are located within grazed pastures. Vehicular disturbance and animal activity in the area contribute heavily to blowout initiation. Access to the gated pastures intensifies trampling pressures at egresses and channels vehicles through corridors between paddocks. Additionally, small depressions in the landscape are used by cattle, either for shelter of dust bathing, causing similar fauna pressures on the landscape to those described in Canadian prairies by Fox et al. (2012). Downwind, the size of the blowouts increases until the sand cover increases to form a field of transverse and barchanoid dunes that migrate into the valley of the Yellow River. The larger, more complex blowouts D and E are close to the interface between the blowouts and the active sand dunes and appear to be developed within vegetation-stabilised parabolic dunes. Blowouts B, D, and E were previously studied by Luo et al. (2019a), who looked at their development and growth from 1967 to 2015 with historical satellite imagery, and monitored the expansion of their erosional hollows with annual surveys from 2015 to 2018 as well as drone images (Luo et al., 2020). Here we present updated morphometrics for these blowouts using finer-resolution DEM reconstructions and imaging of the internal structures within depositional lobes. The five blowouts exemplify the range of features found in the Gonghe Basin and are discussed in order of ascending complexity.

TABLE 1. Location of the studied blowout features (centroid of the erosional hollow).
3 Methodology
This study employs an innovative combination of surface and subsurface imaging. SfM optical drone mapping was combined with GPR surveys to provide a high-resolution, non-invasive approach that leaves the fragile landscape undisturbed. We extend the technical work of Luo et al. (2020) to provide geomorphometry and geospatial analysis of the Gonghe Basin using a consistent suit of SfM data. The fieldwork for this study was conducted in July 2018.
Two Phantom four drones were used to survey the full extent of the blowouts. Images were first collected at nadir angles with additional images then captured inside the scour hollows to ensure lateral coverage. A Digital Elevation Model (DEM) and ortho-mosaic were created for each blowout feature using the established SfM approach within Agisoft Photoscan Professional Edition (Scarelli et al., 2016; Lin et al., 2019). Firstly, the optical drone images were aligned and a dense point cloud calculated. Outlying points within the dense clouds were removed manually and a mesh built from the cleaned dataset. This mesh was converted into a DEM and an orthorectified true colour composite texture of the optical drone images was created. Ground control points were recorded using a differential GPS, allowing the SfM data to be precisely georeferenced. Flight details and DEM reconstruction metrics are listed in the Supplementary Material (Supplementary Table S4). The three-dimensional models of the study areas were then used to determine the erosional hollow boundary and lobe extent for each blowout feature where it could be discerned. The elevation of the erosional hollow boundary was sampled at 0.2 m intervals and an original surface interpolated using ordinary kriging. This surface was differenced from the DEM to determine the volume of the erosional hollow.
GPR surveys have been successfully conducted to investigate the internal structure of aeolian features (Hugenholtz et al., 2008; Bristow et al., 2010), but relatively few studies have combined the technique with remote sensing to analyse blowout features (Neal and Roberts, 2001; González-Villanueva et al., 2011; Jewell et al., 2017). The low conductivity of sand and large-scale structures contained within aeolian features lend themselves well to GPR surveys (Bristow, 2009) which use the transmission of high-frequency electromagnetic fields to image subsurface structures. The GPR profiles within this paper were collected using 200 MHz antennas, a step size of 0.2 m, and an antenna separation of 1 m. CMP surveys indicated a velocity of 0.08 mns−1, that of damp sand. This corresponds well with field observations as short rainfall events occurred frequently throughout the duration of the fieldwork. Similar to the drone mapping, a differential GPS was used to precisely co-locate the GPR survey transects. Topographic corrections were reconstructed from the SfM-determined DEMs. Where a depositional lobe was evident, its depth was traced and extracted at the same resolution as the step size (0.2 m). Ordinary kriging was then used to interpolate a basal surface of the lobe, which was subtracted from the DEM to determine lobe volume.
The uncertainty of the volumetric calculations was determined by the GPR parameters. The signal had a wavelength of 0.4 m, and thus a resolution one quarter that of the wavelength, 0.1 m. The volumetric uncertainty (m3) was therefore calculated by multiplying the area of the lobe footprint (m2) by ±0.05 m.
4 Ground-Penetrating Radar Image Analysis
Interpretation of the GPR profiles follows the radar stratigraphy and radar facies methodology (Gawthorpe et al., 1993; Neal and Roberts, 2001; Jol and Bristow, 2003), where reflections on the GPR profile are interpreted as stratigraphic horizons and reflection terminations mark breaks in deposition or truncation due to erosion. The top of the soil horizon at the base of the lobe forms a continuous high-amplitude sub-horizontal reflection at Blowout A (Figures 2, 3).
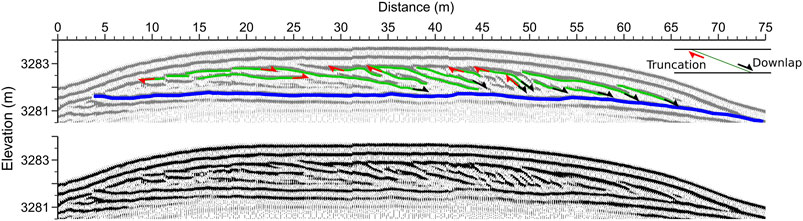
FIGURE 2. A ground-penetrating radar transect bisecting the depositional lobe of Blowout A from NW to SE. The vertical axis is exaggerated by a factor of 2.5. The extracted base is denoted by the thicker blue line and interpretations of the internal bounding surfaces are shown by thinner green lines. The uninterpreted GPR survey is shown for reference.
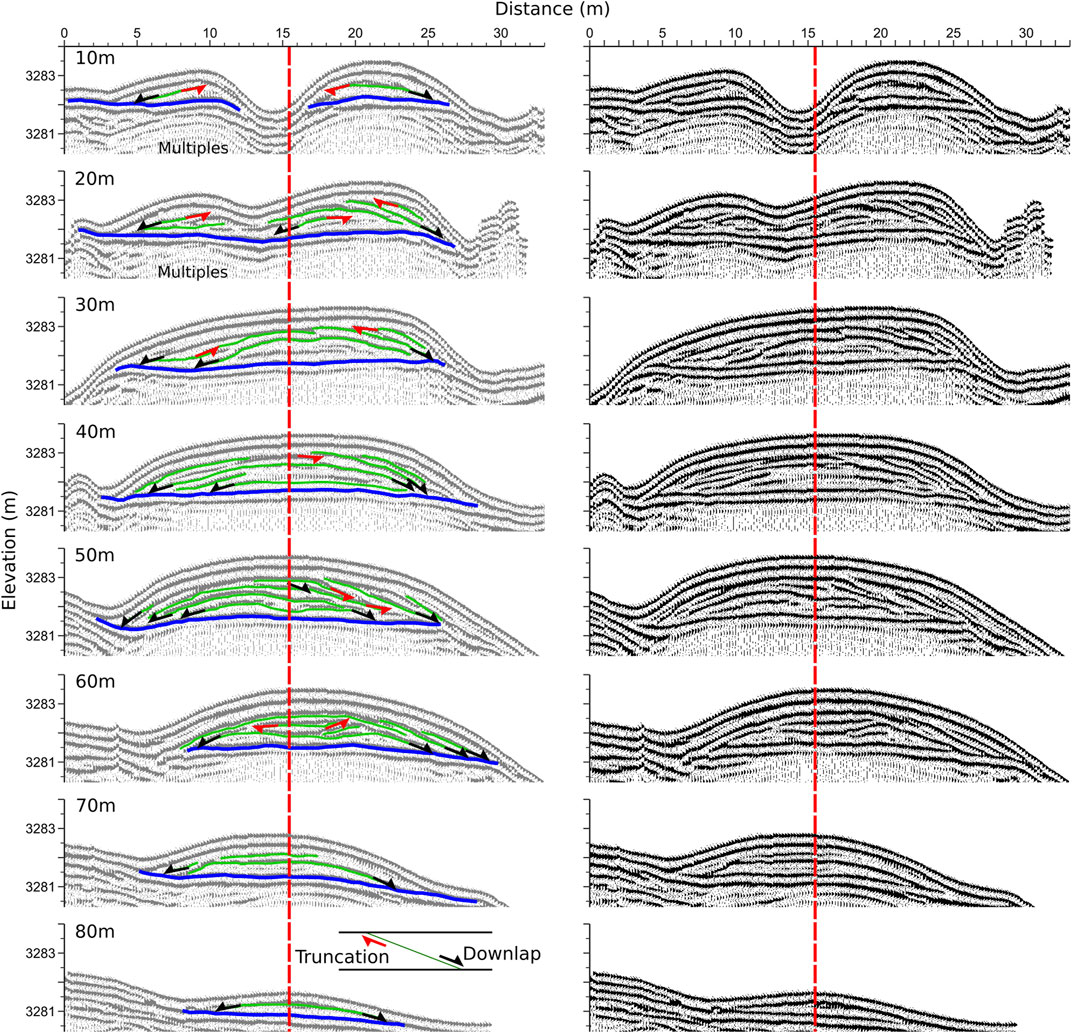
FIGURE 3. Ground-penetrating radar transect at 10 m intervals perpendicular to the NW-SE bisect. Transects are shown from SE to NW going from left to right. The vertical axis is exaggerated by a factor of 2.5. The extracted base is denoted by the thicker blue line and interpretations of the internal bounding surfaces are shown by thinner green lines. The red dotted line indicates the intersection with the NW to SE bisect (Figure 3). The uninterpreted GPR surveys are shown for reference.
At Blowout B the basal reflection has a very low-angle dip downwind parallel to the blowout lobe and a relatively steep slope to the west perpendicular to the lobe (Figures 4, 5), because the lobe runs along the flank of a vegetated linear dune. The GPR profile along the axis of the lobe at Blowout A shows inclined reflections that dip in the downwind direction (Figure 2). These are interpreted as former positions of the lobe surface and record the extension of the lobe downwind. Changes in the dip of the reflections suggest that the downwind margin of the lobe steepened and then flattened out. The dip of the reflections shows that the downwind margin did not reach the angle of repose. Truncation of the reflections within the lobe indicate periods of erosion, when the lobe was reshaped by changes in the wind. Reflections on the GPR profiles across the lobe are dominated by convex reflections that are interpreted to come from former positions of the lobe surface (Figure 3).
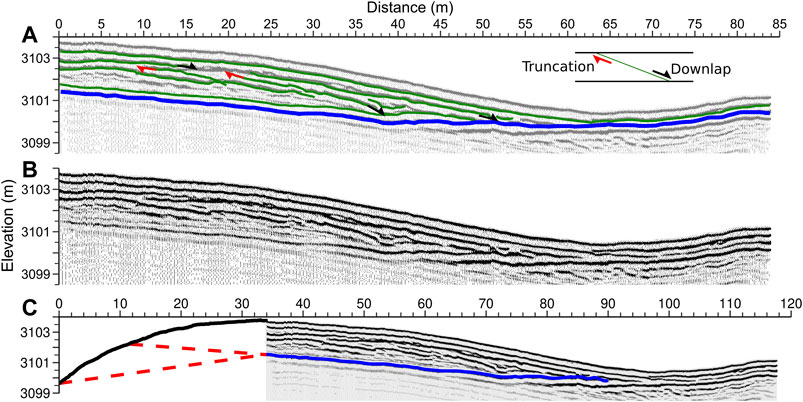
FIGURE 4. (A) Longitudinal GPR transects of the depositional lobe of Blowout B. The vertical axis is exaggerated by a factor of 2.5. The extracted base is denoted by the thicker blue line and interpretations of the internal bounding surfaces are shown by thinner green lines. (B) The uninterpreted GPR survey is shown for reference. (C) The extrapolations used to calculate volume estimates for the lobe of Blowout B. The interpreted base of the lobe is shown in the solid blue line. The solid black line shows the DEM surface. A linear model extrapolating the first 10 m of the basal surface is shown in the higher red dashed line. The lower red dashed line shows a linear model between the start of the lobe and the identified base.
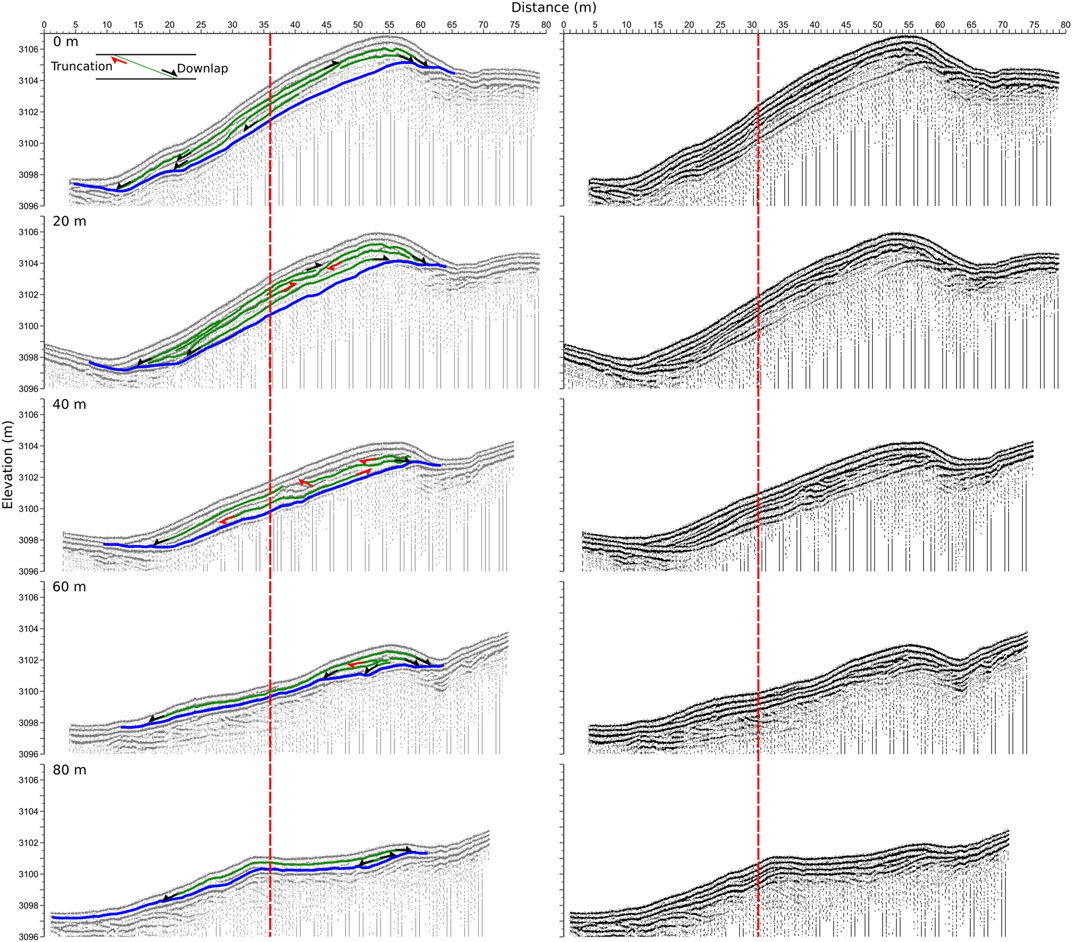
FIGURE 5. Transverse GPR transects across the lobe of Blowout B at 20 m intervals perpendicular to the NW to SE bisect. The vertical axis is exaggerated by a factor of 2.5. The extracted base is denoted by the thicker blue line and interpretations of the internal bounding surfaces are shown by thinner green lines. The red dotted line indicates the intersection with the NW to SE bisect (Figure 6). The uninterpreted GPR surveys are shown for reference.
The convex morphology mirrors the lobe surface at the time of survey. However, the convex reflections are not symmetrical; some are truncated and others are only preserved on the east side of the lobe. Truncation of the reflections marks erosion, most notably at the upwind end of the lobe where a central scour has eroded into the upwind end of the lobe. Truncation of reflections within the lobe are interpreted as reactivation surfaces where the lobe was reshaped by a change in the wind. The asymmetric development of the lobe with local advance towards the west indicates a change in wind direction.
The presence of downlap and truncation surfaces within the lobes indicates reshaping of the lobe surface due to changes in the wind strength and direction similar to reactivation surfaces identified in sand dunes (Kocurek, 1996) as well as GPR profiles across sand dunes (e.g., Bristow et al., 2005). The abundance of truncation and downlap terminations within the lobe strata indicates extensive reworking of the lobe, with episodes of erosion as well as periods of deposition.
5 Morphometric Analysis
5.1 Blowout A
Blowout A (Figure 6) exemplifies the standard blowout model with one active erosional hollow and a subsequent clearly defined downwind depositional lobe. The blowout, including the deflation hollow and depositional lobe, measures 170 m in length, 33 m in width, and has a total footprint of 4,015 m2. The hollow accounts for just under half of the total feature length (79 m). The blowout is oriented to the south-east yet deposited sediment is evident on the south-west edge of the hollow. This is likely caused by a slight deviation from a perfect elongated concave shape, allowing eroded material to be deposited at an angle when exiting the hollow. The maximum width of the hollow is similar to that of the lobe, reaching 33 m and 31 m, respectively.
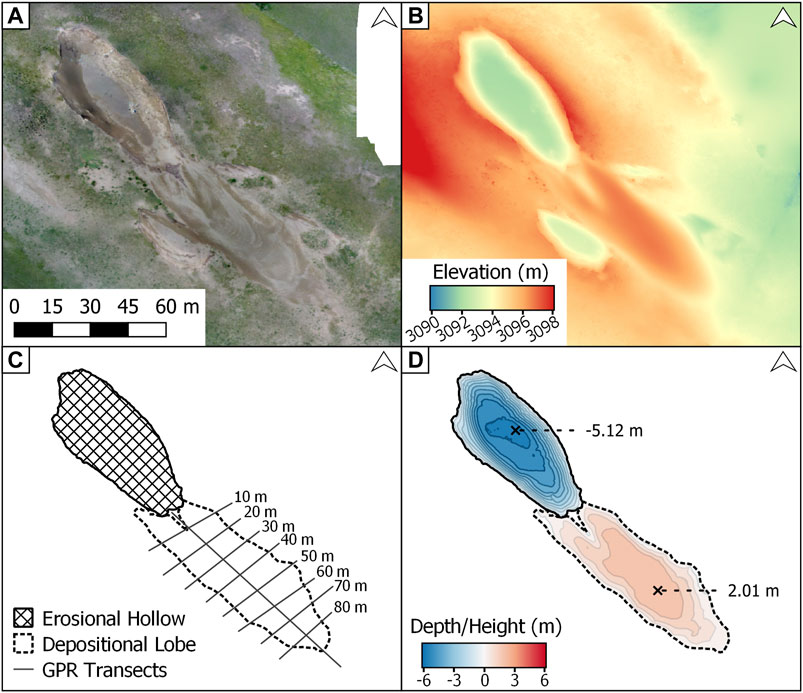
FIGURE 6. Blowout A viewed as (A) a true color composite; (B) a digital elevation model; (C) a schematic model with ground-penetrating radar transects; and (D) interpolated lobe height and hollow depth (contours at 0.5 m spacing). In the true color composite, the light and darker tones on the lobe surface denote moisture content of the sand, showing the former shape and extent of the lobe. Coordinates of the top-left corner of the bounding box: 35.95159N, 100.30301E; bottom-right corner: 35.95015N, 100.30458E.
A GPR survey was conducted to determine the volume of the depositional lobe. A single longitudinal transect bisected the depositional lobe from NW to SE (Figure 2). Eight transects were then made from SW to NE at 10 m intervals perpendicular to the longitudinal transect (Figure 3). The continuous lines at the top of the transects in Figures 2, 3 denote the direct signals between the transmitter and the receiver. The first signal is the airwave, the fastest direct signal that travels from the transmitter to the receiver directly through the air at the speed of light. The second signal represents the groundwave, a signal that travels directly to the receiver through the near-surface without reflecting off of any soil horizons at a lower velocity. These direct arrivals effectively obscure the top 0.5 m of strata, limiting the use of the GPR to detect the thickness of layers of sand where the thickness is less than 0.5 m. The NW-SE bisect shows inclined reflections dipping in the downwind direction as well as a reflection from the base of the lobe (Figure 2). The continuous sub-horizontal reflection at the base of the lobe marks the contact between the lobe and the underlying soil horizon and is coloured blue on Figure 2. Inclined reflections within the lobe increase in dip downwind until it reaches an angle of around 30 degrees and then decreases again (Figure 2) The downwind dipping reflections are evidence of progradation, with high-angle reflections indicating the angle of repose and development of a slipface on the downwind end of the lobe. Truncation of the inclined reflections at the upwind end of the lobe indicates erosion and is attributed to aeolian reworking of the lobe deposits. Bounding surfaces between sets of inclined reflections are attributed to aeolian reworking of the lobe, possibly during storm events. In conjunction with the sub-horizontal reflections in the perpendicular transects, the lobe shows that tabular cross-strata have formed at the leeward slope. The GPR profiles across the lobe show a central scour at the upwind end that is eroding through the lobe deposits and the underlying soil, truncating the basal blue reflection (Figure 2). Reflections within the cross-section profiles show convex-upwards reflections as well as low-angle inclined reflections (Figure 3). The convex-upward reflections are attributed to the dome-like morphology of the lobe recording aggradation on the lobe surface. This is most likely wind ripple laminae that are beneath the resolution of the GPR. The low-angle inclined reflections overlay bounding surfaces and are interpreted to indicate changes in the accretion direction of the lobe, with the lobe building out towards the east, most likely a response to changes in wind direction.
The DEM indicates that the scour hollow is 3 m deeper than the lobe is thick. However, the lobe extends over a larger area, 2,133 m2 compared to 1,882 m2 of the hollow. The erosional hollow has a volume of 5,806 m3 and the lobe has a volume of 2,230
5.2 Blowout B
Blowout B (Figure 7) differs from Blowout A (Figure 6) in that it is eroding into the flank of an elongated ridge, possibly a vegetated linear dune. The blowout lobe is not readily apparent in the DEM or in the orthorectified true colour composite. Instead, an apron of sediment is evident, measuring 633 m in length and 73 m in width at its maximum.
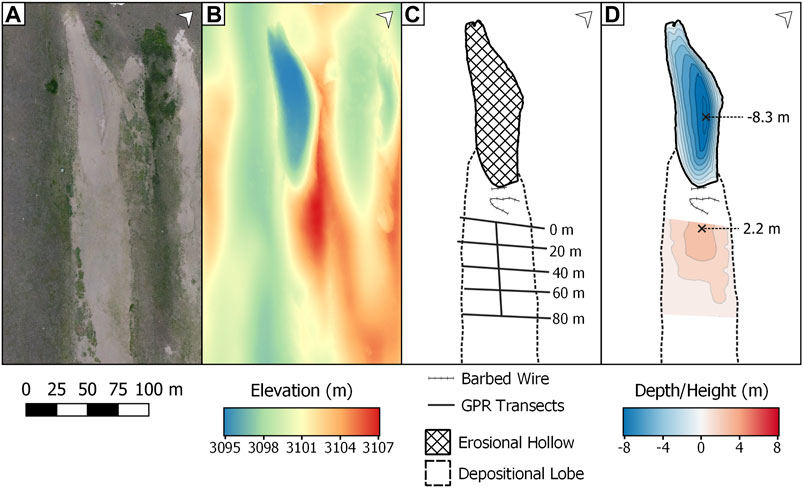
FIGURE 7. Blowout B viewed as (A) a true color composite; (B) a digital elevation model; (C) a schematic model with ground-penetrating radar transects; and (D) interpolated lobe height and hollow depth (contours at 1 m spacing). Note the depositional lobe situated on an incline. Coordinates of the top-left corner of the bounding box: 35.96427N, 100.27499E; bottom-right corner: 35.96310N, 100.27839E.
A partially broken barbed wire fence precluded the first 30 m of a bisecting GPR transect from being surveyed. Despite this, a 84 m NW-SE bisect was completed (Figure 4). Five SW-NE transects were made perpendicular to the bisect at approximately 20 m intervals (Figure 5). In contrast to Blowout A, the transects show a much more complex history. Low-angle reflections and truncated erosion surfaces indicate several periods of reconstruction and erosion. Reworking of the lobe sediment has produced clear scour surfaces and saddle morphology is evident. The increased internal complexity of the lobe could be indicative of maturity, or result from the slope exposing the lobe to a more complex wind regime.
When extracting the basal surface from the GPR transects, the resulting lobe depth is surprisingly symmetrical despite the topographic gradient. Analysis based solely on the DEM without knowledge of the subsurface would therefore overestimated the plume depth. Interpolating the basal surface covered by GPR surveys produces a volume estimate of 6,310
5.3 Blowout C
The apron of Blowout C (Figure 8) is easy to discern in the orthorectified true colour composite, but is harder to delimit in the DEM due to a topographic incline. The apron is more than twice the maximum width of the hollow (58 m and 28 m, respectively), and three times that of its length (257 m and 87 m, respectively). Additionally, the hollow has a footprint only a tenth that of the apron (1,270 m2 and 13,000 m2, respectively). Five GPR surveys were conducted across the depositional plume, comprised of two 150 m longitudinal transects and three 50 m latitudinal transects. However, the apron was too thin to be resolved in the GPR surveys. Instead, 88 small pits were dug into the surface at random locations to measure the soil horizon depth (Supplementary Table S3). The depth of sand at each pit was measured in centimetres using an extending steel ruler. Pit locations were recorded using DGPS. These soil horizon depths underwent ordinary kriging to interpolate a basal surface (Figure 8D). The maximum depth of the horizon was measured at 0.46 m, and its volume was calculated at 2,290 m3, albeit with a substantial kriging interpolation uncertainty of 75%. This volume of the depositional lobe is only 980 m3 less than the erosional hollow’s volume (3,270
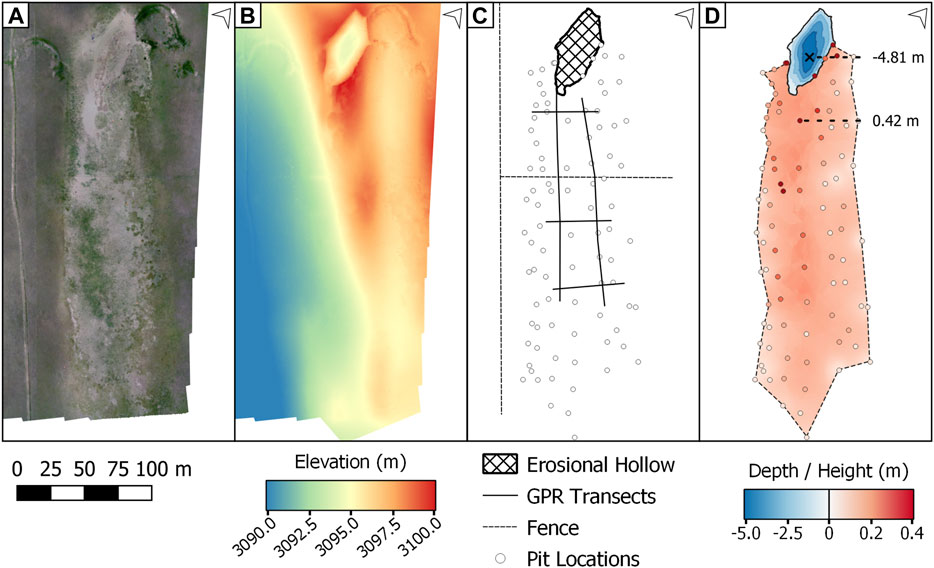
FIGURE 8. Blowout C viewed as (A) a true color composite; (B) a digital elevation model; and (C) a schematic model with ground-penetrating radar transects; and (D) interpolated hollow depth and apron soil thickness with pit sample locations. Coordinates of the top-left corner of the bounding box: 35.95123N, 100.29763E; bottom-right corner: 35.94985N, 100.30134E.
5.4 Blowout D
Blowout D shows a complex mega-blowout feature (Figure 9). The boundary between hollow and lobe is hard to discern with a shallow gradient existing throughout its 1,220 m length and 470 m span. The feature covers an area of 446,000 m2, an order of magnitude larger than Blowouts A–C. With this larger magnitude comes increasing complexity. Multiple secondary hollows are evident on the south-eastern edge of the feature. Some of these hollows are in the process of merging into each other while also simultaneously eroding the side of the primary hollow perpendicular to the direction of the prevailing wind. Juxtaposed to the simplistic model of Blowout A, which has one erosional hollow and one depositional lobe/apron, Blowout D is simultaneously eroding at multiple points along its boundary. Smaller erosional hollows appear on the edge of the larger primary hollow, feeding sediment into the larger system.
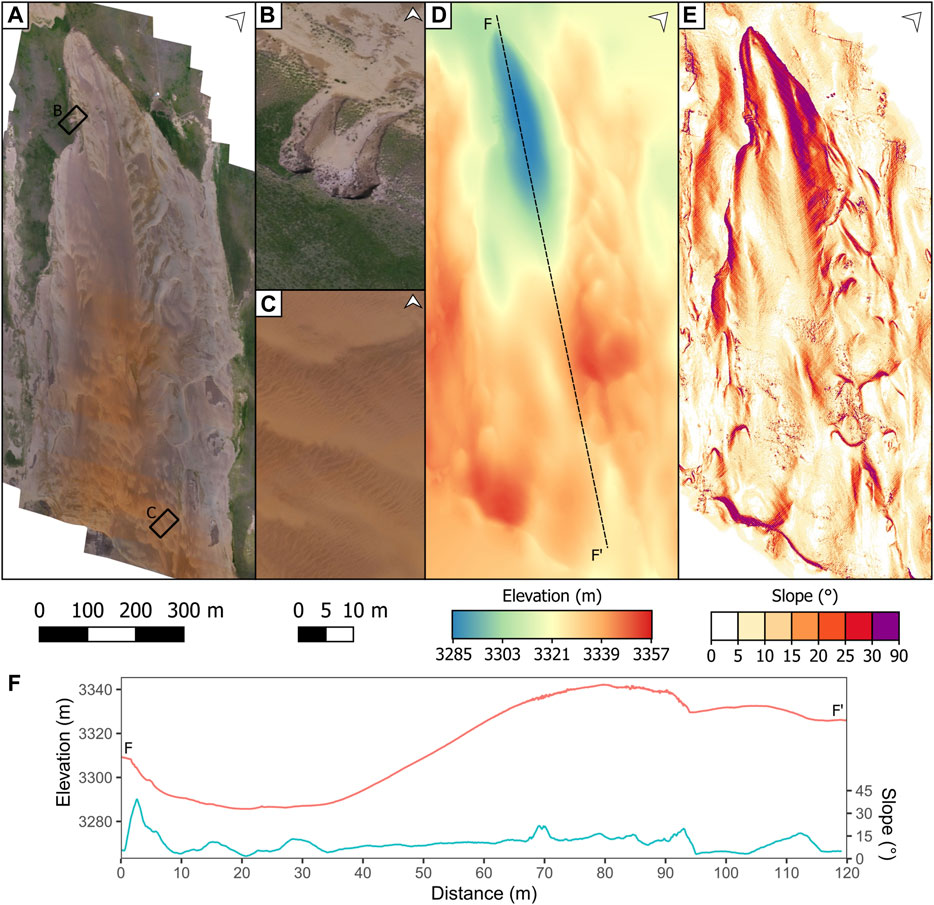
FIGURE 9. (A) A complex mega-blowout with (B) multiple merging erosional hollows and (C) evidence of active sediment transport. The (D) digital elevation model and (E) slope map show a (F) low gradient incline in the hollow-lobe transition (vertical exaggeration of 2.5). Coordinates of the top-left corner of the bounding box: 35.89694N, 100.28670E; bottom-right corner: 35.89114N, 100.30006E.
The sides of the erosional hollow are oversteepened (Figure 9E), with sediment along the scour sides approaching or sitting at the angle of repose. Resistant soils and plant roots flanking the scour sides are maintaining these slopes.
The topography within the hollow also differs from that of Blowouts A–C, with areas of sediment transport evident inside the erosional part of the feature. The mega-blowout appears to facilitate a wind regime that is reworking the sediment below the level of the hollow edge. Further downwind, ripple and proto-dune movement are evident. The hollow-lobe transition is elongated, with a gradual incline over which sand is transported out of the hollow. This complex system is not witnessed in the smaller-scale blowouts, where eroded sediment is immediately transported and deposited at the downwind margin of the hollow.
5.5 Blowout E
Blowout E (Figure 10) is another complex mega-blowout. A primary erosional hollow 180,110 m2 in size has deposited sediment over an incline to the east while simultaneously infilling historic and vegetated hollows to the south. This primary deposit covers an area of 238,000 m2. Multiple smaller hollows are evident further south of the primary deposit, and a secondary apron is present. Vegetation is evident both within the second largest hollow and around the edges of the secondary apron.
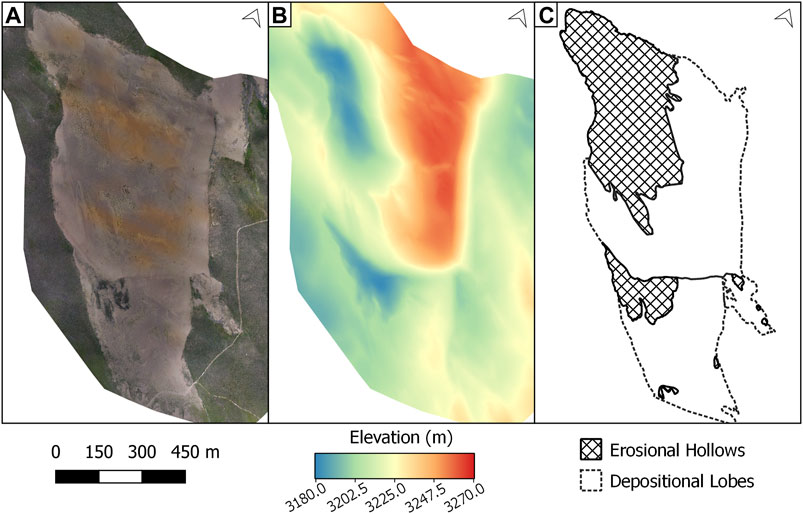
FIGURE 10. A complex mega-blowout viewed as (A) a true color composite; (B) a digital elevation model derived from Structure-from-Motion modeling; and (C) a schematic model demarcating erosional hollows and depositional lobes. Note infilling of downwind erosional hollows and large slope gradients. Coordinates of the top-left corner of the bounding box: 35.8610N, 100.2761E; bottom-right corner: 35.8516N, 100.2913E.
Two possible interpretations of the mega-blowout’s history of sediment reactivation may be drawn from our analysis. Firstly, the secondary erosional hollow could be mature and inactive, slowly becoming infilled by sediment produced in the active erosional hollow to the north-west. Secondly, the lobe could be in active transport through a larger hollow. The similar depths between the primary and secondary erosional hollows suggest the feature may be a single large hollow. A limit, such as a perched water table, may have been reached with sediment now passing through the feature in a similar way to Blowout D.
6 Discussion
Barchyn and Hugenholtz (2013) suggest that the erosion in a blowout will equal the volume of sediment in the depositional apron due to the conservation of mass. However, we are not aware of any other studies of blowout deflation hollow/depositional lobe volumes with which to compare our results. As a consequence, we can only speculate that the differences observed in this study are not unique but should apply more widely. Barchyn and Hugenholtz (2013) assume that the apron is 100% efficient in trapping wind-blown sand. By analogy with sand dunes it has been shown that dunes with slipfaces are not very efficient sand traps, trapping only a small percentage of the saltation flux, and dunes without slipfaces even less so (Bristow and Lancaster, 2004). The clear implication is that sand derived from deflation hollows can accumulate locally within depositional lobes, but equally it will be distributed more widely downwind. This combination of local sand accumulation and downwind reworking can account for most of the variations in morphology observed in the blowout lobes. The other significant influence is the wind direction, which can affect the direction of sediment transport and resulting lobe development.
Truncation of reflections on the GPR profiles provide evidence for erosion and indicates breaks in deposition, as well as reworking of the sand on the surface of the blowout lobe. Changes in the accretion direction of reflections indicates changes in the lobe morphology that is attributed to changes in wind direction. GPR also images the base of the lobes and this has been used to calculate the volume of sediment within two lobes. While the results of the GPR survey in imaging the lobe strata and the base of the lobe are positive, the calculation of lobe volumes using GPR was limited by the inability of the 200 MHz GPR system to image sand layers less than 0.5 m thickness, the section that is covered by arrival of the direct air and ground waves. Higher-frequency GPR systems e.g. 500 MHz antennas with a shorter wavelength would have helped in this respect. The use of soil pits to determine lobe thickness and volume shows a much closer agreement between the volume of the scour hollow and the volume of the depositional lobe at location C. Nonetheless, the kriging interpolation of these point measurements is associated with large statistical uncertainty (Table 2).
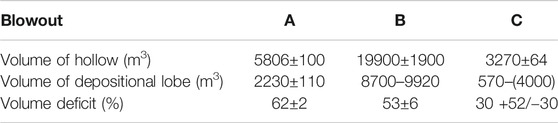
TABLE 2. Volume deficit measurement of the three small blowouts.
It would be advantageous for future work to further constrain depositional volumes. There exists, however, two difficulties in this. Firstly, an invasive field campaign risks disturbing the fragile environment and contributing to further land degradation. Secondly, the attribution of widely spread fine material to a particular blowout becomes problematic further downwind. Delimiting the input of upwind features to the amount of sediment in the topsoil surrounding a blowout would require a comprehensive monitoring campaign and/or foreknowledge of sediment emissivity. We have shown that a large amount of material is lost to the surrounding downwind environment, and thus features further downwind are unlikely to be acting in a closed system. The proximity of other blowouts and their level of activity would therefore need to be carefully considered when constraining depositional volumes further. This issue notwithstanding, repeated drone surveys could be conducted to determine lobe accretion and scour deflation through time. While sandy environments pose challenges to photogrammetric methods, studies quantifying sand deposition on beaches using UAV surveys have produced DEMs with centimetre and sub-centimetre vertical accuracies (Jayson-Quashigah et al., 2019; Casella et al., 2020, 2016). Similar applications would be useful to determine volumetric changes through time. However, these studies would be limited to quantifications of topographic changes as sub-surface imaging is still required to identify the lobe base.
6.1 Elevation and Scour Depth
The scour depth of blowouts in the coastal zone is limited by the presence of the water table and associated capillary zone that restricts sand entrainment, as well as the presence of coarse-grained beach deposits beneath coastal dunes. As a consequence the scour depth in coastal dunes is restricted because wind cannot deflate sand beneath the water table, which is close to mean sea level at the coast, nor can it entrain coarse-grained beach deposits that are commonly raised slightly above the high tide line in a backshore setting. In contrast, the blowouts of the QTP lack a shallow water table and the deflation depth is limited instead by the thickness of aeolian sand and depth to underlying strata. In the Gonghe Basin the sand thickness and blowout dimensions appear to increase in the downwind direction until they join the active sand dunes. We speculate that the increased sand thickness away from the deflation zone in the Gonghe Basin is a legacy of a downwind decrease in transport capacity as wind flow expanded away from the topographic confines of the basin. Drought conditions during the Little Ice Age are believed to have resulted in the reactivation of the blowouts (Luo et al., 2019b).
6.2 Upwind Propagation of Instability and Blowouts
The upwind decrease in blowout dimensions, away from the active dunes, and towards the vegetated plain suggests an upwind propagation of the blowout system, propagating upwind, away from the active dunes. This pattern can be viewed as a systematic downwind propagation of blowout morphology, from small blowouts (localities A, B, and C, this study), to larger mega-blowouts downwind (localities D and E, this study) and sites described by Luo et al. (2019a)Luo et al. (2019b). This pattern suggests a downwind propagation of instability with blowout dimensions increasing downwind. However, an alternative hypothesis is that the sizes of the blowouts relate to their age. In which case the larger blowouts which are downwind started earlier than the smaller blowouts upwind. This explanation suggests the opposite, that the instability started at the downwind end and propagated upwind even though individual blowouts tend to propagate downwind. This hypothesis appears to be supported by OSL ages (Luo et al., 2019a; Luo et al., 2019b). One possible reason for what appears at first to be a counter-intuitive explanation for the blowout pattern is that the downwind areas which are at a higher elevation (Figure 1) were closer to the threshold for blowout development and it is only as anthropogenic impacts have increased in the grazed pastures at lower elevations that blowouts have developed upwind, suggesting a bio-geomorphic control on the wider pattern of climatically driven blowout development.
7 Conclusion
High resolution topographic surveys of blowouts including erosional hollows and adjacent depositional lobes were collected using SfM optical drone mapping and DGPS to create digital elevation models (DEMs) of the blowouts. In addition, ground-penetrating radar (GPR) profiles were collected along and across the depositional lobes at three of the smaller and less complex blowouts. Volumes of the erosional hollows and their adjacent depositional lobes are calculated from the DEMs, GPR data, and soil pits. The results show that although the areas of the hollows and lobes are similar, the volume of the lobes is much less than the volume of the adjacent hollows with the lobe volume amounting to around 50% of the hollow. Part of the difference in volumes can be attributed to the method used to calculate the lobe volumes. The wavelength of the GPR prevents measurement of sand layers that are thinner than the section covered by the first arrivals of the direct groundwaves and airwaves. Despite this, the results indicate that blowout lobes are not very efficient sand traps, capturing only 50% of the sand eroded from the hollow. The remaining 50% is probably distributed further downwind, as a thin sand layer captured by local vegetation, with an undetermined fraction transported further downwind as saltating sand or a “dust” plume during storm events.
Data Availability Statement
The original contributions presented in the study are included in the article/Supplementary Material, further inquiries can be directed to the corresponding author.
Author Contributions
Drone footage collected by RB and TM with support from TB, WL, and PV. GIS field data collection from PV, TB, and WL. GPR surveys conducted by ED and CB, with additional support from TB. GPR interpretations by CB. Models created by TB and RB. Morphometrics and data analysis from TB. Manuscript written by TB, with substantial contributions from CB and edits from PV.
Funding
TB is supported by the Natural Environment Research Council (NERC) through Grant No. NE/L002485/1. This reseach was funded by Grant No. 41771015 of the Chinese National Natural Science Foundation, awarded to WL, and a Thesiger Oman fellowship (THES 02/18) of the Royal Geographical Society, awarded to PV.
Conflict of Interest
The authors declare that the research was conducted in the absence of any commercial or financial relationships that could be construed as a potential conflict of interest.
Acknowledgments
We would like to thank Mark Bateman, Mei Shao, Songnian Luo, Wanli Luo, and Binhua Xu for field assistance, and the farmers of Gonghe for granting us access to their land. We would also like to thank LG-R and the anonymous reviewers for their critical and constructive comments.
Supplementary Material
The Supplementary Material for this article can be found online at: https://www.frontiersin.org/articles/10.3389/feart.2021.669440/full#supplementary-material
References
Abhar, K. C., Walker, I. J., Hesp, P. A., and Gares, P. A. (2015). Spatial-temporal Evolution of Aeolian Blowout Dunes at Cape Cod. Geomorphology 236, 148–162. doi:10.1016/j.geomorph.2015.02.015 Available at: https://linkinghub.elsevier.com/retrieve/pii/S0169555X15000987.
Acosta, A. T. R., Jucker, T., Prisco, I., and Santoro, R. (2013). Passive Recovery of Mediterranean Coastal Dunes Following Limitations to Human Trampling, 187–198. doi:10.1007/978-3-642-33445-0_12 Available at: http://link.springer.com/10.1007/978-3-642-33445-0_12.
An, Y., Fang, W., Ming, B., and Huang, Q. (2015). Theories and Methodology of Complementary Hydro/photovoltaic Operation: Applications to Short-Term Scheduling. J. Renew. Sustain. Energ. 7 (6). doi:10.1063/1.4939056
Barchyn, T. E., and Hugenholtz, C. H. (2013). Dune Field Reactivation from Blowouts: Sevier Desert, UT, USA. Aeolian Res. 11, 75–84. doi:10.1016/j.aeolia.2013.08.003
Blanco, P. D., Rostagno, C. M., del Valle, H. F., Beeskow, A. M., and Wiegand, T. (2008). Grazing Impacts in Vegetated Dune Fields: Predictions from Spatial Pattern Analysis. Rangeland Ecol. Manage. 61 (2), 194–203. doi:10.2111/06-063.1 Available at: https://linkinghub.elsevier.com/retrieve/pii/S1550742408500194.
Bristow, C., Augustinus, P., Wallis, I., Jol, H., and Rhodes, E. (2010). Investigation of the Age and Migration of Reversing Dunes in Antarctica Using GPR and OSL, with Implications for GPR on Mars. Earth Planet. Sci. Lett. 289 (1–2), 30–42. doi:10.1016/j.epsl.2009.10.026
Bristow, C. S. (2009). ‘Ground Penetrating Radar in Aeolian Dune Sands’, Ground Penetrating Radar: Theory and Applications, 273–297.
Bristow, C. S., Lancaster, N., and Duller, G. A. T. (2005). Combining Ground Penetrating Radar Surveys and Optical Dating to Determine Dune Migration in Namibia. J. Geol. Soc. 162 (2), 315–321. doi:10.1144/0016-764903-120
Bristow, C. S., and Lancaster, N. (2004). Movement of a Small Slipfaceless Dome Dune in the Namib Sand Sea, Namibia. Geomorphology 59 (1-4), 189–196. doi:10.1016/j.geomorph.2003.09.015
Casella, E., Drechsel, J., Winter, C., Benninghoff, M., and Rovere, A. (2020). Accuracy of Sand Beach Topography Surveying by Drones and Photogrammetry. Geo-mar Lett. 40 (2), 255–268. doi:10.1007/s00367-020-00638-8 Available at: http://link.springer.com/10.1007/s00367-020-00638-8.
Casella, E., Rovere, A., Pedroncini, A., Stark, C. P., Casella, M., Ferrari, M., et al. (2016). Drones as Tools for Monitoring Beach Topography Changes in the Ligurian Sea (NW Mediterranean). Geo-mar Lett. 36 (2), 151–163. doi:10.1007/s00367-016-0435-9 Available at: http://link.springer.com/10.1007/s00367-016-0435-9.
Corenblit, D., Baas, A., Balke, T., Bouma, T., Fromard, F., Garófano-Gómez, V., et al. (2015). Engineer Pioneer Plants Respond to and Affect Geomorphic Constraints Similarly along Water-Terrestrial Interfaces World-wide. Glob. Ecol. Biogeogr. 24 (12), 1363–1376. doi:10.1111/geb.12373 Available at: http://doi.wiley.com/10.1111/geb.12373.
Davidson-Arnott, R. G. D., Yang, Y., Ollerhead, J., Hesp, P. A., and Walker, I. J. (2008). The Effects of Surface Moisture on Aeolian Sediment Transport Threshold and Mass Flux on a Beach. Earth Surf. Process. Landforms 33 (1), 55–74. doi:10.1002/esp.1527 Available at: http://doi.wiley.com/10.1002/esp.1527.
Dong, G., Gao, S., and Jin, J. (1993). The Desertification and its Control in the Gonghe Basin, Qinghai Province. Beijing, China: Scientific Press.
Drees, M., and Olff, H. (2001). ‘Rabbit Grazing and Rabbit Counting’, Coastal Dune Management Shared Experience of European Conservation Practice. Liverpool, United Kingdom: Liverpool University Press, 86–95.
Fox, T. A., Hugenholtz, C. H., Bender, D., and Gates, C. C. (2012). Can bison Play a Role in Conserving Habitat for Endangered Sandhills Species in Canada? Biodivers Conserv 21 (6), 1441–1455. doi:10.1007/s10531-012-0255-9 Available at: http://link.springer.com/10.1007/s10531-012-0255-9.
García-Romero, L., Delgado-Fernández, I., Hesp, P. A., Hernández-Calvento, L., Hernández-Cordero, A. I., and Viera-Pérez, M. (2019). Biogeomorphological Processes in an Arid Transgressive Dunefield as Indicators of Human Impact by Urbanization. Sci. Total Environ. 650, 73–86. doi:10.1016/j.scitotenv.2018.08.429 Available at: https://linkinghub.elsevier.com/retrieve/pii/S0048969718334041.
Garès, P. A., and Pease, P. (2015). Influence of Topography on Wind Speed over a Coastal Dune and Blowout System at Jockey's Ridge, NC, USA. Earth Surf. Process. Landforms 40 (7), 853–863. doi:10.1002/esp.3670 Available at: http://doi.wiley.com/10.1002/esp.3670.
Gautam, B. K., Khan, F. A., and Singh, A. (2017). Performance Analysis of 5 MWP Grid-Connected Solar PV Power Plant Using IEC 61724. Int. Res. J. Eng. Technology(IRJET) 4 (7), 2801–2805.
Gawthorpe, R. L., Collier, R. E. L., Alexander, J., Bridge, J. S., and Leeder, M. R. (1993). Ground Penetrating Radar: Application to Sandbody Geometry and Heterogeneity Studies. Geol. Soc. Lond. Spec. Publications 73 (1), 421–432. doi:10.1144/gsl.sp.1993.073.01.24
González-Villanueva, R., Costas, S., Duarte, H., Pérez-Arlucea, M., and Alejo, I. (2011). Blowout Evolution in a Coastal Dune: Using GPR, Aerial Imagery and Core Records. J. Coastal Res. 64, 278–282. doi:10.1016/j.geomorph.2012.12.019
Gonzlez-Villanueva, R., Costas, S., Prez-Arlucea, M., Jerez, S., and Trigo, R. M. (2013). Impact of Atmospheric Circulation Patterns on Coastal Dune Dynamics, NW Spain. Geomorphology 185, 96–109. doi:10.1016/j.geomorph.2012.12.019 Available at: https://linkinghub.elsevier.com/retrieve/pii/S0169555X12005776.
Hesp, P. A., Smyth, T. A. G., Walker, I. J., Gares, P. A., and Wasklewisz, T. (2016). Flow within a Trough Blowout at Cape Cod. J. Coastal Res. 75 (sp1), 288–292. doi:10.2112/si75-058.1
Hesp, P. A., and Walker, I. J. (2012). Three-dimensional Æolian Dynamics within a Bowl Blowout during Offshore Winds: Greenwich Dunes, Prince Edward Island, Canada. Aeolian Res. 3 (4), 389–399. doi:10.1016/j.aeolia.2011.09.002
Hesp, P. (2002). Foredunes and Blowouts: Initiation, Geomorphology and Dynamics. Geomorphology 48 (1-3), 245–268. doi:10.1016/s0169-555x(02)00184-8
Hesp, P., Schmutz, P., Martinez, M. M., Driskell, L., Orgera, R., Renken, K., et al. (2010). The Effect on Coastal Vegetation of Trampling on a Parabolic Dune. Aeolian Res. 2 (2-3), 105–111. doi:10.1016/j.aeolia.2010.03.001 Available at: https://linkinghub.elsevier.com/retrieve/pii/S1875963710000042.
Houser, C., Labude, B., Haider, L., and Weymer, B. (2013). Impacts of Driving on the Beach: Case Studies from Assateague Island and Padre Island National Seashores. Ocean Coastal Manage. 71, 33–45. doi:10.1016/j.ocecoaman.2012.09.012 Available at: https://linkinghub.elsevier.com/retrieve/pii/S0964569112002670.
Hugenholtz, C. H., and Wolfe, S. A. (2009). Form-flow Interactions of an Aeolian Saucer Blowout. Earth Surf. Process. Landforms 34 (November), 919–928. doi:10.1002/esp.1776
Hugenholtz, C. H., Wolfe, S. A., and Moorman, B. J. (2008). Effects of Sand Supply on the Morphodynamics and Stratigraphy of Active Parabolic Dunes, Bigstick Sand Hills, Southwestern SaskatchewanGeological Survey of Canada Contribution 20060654.. Can. J. Earth Sci. 45 (3), 321–335. doi:10.1139/e08-001
Hugenholtz, C. H., and Wolfe, S. A. (2006). Morphodynamics and Climate Controls of Two Aeolian Blowouts on the Northern Great Plains, Canada. Earth Surf. Process. Landforms 31 (12), 1540–1557. doi:10.1002/esp.1367
Jayson-Quashigah, P.-N., Appeaning Addo, K., Amisigo, B., and Wiafe, G. (2019). Assessment of Short-Term Beach Sediment Change in the Volta Delta Coast in Ghana Using Data from Unmanned Aerial Vehicles (Drone). Ocean Coastal Manage. 182, 104952. doi:10.1016/j.ocecoaman.2019.104952 Available at: https://linkinghub.elsevier.com/retrieve/pii/S0964569118309578.
Jewell, M., Houser, C., and Trimble, S. (2014). Initiation and Evolution of Blowouts within Padre Island National Seashore, Texas. Ocean Coastal Manage. 95, 156–164. doi:10.1016/j.ocecoaman.2014.04.019
Jewell, M., Houser, C., and Trimble, S. (2017). Phases of Blowout Initiation and Stabilization on Padre Island Revealed through Ground-Penetrating Radar and Remotely Sensed Imagery. Phys. Geogr. 38 (6), 556–577. doi:10.1080/02723646.2017.1338042
Jol, H. M., and Bristow, C. S. (2003). GPR in Sediments: Advice on Data Collection, Basic Processing and Interpretation, a Good Practice Guide. Geol. Soc. Lond. Spec. Publications, 211, 9–27. doi:10.1144/gsl.sp.2001.211.01.02
Kang, J., Zhao, W., and Zhao, M. (2017). Remediation of Blowouts by Clonal Plants in Maqu Degraded Alpine Grasslands of Northwest China. J. Plant Res. 130 (2), 291–299. doi:10.1007/s10265-016-0884-2 Available at: http://link.springer.com/10.1007/s10265-016-0884-2.
Käyhkö, J. (2007). Aeolian Blowout Dynamics in Subarctic Lapland Based on Decadal Levelling Investigations. Geografiska Annaler: Ser. A, Phys. Geogr. 89 (1), 65–81. doi:10.1111/j.1468-0459.2007.00308.x
Kocurek, G. (1996). “Deserts Aeolian Systems,” in Sedimentary Environments : Processes, Facies and Stratigraphy. Editor H. Reading (Oxford: Blackwell Publishing), 125–153.
Lancaster, N. (1986). Dynamics of Deflation Hollows in the Elands Bay Area, Cape Province, South Africa. CATENA 13 (1-2), 139–153. doi:10.1016/s0341-8162(86)80009-1 Available at: https://linkinghub.elsevier.com/retrieve/pii/S0341816286800091.
Lin, J., Wang, R., Li, L., and Xiao, Z. (2019). A Workflow of SfM-Based Digital Outcrop Reconstruction Using Agisoft PhotoScan, in ‘2019 IEEE 4th International Conference on Image, Vision and Computing (ICIVC)’(IEEE), 711–715.
Liu, B., Jin, H., Sun, L., Sun, Z., Su, Z., and Zhang, C. (2013). Holocene Climatic Change Revealed by Aeolian Deposits from the Gonghe Basin, Northeastern Qinghai-Tibetan Plateau. Quat. Int. 296, 231–240. doi:10.1016/j.quaint.2012.05.003
Lu, H., Miao, X., Zhou, Y., Mason, J., Swinehart, J., Zhang, J., et al. (2005). Late Quaternary aeolian activity in the Mu Us and Otindag dune fields (north China) and lagged response to insolation forcing. Geophys. Res. Letters 32. doi:10.1029/2005GL024560
Luo, W., Shao, M., Che, X., Hesp, P. A., Bryant, R. G., Yan, C., et al. (2020). Optimization of UAVs‐SfM Data Collection in Aeolian Landform Morphodynamics: a Case Study from the Gonghe Basin, China. Earth Surf. Process. Landforms 45 (13), 3293–3312. doi:10.1002/esp.4965
Luo, W., Wang, Z., Lu, J., Yang, L., Qian, G., Dong, Z., et al. (2019a). Mega‐blowouts in Qinghai-Tibet Plateau: Morphology, Distribution and Initiation. Earth Surf. Process. Landforms 44 (2), 449–458. doi:10.1002/esp.4507
Luo, W., Wang, Z., Shao, M., Lu, J., Qian, G., Dong, Z., et al. (2019b). Historical Evolution and Controls on Mega-Blowouts in Northeastern Qinghai-Tibetan Plateau, China. Geomorphology 329, 17–31. doi:10.1016/j.geomorph.2018.12.033
Neal, A., and Roberts, C. L. (2001). Internal Structure of a Trough Blowout, Determined from Migrated Ground-Penetrating Radar Profiles. Sedimentology 48 (4), 791–810. doi:10.1046/j.1365-3091.2001.00382.x
Qiang, M., Chen, F., Song, L., Liu, X., Li, M., and Wang, Q. (2013). Late Quaternary Aeolian Activity in Gonghe Basin, Northeastern Qinghai-Tibetan Plateau, China. Quat. Res. 79 (3), 403–412. doi:10.1016/j.yqres.2013.03.003
Qiang, M., Jin, Y., Liu, X., Song, L., Li, H., Li, F., et al. (2016). Late Pleistocene and Holocene Aeolian Sedimentation in Gonghe Basin, Northeastern Qinghai-Tibetan Plateau: Variability, Processes, and Climatic Implications. Quat. Sci. Rev. 132, 57–73. doi:10.1016/j.quascirev.2015.11.010
Scarelli, F. M., Cantelli, L., Barboza, E. G., Rosa, M. L. C. C., and Gabbianelli, G. (2016). Natural and Anthropogenic Coastal System Comparison Using DSM from a Low Cost UAV Survey (Capão Novo, RS/Brazil). J. Coastal Res. 75 (sp1), 1232–1236. doi:10.2112/si75-247.1
Schwarz, C., Brinkkemper, J., and Ruessink, G. (2018). Feedbacks between Biotic and Abiotic Processes Governing the Development of Foredune Blowouts: A Review. Jmse 7 (1), 2. doi:10.3390/jmse7010002 Available at: http://www.mdpi.com/2077-1312/7/1/2.
Smyth, T. A. G., Jackson, D. W. T., and Cooper, J. A. G. (2013). Three Dimensional Airflow Patterns within a Coastal Trough-Bowl Blowout during Fresh Breeze to Hurricane Force Winds. Aeolian Res. 9, 111–123. doi:10.1016/j.aeolia.2013.03.002 Available at: https://linkinghub.elsevier.com/retrieve/pii/S1875963713000232.
Smyth, T., Thorpe, E., and Rooney, P. (2020). Blowout Evolution between 1999 and 2015 in Ainsdale Sand Dunes National Nature Reserve. (England: North West Geography), 1 (20).
Sun, Y., Hasi, E., Liu, M., Du, H., Guan, C., and Tao, B. (2016). Airflow and Sediment Movement within an Inland Blowout in Hulun Buir Sandy Grassland, Inner Mongolia, China. Aeolian Res. 22, 13–22. doi:10.1016/j.aeolia.2016.05.002 Available at: https://linkinghub.elsevier.com/retrieve/pii/S1875963716300647.
van Boxel, J. H., Jungerius, P. D., Kieffer, N., and Hampele, N. (1997). Ecological Effects of Reactivation of Artificially Stabilized Blowouts in Coastal Dunes. J. Coast Conserv 3 (1), 57–62. doi:10.1007/bf02908179 Available at: http://link.springer.com/10.1007/BF02908179.
van der Hagen, H. G. J. M., Assendorp, D., Calame, W., van der Meulen, F., Sýkora, K. V., and Schaminée, J. H. J. (2020). Is Livestock Grazing a Key Factor for Changing Vegetation Patterns in Lime Rich Coastal Dunes in the Netherlands?. J. Coastal Conservation 24 (2), 15. doi:10.1007/s11852-020-00733-z Available at: http://link.springer.com/10.1007/s11852-020-00733-z.
Wang, X., Lang, L., Hua, T., Li, H., Zhang, C., and Ma, W. (2018). Effects of Aeolian Processes on Soil Nutrient Loss in the Gonghe Basin, Qinghai-Tibet Plateau: an Experimental Study. J. Soils Sediments 18 (1), 229–238. doi:10.1007/s11368-017-1734-0
Wang, Z., Luo, W., Dong, Z., Lu, J., Qian, G., and Xu, G. (2017). Grain Size Characteristics of the Blowout Surface Sediments and its Aerodynamic Significance in the Alpine Meadow Region of the Gonghe Basin. J. Desert Res. 37 (1). doi:10.7522/j.issn.1000-694X.2016.00064
Wernette, P., Houser, C., Lehner, J., Evans, A., and Weymer, B. (2020). Investigating the Impact of Hurricane Harvey and Driving on Beach-Dune Morphology. Geomorphology 358, 107119. doi:10.1016/j.geomorph.2020.107119
Yan, P., and Shi, P. (2004). Using the 137Cs Technique to Estimate Wind Erosion in Gonghe Basin, QInghai Province, China. Soil Sci. 169 (4), 295–305. doi:10.1097/01.ss.0000126843.88716.d3
Yu, C., Zhang, J., Pang, X. P., Wang, Q., Zhou, Y. P., and Guo, Z. G. (2017). Soil Disturbance and Disturbance Intensity: Response of Soil Nutrient Concentrations of Alpine Meadow to Plateau Pika Bioturbation in the Qinghai-Tibetan Plateau, China. Geoderma 307 (July), 98–106. doi:10.1016/j.geoderma.2017.07.041
Yu, Y., and Jia, Z. Q. (2014). Changes in Soil Organic Carbon and Nitrogen Capacities of Salix Cheilophila Schneid along a Revegetation Chronosequence in Semi-arid Degraded Sandy Land of the Gonghe Basin, Tibet Plateau. Solid Earth 5 (2), 1045–1054. doi:10.5194/se-5-1045-2014
Keywords: structure from motion, Qinghai-Tibet Plateau, ground-penetrating radar, aeolian geomorphology, geospatial reconstruction, blowouts
Citation: Baird TR, Bristow CS, Luo W, Du E, Bryant RG, Mitchell TM and Vermeesch P (2021) Blowout Morphometrics and Mass Balances. Front. Earth Sci. 9:669440. doi: 10.3389/feart.2021.669440
Received: 18 February 2021; Accepted: 04 May 2021;
Published: 25 May 2021.
Edited by:
Zhiwei Xu, Nanjing University, ChinaReviewed by:
Zhengyao Liu, Shaanxi Normal University, ChinaYang Bai, Huizhou University, China
Leví García-Romero, University of Las Palmas de Gran Canaria, Spain
Copyright © 2021 Baird, Bristow, Luo, Du, Bryant, Mitchell and Vermeesch. This is an open-access article distributed under the terms of the Creative Commons Attribution License (CC BY). The use, distribution or reproduction in other forums is permitted, provided the original author(s) and the copyright owner(s) are credited and that the original publication in this journal is cited, in accordance with accepted academic practice. No use, distribution or reproduction is permitted which does not comply with these terms.
*Correspondence: Thomas R Baird, dGhvbWFzLmJhaXJkLjE2QHVjbC5hYy51aw==