 Tom Kettlety
 James P. Verdon
- 1Department of Earth Sciences, University of Oxford, Oxford, United Kingdom
- 2School of Earth Sciences, University of Bristol, Bristol, United Kingdom
We investigate the physical mechanisms governing the activation of faults during hydraulic fracturing. Recent studies have debated the varying importance of different fault reactivation mechanisms in different settings. Pore pressure increase caused by injection is generally considered to be the primary driver of induced seismicity. However, in very tight reservoir rocks, unless a fracture network exists to act as a hydraulic conduit, the rate of diffusion may be too low to explain the spatio-temporal evolution of some microseismic sequences. Thus, elastic and poroelastic stress transfer and aseismic slip have been invoked to explain observations of events occurring beyond the expected distance of a reasonable diffusive front. In this study we use the high quality microseismic data acquired during hydraulic fracturing at the Preston New Road (PNR) wells, Lancashire, UK, to examine fault triggering mechanisms. Injection through both wells generated felt induced seismicity—an ML 1.6 during PNR-1z injection in 2018 and an ML 2.9 during PNR-2 in 2019—and the microseismic observations show that each operation activated different faults with different orientations. Previous studies have already shown that PNR-1z seismicity was triggered by a combination of both direct hydraulic effects and elastic stress transfer generated by hydraulic fracture opening. Here we perform a similar analysis of the PNR-2 seismicity, finding that the PNR-2 fault triggering was mostly likely dominated by the diffusion of increased fluid pressure through a secondary zone of hydraulic fractures. However, elastic stress transfer caused by hydraulic fracture opening would have also acted to promote slip. It is significant that no microseismicity was observed on the previously activated fault during PNR-2 operations. This dataset therefore provides a unique opportunity to estimate the minimum perturbation required to activate the fault. As it appears that there was no hydraulic connection between them during each stimulation, any perturbation caused to the PNR-1z fault by PNR-2 stimulation must be through elastic or poroelastic stress transfer. As such, by computing the stress transfer created by PNR-2 stimulation onto the PNR-1z fault, we are able to approximate the minimum bound for the required stress perturbation: in excess of 0.1 MPa, orders of magnitude larger than stated estimates of a generalized triggering threshold.
Introduction
Felt induced seismicity occurs when industrial activities create stress changes in the subsurface that reactivate faults. This phenomenon has affected a wide range of industries, including hydroelectric reservoir impoundment (e.g., Gupta, 1992); mining (e.g., Verdon et al., 2018); waste-water disposal (e.g., Keranen et al., 2014); deep geothermal energy extraction (e.g., Grigoli et al., 2018); depletion of conventional hydrocarbon reservoirs (e.g., Bourne et al., 2014); hydraulic fracturing in shale gas reservoirs (e.g., Bao and Eaton, 2016; Lei et al., 2019; Kettlety et al., 2019; Verdon and Bommer, 2020; Schultz et al., 2020); natural gas storage (e.g., Cesca et al., 2014); and carbon capture and storage (e.g., Stork et al., 2015).
In some cases, induced seismic events have been of sufficient magnitude to cause significant amounts of damage to nearby buildings and infrastructure. Even where events have not been of sufficient size to cause damage, cases where events are of sufficient magnitude to be felt by the nearby public have caused concern that has, in a number of cases, led to the shut-down of the causative activities (e.g., Deichmann and Giardini, 2009; Cesca et al., 2014; Kettlety et al., 2021). As such, it is of great importance to better understand what physical processes underpin the activation of faults by injection, and determine the geologic factors which most strongly affect the likelihood for a particular operation to trigger felt seismicity.
In the UK, 3 wells have been hydraulically fractured in the Fylde Peninsula, Lancashire, targeting the gas-bearing Carboniferous Bowland Shale Formation, and all three have caused induced seismicity (see Clarke et al., 2014; Clarke et al., 2019a; Kettlety et al., 2021). In 2011, stimulation of the Preese Hall well was halted after triggering a ML 2.3 event (Clarke et al., 2014). This led to a moratorium on shale gas hydraulic fracturing imposed by the UK government lasting several years, during which Traffic Light System (TLS) regulations were imposed, with a “red light” magnitude of ML 0.5. In 2018, the Preston New Road PNR-1z well was stimulated. Stimulation of this well was paused on several occasions as ML > 0.5 events were triggered, with the largest reaching ML 1.5 (Clarke et al., 2019a). In 2019, the adjacent PNR-2 well was stimulated. On the 26th August, the operations triggered an ML 2.9 earthquake (Kettlety et al., 2021), in response to which the UK government has imposed a further moratorium on shale gas hydraulic fracturing.
Processes that lead to fault reactivation during subsurface fluid injection are typically considered with respect to their impact on the stress conditions in the rock mass. For a given fault, the in situ stress field can be resolved into normal (
where P is the pore pressure,
If a process causes a perturbation that increases CFS (with a change in CFS noted hereafter as ΔCFS) then it will move the fault toward the failure threshold, increasing the likelihood of seismicity occurring. In discussing triggering stress changes (i.e., a ∆CFS), cohesion C is often assumed to be negligible, which may be the case for faults which are very close to failure, or “critically stressed”. As will be discussed, the accuracy of this assumption is still a matter of debate in determining the magnitudes of stress required to trigger fault slip.
Subsurface injection will always cause an increase in pore pressure, since additional fluid is added into the system. Equation 1 shows that this will increase CFS, promoting faults to slip. Hence pore pressure increases associated with injection are typically considered to be the driving mechanism for injection-induced seismicity (e.g., Holland, 2013; Schultz et al., 2015; Verdon et al., 2019).
Subsurface fluid injection can also create geomechanical deformation, especially if injection pressures exceed the minimum pressure required to generate fracturing. Both fracturing and the poroelastic expansion of the rock frame associated with the increase of pressure within the rock pore spaces (e.g., Rice and Cleary, 1976) will perturb the stress field in the surrounding rocks. The impact this deformation has on
Elastic stress transfer effects from dislocations in the subsurface have been shown to control the positions of aftershock events after a large earthquake (e.g., Stein, 1999; Steacy et al., 2004), and of earthquakes associated with magma movement in volcanic settings (e.g., Toda et al., 2002; Green et al., 2015). Here, the process of deforming the rock matrix, through fault slip, fracture opening, or the intrusion of a dike, elastically changes the state of stress, inducing a ∆CFS which can act to trigger a nearby fault to slip.
Transfer of pore pressure perturbations through the rock pore space, from the injection point to the reactivated fault, requires time (often hours or days); whereas transfer of stress through the rock frame takes place instantaneously (or at least at the speed of a compressional wave, i.e. thousands of meters per second). Hence, event occurrences at a range of distances from an injection point within a short space of time might indicate events triggered by stress transfer, whereas a progression of events at increasing distances with time might indicate a process dominated by pore pressure diffusion (e.g., Shapiro et al., 1997; Shapiro, 2008; Shapiro and Dinske, 2009). Alternatively, the presence of pre-existing permeable fracture corridors, within otherwise low-permeability formations, may provide an alternative mechanism by which events could be induced at relatively large distances from an injection well within a short time period (e.g., Igonin et al., 2021). Aseismic slip has also been shown to induce stress changes and trigger felt seismicity, and has been invoked when the spatiotemporal evolution of seismicity outpaces fluid diffusion but still is delayed with respect to elastic stress triggering (e.g., Bhattacharya and Viesca, 2019; Eyre et al., 2019). However, modeling of aseismic slip is a challenging process, depending heavily on rheological properties of the host shales and the stress history of the, often small, unmapped faults, both of which are frequently unavailable or generally poorly constrained, as is the case for PNR.
While a positive change in CFS is clearly required to produce fault reactivation, the necessary size of perturbation has remained a matter of debate. In some cases, very small perturbations (<0.01 MPa) have been proposed as being sufficient to have caused fault reactivation (e.g., Kilb et al., 2002; Shapiro et al., 2006; Westwood et al., 2017). In reality, fault criticality is a poorly constrained parameter, which calls into question the use of a general triggering threshold, and the implication that such small magnitude stress changes can induce fault slip in any given locale.
In the following work, we examine the spatiotemporal evolution of microseismicity during the Preston New Road hydraulic fracturing operations in 2019, and use it to characterize the dominant triggering mechanism, whether that be pore pressure diffusion or elastic stress transfer. We then, following the elastostatic modeling approach of Kettlety et al. (2020) for PNR operations in 2018, model the elastostatic stress changes produced by the opening of hydraulic fractures. Using this method we show how stress was transferred onto the fault identified in the microseismic data, and assess whether the stress changes would have promoted slip.
One of the most interesting aspects of the PNR microseismicity is that the two wells (PNR-1z and PNR-2), despite being only 200 m apart, reactivated entirely different fault structures. There is no overlap in the microseismic events or induced seismicity generated by the two wells (Kettlety et al., 2021). The PNR-1z well did not reactivate the PNR-2 fault, and the PNR-1z well did not reactivate the PNR-2 fault. As such, the perturbations created by stimulation of the PNR-2 well were insufficient to reactivate the PNR-1z fault, despite this fault already having been reactivated during stimulation of PNR-1z. Hence, by computing the perturbations created by PNR-2 injection on the PNR-1z fault, we are able to approximate a minimum bound for the magnitude of perturbation required to reactivate the fault.
Preston New Road Hydraulic Fracturing
The hydraulic fracturing at the Preston New Road wells, and the resulting microseismicity and induced seismicity, has been described in detail by Clarke et al. (2019a) and Kettlety et al. (2021). We recap key features here as they pertain to the analysis we present in this study.
In 2018 Cuadrilla Resources Limited (CRL) drilled two horizontal wells into the Upper and Lower Bowland Shale at the Preston New Road site, around 5 km east of the town of Blackpool in Lancashire, UK. The two wells targeted the two reservoir units, with 41 sliding sleeve stages planned on each well, evenly spaced along their ∼1 km lateral sections. The first well was hydraulically fractured in October to December 2018, whilst the second was stimulated in August 2019. Microseismicity was monitored by a surface array, which administered the TLS and measured ground motions, and a downhole array, situated in the adjacent well. The downhole arrays were used to track fracture growth, and interaction with any faults, through the observation of microseismic events with magnitudes down to MW < −2.0 [see Clarke et al. (2019a) and Kettlety et al. (2021) for discussion of location and magnitude uncertainties].
The deeper well (PNR-1z), drilled to 2.3 km depth, was the first to be fracked: injection started on October 16th, 2018. Stages were frequently ended early due to seismicity concerns. ML > 0.0 seismicity occurred during and after injection of several stages, exceeding the amber (ML > 0) and red light (ML > 0.5) TLS thresholds (Clarke et al., 2019a). Many of the injection sleeves were skipped in an effort to avoid particularly seismogenic areas around the well identified during operations. This can be seen in Figure 1 by the gaps between worked sleeves for PNR-1z. Toward the end of October, an ML 1.1 event occurred, and injection was paused throughout November in order to allow seismicity rates to subside. During this hiatus, microseismic observations illuminated a particularly seismogenic planar feature, the trend of which aligned closely to the focal mechanisms of the largest events. Low magnitude seismicity on this NE-SW trending feature (shown as a gray plane in Figure 1 continued throughout the hiatus, whilst the other areas around the well became quiescent. This “fault zone” was termed “PNR-1zii” by the operator (Cuadrilla Resources Ltd., CRL, 2019). As discussed in Clarke et al. (2019a) and Kettlety et al. (2021), it is not clear whether this feature is truly a single fault or a collection of similarly aligned pre-existing fractures, however, from here we will refer to it as the “PNR-1z NE fault”, as the major structure responsible for felt seismicity during stimulation of PNR-1z.
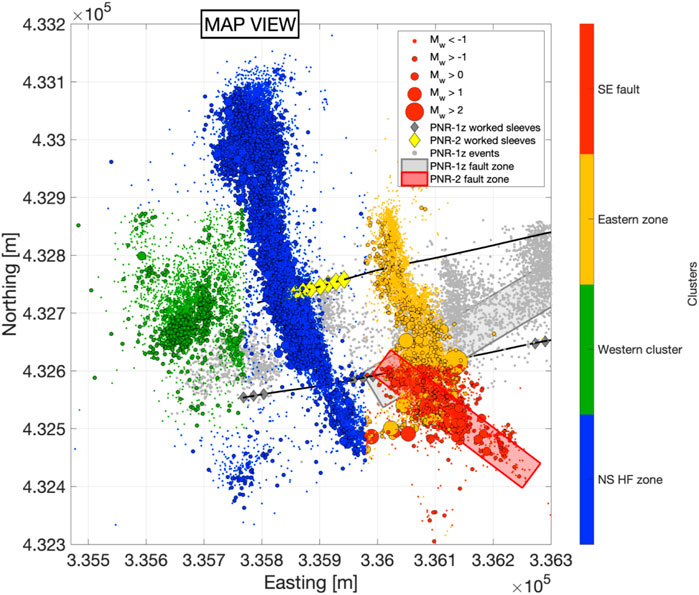
FIGURE 1. Map view of PNR microseismic event locations, sized by magnitude and colored by cluster, focused on the PNR-2 events. The well paths are shown by the black lines, and sleeve locations (the points from which each stage was injected) are shown as yellow diamonds. Coordinates shown here use the Ordnance Survey United Kingdom grid system, which continues throughout, with the background grid showing 100 m increments.
PNR-1z operations recommenced in December 2018 and 5 further stages at the heel of the well were injected. During this time, the largest event of the 2018 operations (an ML 1.6) occurred, within the PNR-1z NE fault zone. This event was felt on the pad, and by a few nearby members of the public.
The second well, PNR-2, targeting the Upper Bowland Shale, is situated ∼250 m to the north and ∼200 m above PNR-1z. Operations started at the toe of the well (Stage 1) on the August 15, 2019, and continued sequentially through to the 7th stage. The first 5 stages proceeded with full volumes of fluid and proppant injected, and no induced seismicity exceeding the TLS thresholds. The majority of microseismic events occurred on a NS trending feature extending roughly 300 m in either direction from the well (shown in blue in Figure 1). The structure delineated by these events is aligned closely to the maximum stress direction (∼170°; Fellgett et al., 2017; Clarke et al., 2019b) and thus the events are assumed to track the growth of hydraulic fractures from the well. A smaller, more diffuse cluster of microseismic events developed around 100 m west of the main NS zone during Stages 2 and 3. This is shown in green in Figure 1 and labeled the “Westward cluster”. Hours after the end of Stage 4, another cluster developed 100 m east of the injected interval. This “Eastern cluster” (shown in yellow in Figure 1) grew during Stage 5, to reveal another cluster trending parallel with the maximum stress direction, seemingly another zone of HF growth spatially separated from the main NS zone. As discussed in Kettlety et al. (2021), the separation of this area of inferred HF growth could be attributed to a stress shadow effect, with increased breakdown pressure either side of the main NS zone due to the large increase in normal stress. The exact mechanism underpinning this separation is under investigation.
Hours after Stage 6, on the August 21, 2019, activity increased at the southern tip of this eastern zone of suspected HF growth, and several ML > 0.5 events occurred, including an ML 1.5 event. Seismicity was paused for one day, with Stage 7 conducted on the 23rd August, using a reduced injected volume and higher viscosity injected fluid in an effort to lessen the likelihood of further seismicity. Hours after Stage 7 was completed, activity in the Eastern Zone increased and larger magnitude events began to occur at its southern tip. One day after the end of injection of Stage 7, an ML 2.1 event occurred in this SE zone, followed on the 26th August by the largest event of the 2019 seismicity, with ML 2.9. The NW-SE-trending fault zone that hosted these events was referred to by the operator and in Kettlety et al. (2020) as “PNR-2i”, but here we will refer to it as the “PNR-2 SE fault (SEF)”, since it is the key structure responsible for the larger-magnitude events during PNR-2 stimulation. Figure 2 shows the locations and orientations of PNR-1z and PNR-2 faults in detail.
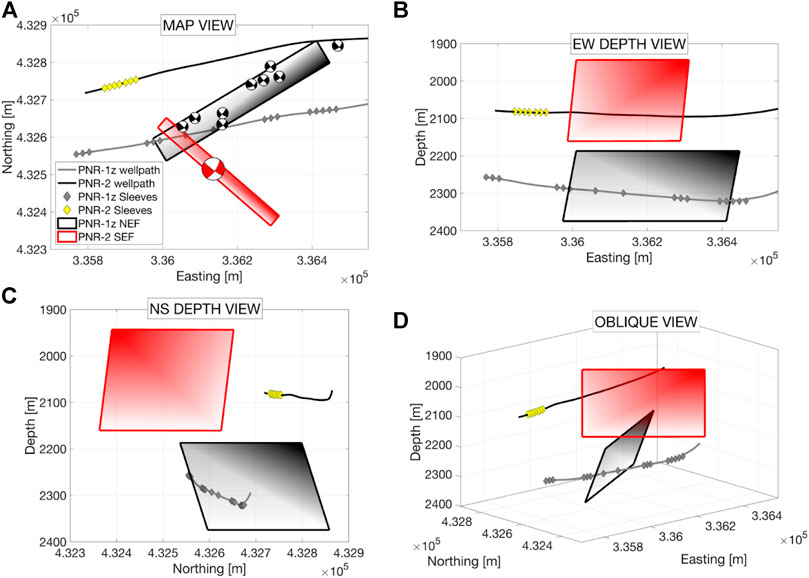
FIGURE 2. Locations and orientations of the two fault zones activated during hydraulic fracturing operations at Preston New Road. The PNR-1z NE fault, shown by the black plane, was identifed from the locations and FMs of the largest events to occur during PNR-1z operations in 2018 (Clarke et al., 2019a), which are shown as black lower hemisphere beach balls in (A), a map view. The PNR-2 SE fault (shown by the red plane) was constrained from the FM of the ML 2.9 event, shown as a red beach ball in (A), as well as the hypocenters of its microseismic aftershocks (see Kettlety et al., 2021, Figure 6). Shading across the planes shown here attempts to aid visualization of the fault orientations in 3-dimensions (B) and (C).
The focal mechanisms of the large events hosted on the two faults are also shown in Figure 2A. Whilst they appear similar (steeply dipping strike-slip, with nodal planes ∼45° from N), the structures in microseismic reveal the fault plane from the auxiliary plane. As shown in Kettlety et al. (2021), there was very little overlap in the location of microseismic events between the 2018 and 2019 periods of activity, and the largest events are clearly located on two different structures. The edges of the fault activated in 2019 during PNR-2 operations were delineated by the microseismic aftershocks that occurred in the hours after the ML 2.9 event, clearly showing its NW-SE trend (Kettlety et al., 2021). With the maximum stress direction at PNR being ∼170° (Fellgett et al., 2017; Clarke et al., 2019) both faults are relatively well-oriented for failure (Kettlety et al., 2021), with the PNR-2 fault being slightly closer to the optimal orientation. These closely spaced conjugate fault zones exemplify the heavily faulted nature of the Bowland Basin and Fylde peninsula (as described in Corfield et al., 1996; Guion et al., 2000; Anderson and Underhill, 2020).
Kettlety et al. (2020) showed that the spatial distribution of the PNR-1z microseismicity was consistent with being triggered by static stress transfer from the opening of hydraulic fractures. Events preferentially occurred in areas where, for NE-SW trending structures (i.e., the PNR-1z NEF or fracture zone), shear stress increased or normal stress decreased such that ∆CFS was positive. Kettlety et al. (2020) identified further evidence for the role of stress triggering in the spatio-temporal evolution of the PNR-1z microseismicity: events were observed to occur at a range of positions near instantaneously, rather than with increasing distance as a function of time, which might be expected if pore pressure diffusion was playing a dominant role.
In the following section, we will use similar methods to assess the triggering mechanisms at play during PNR-2 operations.
Spatiotemporal Evolution
The evolution of microseismic event distances from the injection point with time can reveal the underlying physical mechanisms that are driving the events (e.g., Shapiro and Dinske, 2009). Shapiro et al. (1997) show that, if microseismicity is driven by pore pressure diffusion from the injection point, then for constant-rate injection a triggering front should develop that extends in distance, r, from the injection point as a function of time t:
where D is the hydraulic diffusivity. The diffusive case can be contrasted with the case of hydraulic fracture propagation where, assuming minimal leak-off of fracturing fluid, the length of hydraulic fracture propagation might be expected to show a linear time-distance relationship, since the length of a hydraulic fracture L scales with the injection rate Q, the height hf and width wf of the hydraulic fracture (Economides and Nolte, 2003; Shapiro and Dinske., 2009):
It is clear that this is a simplified model, and represents the upper bound in the distance a single hydraulic fracture could extend with minimal leak off. In Figure 3, we show the spatio-temporal evolution of the PNR-2 microseismicity within the western event clusters (see Figure 1) for Stages 1–6. In Figure 4, we show the spatio-temporal evolution of the microseismicity within the eastern clusters (Eastern Zone and the PNR-2 fault zone, see Figure 1) for the stages that produced events within this cluster (Stages 4–7).
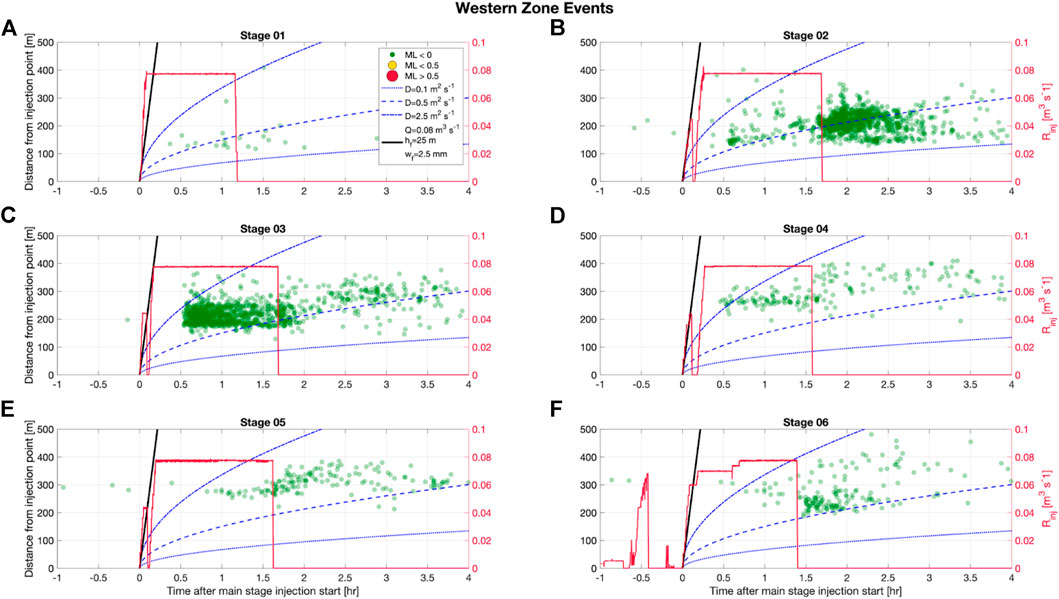
FIGURE 3. Spatiotemporal evolution of microseismicity (dots, colored and sized by magnitude) within the western clusters for each injection stage. We also show the injection rate (Rinj, red line), and the expected time-distance behavior produced by diffusion models with D = 0.1, 1 and 2.5 m2/s (blue dashed lines), and a simple hydraulic fracture model (black line) assuming hf = 25 m, wf = 2.5 mm and no fluid loss.
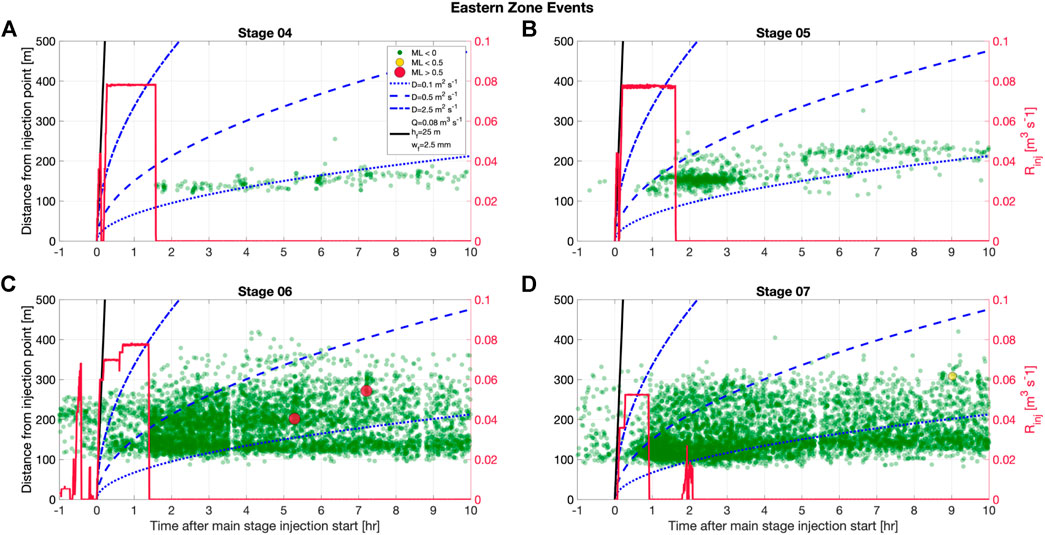
FIGURE 4. Spatiotemporal evolution of microseismicity within the eastern clusters for each stage. The figure is formatted as in Figure 3 above. The delay in the onset of seismicity after injection in the eastern zone decreases with subsequent stages, indicative of permeability enhancement in the reservoir. Unlike during PNR-1z (Kettlety et al., 2020), the pattern of seismicity is more consistent with a
For the PNR-1z microseismicity, we did not observe any patterns in r vs t behavior, with events occurring near-instantaneously at a range of distances from the well (Kettlety et al., 2020). This motivated us to study the effects of stress transfer through the rock frame, since elastic stress transfer through the rock frame occurs at the speed of a compressive wave (thousands of m/s), which is far quicker than the timescales considered here.
For the PNR-2 microseismicity, the envelopes of event distances as a function of time appear to evolve with a dependence of
The system permeability
where
with K as the bulk modulus, with subscripts d, g and f corresponding to the dry rock frame, grain material, and fluid;
Instead, we surmise that the permeabilities estimated from the microseismic event spatio-temporal distributions correspond to the permeabilities of the fracture networks created during hydraulic stimulation. In the previous section, we observe that, for most stages, microseismicity occurs along the same zones as reactivated during previous stages (e.g., the NS Zone, and the Eastern Zone). Therefore, the spatial growth of microseismic events will be determined by diffusion of pressure along these features. A permeability of
Overall, the consistency of the microseismic event distributions with a
Elastostatic Stress Modelling
In order to examine the effects of elastostatic stress triggering on the PNR faults by opening fractures, we follow the approach developed in Kettlety et al. (2020). In this method, we generate model hydraulic fracture sets stochastically, with dimensions scaled to the observed size of the microseismic event clusters, and the number of fractures scaled to the total injected volume during each stage. The hydraulic fractures are used as sources of stress perturbation in the PSCMP code of Wang et al. (2006), which analytically computes the changes in the stress tensor within a homogeneous elastic medium. The Coulomb stress change can then be resolved onto a particular receiver geometry—in this case, the faults activated by the injection at PNR—to assess whether the opening of hydraulic fractures promotes or inhibits failure on the fault surfaces.
In this stochastic modeling approach, many thousands of model instantiations are produced for each zone of hydraulic fracturing, such that the average stressing effect of a zone of opening hydraulic fractures can be assessed, without being tied to a particular model instantiation. As an input to the stochastic model, statistical distributions are defined to parameterize the source hydraulic fractures. We tailor the shapes of the populations to mimic the observed microseismicity, which we use as a proxy for the properties of the hydraulic fractures. The parameters used to characterize the model fractures are given in Table 1. We produce two distinct populations: the larger NS zone; and the Eastern zone of HFs. We define the point along the well from which fractures originate, the standard deviations of the normal distributions used to define the location of the fracture initiation point relative to the sleeve, the proportion of fractures trending north or south, the mean strike, the maximum length of the uniform distribution of fracture length, the fracture width, and the fracture aspect ratio (the ratio of length to height). The fixed widths of fractures used in the model is naturally a simplification. However, from the equations for an idealized Griffith crack, and given the injection rate and range of fracture lengths, a fracture width of 2 mm is a reasonable approximation (see Kettlety et al., 2020). In order to simulate the natural variation in the orientation of the fractures, we apply a Von-Mises perturbation to the strike and dip, with

TABLE 1. Summary of the parameters used to characterize the model hydraulic fractures.
We determine the number of fractures in each instantiation using the volume of fluid pumped into each stage: we generate model fractures until the volume contained within the fractures equals some fraction of the injected volume. Here, we use a leak off factor of 50%, as this is a reasonable approximation given laboratory measurements of leak off rates (REF). This does require an estimate of the relative proportions of each stage volume that might have contributed to each fracture zone. This can’t be easily quantified with the available data, though we make assumptions shown in Table 2, based on the relative proportions of microseismic observed on each feature during each stage. We model all of the sources as producing strain perpendicular to the fracture face (purely tensional, mode 1 slip), with no component of slip parallel to the fracture face. Example fracture models are shown in Figure 5.
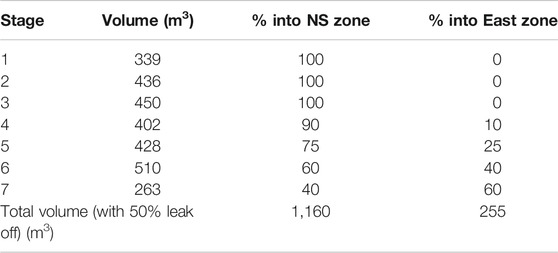
TABLE 2. Injection volumes for each stage, and our apportionment of their volumes into the NS and Eastern hydraulic fracturing zones.
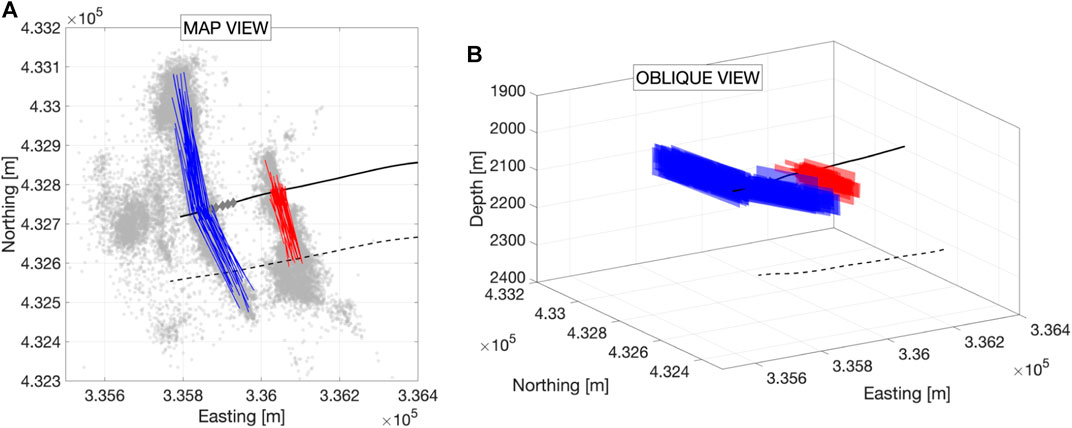
FIGURE 5. Examples of the stochastically generated hydraulic fracture “sources” used to simulate stress changes in the surrounding rocks. In (A) we show a map view of the sources for the NS Zone (blue lines) and the Eastern Zone (red lines) with the observed microseismicity overlain (grey dots). The well paths are shown by the solid black line for PNR-2, and the dashed black line for PNR-1z. The locations of the injection points during PNR-2 operations are shown by the grey diamonds. In (B) we show a 3D view of the model hydraulic fracture sources.
We produce 1,000 sets of fractures for both the NS Zone and the Eastern Zone, and then resolve the modeled stress changes from every set onto the geometry of both the PNR-2 SEF plane (with a strike of 130°, dip of 80°, and a rake of 180°) and the PNR-1z NEF plane (with a strike of 240°, dip of 70°, and rake of 0°). These geometries are derived from the orientations of the planes mapped out by the microseismic events, as well as the focal mechanism measured for the largest events on the faults (Clarke et al., 2019b; Kettlety et al., 2021). We calculate the Coulomb stress change (∆CFS) for each geometry for every instantiation, and then take the median ∆CFS at each point in the volume in order to assess the average stressing effect of the opening hydraulic fractures. To calculate ∆CFS, we use a friction coefficient of µfric = 0.6, a Skempton’s ratio of 0.3, a shear modulus µ = 20 GPa, and a Poisson's ratio of 0.25. These values provide a reasonable representation of shales (Ortega et al., 2007; Kohli and Zoback, 2013; Orellana et al., 2019), and in particular the Bowland Shale (Herrmann et al., 2018). The shear modulus and Poisson’s ratio are also consistent with the values derived from the velocity model in the reservoir units (CRL, 2019).
Results
Figure 6 shows maps of ΔCFS changes at the well depth produced by both the NS Zone and Eastern Zone sources. In both cases, ΔCFS values decrease in the regions either side of the fractures, and increase in zones ahead of the fracture tips. In Figures 7, 8 we show the median ΔCFS values across the PNR-2 SEF and PNR-1z NEF planes respectively. We find that the lowermost corner of the SEF nearest to the fracture zones experiences large negative ΔCFS changes, as expected from the large normal stress increase compressing the fault zone. However, across most of the PNR-2 fault plane, including the region defined as the rupture area by the ML 2.9 event aftershocks (see Figure 6 of Kettlety et al., 2021) experiences positive ΔCFS changes from the tensile opening of fractures in both the NS and Eastern zones, due to the increase in the shear stress on the fault beyond the fracture tips. These observations indicate that static stress transfer could have played a role in facilitating slip on a pre-existing fault, as was the case for the PNR-1z stimulation (Kettlety et al., 2020).
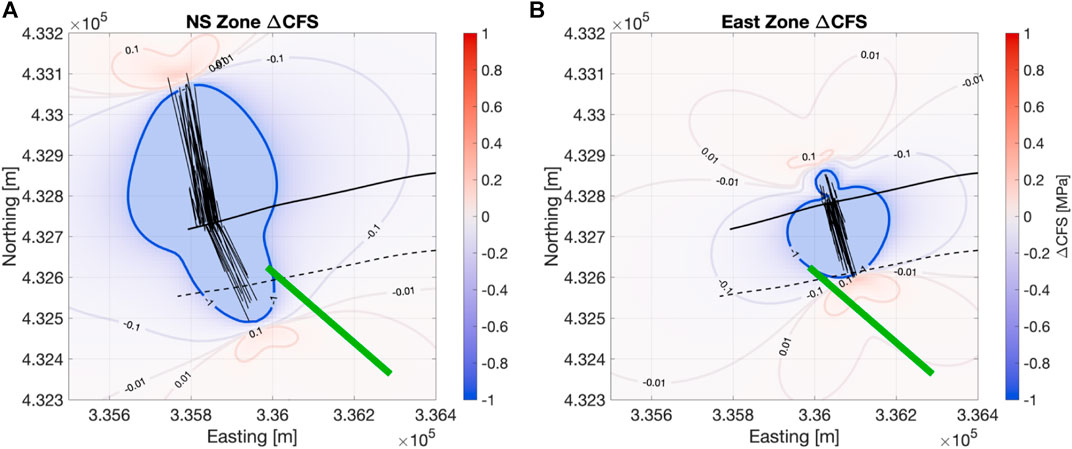
FIGURE 6. Maps of ΔCFS produced by the NS Zone (A) and the Eastern Zone (B) at the depth of the PNR-2 injection. In each case an example set of the fracture sources is shown by a population of black lines, the SEF zone by the green line, and the PNR-2 and PNR-1z well paths by the solid and dash lines respectively (as in Figure 5). Outside of the portion of large normal stress increase (with negative ∆CFS in blue) there is a region on the SE fault beyond the fracture tips where shear stress increases and positive ∆CFS is promoting failure.
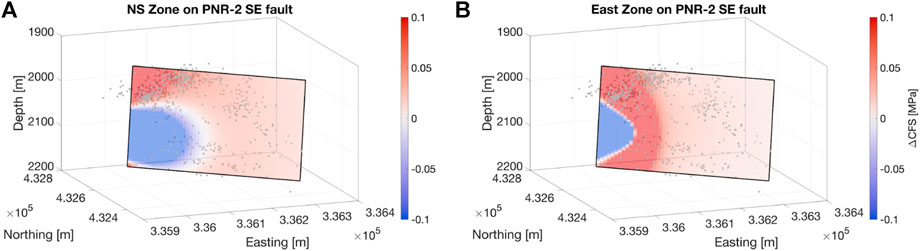
FIGURE 7. Median ΔCFS values on the SEF fault plane (as defined by the ML 2.9 event aftershocks, shown as grey dots) produced by the NS Zone (A) and the Eastern Zone (B) of model HFs. The change in the ΔCFS color scale from Figure 6 should be noted. Outside of the zone of normal stress increase immediately perpendicular to the surfaces of the fractures, ΔCFS is positive due to increases in shear stress. This will act in part to promote failure on the fault’s surface.
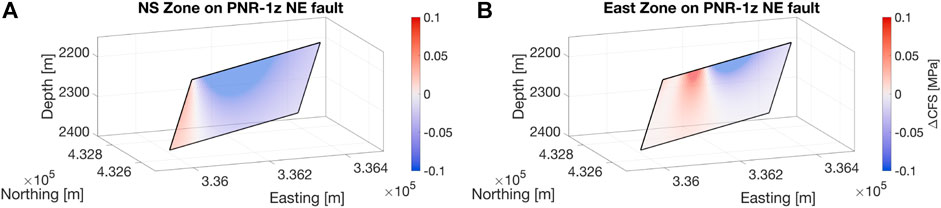
FIGURE 8. ΔCFS values on the PNR-1z NEF plane (as defined by the largest induced events and seismic activity, see Clarke et al., 2019a) produced by the NS Zone of hydraulic fracturing (A) and the Eastern Zone (B).
However, as described in the previous section, the spatiotemporal evolution of the microseismicity shows a clear relationship between time and distance that is indicative of a diffusion-driven process. If static stress transfer were the dominant process, then we would expect a near-instantaneous response with events occurring at a range of distances with little dependence on time. Therefore, while these stress transfer effects may be partly acting to promote slip on the SE fault, overall the microseismicity is driven by the diffusion of elevated pore pressures from the well. Nevertheless, these results show that establishing the causative processes for induced seismicity can be challenging, and that multiple physical processes can act in tandem to reactivate faults during hydraulic stimulation.
Figure 8 shows the median ΔCFS resolved onto the PNR-1z NE-trending fault geometry. The NS zone HFs to the west of the fault zone mostly act to inhibit slip, with around 0.1 MPa of negative ΔCFS across the faults surface. This can be understood intuitively as due to the large normal stress change that extends a significant distance from the zone of HFs opposing the preferred, left-lateral, slip direction of the fault. The East Zone HFs, which are located above the PNR-1z NEF, impart both positive and negative ∆CFS on the order of 0.1 MPa, with the area to the east of the fractures being clamped, and the area to the west being promoted to fail. This due to a similar mechanism as in the NS Zone case, with the large normal stress change acting parallel the preferred slip direction to the west of the HF zone. Despite this triggering effect, no seismicity was located near or on the PNR-1z NEF.
Stress Triggering Thresholds
The observation that no seismicity was triggered on the PNR-1z NEF during PNR-2 operations means that we can assume that whatever triggering effect was provided by the opening fractures was not large enough to initiate slip on the fault. Also, because there was no seismicity near the NEF during PNR-2 stimulation, it is unlikely there is a direct hydraulic connection. From Figure 8B, we can see that the East Zone HFs would have induced a ΔCFS of approximately 0.1 MPa across a significant fraction of the fault’s surface, meaning to successfully trigger the fault more than 0.1 MPa of stress change would have to be imparted. However, this elastic stress transfer is but one mechanism imparting stress on the NEF. To determine the minimum triggering threshold for the fault, the contributions from other mechanisms should be considered.
As fluid is injected into the formation, pore pressures around the injection point increase substantially, by many tens of MPa. This increased pressure will diffuse out into the surrounding rock mass slowly, and preferentially along higher permeability conduits such as natural or newly created fractures. If the formation is more permeable, the zone of increased pore pressure will propagate to larger distances in a shorter time and the magnitude of the change in pressure will be lower. For less permeable rocks, the pressure front will extend to a shorter distance, but the magnitude of pressure increase will be higher (see Rice and Cleary, 1976).
Alongside this simple increase in pore pressure is the poroelastic expansion of the rock frame, whereby a change in pressure within the rock pore space deforms the matrix itself and elastically deforms the surrounding rock. This mechanism can induce stress changes out to a significant distance (Segall and Lu, 2015). The exact magnitude of the stress in three dimensions around the injection point is dependent on the hydraulic structure of the reservoir. To calculate this magnitude using complex multiphase hydromechanical models requires calibration based on a large number of geomechanical and hydraulic parameters, such a drained and undrained elastic moduli, the Biot–Willis coefficients, and the fluid viscosity, each of which vary considerably both in space and time during a hydraulic fracturing operation into a shale gas reservoir. As with most reservoirs, these parameters for PNR are not well constrained.
Without using these underconstrained modeling approaches, we can calculate an order of magnitude estimate for the stress change induced by poroelastic effects using the equations of poroelastic theory (Biot, 1962; explicitly defined for a series of injection intervals in Rudnicki, 1986), which give pore pressure and change in the stress tensor in a 3D homogeneous poroelastic medium. This will allow us to compare order of magnitude estimates of the stress changes induced through fracture-opening elastic stress transfer, poroelastic expansion, and pore pressure increase.
In applying these analytical solutions, we use a series of injection intervals that match the duration and flow rates of those used during PNR-2 (Figures 3, 4). We model the pore pressure and poroelastic stress changes for the duration of the injection operations, and continue up to the time the largest event in the 2019 sequence occurred, the ML 2.9 event on the SEF.
We use a shear modulus of 20 GPa and a drained Lame parameter of 20 GPa, values that are derived from the velocity model for the reservoir (for acquisition details, see CRL, 2019; Kettlety et al., 2020, Kettlety et al., 2021). We use an undrained first Lame parameter of 30 GPa, using an appropriate ratio of drained to undrained first Lame parameters for shales (e.g, Islam and Skalle, 2013; Segall and Lu, 2015). With these drained and undrained elastic parameters, poroelastic theory (see Segall and Lu, 2015, Eq. 15) gives a Biot coefficient of 0.77, consistent with laboratory measurements and model estimates (Muller and Sahay, 2016). We use a dynamic viscosity of 1 mPa s, as that was the stated viscosity in the hydraulic fracture plan for the slickwater used in all but the final stage (CRL, 2019). We examine several permeabilities (0.5 mD, 5 mD, and 50 mD) that cover the range of values appropriate for the enhanced permeability of the hydraulic fractures within the low permeability shale.
From the temporal delay observed between injection and seismic activity near the fault (Figures 3, 4), fracture permeability was estimated to reach on the order of 100 mD, however this is most likely reflective of the maximum permeability of the fractures immediately after injection, which will dominated the permeability structure in comparison to the very low permeability shale matrix (∼0.0001 mD). As we are attempting to model the stress changes throughout the medium, some intermediate value is deemed most appropriate. Naturally, the permeability structure in reality will be quite heterogeneous, and a hydraulic pathway could extend the ranges of the stress changes, though this is not apparent for the NEF. The homogeneous model case, however, allows us to similarly compare the order of magnitude stress changes between the pore pressure, the fracture opening stress transfer, and the poroelastic effect.
From Figure 2 we can see that the injection points during PNR-2 operations were around 200–250 m from the nearest point of PNR-1z NE fault zone. Figure 9 shows the pore pressure ∆P and the poroelastic ΔCFS change across the top of the NEF plane due to poroelastic expansion during PNR-2 operations. The stress changes at the end of the modeled time would be reflective of those when the SEF fault slipped and the ML 2.9 event occurred.
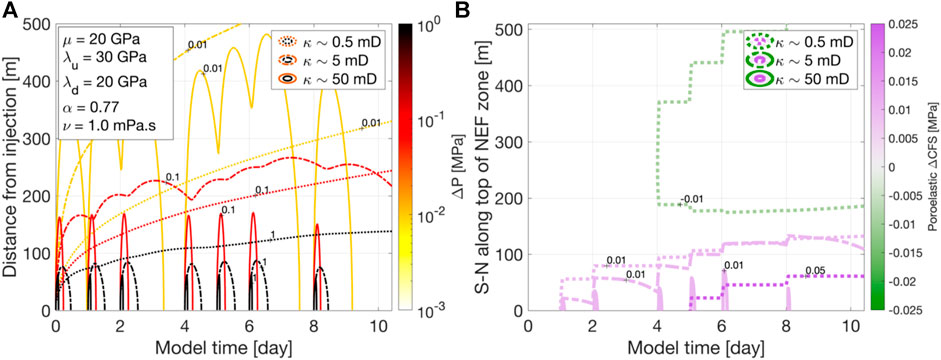
FIGURE 9. Results of the poroelastic modeling for the PNR-2 operations, using the analytical solutions of Rudnicki (1986) for fluid injection into a homogeneous poroelastic medium. (A) shows the change in the pore pressure ∆P with time and distance from the injection points at the end of the PNR-2 well. The poroelastic parameters used are shown inset and described in the text. The colors denote the magnitude of the ∆P contour, and the line styles show the three different permeabilities used. With the PNR-1z NEF being around 250 m away from the injection, this simple model estimates a ∆P on the order of 0.1 MPa. (B) shows the poroelastic Coulomb stress change (∆CFS) resolved onto the geometry of the PNR-1z NEF. This shows how the ∆CFS value evolves with time for the line along the top of the fault zone, going south to north (see Figure 2 for the orientation of the inferred fault zone in 3D). The maximum poroelastic ∆CFS on the NEF is limited to around 0.01 MPa throughout PNR-2 operations. Poroelastic ∆CFS naturally increases markedly at the start of each injection period, and decays with time.
Figure 9A shows that the pore pressure is estimated to be on the order of 0.1 MPa or less at a distance of ∼200 m (i.e., near the NEF), except in the “high” permeability case, where it would be an order of magnitude lower. This is comparable in magnitude to the stress change received by the elastic stress transfer from the opening of hydraulic fractures. However, it appears there was no hydraulic connection between the PNR-2 injection and the NEF. Thus, the permeability approaching the NEF would be significantly lower than those modeled here, and much closer to the matrix. In this case, it is unlikely that any significant (>0.1 MPa) ∆P would extend as far as the NEF during PNR-2 operations, as the increased fluid pressure would take far too long to diffuse that distance. If there was a direct hydraulic connection to the NEF, the ∆P would be somewhere.
The model also produces a maximum poroelastic ∆CFS at the top of the NEF of around 0.01 MPa, significantly smaller than both the ∆P and the ∆CFS created by tensile hydraulic fracture opening. This demonstrates that pore pressure increase and elastic stress transfer from opening HFs have an order of magnitude larger stress perturbations than poroelastic stress transfer from the expansion of the rock frame, and thus the latter mechanism is unlikely to be a dominant contributing mechanism. Whilst in the “low” permeability case the poroelastic ∆CFS near the NEF is slightly larger, it reaches a maximum value (0.07 MPa) just after the pumping of the final stage (around model day 8). At that permeability and model time, the magnitude of ∆P has already far exceeded that of the poroelastic ∆CFS, by around a factor of 4. Thus, even within the variation of permeability, elastic stress transfer from opening fractures would be a more significant triggering mechanism.
Discussion and Conclusion
Microseismic monitoring at the Preston New Road hydraulic fracturing operations in 2018 and 2019 provided an extensive dataset (Clarke et al., 2019b; Kettlety et al., 2021), allowing for detailed study of the physical mechanisms underpinning an influential case of hydraulic fracturing-induced fault activation. We use the event hypocentres and their evolution with time (Figures 3, 4) to demonstrate that the most likely fault activation mechanism during PNR-2 seismicity was the diffusion of increased pore pressure along the newly created hydraulic fractures in the Eastern Zone. Whilst this spatiotemporal evolution method relies on a simplified model of fluid pressure propagation (Shapiro et al., 1997), it is substantiated by the relatively small contribution of elastic stress transfer from opening hydraulic fractures (Figure 6). Pore pressure modeling (Figure 9) also shows possible pore pressure change ∆P of 0.1 MPa or more near the SE-trending fault.
The diffusion of increased pore pressure is a mechanism that has been invoked in many induced seismicity cases (Schultz et al., 2020). It is somewhat surprising that this appears to contrast with the mechanism controlling the spatial distribution of seismicity during the first phase of operations at PNR in 2018, where elastic stress transfer from the opening of hydraulic fractures appeared to control the location of microseismicity along the activated NE-trending fault zone (Kettlety et al., 2020). The primary difference appears to be that the NE zone of enhanced seismicity activated during PNR-1z directly intersected the injection well, with multiple stages creating hydraulic fractures through this suspected fault. During PNR-2 operations, the SEF fault that hosted the widely felt ML 2.9 event was offset entirely from the well, by over 200 m. There was a delay between injection and the onset of activity on fault, most likely due to the finite time required for increased fluid pressure to diffuse along the newly created hydraulic fractures and reach the fault zone. The Preston New Road case study clearly highlights that fault position relative to the injection point is a control on which physical mechanism will contribute to fault triggering.
Using the method developed for the PNR-1z case of fault activation (Kettlety et al., 2020), we use an elastic stress transfer model of hydraulic fracture opening to determine if this mechanism promoted slip on the SEF and NEF during PNR-2 operations. We show that a portion of the SEF would receive a positive ∆CFS (∼0.1 MPa) due to tensile opening hydraulic fractures, promoting slip on the fault. However, part of the fault would also receive a large negative ∆CFS due to the large normal stress increase of opening fractures clamping the fault. Thus, whilst fracture open stress transfer could have contributed to the triggering of the SEF, we conclude that it was mostly induced by increased fluid pressure diffusing through fractures in the Eastern Zone.
The NEF would receive a mostly negative elastic ∆CFS, inhibiting slip, from the large NS Zone of hydraulic fractures identified during PNR-2 injection, however, over half of its surface would receive a positive ∆CFS of around 0.1 MPa from the Eastern Zone of HFs. Still, this was not enough to trigger activity on the fault, as no events were detected near the NEF. Simplified models of poroelastic stress transfer (Figure 9) show the approximate magnitude of stress change from this mechanism would be an order of magnitude less than that expected from this HF opening modeling. This means that if stress transfer were to trigger the NEF, it would require in excess of ∼0.1 MPa of ∆CFS.
The fracture-opening stress modeling requires parameterization of the inferred hydraulic fractures, which naturally simplifies the reality of the properties of the hydraulic fractures. The aim of this modeling is to determine the polarity and approximate magnitude of stress change that the faults at PNR would experience as a result of opening fractures. The model parameters which would substantively change the results given in Figures 6–8 are position and orientation of the fractures, their width, and their number. The location and orientations used in the model are constrained by the trends and extent of the microseismic event clusters. This relies on the interpretation that these clusters are imaging the hydraulic fracture growth, which their evolution (growing outward from the stages), orientation (with respect to the local SHmax), and location (centered on the injection point) all suggest are the case. The modeled widths are reasonable given the Griffith crack model for fractures of this length and the injection rate (Nordgren, 1972; Kettlety et al., 2020), and generally match those found with complex finite element models of fracture growth undertaken by the operator (CRL, 2019). Their number is constrained by their size (see above discussion) and the total volume of fluid which, with some apportionment between HF zones, is well constrained by the rates of injection (Figures 3, 4). Increasing or decreasing the apportionment or leak off rate may change the approximate magnitude by a small amount, but not the polarity of the stress changes. The smoothing introduced by using the median ∆CFS from the Monte Carlo simulation of fractures also decreases the effect of style of failure and the edge effects of the model fractures (Kettlety et al., 2020). Deviations outside the constraint placed by the microseismic events to the fracture lengths and orientations would be required in order to significantly shift the patterns in the stress changes observed.
The models used are homogeneous and isotropic, and naturally simplify a complex reservoir structure. However, anisotropic, heterogeneous models of the hydromechanical response of a reservoir to injection require dozens of poorly constrained parameters, as described previously. Despite their lack of complexity, the models used here require significantly fewer parameters, all of which can be estimated from available data about the PNR shales (e.g., shear modulus, Poisson’s ratio), measurements from the microseismic (e.g., fault/fracture length, orientation, permeability), and appropriate laboratory analogues (e.g., effective coefficient of friction, Biot coefficient, fluid viscosity). Comparisons between these models allow us to study the relative contributions of the underlying triggering mechanisms, and approximate the magnitudes of the stress changes during this case of fault activation.
This magnitude of stress change expected on PNR-1z NEF is an order of magnitude larger than previously stated triggering thresholds, 0.01 MPa or less (e.g., Shapiro et al., 1997; Westwood et al., 2017). Generally speaking, the calculation of ∆CFS assumes a negligible fault cohesion C, which provides inherent strength to overcome in the Mohr–Coulomb failure criterion (Equation 2), and ignores the dynamic friction behavior of the fault rocks (i.e., velocity strengthening or weakening behavior, as in Faulkner et al., 2010). The variability of these properties between faults will naturally in part control the magnitude of the triggering threshold. As laboratory experimentation on the reservoir or fault rocks themselves is required, these properties are more difficult to constrain.
Fault orientation in the regional stress will also be a controlling parameter on the threshold, as well as the most likely triggering mechanism. Whilst the PNR-1z NEF is not as well aligned for failure as the PNR-2 SEF, it is still relatively near the expected optimal orientation for left-lateral faults in this strike-slip regime (Kettlety et al., 2021). The assumptions for the determination of the minimum triggering threshold will then also rely on the fault being critically stressed, where a relatively small increase of ∼0.1 MPa in ∆CFS could be able to trigger fault slip. With the NEF fault being further from the failure envelope, and potentially having fault cohesion and friction behavior not favourable to fault reactivation, the minimum triggering threshold may be greater than 0.1 MPa.
This work shows that both spatiotemporal analysis and geomechanical modeling can be used to assess the relative importance of triggering mechanisms, and highlights that the magnitude of stress change required to trigger a fault may be significantly larger than previously assumed. Our estimation of a minimum triggering threshold is an order of magnitude larger than some minimum bounds used in hazard assessment (e.g., Westwood et al., 2017), and would only be increased when fault cohesion, orientation, and heterogeneity are considered. Using generalized triggering thresholds with low magnitudes (<0.01 MPa) may significantly overestimate the potential hazard associated with injection operations, and their use in this type of hazard analysis needs to be reevaluated. To accurately assess the seismic risk of a particular injection site, these spatiotemporal and geomechanical analyses need to be linked with studies of rock mechanics, petrophysics, and frictional stability measurements. This will be a key in assessing the risk of induced seismicity for increasingly vital technologies, such as geologic CO2 or hydrogen storage, and geothermal energy.
Data Availability Statement
Publicly available datasets were analyzed in this study. This data can be found here: https://www.ogauthority.co.uk/exploration-production/onshore/onshore-reports-and-data/preston-new-road-pnr-1z-hydraulic-fracturing-operations-data/, https://consult.environment-agency.gov.uk/onshore-oil-and-gas/information-on-cuadrillas-preston-new-road-site/user_uploads/pnr-2-hfp-v3.0.pdf, https://www.ogauthority.co.uk/media/6970/oga-summary-of-pnr2-studies-final.pdf.
Author Contributions
TK and JV both contributed equally to the writing of the manuscript, the development of the research, and conducting the modeling.
Funding
TK is supported by the NERC UKUH Challenge Grants SHAPE-UK project (Grant Number NE/R018006/1). JV contribution to this work is supported by NERC (Grant Number NE/R018162/1). The authors would also like to thank the UK Oil and Gas Authority for partial funding of this research.
Conflict of Interest
The authors declare that the research was conducted in the absence of any commercial or financial relationships that could be construed as a potential conflict of interest.
Acknowledgments
We would like to acknowledge Cuadrilla Resources Limited, the operator of the PNR site, and Schlumberger Ltd., who conducted the processing of the microseismic data that are presented in this work, and Nanometrics Ltd., who conducted the processing of the surface derived data acquired by Nanometrics Ltd. and the British Geological Survey. We would like to thank Michael Kendall for insightful discussion of the results, as well as Ryan Schultz and Louis De Barros for their constructive feedback. This work was a product of the Bristol University Microseismicity Projects (BUMPs)—a research consortium whose sponsors include several hydrocarbon operators and service providers.
References
Anderson, I., and Underhill, J. R. (2020). Structural Constraints on Lower Carboniferous Shale Gas Exploration in the Craven Basin, NW England. Pet. Geosci. 26 (2), 303–324. doi:10.1144/petgeo2019-125
Bao, X., and Eaton, D. W. (2016). Fault Activation by Hydraulic Fracturing in Western Canada. Science 354, 1406–1409. doi:10.1126/science.aag2583
Bhattacharya, P., and Viesca, R. C. (2019). Fluid-induced Aseismic Fault Slip Outpaces Pore-Fluid Migration. Science 364 (6439), 464–468. doi:10.1126/science.aaw7354
Biot, M. A. (1962). Mechanics of Deformation and Acoustic Propagation in Porous Media. J. Appl. Phys. 33 (4), 1482–1498. doi:10.1063/1.1728759
Bourne, S. J., Oates, S. J., Van Elk, J., and Doornhof, D. (2014). A Seismological Model for Earthquakes Induced by Fluid Extraction from a Subsurface Reservoir. J. Geophys. Res. Solid Earth 119 (12), 8991–9015. doi:10.1002/2014JB011663
Carey, J. W., Lei, Z., Rougier, E., Mori, H., and Viswanathan, H. (2015). Fracture-permeability Behavior of Shale. J. Unconventional Oil Gas Resour. 11, 27–43. doi:10.1016/j.juogr.2015.04.003
Cesca, S., Grigoli, F., Heimann, S., González, Á., Buforn, E., Maghsoudi, S., et al. (2014). The 2013 September-October Seismic Sequence Offshore Spain: A Case of Seismicity Triggered by Gas Injection?. Geophys. J. Int. 198 (2), 941–953. doi:10.1093/gji/ggu172
Clarke, H., Eisner, L., Styles, P., and Turner, P. (2014). Felt Seismicity Associated with Shale Gas Hydraulic Fracturing: The First Documented Example in Europe. Geophys. Res. Lett. 41 (23), 8308–8314. doi:10.1002/2014GL062047
Clarke, H., Soroush, H., and Wood, T. (2019b). Preston New Road: the Role of Geomechanics in Successful Drilling of the UK’s First Horizontal Shale Gas Well, Society of Petroleum Engineers EUROPEC at the 81st EAGE Annual Conference SPE-195563, London, June 3, 2019 (EAGE). doi:10.2118/195563-ms
Clarke, H., Turner, P., Bustin, R. M., Riley, N., and Besly, B. (2018). Shale Gas Resources of the Bowland Basin, NW England: a Holistic Study. Pet. Geosci. 24 (3), 287–322. doi:10.1144/petgeo2017-066
Clarke, H., Verdon, J. P., Kettlety, T., Baird, A. F., and Kendall, J. M. (2019a). Real‐Time Imaging, Forecasting, and Management of Human‐Induced Seismicity at Preston New Road, Lancashire, England. Seismological Res. Lett. 90 (5), 1902–1915. doi:10.1785/0220190110
Corfield, S. M., Gawthorpe, R. L., Gage, M., Fraser, A. J., and Besly, B. M. (1996). Inversion Tectonics of the Variscan Foreland of the British Isles. J. Geol. Soc. 153, 17–32. doi:10.1144/gsjgs.153.1.0017
Cuadrilla Resources Ltd. (CRL) (2019). Hydraulic Fracture Plan: PNR 2. Available at: https://consult.environment-agency.gov.uk/onshore-oil-and-gas/information-on-cuadrillas-preston-new-road-site/user_uploads/pnr-2-hfp-v3.0.pdf (Accessed May 2021).
Deichmann, N., and Giardini, D. (2009). Earthquakes Induced by the Stimulation of an Enhanced Geothermal System below Basel (Switzerland). Seismological Res. Lett. 80 (5), 784–798. doi:10.1785/gssrl.80.5.784
Deng, K., Liu, Y., and Harrington, R. M. (2016). Poroelastic Stress Triggering of the December 2013 Crooked Lake, Alberta, Induced Seismicity Sequence. Geophys. Res. Lett. 43 (16), 8482–8491. doi:10.1002/2016GL070421
Economides, M. J., and Nolte, K. G. (2003). Reservoir Stimulation. 3rd ed. Hoboken, N.J: John Wiley, 5-1–5–14.
Eyre, T. S., Eaton, D. W., Garagash, D. I., Zecevic, M., Venieri, M., Weir, R., et al. (2019). The Role of Aseismic Slip in Hydraulic Fracturing-Induced Seismicity. Sci. Adv. 5 (8), eaav7172. doi:10.1126/sciadv.aav7172
Faulkner, D. R., Jackson, C. A. L., Lunn, R. J., Schlische, R. W., Shipton, Z. K., Wibberley, C. A. J., et al. (2010). A Review of Recent Developments Concerning the Structure, Mechanics and Fluid Flow Properties of Fault Zones. J. Struct. Geology. 32 (11), 1557–1575. doi:10.1016/j.jsg.2010.06.009
Fellgett, M. W., Kingdon, A., Williams, J. D. O., and Gent, C. M. A. (2017). “State of Stress across UK Regions,” in British Geological Survey Open Report, Vol. OR/17/048.
Green, R. G., Greenfield, T., and White, R. S. (2015). Triggered Earthquakes Suppressed by an Evolving Stress Shadow from a Propagating Dyke. Nat. Geosci 8 (8), 629–632. doi:10.1038/ngeo2491
Grigoli, F., Cesca, S., Rinaldi, A. P., Manconi, A., López-Comino, J. A., Clinton, J. F., et al. (2018). The November 2017Mw5.5 Pohang Earthquake: A Possible Case of Induced Seismicity in South Korea. Science 360 (6392), 1003–1006. doi:10.1126/science.aat2010
Guion, P. D., Gutteridge, P., and Davies, S. J. (2000). “Carboniferous Sedimentation and Volcanism on the Laurussian Margin,” in Geological History of Britain and Ireland. Editors N. H. Woodcock, and R. A. Strachan (Oxford, United Kingdom: Blackwell Science), 227–271.
Herrmann, J., Rybacki, E., Sone, H., and Dresen, G. (2018). Deformation Experiments on Bowland and Posidonia Shale-Part I: Strength and Young's Modulus at Ambient and In Situ Pc-T Conditions. Rock Mech. Rock Eng. 51 (12), 3645–3666. doi:10.1007/s00603-018-1572-4
Holland, A. A. (2013). Earthquakes Triggered by Hydraulic Fracturing in South-Central Oklahoma. Bull. Seismological Soc. America 103 (3), 1784–1792. doi:10.1785/0120120109
Igonin, N., Verdon, J. P., Kendall, J. M., and Eaton, D. W. (2021). Large‐Scale Fracture Systems Are Permeable Pathways for Fault Activation during Hydraulic Fracturing. J. Geophys. Res. Solid Earth 126. doi:10.1029/2020JB020311
Islam, M. A., and Skalle, P. (2013). An Experimental Investigation of Shale Mechanical Properties through Drained and Undrained Test Mechanisms. Rock Mech. Rock Eng. 46 (6), 1391–1413. doi:10.1007/s00603-013-0377-8
Keranen, K. M., Weingarten, M., Abers, G. A., Bekins, B. A., and Ge, S. (2014). Sharp Increase in Central Oklahoma Seismicity since 2008 Induced by Massive Wastewater Injection. Science 345 (6195), 448–451. doi:10.1126/science.1255802
Kettlety, T., Verdon, J. P., Butcher, A., Hampson, M., and Craddock, L. (2021). High-Resolution Imaging of the ML 2.9 August 2019 Earthquake in Lancashire, United Kingdom, Induced by Hydraulic Fracturing during Preston New Road PNR-2 Operations. Seismological Res. Lett. 92, 151–169. doi:10.1785/0220200187
Kettlety, T., Verdon, J. P., Werner, M. J., Kendall, J. M., and Budge, J. (2019). Investigating the Role of Elastostatic Stress Transfer during Hydraulic Fracturing-Induced Fault Activation. Geophys. J. Int. 217, 1200–1216. doi:10.1093/gji/ggz080
Kettlety, T., Verdon, J. P., Werner, M. J., and Kendall, J. M. (2020). Stress Transfer from Opening Hydraulic Fractures Controls the Distribution of Induced Seismicity. J. Geophys. Res. Solid Earth 125. doi:10.1029/2019jb018794
Kilb, D., Gomberg, J., and Bodin, P. (2002). Aftershock Triggering by Complete Coulomb Stress Changes. J. Geophys. Res. 107 (B4), ESE 2–1. doi:10.1029/2001jb000202),
Kohli, A. H., and Zoback, M. D. (2013). Frictional Properties of Shale Reservoir Rocks. J. Geophys. Res. Solid Earth 118 (9), 5109–5125. doi:10.1002/jgrb.50346
Lei, X., Wang, Z., and Su, J. (2019). The December 2018 ML 5.7 and January 2019 ML 5.3 Earthquakes in South Sichuan Basin Induced by Shale Gas Hydraulic Fracturing. Seismological Res. Lett. 90 (3), 1099–1110. doi:10.1785/0220190029
Liu, H., Hu, X., Guo, Y., Ma, X., Wang, F., and Chen, Q. (2019). Fracture Characterization Using Flowback Water Transients from Hydraulically Fractured Shale Gas Wells. ACS Omega 4, 14688–14698. doi:10.1021/acsomega.9b01117
Müller, T. M., and Sahay, P. N. (2016). Biot Coefficient Is Distinct from Effective Pressure Coefficient. Geophysics 81 (4), L27–L33. doi:10.1190/GEO2015-0625.1
Nordgren, R. P. (1972). Propagation of a Vertical Hydraulic Fracture. Soc. Pet. Eng. J. 12 (04), 306–314. doi:10.2118/3009-PA
Orellana, L. F., Giorgetti, C., and Violay, M. (2019). Contrasting Mechanical and Hydraulic Properties of Wet and Dry Fault Zones in a Proposed Shale‐Hosted Nuclear Waste Repository. Geophys. Res. Lett. 46, 1357–1366. doi:10.1029/2018GL080384
Ortega, J. A., Ulm, F.-J., and Abousleiman, Y. (2007). The Effect of the Nanogranular Nature of Shale on Their Poroelastic Behavior. Acta Geotech. 2 (3), 155–182. doi:10.1007/s11440-007-0038-8
Rice, J. R., and Cleary, M. P. (1976). Some Basic Stress Diffusion Solutions for Fluid-Saturated Elastic Porous Media with Compressible Constituents. Rev. Geophys. 14 (2), 227. doi:10.1029/RG014i002p00227
Rudnicki, J. W. (1986). Fluid Mass Sources and Point Forces in Linear Elastic Diffusive Solids. Mech. Mater. 5 (4), 383–393. doi:10.1016/0167-6636(86)90042-6
Schultz, R., Skoumal, R. J., Brudzinski, M. R., Eaton, D., Baptie, B., and Ellsworth, W. (2020). Hydraulic Fracturing‐Induced Seismicity. Rev. Geophys. 58 (3), 1–43. doi:10.1029/2019RG000695
Schultz, R., Stern, V., Novakovic, M., Atkinson, G., and Gu, Y. J. (2015). Hydraulic Fracturing and the Crooked Lake Sequences: Insights Gleaned from Regional Seismic Networks. Geophys. Res. Lett. 42, 2750–2758. doi:10.1002/2015GL063455.Received
Segall, P., and Lu, S. (2015). Injection-induced Seismicity: Poroelastic and Earthquake Nucleation Effects. J. Geophys. Res. Solid Earth 120, 5082–5103. doi:10.1002/2015JB012060
Shapiro, S. A. (2008). Microseismicity: A Tool for Reservoir Characterization. Amsterdam, The Netherlands: EAGE Publications. doi:10.3997/9789073781702
Shapiro, S. A., and Dinske, C. (2009). Fluid-induced Seismicity: Pressure Diffusion and Hydraulic Fracturing. Geophys. Prospecting 57 (2), 301–310. doi:10.1111/j.1365-2478.2008.00770.x
Shapiro, S. A., Huenges, E., and Borm, G. (1997). Estimating the Crust Permeability from Fluid-Injection-Induced Seismic Emission at the KTB Site. Geophys. J. Int. 131 (2), F15–F18. doi:10.1111/j.1365-246x.1997.tb01215.x
Shapiro, S. A., Kummerow, J., Dinske, C., Asch, G., Rothert, E., Erzinger, J., et al. (2006). Fluid Induced Seismicity Guided by a Continental Fault: Injection Experiment of 2004/2005 at the German Deep Drilling Site (KTB). Geophys. Res. Lett. 33 (1), a–n. doi:10.1029/2005GL024659
Steacy, S., Marsan, D., Nalbant, S. S., and McCloskey, J. (2004). Sensitivity of Static Stress Calculations to the Earthquake Slip Distribution. J. Geophys. Res. 109, 16. doi:10.1029/2002JB002365
Stein, R. S. (1999). The Role of Stress Transfer in Earthquake Occurrence. Nature 402, 605–609. doi:10.1038/45144
Stork, A. L., Verdon, J. P., and Kendall, J.-M. (2015). The Microseismic Response at the in Salah Carbon Capture and Storage (CCS) Site. Int. J. Greenhouse Gas Control. 32, 159–171. doi:10.1016/j.ijggc.2014.11.014
Toda, S., Stein, R. S., and Sagiya, T. (2002). Evidence from the AD 2000 Izu Islands Earthquake Swarm that Stressing Rate Governs Seismicity. Nature 419 (6902), 58–61. doi:10.1038/nature00997
Verdon, J. P., Baptie, B. J., and Bommer, J. J. (2019). An Improved Framework for Discriminating Seismicity Induced by Industrial Activities from Natural Earthquakes. Seismological Res. Lett. 90 (4), 1592–1611. doi:10.1785/0220190030
Verdon, J. P., Kendall, J.-M., Butcher, A., Luckett, R., and Baptie, B. J. (2018). Seismicity Induced by Longwall Coal Mining at the Thoresby Colliery, Nottinghamshire, U.K. Geophys. J. Int. 212 (2), 942–954. doi:10.1093/gji/ggx465
Wang, R., Lorenzo-Martín, F., and Roth, F. (2006). PSGRN/PSCMP-a New Code for Calculating Co- and Post-seismic Deformation, Geoid and Gravity Changes Based on the Viscoelastic-Gravitational Dislocation Theory. Comput. Geosciences 32 (4), 527–541. doi:10.1016/j.cageo.2005.08.006
Westwood, R. F., Toon, S. M., Styles, P., and Cassidy, N. J. (2017). Horizontal Respect Distance for Hydraulic Fracturing in the Vicinity of Existing Faults in Deep Geological Reservoirs: a Review and Modelling Study. Geomech. Geophys. Geo-energ. Geo-resour. 3 (4), 379–391. doi:10.1007/s40948-017-0065-3
Keywords: induced seismicity, geomechanics, stress modeling, microseismicity, hydraulic fracturing
Citation: Kettlety T and Verdon JP (2021) Fault Triggering Mechanisms for Hydraulic Fracturing-Induced Seismicity From the Preston New Road, UK Case Study. Front. Earth Sci. 9:670771. doi: 10.3389/feart.2021.670771
Received: 22 February 2021; Accepted: 04 May 2021;
Published: 17 May 2021.
Edited by:
Francesco Grigoli, ETH Zürich, SwitzerlandReviewed by:
Louis De Barros, UMR7329 Géoazur (GEOAZUR), FranceRyan Schultz, Stanford University, United States
Copyright © 2021 Kettlety and Verdon. This is an open-access article distributed under the terms of the Creative Commons Attribution License (CC BY). The use, distribution or reproduction in other forums is permitted, provided the original author(s) and the copyright owner(s) are credited and that the original publication in this journal is cited, in accordance with accepted academic practice. No use, distribution or reproduction is permitted which does not comply with these terms.
*Correspondence: Tom Kettlety, dG9tLmtldHRsZXR5QGVhcnRoLm94LmFjLnVr
†These authors have contributed equally to this work and share first authorship